Media borough, PA
Media borough Overview
5,860
TOTAL POPULATION
2,705
MALE POPULATION
3,155
FEMALE POPULATION
85.74
MALES / 100 FEMALES
116.64
FEMALES / 100 MALES
43.2
MEDIAN AGE
2.8
AVG FAMILY SIZE
1.9
AVG HOUSEHOLD SIZE
$60,872
PER CAPITA INCOME
$120,489
AVG FAMILY INCOME
$85,951
AVG HOUSEHOLD INCOME
30.7%
WAGE / INCOME GAP [ % ]
69.3¢/ $1
WAGE / INCOME GAP [ $ ]
0.45
INEQUALITY / GINI INDEX
3,929
LABOR FORCE [ PEOPLE ]
75.2%
PERCENT IN LABOR FORCE
6.1%
UNEMPLOYMENT RATE
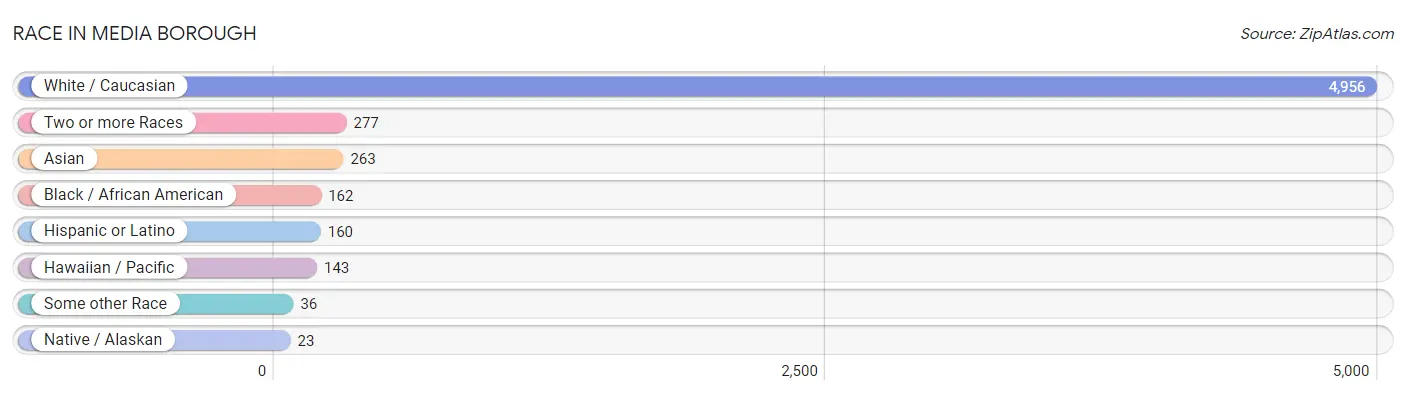
Race in Media borough
The most populous races in Media borough are White / Caucasian (4,956 | 84.6%), Two or more Races (277 | 4.7%), and Asian (263 | 4.5%).
| Race | # Population | % Population |
| Asian | 263 | 4.5% |
| Black / African American | 162 | 2.8% |
| Hawaiian / Pacific | 143 | 2.4% |
| Hispanic or Latino | 160 | 2.7% |
| Native / Alaskan | 23 | 0.4% |
| White / Caucasian | 4,956 | 84.6% |
| Two or more Races | 277 | 4.7% |
| Some other Race | 36 | 0.6% |
| Total | 5,860 | 100.0% |
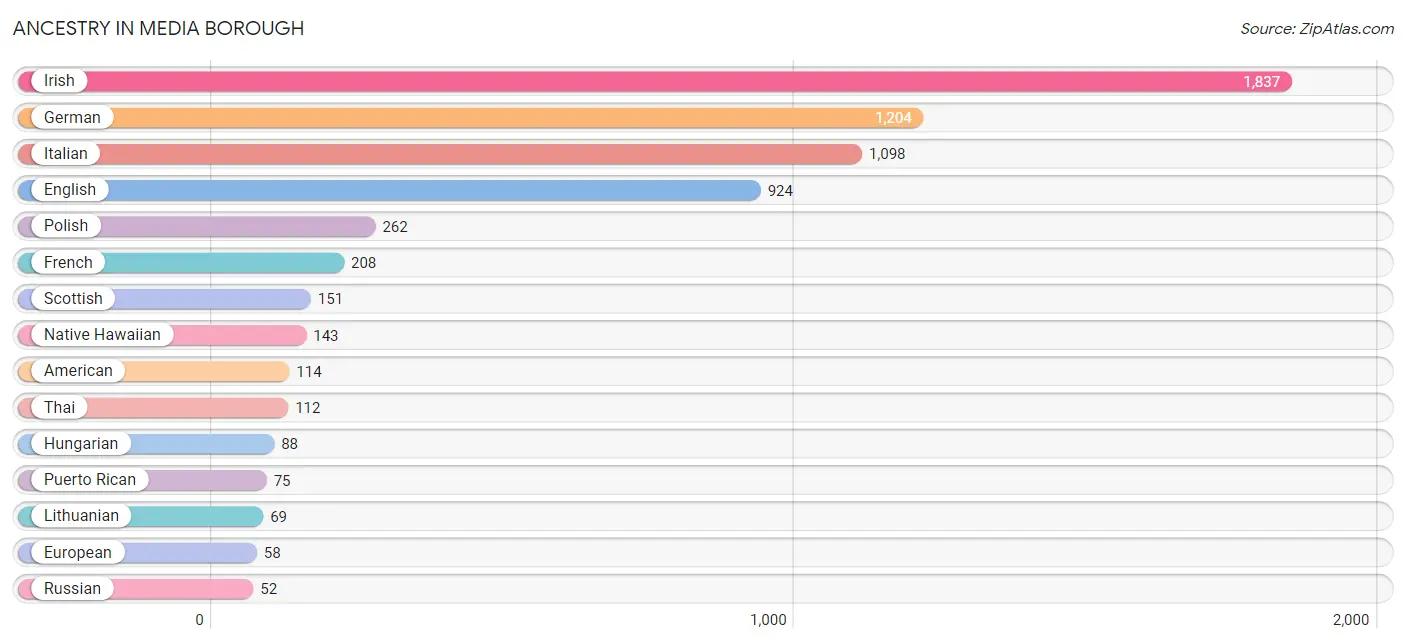
Ancestry in Media borough
The most populous ancestries reported in Media borough are Irish (1,837 | 31.4%), German (1,204 | 20.5%), Italian (1,098 | 18.7%), English (924 | 15.8%), and Polish (262 | 4.5%), together accounting for 90.9% of all Media borough residents.
| Ancestry | # Population | % Population |
| American | 114 | 1.9% |
| Apache | 35 | 0.6% |
| Arab | 17 | 0.3% |
| Argentinean | 14 | 0.2% |
| Austrian | 11 | 0.2% |
| Bhutanese | 12 | 0.2% |
| British | 33 | 0.6% |
| Burmese | 38 | 0.6% |
| Cambodian | 15 | 0.3% |
| Canadian | 10 | 0.2% |
| Cherokee | 24 | 0.4% |
| Cuban | 22 | 0.4% |
| Czech | 9 | 0.2% |
| Danish | 20 | 0.3% |
| Dutch | 20 | 0.3% |
| Eastern European | 11 | 0.2% |
| English | 924 | 15.8% |
| European | 58 | 1.0% |
| Filipino | 50 | 0.9% |
| French | 208 | 3.5% |
| French Canadian | 45 | 0.8% |
| German | 1,204 | 20.5% |
| Greek | 31 | 0.5% |
| Hungarian | 88 | 1.5% |
| Indian (Asian) | 37 | 0.6% |
| Iranian | 36 | 0.6% |
| Irish | 1,837 | 31.4% |
| Italian | 1,098 | 18.7% |
| Jamaican | 13 | 0.2% |
| Japanese | 8 | 0.1% |
| Lithuanian | 69 | 1.2% |
| Mexican | 10 | 0.2% |
| Native Hawaiian | 143 | 2.4% |
| Northern European | 49 | 0.8% |
| Norwegian | 16 | 0.3% |
| Polish | 262 | 4.5% |
| Puerto Rican | 75 | 1.3% |
| Romanian | 11 | 0.2% |
| Russian | 52 | 0.9% |
| Scotch-Irish | 49 | 0.8% |
| Scottish | 151 | 2.6% |
| South American | 14 | 0.2% |
| Spanish | 39 | 0.7% |
| Swedish | 28 | 0.5% |
| Swiss | 10 | 0.2% |
| Syrian | 17 | 0.3% |
| Thai | 112 | 1.9% |
| Turkish | 27 | 0.5% |
| Ukrainian | 12 | 0.2% |
| Welsh | 30 | 0.5% | View All 50 Rows |
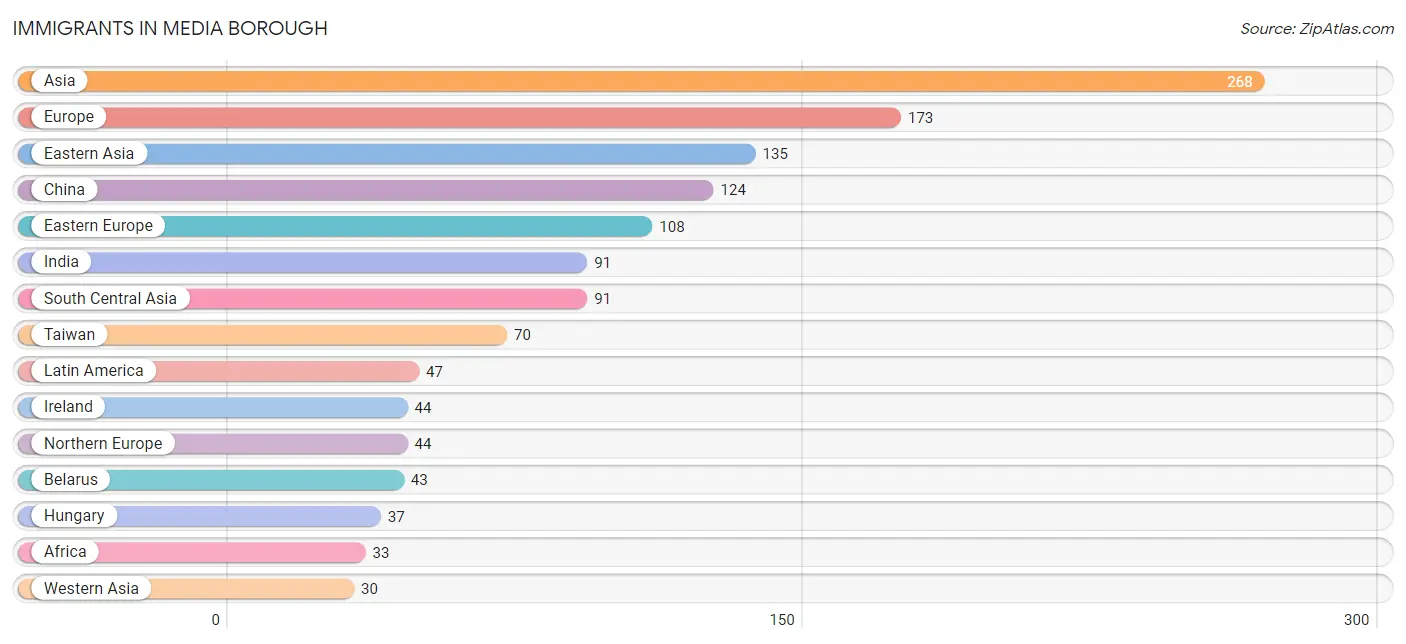
Immigrants in Media borough
The most numerous immigrant groups reported in Media borough came from Asia (268 | 4.6%), Europe (173 | 2.9%), Eastern Asia (135 | 2.3%), China (124 | 2.1%), and Eastern Europe (108 | 1.8%), together accounting for 13.8% of all Media borough residents.
| Immigration Origin | # Population | % Population |
| Africa | 33 | 0.6% |
| Argentina | 14 | 0.2% |
| Asia | 268 | 4.6% |
| Australia | 10 | 0.2% |
| Belarus | 43 | 0.7% |
| Cambodia | 8 | 0.1% |
| Canada | 24 | 0.4% |
| Caribbean | 14 | 0.2% |
| Central America | 9 | 0.2% |
| China | 124 | 2.1% |
| Eastern Asia | 135 | 2.3% |
| Eastern Europe | 108 | 1.8% |
| Europe | 173 | 2.9% |
| Germany | 12 | 0.2% |
| Hungary | 37 | 0.6% |
| India | 91 | 1.5% |
| Ireland | 44 | 0.7% |
| Italy | 9 | 0.2% |
| Jamaica | 13 | 0.2% |
| Korea | 11 | 0.2% |
| Latin America | 47 | 0.8% |
| Mexico | 9 | 0.2% |
| Morocco | 14 | 0.2% |
| Nigeria | 13 | 0.2% |
| Northern Africa | 14 | 0.2% |
| Northern Europe | 44 | 0.7% |
| Oceania | 10 | 0.2% |
| Philippines | 4 | 0.1% |
| Russia | 14 | 0.2% |
| South Africa | 6 | 0.1% |
| South America | 24 | 0.4% |
| South Central Asia | 91 | 1.5% |
| South Eastern Asia | 12 | 0.2% |
| Southern Europe | 9 | 0.2% |
| Syria | 17 | 0.3% |
| Taiwan | 70 | 1.2% |
| Trinidad and Tobago | 1 | 0.0% |
| Turkey | 13 | 0.2% |
| Ukraine | 14 | 0.2% |
| Venezuela | 10 | 0.2% |
| Western Africa | 13 | 0.2% |
| Western Asia | 30 | 0.5% |
| Western Europe | 12 | 0.2% | View All 43 Rows |
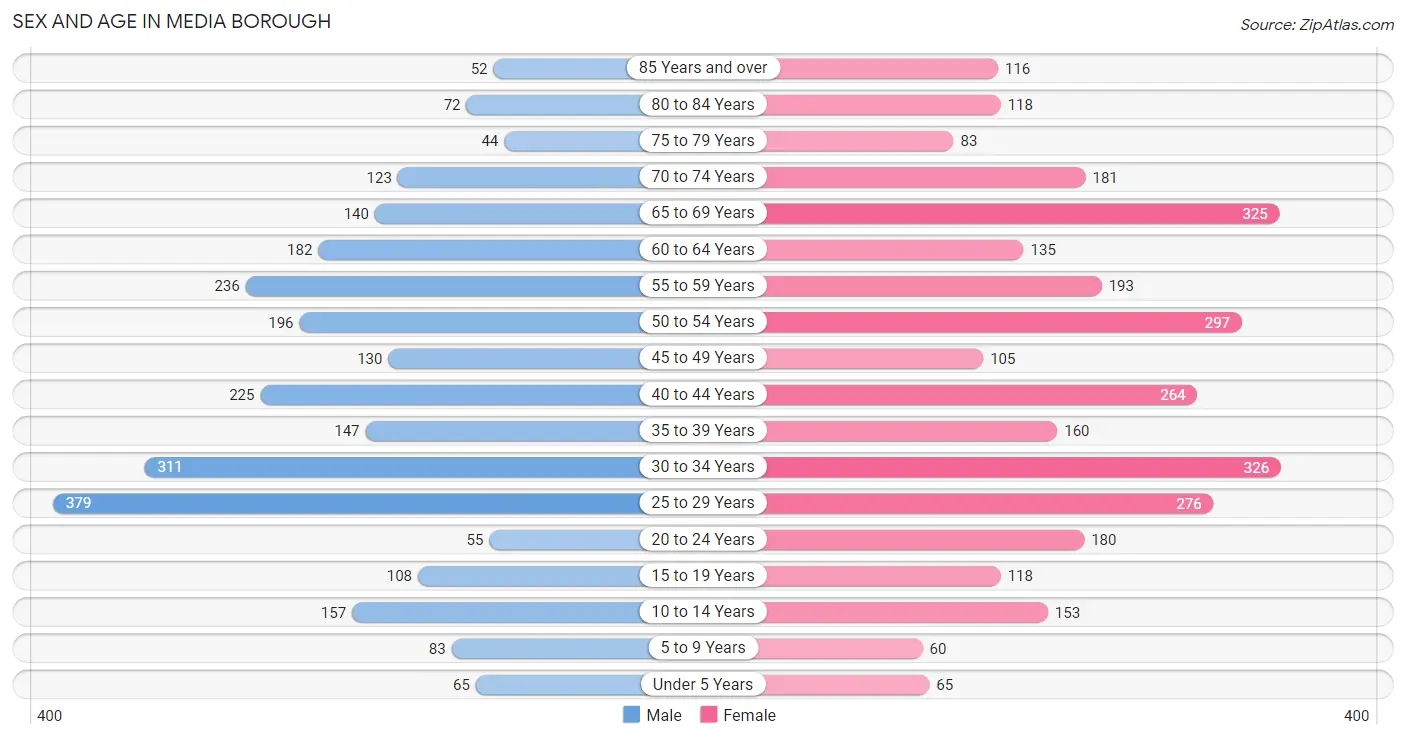
Sex and Age in Media borough
Sex and Age in Media borough
The most populous age groups in Media borough are 25 to 29 Years (379 | 14.0%) for men and 30 to 34 Years (326 | 10.3%) for women.
| Age Bracket | Male | Female |
| Under 5 Years | 65 (2.4%) | 65 (2.1%) |
| 5 to 9 Years | 83 (3.1%) | 60 (1.9%) |
| 10 to 14 Years | 157 (5.8%) | 153 (4.9%) |
| 15 to 19 Years | 108 (4.0%) | 118 (3.7%) |
| 20 to 24 Years | 55 (2.0%) | 180 (5.7%) |
| 25 to 29 Years | 379 (14.0%) | 276 (8.7%) |
| 30 to 34 Years | 311 (11.5%) | 326 (10.3%) |
| 35 to 39 Years | 147 (5.4%) | 160 (5.1%) |
| 40 to 44 Years | 225 (8.3%) | 264 (8.4%) |
| 45 to 49 Years | 130 (4.8%) | 105 (3.3%) |
| 50 to 54 Years | 196 (7.2%) | 297 (9.4%) |
| 55 to 59 Years | 236 (8.7%) | 193 (6.1%) |
| 60 to 64 Years | 182 (6.7%) | 135 (4.3%) |
| 65 to 69 Years | 140 (5.2%) | 325 (10.3%) |
| 70 to 74 Years | 123 (4.5%) | 181 (5.7%) |
| 75 to 79 Years | 44 (1.6%) | 83 (2.6%) |
| 80 to 84 Years | 72 (2.7%) | 118 (3.7%) |
| 85 Years and over | 52 (1.9%) | 116 (3.7%) |
| Total | 2,705 (100.0%) | 3,155 (100.0%) |
Families and Households in Media borough
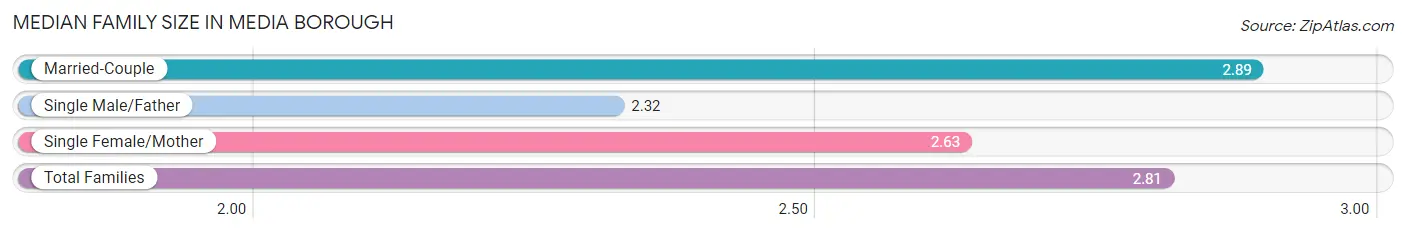
Median Family Size in Media borough
The median family size in Media borough is 2.81 persons per family, with married-couple families (959 | 73.5%) accounting for the largest median family size of 2.89 persons per family. On the other hand, single male/father families (63 | 4.8%) represent the smallest median family size with 2.32 persons per family.
| Family Type | # Families | Family Size |
| Married-Couple | 959 (73.5%) | 2.89 |
| Single Male/Father | 63 (4.8%) | 2.32 |
| Single Female/Mother | 283 (21.7%) | 2.63 |
| Total Families | 1,305 (100.0%) | 2.81 |
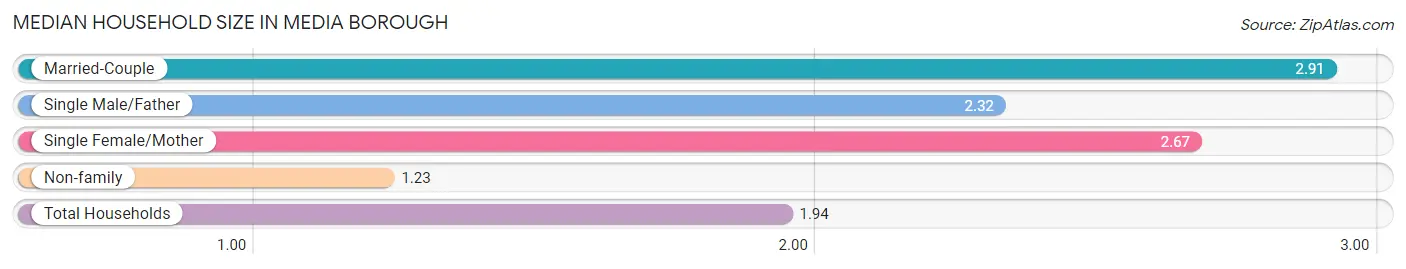
Median Household Size in Media borough
The median household size in Media borough is 1.94 persons per household, with married-couple households (959 | 32.6%) accounting for the largest median household size of 2.91 persons per household. non-family households (1,634 | 55.6%) represent the smallest median household size with 1.23 persons per household.
| Household Type | # Households | Household Size |
| Married-Couple | 959 (32.6%) | 2.91 |
| Single Male/Father | 63 (2.1%) | 2.32 |
| Single Female/Mother | 283 (9.6%) | 2.67 |
| Non-family | 1,634 (55.6%) | 1.23 |
| Total Households | 2,939 (100.0%) | 1.94 |
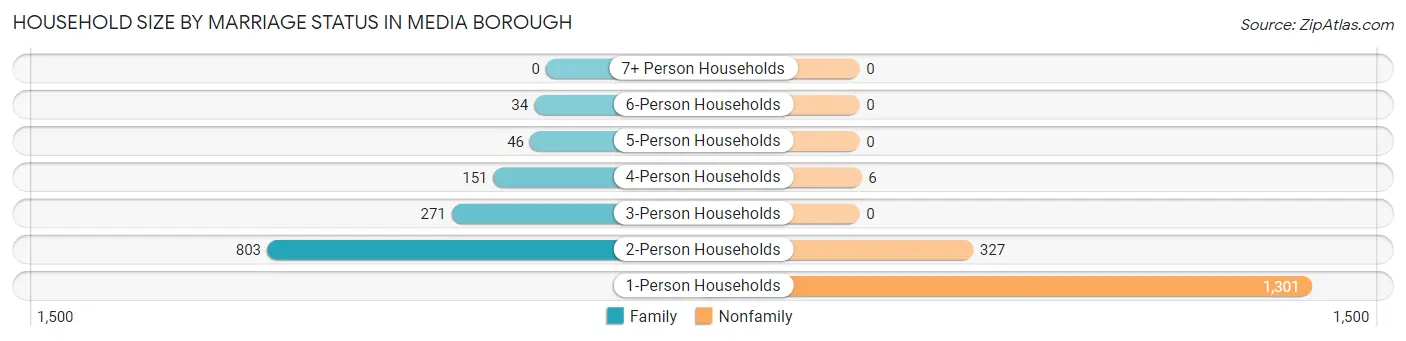
Household Size by Marriage Status in Media borough
Out of a total of 2,939 households in Media borough, 1,305 (44.4%) are family households, while 1,634 (55.6%) are nonfamily households. The most numerous type of family households are 2-person households, comprising 803, and the most common type of nonfamily households are 1-person households, comprising 1,301.
| Household Size | Family Households | Nonfamily Households |
| 1-Person Households | - | 1,301 (44.3%) |
| 2-Person Households | 803 (27.3%) | 327 (11.1%) |
| 3-Person Households | 271 (9.2%) | 0 (0.0%) |
| 4-Person Households | 151 (5.1%) | 6 (0.2%) |
| 5-Person Households | 46 (1.6%) | 0 (0.0%) |
| 6-Person Households | 34 (1.2%) | 0 (0.0%) |
| 7+ Person Households | 0 (0.0%) | 0 (0.0%) |
| Total | 1,305 (44.4%) | 1,634 (55.6%) |
Female Fertility in Media borough
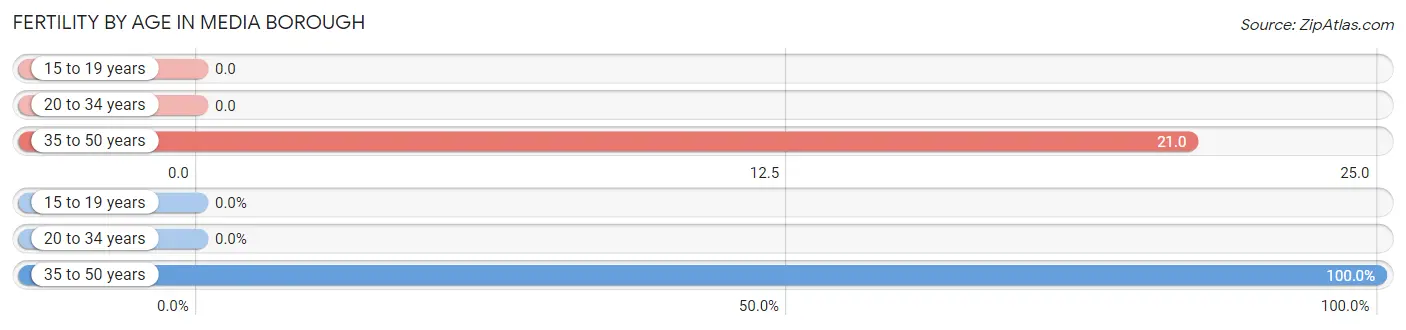
Fertility by Age in Media borough
Average fertility rate in Media borough is 8.0 births per 1,000 women. Women in the age bracket of 35 to 50 years have the highest fertility rate with 21.0 births per 1,000 women. Women in the age bracket of 35 to 50 years acount for 100.0% of all women with births.
| Age Bracket | Women with Births | Births / 1,000 Women |
| 15 to 19 years | 0 (0.0%) | 0.0 |
| 20 to 34 years | 0 (0.0%) | 0.0 |
| 35 to 50 years | 12 (100.0%) | 21.0 |
| Total | 12 (100.0%) | 8.0 |
Fertility by Age by Marriage Status in Media borough
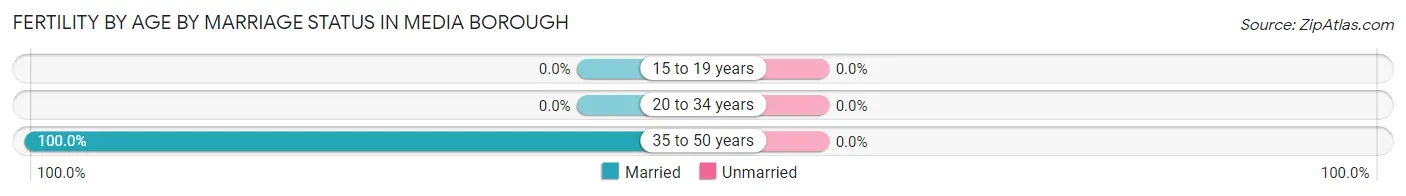
| Age Bracket | Married | Unmarried |
| 15 to 19 years | 0 (0.0%) | 0 (0.0%) |
| 20 to 34 years | 0 (0.0%) | 0 (0.0%) |
| 35 to 50 years | 12 (100.0%) | 0 (0.0%) |
| Total | 12 (100.0%) | 0 (0.0%) |
Fertility by Education in Media borough
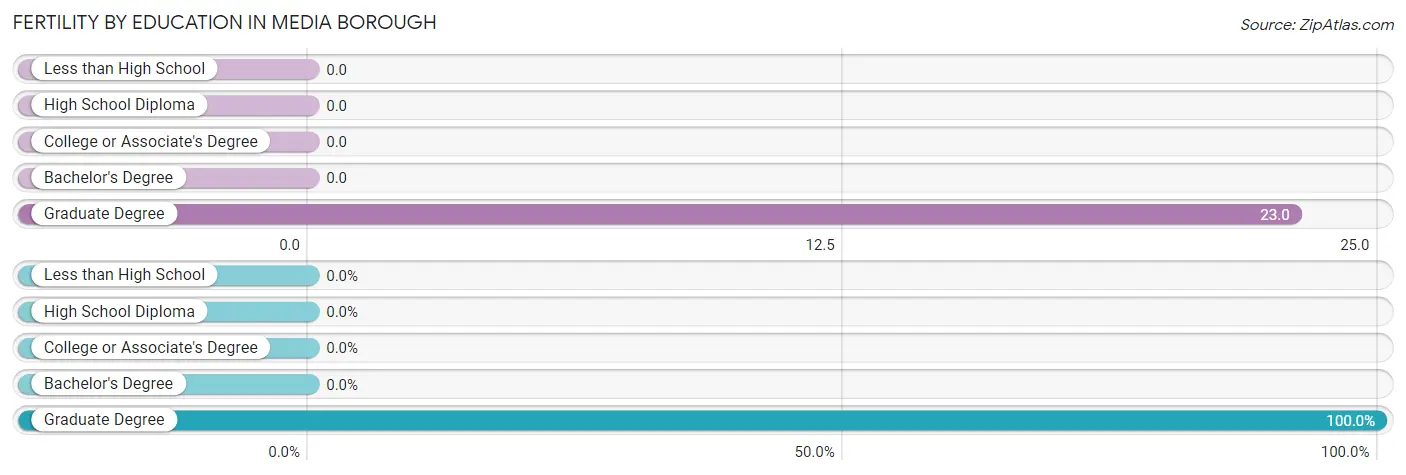
| Educational Attainment | Women with Births | Births / 1,000 Women |
| Less than High School | 0 (0.0%) | 0.0 |
| High School Diploma | 0 (0.0%) | 0.0 |
| College or Associate's Degree | 0 (0.0%) | 0.0 |
| Bachelor's Degree | 0 (0.0%) | 0.0 |
| Graduate Degree | 12 (100.0%) | 23.0 |
| Total | 12 (100.0%) | 8.0 |
Fertility by Education by Marriage Status in Media borough
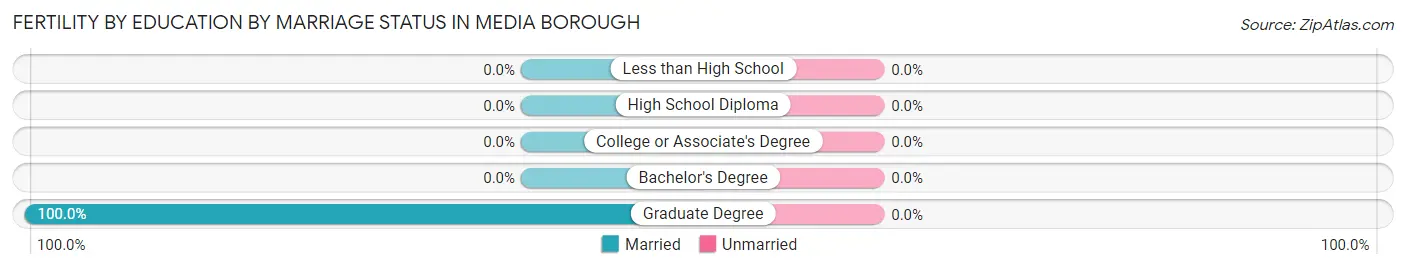
| Educational Attainment | Married | Unmarried |
| Less than High School | 0 (0.0%) | 0 (0.0%) |
| High School Diploma | 0 (0.0%) | 0 (0.0%) |
| College or Associate's Degree | 0 (0.0%) | 0 (0.0%) |
| Bachelor's Degree | 0 (0.0%) | 0 (0.0%) |
| Graduate Degree | 12 (100.0%) | 0 (0.0%) |
| Total | 12 (100.0%) | 0 (0.0%) |
Income in Media borough
Income Overview in Media borough
Per Capita Income in Media borough is $60,872, while median incomes of families and households are $120,489 and $85,951 respectively.
| Characteristic | Number | Measure |
| Per Capita Income | 5,860 | $60,872 |
| Median Family Income | 1,305 | $120,489 |
| Mean Family Income | 1,305 | $137,925 |
| Median Household Income | 2,939 | $85,951 |
| Mean Household Income | 2,939 | $115,449 |
| Income Deficit | 1,305 | $0 |
| Wage / Income Gap (%) | 5,860 | 30.73% |
| Wage / Income Gap ($) | 5,860 | 69.27¢ per $1 |
| Gini / Inequality Index | 5,860 | 0.45 |
Earnings by Sex in Media borough
Average Earnings in Media borough are $56,875, $68,975 for men and $47,777 for women, a difference of 30.7%.
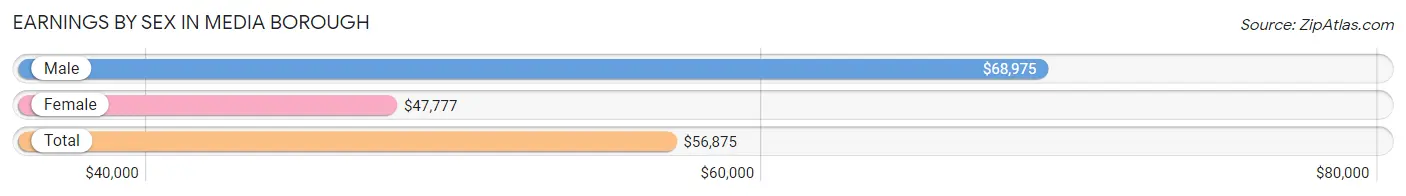
| Sex | Number | Average Earnings |
| Male | 1,877 (47.0%) | $68,975 |
| Female | 2,115 (53.0%) | $47,777 |
| Total | 3,992 (100.0%) | $56,875 |
Earnings by Sex by Income Bracket in Media borough
The most common earnings brackets in Media borough are $100,000+ for men (503 | 26.8%) and $30,000 to $34,999 for women (303 | 14.3%).
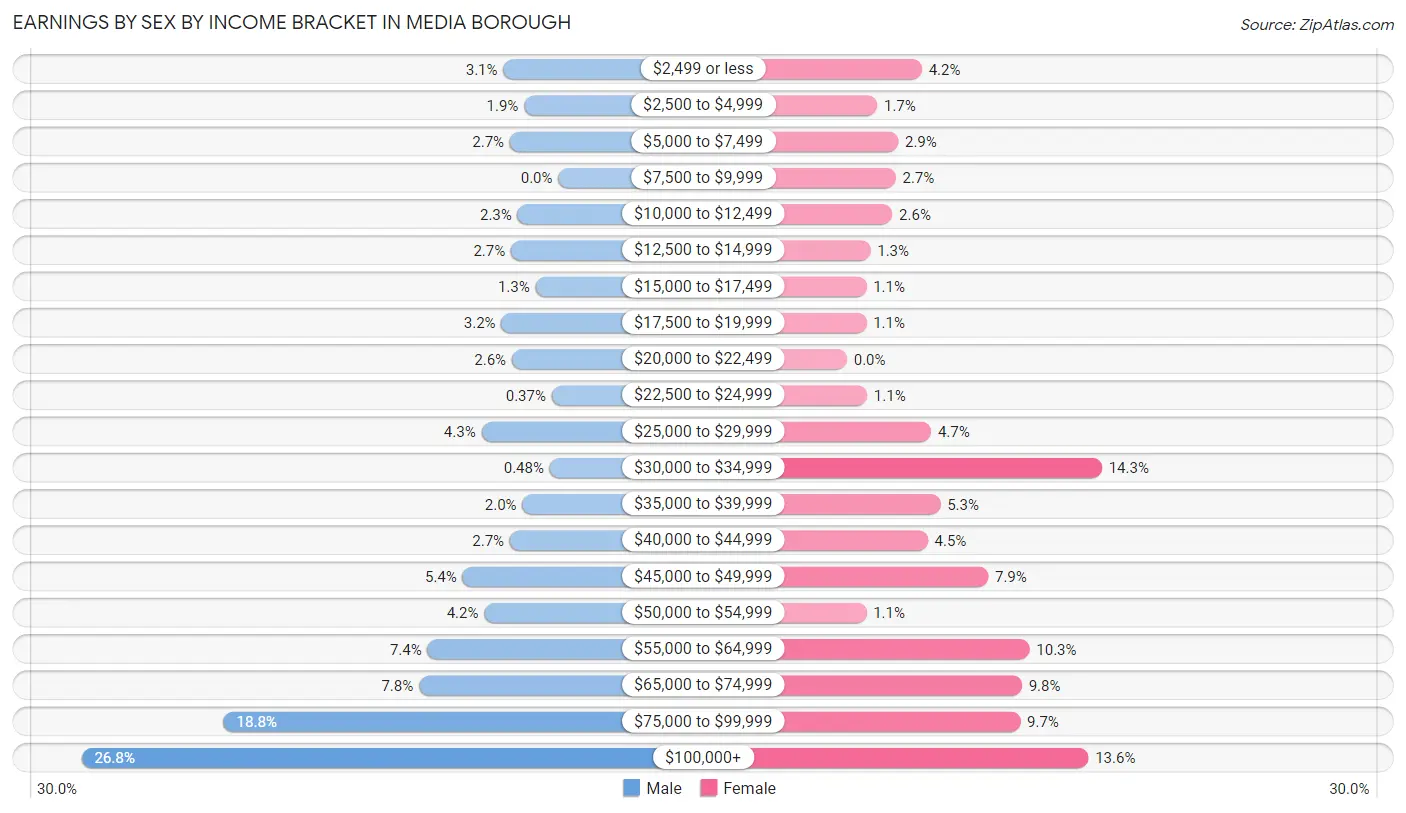
| Income | Male | Female |
| $2,499 or less | 58 (3.1%) | 89 (4.2%) |
| $2,500 to $4,999 | 36 (1.9%) | 36 (1.7%) |
| $5,000 to $7,499 | 51 (2.7%) | 61 (2.9%) |
| $7,500 to $9,999 | 0 (0.0%) | 58 (2.7%) |
| $10,000 to $12,499 | 43 (2.3%) | 54 (2.5%) |
| $12,500 to $14,999 | 50 (2.7%) | 28 (1.3%) |
| $15,000 to $17,499 | 24 (1.3%) | 23 (1.1%) |
| $17,500 to $19,999 | 60 (3.2%) | 23 (1.1%) |
| $20,000 to $22,499 | 49 (2.6%) | 0 (0.0%) |
| $22,500 to $24,999 | 7 (0.4%) | 24 (1.1%) |
| $25,000 to $29,999 | 81 (4.3%) | 100 (4.7%) |
| $30,000 to $34,999 | 9 (0.5%) | 303 (14.3%) |
| $35,000 to $39,999 | 38 (2.0%) | 111 (5.2%) |
| $40,000 to $44,999 | 51 (2.7%) | 96 (4.5%) |
| $45,000 to $49,999 | 101 (5.4%) | 168 (7.9%) |
| $50,000 to $54,999 | 78 (4.2%) | 23 (1.1%) |
| $55,000 to $64,999 | 138 (7.3%) | 217 (10.3%) |
| $65,000 to $74,999 | 147 (7.8%) | 208 (9.8%) |
| $75,000 to $99,999 | 353 (18.8%) | 206 (9.7%) |
| $100,000+ | 503 (26.8%) | 287 (13.6%) |
| Total | 1,877 (100.0%) | 2,115 (100.0%) |
Earnings by Sex by Educational Attainment in Media borough
Average earnings in Media borough are $71,827 for men and $48,956 for women, a difference of 31.8%. Men with an educational attainment of graduate degree enjoy the highest average annual earnings of $103,403, while those with high school diploma education earn the least with $54,702. Women with an educational attainment of graduate degree earn the most with the average annual earnings of $60,588, while those with college or associate's degree education have the smallest earnings of $32,460.
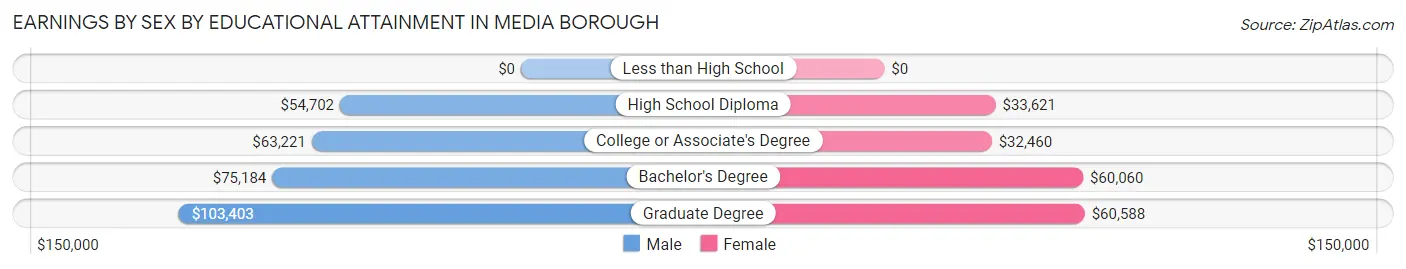
| Educational Attainment | Male Income | Female Income |
| Less than High School | - | - |
| High School Diploma | $54,702 | $33,621 |
| College or Associate's Degree | $63,221 | $32,460 |
| Bachelor's Degree | $75,184 | $60,060 |
| Graduate Degree | $103,403 | $60,588 |
| Total | $71,827 | $48,956 |
Family Income in Media borough
Family Income Brackets in Media borough
According to the Media borough family income data, there are 395 families falling into the $100,000 to $149,999 income range, which is the most common income bracket and makes up 30.3% of all families.
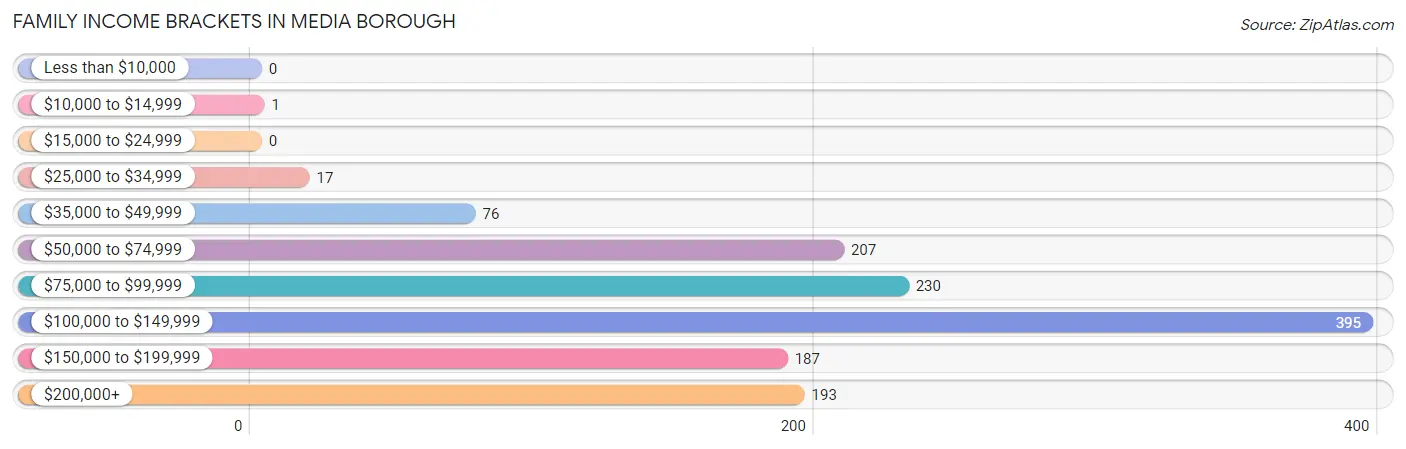
| Income Bracket | # Families | % Families |
| Less than $10,000 | 0 | 0.0% |
| $10,000 to $14,999 | 1 | 0.1% |
| $15,000 to $24,999 | 0 | 0.0% |
| $25,000 to $34,999 | 17 | 1.3% |
| $35,000 to $49,999 | 76 | 5.8% |
| $50,000 to $74,999 | 207 | 15.9% |
| $75,000 to $99,999 | 230 | 17.6% |
| $100,000 to $149,999 | 395 | 30.3% |
| $150,000 to $199,999 | 187 | 14.3% |
| $200,000+ | 193 | 14.8% |
Family Income by Famaliy Size in Media borough
4-person families (142 | 10.9%) account for the highest median family income in Media borough with $160,577 per family, while 2-person families (815 | 62.5%) have the highest median income of $58,125 per family member.
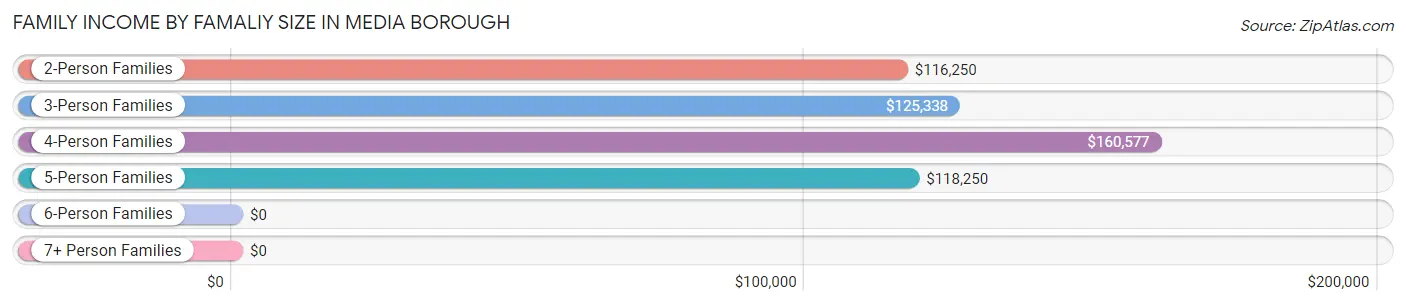
| Income Bracket | # Families | Median Income |
| 2-Person Families | 815 (62.5%) | $116,250 |
| 3-Person Families | 268 (20.5%) | $125,338 |
| 4-Person Families | 142 (10.9%) | $160,577 |
| 5-Person Families | 46 (3.5%) | $118,250 |
| 6-Person Families | 34 (2.6%) | $0 |
| 7+ Person Families | 0 (0.0%) | $0 |
| Total | 1,305 (100.0%) | $120,489 |
Family Income by Number of Earners in Media borough
The median family income in Media borough is $120,489, with families comprising 3+ earners (136) having the highest median family income of $168,750, while families with no earners (132) have the lowest median family income of $79,015, accounting for 10.4% and 10.1% of families, respectively.
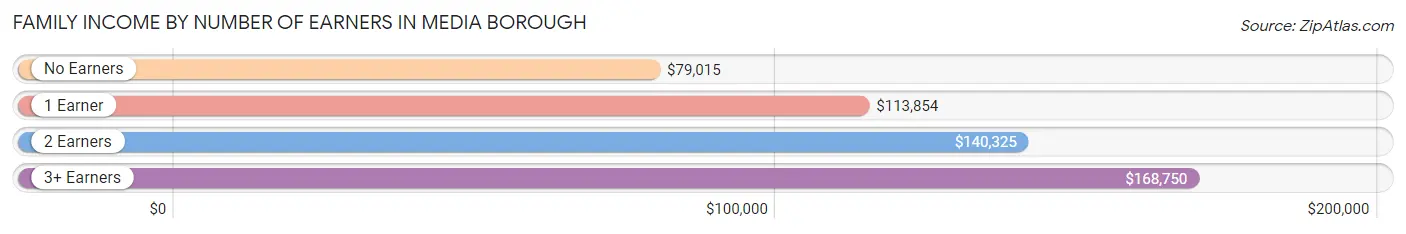
| Number of Earners | # Families | Median Income |
| No Earners | 132 (10.1%) | $79,015 |
| 1 Earner | 326 (25.0%) | $113,854 |
| 2 Earners | 711 (54.5%) | $140,325 |
| 3+ Earners | 136 (10.4%) | $168,750 |
| Total | 1,305 (100.0%) | $120,489 |
Household Income in Media borough
Household Income Brackets in Media borough
With 708 households falling in the category, the $100,000 to $149,999 income range is the most frequent in Media borough, accounting for 24.1% of all households. In contrast, only 29 households (1.0%) fall into the $10,000 to $14,999 income bracket, making it the least populous group.
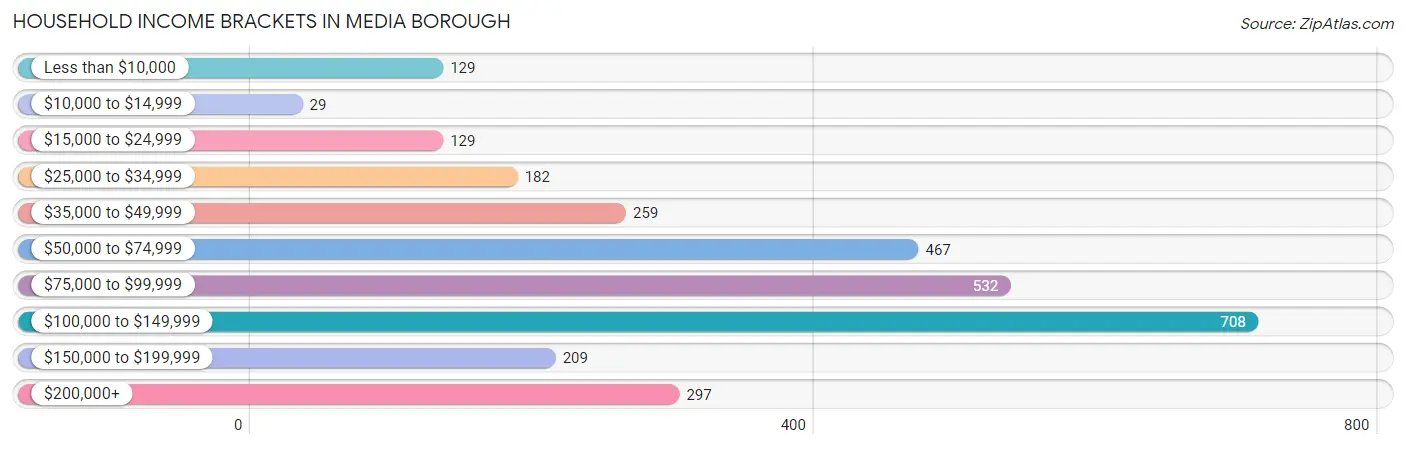
| Income Bracket | # Households | % Households |
| Less than $10,000 | 129 | 4.4% |
| $10,000 to $14,999 | 29 | 1.0% |
| $15,000 to $24,999 | 129 | 4.4% |
| $25,000 to $34,999 | 182 | 6.2% |
| $35,000 to $49,999 | 259 | 8.8% |
| $50,000 to $74,999 | 467 | 15.9% |
| $75,000 to $99,999 | 532 | 18.1% |
| $100,000 to $149,999 | 708 | 24.1% |
| $150,000 to $199,999 | 209 | 7.1% |
| $200,000+ | 297 | 10.1% |
Household Income by Householder Age in Media borough
The median household income in Media borough is $85,951, with the highest median household income of $100,655 found in the 45 to 64 years age bracket for the primary householder. A total of 927 households (31.5%) fall into this category. Meanwhile, the 65+ years age bracket for the primary householder has the lowest median household income of $69,872, with 680 households (23.1%) in this group.
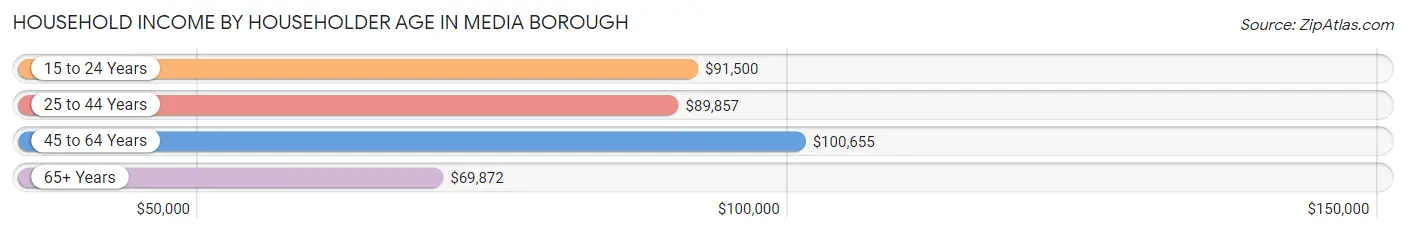
| Income Bracket | # Households | Median Income |
| 15 to 24 Years | 96 (3.3%) | $91,500 |
| 25 to 44 Years | 1,236 (42.1%) | $89,857 |
| 45 to 64 Years | 927 (31.5%) | $100,655 |
| 65+ Years | 680 (23.1%) | $69,872 |
| Total | 2,939 (100.0%) | $85,951 |
Poverty in Media borough
Income Below Poverty by Sex and Age in Media borough
With 5.0% poverty level for males and 2.7% for females among the residents of Media borough, 15 year old males and 18 to 24 year old females are the most vulnerable to poverty, with 12 males (23.1%) and 16 females (7.6%) in their respective age groups living below the poverty level.
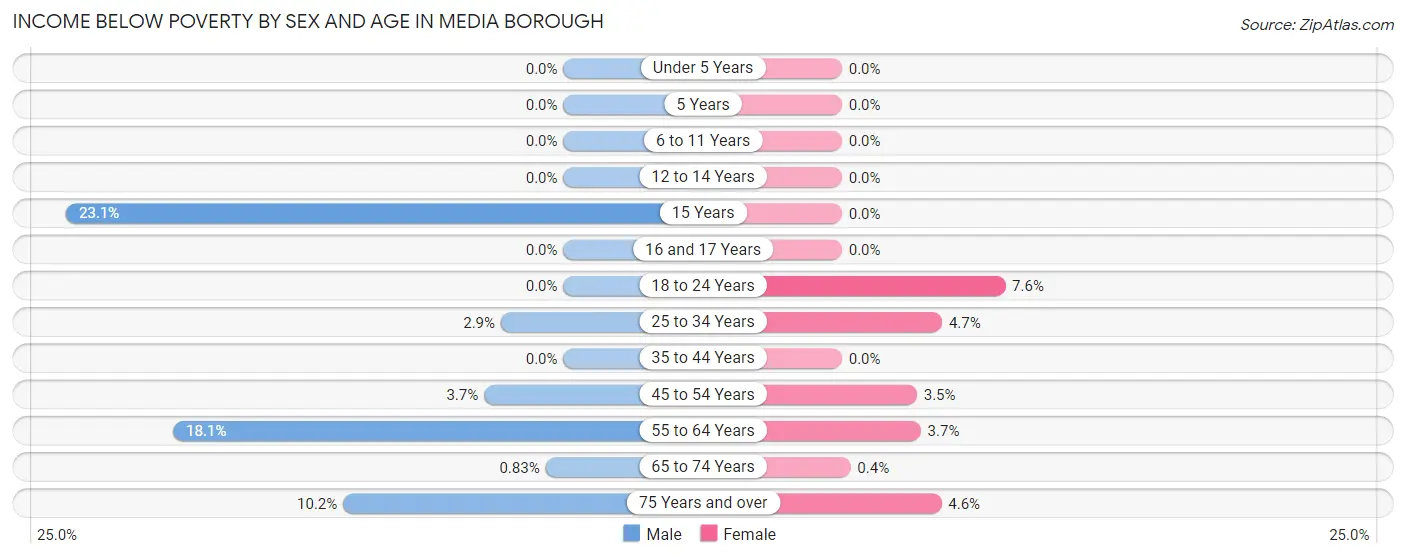
| Age Bracket | Male | Female |
| Under 5 Years | 0 (0.0%) | 0 (0.0%) |
| 5 Years | 0 (0.0%) | 0 (0.0%) |
| 6 to 11 Years | 0 (0.0%) | 0 (0.0%) |
| 12 to 14 Years | 0 (0.0%) | 0 (0.0%) |
| 15 Years | 12 (23.1%) | 0 (0.0%) |
| 16 and 17 Years | 0 (0.0%) | 0 (0.0%) |
| 18 to 24 Years | 0 (0.0%) | 16 (7.6%) |
| 25 to 34 Years | 20 (2.9%) | 28 (4.6%) |
| 35 to 44 Years | 0 (0.0%) | 0 (0.0%) |
| 45 to 54 Years | 12 (3.7%) | 14 (3.5%) |
| 55 to 64 Years | 73 (18.1%) | 12 (3.7%) |
| 65 to 74 Years | 2 (0.8%) | 2 (0.4%) |
| 75 Years and over | 14 (10.2%) | 11 (4.6%) |
| Total | 133 (5.0%) | 83 (2.7%) |
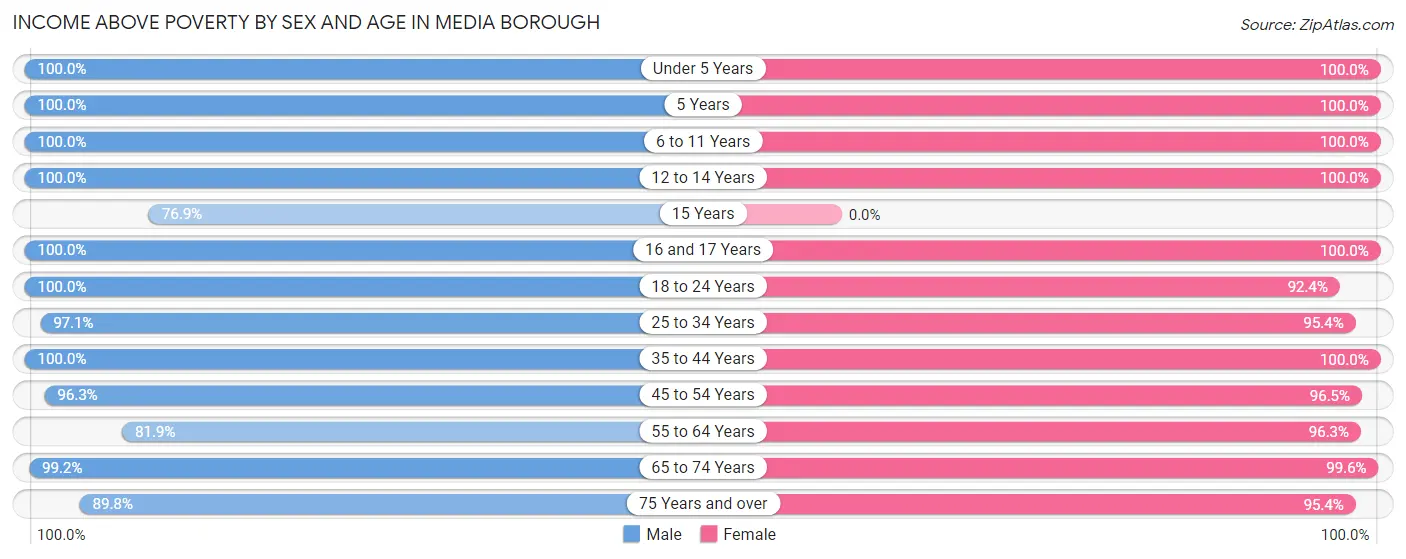
Income Above Poverty by Sex and Age in Media borough
According to the poverty statistics in Media borough, males aged under 5 years and females aged under 5 years are the age groups that are most secure financially, with 100.0% of males and 100.0% of females in these age groups living above the poverty line.
| Age Bracket | Male | Female |
| Under 5 Years | 65 (100.0%) | 65 (100.0%) |
| 5 Years | 32 (100.0%) | 2 (100.0%) |
| 6 to 11 Years | 131 (100.0%) | 138 (100.0%) |
| 12 to 14 Years | 77 (100.0%) | 73 (100.0%) |
| 15 Years | 40 (76.9%) | 0 (0.0%) |
| 16 and 17 Years | 32 (100.0%) | 87 (100.0%) |
| 18 to 24 Years | 79 (100.0%) | 195 (92.4%) |
| 25 to 34 Years | 670 (97.1%) | 574 (95.4%) |
| 35 to 44 Years | 372 (100.0%) | 424 (100.0%) |
| 45 to 54 Years | 314 (96.3%) | 388 (96.5%) |
| 55 to 64 Years | 330 (81.9%) | 316 (96.3%) |
| 65 to 74 Years | 240 (99.2%) | 498 (99.6%) |
| 75 Years and over | 123 (89.8%) | 227 (95.4%) |
| Total | 2,505 (95.0%) | 2,987 (97.3%) |
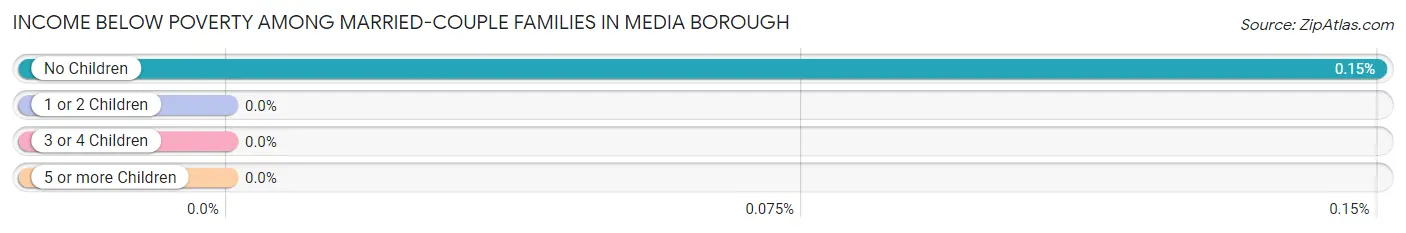
Income Below Poverty Among Married-Couple Families in Media borough
The poverty statistics for married-couple families in Media borough show that 0.1% or 1 of the total 959 families live below the poverty line. Families with no children have the highest poverty rate of 0.2%, comprising of 1 families. On the other hand, families with 1 or 2 children have the lowest poverty rate of 0.0%, which includes 0 families.
| Children | Above Poverty | Below Poverty |
| No Children | 681 (99.9%) | 1 (0.2%) |
| 1 or 2 Children | 219 (100.0%) | 0 (0.0%) |
| 3 or 4 Children | 58 (100.0%) | 0 (0.0%) |
| 5 or more Children | 0 (0.0%) | 0 (0.0%) |
| Total | 958 (99.9%) | 1 (0.1%) |
Income Below Poverty Among Single-Parent Households in Media borough
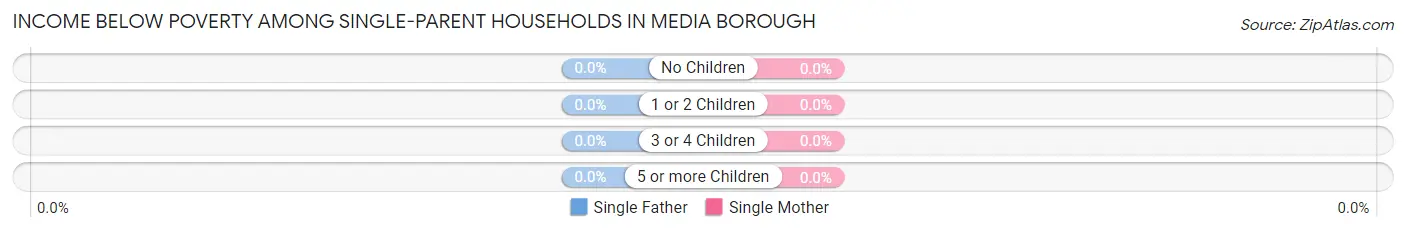
| Children | Single Father | Single Mother |
| No Children | 0 (0.0%) | 0 (0.0%) |
| 1 or 2 Children | 0 (0.0%) | 0 (0.0%) |
| 3 or 4 Children | 0 (0.0%) | 0 (0.0%) |
| 5 or more Children | 0 (0.0%) | 0 (0.0%) |
| Total | 0 (0.0%) | 0 (0.0%) |
Income Below Poverty Among Married-Couple vs Single-Parent Households in Media borough
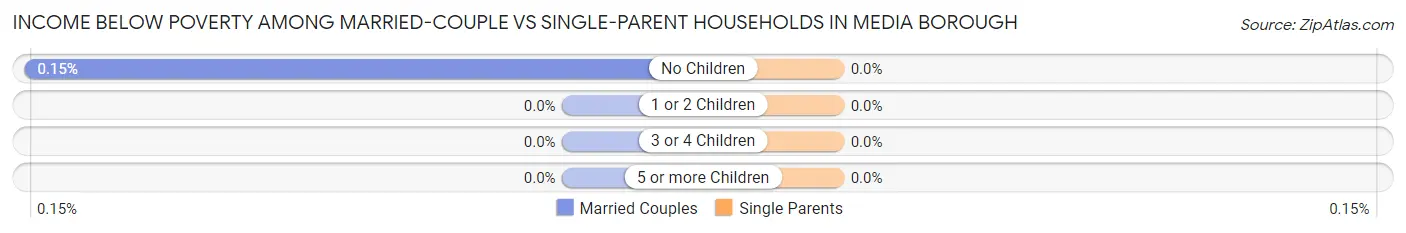
| Children | Married-Couple Families | Single-Parent Households |
| No Children | 1 (0.2%) | 0 (0.0%) |
| 1 or 2 Children | 0 (0.0%) | 0 (0.0%) |
| 3 or 4 Children | 0 (0.0%) | 0 (0.0%) |
| 5 or more Children | 0 (0.0%) | 0 (0.0%) |
| Total | 1 (0.1%) | 0 (0.0%) |
Employment Characteristics in Media borough
Employment by Class of Employer in Media borough
Among the 3,690 employed individuals in Media borough, private company employees (2,391 | 64.8%), not-for-profit organizations (598 | 16.2%), and local government employees (308 | 8.4%) make up the most common classes of employment.
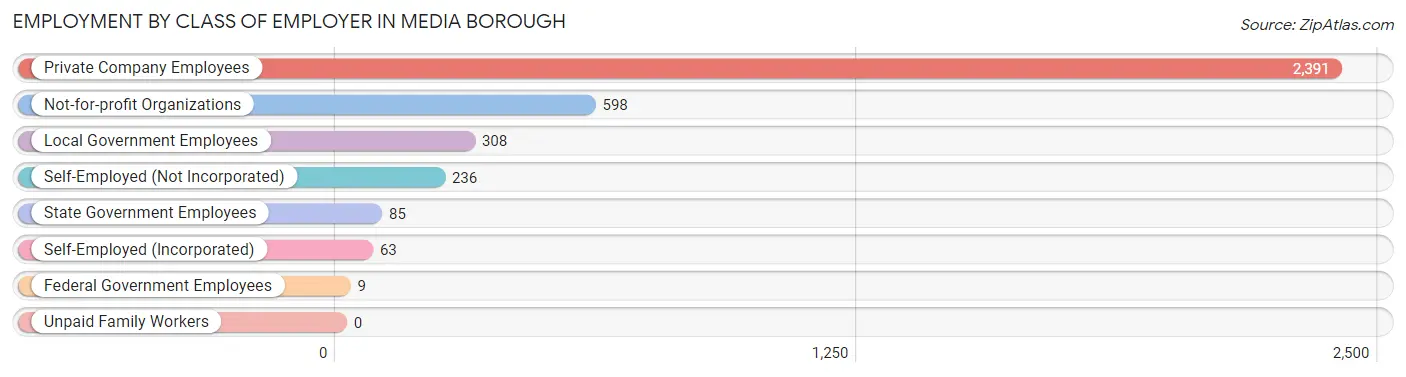
| Employer Class | # Employees | % Employees |
| Private Company Employees | 2,391 | 64.8% |
| Self-Employed (Incorporated) | 63 | 1.7% |
| Self-Employed (Not Incorporated) | 236 | 6.4% |
| Not-for-profit Organizations | 598 | 16.2% |
| Local Government Employees | 308 | 8.4% |
| State Government Employees | 85 | 2.3% |
| Federal Government Employees | 9 | 0.2% |
| Unpaid Family Workers | 0 | 0.0% |
| Total | 3,690 | 100.0% |
Employment Status by Age in Media borough
According to the labor force statistics for Media borough, out of the total population over 16 years of age (5,225), 75.2% or 3,929 individuals are in the labor force, with 6.1% or 240 of them unemployed. The age group with the highest labor force participation rate is 55 to 59 years, with 99.3% or 426 individuals in the labor force. Within the labor force, the 16 to 19 years age range has the highest percentage of unemployed individuals, with 18.4% or 7 of them being unemployed.
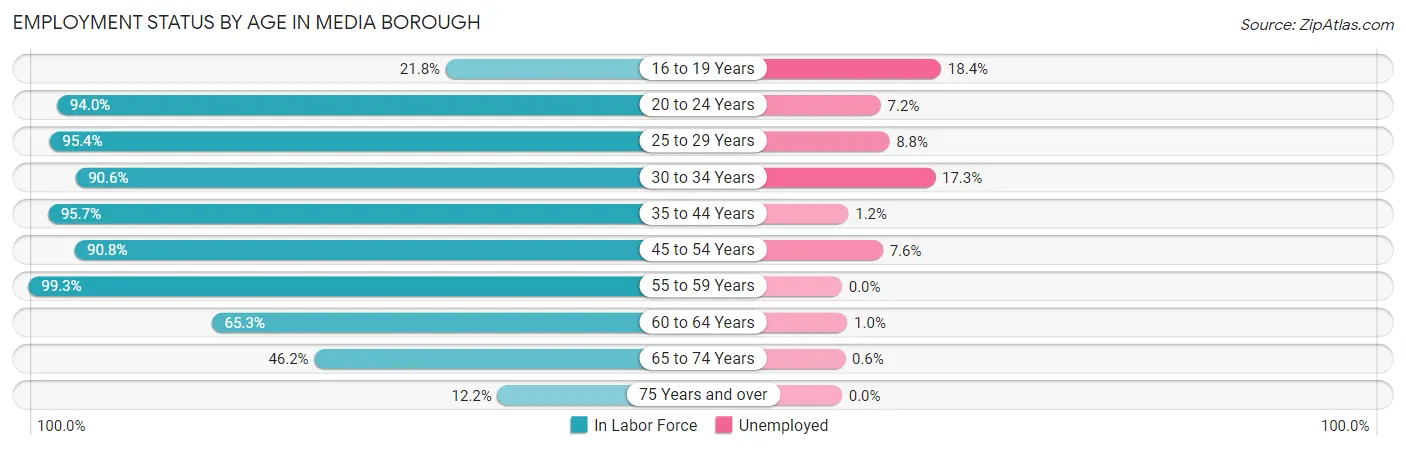
| Age Bracket | In Labor Force | Unemployed |
| 16 to 19 Years | 38 (21.8%) | 7 (18.4%) |
| 20 to 24 Years | 221 (94.0%) | 16 (7.2%) |
| 25 to 29 Years | 625 (95.4%) | 55 (8.8%) |
| 30 to 34 Years | 577 (90.6%) | 100 (17.3%) |
| 35 to 44 Years | 762 (95.7%) | 9 (1.2%) |
| 45 to 54 Years | 661 (90.8%) | 50 (7.6%) |
| 55 to 59 Years | 426 (99.3%) | 0 (0.0%) |
| 60 to 64 Years | 207 (65.3%) | 2 (1.0%) |
| 65 to 74 Years | 355 (46.2%) | 2 (0.6%) |
| 75 Years and over | 59 (12.2%) | 0 (0.0%) |
| Total | 3,929 (75.2%) | 240 (6.1%) |
Employment Status by Educational Attainment in Media borough
According to labor force statistics for Media borough, 91.5% of individuals (3,259) out of the total population between 25 and 64 years of age (3,562) are in the labor force, with 6.6% or 215 of them being unemployed. The group with the highest labor force participation rate are those with the educational attainment of college / associate degree, with 93.6% or 630 individuals in the labor force. Within the labor force, individuals with high school diploma education have the highest percentage of unemployment, with 18.5% or 74 of them being unemployed.
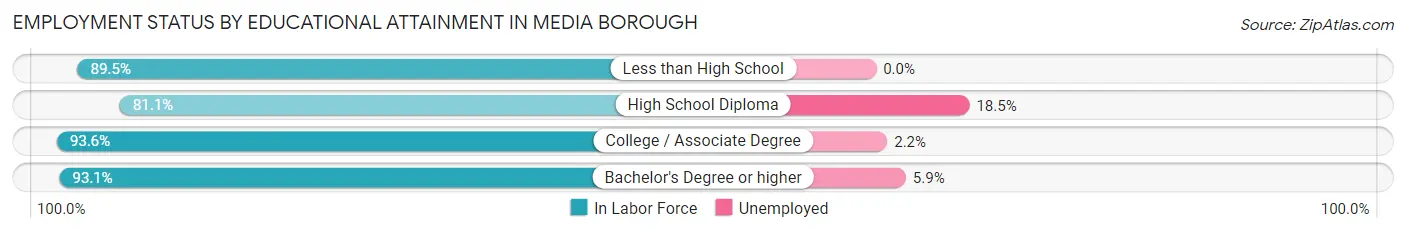
| Educational Attainment | In Labor Force | Unemployed |
| Less than High School | 68 (89.5%) | 0 (0.0%) |
| High School Diploma | 400 (81.1%) | 91 (18.5%) |
| College / Associate Degree | 630 (93.6%) | 15 (2.2%) |
| Bachelor's Degree or higher | 2,160 (93.1%) | 137 (5.9%) |
| Total | 3,259 (91.5%) | 235 (6.6%) |
Employment Occupations by Sex in Media borough
Management, Business, Science and Arts Occupations
The most common Management, Business, Science and Arts occupations in Media borough are Community & Social Service (828 | 22.4%), Management (526 | 14.2%), Computers, Engineering & Science (420 | 11.4%), Education Instruction & Library (381 | 10.3%), and Business & Financial (349 | 9.5%).
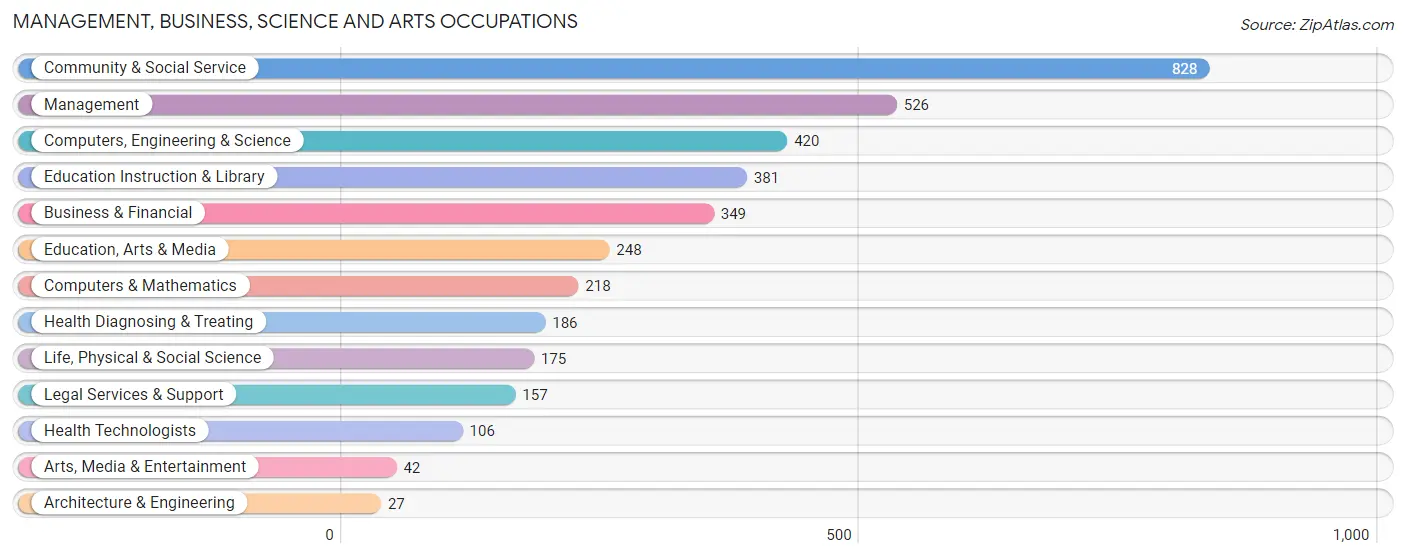
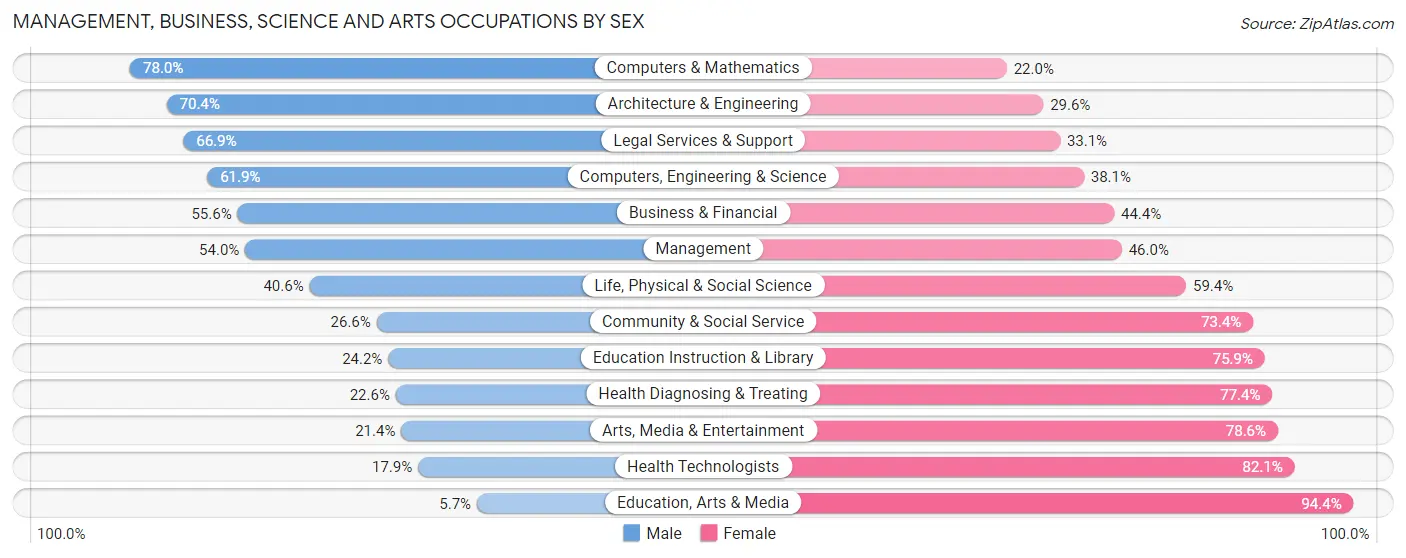
Management, Business, Science and Arts Occupations by Sex
Within the Management, Business, Science and Arts occupations in Media borough, the most male-oriented occupations are Computers & Mathematics (78.0%), Architecture & Engineering (70.4%), and Legal Services & Support (66.9%), while the most female-oriented occupations are Education, Arts & Media (94.4%), Health Technologists (82.1%), and Arts, Media & Entertainment (78.6%).
| Occupation | Male | Female |
| Management | 284 (54.0%) | 242 (46.0%) |
| Business & Financial | 194 (55.6%) | 155 (44.4%) |
| Computers, Engineering & Science | 260 (61.9%) | 160 (38.1%) |
| Computers & Mathematics | 170 (78.0%) | 48 (22.0%) |
| Architecture & Engineering | 19 (70.4%) | 8 (29.6%) |
| Life, Physical & Social Science | 71 (40.6%) | 104 (59.4%) |
| Community & Social Service | 220 (26.6%) | 608 (73.4%) |
| Education, Arts & Media | 14 (5.7%) | 234 (94.4%) |
| Legal Services & Support | 105 (66.9%) | 52 (33.1%) |
| Education Instruction & Library | 92 (24.1%) | 289 (75.8%) |
| Arts, Media & Entertainment | 9 (21.4%) | 33 (78.6%) |
| Health Diagnosing & Treating | 42 (22.6%) | 144 (77.4%) |
| Health Technologists | 19 (17.9%) | 87 (82.1%) |
| Total (Category) | 1,000 (43.3%) | 1,309 (56.7%) |
| Total (Overall) | 1,684 (45.6%) | 2,006 (54.4%) |
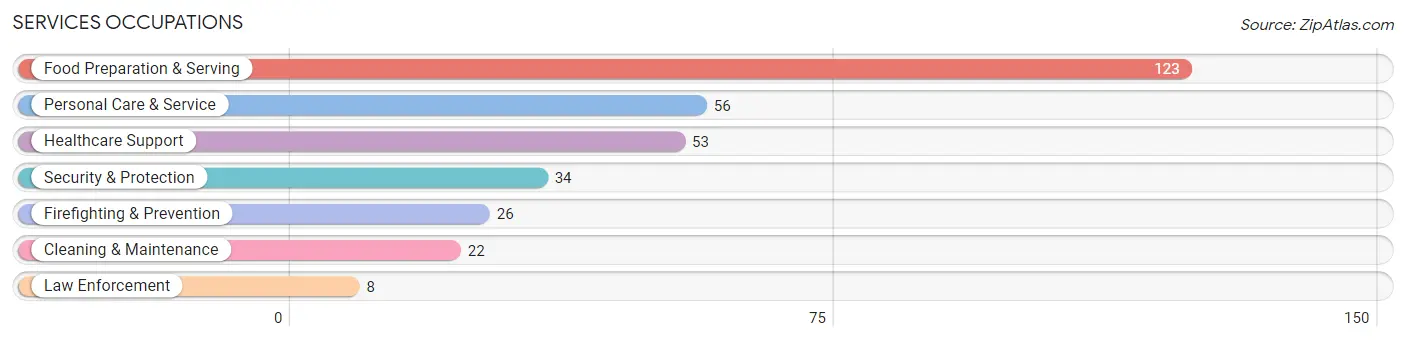
Services Occupations
The most common Services occupations in Media borough are Food Preparation & Serving (123 | 3.3%), Personal Care & Service (56 | 1.5%), Healthcare Support (53 | 1.4%), Security & Protection (34 | 0.9%), and Firefighting & Prevention (26 | 0.7%).
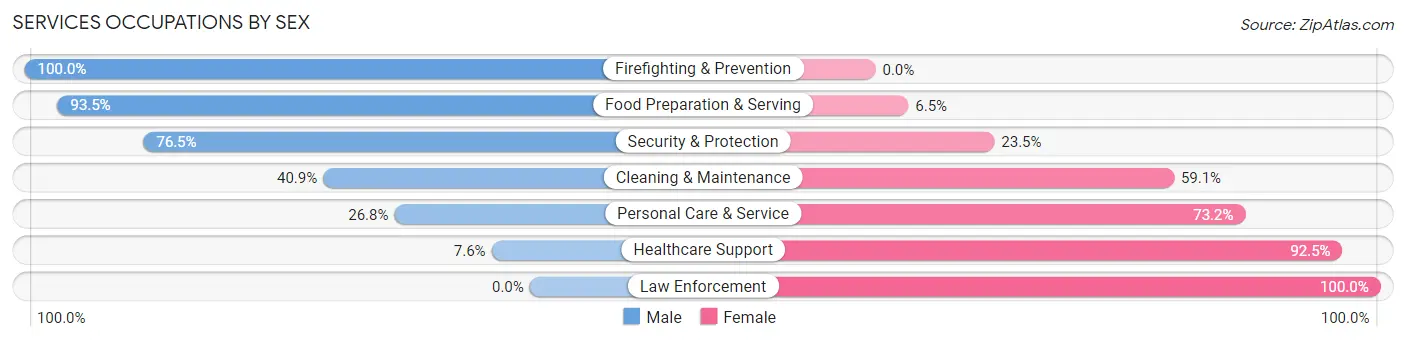
Services Occupations by Sex
Within the Services occupations in Media borough, the most male-oriented occupations are Firefighting & Prevention (100.0%), Food Preparation & Serving (93.5%), and Security & Protection (76.5%), while the most female-oriented occupations are Law Enforcement (100.0%), Healthcare Support (92.4%), and Personal Care & Service (73.2%).
| Occupation | Male | Female |
| Healthcare Support | 4 (7.5%) | 49 (92.4%) |
| Security & Protection | 26 (76.5%) | 8 (23.5%) |
| Firefighting & Prevention | 26 (100.0%) | 0 (0.0%) |
| Law Enforcement | 0 (0.0%) | 8 (100.0%) |
| Food Preparation & Serving | 115 (93.5%) | 8 (6.5%) |
| Cleaning & Maintenance | 9 (40.9%) | 13 (59.1%) |
| Personal Care & Service | 15 (26.8%) | 41 (73.2%) |
| Total (Category) | 169 (58.7%) | 119 (41.3%) |
| Total (Overall) | 1,684 (45.6%) | 2,006 (54.4%) |
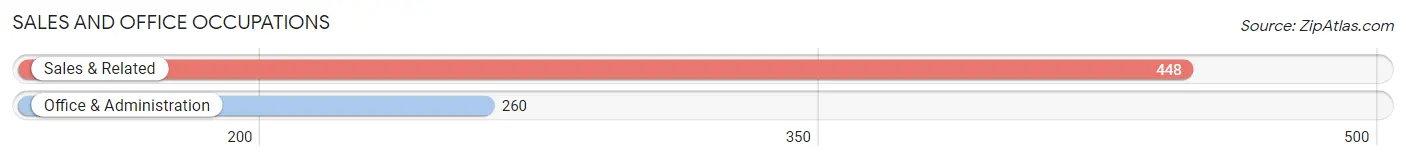
Sales and Office Occupations
The most common Sales and Office occupations in Media borough are Sales & Related (448 | 12.1%), and Office & Administration (260 | 7.0%).
Sales and Office Occupations by Sex
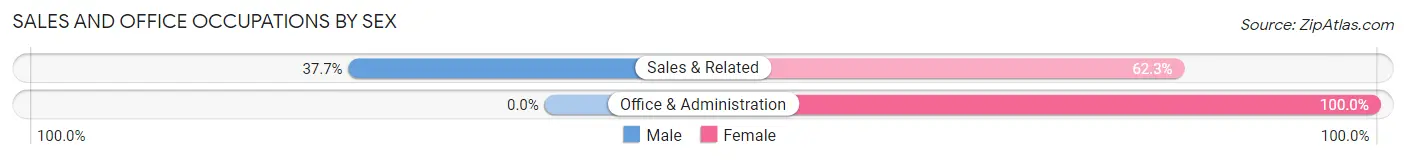
| Occupation | Male | Female |
| Sales & Related | 169 (37.7%) | 279 (62.3%) |
| Office & Administration | 0 (0.0%) | 260 (100.0%) |
| Total (Category) | 169 (23.9%) | 539 (76.1%) |
| Total (Overall) | 1,684 (45.6%) | 2,006 (54.4%) |
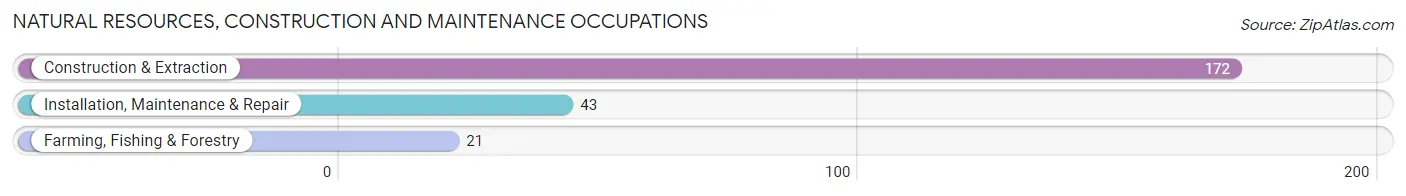
Natural Resources, Construction and Maintenance Occupations
The most common Natural Resources, Construction and Maintenance occupations in Media borough are Construction & Extraction (172 | 4.7%), Installation, Maintenance & Repair (43 | 1.2%), and Farming, Fishing & Forestry (21 | 0.6%).
Natural Resources, Construction and Maintenance Occupations by Sex
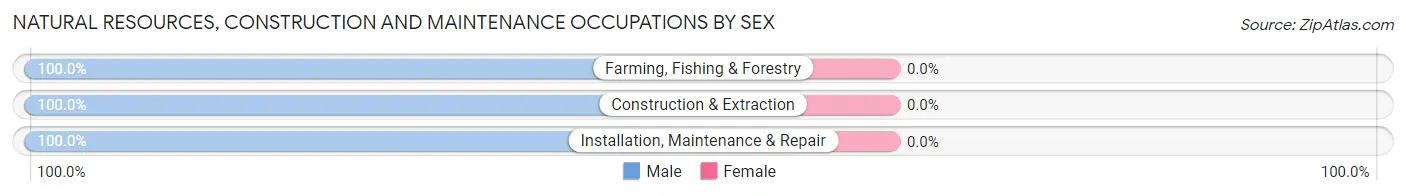
| Occupation | Male | Female |
| Farming, Fishing & Forestry | 21 (100.0%) | 0 (0.0%) |
| Construction & Extraction | 172 (100.0%) | 0 (0.0%) |
| Installation, Maintenance & Repair | 43 (100.0%) | 0 (0.0%) |
| Total (Category) | 236 (100.0%) | 0 (0.0%) |
| Total (Overall) | 1,684 (45.6%) | 2,006 (54.4%) |
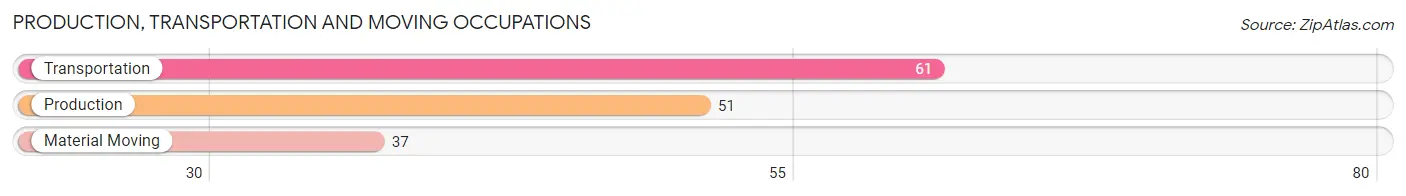
Production, Transportation and Moving Occupations
The most common Production, Transportation and Moving occupations in Media borough are Transportation (61 | 1.7%), Production (51 | 1.4%), and Material Moving (37 | 1.0%).
Production, Transportation and Moving Occupations by Sex
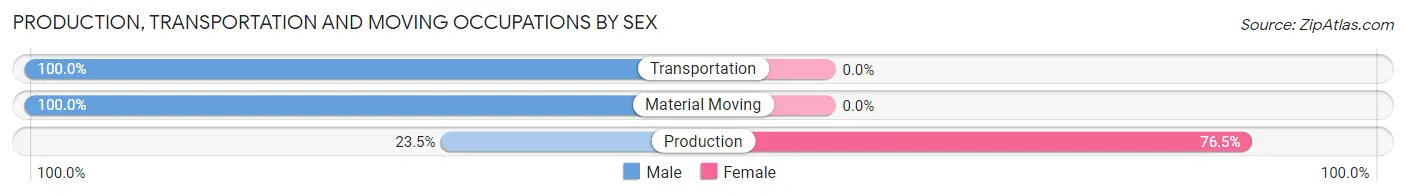
| Occupation | Male | Female |
| Production | 12 (23.5%) | 39 (76.5%) |
| Transportation | 61 (100.0%) | 0 (0.0%) |
| Material Moving | 37 (100.0%) | 0 (0.0%) |
| Total (Category) | 110 (73.8%) | 39 (26.2%) |
| Total (Overall) | 1,684 (45.6%) | 2,006 (54.4%) |
Employment Industries by Sex in Media borough
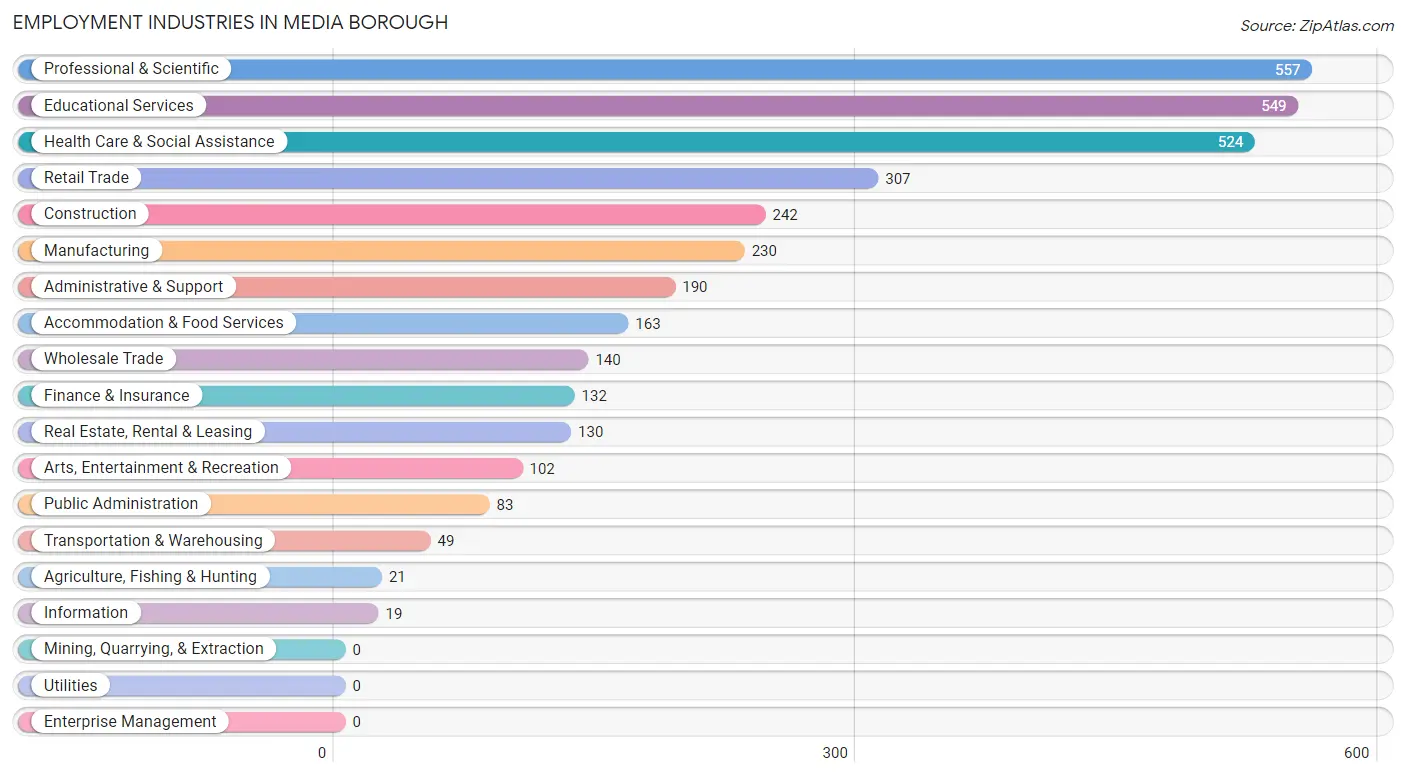
Employment Industries in Media borough
The major employment industries in Media borough include Professional & Scientific (557 | 15.1%), Educational Services (549 | 14.9%), Health Care & Social Assistance (524 | 14.2%), Retail Trade (307 | 8.3%), and Construction (242 | 6.6%).
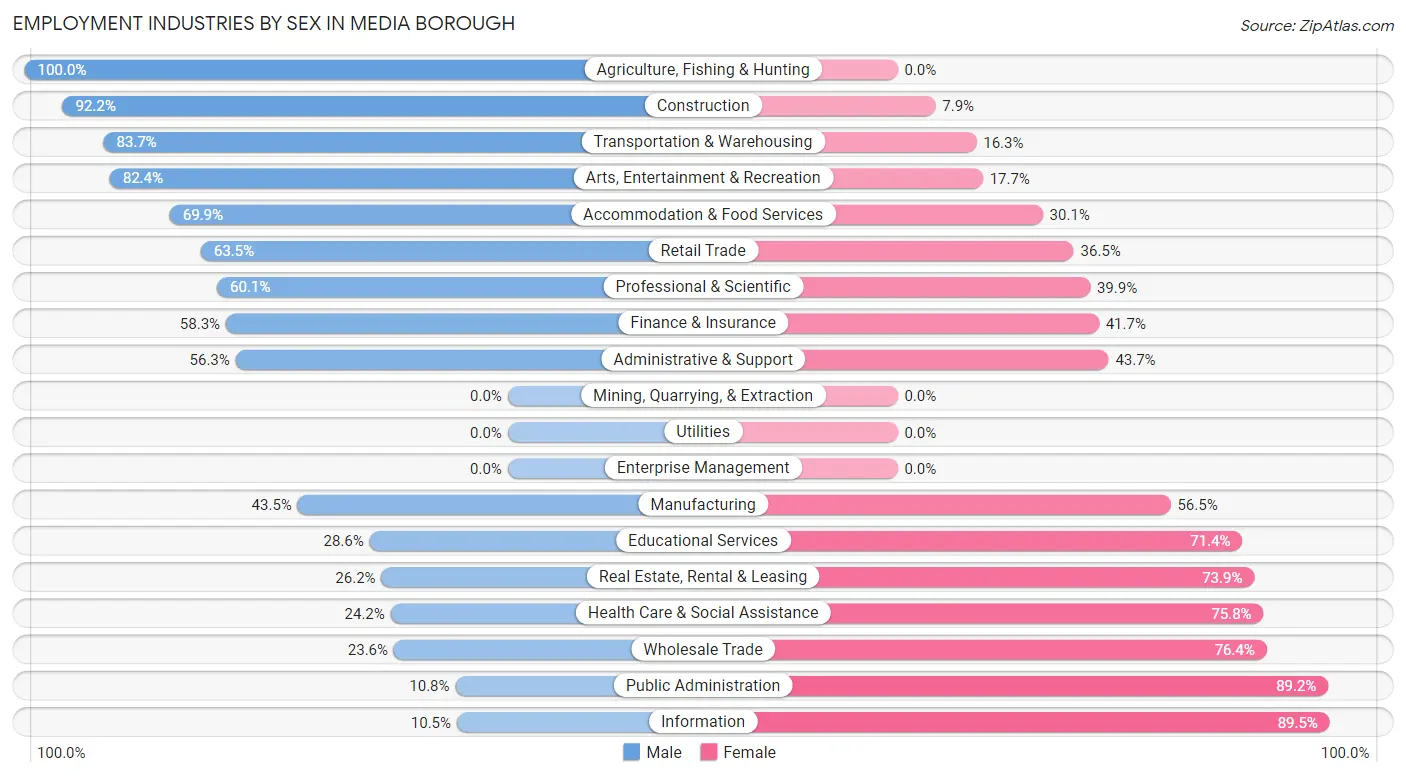
Employment Industries by Sex in Media borough
The Media borough industries that see more men than women are Agriculture, Fishing & Hunting (100.0%), Construction (92.1%), and Transportation & Warehousing (83.7%), whereas the industries that tend to have a higher number of women are Information (89.5%), Public Administration (89.2%), and Wholesale Trade (76.4%).
| Industry | Male | Female |
| Agriculture, Fishing & Hunting | 21 (100.0%) | 0 (0.0%) |
| Mining, Quarrying, & Extraction | 0 (0.0%) | 0 (0.0%) |
| Construction | 223 (92.1%) | 19 (7.9%) |
| Manufacturing | 100 (43.5%) | 130 (56.5%) |
| Wholesale Trade | 33 (23.6%) | 107 (76.4%) |
| Retail Trade | 195 (63.5%) | 112 (36.5%) |
| Transportation & Warehousing | 41 (83.7%) | 8 (16.3%) |
| Utilities | 0 (0.0%) | 0 (0.0%) |
| Information | 2 (10.5%) | 17 (89.5%) |
| Finance & Insurance | 77 (58.3%) | 55 (41.7%) |
| Real Estate, Rental & Leasing | 34 (26.2%) | 96 (73.9%) |
| Professional & Scientific | 335 (60.1%) | 222 (39.9%) |
| Enterprise Management | 0 (0.0%) | 0 (0.0%) |
| Administrative & Support | 107 (56.3%) | 83 (43.7%) |
| Educational Services | 157 (28.6%) | 392 (71.4%) |
| Health Care & Social Assistance | 127 (24.2%) | 397 (75.8%) |
| Arts, Entertainment & Recreation | 84 (82.4%) | 18 (17.6%) |
| Accommodation & Food Services | 114 (69.9%) | 49 (30.1%) |
| Public Administration | 9 (10.8%) | 74 (89.2%) |
| Total | 1,684 (45.6%) | 2,006 (54.4%) |
Education in Media borough
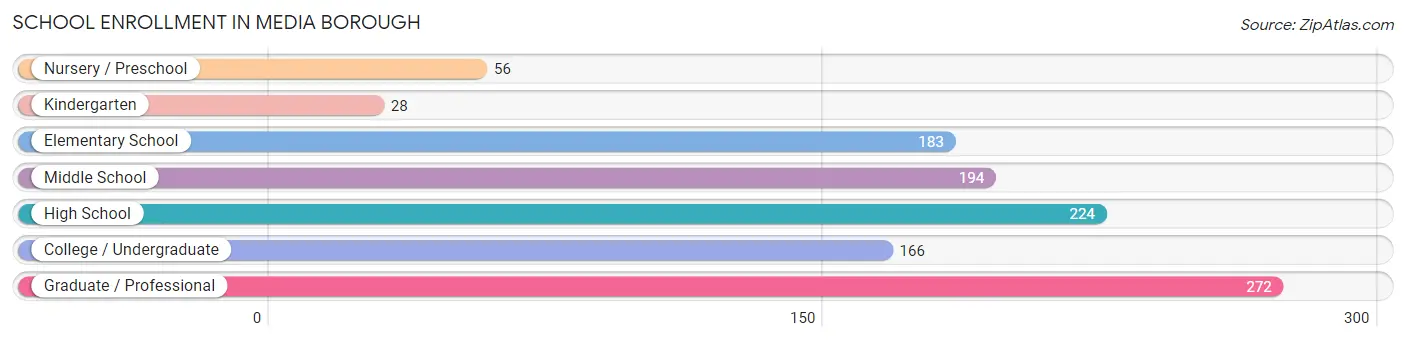
School Enrollment in Media borough
The most common levels of schooling among the 1,123 students in Media borough are graduate / professional (272 | 24.2%), high school (224 | 20.0%), and middle school (194 | 17.3%).
| School Level | # Students | % Students |
| Nursery / Preschool | 56 | 5.0% |
| Kindergarten | 28 | 2.5% |
| Elementary School | 183 | 16.3% |
| Middle School | 194 | 17.3% |
| High School | 224 | 20.0% |
| College / Undergraduate | 166 | 14.8% |
| Graduate / Professional | 272 | 24.2% |
| Total | 1,123 | 100.0% |
School Enrollment by Age by Funding Source in Media borough
Out of a total of 1,123 students who are enrolled in schools in Media borough, 325 (28.9%) attend a private institution, while the remaining 798 (71.1%) are enrolled in public schools. The age group of 3 to 4 year olds has the highest likelihood of being enrolled in private schools, with 24 (100.0% in the age bracket) enrolled. Conversely, the age group of 15 to 17 year olds has the lowest likelihood of being enrolled in a private school, with 171 (100.0% in the age bracket) attending a public institution.
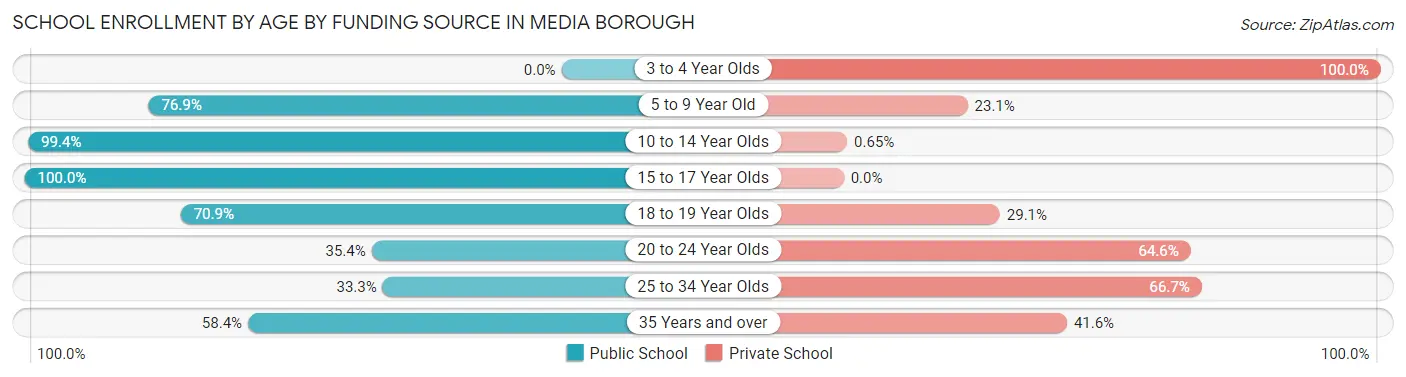
| Age Bracket | Public School | Private School |
| 3 to 4 Year Olds | 0 (0.0%) | 24 (100.0%) |
| 5 to 9 Year Old | 110 (76.9%) | 33 (23.1%) |
| 10 to 14 Year Olds | 308 (99.4%) | 2 (0.6%) |
| 15 to 17 Year Olds | 171 (100.0%) | 0 (0.0%) |
| 18 to 19 Year Olds | 39 (70.9%) | 16 (29.1%) |
| 20 to 24 Year Olds | 46 (35.4%) | 84 (64.6%) |
| 25 to 34 Year Olds | 59 (33.3%) | 118 (66.7%) |
| 35 Years and over | 66 (58.4%) | 47 (41.6%) |
| Total | 798 (71.1%) | 325 (28.9%) |
Educational Attainment by Field of Study in Media borough
Business (539 | 16.9%), science & technology (298 | 9.3%), visual & performing arts (281 | 8.8%), education (277 | 8.7%), and arts & humanities (272 | 8.5%) are the most common fields of study among 3,199 individuals in Media borough who have obtained a bachelor's degree or higher.
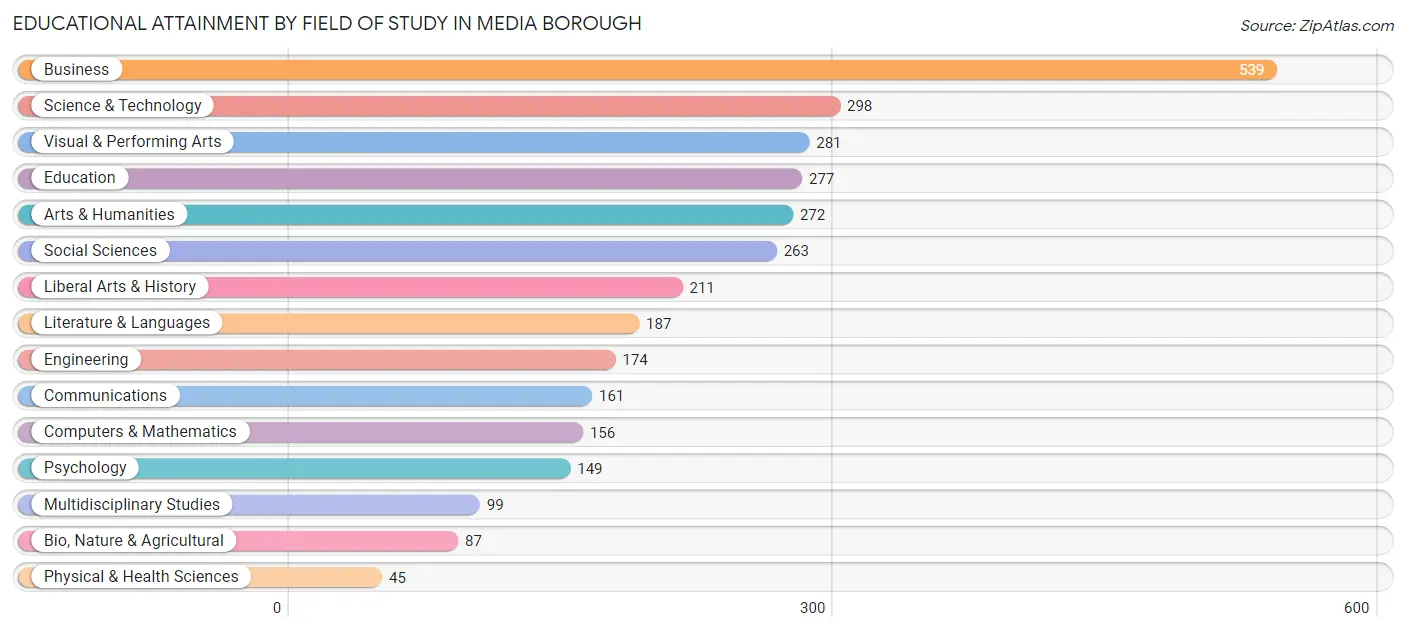
| Field of Study | # Graduates | % Graduates |
| Computers & Mathematics | 156 | 4.9% |
| Bio, Nature & Agricultural | 87 | 2.7% |
| Physical & Health Sciences | 45 | 1.4% |
| Psychology | 149 | 4.7% |
| Social Sciences | 263 | 8.2% |
| Engineering | 174 | 5.4% |
| Multidisciplinary Studies | 99 | 3.1% |
| Science & Technology | 298 | 9.3% |
| Business | 539 | 16.9% |
| Education | 277 | 8.7% |
| Literature & Languages | 187 | 5.9% |
| Liberal Arts & History | 211 | 6.6% |
| Visual & Performing Arts | 281 | 8.8% |
| Communications | 161 | 5.0% |
| Arts & Humanities | 272 | 8.5% |
| Total | 3,199 | 100.0% |
Transportation & Commute in Media borough
Vehicle Availability by Sex in Media borough
The most prevalent vehicle ownership categories in Media borough are males with 2 vehicles (646, accounting for 38.4%) and females with 2 vehicles (843, making up 32.2%).
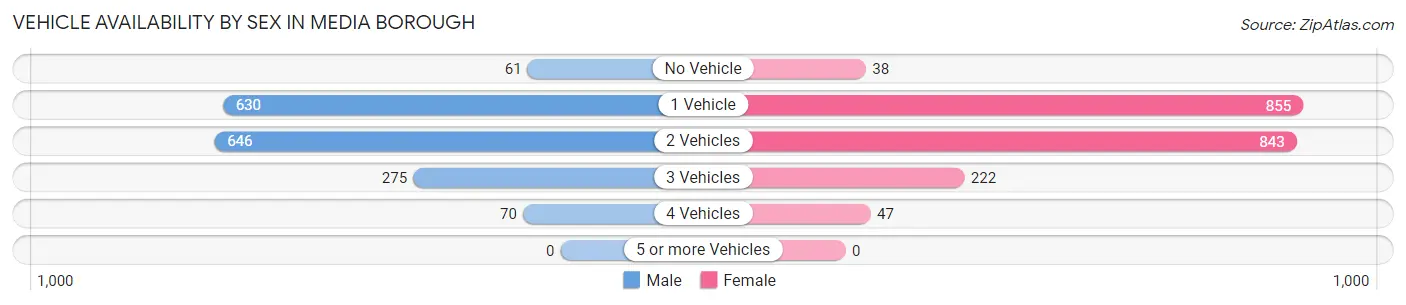
| Vehicles Available | Male | Female |
| No Vehicle | 61 (3.6%) | 38 (1.9%) |
| 1 Vehicle | 630 (37.5%) | 855 (42.6%) |
| 2 Vehicles | 646 (38.4%) | 843 (42.0%) |
| 3 Vehicles | 275 (16.4%) | 222 (11.1%) |
| 4 Vehicles | 70 (4.2%) | 47 (2.3%) |
| 5 or more Vehicles | 0 (0.0%) | 0 (0.0%) |
| Total | 1,682 (100.0%) | 2,005 (100.0%) |
Commute Time in Media borough
The most frequently occuring commute durations in Media borough are 10 to 14 minutes (404 commuters, 13.5%), 45 to 59 minutes (388 commuters, 12.9%), and 20 to 24 minutes (354 commuters, 11.8%).
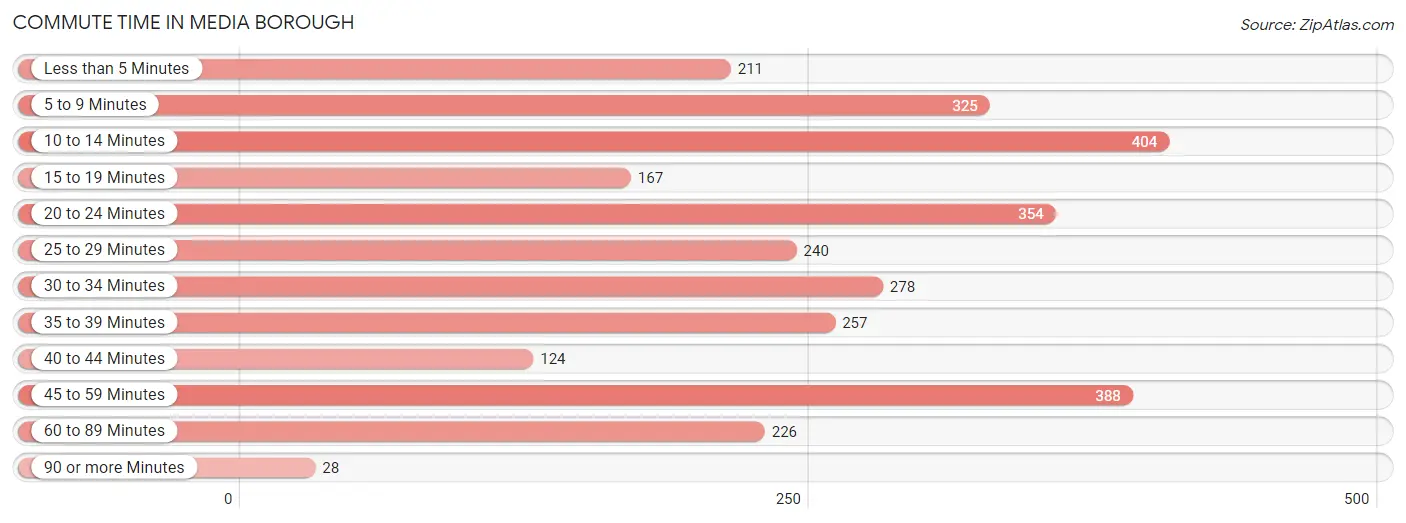
| Commute Time | # Commuters | % Commuters |
| Less than 5 Minutes | 211 | 7.0% |
| 5 to 9 Minutes | 325 | 10.8% |
| 10 to 14 Minutes | 404 | 13.5% |
| 15 to 19 Minutes | 167 | 5.6% |
| 20 to 24 Minutes | 354 | 11.8% |
| 25 to 29 Minutes | 240 | 8.0% |
| 30 to 34 Minutes | 278 | 9.3% |
| 35 to 39 Minutes | 257 | 8.6% |
| 40 to 44 Minutes | 124 | 4.1% |
| 45 to 59 Minutes | 388 | 12.9% |
| 60 to 89 Minutes | 226 | 7.5% |
| 90 or more Minutes | 28 | 0.9% |
Commute Time by Sex in Media borough
The most common commute times in Media borough are 10 to 14 minutes (179 commuters, 13.5%) for males and 20 to 24 minutes (269 commuters, 16.0%) for females.
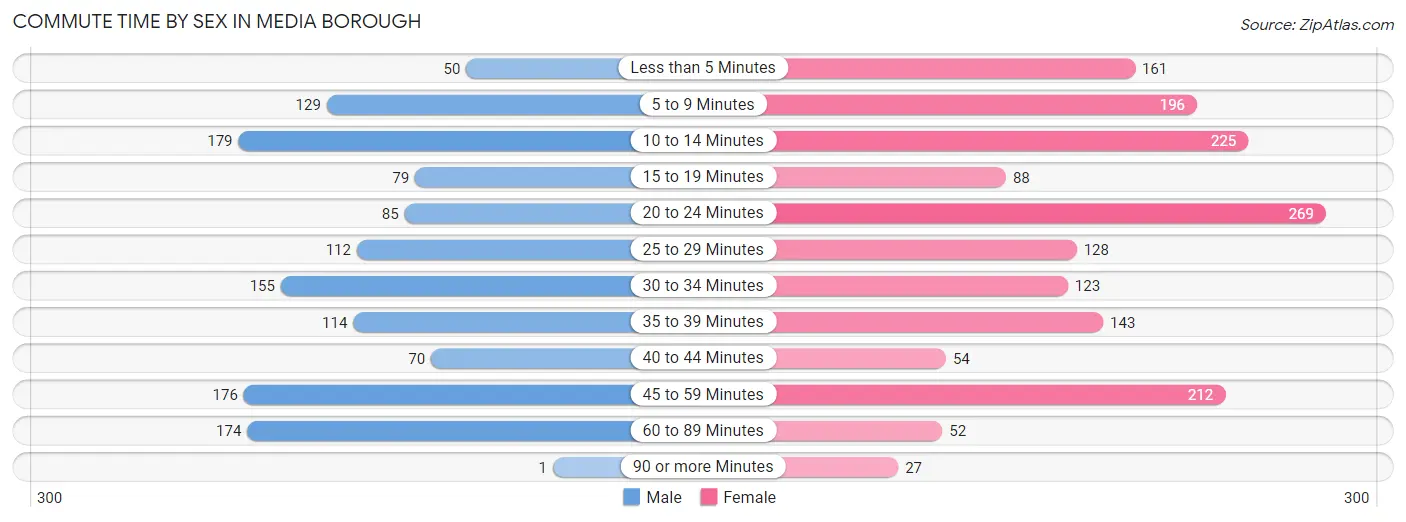
| Commute Time | Male | Female |
| Less than 5 Minutes | 50 (3.8%) | 161 (9.6%) |
| 5 to 9 Minutes | 129 (9.7%) | 196 (11.7%) |
| 10 to 14 Minutes | 179 (13.5%) | 225 (13.4%) |
| 15 to 19 Minutes | 79 (6.0%) | 88 (5.2%) |
| 20 to 24 Minutes | 85 (6.4%) | 269 (16.0%) |
| 25 to 29 Minutes | 112 (8.5%) | 128 (7.6%) |
| 30 to 34 Minutes | 155 (11.7%) | 123 (7.3%) |
| 35 to 39 Minutes | 114 (8.6%) | 143 (8.5%) |
| 40 to 44 Minutes | 70 (5.3%) | 54 (3.2%) |
| 45 to 59 Minutes | 176 (13.3%) | 212 (12.6%) |
| 60 to 89 Minutes | 174 (13.1%) | 52 (3.1%) |
| 90 or more Minutes | 1 (0.1%) | 27 (1.6%) |
Time of Departure to Work by Sex in Media borough
The most frequent times of departure to work in Media borough are 8:00 AM to 8:29 AM (248, 18.7%) for males and 8:30 AM to 8:59 AM (319, 19.0%) for females.
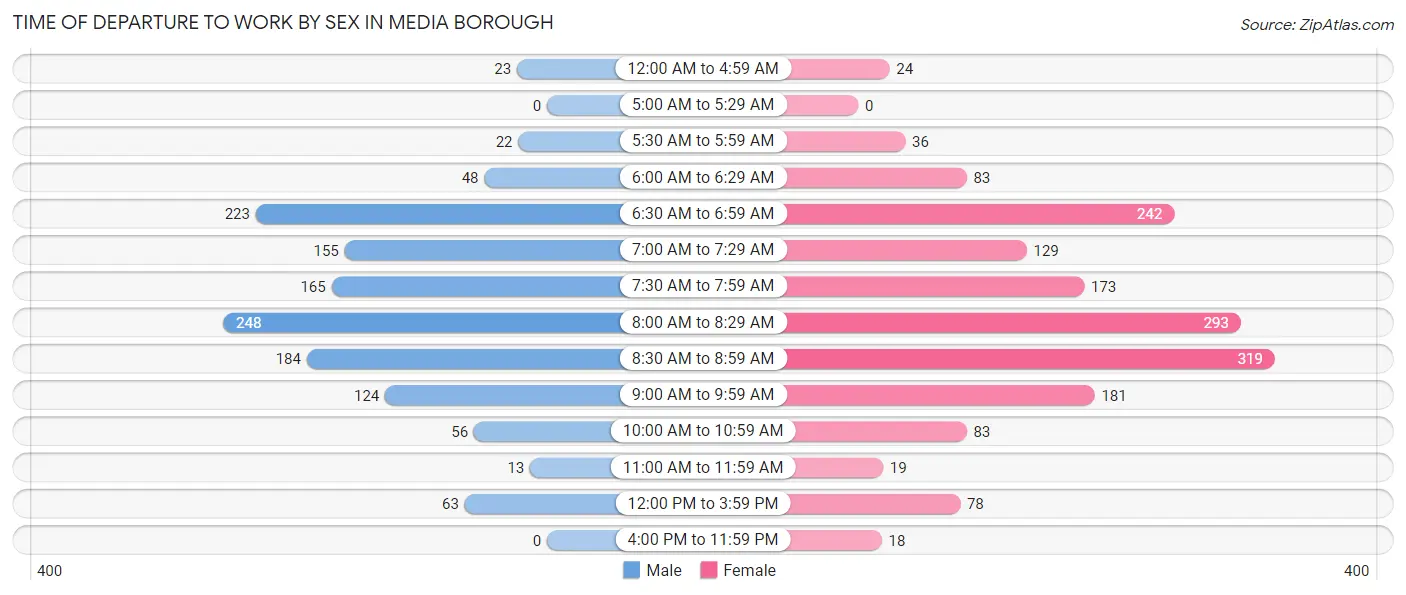
| Time of Departure | Male | Female |
| 12:00 AM to 4:59 AM | 23 (1.7%) | 24 (1.4%) |
| 5:00 AM to 5:29 AM | 0 (0.0%) | 0 (0.0%) |
| 5:30 AM to 5:59 AM | 22 (1.7%) | 36 (2.1%) |
| 6:00 AM to 6:29 AM | 48 (3.6%) | 83 (5.0%) |
| 6:30 AM to 6:59 AM | 223 (16.8%) | 242 (14.4%) |
| 7:00 AM to 7:29 AM | 155 (11.7%) | 129 (7.7%) |
| 7:30 AM to 7:59 AM | 165 (12.5%) | 173 (10.3%) |
| 8:00 AM to 8:29 AM | 248 (18.7%) | 293 (17.5%) |
| 8:30 AM to 8:59 AM | 184 (13.9%) | 319 (19.0%) |
| 9:00 AM to 9:59 AM | 124 (9.4%) | 181 (10.8%) |
| 10:00 AM to 10:59 AM | 56 (4.2%) | 83 (5.0%) |
| 11:00 AM to 11:59 AM | 13 (1.0%) | 19 (1.1%) |
| 12:00 PM to 3:59 PM | 63 (4.8%) | 78 (4.6%) |
| 4:00 PM to 11:59 PM | 0 (0.0%) | 18 (1.1%) |
| Total | 1,324 (100.0%) | 1,678 (100.0%) |
Housing Occupancy in Media borough
Occupancy by Ownership in Media borough
Of the total 2,939 dwellings in Media borough, owner-occupied units account for 1,169 (39.8%), while renter-occupied units make up 1,770 (60.2%).
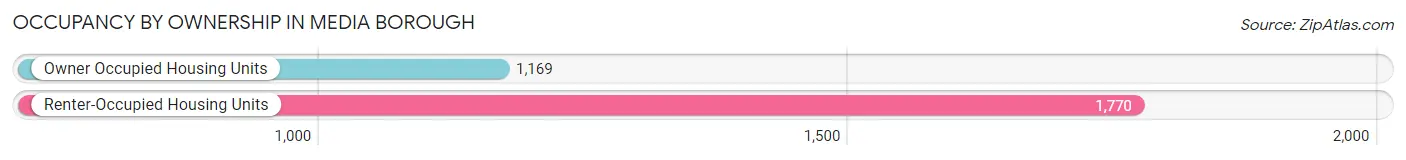
| Occupancy | # Housing Units | % Housing Units |
| Owner Occupied Housing Units | 1,169 | 39.8% |
| Renter-Occupied Housing Units | 1,770 | 60.2% |
| Total Occupied Housing Units | 2,939 | 100.0% |
Occupancy by Household Size in Media borough
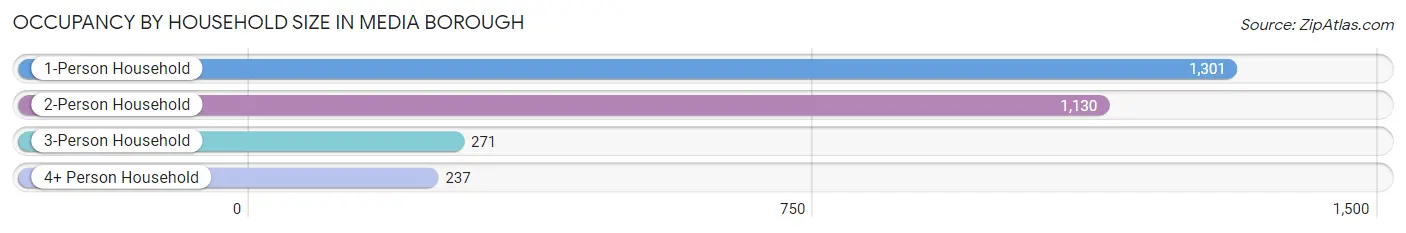
| Household Size | # Housing Units | % Housing Units |
| 1-Person Household | 1,301 | 44.3% |
| 2-Person Household | 1,130 | 38.5% |
| 3-Person Household | 271 | 9.2% |
| 4+ Person Household | 237 | 8.1% |
| Total Housing Units | 2,939 | 100.0% |
Occupancy by Ownership by Household Size in Media borough
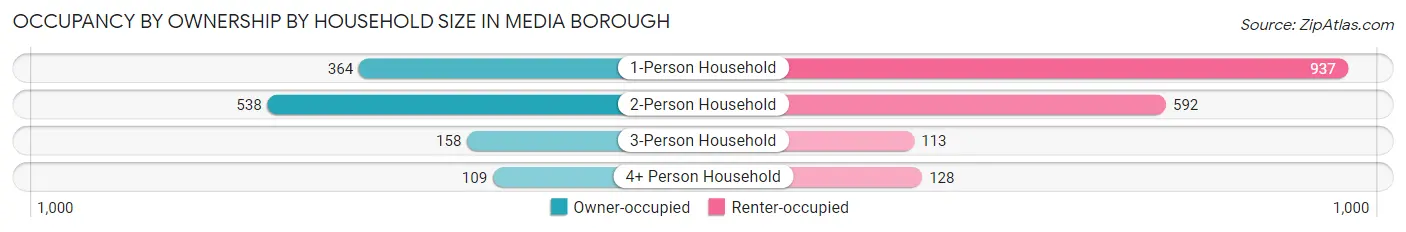
| Household Size | Owner-occupied | Renter-occupied |
| 1-Person Household | 364 (28.0%) | 937 (72.0%) |
| 2-Person Household | 538 (47.6%) | 592 (52.4%) |
| 3-Person Household | 158 (58.3%) | 113 (41.7%) |
| 4+ Person Household | 109 (46.0%) | 128 (54.0%) |
| Total Housing Units | 1,169 (39.8%) | 1,770 (60.2%) |
Occupancy by Educational Attainment in Media borough
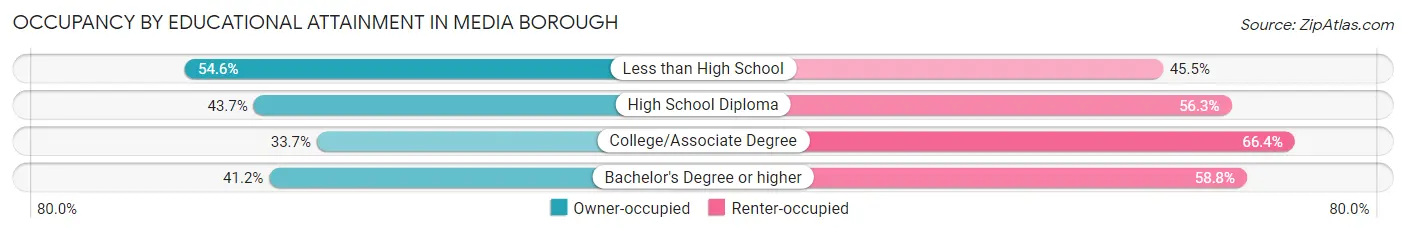
| Household Size | Owner-occupied | Renter-occupied |
| Less than High School | 24 (54.5%) | 20 (45.5%) |
| High School Diploma | 135 (43.7%) | 174 (56.3%) |
| College/Associate Degree | 248 (33.7%) | 489 (66.3%) |
| Bachelor's Degree or higher | 762 (41.2%) | 1,087 (58.8%) |
Occupancy by Age of Householder in Media borough
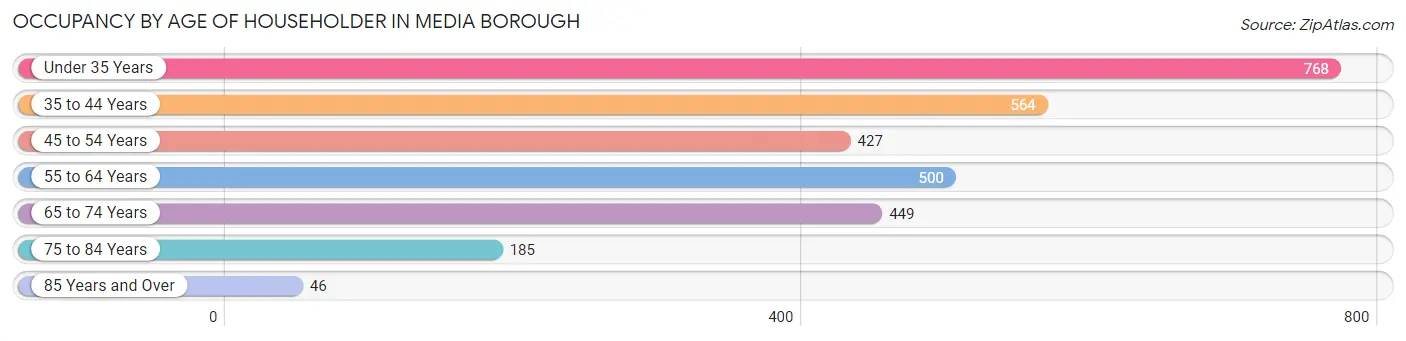
| Age Bracket | # Households | % Households |
| Under 35 Years | 768 | 26.1% |
| 35 to 44 Years | 564 | 19.2% |
| 45 to 54 Years | 427 | 14.5% |
| 55 to 64 Years | 500 | 17.0% |
| 65 to 74 Years | 449 | 15.3% |
| 75 to 84 Years | 185 | 6.3% |
| 85 Years and Over | 46 | 1.6% |
| Total | 2,939 | 100.0% |
Housing Finances in Media borough
Median Income by Occupancy in Media borough
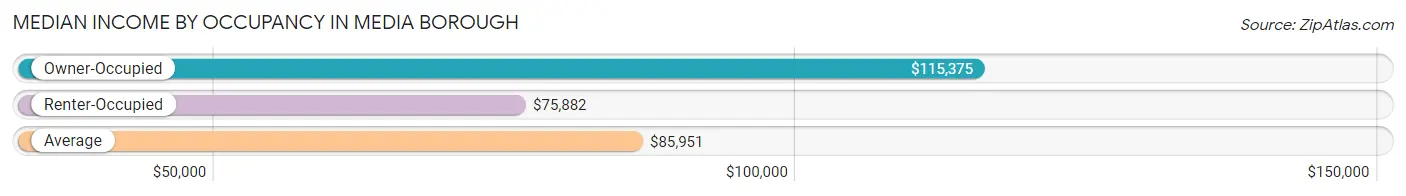
| Occupancy Type | # Households | Median Income |
| Owner-Occupied | 1,169 (39.8%) | $115,375 |
| Renter-Occupied | 1,770 (60.2%) | $75,882 |
| Average | 2,939 (100.0%) | $85,951 |
Occupancy by Householder Income Bracket in Media borough
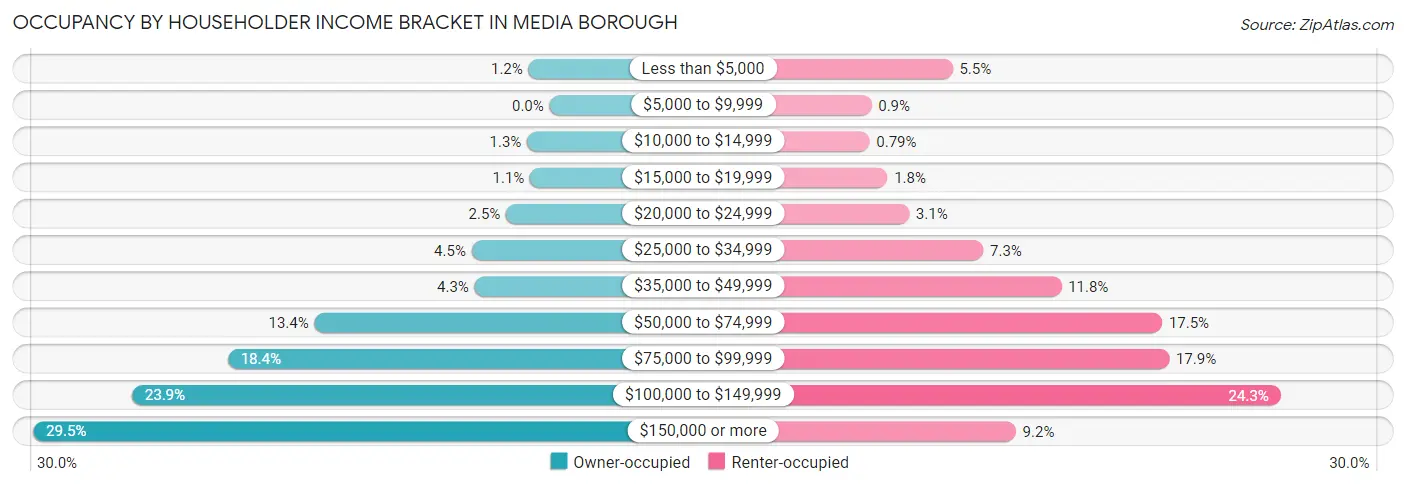
| Income Bracket | Owner-occupied | Renter-occupied |
| Less than $5,000 | 14 (1.2%) | 98 (5.5%) |
| $5,000 to $9,999 | 0 (0.0%) | 16 (0.9%) |
| $10,000 to $14,999 | 15 (1.3%) | 14 (0.8%) |
| $15,000 to $19,999 | 13 (1.1%) | 32 (1.8%) |
| $20,000 to $24,999 | 29 (2.5%) | 54 (3.0%) |
| $25,000 to $34,999 | 52 (4.4%) | 129 (7.3%) |
| $35,000 to $49,999 | 50 (4.3%) | 208 (11.7%) |
| $50,000 to $74,999 | 157 (13.4%) | 310 (17.5%) |
| $75,000 to $99,999 | 215 (18.4%) | 317 (17.9%) |
| $100,000 to $149,999 | 279 (23.9%) | 430 (24.3%) |
| $150,000 or more | 345 (29.5%) | 162 (9.1%) |
| Total | 1,169 (100.0%) | 1,770 (100.0%) |
Monthly Housing Cost Tiers in Media borough
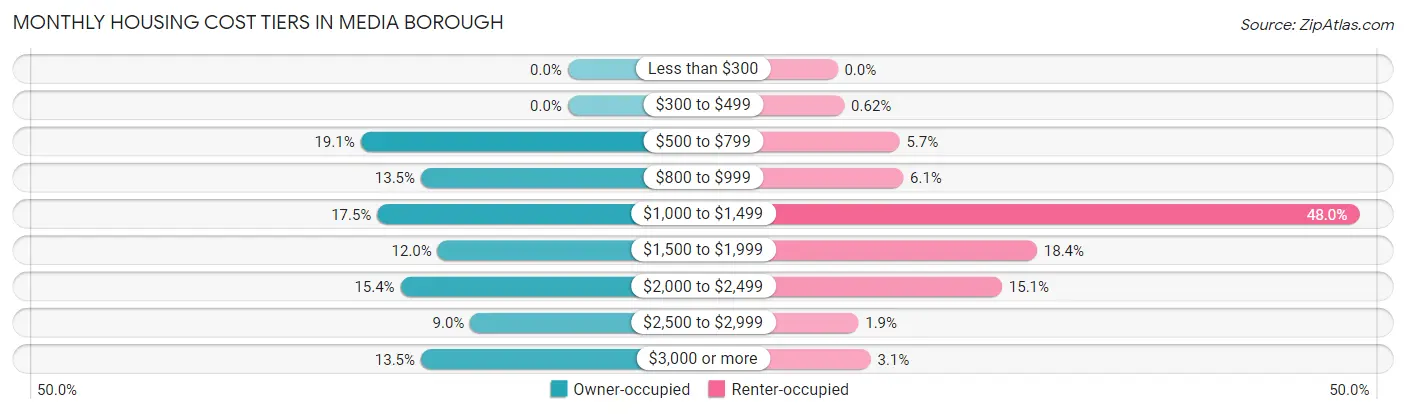
| Monthly Cost | Owner-occupied | Renter-occupied |
| Less than $300 | 0 (0.0%) | 0 (0.0%) |
| $300 to $499 | 0 (0.0%) | 11 (0.6%) |
| $500 to $799 | 223 (19.1%) | 101 (5.7%) |
| $800 to $999 | 158 (13.5%) | 107 (6.0%) |
| $1,000 to $1,499 | 205 (17.5%) | 850 (48.0%) |
| $1,500 to $1,999 | 140 (12.0%) | 325 (18.4%) |
| $2,000 to $2,499 | 180 (15.4%) | 268 (15.1%) |
| $2,500 to $2,999 | 105 (9.0%) | 34 (1.9%) |
| $3,000 or more | 158 (13.5%) | 54 (3.0%) |
| Total | 1,169 (100.0%) | 1,770 (100.0%) |
Physical Housing Characteristics in Media borough
Housing Structures in Media borough
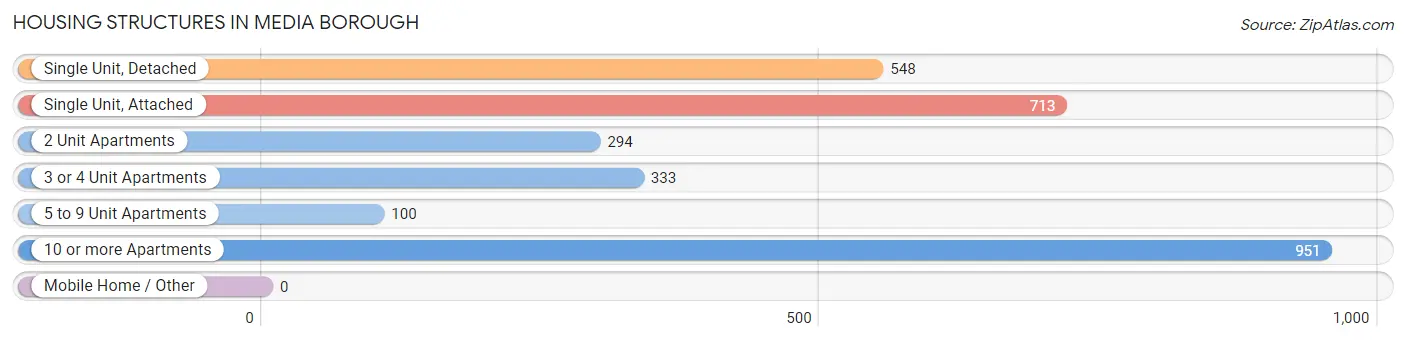
| Structure Type | # Housing Units | % Housing Units |
| Single Unit, Detached | 548 | 18.6% |
| Single Unit, Attached | 713 | 24.3% |
| 2 Unit Apartments | 294 | 10.0% |
| 3 or 4 Unit Apartments | 333 | 11.3% |
| 5 to 9 Unit Apartments | 100 | 3.4% |
| 10 or more Apartments | 951 | 32.4% |
| Mobile Home / Other | 0 | 0.0% |
| Total | 2,939 | 100.0% |
Housing Structures by Occupancy in Media borough
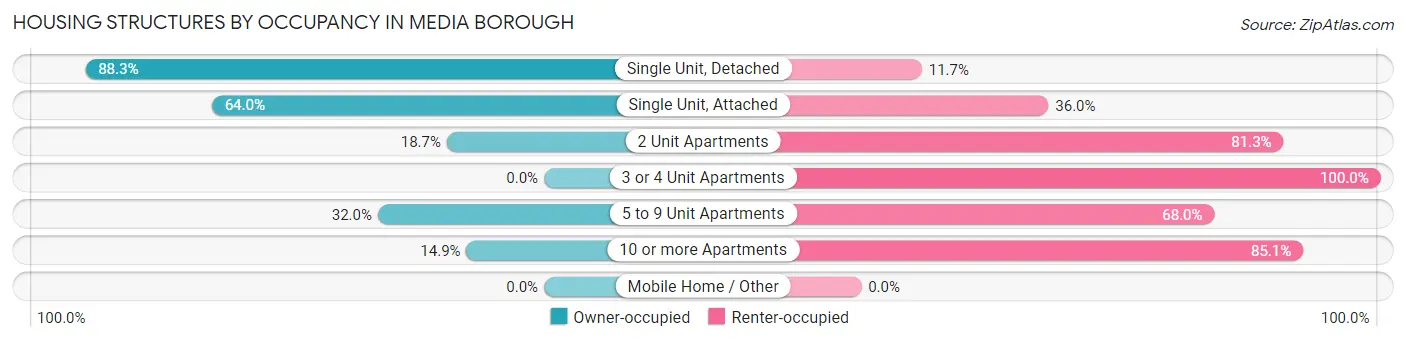
| Structure Type | Owner-occupied | Renter-occupied |
| Single Unit, Detached | 484 (88.3%) | 64 (11.7%) |
| Single Unit, Attached | 456 (64.0%) | 257 (36.0%) |
| 2 Unit Apartments | 55 (18.7%) | 239 (81.3%) |
| 3 or 4 Unit Apartments | 0 (0.0%) | 333 (100.0%) |
| 5 to 9 Unit Apartments | 32 (32.0%) | 68 (68.0%) |
| 10 or more Apartments | 142 (14.9%) | 809 (85.1%) |
| Mobile Home / Other | 0 (0.0%) | 0 (0.0%) |
| Total | 1,169 (39.8%) | 1,770 (60.2%) |
Housing Structures by Number of Rooms in Media borough
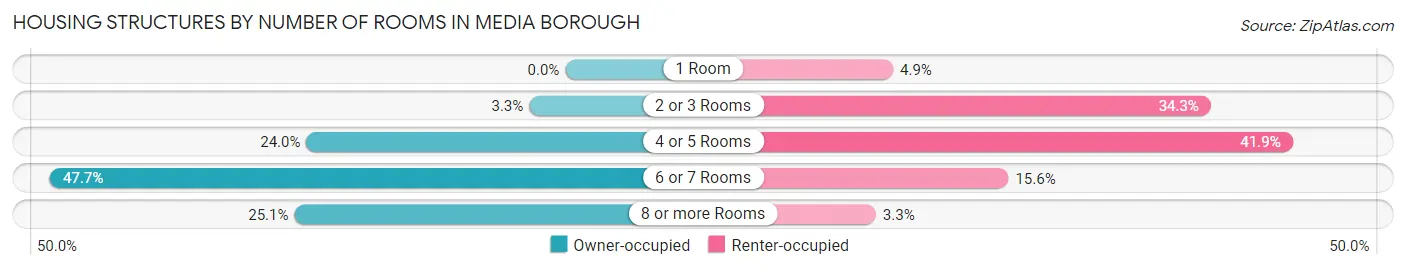
| Number of Rooms | Owner-occupied | Renter-occupied |
| 1 Room | 0 (0.0%) | 87 (4.9%) |
| 2 or 3 Rooms | 39 (3.3%) | 607 (34.3%) |
| 4 or 5 Rooms | 280 (23.9%) | 741 (41.9%) |
| 6 or 7 Rooms | 557 (47.6%) | 276 (15.6%) |
| 8 or more Rooms | 293 (25.1%) | 59 (3.3%) |
| Total | 1,169 (100.0%) | 1,770 (100.0%) |
Housing Structure by Heating Type in Media borough
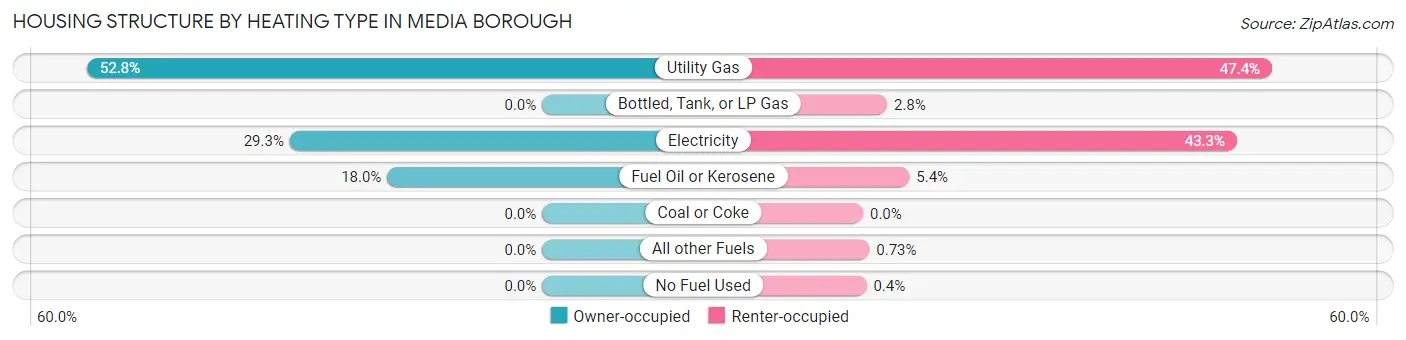
| Heating Type | Owner-occupied | Renter-occupied |
| Utility Gas | 617 (52.8%) | 839 (47.4%) |
| Bottled, Tank, or LP Gas | 0 (0.0%) | 49 (2.8%) |
| Electricity | 342 (29.3%) | 767 (43.3%) |
| Fuel Oil or Kerosene | 210 (18.0%) | 95 (5.4%) |
| Coal or Coke | 0 (0.0%) | 0 (0.0%) |
| All other Fuels | 0 (0.0%) | 13 (0.7%) |
| No Fuel Used | 0 (0.0%) | 7 (0.4%) |
| Total | 1,169 (100.0%) | 1,770 (100.0%) |
Household Vehicle Usage in Media borough
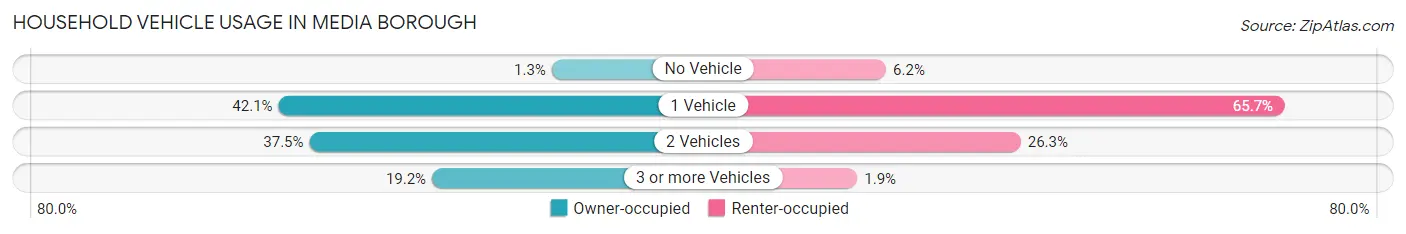
| Vehicles per Household | Owner-occupied | Renter-occupied |
| No Vehicle | 15 (1.3%) | 109 (6.2%) |
| 1 Vehicle | 492 (42.1%) | 1,163 (65.7%) |
| 2 Vehicles | 438 (37.5%) | 465 (26.3%) |
| 3 or more Vehicles | 224 (19.2%) | 33 (1.9%) |
| Total | 1,169 (100.0%) | 1,770 (100.0%) |
Real Estate & Mortgages in Media borough
Real Estate and Mortgage Overview in Media borough
| Characteristic | Without Mortgage | With Mortgage |
| Housing Units | 441 | 728 |
| Median Property Value | $408,300 | $392,800 |
| Median Household Income | $89,637 | $239 |
| Monthly Housing Costs | $798 | $158 |
| Real Estate Taxes | $4,529 | $0 |
Property Value by Mortgage Status in Media borough
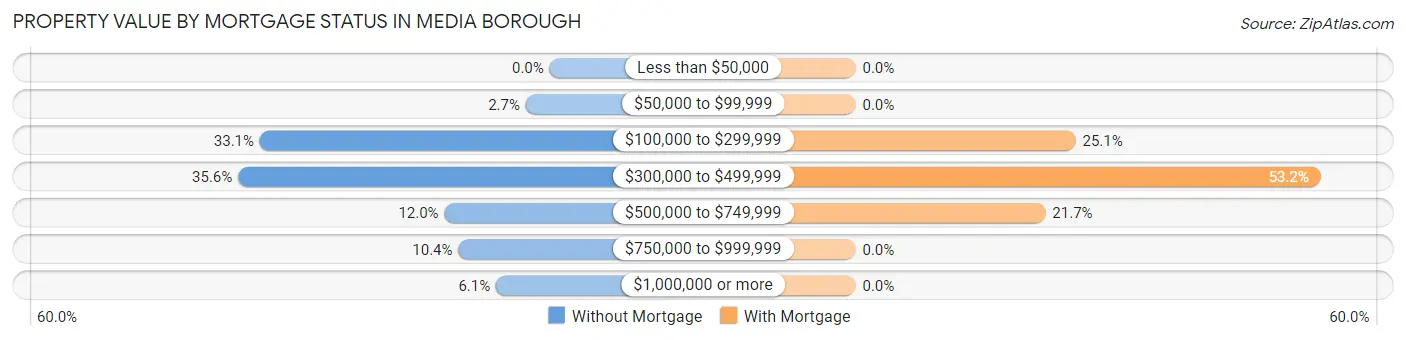
| Property Value | Without Mortgage | With Mortgage |
| Less than $50,000 | 0 (0.0%) | 0 (0.0%) |
| $50,000 to $99,999 | 12 (2.7%) | 0 (0.0%) |
| $100,000 to $299,999 | 146 (33.1%) | 183 (25.1%) |
| $300,000 to $499,999 | 157 (35.6%) | 387 (53.2%) |
| $500,000 to $749,999 | 53 (12.0%) | 158 (21.7%) |
| $750,000 to $999,999 | 46 (10.4%) | 0 (0.0%) |
| $1,000,000 or more | 27 (6.1%) | 0 (0.0%) |
| Total | 441 (100.0%) | 728 (100.0%) |
Household Income by Mortgage Status in Media borough
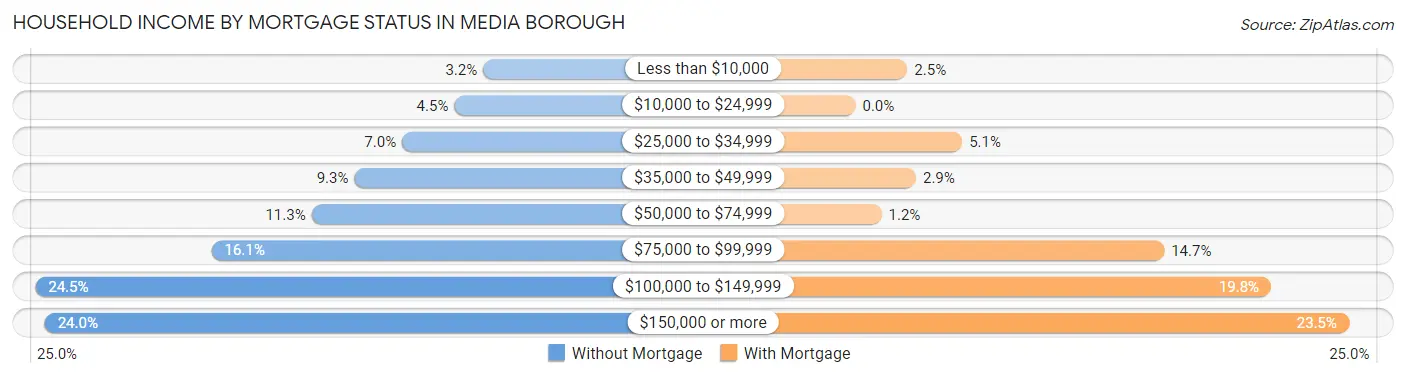
| Household Income | Without Mortgage | With Mortgage |
| Less than $10,000 | 14 (3.2%) | 18 (2.5%) |
| $10,000 to $24,999 | 20 (4.5%) | 0 (0.0%) |
| $25,000 to $34,999 | 31 (7.0%) | 37 (5.1%) |
| $35,000 to $49,999 | 41 (9.3%) | 21 (2.9%) |
| $50,000 to $74,999 | 50 (11.3%) | 9 (1.2%) |
| $75,000 to $99,999 | 71 (16.1%) | 107 (14.7%) |
| $100,000 to $149,999 | 108 (24.5%) | 144 (19.8%) |
| $150,000 or more | 106 (24.0%) | 171 (23.5%) |
| Total | 441 (100.0%) | 728 (100.0%) |
Property Value to Household Income Ratio in Media borough
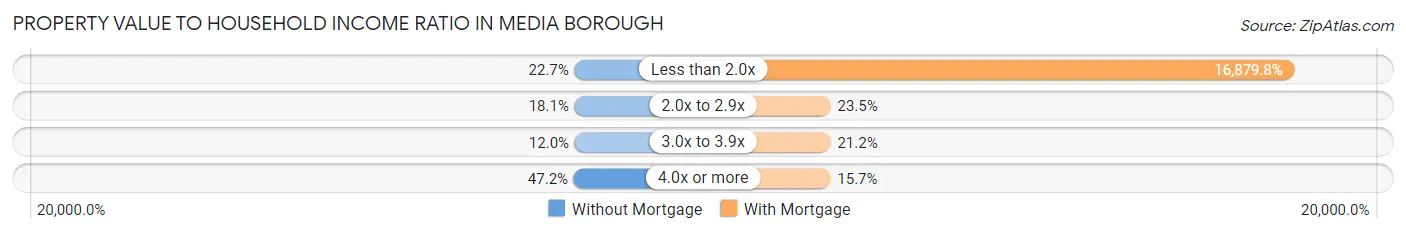
| Value-to-Income Ratio | Without Mortgage | With Mortgage |
| Less than 2.0x | 100 (22.7%) | 122,885 (16,879.8%) |
| 2.0x to 2.9x | 80 (18.1%) | 171 (23.5%) |
| 3.0x to 3.9x | 53 (12.0%) | 154 (21.1%) |
| 4.0x or more | 208 (47.2%) | 114 (15.7%) |
| Total | 441 (100.0%) | 728 (100.0%) |
Real Estate Taxes by Mortgage Status in Media borough
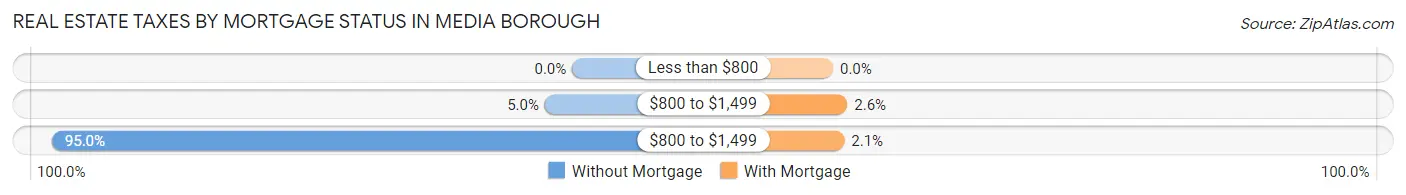
| Property Taxes | Without Mortgage | With Mortgage |
| Less than $800 | 0 (0.0%) | 0 (0.0%) |
| $800 to $1,499 | 22 (5.0%) | 19 (2.6%) |
| $800 to $1,499 | 419 (95.0%) | 15 (2.1%) |
| Total | 441 (100.0%) | 728 (100.0%) |
Health & Disability in Media borough
Health Insurance Coverage by Age in Media borough
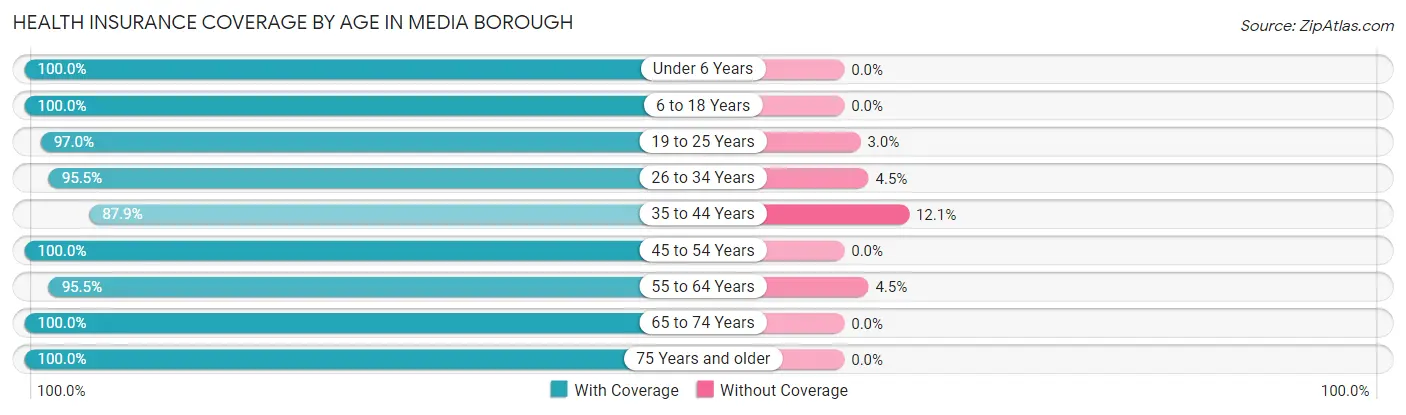
| Age Bracket | With Coverage | Without Coverage |
| Under 6 Years | 164 (100.0%) | 0 (0.0%) |
| 6 to 18 Years | 613 (100.0%) | 0 (0.0%) |
| 19 to 25 Years | 355 (97.0%) | 11 (3.0%) |
| 26 to 34 Years | 1,139 (95.5%) | 54 (4.5%) |
| 35 to 44 Years | 700 (87.9%) | 96 (12.1%) |
| 45 to 54 Years | 728 (100.0%) | 0 (0.0%) |
| 55 to 64 Years | 698 (95.5%) | 33 (4.5%) |
| 65 to 74 Years | 742 (100.0%) | 0 (0.0%) |
| 75 Years and older | 375 (100.0%) | 0 (0.0%) |
| Total | 5,514 (96.6%) | 194 (3.4%) |
Health Insurance Coverage by Citizenship Status in Media borough
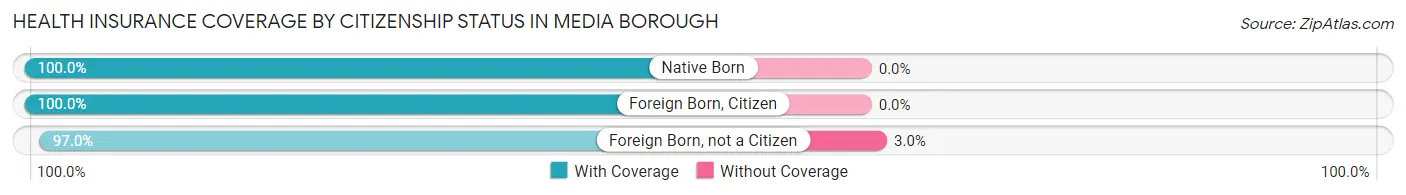
| Citizenship Status | With Coverage | Without Coverage |
| Native Born | 164 (100.0%) | 0 (0.0%) |
| Foreign Born, Citizen | 613 (100.0%) | 0 (0.0%) |
| Foreign Born, not a Citizen | 355 (97.0%) | 11 (3.0%) |
Health Insurance Coverage by Household Income in Media borough
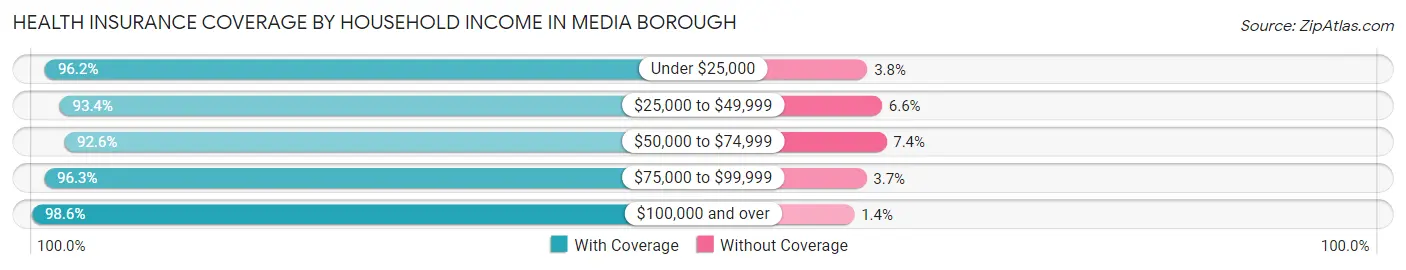
| Household Income | With Coverage | Without Coverage |
| Under $25,000 | 276 (96.2%) | 11 (3.8%) |
| $25,000 to $49,999 | 555 (93.4%) | 39 (6.6%) |
| $50,000 to $74,999 | 863 (92.6%) | 69 (7.4%) |
| $75,000 to $99,999 | 895 (96.3%) | 34 (3.7%) |
| $100,000 and over | 2,911 (98.6%) | 41 (1.4%) |
Public vs Private Health Insurance Coverage by Age in Media borough
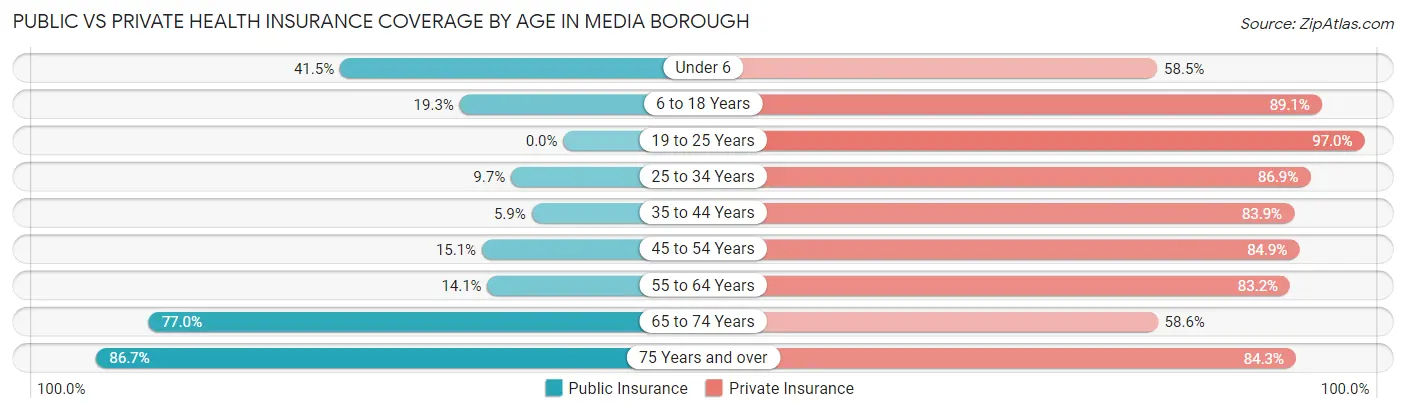
| Age Bracket | Public Insurance | Private Insurance |
| Under 6 | 68 (41.5%) | 96 (58.5%) |
| 6 to 18 Years | 118 (19.3%) | 546 (89.1%) |
| 19 to 25 Years | 0 (0.0%) | 355 (97.0%) |
| 25 to 34 Years | 116 (9.7%) | 1,037 (86.9%) |
| 35 to 44 Years | 47 (5.9%) | 668 (83.9%) |
| 45 to 54 Years | 110 (15.1%) | 618 (84.9%) |
| 55 to 64 Years | 103 (14.1%) | 608 (83.2%) |
| 65 to 74 Years | 571 (76.9%) | 435 (58.6%) |
| 75 Years and over | 325 (86.7%) | 316 (84.3%) |
| Total | 1,458 (25.5%) | 4,679 (82.0%) |
Disability Status by Sex by Age in Media borough
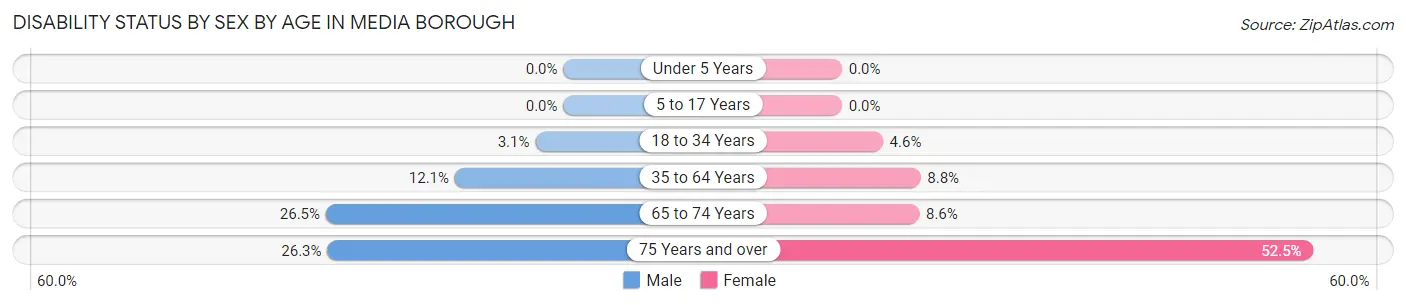
| Age Bracket | Male | Female |
| Under 5 Years | 0 (0.0%) | 0 (0.0%) |
| 5 to 17 Years | 0 (0.0%) | 0 (0.0%) |
| 18 to 34 Years | 24 (3.1%) | 37 (4.5%) |
| 35 to 64 Years | 133 (12.1%) | 101 (8.7%) |
| 65 to 74 Years | 64 (26.5%) | 43 (8.6%) |
| 75 Years and over | 36 (26.3%) | 125 (52.5%) |
Disability Class by Sex by Age in Media borough
Disability Class: Hearing Difficulty
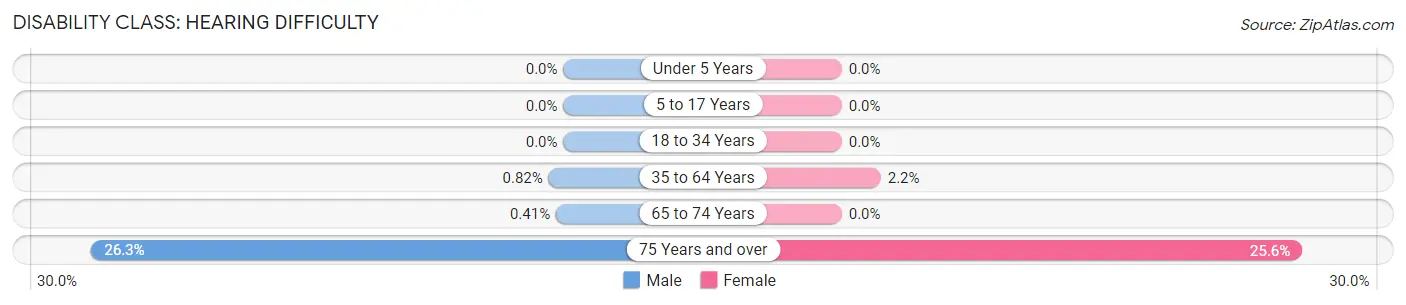
| Age Bracket | Male | Female |
| Under 5 Years | 0 (0.0%) | 0 (0.0%) |
| 5 to 17 Years | 0 (0.0%) | 0 (0.0%) |
| 18 to 34 Years | 0 (0.0%) | 0 (0.0%) |
| 35 to 64 Years | 9 (0.8%) | 25 (2.2%) |
| 65 to 74 Years | 1 (0.4%) | 0 (0.0%) |
| 75 Years and over | 36 (26.3%) | 61 (25.6%) |
Disability Class: Vision Difficulty
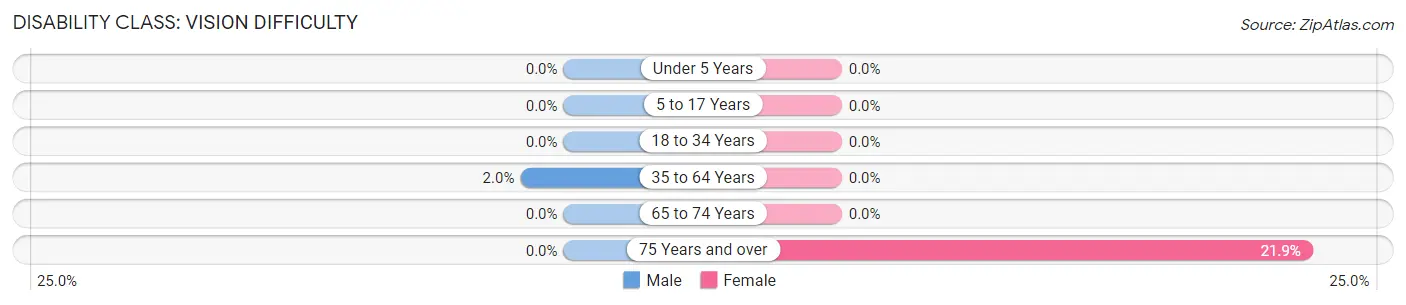
| Age Bracket | Male | Female |
| Under 5 Years | 0 (0.0%) | 0 (0.0%) |
| 5 to 17 Years | 0 (0.0%) | 0 (0.0%) |
| 18 to 34 Years | 0 (0.0%) | 0 (0.0%) |
| 35 to 64 Years | 22 (2.0%) | 0 (0.0%) |
| 65 to 74 Years | 0 (0.0%) | 0 (0.0%) |
| 75 Years and over | 0 (0.0%) | 52 (21.8%) |
Disability Class: Cognitive Difficulty
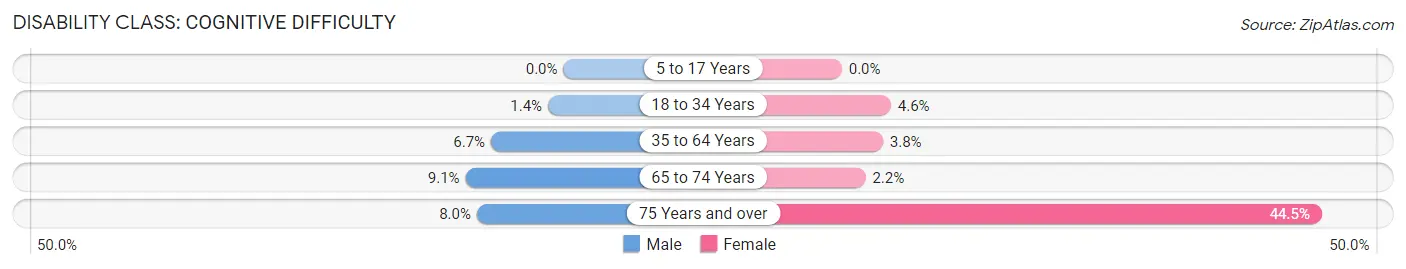
| Age Bracket | Male | Female |
| 5 to 17 Years | 0 (0.0%) | 0 (0.0%) |
| 18 to 34 Years | 11 (1.4%) | 37 (4.5%) |
| 35 to 64 Years | 74 (6.7%) | 44 (3.8%) |
| 65 to 74 Years | 22 (9.1%) | 11 (2.2%) |
| 75 Years and over | 11 (8.0%) | 106 (44.5%) |
Disability Class: Ambulatory Difficulty
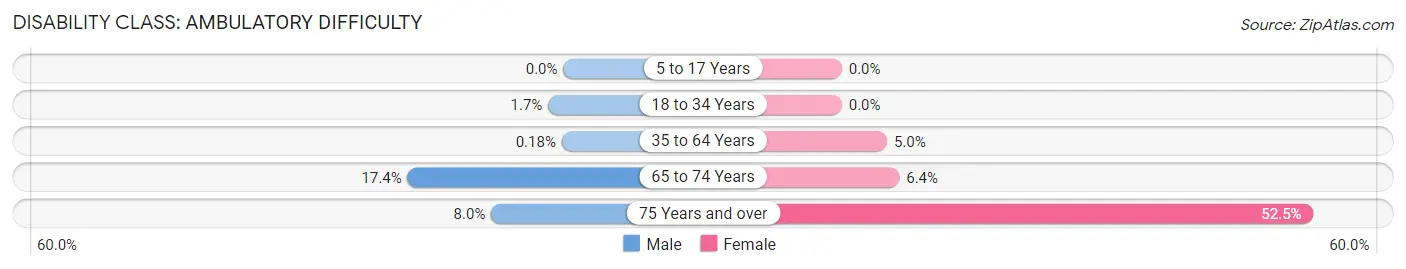
| Age Bracket | Male | Female |
| 5 to 17 Years | 0 (0.0%) | 0 (0.0%) |
| 18 to 34 Years | 13 (1.7%) | 0 (0.0%) |
| 35 to 64 Years | 2 (0.2%) | 58 (5.0%) |
| 65 to 74 Years | 42 (17.4%) | 32 (6.4%) |
| 75 Years and over | 11 (8.0%) | 125 (52.5%) |
Disability Class: Self-Care Difficulty
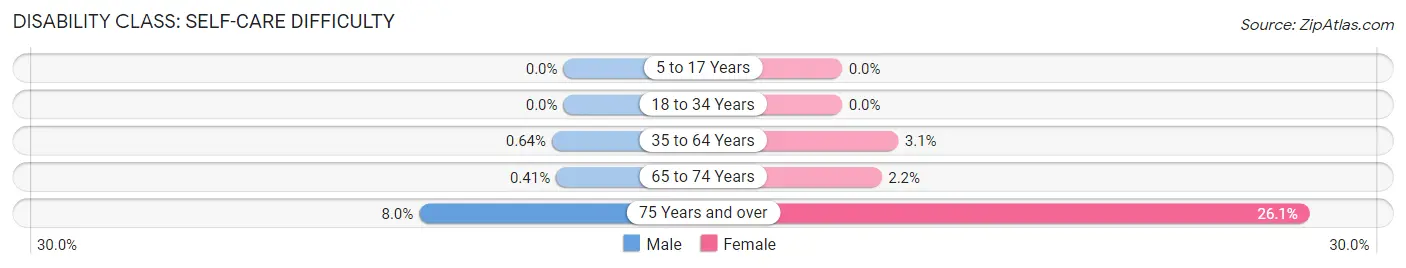
| Age Bracket | Male | Female |
| 5 to 17 Years | 0 (0.0%) | 0 (0.0%) |
| 18 to 34 Years | 0 (0.0%) | 0 (0.0%) |
| 35 to 64 Years | 7 (0.6%) | 36 (3.1%) |
| 65 to 74 Years | 1 (0.4%) | 11 (2.2%) |
| 75 Years and over | 11 (8.0%) | 62 (26.1%) |
Technology Access in Media borough
Computing Device Access in Media borough
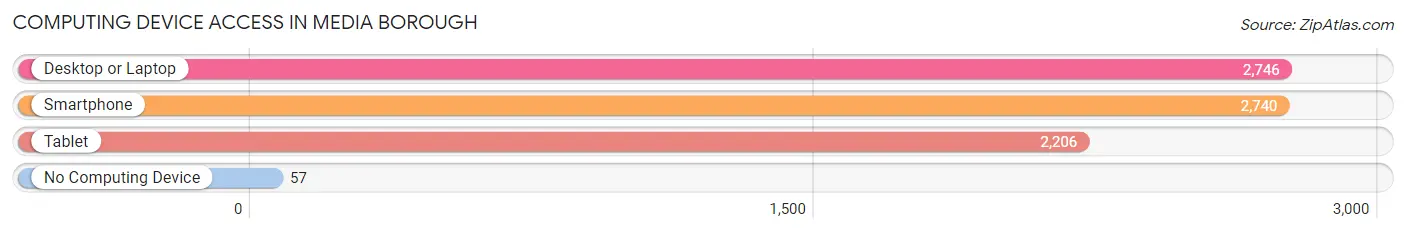
| Device Type | # Households | % Households |
| Desktop or Laptop | 2,746 | 93.4% |
| Smartphone | 2,740 | 93.2% |
| Tablet | 2,206 | 75.1% |
| No Computing Device | 57 | 1.9% |
| Total | 2,939 | 100.0% |
Internet Access in Media borough
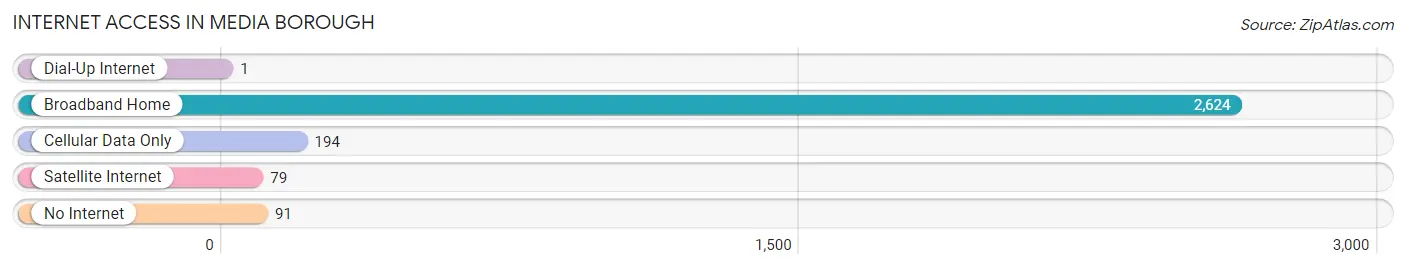
| Internet Type | # Households | % Households |
| Dial-Up Internet | 1 | 0.0% |
| Broadband Home | 2,624 | 89.3% |
| Cellular Data Only | 194 | 6.6% |
| Satellite Internet | 79 | 2.7% |
| No Internet | 91 | 3.1% |
| Total | 2,939 | 100.0% |
Media borough Summary
Borough of Media is a borough in Delaware County, Pennsylvania, United States. It is located 16 miles (26 km) west of Philadelphia and is part of the Philadelphia metropolitan area. As of the 2010 census, the borough had a population of 5,327.
History
The area now known as Media was originally inhabited by the Lenni Lenape Native Americans. The first European settlers arrived in the area in 1683, when William Penn purchased the land from the Lenni Lenape. The area was originally part of Chester County, but was transferred to Delaware County in 1789.
The town of Media was founded in 1850 by the Philadelphia and West Chester Railroad. The town was named after the nearby creek, which was named after the medium-sized trees that grew along its banks. The town quickly grew and by 1854, it had become the county seat of Delaware County.
In 1866, the borough of Media was incorporated. The borough was named after the creek and the town. The borough quickly grew and by the early 20th century, it had become a popular summer resort destination.
Geography
Media is located at 39°54′N 75°23′W (39.9000, -75.3833). According to the United States Census Bureau, the borough has a total area of 1.2 square miles (3.1 km2), all of it land.
Economy
Media is home to a variety of businesses, including retail stores, restaurants, and professional services. The borough is also home to several corporate headquarters, including the corporate headquarters of the Philadelphia Media Network, which owns the Philadelphia Inquirer, the Philadelphia Daily News, and Philly.com.
Demographics
As of the 2010 census, there were 5,327 people, 2,093 households, and 1,323 families residing in the borough. The population density was 4,521.3 people per square mile (1,749.2/km2). There were 2,309 housing units at an average density of 1,919.2 per square mile (739.7/km2). The racial makeup of the borough was 87.2% White, 5.3% African American, 0.2% Native American, 4.2% Asian, 0.1% Pacific Islander, 1.2% from other races, and 2.0% from two or more races. Hispanic or Latino of any race were 3.7% of the population.
There were 2,093 households, out of which 28.2% had children under the age of 18 living with them, 46.2% were married couples living together, 11.7% had a female householder with no husband present, and 37.7% were non-families. 32.2% of all households were made up of individuals, and 11.3% had someone living alone who was 65 years of age or older. The average household size was 2.38 and the average family size was 3.04.
In the borough, the population was spread out, with 22.2% under the age of 18, 8.2% from 18 to 24, 28.2% from 25 to 44, 25.2% from 45 to 64, and 16.2% who were 65 years of age or older. The median age was 39 years. For every 100 females, there were 91.2 males. For every 100 females age 18 and over, there were 87.7 males.
The median income for a household in the borough was $50,902, and the median income for a family was $62,857. Males had a median income of $45,945 versus $35,938 for females. The per capita income for the borough was $27,945. About 4.2% of families and 6.2% of the population were below the poverty line, including 8.2% of those under age 18 and 5.2% of those age 65 or over.
Common Questions
What is the Total Population of Media borough?
Total Population of Media borough is 5,860.
What is the Total Male Population of Media borough?
Total Male Population of Media borough is 2,705.
What is the Total Female Population of Media borough?
Total Female Population of Media borough is 3,155.
What is the Ratio of Males per 100 Females in Media borough?
There are 85.74 Males per 100 Females in Media borough.
What is the Ratio of Females per 100 Males in Media borough?
There are 116.64 Females per 100 Males in Media borough.
What is the Median Population Age in Media borough?
Median Population Age in Media borough is 43.2 Years.
What is the Average Family Size in Media borough
Average Family Size in Media borough is 2.8 People.
What is the Average Household Size in Media borough
Average Household Size in Media borough is 1.9 People.
What is Per Capita Income in Media borough?
Per Capita income in Media borough is $60,872.
What is the Median Family Income in Media borough?
Median Family Income in Media borough is $120,489.
What is the Median Household income in Media borough?
Median Household Income in Media borough is $85,951.
What is Income or Wage Gap in Media borough?
Income or Wage Gap in Media borough is 30.7%.
Women in Media borough earn 69.3 cents for every dollar earned by a man.
What is Inequality or Gini Index in Media borough?
Inequality or Gini Index in Media borough is 0.45.
How Large is the Labor Force in Media borough?
There are 3,929 People in the Labor Forcein in Media borough.
What is the Percentage of People in the Labor Force in Media borough?
75.2% of People are in the Labor Force in Media borough.
What is the Unemployment Rate in Media borough?
Unemployment Rate in Media borough is 6.1%.