Wyncote, PA
Wyncote Map
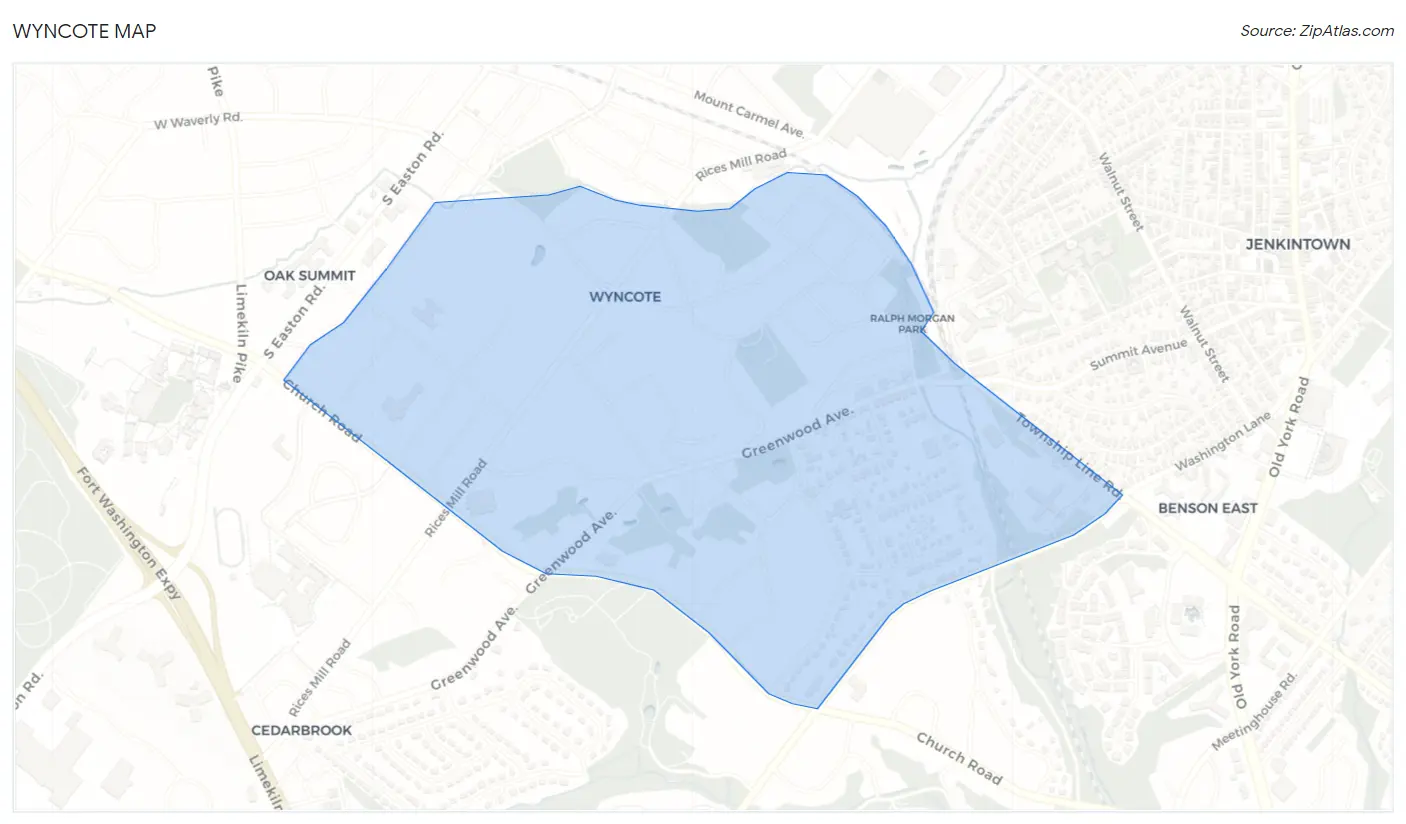
Wyncote Overview
3,420
TOTAL POPULATION
1,834
MALE POPULATION
1,586
FEMALE POPULATION
115.64
MALES / 100 FEMALES
86.48
FEMALES / 100 MALES
45.1
MEDIAN AGE
3.2
AVG FAMILY SIZE
2.5
AVG HOUSEHOLD SIZE
$54,271
PER CAPITA INCOME
$148,933
AVG FAMILY INCOME
$130,833
AVG HOUSEHOLD INCOME
7.2%
WAGE / INCOME GAP [ % ]
92.8¢/ $1
WAGE / INCOME GAP [ $ ]
0.45
INEQUALITY / GINI INDEX
1,582
LABOR FORCE [ PEOPLE ]
55.3%
PERCENT IN LABOR FORCE
1.0%
UNEMPLOYMENT RATE
Wyncote Zip Codes
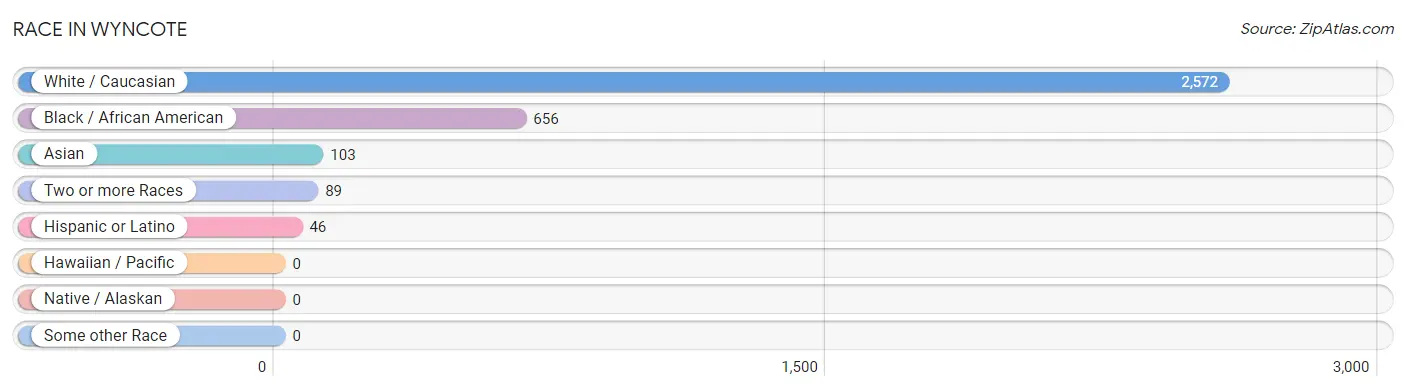
Race in Wyncote
The most populous races in Wyncote are White / Caucasian (2,572 | 75.2%), Black / African American (656 | 19.2%), and Asian (103 | 3.0%).
| Race | # Population | % Population |
| Asian | 103 | 3.0% |
| Black / African American | 656 | 19.2% |
| Hawaiian / Pacific | 0 | 0.0% |
| Hispanic or Latino | 46 | 1.3% |
| Native / Alaskan | 0 | 0.0% |
| White / Caucasian | 2,572 | 75.2% |
| Two or more Races | 89 | 2.6% |
| Some other Race | 0 | 0.0% |
| Total | 3,420 | 100.0% |
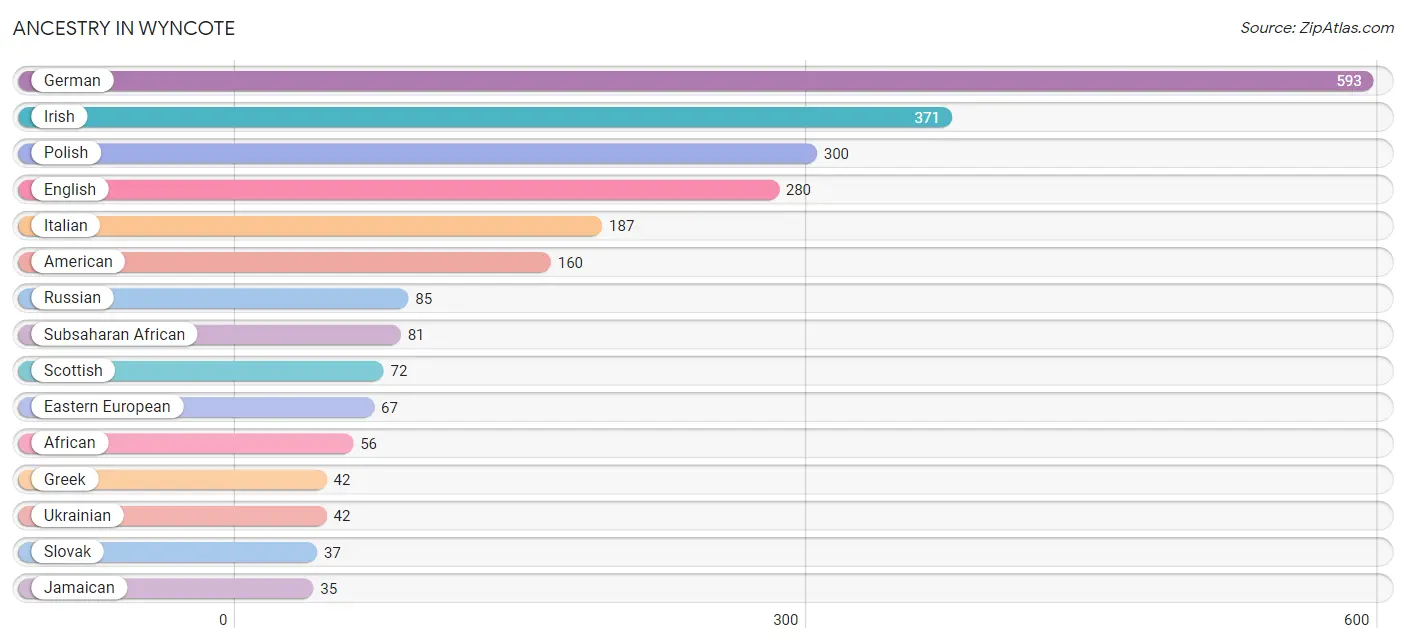
Ancestry in Wyncote
The most populous ancestries reported in Wyncote are German (593 | 17.3%), Irish (371 | 10.8%), Polish (300 | 8.8%), English (280 | 8.2%), and Italian (187 | 5.5%), together accounting for 50.6% of all Wyncote residents.
| Ancestry | # Population | % Population |
| African | 56 | 1.6% |
| American | 160 | 4.7% |
| Arab | 16 | 0.5% |
| Austrian | 1 | 0.0% |
| Belgian | 9 | 0.3% |
| Blackfeet | 10 | 0.3% |
| British | 18 | 0.5% |
| Central American | 23 | 0.7% |
| Costa Rican | 23 | 0.7% |
| Croatian | 8 | 0.2% |
| Cuban | 8 | 0.2% |
| Czech | 7 | 0.2% |
| Czechoslovakian | 7 | 0.2% |
| Danish | 17 | 0.5% |
| Dutch | 6 | 0.2% |
| Eastern European | 67 | 2.0% |
| English | 280 | 8.2% |
| French | 5 | 0.2% |
| French Canadian | 10 | 0.3% |
| German | 593 | 17.3% |
| Greek | 42 | 1.2% |
| Hungarian | 18 | 0.5% |
| Indian (Asian) | 23 | 0.7% |
| Irish | 371 | 10.8% |
| Italian | 187 | 5.5% |
| Jamaican | 35 | 1.0% |
| Lebanese | 11 | 0.3% |
| Lithuanian | 25 | 0.7% |
| Moroccan | 5 | 0.2% |
| Northern European | 33 | 1.0% |
| Norwegian | 15 | 0.4% |
| Pennsylvania German | 2 | 0.1% |
| Polish | 300 | 8.8% |
| Russian | 85 | 2.5% |
| Scotch-Irish | 14 | 0.4% |
| Scottish | 72 | 2.1% |
| Slovak | 37 | 1.1% |
| Slovene | 15 | 0.4% |
| Spaniard | 1 | 0.0% |
| Sri Lankan | 1 | 0.0% |
| Subsaharan African | 81 | 2.4% |
| Swedish | 7 | 0.2% |
| Thai | 8 | 0.2% |
| Ukrainian | 42 | 1.2% |
| Welsh | 27 | 0.8% | View All 45 Rows |
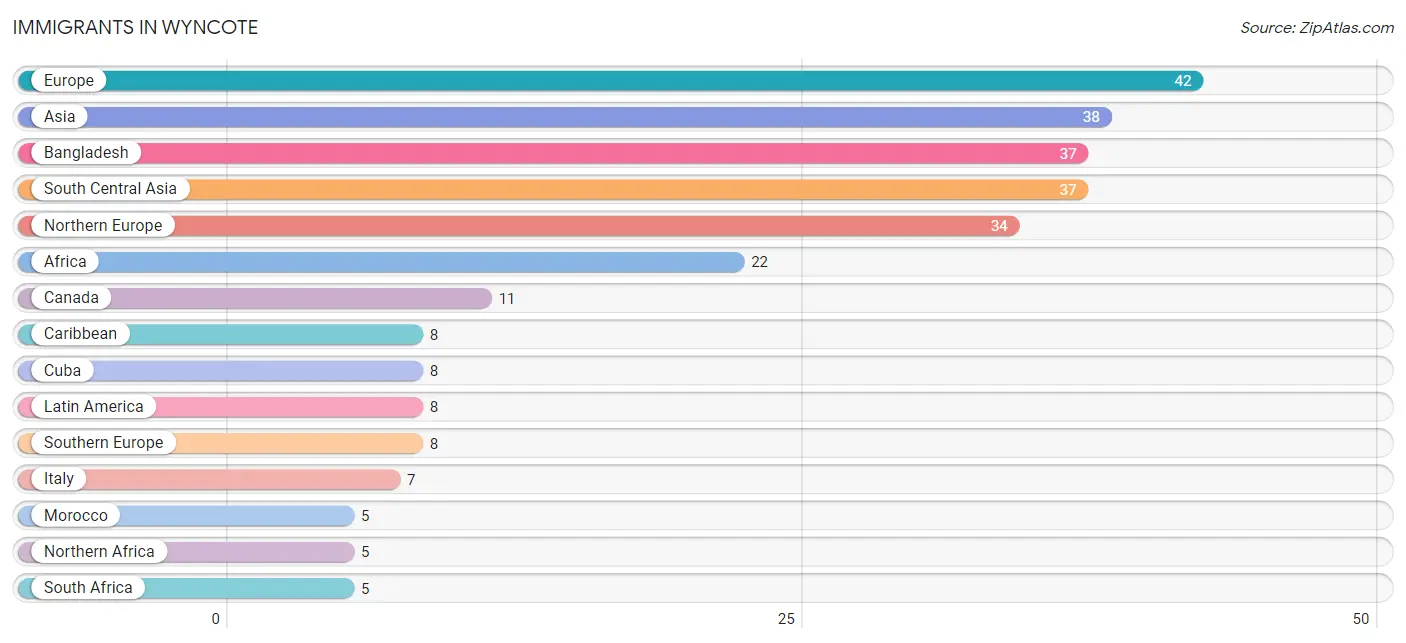
Immigrants in Wyncote
The most numerous immigrant groups reported in Wyncote came from Europe (42 | 1.2%), Asia (38 | 1.1%), Bangladesh (37 | 1.1%), South Central Asia (37 | 1.1%), and Northern Europe (34 | 1.0%), together accounting for 5.5% of all Wyncote residents.
| Immigration Origin | # Population | % Population |
| Africa | 22 | 0.6% |
| Asia | 38 | 1.1% |
| Bangladesh | 37 | 1.1% |
| Canada | 11 | 0.3% |
| Caribbean | 8 | 0.2% |
| Cuba | 8 | 0.2% |
| Europe | 42 | 1.2% |
| Italy | 7 | 0.2% |
| Latin America | 8 | 0.2% |
| Morocco | 5 | 0.2% |
| Northern Africa | 5 | 0.2% |
| Northern Europe | 34 | 1.0% |
| South Africa | 5 | 0.2% |
| South Central Asia | 37 | 1.1% |
| South Eastern Asia | 1 | 0.0% |
| Southern Europe | 8 | 0.2% |
| Spain | 1 | 0.0% |
| Vietnam | 1 | 0.0% | View All 18 Rows |
Sex and Age in Wyncote
Sex and Age in Wyncote
The most populous age groups in Wyncote are 20 to 24 Years (261 | 14.2%) for men and 50 to 54 Years (159 | 10.0%) for women.
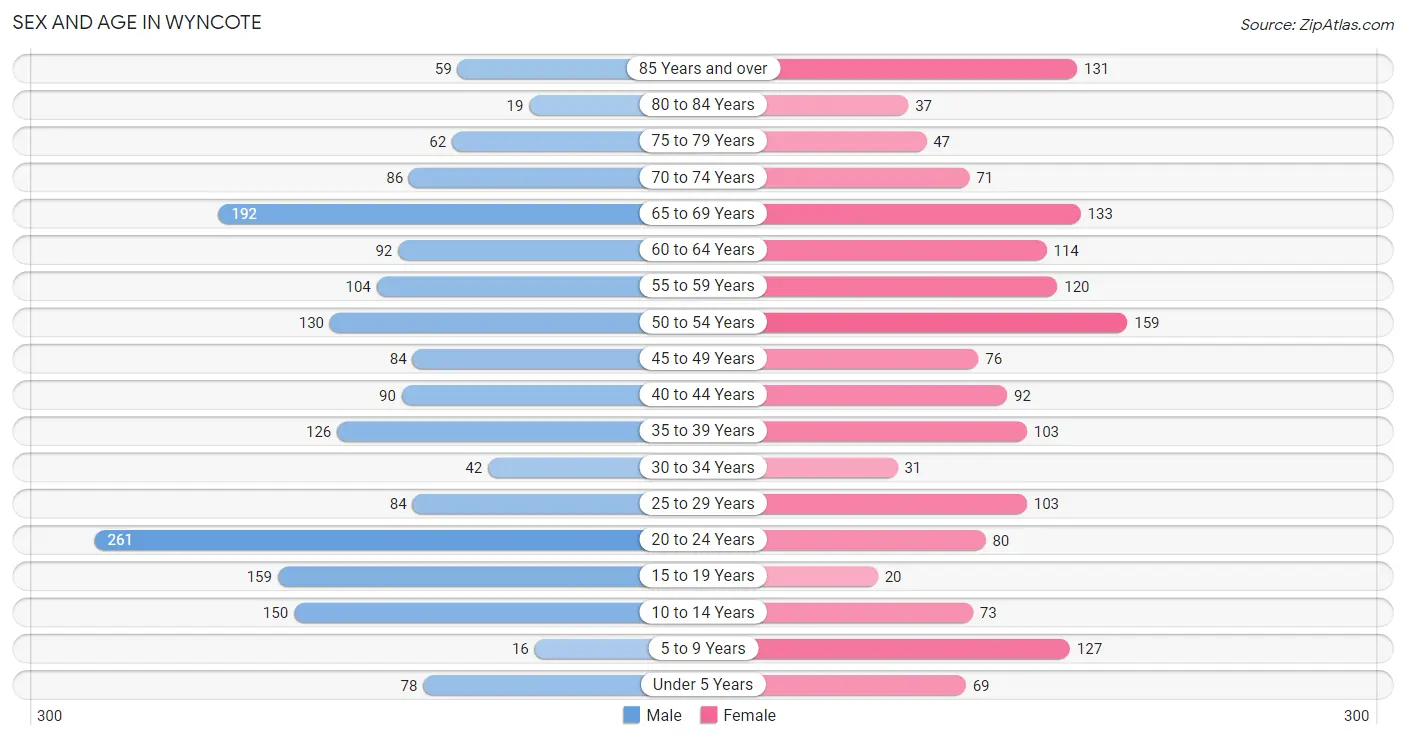
| Age Bracket | Male | Female |
| Under 5 Years | 78 (4.3%) | 69 (4.3%) |
| 5 to 9 Years | 16 (0.9%) | 127 (8.0%) |
| 10 to 14 Years | 150 (8.2%) | 73 (4.6%) |
| 15 to 19 Years | 159 (8.7%) | 20 (1.3%) |
| 20 to 24 Years | 261 (14.2%) | 80 (5.0%) |
| 25 to 29 Years | 84 (4.6%) | 103 (6.5%) |
| 30 to 34 Years | 42 (2.3%) | 31 (1.9%) |
| 35 to 39 Years | 126 (6.9%) | 103 (6.5%) |
| 40 to 44 Years | 90 (4.9%) | 92 (5.8%) |
| 45 to 49 Years | 84 (4.6%) | 76 (4.8%) |
| 50 to 54 Years | 130 (7.1%) | 159 (10.0%) |
| 55 to 59 Years | 104 (5.7%) | 120 (7.6%) |
| 60 to 64 Years | 92 (5.0%) | 114 (7.2%) |
| 65 to 69 Years | 192 (10.5%) | 133 (8.4%) |
| 70 to 74 Years | 86 (4.7%) | 71 (4.5%) |
| 75 to 79 Years | 62 (3.4%) | 47 (3.0%) |
| 80 to 84 Years | 19 (1.0%) | 37 (2.3%) |
| 85 Years and over | 59 (3.2%) | 131 (8.3%) |
| Total | 1,834 (100.0%) | 1,586 (100.0%) |
Families and Households in Wyncote
Median Family Size in Wyncote
The median family size in Wyncote is 3.21 persons per family, with married-couple families (656 | 81.5%) accounting for the largest median family size of 3.41 persons per family. On the other hand, single male/father families (69 | 8.6%) represent the smallest median family size with 1.74 persons per family.
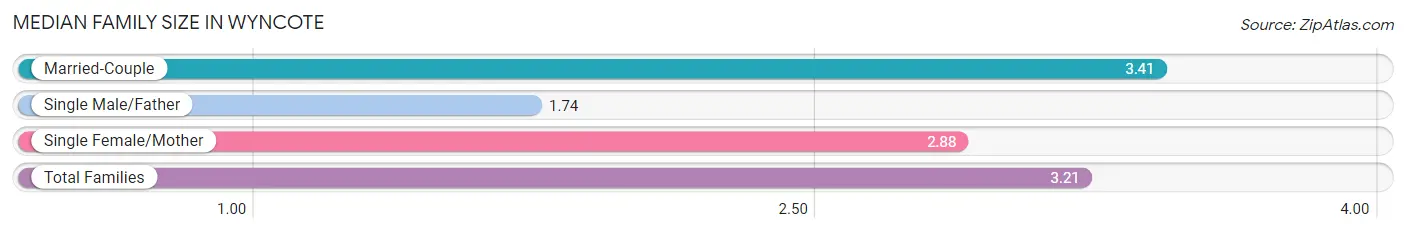
| Family Type | # Families | Family Size |
| Married-Couple | 656 (81.5%) | 3.41 |
| Single Male/Father | 69 (8.6%) | 1.74 |
| Single Female/Mother | 80 (9.9%) | 2.88 |
| Total Families | 805 (100.0%) | 3.21 |
Median Household Size in Wyncote
The median household size in Wyncote is 2.54 persons per household, with married-couple households (656 | 54.9%) accounting for the largest median household size of 3.41 persons per household. non-family households (389 | 32.6%) represent the smallest median household size with 1.14 persons per household.
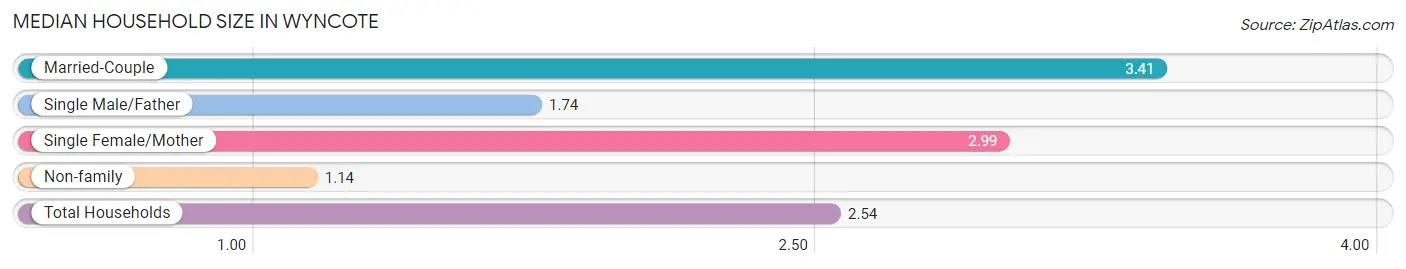
| Household Type | # Households | Household Size |
| Married-Couple | 656 (54.9%) | 3.41 |
| Single Male/Father | 69 (5.8%) | 1.74 |
| Single Female/Mother | 80 (6.7%) | 2.99 |
| Non-family | 389 (32.6%) | 1.14 |
| Total Households | 1,194 (100.0%) | 2.54 |
Household Size by Marriage Status in Wyncote
Out of a total of 1,194 households in Wyncote, 805 (67.4%) are family households, while 389 (32.6%) are nonfamily households. The most numerous type of family households are 2-person households, comprising 336, and the most common type of nonfamily households are 1-person households, comprising 343.
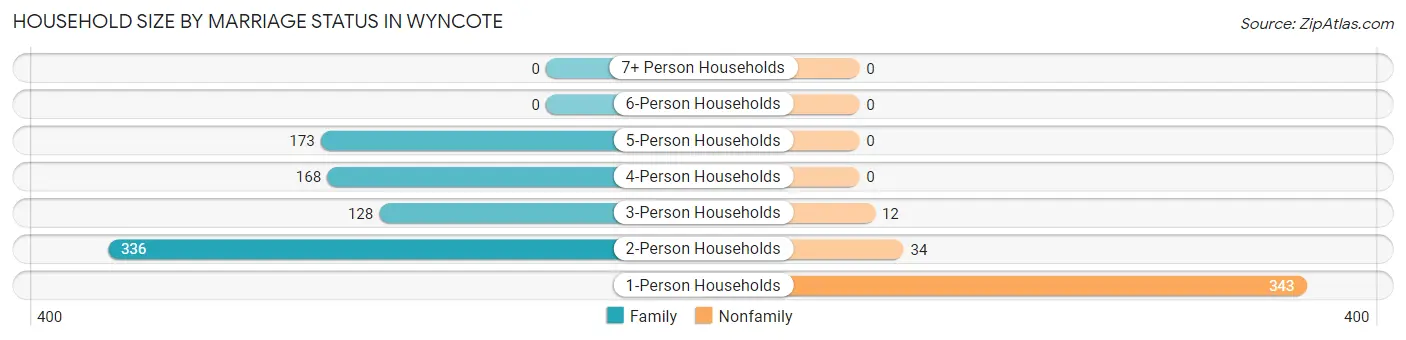
| Household Size | Family Households | Nonfamily Households |
| 1-Person Households | - | 343 (28.7%) |
| 2-Person Households | 336 (28.1%) | 34 (2.9%) |
| 3-Person Households | 128 (10.7%) | 12 (1.0%) |
| 4-Person Households | 168 (14.1%) | 0 (0.0%) |
| 5-Person Households | 173 (14.5%) | 0 (0.0%) |
| 6-Person Households | 0 (0.0%) | 0 (0.0%) |
| 7+ Person Households | 0 (0.0%) | 0 (0.0%) |
| Total | 805 (67.4%) | 389 (32.6%) |
Female Fertility in Wyncote
Fertility by Age in Wyncote
Average fertility rate in Wyncote is 21.0 births per 1,000 women. Women in the age bracket of 20 to 34 years have the highest fertility rate with 61.0 births per 1,000 women. Women in the age bracket of 20 to 34 years acount for 100.0% of all women with births.
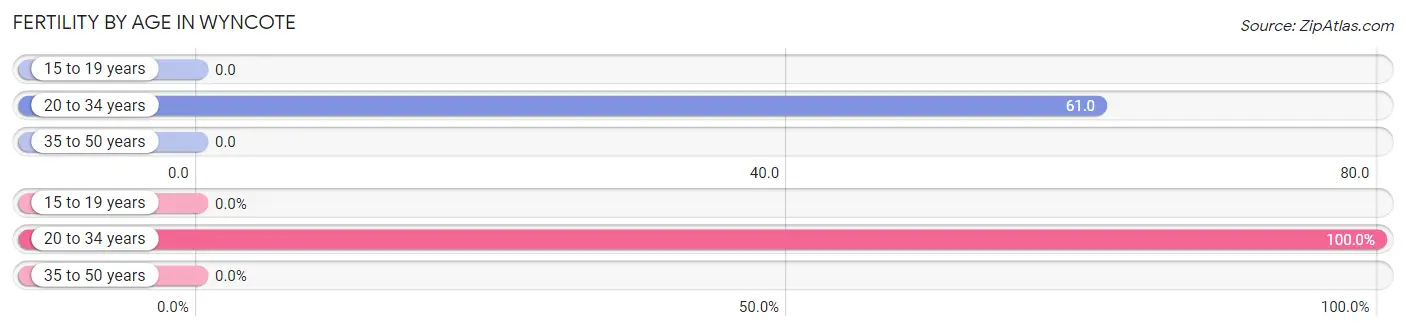
| Age Bracket | Women with Births | Births / 1,000 Women |
| 15 to 19 years | 0 (0.0%) | 0.0 |
| 20 to 34 years | 13 (100.0%) | 61.0 |
| 35 to 50 years | 0 (0.0%) | 0.0 |
| Total | 13 (100.0%) | 21.0 |
Fertility by Age by Marriage Status in Wyncote
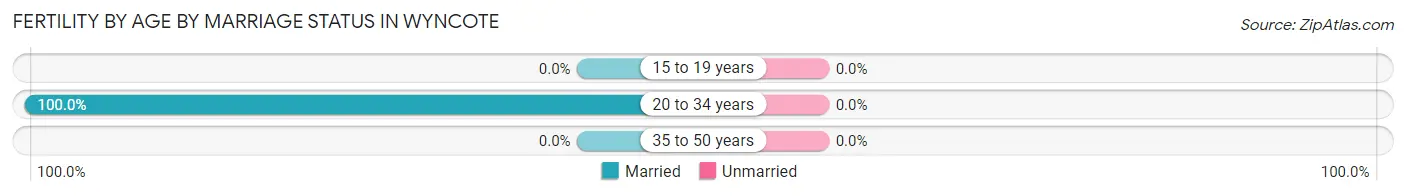
| Age Bracket | Married | Unmarried |
| 15 to 19 years | 0 (0.0%) | 0 (0.0%) |
| 20 to 34 years | 13 (100.0%) | 0 (0.0%) |
| 35 to 50 years | 0 (0.0%) | 0 (0.0%) |
| Total | 13 (100.0%) | 0 (0.0%) |
Fertility by Education in Wyncote
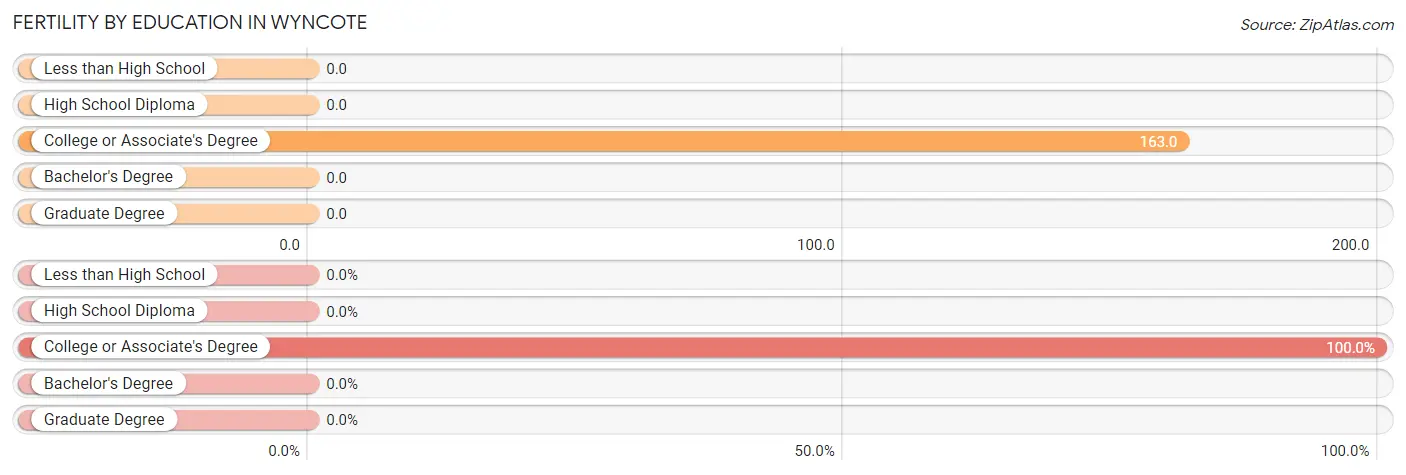
| Educational Attainment | Women with Births | Births / 1,000 Women |
| Less than High School | 0 (0.0%) | 0.0 |
| High School Diploma | 0 (0.0%) | 0.0 |
| College or Associate's Degree | 13 (100.0%) | 163.0 |
| Bachelor's Degree | 0 (0.0%) | 0.0 |
| Graduate Degree | 0 (0.0%) | 0.0 |
| Total | 13 (100.0%) | 21.0 |
Fertility by Education by Marriage Status in Wyncote
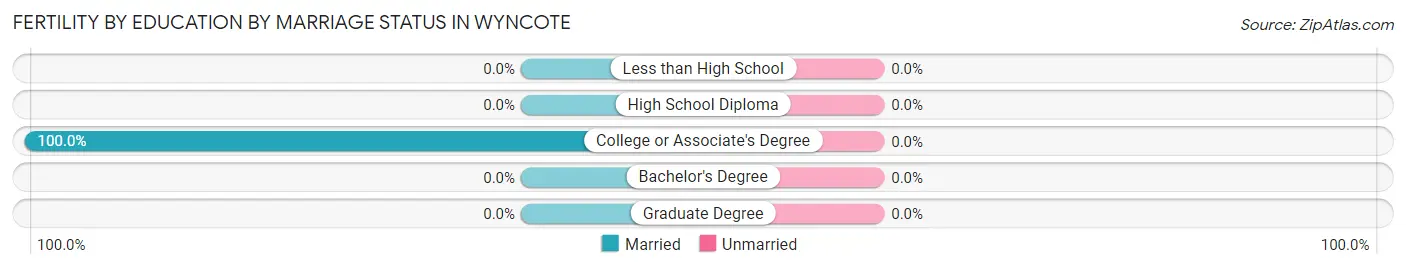
| Educational Attainment | Married | Unmarried |
| Less than High School | 0 (0.0%) | 0 (0.0%) |
| High School Diploma | 0 (0.0%) | 0 (0.0%) |
| College or Associate's Degree | 13 (100.0%) | 0 (0.0%) |
| Bachelor's Degree | 0 (0.0%) | 0 (0.0%) |
| Graduate Degree | 0 (0.0%) | 0 (0.0%) |
| Total | 13 (100.0%) | 0 (0.0%) |
Income in Wyncote
Income Overview in Wyncote
Per Capita Income in Wyncote is $54,271, while median incomes of families and households are $148,933 and $130,833 respectively.
| Characteristic | Number | Measure |
| Per Capita Income | 3,420 | $54,271 |
| Median Family Income | 805 | $148,933 |
| Mean Family Income | 805 | $194,323 |
| Median Household Income | 1,194 | $130,833 |
| Mean Household Income | 1,194 | $149,637 |
| Income Deficit | 805 | $0 |
| Wage / Income Gap (%) | 3,420 | 7.20% |
| Wage / Income Gap ($) | 3,420 | 92.80¢ per $1 |
| Gini / Inequality Index | 3,420 | 0.45 |
Earnings by Sex in Wyncote
Average Earnings in Wyncote are $69,896, $68,152 for men and $73,438 for women, a difference of 7.2%.
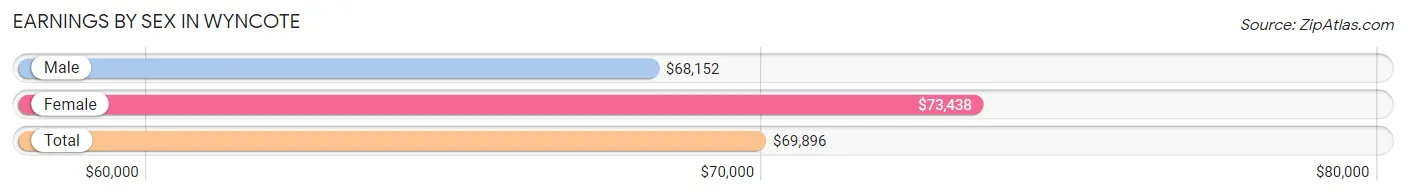
| Sex | Number | Average Earnings |
| Male | 980 (54.7%) | $68,152 |
| Female | 811 (45.3%) | $73,438 |
| Total | 1,791 (100.0%) | $69,896 |
Earnings by Sex by Income Bracket in Wyncote
The most common earnings brackets in Wyncote are $100,000+ for men (311 | 31.7%) and $100,000+ for women (240 | 29.6%).
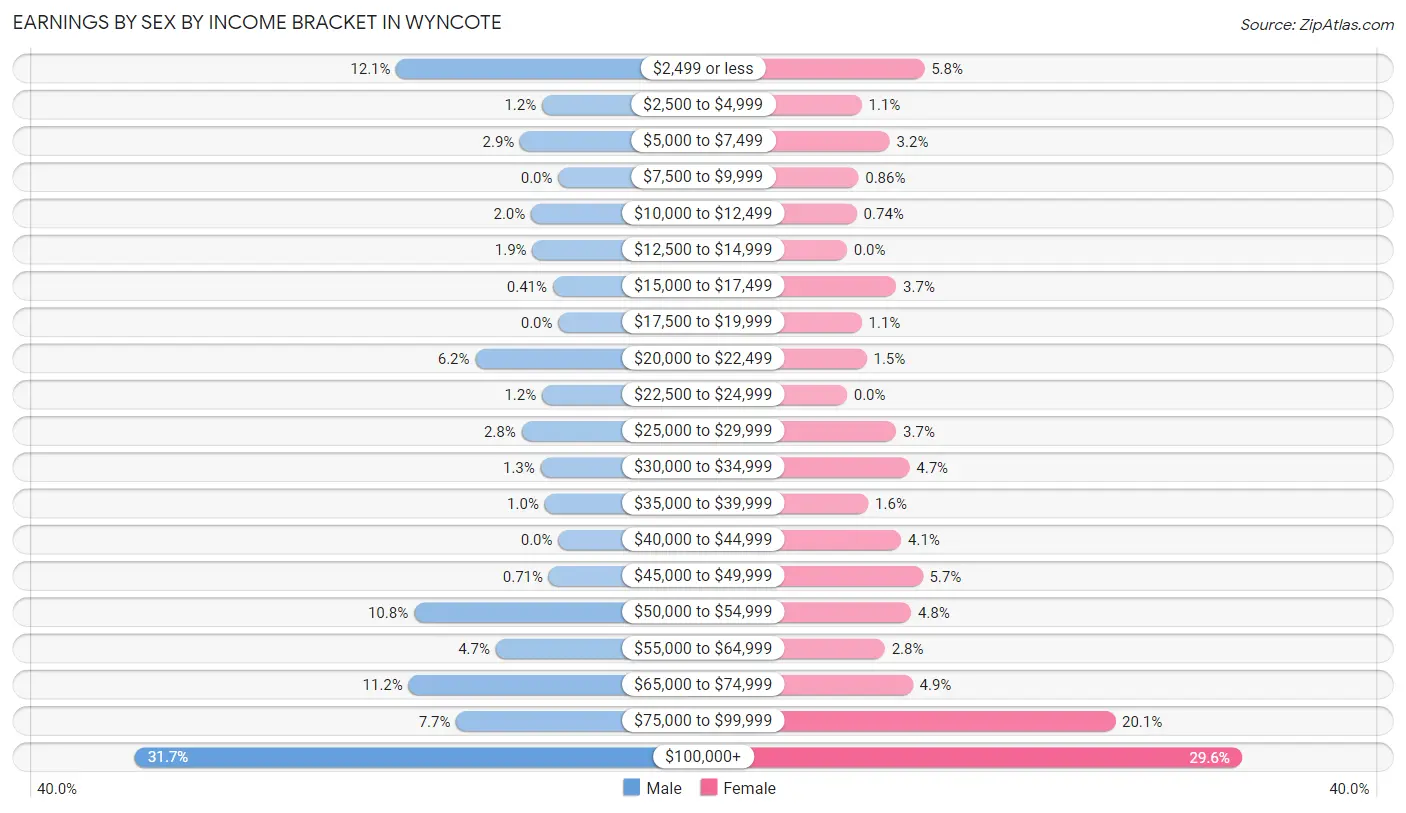
| Income | Male | Female |
| $2,499 or less | 119 (12.1%) | 47 (5.8%) |
| $2,500 to $4,999 | 12 (1.2%) | 9 (1.1%) |
| $5,000 to $7,499 | 28 (2.9%) | 26 (3.2%) |
| $7,500 to $9,999 | 0 (0.0%) | 7 (0.9%) |
| $10,000 to $12,499 | 20 (2.0%) | 6 (0.7%) |
| $12,500 to $14,999 | 19 (1.9%) | 0 (0.0%) |
| $15,000 to $17,499 | 4 (0.4%) | 30 (3.7%) |
| $17,500 to $19,999 | 0 (0.0%) | 9 (1.1%) |
| $20,000 to $22,499 | 61 (6.2%) | 12 (1.5%) |
| $22,500 to $24,999 | 12 (1.2%) | 0 (0.0%) |
| $25,000 to $29,999 | 27 (2.8%) | 30 (3.7%) |
| $30,000 to $34,999 | 13 (1.3%) | 38 (4.7%) |
| $35,000 to $39,999 | 10 (1.0%) | 13 (1.6%) |
| $40,000 to $44,999 | 0 (0.0%) | 33 (4.1%) |
| $45,000 to $49,999 | 7 (0.7%) | 46 (5.7%) |
| $50,000 to $54,999 | 106 (10.8%) | 39 (4.8%) |
| $55,000 to $64,999 | 46 (4.7%) | 23 (2.8%) |
| $65,000 to $74,999 | 110 (11.2%) | 40 (4.9%) |
| $75,000 to $99,999 | 75 (7.6%) | 163 (20.1%) |
| $100,000+ | 311 (31.7%) | 240 (29.6%) |
| Total | 980 (100.0%) | 811 (100.0%) |
Earnings by Sex by Educational Attainment in Wyncote
Average earnings in Wyncote are $75,560 for men and $81,705 for women, a difference of 7.5%. Men with an educational attainment of graduate degree enjoy the highest average annual earnings of $88,750, while those with college or associate's degree education earn the least with $53,523. Women with an educational attainment of graduate degree earn the most with the average annual earnings of $103,000, while those with high school diploma education have the smallest earnings of $2,499.
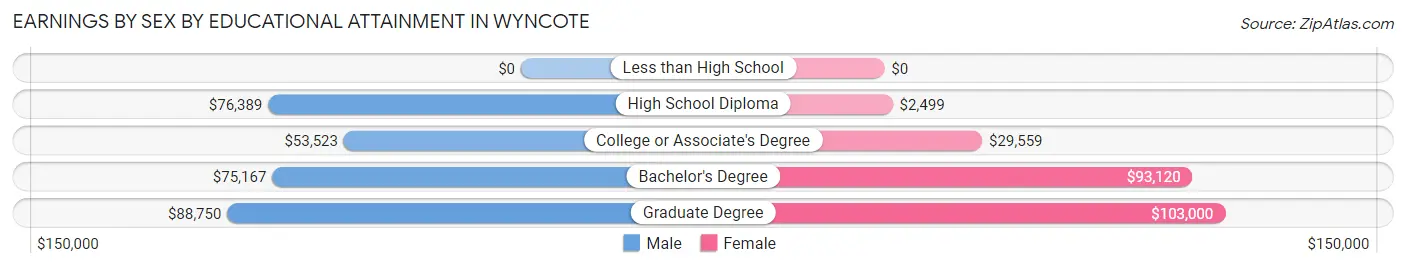
| Educational Attainment | Male Income | Female Income |
| Less than High School | - | - |
| High School Diploma | $76,389 | $2,499 |
| College or Associate's Degree | $53,523 | $29,559 |
| Bachelor's Degree | $75,167 | $93,120 |
| Graduate Degree | $88,750 | $103,000 |
| Total | $75,560 | $81,705 |
Family Income in Wyncote
Family Income Brackets in Wyncote
According to the Wyncote family income data, there are 293 families falling into the $100,000 to $149,999 income range, which is the most common income bracket and makes up 36.4% of all families.
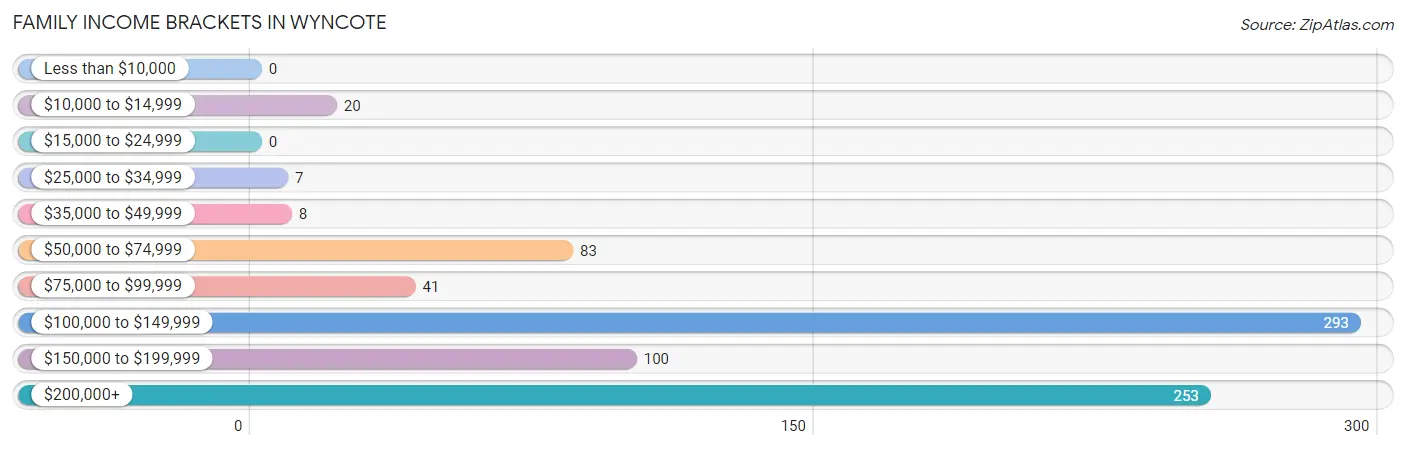
| Income Bracket | # Families | % Families |
| Less than $10,000 | 0 | 0.0% |
| $10,000 to $14,999 | 20 | 2.5% |
| $15,000 to $24,999 | 0 | 0.0% |
| $25,000 to $34,999 | 7 | 0.9% |
| $35,000 to $49,999 | 8 | 1.0% |
| $50,000 to $74,999 | 83 | 10.3% |
| $75,000 to $99,999 | 41 | 5.1% |
| $100,000 to $149,999 | 293 | 36.4% |
| $150,000 to $199,999 | 100 | 12.4% |
| $200,000+ | 253 | 31.4% |
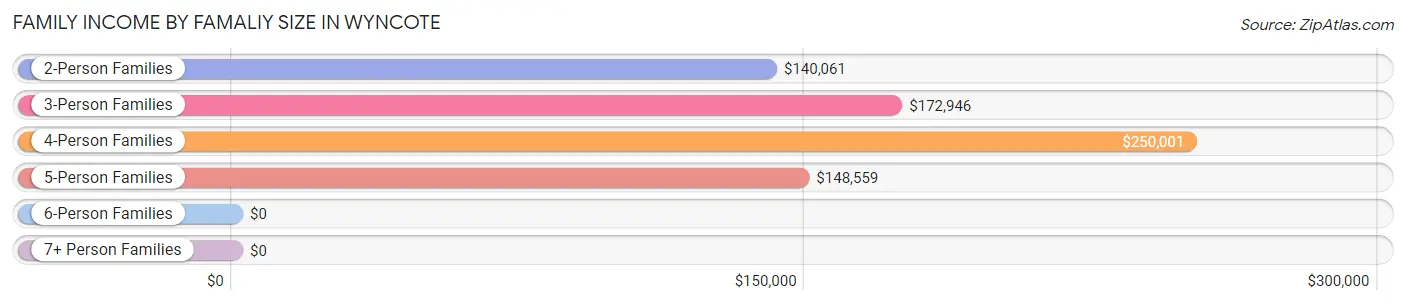
Family Income by Famaliy Size in Wyncote
4-person families (153 | 19.0%) account for the highest median family income in Wyncote with $250,001 per family, while 2-person families (336 | 41.7%) have the highest median income of $70,030 per family member.
| Income Bracket | # Families | Median Income |
| 2-Person Families | 336 (41.7%) | $140,061 |
| 3-Person Families | 143 (17.8%) | $172,946 |
| 4-Person Families | 153 (19.0%) | $250,001 |
| 5-Person Families | 173 (21.5%) | $148,559 |
| 6-Person Families | 0 (0.0%) | $0 |
| 7+ Person Families | 0 (0.0%) | $0 |
| Total | 805 (100.0%) | $148,933 |
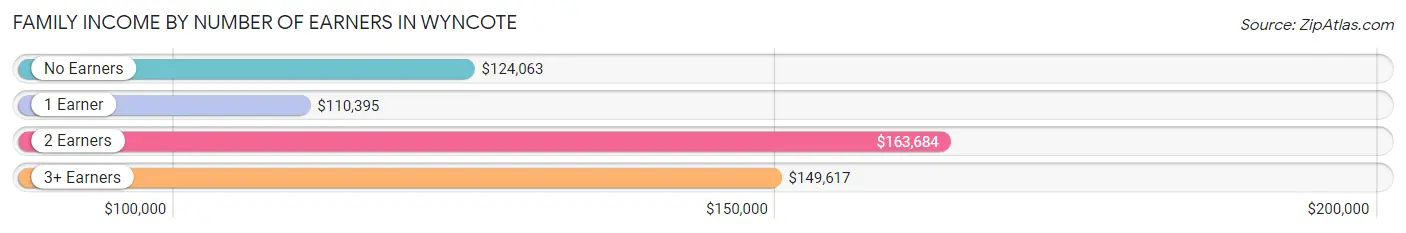
Family Income by Number of Earners in Wyncote
The median family income in Wyncote is $148,933, with families comprising 2 earners (344) having the highest median family income of $163,684, while families with 1 earner (234) have the lowest median family income of $110,395, accounting for 42.7% and 29.1% of families, respectively.
| Number of Earners | # Families | Median Income |
| No Earners | 39 (4.8%) | $124,063 |
| 1 Earner | 234 (29.1%) | $110,395 |
| 2 Earners | 344 (42.7%) | $163,684 |
| 3+ Earners | 188 (23.4%) | $149,617 |
| Total | 805 (100.0%) | $148,933 |
Household Income in Wyncote
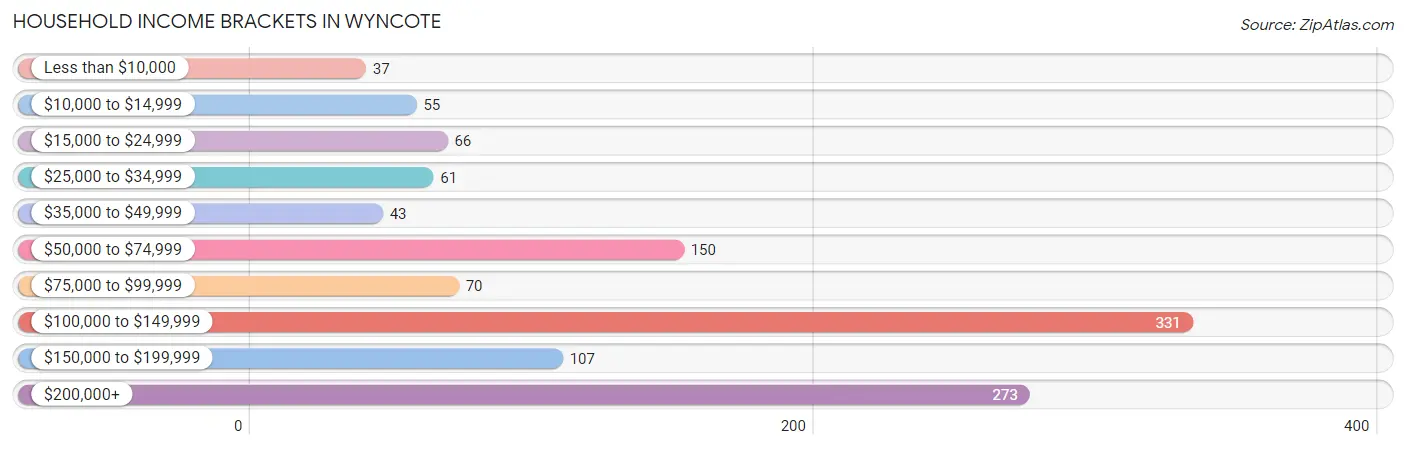
Household Income Brackets in Wyncote
With 331 households falling in the category, the $100,000 to $149,999 income range is the most frequent in Wyncote, accounting for 27.7% of all households. In contrast, only 37 households (3.1%) fall into the less than $10,000 income bracket, making it the least populous group.
| Income Bracket | # Households | % Households |
| Less than $10,000 | 37 | 3.1% |
| $10,000 to $14,999 | 55 | 4.6% |
| $15,000 to $24,999 | 66 | 5.5% |
| $25,000 to $34,999 | 61 | 5.1% |
| $35,000 to $49,999 | 43 | 3.6% |
| $50,000 to $74,999 | 150 | 12.6% |
| $75,000 to $99,999 | 70 | 5.9% |
| $100,000 to $149,999 | 331 | 27.7% |
| $150,000 to $199,999 | 107 | 9.0% |
| $200,000+ | 273 | 22.9% |
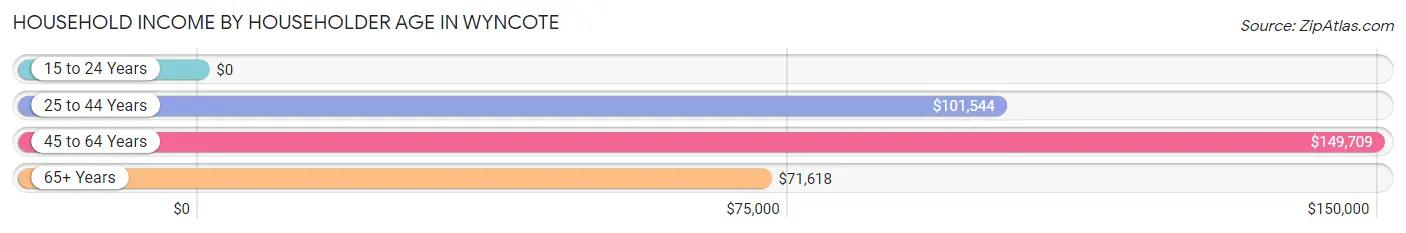
Household Income by Householder Age in Wyncote
The median household income in Wyncote is $130,833, with the highest median household income of $149,709 found in the 45 to 64 years age bracket for the primary householder. A total of 407 households (34.1%) fall into this category. Meanwhile, the 15 to 24 years age bracket for the primary householder has the lowest median household income of $0, with 58 households (4.9%) in this group.
| Income Bracket | # Households | Median Income |
| 15 to 24 Years | 58 (4.9%) | $0 |
| 25 to 44 Years | 375 (31.4%) | $101,544 |
| 45 to 64 Years | 407 (34.1%) | $149,709 |
| 65+ Years | 354 (29.6%) | $71,618 |
| Total | 1,194 (100.0%) | $130,833 |
Poverty in Wyncote
Income Below Poverty by Sex and Age in Wyncote
With 8.2% poverty level for males and 5.8% for females among the residents of Wyncote, 65 to 74 year old males and 18 to 24 year old females are the most vulnerable to poverty, with 42 males (21.6%) and 35 females (43.8%) in their respective age groups living below the poverty level.
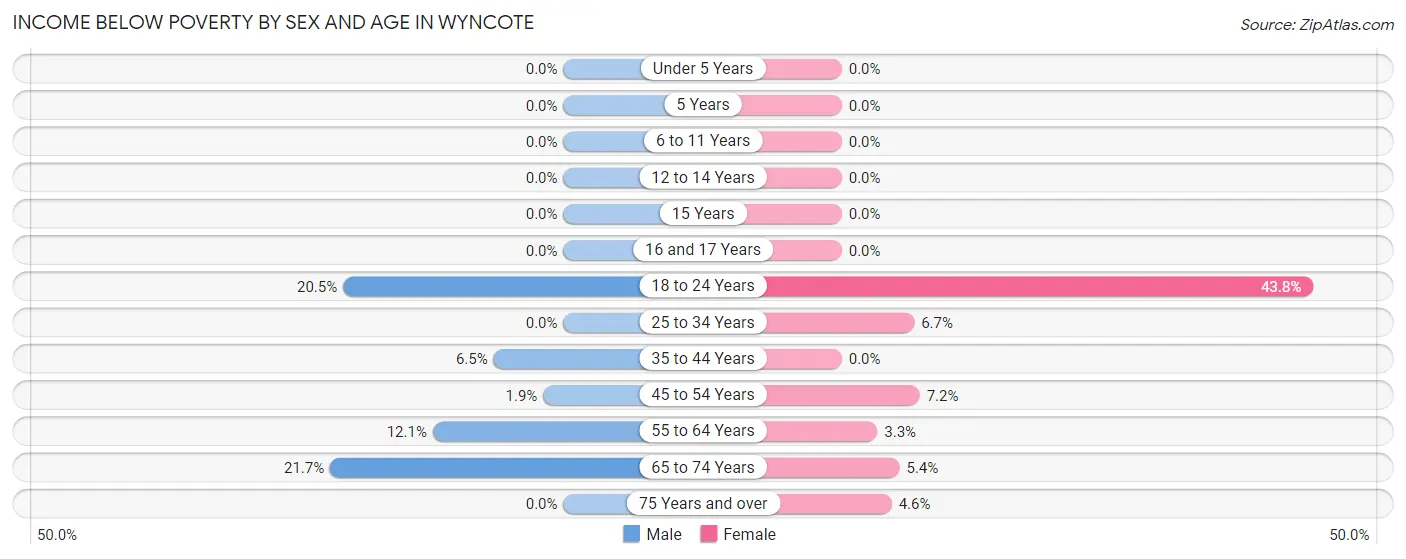
| Age Bracket | Male | Female |
| Under 5 Years | 0 (0.0%) | 0 (0.0%) |
| 5 Years | 0 (0.0%) | 0 (0.0%) |
| 6 to 11 Years | 0 (0.0%) | 0 (0.0%) |
| 12 to 14 Years | 0 (0.0%) | 0 (0.0%) |
| 15 Years | 0 (0.0%) | 0 (0.0%) |
| 16 and 17 Years | 0 (0.0%) | 0 (0.0%) |
| 18 to 24 Years | 54 (20.4%) | 35 (43.8%) |
| 25 to 34 Years | 0 (0.0%) | 9 (6.7%) |
| 35 to 44 Years | 14 (6.5%) | 0 (0.0%) |
| 45 to 54 Years | 4 (1.9%) | 17 (7.2%) |
| 55 to 64 Years | 20 (12.1%) | 7 (3.3%) |
| 65 to 74 Years | 42 (21.6%) | 9 (5.4%) |
| 75 Years and over | 0 (0.0%) | 5 (4.6%) |
| Total | 134 (8.2%) | 82 (5.8%) |
Income Above Poverty by Sex and Age in Wyncote
According to the poverty statistics in Wyncote, males aged under 5 years and females aged under 5 years are the age groups that are most secure financially, with 100.0% of males and 100.0% of females in these age groups living above the poverty line.
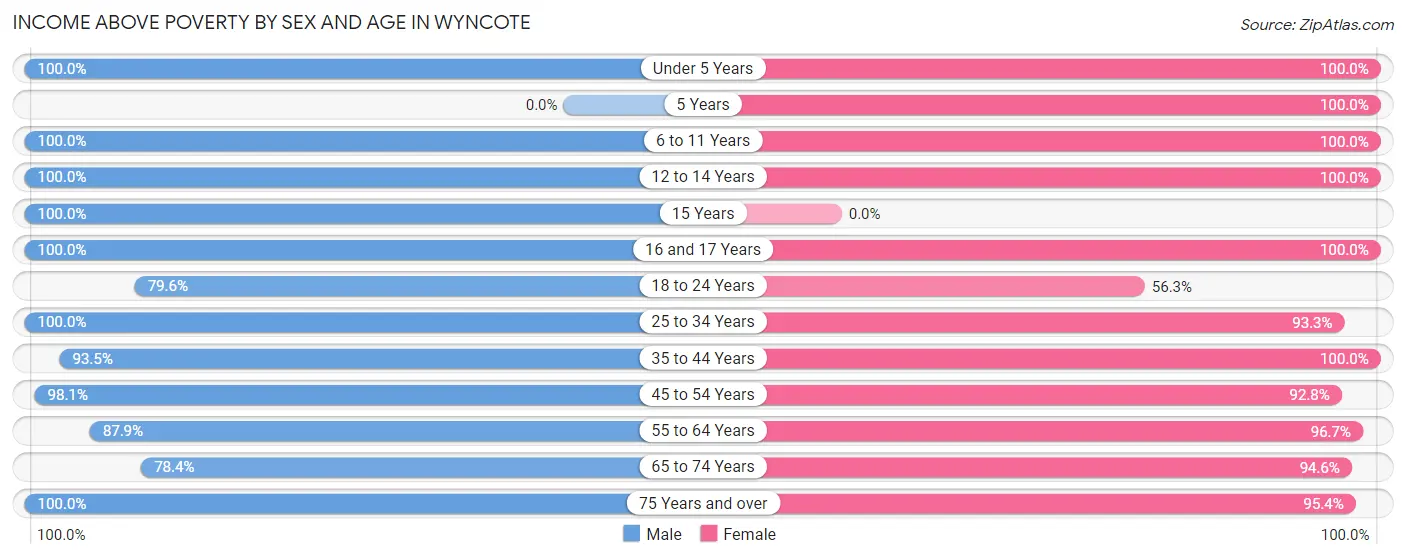
| Age Bracket | Male | Female |
| Under 5 Years | 78 (100.0%) | 69 (100.0%) |
| 5 Years | 0 (0.0%) | 38 (100.0%) |
| 6 to 11 Years | 65 (100.0%) | 119 (100.0%) |
| 12 to 14 Years | 101 (100.0%) | 43 (100.0%) |
| 15 Years | 47 (100.0%) | 0 (0.0%) |
| 16 and 17 Years | 101 (100.0%) | 20 (100.0%) |
| 18 to 24 Years | 210 (79.5%) | 45 (56.2%) |
| 25 to 34 Years | 126 (100.0%) | 125 (93.3%) |
| 35 to 44 Years | 202 (93.5%) | 179 (100.0%) |
| 45 to 54 Years | 210 (98.1%) | 218 (92.8%) |
| 55 to 64 Years | 145 (87.9%) | 205 (96.7%) |
| 65 to 74 Years | 152 (78.3%) | 159 (94.6%) |
| 75 Years and over | 73 (100.0%) | 103 (95.4%) |
| Total | 1,510 (91.8%) | 1,323 (94.2%) |
Income Below Poverty Among Married-Couple Families in Wyncote
The poverty statistics for married-couple families in Wyncote show that 3.0% or 20 of the total 656 families live below the poverty line. Families with no children have the highest poverty rate of 6.6%, comprising of 20 families. On the other hand, families with 1 or 2 children have the lowest poverty rate of 0.0%, which includes 0 families.
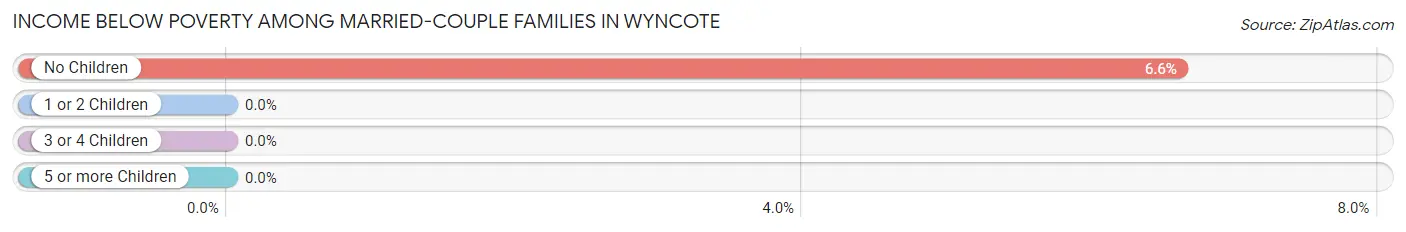
| Children | Above Poverty | Below Poverty |
| No Children | 282 (93.4%) | 20 (6.6%) |
| 1 or 2 Children | 315 (100.0%) | 0 (0.0%) |
| 3 or 4 Children | 39 (100.0%) | 0 (0.0%) |
| 5 or more Children | 0 (0.0%) | 0 (0.0%) |
| Total | 636 (97.0%) | 20 (3.0%) |
Income Below Poverty Among Single-Parent Households in Wyncote
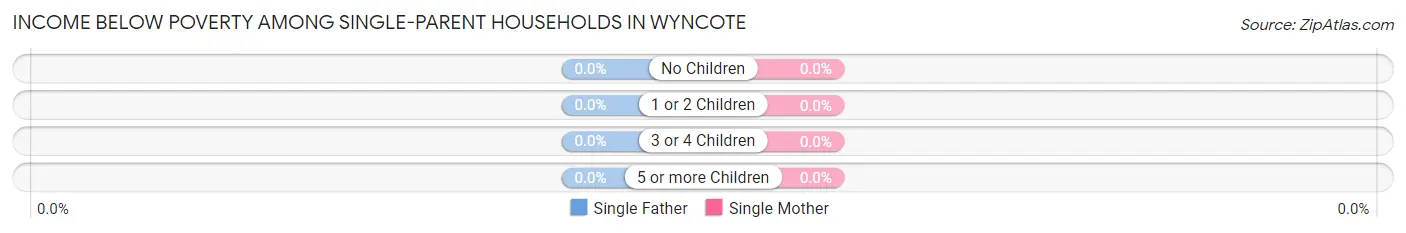
| Children | Single Father | Single Mother |
| No Children | 0 (0.0%) | 0 (0.0%) |
| 1 or 2 Children | 0 (0.0%) | 0 (0.0%) |
| 3 or 4 Children | 0 (0.0%) | 0 (0.0%) |
| 5 or more Children | 0 (0.0%) | 0 (0.0%) |
| Total | 0 (0.0%) | 0 (0.0%) |
Income Below Poverty Among Married-Couple vs Single-Parent Households in Wyncote
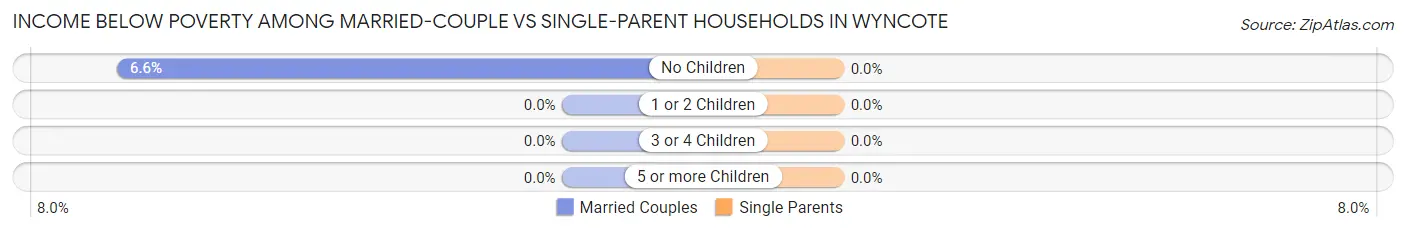
| Children | Married-Couple Families | Single-Parent Households |
| No Children | 20 (6.6%) | 0 (0.0%) |
| 1 or 2 Children | 0 (0.0%) | 0 (0.0%) |
| 3 or 4 Children | 0 (0.0%) | 0 (0.0%) |
| 5 or more Children | 0 (0.0%) | 0 (0.0%) |
| Total | 20 (3.0%) | 0 (0.0%) |
Employment Characteristics in Wyncote
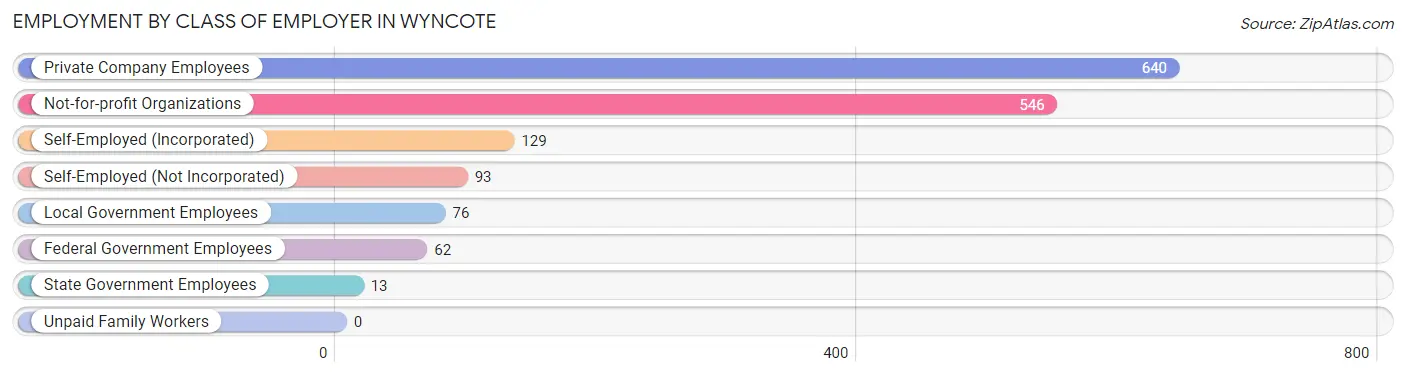
Employment by Class of Employer in Wyncote
Among the 1,559 employed individuals in Wyncote, private company employees (640 | 41.0%), not-for-profit organizations (546 | 35.0%), and self-employed (incorporated) (129 | 8.3%) make up the most common classes of employment.
| Employer Class | # Employees | % Employees |
| Private Company Employees | 640 | 41.0% |
| Self-Employed (Incorporated) | 129 | 8.3% |
| Self-Employed (Not Incorporated) | 93 | 6.0% |
| Not-for-profit Organizations | 546 | 35.0% |
| Local Government Employees | 76 | 4.9% |
| State Government Employees | 13 | 0.8% |
| Federal Government Employees | 62 | 4.0% |
| Unpaid Family Workers | 0 | 0.0% |
| Total | 1,559 | 100.0% |
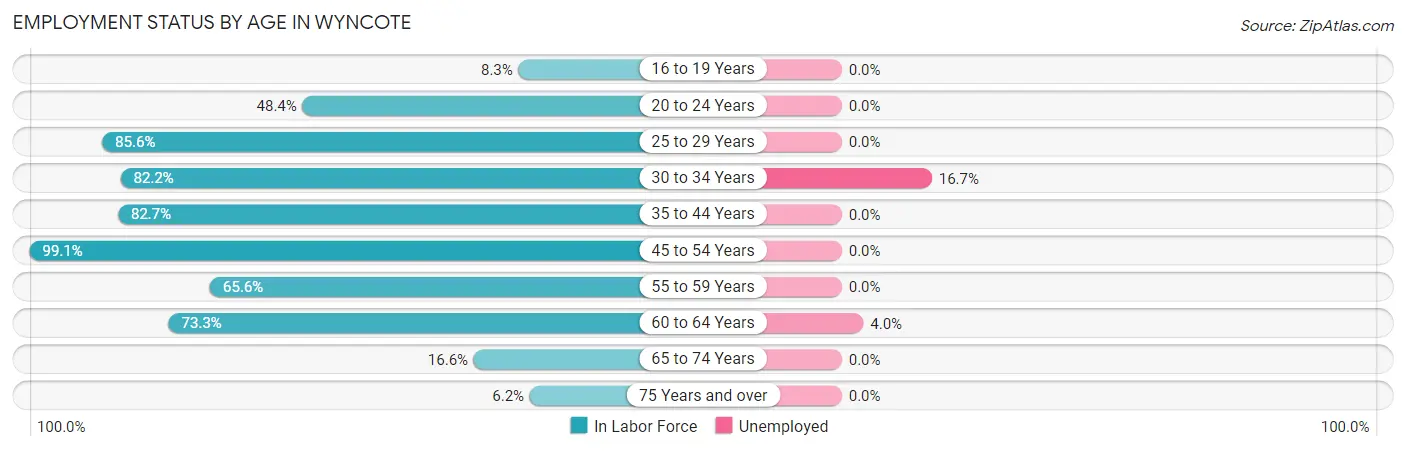
Employment Status by Age in Wyncote
According to the labor force statistics for Wyncote, out of the total population over 16 years of age (2,860), 55.3% or 1,582 individuals are in the labor force, with 1.0% or 16 of them unemployed. The age group with the highest labor force participation rate is 45 to 54 years, with 99.1% or 445 individuals in the labor force. Within the labor force, the 30 to 34 years age range has the highest percentage of unemployed individuals, with 16.7% or 10 of them being unemployed.
| Age Bracket | In Labor Force | Unemployed |
| 16 to 19 Years | 11 (8.3%) | 0 (0.0%) |
| 20 to 24 Years | 165 (48.4%) | 0 (0.0%) |
| 25 to 29 Years | 160 (85.6%) | 0 (0.0%) |
| 30 to 34 Years | 60 (82.2%) | 10 (16.7%) |
| 35 to 44 Years | 340 (82.7%) | 0 (0.0%) |
| 45 to 54 Years | 445 (99.1%) | 0 (0.0%) |
| 55 to 59 Years | 147 (65.6%) | 0 (0.0%) |
| 60 to 64 Years | 151 (73.3%) | 6 (4.0%) |
| 65 to 74 Years | 80 (16.6%) | 0 (0.0%) |
| 75 Years and over | 22 (6.2%) | 0 (0.0%) |
| Total | 1,582 (55.3%) | 16 (1.0%) |
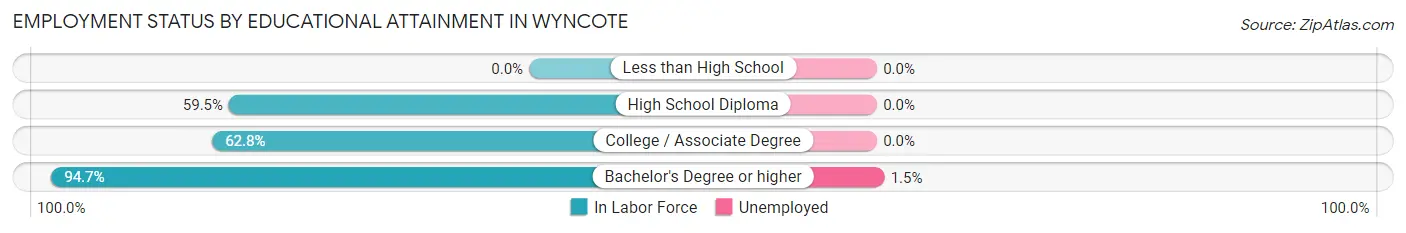
Employment Status by Educational Attainment in Wyncote
According to labor force statistics for Wyncote, 84.1% of individuals (1,304) out of the total population between 25 and 64 years of age (1,550) are in the labor force, with 1.2% or 16 of them being unemployed. The group with the highest labor force participation rate are those with the educational attainment of bachelor's degree or higher, with 94.7% or 1,063 individuals in the labor force. Within the labor force, individuals with bachelor's degree or higher education have the highest percentage of unemployment, with 1.5% or 16 of them being unemployed.
| Educational Attainment | In Labor Force | Unemployed |
| Less than High School | 0 (0.0%) | 0 (0.0%) |
| High School Diploma | 88 (59.5%) | 0 (0.0%) |
| College / Associate Degree | 152 (62.8%) | 0 (0.0%) |
| Bachelor's Degree or higher | 1,063 (94.7%) | 17 (1.5%) |
| Total | 1,304 (84.1%) | 19 (1.2%) |
Employment Occupations by Sex in Wyncote
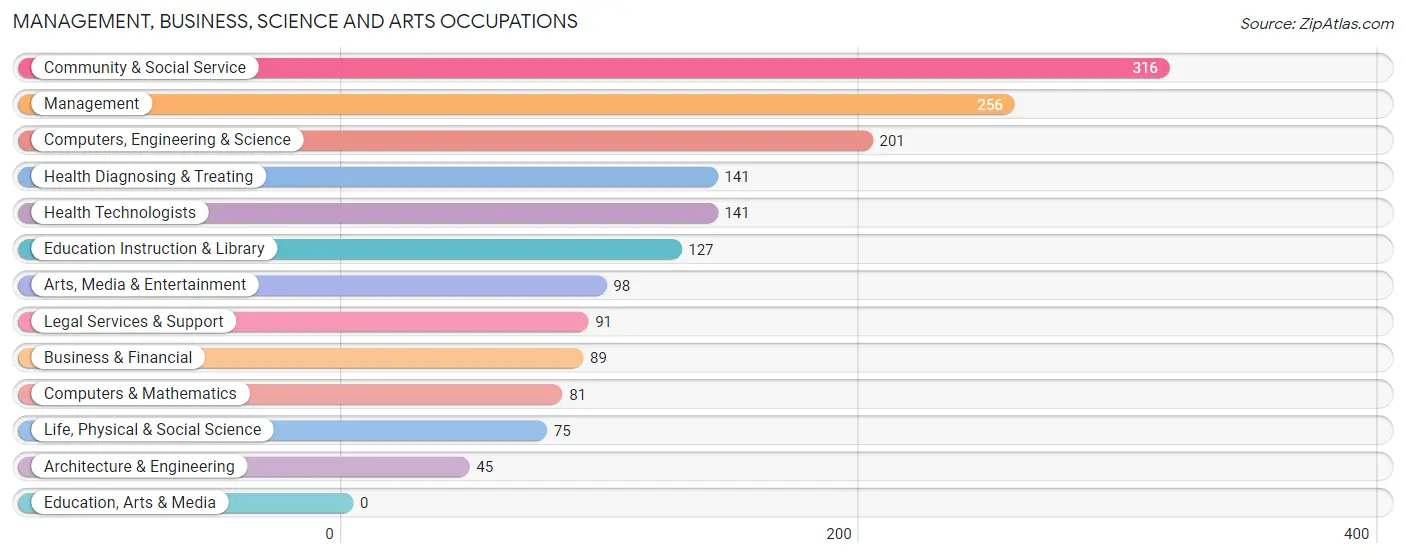
Management, Business, Science and Arts Occupations
The most common Management, Business, Science and Arts occupations in Wyncote are Community & Social Service (316 | 20.3%), Management (256 | 16.5%), Computers, Engineering & Science (201 | 12.9%), Health Diagnosing & Treating (141 | 9.1%), and Health Technologists (141 | 9.1%).
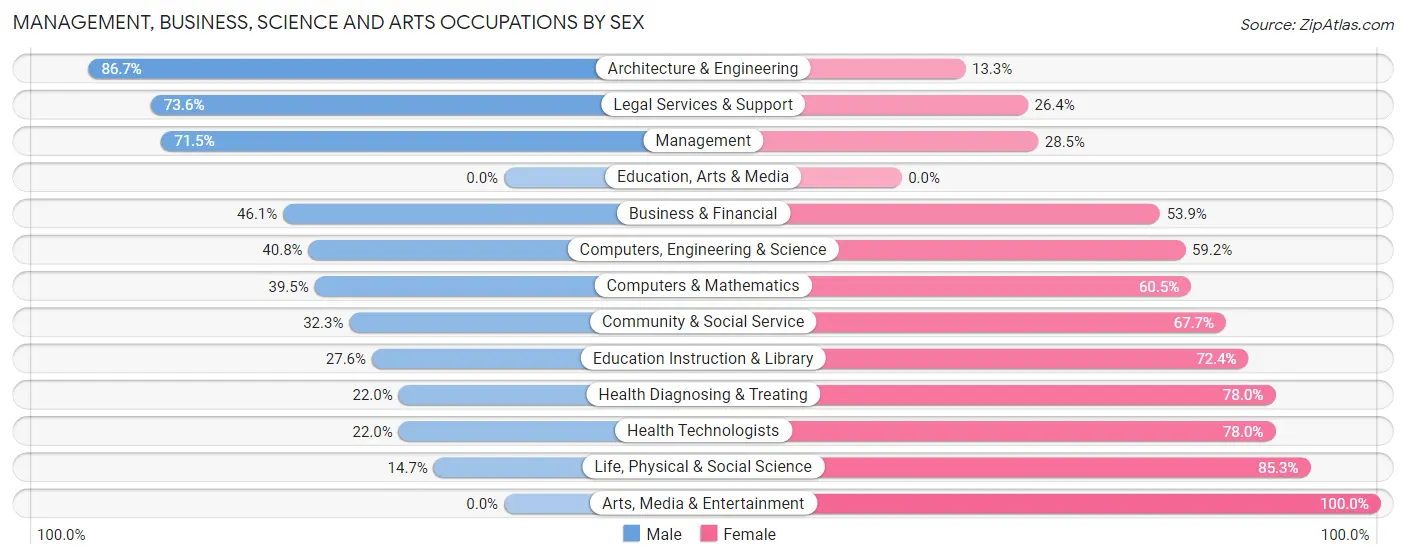
Management, Business, Science and Arts Occupations by Sex
Within the Management, Business, Science and Arts occupations in Wyncote, the most male-oriented occupations are Architecture & Engineering (86.7%), Legal Services & Support (73.6%), and Management (71.5%), while the most female-oriented occupations are Arts, Media & Entertainment (100.0%), Life, Physical & Social Science (85.3%), and Health Diagnosing & Treating (78.0%).
| Occupation | Male | Female |
| Management | 183 (71.5%) | 73 (28.5%) |
| Business & Financial | 41 (46.1%) | 48 (53.9%) |
| Computers, Engineering & Science | 82 (40.8%) | 119 (59.2%) |
| Computers & Mathematics | 32 (39.5%) | 49 (60.5%) |
| Architecture & Engineering | 39 (86.7%) | 6 (13.3%) |
| Life, Physical & Social Science | 11 (14.7%) | 64 (85.3%) |
| Community & Social Service | 102 (32.3%) | 214 (67.7%) |
| Education, Arts & Media | 0 (0.0%) | 0 (0.0%) |
| Legal Services & Support | 67 (73.6%) | 24 (26.4%) |
| Education Instruction & Library | 35 (27.6%) | 92 (72.4%) |
| Arts, Media & Entertainment | 0 (0.0%) | 98 (100.0%) |
| Health Diagnosing & Treating | 31 (22.0%) | 110 (78.0%) |
| Health Technologists | 31 (22.0%) | 110 (78.0%) |
| Total (Category) | 439 (43.8%) | 564 (56.2%) |
| Total (Overall) | 861 (55.4%) | 692 (44.6%) |
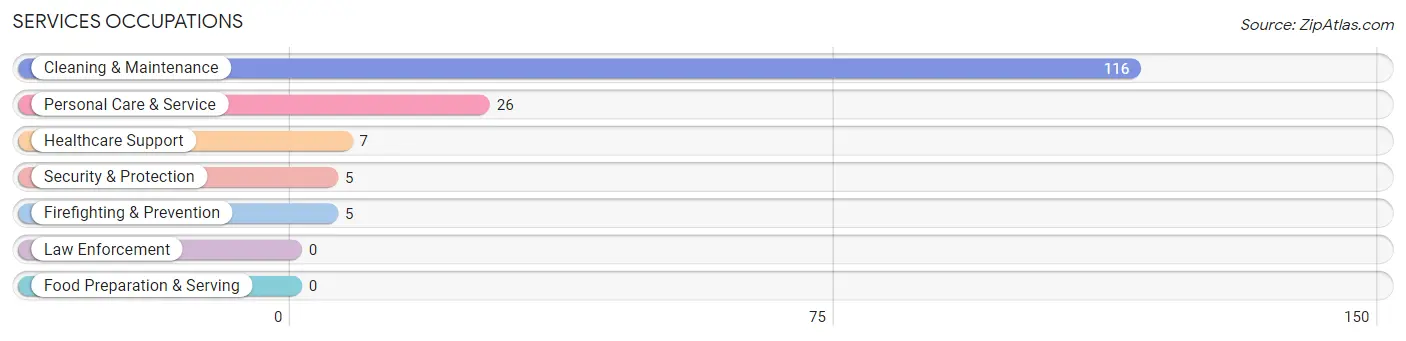
Services Occupations
The most common Services occupations in Wyncote are Cleaning & Maintenance (116 | 7.5%), Personal Care & Service (26 | 1.7%), Healthcare Support (7 | 0.4%), Security & Protection (5 | 0.3%), and Firefighting & Prevention (5 | 0.3%).
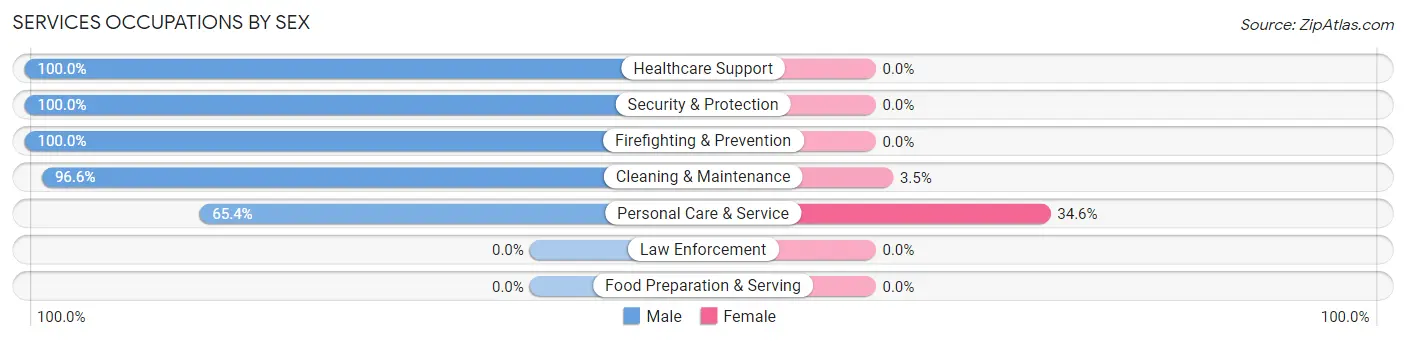
Services Occupations by Sex
Within the Services occupations in Wyncote, the most male-oriented occupations are Healthcare Support (100.0%), Security & Protection (100.0%), and Firefighting & Prevention (100.0%), while the most female-oriented occupations are Personal Care & Service (34.6%), and Cleaning & Maintenance (3.5%).
| Occupation | Male | Female |
| Healthcare Support | 7 (100.0%) | 0 (0.0%) |
| Security & Protection | 5 (100.0%) | 0 (0.0%) |
| Firefighting & Prevention | 5 (100.0%) | 0 (0.0%) |
| Law Enforcement | 0 (0.0%) | 0 (0.0%) |
| Food Preparation & Serving | 0 (0.0%) | 0 (0.0%) |
| Cleaning & Maintenance | 112 (96.6%) | 4 (3.5%) |
| Personal Care & Service | 17 (65.4%) | 9 (34.6%) |
| Total (Category) | 141 (91.6%) | 13 (8.4%) |
| Total (Overall) | 861 (55.4%) | 692 (44.6%) |
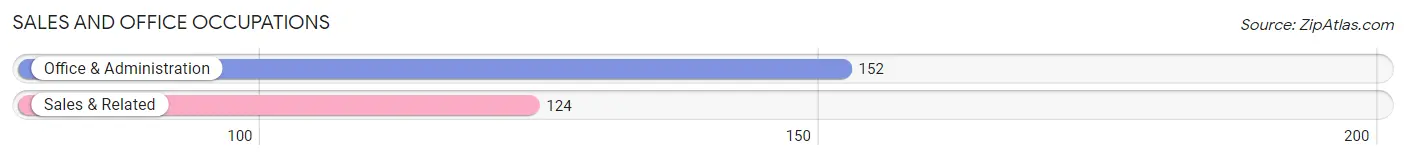
Sales and Office Occupations
The most common Sales and Office occupations in Wyncote are Office & Administration (152 | 9.8%), and Sales & Related (124 | 8.0%).
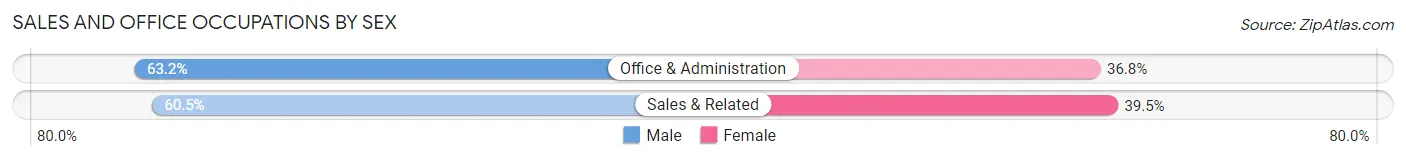
Sales and Office Occupations by Sex
| Occupation | Male | Female |
| Sales & Related | 75 (60.5%) | 49 (39.5%) |
| Office & Administration | 96 (63.2%) | 56 (36.8%) |
| Total (Category) | 171 (62.0%) | 105 (38.0%) |
| Total (Overall) | 861 (55.4%) | 692 (44.6%) |
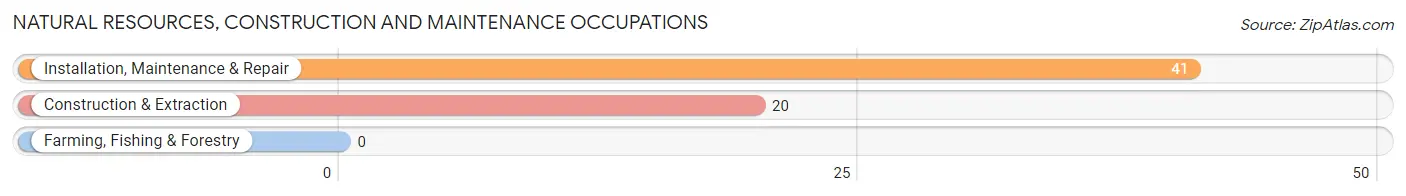
Natural Resources, Construction and Maintenance Occupations
The most common Natural Resources, Construction and Maintenance occupations in Wyncote are Installation, Maintenance & Repair (41 | 2.6%), and Construction & Extraction (20 | 1.3%).
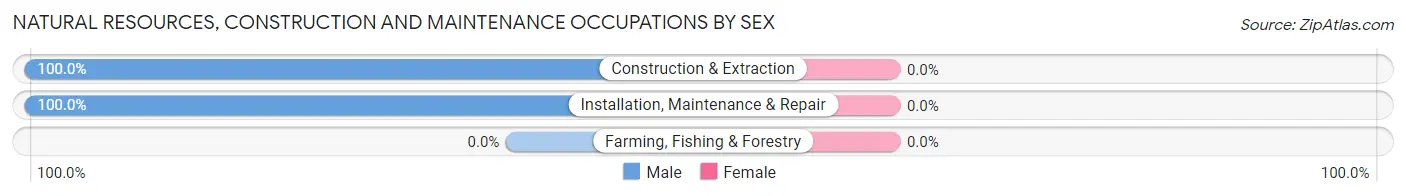
Natural Resources, Construction and Maintenance Occupations by Sex
| Occupation | Male | Female |
| Farming, Fishing & Forestry | 0 (0.0%) | 0 (0.0%) |
| Construction & Extraction | 20 (100.0%) | 0 (0.0%) |
| Installation, Maintenance & Repair | 41 (100.0%) | 0 (0.0%) |
| Total (Category) | 61 (100.0%) | 0 (0.0%) |
| Total (Overall) | 861 (55.4%) | 692 (44.6%) |
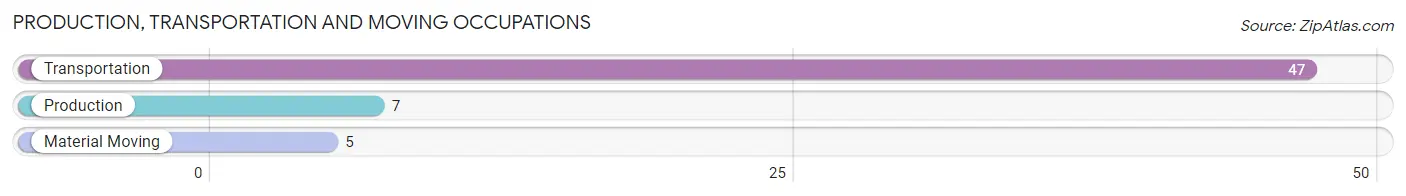
Production, Transportation and Moving Occupations
The most common Production, Transportation and Moving occupations in Wyncote are Transportation (47 | 3.0%), Production (7 | 0.4%), and Material Moving (5 | 0.3%).
Production, Transportation and Moving Occupations by Sex
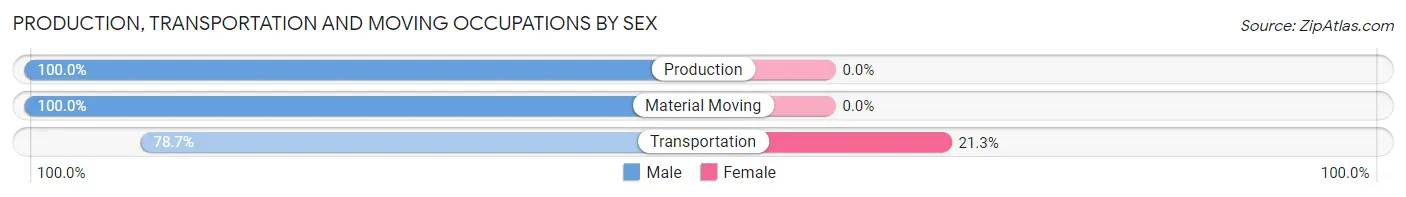
| Occupation | Male | Female |
| Production | 7 (100.0%) | 0 (0.0%) |
| Transportation | 37 (78.7%) | 10 (21.3%) |
| Material Moving | 5 (100.0%) | 0 (0.0%) |
| Total (Category) | 49 (83.1%) | 10 (17.0%) |
| Total (Overall) | 861 (55.4%) | 692 (44.6%) |
Employment Industries by Sex in Wyncote
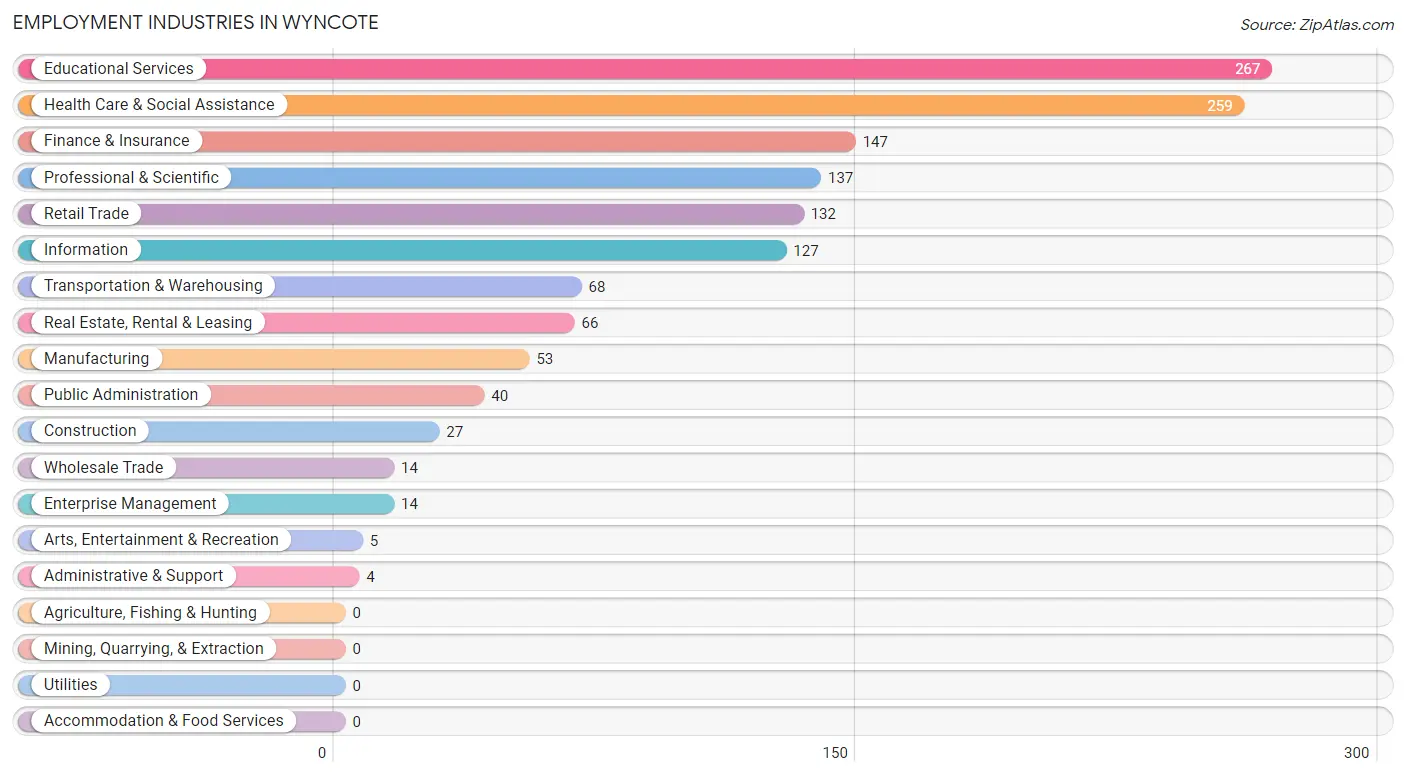
Employment Industries in Wyncote
The major employment industries in Wyncote include Educational Services (267 | 17.2%), Health Care & Social Assistance (259 | 16.7%), Finance & Insurance (147 | 9.5%), Professional & Scientific (137 | 8.8%), and Retail Trade (132 | 8.5%).
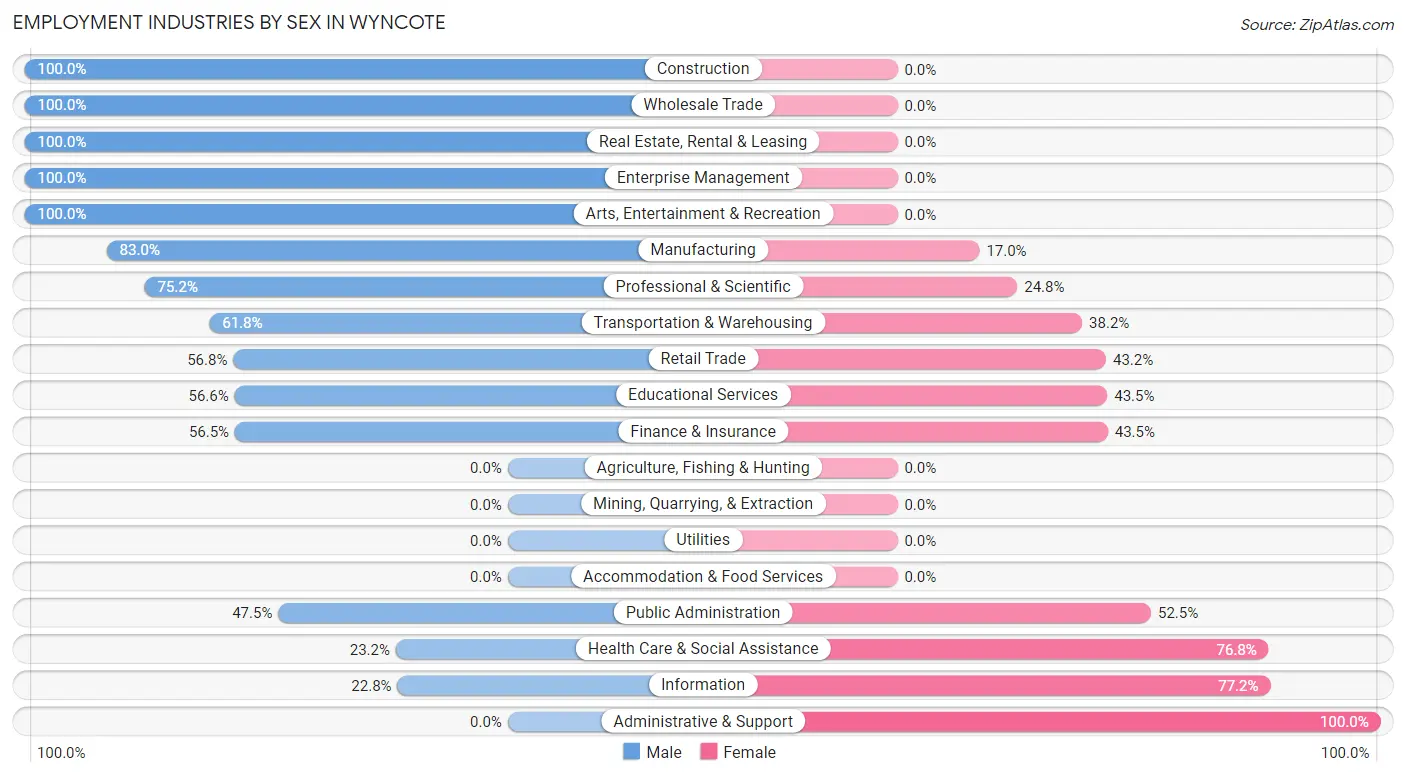
Employment Industries by Sex in Wyncote
The Wyncote industries that see more men than women are Construction (100.0%), Wholesale Trade (100.0%), and Real Estate, Rental & Leasing (100.0%), whereas the industries that tend to have a higher number of women are Administrative & Support (100.0%), Information (77.2%), and Health Care & Social Assistance (76.8%).
| Industry | Male | Female |
| Agriculture, Fishing & Hunting | 0 (0.0%) | 0 (0.0%) |
| Mining, Quarrying, & Extraction | 0 (0.0%) | 0 (0.0%) |
| Construction | 27 (100.0%) | 0 (0.0%) |
| Manufacturing | 44 (83.0%) | 9 (17.0%) |
| Wholesale Trade | 14 (100.0%) | 0 (0.0%) |
| Retail Trade | 75 (56.8%) | 57 (43.2%) |
| Transportation & Warehousing | 42 (61.8%) | 26 (38.2%) |
| Utilities | 0 (0.0%) | 0 (0.0%) |
| Information | 29 (22.8%) | 98 (77.2%) |
| Finance & Insurance | 83 (56.5%) | 64 (43.5%) |
| Real Estate, Rental & Leasing | 66 (100.0%) | 0 (0.0%) |
| Professional & Scientific | 103 (75.2%) | 34 (24.8%) |
| Enterprise Management | 14 (100.0%) | 0 (0.0%) |
| Administrative & Support | 0 (0.0%) | 4 (100.0%) |
| Educational Services | 151 (56.6%) | 116 (43.4%) |
| Health Care & Social Assistance | 60 (23.2%) | 199 (76.8%) |
| Arts, Entertainment & Recreation | 5 (100.0%) | 0 (0.0%) |
| Accommodation & Food Services | 0 (0.0%) | 0 (0.0%) |
| Public Administration | 19 (47.5%) | 21 (52.5%) |
| Total | 861 (55.4%) | 692 (44.6%) |
Education in Wyncote
School Enrollment in Wyncote
The most common levels of schooling among the 836 students in Wyncote are high school (179 | 21.4%), elementary school (168 | 20.1%), and middle school (151 | 18.1%).
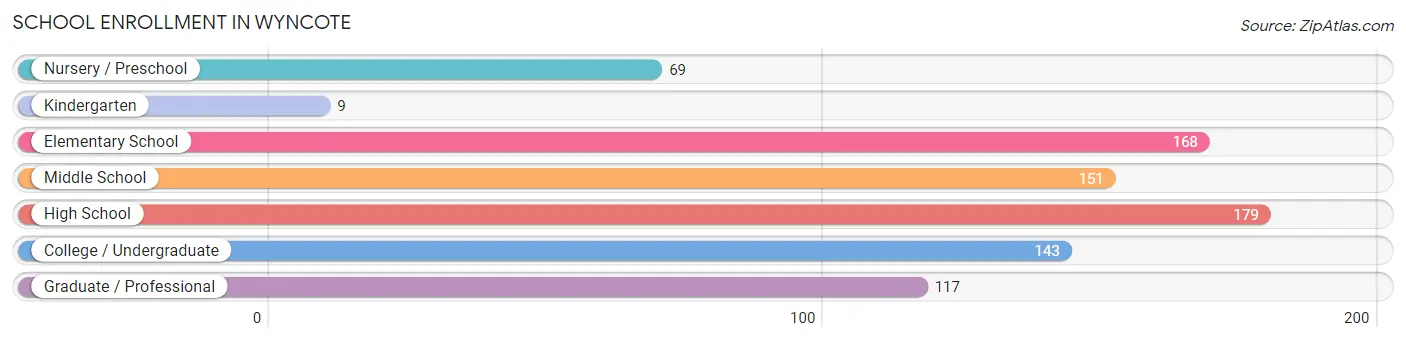
| School Level | # Students | % Students |
| Nursery / Preschool | 69 | 8.3% |
| Kindergarten | 9 | 1.1% |
| Elementary School | 168 | 20.1% |
| Middle School | 151 | 18.1% |
| High School | 179 | 21.4% |
| College / Undergraduate | 143 | 17.1% |
| Graduate / Professional | 117 | 14.0% |
| Total | 836 | 100.0% |
School Enrollment by Age by Funding Source in Wyncote
Out of a total of 836 students who are enrolled in schools in Wyncote, 500 (59.8%) attend a private institution, while the remaining 336 (40.2%) are enrolled in public schools. The age group of 3 to 4 year olds has the highest likelihood of being enrolled in private schools, with 31 (100.0% in the age bracket) enrolled. Conversely, the age group of 18 to 19 year olds has the lowest likelihood of being enrolled in a private school, with 11 (100.0% in the age bracket) attending a public institution.
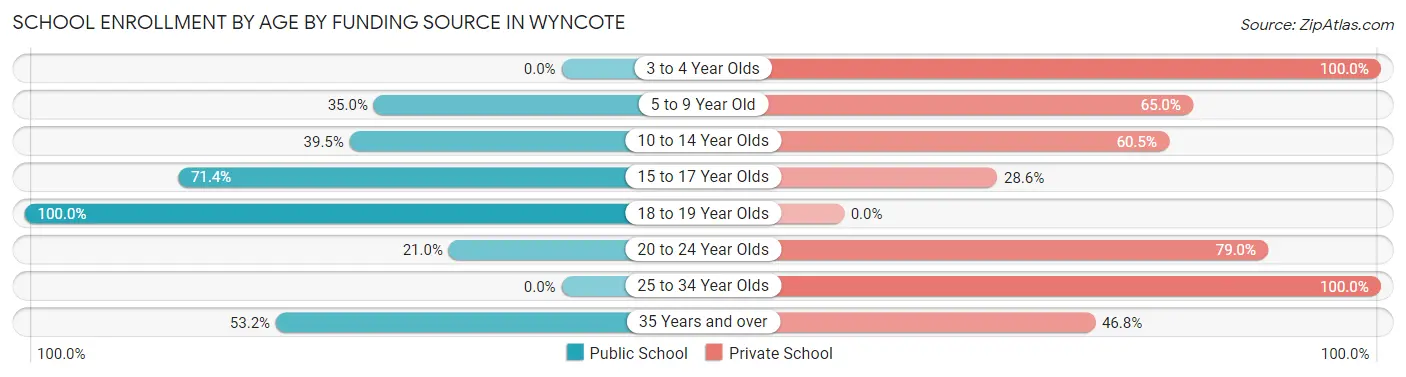
| Age Bracket | Public School | Private School |
| 3 to 4 Year Olds | 0 (0.0%) | 31 (100.0%) |
| 5 to 9 Year Old | 50 (35.0%) | 93 (65.0%) |
| 10 to 14 Year Olds | 88 (39.5%) | 135 (60.5%) |
| 15 to 17 Year Olds | 120 (71.4%) | 48 (28.6%) |
| 18 to 19 Year Olds | 11 (100.0%) | 0 (0.0%) |
| 20 to 24 Year Olds | 42 (21.0%) | 158 (79.0%) |
| 25 to 34 Year Olds | 0 (0.0%) | 13 (100.0%) |
| 35 Years and over | 25 (53.2%) | 22 (46.8%) |
| Total | 336 (40.2%) | 500 (59.8%) |
Educational Attainment by Field of Study in Wyncote
Business (357 | 22.6%), education (157 | 10.0%), social sciences (128 | 8.1%), bio, nature & agricultural (126 | 8.0%), and liberal arts & history (124 | 7.9%) are the most common fields of study among 1,577 individuals in Wyncote who have obtained a bachelor's degree or higher.
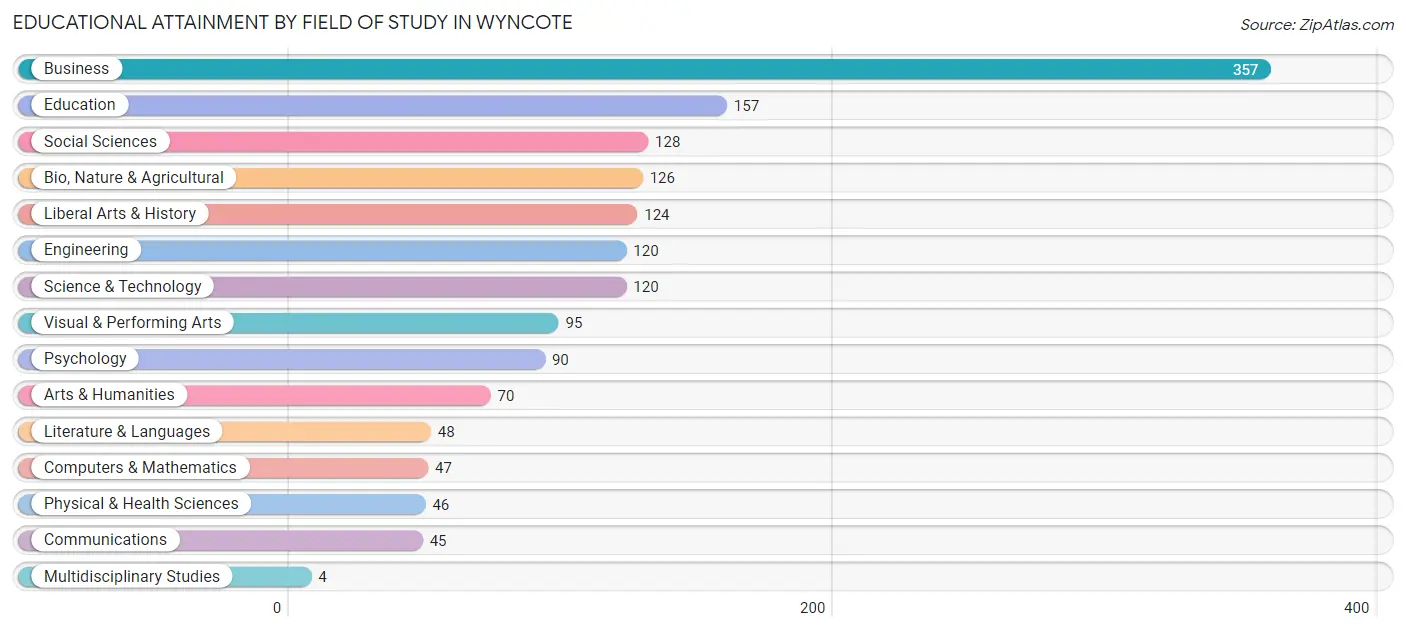
| Field of Study | # Graduates | % Graduates |
| Computers & Mathematics | 47 | 3.0% |
| Bio, Nature & Agricultural | 126 | 8.0% |
| Physical & Health Sciences | 46 | 2.9% |
| Psychology | 90 | 5.7% |
| Social Sciences | 128 | 8.1% |
| Engineering | 120 | 7.6% |
| Multidisciplinary Studies | 4 | 0.3% |
| Science & Technology | 120 | 7.6% |
| Business | 357 | 22.6% |
| Education | 157 | 10.0% |
| Literature & Languages | 48 | 3.0% |
| Liberal Arts & History | 124 | 7.9% |
| Visual & Performing Arts | 95 | 6.0% |
| Communications | 45 | 2.9% |
| Arts & Humanities | 70 | 4.4% |
| Total | 1,577 | 100.0% |
Transportation & Commute in Wyncote
Vehicle Availability by Sex in Wyncote
The most prevalent vehicle ownership categories in Wyncote are males with 3 vehicles (308, accounting for 36.0%) and females with 3 vehicles (267, making up 43.9%).
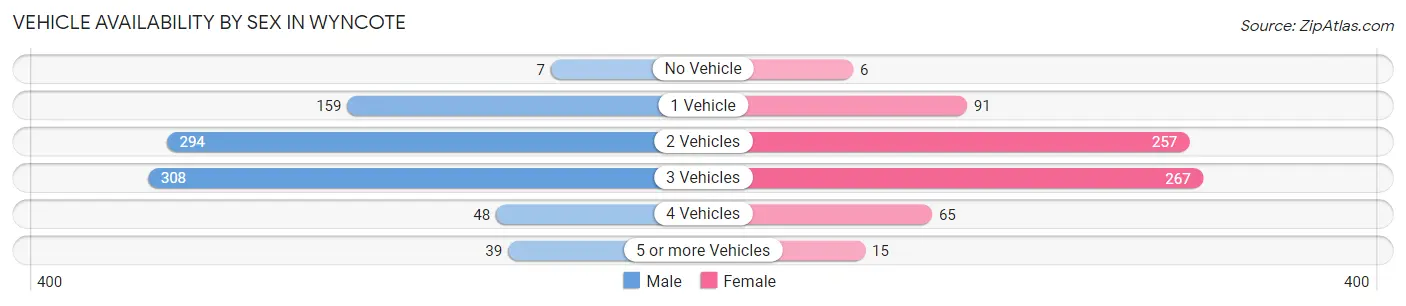
| Vehicles Available | Male | Female |
| No Vehicle | 7 (0.8%) | 6 (0.9%) |
| 1 Vehicle | 159 (18.6%) | 91 (13.0%) |
| 2 Vehicles | 294 (34.4%) | 257 (36.7%) |
| 3 Vehicles | 308 (36.0%) | 267 (38.1%) |
| 4 Vehicles | 48 (5.6%) | 65 (9.3%) |
| 5 or more Vehicles | 39 (4.6%) | 15 (2.1%) |
| Total | 855 (100.0%) | 701 (100.0%) |
Commute Time in Wyncote
The most frequently occuring commute durations in Wyncote are 10 to 14 minutes (264 commuters, 19.9%), 30 to 34 minutes (250 commuters, 18.8%), and 45 to 59 minutes (191 commuters, 14.4%).
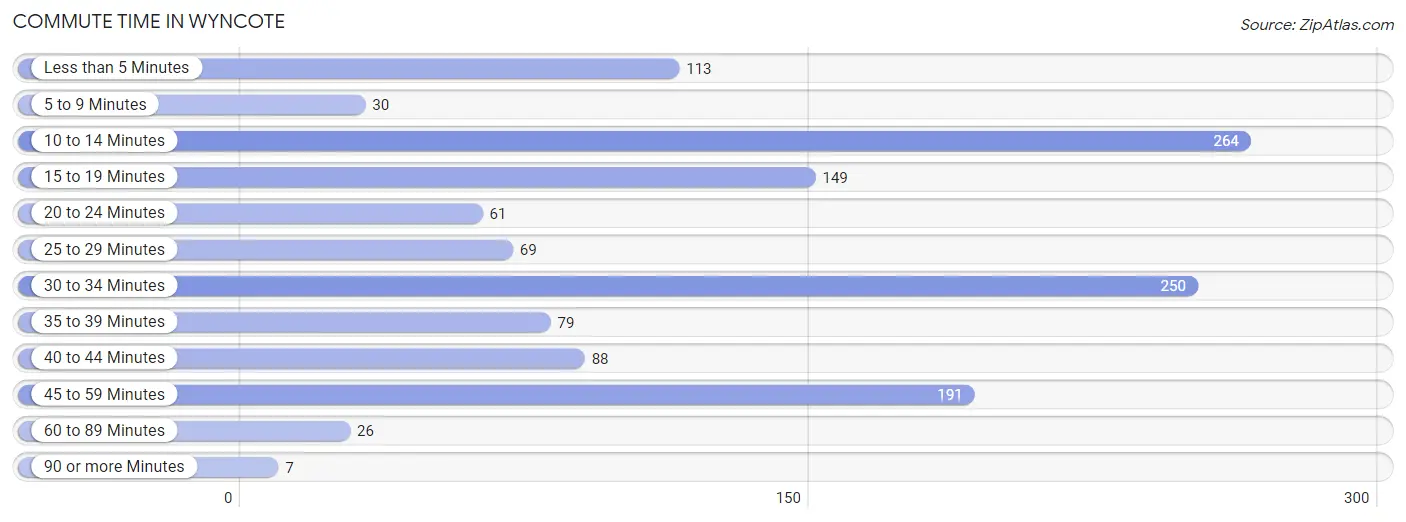
| Commute Time | # Commuters | % Commuters |
| Less than 5 Minutes | 113 | 8.5% |
| 5 to 9 Minutes | 30 | 2.3% |
| 10 to 14 Minutes | 264 | 19.9% |
| 15 to 19 Minutes | 149 | 11.2% |
| 20 to 24 Minutes | 61 | 4.6% |
| 25 to 29 Minutes | 69 | 5.2% |
| 30 to 34 Minutes | 250 | 18.8% |
| 35 to 39 Minutes | 79 | 5.9% |
| 40 to 44 Minutes | 88 | 6.6% |
| 45 to 59 Minutes | 191 | 14.4% |
| 60 to 89 Minutes | 26 | 2.0% |
| 90 or more Minutes | 7 | 0.5% |
Commute Time by Sex in Wyncote
The most common commute times in Wyncote are 30 to 34 minutes (148 commuters, 21.0%) for males and 10 to 14 minutes (218 commuters, 35.1%) for females.
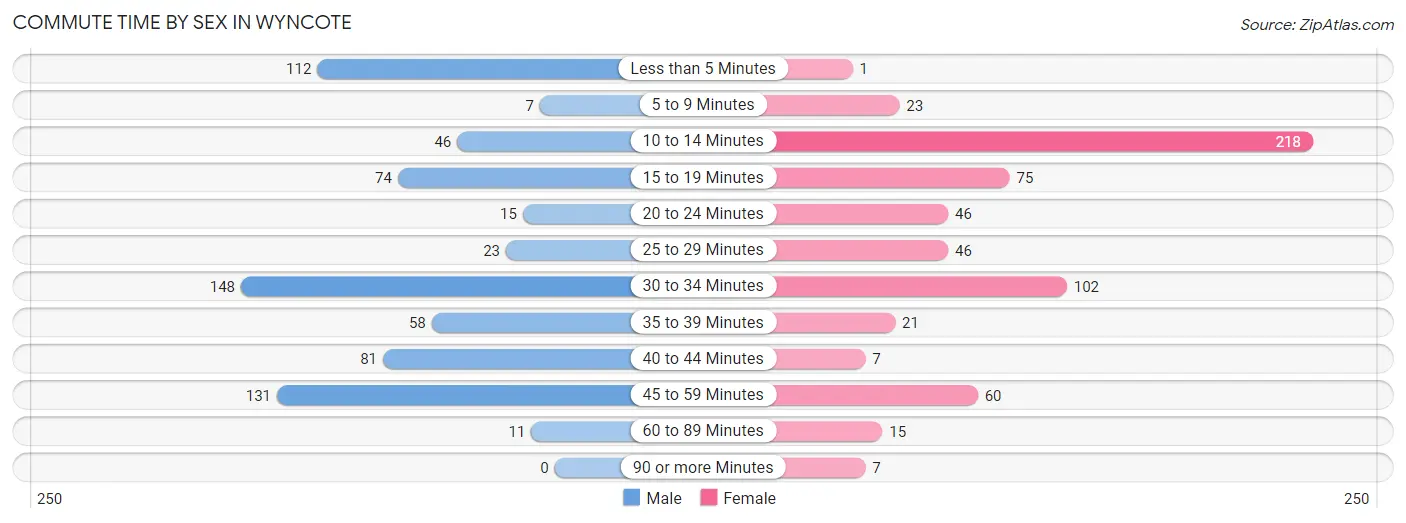
| Commute Time | Male | Female |
| Less than 5 Minutes | 112 (15.9%) | 1 (0.2%) |
| 5 to 9 Minutes | 7 (1.0%) | 23 (3.7%) |
| 10 to 14 Minutes | 46 (6.5%) | 218 (35.1%) |
| 15 to 19 Minutes | 74 (10.5%) | 75 (12.1%) |
| 20 to 24 Minutes | 15 (2.1%) | 46 (7.4%) |
| 25 to 29 Minutes | 23 (3.3%) | 46 (7.4%) |
| 30 to 34 Minutes | 148 (21.0%) | 102 (16.4%) |
| 35 to 39 Minutes | 58 (8.2%) | 21 (3.4%) |
| 40 to 44 Minutes | 81 (11.5%) | 7 (1.1%) |
| 45 to 59 Minutes | 131 (18.6%) | 60 (9.7%) |
| 60 to 89 Minutes | 11 (1.6%) | 15 (2.4%) |
| 90 or more Minutes | 0 (0.0%) | 7 (1.1%) |
Time of Departure to Work by Sex in Wyncote
The most frequent times of departure to work in Wyncote are 8:00 AM to 8:29 AM (243, 34.4%) for males and 7:00 AM to 7:29 AM (205, 33.0%) for females.
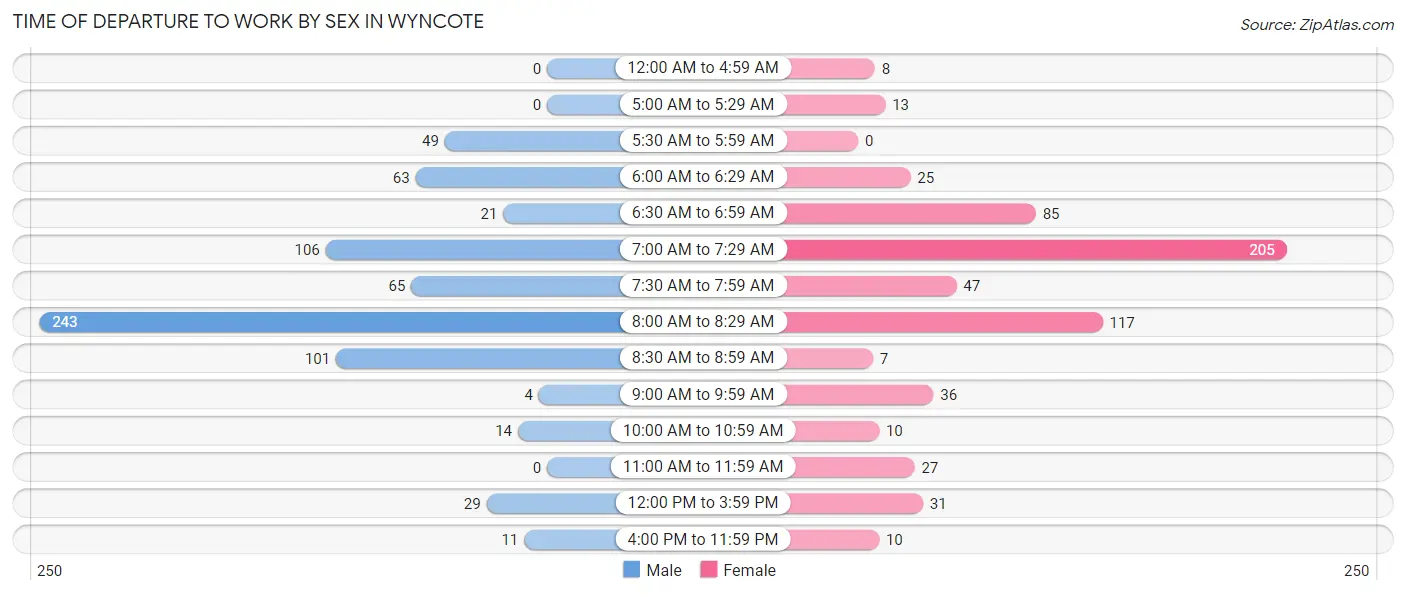
| Time of Departure | Male | Female |
| 12:00 AM to 4:59 AM | 0 (0.0%) | 8 (1.3%) |
| 5:00 AM to 5:29 AM | 0 (0.0%) | 13 (2.1%) |
| 5:30 AM to 5:59 AM | 49 (6.9%) | 0 (0.0%) |
| 6:00 AM to 6:29 AM | 63 (8.9%) | 25 (4.0%) |
| 6:30 AM to 6:59 AM | 21 (3.0%) | 85 (13.7%) |
| 7:00 AM to 7:29 AM | 106 (15.0%) | 205 (33.0%) |
| 7:30 AM to 7:59 AM | 65 (9.2%) | 47 (7.6%) |
| 8:00 AM to 8:29 AM | 243 (34.4%) | 117 (18.8%) |
| 8:30 AM to 8:59 AM | 101 (14.3%) | 7 (1.1%) |
| 9:00 AM to 9:59 AM | 4 (0.6%) | 36 (5.8%) |
| 10:00 AM to 10:59 AM | 14 (2.0%) | 10 (1.6%) |
| 11:00 AM to 11:59 AM | 0 (0.0%) | 27 (4.3%) |
| 12:00 PM to 3:59 PM | 29 (4.1%) | 31 (5.0%) |
| 4:00 PM to 11:59 PM | 11 (1.6%) | 10 (1.6%) |
| Total | 706 (100.0%) | 621 (100.0%) |
Housing Occupancy in Wyncote
Occupancy by Ownership in Wyncote
Of the total 1,194 dwellings in Wyncote, owner-occupied units account for 831 (69.6%), while renter-occupied units make up 363 (30.4%).
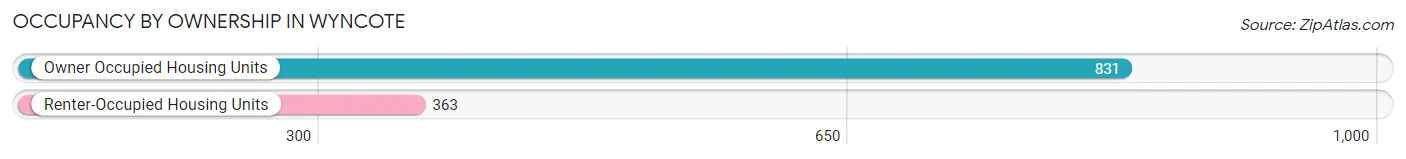
| Occupancy | # Housing Units | % Housing Units |
| Owner Occupied Housing Units | 831 | 69.6% |
| Renter-Occupied Housing Units | 363 | 30.4% |
| Total Occupied Housing Units | 1,194 | 100.0% |
Occupancy by Household Size in Wyncote
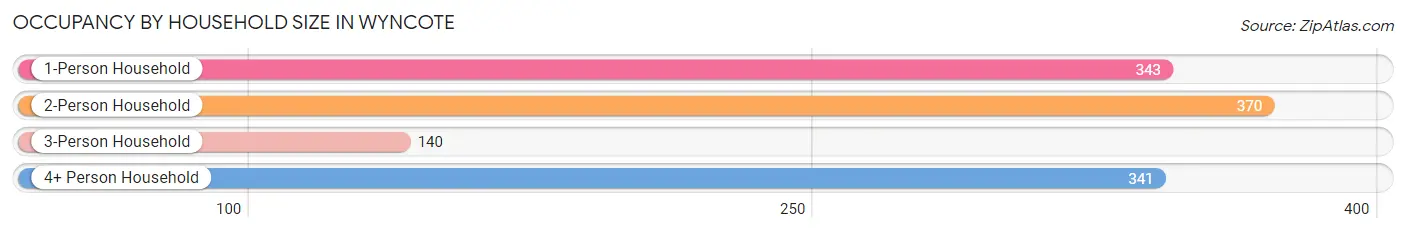
| Household Size | # Housing Units | % Housing Units |
| 1-Person Household | 343 | 28.7% |
| 2-Person Household | 370 | 31.0% |
| 3-Person Household | 140 | 11.7% |
| 4+ Person Household | 341 | 28.6% |
| Total Housing Units | 1,194 | 100.0% |
Occupancy by Ownership by Household Size in Wyncote
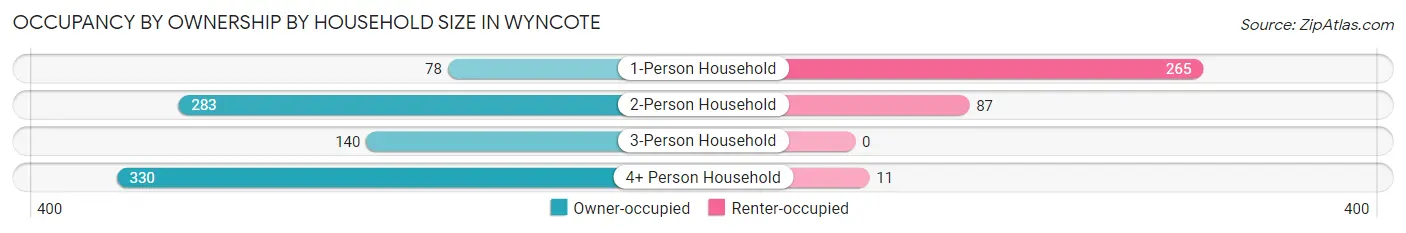
| Household Size | Owner-occupied | Renter-occupied |
| 1-Person Household | 78 (22.7%) | 265 (77.3%) |
| 2-Person Household | 283 (76.5%) | 87 (23.5%) |
| 3-Person Household | 140 (100.0%) | 0 (0.0%) |
| 4+ Person Household | 330 (96.8%) | 11 (3.2%) |
| Total Housing Units | 831 (69.6%) | 363 (30.4%) |
Occupancy by Educational Attainment in Wyncote
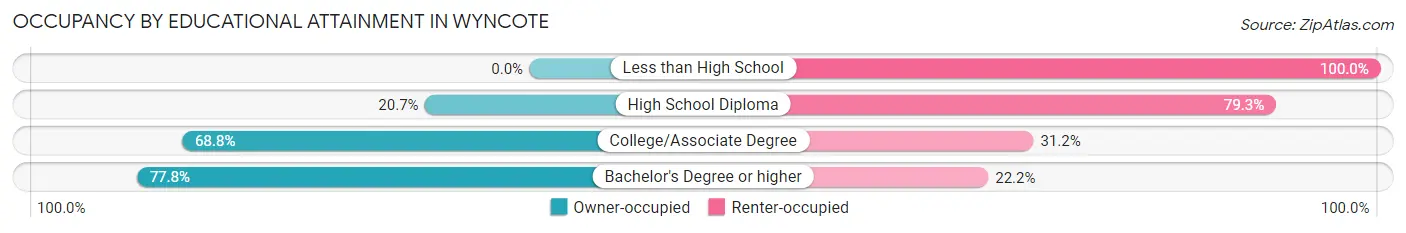
| Household Size | Owner-occupied | Renter-occupied |
| Less than High School | 0 (0.0%) | 49 (100.0%) |
| High School Diploma | 17 (20.7%) | 65 (79.3%) |
| College/Associate Degree | 97 (68.8%) | 44 (31.2%) |
| Bachelor's Degree or higher | 717 (77.8%) | 205 (22.2%) |
Occupancy by Age of Householder in Wyncote
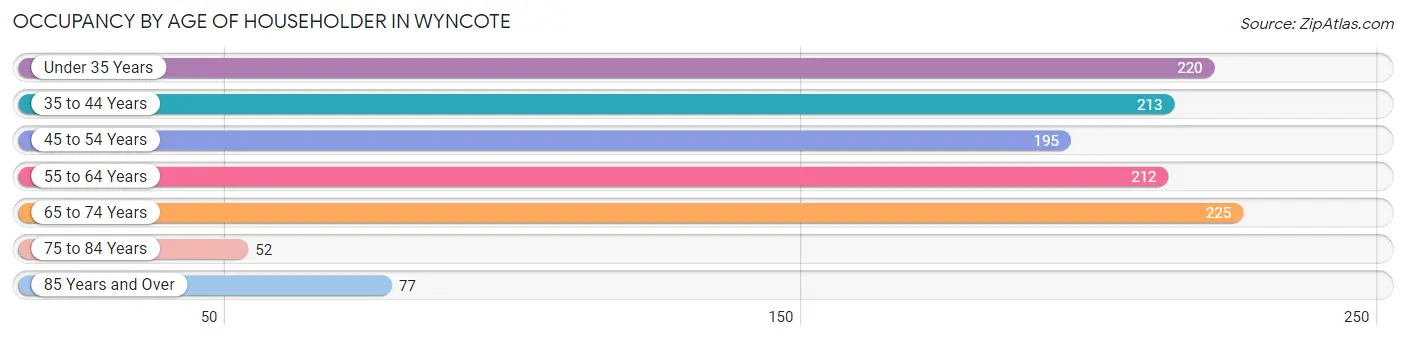
| Age Bracket | # Households | % Households |
| Under 35 Years | 220 | 18.4% |
| 35 to 44 Years | 213 | 17.8% |
| 45 to 54 Years | 195 | 16.3% |
| 55 to 64 Years | 212 | 17.8% |
| 65 to 74 Years | 225 | 18.8% |
| 75 to 84 Years | 52 | 4.4% |
| 85 Years and Over | 77 | 6.5% |
| Total | 1,194 | 100.0% |
Housing Finances in Wyncote
Median Income by Occupancy in Wyncote
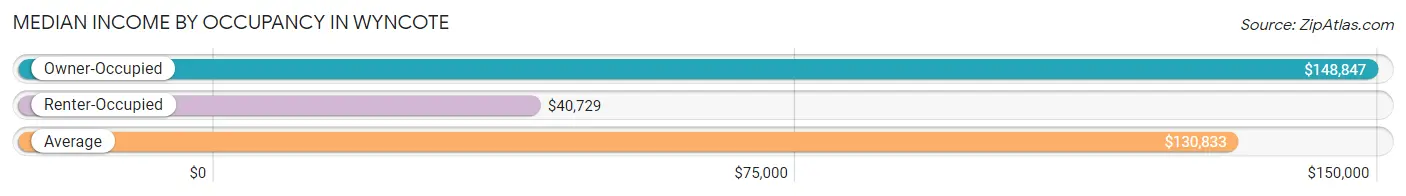
| Occupancy Type | # Households | Median Income |
| Owner-Occupied | 831 (69.6%) | $148,847 |
| Renter-Occupied | 363 (30.4%) | $40,729 |
| Average | 1,194 (100.0%) | $130,833 |
Occupancy by Householder Income Bracket in Wyncote
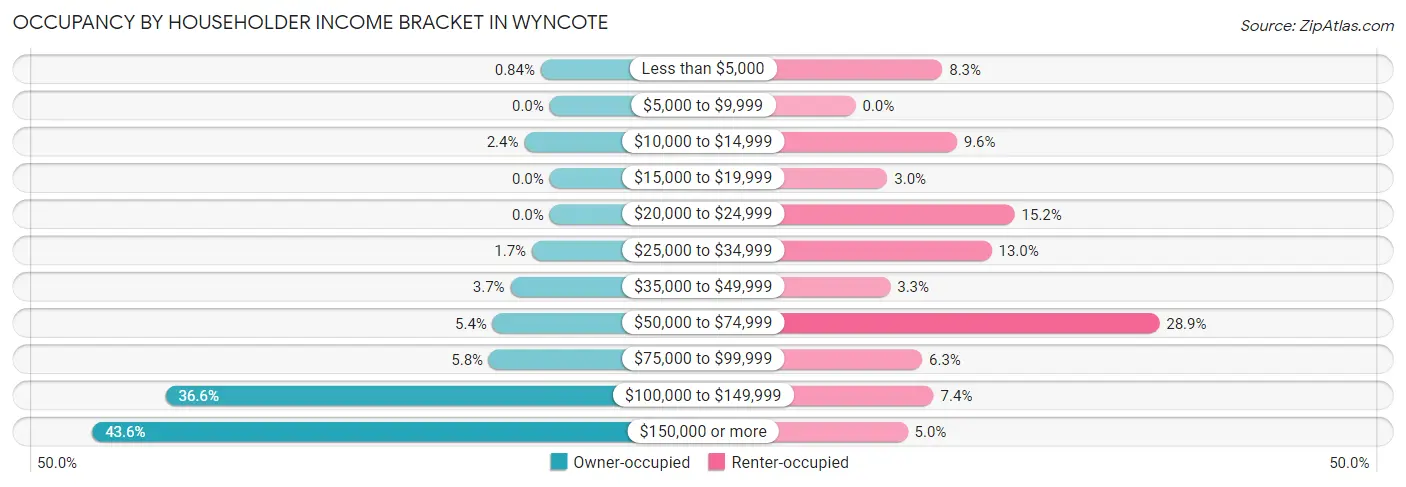
| Income Bracket | Owner-occupied | Renter-occupied |
| Less than $5,000 | 7 (0.8%) | 30 (8.3%) |
| $5,000 to $9,999 | 0 (0.0%) | 0 (0.0%) |
| $10,000 to $14,999 | 20 (2.4%) | 35 (9.6%) |
| $15,000 to $19,999 | 0 (0.0%) | 11 (3.0%) |
| $20,000 to $24,999 | 0 (0.0%) | 55 (15.1%) |
| $25,000 to $34,999 | 14 (1.7%) | 47 (13.0%) |
| $35,000 to $49,999 | 31 (3.7%) | 12 (3.3%) |
| $50,000 to $74,999 | 45 (5.4%) | 105 (28.9%) |
| $75,000 to $99,999 | 48 (5.8%) | 23 (6.3%) |
| $100,000 to $149,999 | 304 (36.6%) | 27 (7.4%) |
| $150,000 or more | 362 (43.6%) | 18 (5.0%) |
| Total | 831 (100.0%) | 363 (100.0%) |
Monthly Housing Cost Tiers in Wyncote
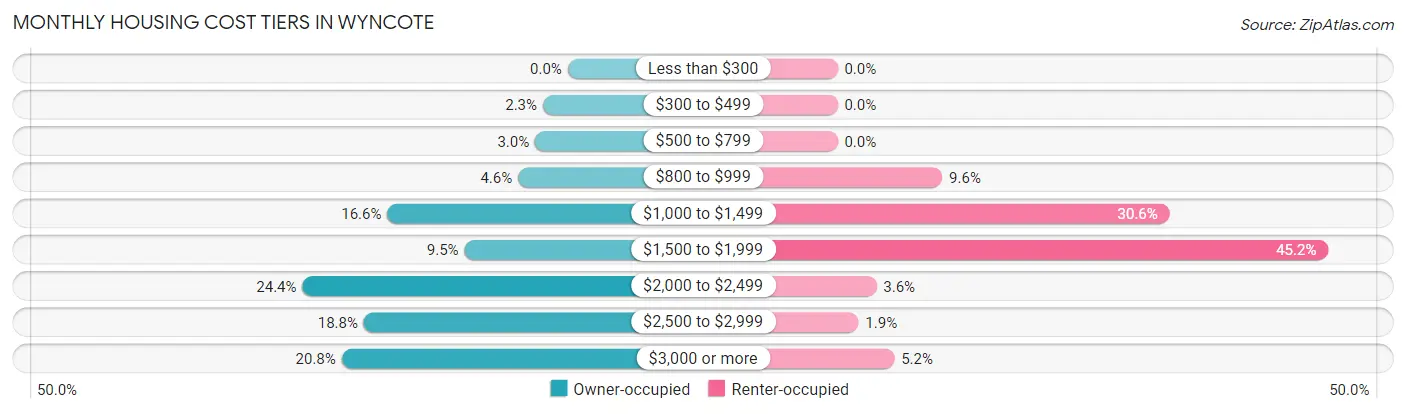
| Monthly Cost | Owner-occupied | Renter-occupied |
| Less than $300 | 0 (0.0%) | 0 (0.0%) |
| $300 to $499 | 19 (2.3%) | 0 (0.0%) |
| $500 to $799 | 25 (3.0%) | 0 (0.0%) |
| $800 to $999 | 38 (4.6%) | 35 (9.6%) |
| $1,000 to $1,499 | 138 (16.6%) | 111 (30.6%) |
| $1,500 to $1,999 | 79 (9.5%) | 164 (45.2%) |
| $2,000 to $2,499 | 203 (24.4%) | 13 (3.6%) |
| $2,500 to $2,999 | 156 (18.8%) | 7 (1.9%) |
| $3,000 or more | 173 (20.8%) | 19 (5.2%) |
| Total | 831 (100.0%) | 363 (100.0%) |
Physical Housing Characteristics in Wyncote
Housing Structures in Wyncote
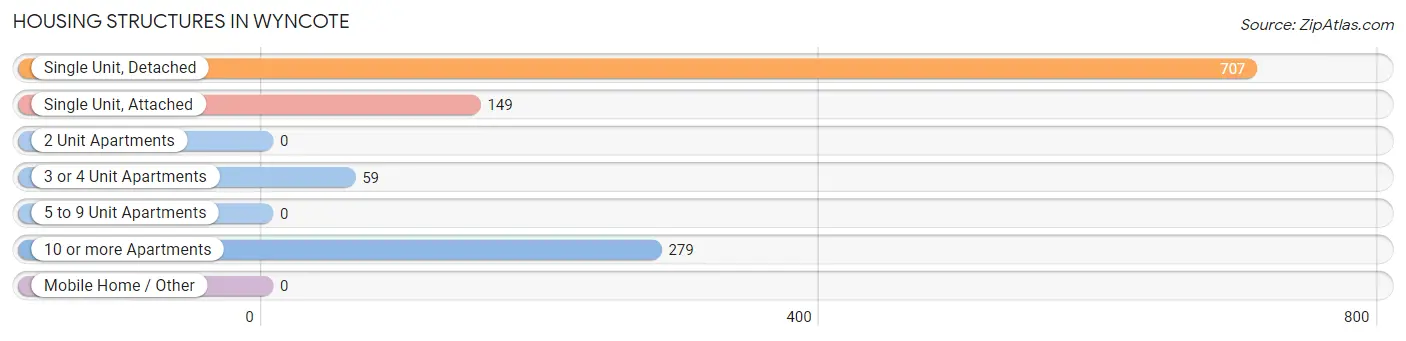
| Structure Type | # Housing Units | % Housing Units |
| Single Unit, Detached | 707 | 59.2% |
| Single Unit, Attached | 149 | 12.5% |
| 2 Unit Apartments | 0 | 0.0% |
| 3 or 4 Unit Apartments | 59 | 4.9% |
| 5 to 9 Unit Apartments | 0 | 0.0% |
| 10 or more Apartments | 279 | 23.4% |
| Mobile Home / Other | 0 | 0.0% |
| Total | 1,194 | 100.0% |
Housing Structures by Occupancy in Wyncote
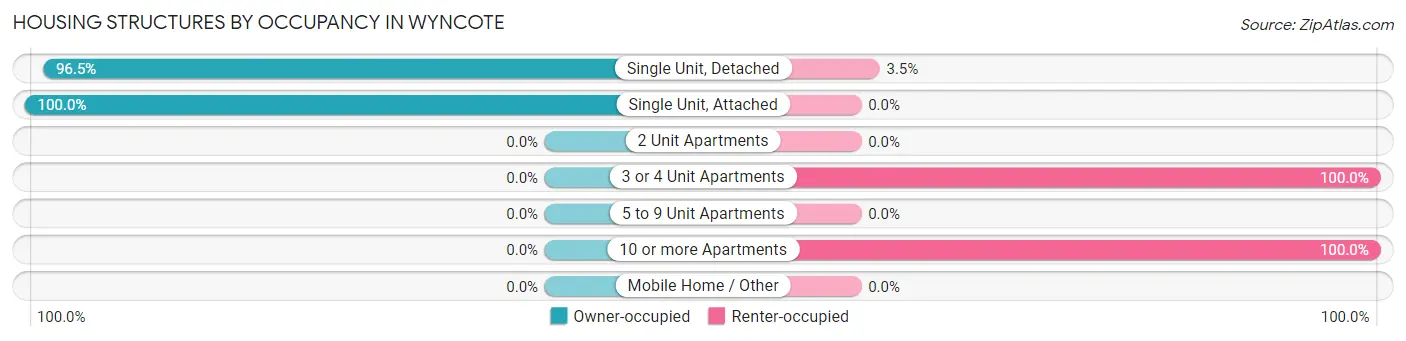
| Structure Type | Owner-occupied | Renter-occupied |
| Single Unit, Detached | 682 (96.5%) | 25 (3.5%) |
| Single Unit, Attached | 149 (100.0%) | 0 (0.0%) |
| 2 Unit Apartments | 0 (0.0%) | 0 (0.0%) |
| 3 or 4 Unit Apartments | 0 (0.0%) | 59 (100.0%) |
| 5 to 9 Unit Apartments | 0 (0.0%) | 0 (0.0%) |
| 10 or more Apartments | 0 (0.0%) | 279 (100.0%) |
| Mobile Home / Other | 0 (0.0%) | 0 (0.0%) |
| Total | 831 (69.6%) | 363 (30.4%) |
Housing Structures by Number of Rooms in Wyncote
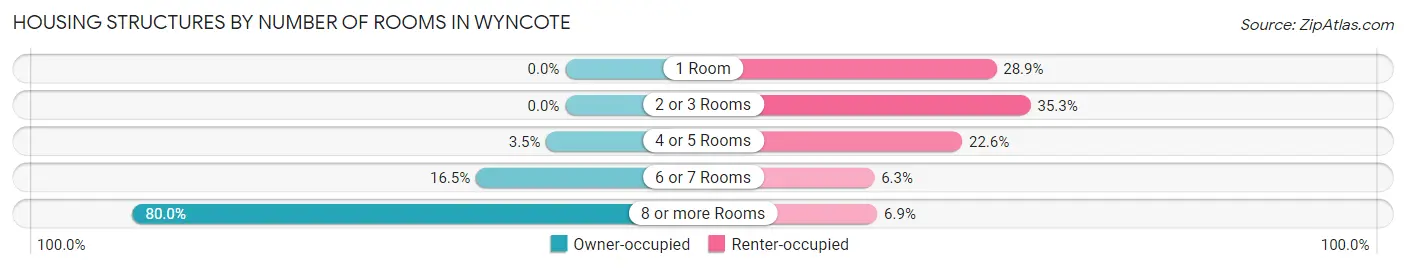
| Number of Rooms | Owner-occupied | Renter-occupied |
| 1 Room | 0 (0.0%) | 105 (28.9%) |
| 2 or 3 Rooms | 0 (0.0%) | 128 (35.3%) |
| 4 or 5 Rooms | 29 (3.5%) | 82 (22.6%) |
| 6 or 7 Rooms | 137 (16.5%) | 23 (6.3%) |
| 8 or more Rooms | 665 (80.0%) | 25 (6.9%) |
| Total | 831 (100.0%) | 363 (100.0%) |
Housing Structure by Heating Type in Wyncote
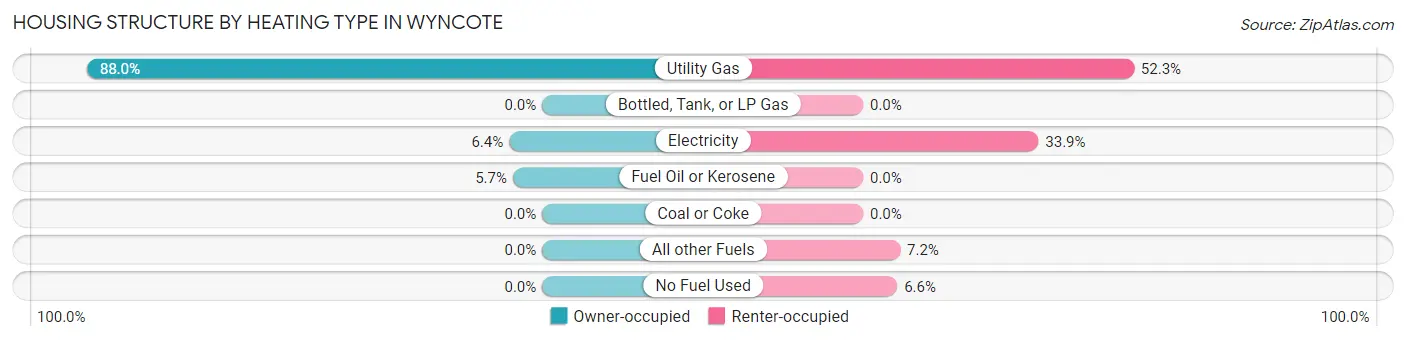
| Heating Type | Owner-occupied | Renter-occupied |
| Utility Gas | 731 (88.0%) | 190 (52.3%) |
| Bottled, Tank, or LP Gas | 0 (0.0%) | 0 (0.0%) |
| Electricity | 53 (6.4%) | 123 (33.9%) |
| Fuel Oil or Kerosene | 47 (5.7%) | 0 (0.0%) |
| Coal or Coke | 0 (0.0%) | 0 (0.0%) |
| All other Fuels | 0 (0.0%) | 26 (7.2%) |
| No Fuel Used | 0 (0.0%) | 24 (6.6%) |
| Total | 831 (100.0%) | 363 (100.0%) |
Household Vehicle Usage in Wyncote
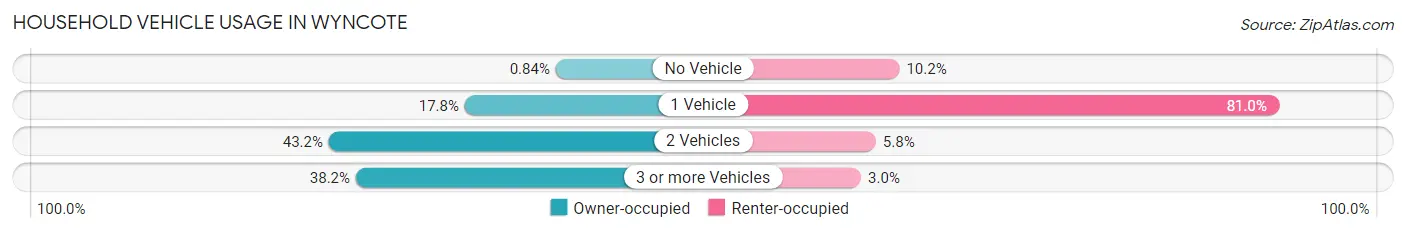
| Vehicles per Household | Owner-occupied | Renter-occupied |
| No Vehicle | 7 (0.8%) | 37 (10.2%) |
| 1 Vehicle | 148 (17.8%) | 294 (81.0%) |
| 2 Vehicles | 359 (43.2%) | 21 (5.8%) |
| 3 or more Vehicles | 317 (38.2%) | 11 (3.0%) |
| Total | 831 (100.0%) | 363 (100.0%) |
Real Estate & Mortgages in Wyncote
Real Estate and Mortgage Overview in Wyncote
| Characteristic | Without Mortgage | With Mortgage |
| Housing Units | 382 | 449 |
| Median Property Value | $415,600 | $381,800 |
| Median Household Income | $148,513 | $240 |
| Monthly Housing Costs | $1,501 | $173 |
| Real Estate Taxes | $10,001 | $0 |
Property Value by Mortgage Status in Wyncote
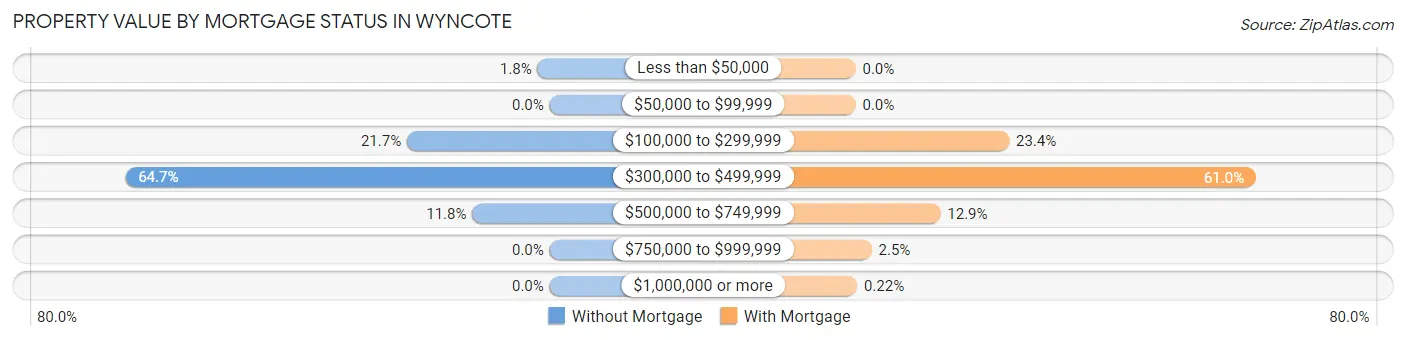
| Property Value | Without Mortgage | With Mortgage |
| Less than $50,000 | 7 (1.8%) | 0 (0.0%) |
| $50,000 to $99,999 | 0 (0.0%) | 0 (0.0%) |
| $100,000 to $299,999 | 83 (21.7%) | 105 (23.4%) |
| $300,000 to $499,999 | 247 (64.7%) | 274 (61.0%) |
| $500,000 to $749,999 | 45 (11.8%) | 58 (12.9%) |
| $750,000 to $999,999 | 0 (0.0%) | 11 (2.5%) |
| $1,000,000 or more | 0 (0.0%) | 1 (0.2%) |
| Total | 382 (100.0%) | 449 (100.0%) |
Household Income by Mortgage Status in Wyncote
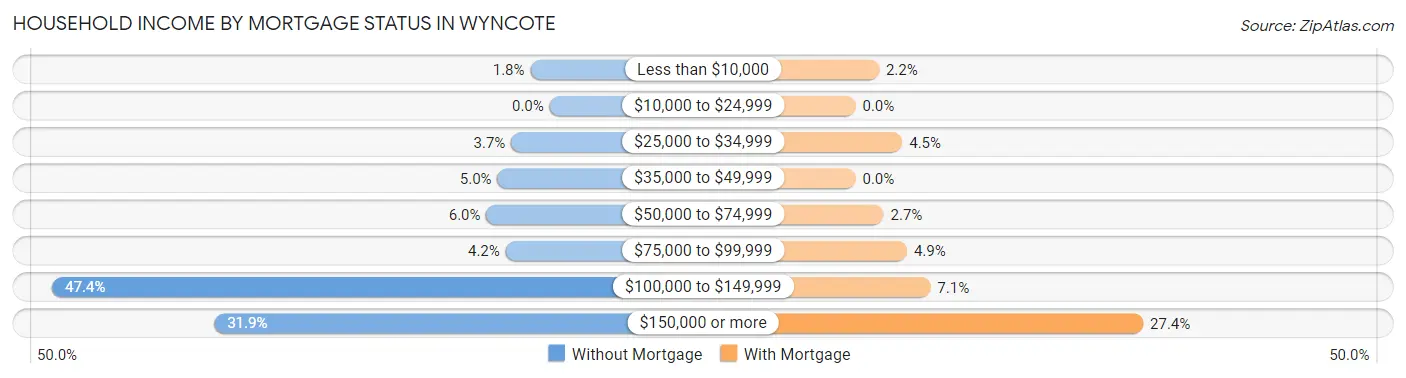
| Household Income | Without Mortgage | With Mortgage |
| Less than $10,000 | 7 (1.8%) | 10 (2.2%) |
| $10,000 to $24,999 | 0 (0.0%) | 0 (0.0%) |
| $25,000 to $34,999 | 14 (3.7%) | 20 (4.4%) |
| $35,000 to $49,999 | 19 (5.0%) | 0 (0.0%) |
| $50,000 to $74,999 | 23 (6.0%) | 12 (2.7%) |
| $75,000 to $99,999 | 16 (4.2%) | 22 (4.9%) |
| $100,000 to $149,999 | 181 (47.4%) | 32 (7.1%) |
| $150,000 or more | 122 (31.9%) | 123 (27.4%) |
| Total | 382 (100.0%) | 449 (100.0%) |
Property Value to Household Income Ratio in Wyncote
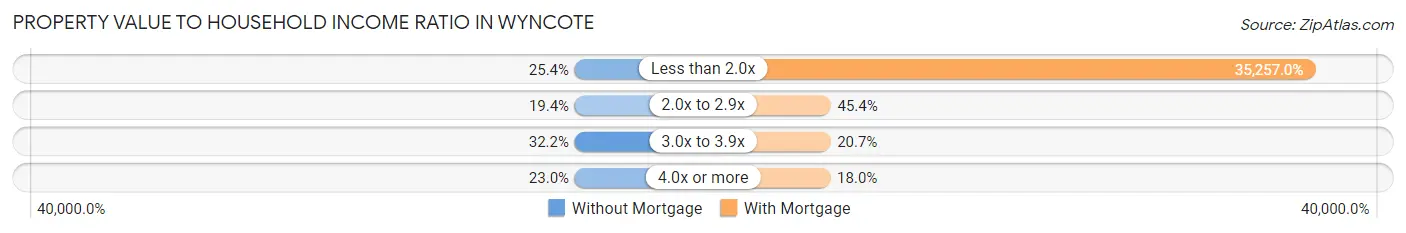
| Value-to-Income Ratio | Without Mortgage | With Mortgage |
| Less than 2.0x | 97 (25.4%) | 158,304 (35,257.0%) |
| 2.0x to 2.9x | 74 (19.4%) | 204 (45.4%) |
| 3.0x to 3.9x | 123 (32.2%) | 93 (20.7%) |
| 4.0x or more | 88 (23.0%) | 81 (18.0%) |
| Total | 382 (100.0%) | 449 (100.0%) |
Real Estate Taxes by Mortgage Status in Wyncote
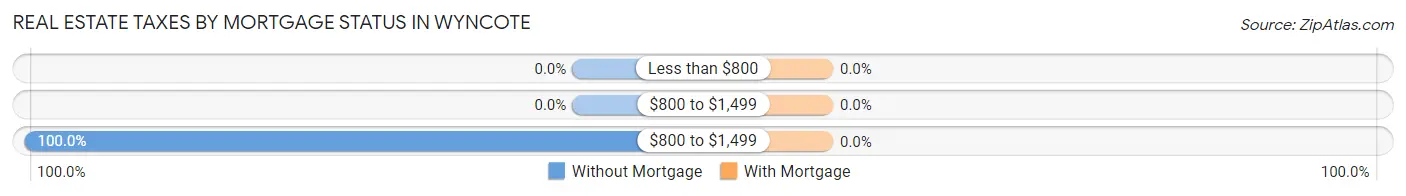
| Property Taxes | Without Mortgage | With Mortgage |
| Less than $800 | 0 (0.0%) | 0 (0.0%) |
| $800 to $1,499 | 0 (0.0%) | 0 (0.0%) |
| $800 to $1,499 | 382 (100.0%) | 0 (0.0%) |
| Total | 382 (100.0%) | 449 (100.0%) |
Health & Disability in Wyncote
Health Insurance Coverage by Age in Wyncote
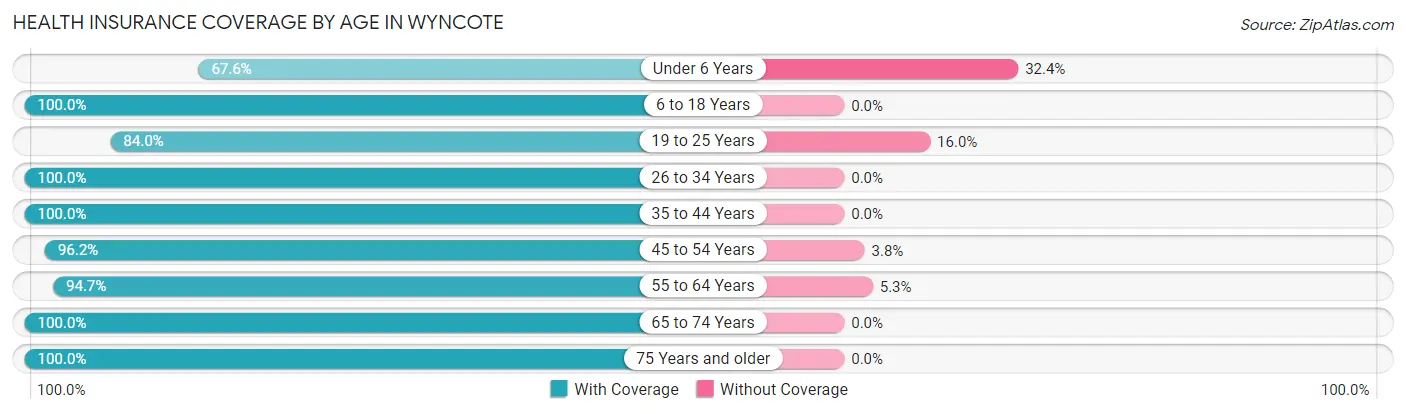
| Age Bracket | With Coverage | Without Coverage |
| Under 6 Years | 125 (67.6%) | 60 (32.4%) |
| 6 to 18 Years | 507 (100.0%) | 0 (0.0%) |
| 19 to 25 Years | 299 (84.0%) | 57 (16.0%) |
| 26 to 34 Years | 237 (100.0%) | 0 (0.0%) |
| 35 to 44 Years | 383 (100.0%) | 0 (0.0%) |
| 45 to 54 Years | 432 (96.2%) | 17 (3.8%) |
| 55 to 64 Years | 357 (94.7%) | 20 (5.3%) |
| 65 to 74 Years | 362 (100.0%) | 0 (0.0%) |
| 75 Years and older | 181 (100.0%) | 0 (0.0%) |
| Total | 2,883 (94.9%) | 154 (5.1%) |
Health Insurance Coverage by Citizenship Status in Wyncote
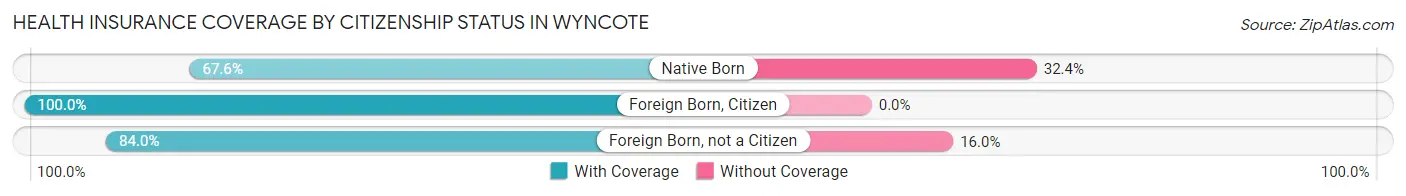
| Citizenship Status | With Coverage | Without Coverage |
| Native Born | 125 (67.6%) | 60 (32.4%) |
| Foreign Born, Citizen | 507 (100.0%) | 0 (0.0%) |
| Foreign Born, not a Citizen | 299 (84.0%) | 57 (16.0%) |
Health Insurance Coverage by Household Income in Wyncote
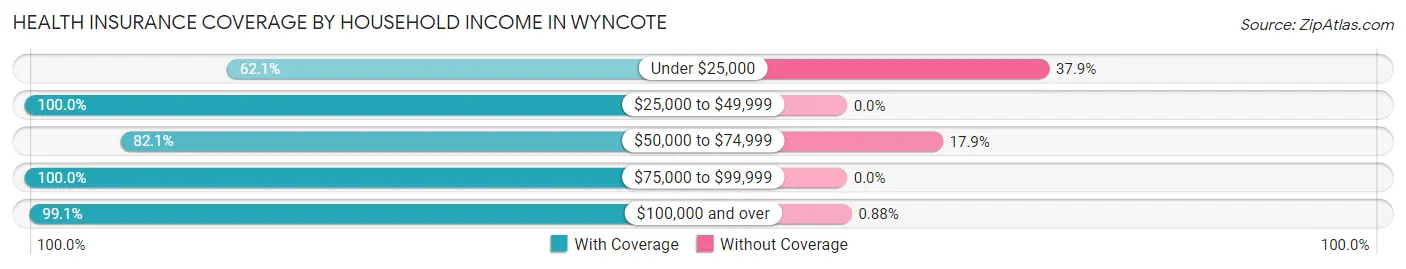
| Household Income | With Coverage | Without Coverage |
| Under $25,000 | 154 (62.1%) | 94 (37.9%) |
| $25,000 to $49,999 | 125 (100.0%) | 0 (0.0%) |
| $50,000 to $74,999 | 183 (82.1%) | 40 (17.9%) |
| $75,000 to $99,999 | 149 (100.0%) | 0 (0.0%) |
| $100,000 and over | 2,259 (99.1%) | 20 (0.9%) |
Public vs Private Health Insurance Coverage by Age in Wyncote
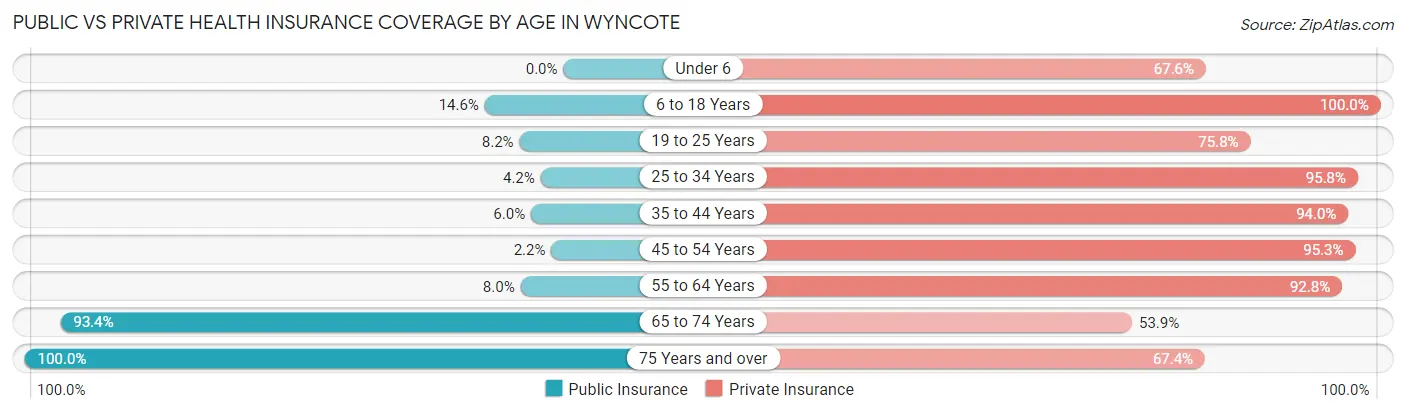
| Age Bracket | Public Insurance | Private Insurance |
| Under 6 | 0 (0.0%) | 125 (67.6%) |
| 6 to 18 Years | 74 (14.6%) | 507 (100.0%) |
| 19 to 25 Years | 29 (8.2%) | 270 (75.8%) |
| 25 to 34 Years | 10 (4.2%) | 227 (95.8%) |
| 35 to 44 Years | 23 (6.0%) | 360 (94.0%) |
| 45 to 54 Years | 10 (2.2%) | 428 (95.3%) |
| 55 to 64 Years | 30 (8.0%) | 350 (92.8%) |
| 65 to 74 Years | 338 (93.4%) | 195 (53.9%) |
| 75 Years and over | 181 (100.0%) | 122 (67.4%) |
| Total | 695 (22.9%) | 2,584 (85.1%) |
Disability Status by Sex by Age in Wyncote
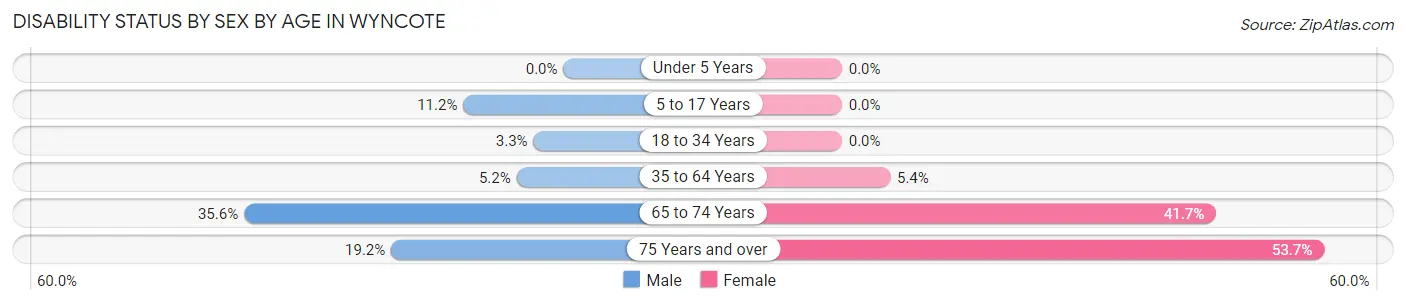
| Age Bracket | Male | Female |
| Under 5 Years | 0 (0.0%) | 0 (0.0%) |
| 5 to 17 Years | 35 (11.2%) | 0 (0.0%) |
| 18 to 34 Years | 13 (3.3%) | 0 (0.0%) |
| 35 to 64 Years | 31 (5.2%) | 33 (5.4%) |
| 65 to 74 Years | 69 (35.6%) | 70 (41.7%) |
| 75 Years and over | 14 (19.2%) | 58 (53.7%) |
Disability Class by Sex by Age in Wyncote
Disability Class: Hearing Difficulty
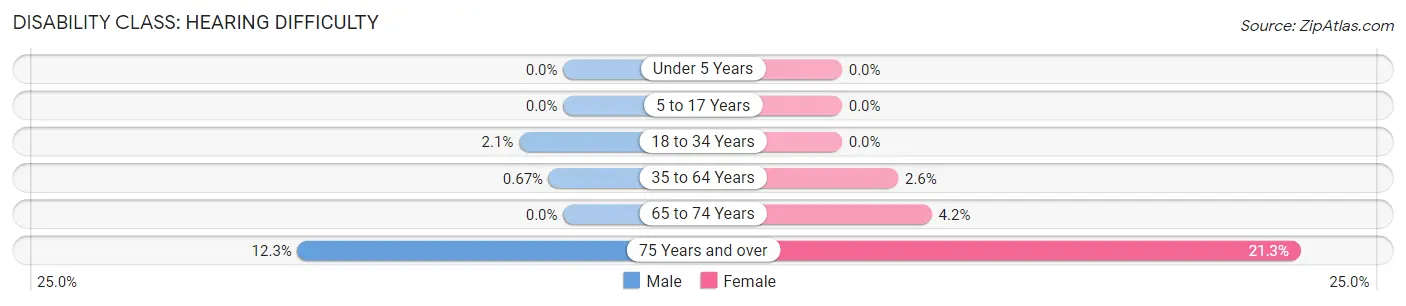
| Age Bracket | Male | Female |
| Under 5 Years | 0 (0.0%) | 0 (0.0%) |
| 5 to 17 Years | 0 (0.0%) | 0 (0.0%) |
| 18 to 34 Years | 8 (2.1%) | 0 (0.0%) |
| 35 to 64 Years | 4 (0.7%) | 16 (2.6%) |
| 65 to 74 Years | 0 (0.0%) | 7 (4.2%) |
| 75 Years and over | 9 (12.3%) | 23 (21.3%) |
Disability Class: Vision Difficulty
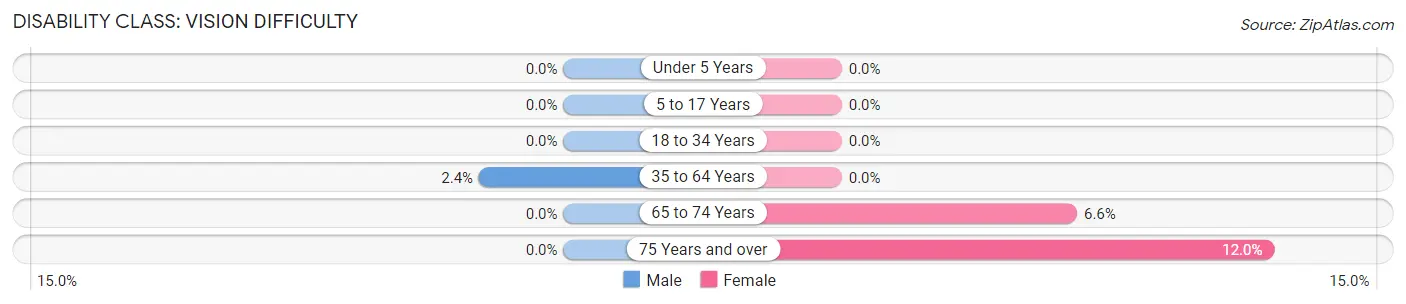
| Age Bracket | Male | Female |
| Under 5 Years | 0 (0.0%) | 0 (0.0%) |
| 5 to 17 Years | 0 (0.0%) | 0 (0.0%) |
| 18 to 34 Years | 0 (0.0%) | 0 (0.0%) |
| 35 to 64 Years | 14 (2.4%) | 0 (0.0%) |
| 65 to 74 Years | 0 (0.0%) | 11 (6.6%) |
| 75 Years and over | 0 (0.0%) | 13 (12.0%) |
Disability Class: Cognitive Difficulty
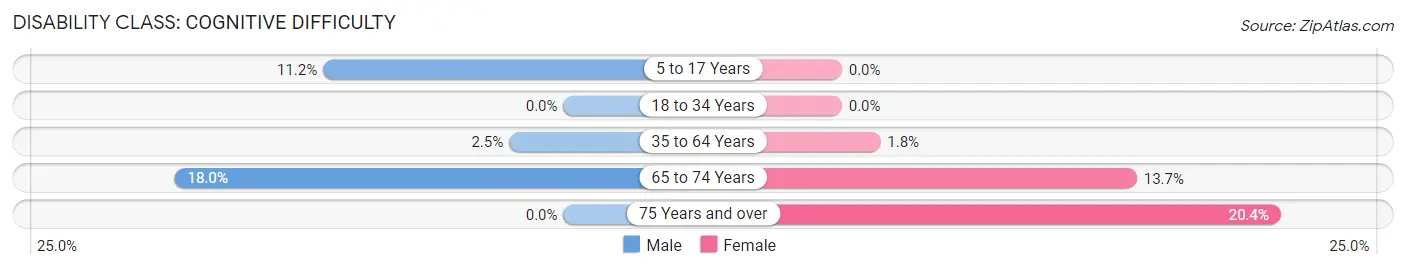
| Age Bracket | Male | Female |
| 5 to 17 Years | 35 (11.2%) | 0 (0.0%) |
| 18 to 34 Years | 0 (0.0%) | 0 (0.0%) |
| 35 to 64 Years | 15 (2.5%) | 11 (1.8%) |
| 65 to 74 Years | 35 (18.0%) | 23 (13.7%) |
| 75 Years and over | 0 (0.0%) | 22 (20.4%) |
Disability Class: Ambulatory Difficulty
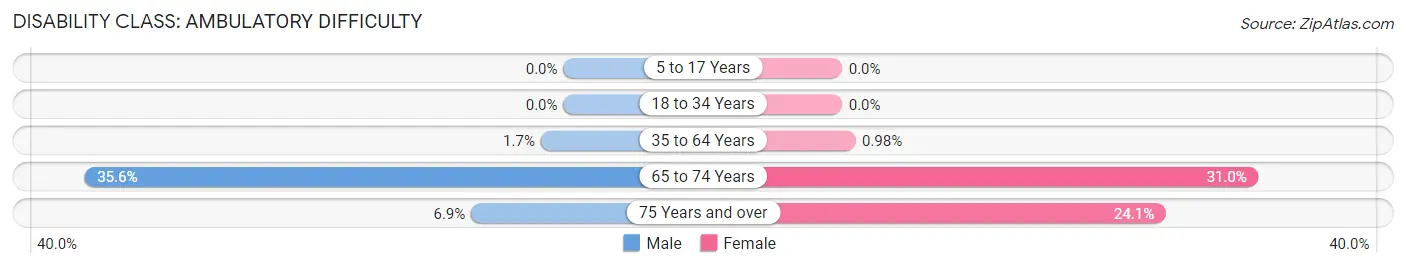
| Age Bracket | Male | Female |
| 5 to 17 Years | 0 (0.0%) | 0 (0.0%) |
| 18 to 34 Years | 0 (0.0%) | 0 (0.0%) |
| 35 to 64 Years | 10 (1.7%) | 6 (1.0%) |
| 65 to 74 Years | 69 (35.6%) | 52 (30.9%) |
| 75 Years and over | 5 (6.9%) | 26 (24.1%) |
Disability Class: Self-Care Difficulty
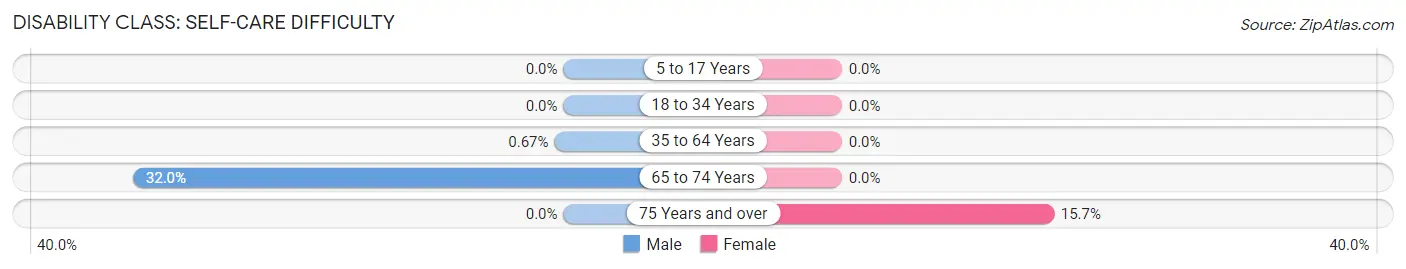
| Age Bracket | Male | Female |
| 5 to 17 Years | 0 (0.0%) | 0 (0.0%) |
| 18 to 34 Years | 0 (0.0%) | 0 (0.0%) |
| 35 to 64 Years | 4 (0.7%) | 0 (0.0%) |
| 65 to 74 Years | 62 (32.0%) | 0 (0.0%) |
| 75 Years and over | 0 (0.0%) | 17 (15.7%) |
Technology Access in Wyncote
Computing Device Access in Wyncote
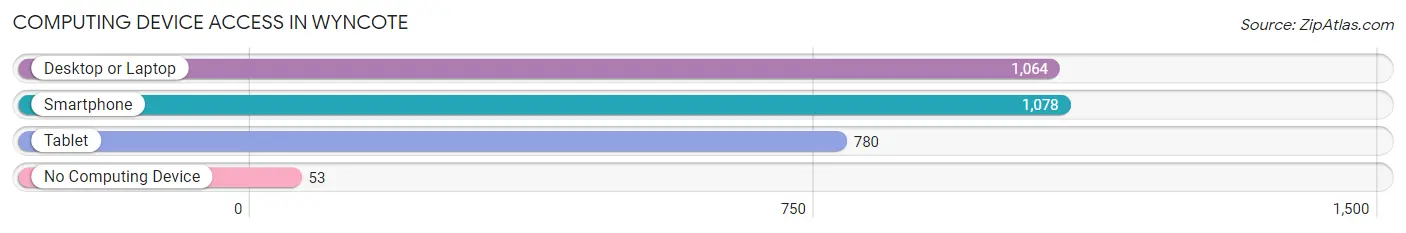
| Device Type | # Households | % Households |
| Desktop or Laptop | 1,064 | 89.1% |
| Smartphone | 1,078 | 90.3% |
| Tablet | 780 | 65.3% |
| No Computing Device | 53 | 4.4% |
| Total | 1,194 | 100.0% |
Internet Access in Wyncote
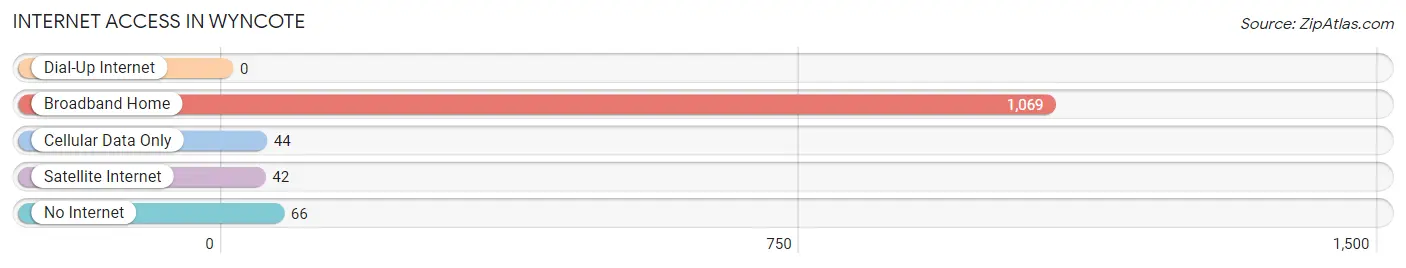
| Internet Type | # Households | % Households |
| Dial-Up Internet | 0 | 0.0% |
| Broadband Home | 1,069 | 89.5% |
| Cellular Data Only | 44 | 3.7% |
| Satellite Internet | 42 | 3.5% |
| No Internet | 66 | 5.5% |
| Total | 1,194 | 100.0% |
Wyncote Summary
Wyncote is a small unincorporated community located in Cheltenham Township, Montgomery County, Pennsylvania. It is located approximately 10 miles north of Philadelphia and is part of the Philadelphia metropolitan area. The population of Wyncote was 4,072 at the 2010 census.
History
Wyncote was founded in 1883 by the Pennsylvania Railroad as a planned community. The name Wyncote is derived from the Welsh language and means “white cottage”. The community was designed to be a model railroad town, with the Pennsylvania Railroad providing housing, schools, churches, and other amenities for its employees.
The community was originally planned to be a self-contained village, with its own post office, stores, and other services. However, the Pennsylvania Railroad eventually sold off much of the land to developers, and the village was never fully realized.
Geography
Wyncote is located at 40°6′17″N 75°9′45″W (40.104722, -75.1625). According to the United States Census Bureau, the CDP has a total area of 0.7 square miles (1.8 km2), all of it land.
Economy
Wyncote is primarily a residential community, with no major employers located within the community. The majority of residents are employed in the nearby cities of Philadelphia and Norristown.
Demographics
As of the 2010 census, there were 4,072 people, 1,717 households, and 1,072 families residing in the CDP. The population density was 5,845.3 people per square mile (2,259.2/km2). There were 1,845 housing units at an average density of 2,637.3/sq mi (1,015.2/km2). The racial makeup of the CDP was 79.2% White, 13.2% African American, 0.2% Native American, 3.2% Asian, 0.1% Pacific Islander, 1.7% from other races, and 2.0% from two or more races. Hispanic or Latino of any race were 4.2% of the population.
There were 1,717 households, out of which 24.2% had children under the age of 18 living with them, 44.2% were married couples living together, 11.7% had a female householder with no husband present, and 39.7% were non-families. 33.2% of all households were made up of individuals, and 12.2% had someone living alone who was 65 years of age or older. The average household size was 2.36 and the average family size was 3.05.
In the CDP, the population was spread out, with 20.2% under the age of 18, 6.7% from 18 to 24, 28.2% from 25 to 44, 28.2% from 45 to 64, and 16.7% who were 65 years of age or older. The median age was 41 years. For every 100 females, there were 90.2 males. For every 100 females age 18 and over, there were 86.3 males.
The median income for a household in the CDP was $50,938, and the median income for a family was $62,917. Males had a median income of $45,000 versus $35,000 for females. The per capita income for the CDP was $27,945. About 4.2% of families and 6.2% of the population were below the poverty line, including 8.2% of those under age 18 and 4.2% of those age 65 or over.
Common Questions
What is the Total Population of Wyncote?
Total Population of Wyncote is 3,420.
What is the Total Male Population of Wyncote?
Total Male Population of Wyncote is 1,834.
What is the Total Female Population of Wyncote?
Total Female Population of Wyncote is 1,586.
What is the Ratio of Males per 100 Females in Wyncote?
There are 115.64 Males per 100 Females in Wyncote.
What is the Ratio of Females per 100 Males in Wyncote?
There are 86.48 Females per 100 Males in Wyncote.
What is the Median Population Age in Wyncote?
Median Population Age in Wyncote is 45.1 Years.
What is the Average Family Size in Wyncote
Average Family Size in Wyncote is 3.2 People.
What is the Average Household Size in Wyncote
Average Household Size in Wyncote is 2.5 People.
What is Per Capita Income in Wyncote?
Per Capita income in Wyncote is $54,271.
What is the Median Family Income in Wyncote?
Median Family Income in Wyncote is $148,933.
What is the Median Household income in Wyncote?
Median Household Income in Wyncote is $130,833.
What is Income or Wage Gap in Wyncote?
Income or Wage Gap in Wyncote is 7.2%.
Women in Wyncote earn 92.8 cents for every dollar earned by a man.
What is Inequality or Gini Index in Wyncote?
Inequality or Gini Index in Wyncote is 0.45.
How Large is the Labor Force in Wyncote?
There are 1,582 People in the Labor Forcein in Wyncote.
What is the Percentage of People in the Labor Force in Wyncote?
55.3% of People are in the Labor Force in Wyncote.
What is the Unemployment Rate in Wyncote?
Unemployment Rate in Wyncote is 1.0%.