Conshohocken borough, PA
Conshohocken borough Overview
9,182
TOTAL POPULATION
4,671
MALE POPULATION
4,511
FEMALE POPULATION
103.55
MALES / 100 FEMALES
96.57
FEMALES / 100 MALES
32.3
MEDIAN AGE
2.7
AVG FAMILY SIZE
2.1
AVG HOUSEHOLD SIZE
$63,628
PER CAPITA INCOME
$135,072
AVG FAMILY INCOME
$114,523
AVG HOUSEHOLD INCOME
3.9%
WAGE / INCOME GAP [ % ]
96.1¢/ $1
WAGE / INCOME GAP [ $ ]
0.38
INEQUALITY / GINI INDEX
6,743
LABOR FORCE [ PEOPLE ]
83.5%
PERCENT IN LABOR FORCE
3.5%
UNEMPLOYMENT RATE
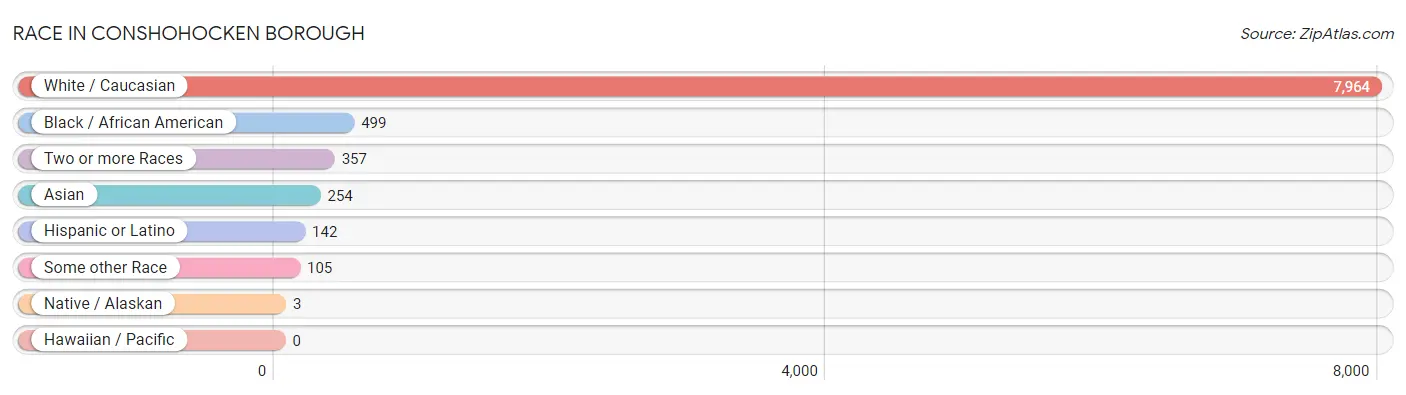
Race in Conshohocken borough
The most populous races in Conshohocken borough are White / Caucasian (7,964 | 86.7%), Black / African American (499 | 5.4%), and Two or more Races (357 | 3.9%).
| Race | # Population | % Population |
| Asian | 254 | 2.8% |
| Black / African American | 499 | 5.4% |
| Hawaiian / Pacific | 0 | 0.0% |
| Hispanic or Latino | 142 | 1.5% |
| Native / Alaskan | 3 | 0.0% |
| White / Caucasian | 7,964 | 86.7% |
| Two or more Races | 357 | 3.9% |
| Some other Race | 105 | 1.1% |
| Total | 9,182 | 100.0% |
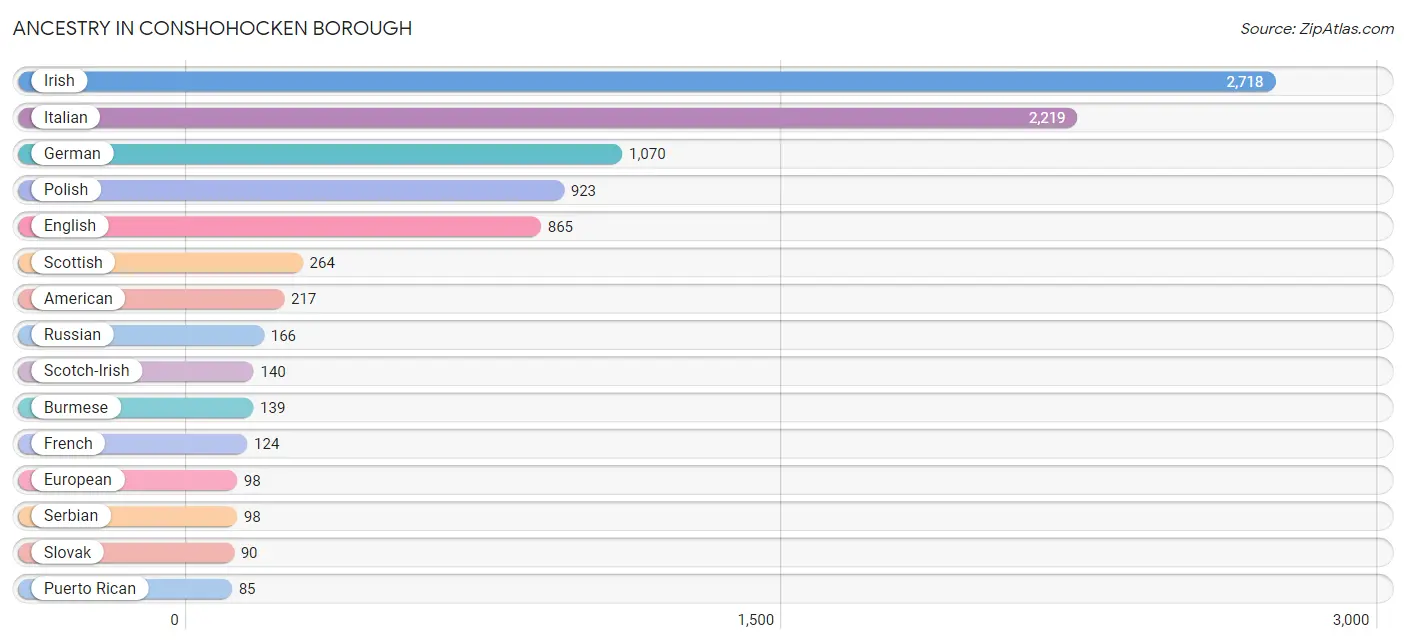
Ancestry in Conshohocken borough
The most populous ancestries reported in Conshohocken borough are Irish (2,718 | 29.6%), Italian (2,219 | 24.2%), German (1,070 | 11.7%), Polish (923 | 10.1%), and English (865 | 9.4%), together accounting for 84.9% of all Conshohocken borough residents.
| Ancestry | # Population | % Population |
| African | 19 | 0.2% |
| American | 217 | 2.4% |
| Arab | 35 | 0.4% |
| Argentinean | 9 | 0.1% |
| Austrian | 62 | 0.7% |
| Barbadian | 11 | 0.1% |
| Bhutanese | 20 | 0.2% |
| British | 61 | 0.7% |
| Burmese | 139 | 1.5% |
| Cherokee | 9 | 0.1% |
| Colombian | 11 | 0.1% |
| Czech | 65 | 0.7% |
| Danish | 18 | 0.2% |
| Dominican | 24 | 0.3% |
| Dutch | 46 | 0.5% |
| Eastern European | 59 | 0.6% |
| English | 865 | 9.4% |
| Estonian | 15 | 0.2% |
| European | 98 | 1.1% |
| French | 124 | 1.3% |
| French Canadian | 7 | 0.1% |
| German | 1,070 | 11.7% |
| Greek | 79 | 0.9% |
| Hungarian | 70 | 0.8% |
| Indian (Asian) | 54 | 0.6% |
| Irish | 2,718 | 29.6% |
| Italian | 2,219 | 24.2% |
| Lebanese | 24 | 0.3% |
| Lithuanian | 26 | 0.3% |
| Mexican | 13 | 0.1% |
| Norwegian | 23 | 0.3% |
| Pennsylvania German | 74 | 0.8% |
| Polish | 923 | 10.1% |
| Portuguese | 10 | 0.1% |
| Puerto Rican | 85 | 0.9% |
| Russian | 166 | 1.8% |
| Scandinavian | 8 | 0.1% |
| Scotch-Irish | 140 | 1.5% |
| Scottish | 264 | 2.9% |
| Serbian | 98 | 1.1% |
| Slovak | 90 | 1.0% |
| South American | 20 | 0.2% |
| Sri Lankan | 1 | 0.0% |
| Subsaharan African | 19 | 0.2% |
| Swedish | 62 | 0.7% |
| Syrian | 11 | 0.1% |
| Thai | 70 | 0.8% |
| Tongan | 37 | 0.4% |
| Ukrainian | 60 | 0.6% |
| Welsh | 55 | 0.6% | View All 50 Rows |
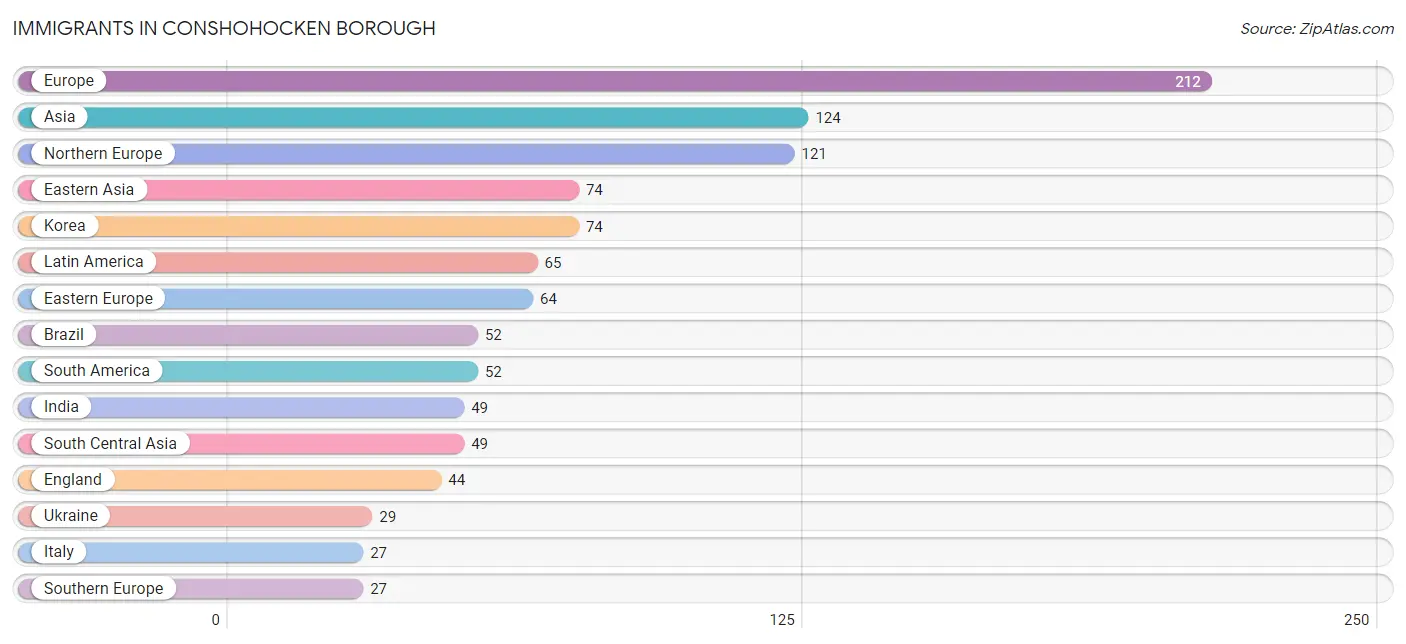
Immigrants in Conshohocken borough
The most numerous immigrant groups reported in Conshohocken borough came from Europe (212 | 2.3%), Asia (124 | 1.3%), Northern Europe (121 | 1.3%), Eastern Asia (74 | 0.8%), and Korea (74 | 0.8%), together accounting for 6.6% of all Conshohocken borough residents.
| Immigration Origin | # Population | % Population |
| Africa | 21 | 0.2% |
| Asia | 124 | 1.3% |
| Brazil | 52 | 0.6% |
| Caribbean | 13 | 0.1% |
| Dominican Republic | 13 | 0.1% |
| Eastern Asia | 74 | 0.8% |
| Eastern Europe | 64 | 0.7% |
| England | 44 | 0.5% |
| Europe | 212 | 2.3% |
| India | 49 | 0.5% |
| Italy | 27 | 0.3% |
| Korea | 74 | 0.8% |
| Latin America | 65 | 0.7% |
| Nigeria | 21 | 0.2% |
| Northern Europe | 121 | 1.3% |
| Poland | 25 | 0.3% |
| Russia | 10 | 0.1% |
| South America | 52 | 0.6% |
| South Central Asia | 49 | 0.5% |
| South Eastern Asia | 1 | 0.0% |
| Southern Europe | 27 | 0.3% |
| Ukraine | 29 | 0.3% |
| Vietnam | 1 | 0.0% |
| Western Africa | 21 | 0.2% | View All 24 Rows |
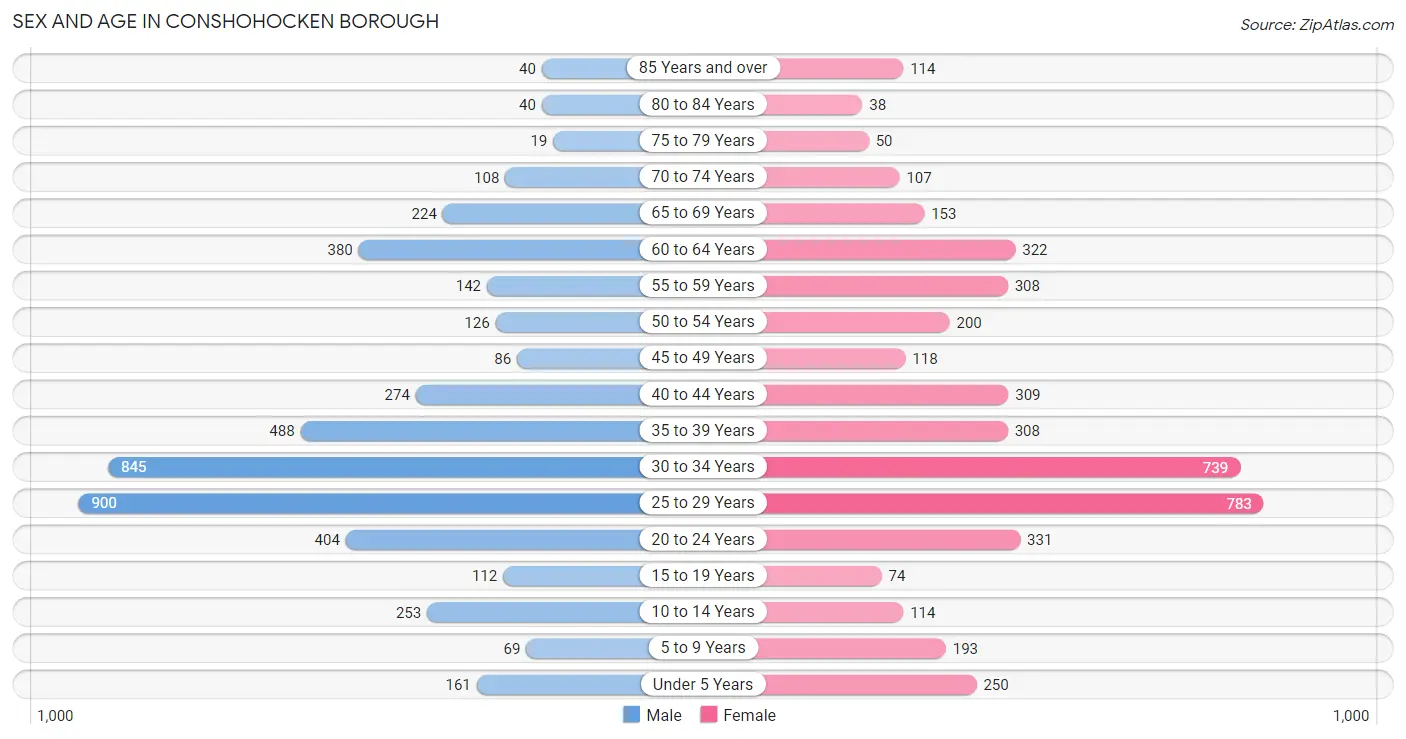
Sex and Age in Conshohocken borough
Sex and Age in Conshohocken borough
The most populous age groups in Conshohocken borough are 25 to 29 Years (900 | 19.3%) for men and 25 to 29 Years (783 | 17.4%) for women.
| Age Bracket | Male | Female |
| Under 5 Years | 161 (3.5%) | 250 (5.5%) |
| 5 to 9 Years | 69 (1.5%) | 193 (4.3%) |
| 10 to 14 Years | 253 (5.4%) | 114 (2.5%) |
| 15 to 19 Years | 112 (2.4%) | 74 (1.6%) |
| 20 to 24 Years | 404 (8.6%) | 331 (7.3%) |
| 25 to 29 Years | 900 (19.3%) | 783 (17.4%) |
| 30 to 34 Years | 845 (18.1%) | 739 (16.4%) |
| 35 to 39 Years | 488 (10.4%) | 308 (6.8%) |
| 40 to 44 Years | 274 (5.9%) | 309 (6.9%) |
| 45 to 49 Years | 86 (1.8%) | 118 (2.6%) |
| 50 to 54 Years | 126 (2.7%) | 200 (4.4%) |
| 55 to 59 Years | 142 (3.0%) | 308 (6.8%) |
| 60 to 64 Years | 380 (8.1%) | 322 (7.1%) |
| 65 to 69 Years | 224 (4.8%) | 153 (3.4%) |
| 70 to 74 Years | 108 (2.3%) | 107 (2.4%) |
| 75 to 79 Years | 19 (0.4%) | 50 (1.1%) |
| 80 to 84 Years | 40 (0.9%) | 38 (0.8%) |
| 85 Years and over | 40 (0.9%) | 114 (2.5%) |
| Total | 4,671 (100.0%) | 4,511 (100.0%) |
Families and Households in Conshohocken borough
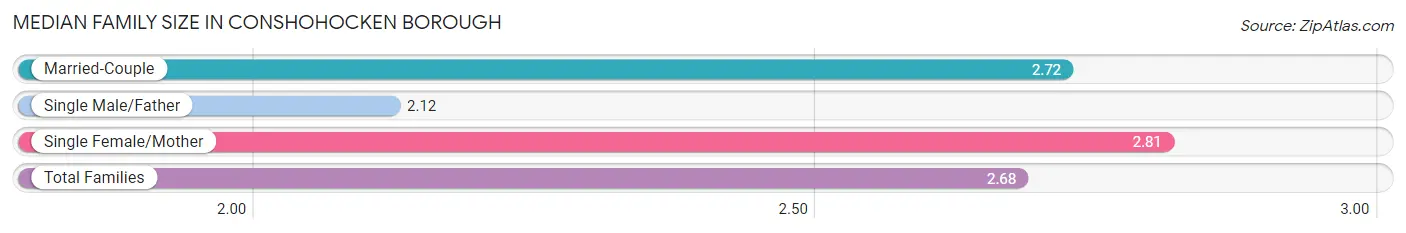
Median Family Size in Conshohocken borough
The median family size in Conshohocken borough is 2.68 persons per family, with single female/mother families (372 | 16.3%) accounting for the largest median family size of 2.81 persons per family. On the other hand, single male/father families (188 | 8.2%) represent the smallest median family size with 2.12 persons per family.
| Family Type | # Families | Family Size |
| Married-Couple | 1,727 (75.5%) | 2.72 |
| Single Male/Father | 188 (8.2%) | 2.12 |
| Single Female/Mother | 372 (16.3%) | 2.81 |
| Total Families | 2,287 (100.0%) | 2.68 |
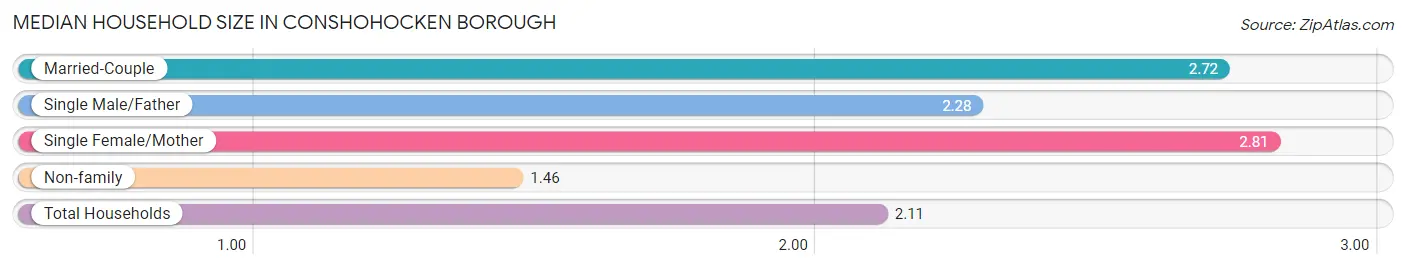
Median Household Size in Conshohocken borough
The median household size in Conshohocken borough is 2.11 persons per household, with single female/mother households (372 | 8.6%) accounting for the largest median household size of 2.81 persons per household. non-family households (2,046 | 47.2%) represent the smallest median household size with 1.46 persons per household.
| Household Type | # Households | Household Size |
| Married-Couple | 1,727 (39.9%) | 2.72 |
| Single Male/Father | 188 (4.3%) | 2.28 |
| Single Female/Mother | 372 (8.6%) | 2.81 |
| Non-family | 2,046 (47.2%) | 1.46 |
| Total Households | 4,333 (100.0%) | 2.11 |
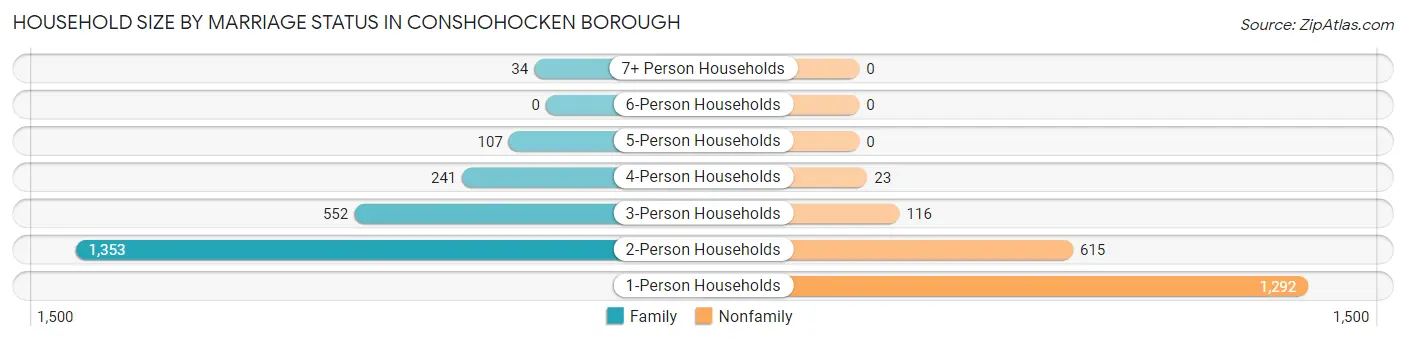
Household Size by Marriage Status in Conshohocken borough
Out of a total of 4,333 households in Conshohocken borough, 2,287 (52.8%) are family households, while 2,046 (47.2%) are nonfamily households. The most numerous type of family households are 2-person households, comprising 1,353, and the most common type of nonfamily households are 1-person households, comprising 1,292.
| Household Size | Family Households | Nonfamily Households |
| 1-Person Households | - | 1,292 (29.8%) |
| 2-Person Households | 1,353 (31.2%) | 615 (14.2%) |
| 3-Person Households | 552 (12.7%) | 116 (2.7%) |
| 4-Person Households | 241 (5.6%) | 23 (0.5%) |
| 5-Person Households | 107 (2.5%) | 0 (0.0%) |
| 6-Person Households | 0 (0.0%) | 0 (0.0%) |
| 7+ Person Households | 34 (0.8%) | 0 (0.0%) |
| Total | 2,287 (52.8%) | 2,046 (47.2%) |
Female Fertility in Conshohocken borough
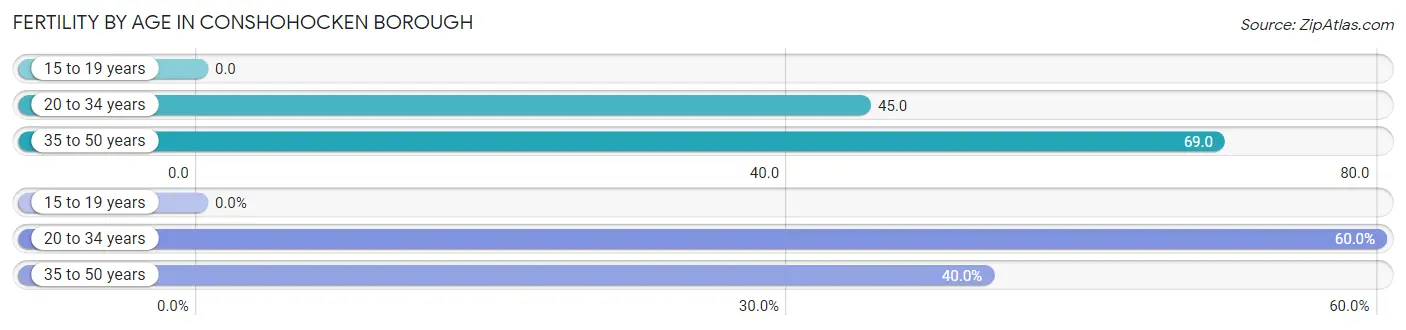
Fertility by Age in Conshohocken borough
Average fertility rate in Conshohocken borough is 51.0 births per 1,000 women. Women in the age bracket of 35 to 50 years have the highest fertility rate with 69.0 births per 1,000 women. Women in the age bracket of 20 to 34 years acount for 60.0% of all women with births.
| Age Bracket | Women with Births | Births / 1,000 Women |
| 15 to 19 years | 0 (0.0%) | 0.0 |
| 20 to 34 years | 84 (60.0%) | 45.0 |
| 35 to 50 years | 56 (40.0%) | 69.0 |
| Total | 140 (100.0%) | 51.0 |
Fertility by Age by Marriage Status in Conshohocken borough
78.6% of women with births (140) in Conshohocken borough are married. The highest percentage of unmarried women with births falls into 20 to 34 years age bracket with 35.7% of them unmarried at the time of birth, while the lowest percentage of unmarried women with births belong to 35 to 50 years age bracket with 0.0% of them unmarried.
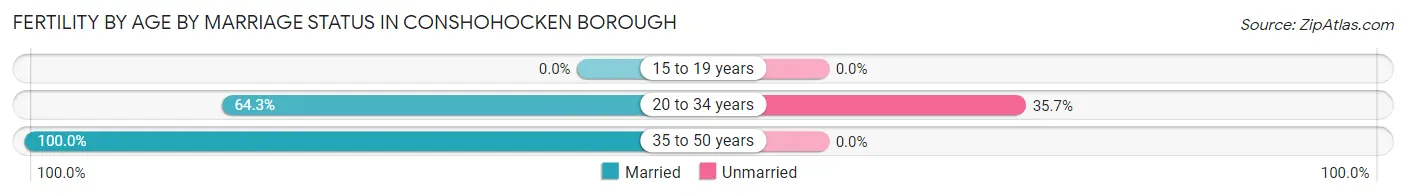
| Age Bracket | Married | Unmarried |
| 15 to 19 years | 0 (0.0%) | 0 (0.0%) |
| 20 to 34 years | 54 (64.3%) | 30 (35.7%) |
| 35 to 50 years | 56 (100.0%) | 0 (0.0%) |
| Total | 110 (78.6%) | 30 (21.4%) |
Fertility by Education in Conshohocken borough
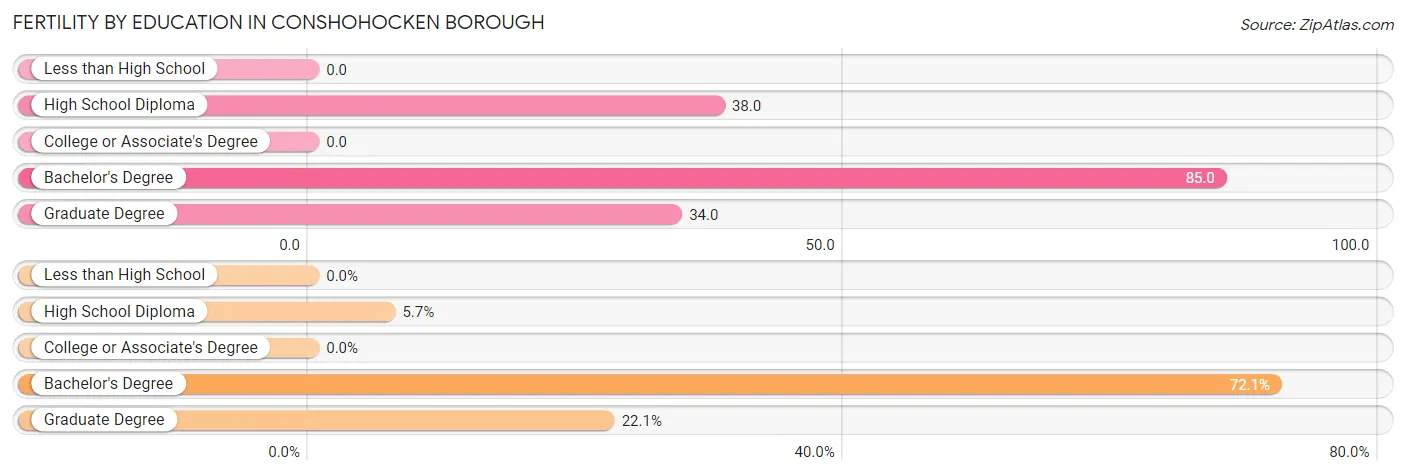
| Educational Attainment | Women with Births | Births / 1,000 Women |
| Less than High School | 0 (0.0%) | 0.0 |
| High School Diploma | 8 (5.7%) | 38.0 |
| College or Associate's Degree | 0 (0.0%) | 0.0 |
| Bachelor's Degree | 101 (72.1%) | 85.0 |
| Graduate Degree | 31 (22.1%) | 34.0 |
| Total | 140 (100.0%) | 51.0 |
Fertility by Education by Marriage Status in Conshohocken borough
21.4% of women with births in Conshohocken borough are unmarried. Women with the educational attainment of high school diploma are most likely to be married with 100.0% of them married at childbirth, while women with the educational attainment of bachelor's degree are least likely to be married with 29.7% of them unmarried at childbirth.
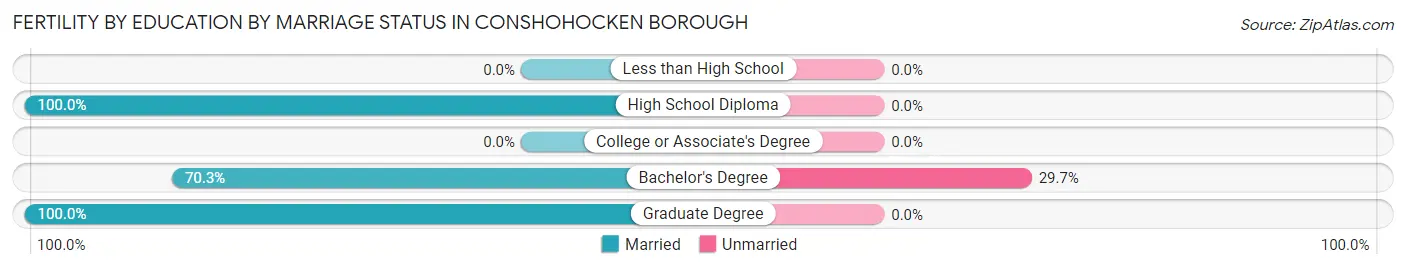
| Educational Attainment | Married | Unmarried |
| Less than High School | 0 (0.0%) | 0 (0.0%) |
| High School Diploma | 8 (100.0%) | 0 (0.0%) |
| College or Associate's Degree | 0 (0.0%) | 0 (0.0%) |
| Bachelor's Degree | 71 (70.3%) | 30 (29.7%) |
| Graduate Degree | 31 (100.0%) | 0 (0.0%) |
| Total | 110 (78.6%) | 30 (21.4%) |
Income in Conshohocken borough
Income Overview in Conshohocken borough
Per Capita Income in Conshohocken borough is $63,628, while median incomes of families and households are $135,072 and $114,523 respectively.
| Characteristic | Number | Measure |
| Per Capita Income | 9,182 | $63,628 |
| Median Family Income | 2,287 | $135,072 |
| Mean Family Income | 2,287 | $157,468 |
| Median Household Income | 4,333 | $114,523 |
| Mean Household Income | 4,333 | $133,976 |
| Income Deficit | 2,287 | $0 |
| Wage / Income Gap (%) | 9,182 | 3.94% |
| Wage / Income Gap ($) | 9,182 | 96.06¢ per $1 |
| Gini / Inequality Index | 9,182 | 0.38 |
Earnings by Sex in Conshohocken borough
Average Earnings in Conshohocken borough are $69,528, $71,677 for men and $68,852 for women, a difference of 3.9%.
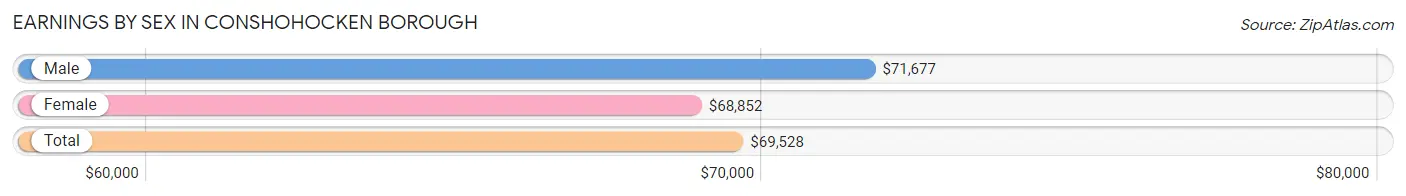
| Sex | Number | Average Earnings |
| Male | 3,707 (54.1%) | $71,677 |
| Female | 3,142 (45.9%) | $68,852 |
| Total | 6,849 (100.0%) | $69,528 |
Earnings by Sex by Income Bracket in Conshohocken borough
The most common earnings brackets in Conshohocken borough are $100,000+ for men (1,214 | 32.8%) and $75,000 to $99,999 for women (694 | 22.1%).
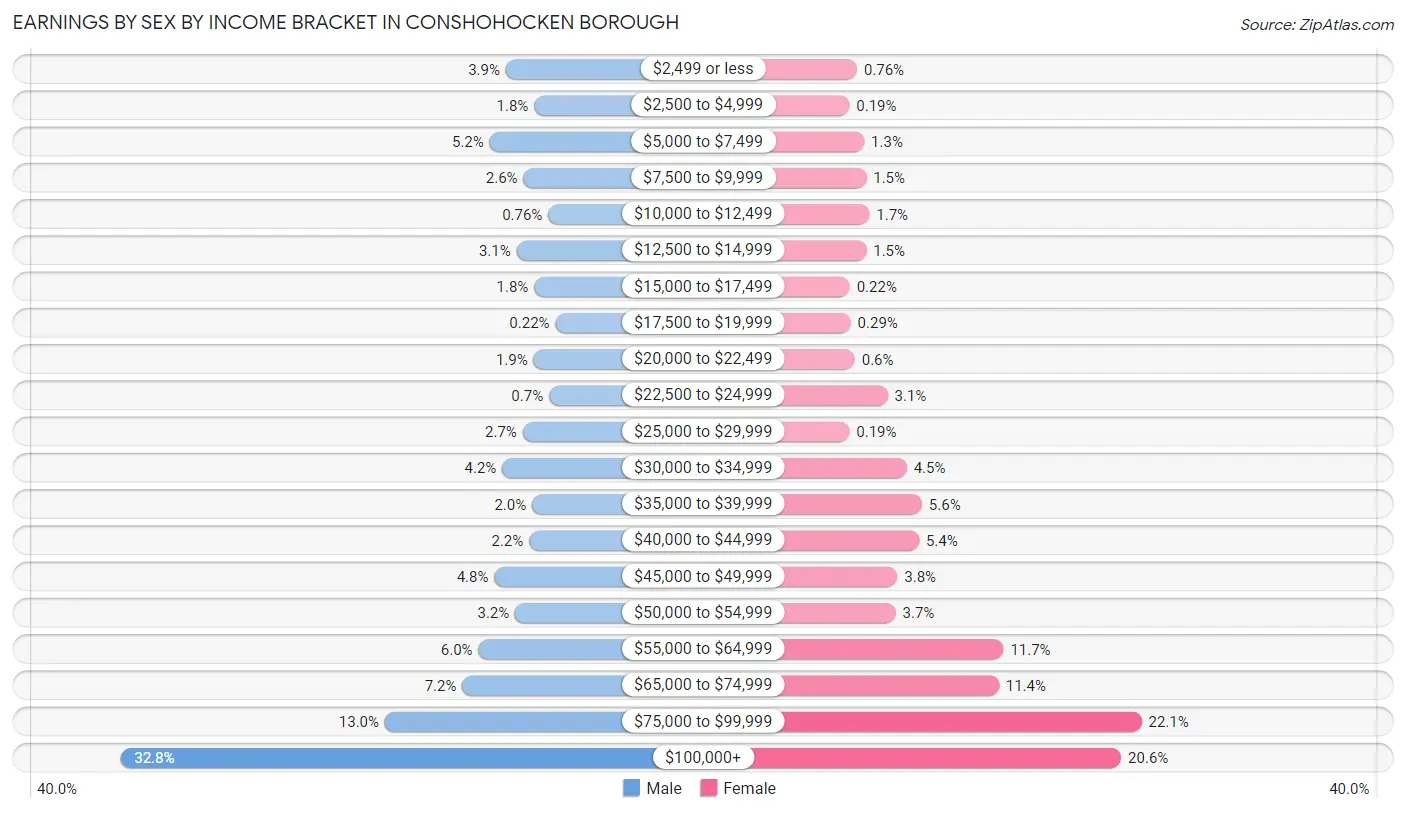
| Income | Male | Female |
| $2,499 or less | 146 (3.9%) | 24 (0.8%) |
| $2,500 to $4,999 | 67 (1.8%) | 6 (0.2%) |
| $5,000 to $7,499 | 191 (5.1%) | 41 (1.3%) |
| $7,500 to $9,999 | 97 (2.6%) | 46 (1.5%) |
| $10,000 to $12,499 | 28 (0.8%) | 53 (1.7%) |
| $12,500 to $14,999 | 116 (3.1%) | 46 (1.5%) |
| $15,000 to $17,499 | 67 (1.8%) | 7 (0.2%) |
| $17,500 to $19,999 | 8 (0.2%) | 9 (0.3%) |
| $20,000 to $22,499 | 69 (1.9%) | 19 (0.6%) |
| $22,500 to $24,999 | 26 (0.7%) | 96 (3.1%) |
| $25,000 to $29,999 | 99 (2.7%) | 6 (0.2%) |
| $30,000 to $34,999 | 156 (4.2%) | 141 (4.5%) |
| $35,000 to $39,999 | 73 (2.0%) | 177 (5.6%) |
| $40,000 to $44,999 | 81 (2.2%) | 170 (5.4%) |
| $45,000 to $49,999 | 178 (4.8%) | 119 (3.8%) |
| $50,000 to $54,999 | 120 (3.2%) | 115 (3.7%) |
| $55,000 to $64,999 | 222 (6.0%) | 369 (11.7%) |
| $65,000 to $74,999 | 267 (7.2%) | 358 (11.4%) |
| $75,000 to $99,999 | 482 (13.0%) | 694 (22.1%) |
| $100,000+ | 1,214 (32.8%) | 646 (20.6%) |
| Total | 3,707 (100.0%) | 3,142 (100.0%) |
Earnings by Sex by Educational Attainment in Conshohocken borough
Average earnings in Conshohocken borough are $74,826 for men and $71,582 for women, a difference of 4.3%. Men with an educational attainment of graduate degree enjoy the highest average annual earnings of $107,357, while those with college or associate's degree education earn the least with $37,679. Women with an educational attainment of graduate degree earn the most with the average annual earnings of $86,451, while those with high school diploma education have the smallest earnings of $38,500.
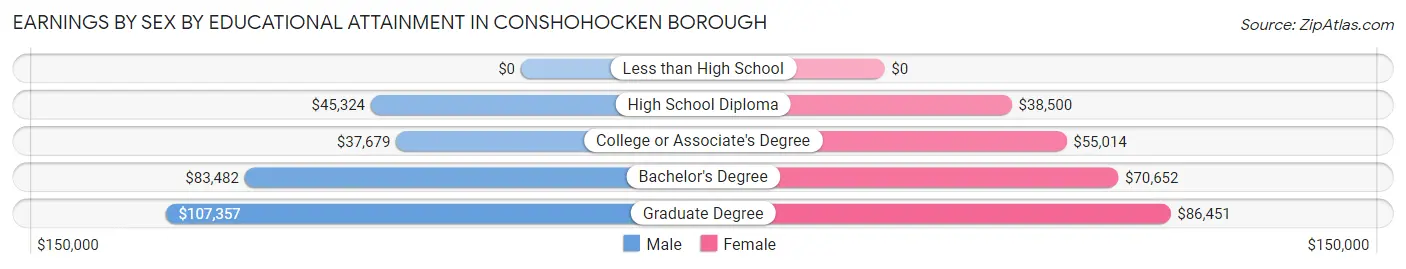
| Educational Attainment | Male Income | Female Income |
| Less than High School | - | - |
| High School Diploma | $45,324 | $38,500 |
| College or Associate's Degree | $37,679 | $55,014 |
| Bachelor's Degree | $83,482 | $70,652 |
| Graduate Degree | $107,357 | $86,451 |
| Total | $74,826 | $71,582 |
Family Income in Conshohocken borough
Family Income Brackets in Conshohocken borough
According to the Conshohocken borough family income data, there are 645 families falling into the $200,000+ income range, which is the most common income bracket and makes up 28.2% of all families.
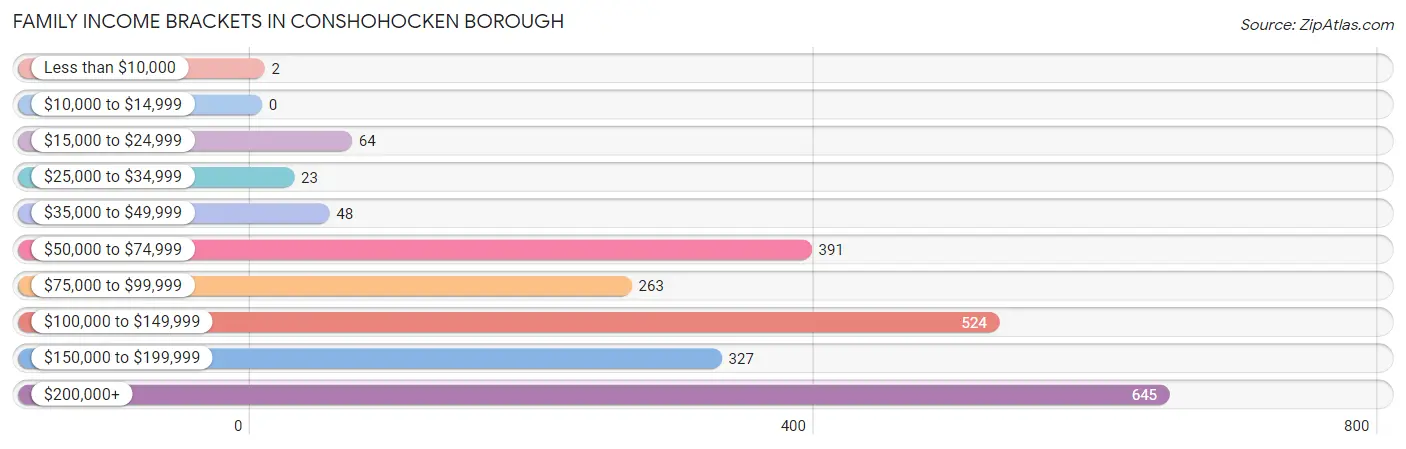
| Income Bracket | # Families | % Families |
| Less than $10,000 | 2 | 0.1% |
| $10,000 to $14,999 | 0 | 0.0% |
| $15,000 to $24,999 | 64 | 2.8% |
| $25,000 to $34,999 | 23 | 1.0% |
| $35,000 to $49,999 | 48 | 2.1% |
| $50,000 to $74,999 | 391 | 17.1% |
| $75,000 to $99,999 | 263 | 11.5% |
| $100,000 to $149,999 | 524 | 22.9% |
| $150,000 to $199,999 | 327 | 14.3% |
| $200,000+ | 645 | 28.2% |
Family Income by Famaliy Size in Conshohocken borough
2-person families (1,383 | 60.5%) account for the highest median family income in Conshohocken borough with $146,193 per family, while 2-person families (1,383 | 60.5%) have the highest median income of $73,096 per family member.
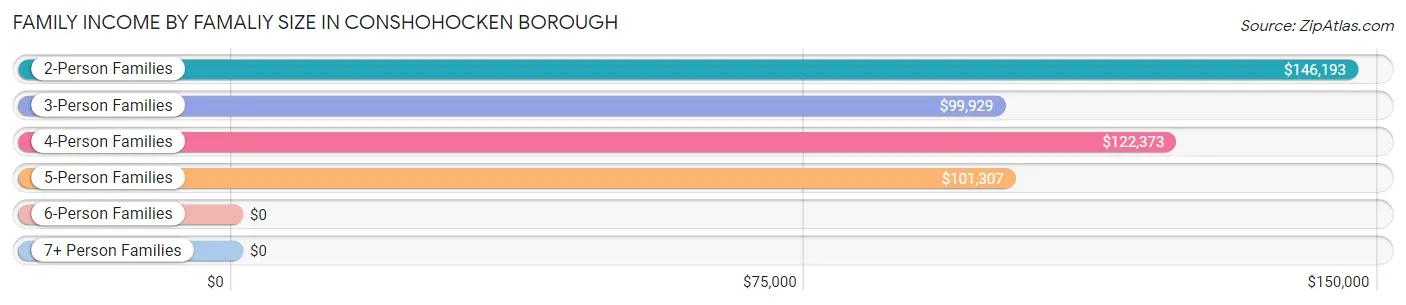
| Income Bracket | # Families | Median Income |
| 2-Person Families | 1,383 (60.5%) | $146,193 |
| 3-Person Families | 522 (22.8%) | $99,929 |
| 4-Person Families | 241 (10.5%) | $122,373 |
| 5-Person Families | 107 (4.7%) | $101,307 |
| 6-Person Families | 0 (0.0%) | $0 |
| 7+ Person Families | 34 (1.5%) | $0 |
| Total | 2,287 (100.0%) | $135,072 |
Family Income by Number of Earners in Conshohocken borough
The median family income in Conshohocken borough is $135,072, with families comprising 2 earners (1,517) having the highest median family income of $172,950, while families with no earners (159) have the lowest median family income of $57,250, accounting for 66.3% and 7.0% of families, respectively.
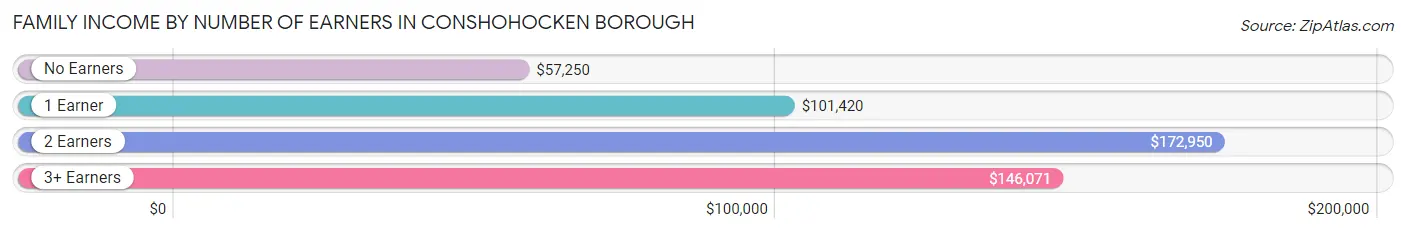
| Number of Earners | # Families | Median Income |
| No Earners | 159 (7.0%) | $57,250 |
| 1 Earner | 453 (19.8%) | $101,420 |
| 2 Earners | 1,517 (66.3%) | $172,950 |
| 3+ Earners | 158 (6.9%) | $146,071 |
| Total | 2,287 (100.0%) | $135,072 |
Household Income in Conshohocken borough
Household Income Brackets in Conshohocken borough
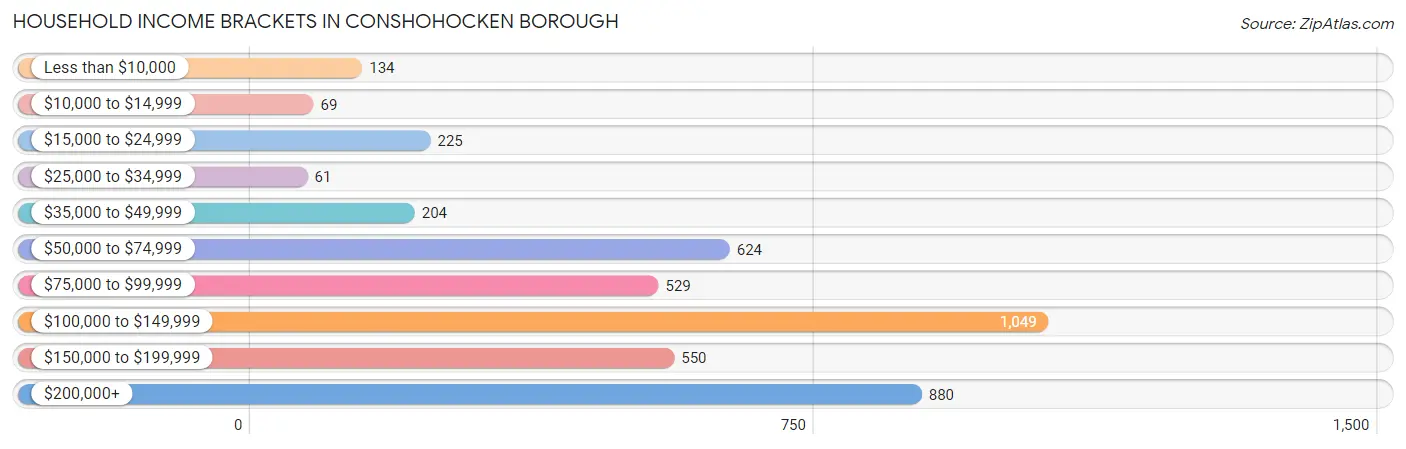
With 1,049 households falling in the category, the $100,000 to $149,999 income range is the most frequent in Conshohocken borough, accounting for 24.2% of all households. In contrast, only 61 households (1.4%) fall into the $25,000 to $34,999 income bracket, making it the least populous group.
| Income Bracket | # Households | % Households |
| Less than $10,000 | 134 | 3.1% |
| $10,000 to $14,999 | 69 | 1.6% |
| $15,000 to $24,999 | 225 | 5.2% |
| $25,000 to $34,999 | 61 | 1.4% |
| $35,000 to $49,999 | 204 | 4.7% |
| $50,000 to $74,999 | 624 | 14.4% |
| $75,000 to $99,999 | 529 | 12.2% |
| $100,000 to $149,999 | 1,049 | 24.2% |
| $150,000 to $199,999 | 550 | 12.7% |
| $200,000+ | 880 | 20.3% |
Household Income by Householder Age in Conshohocken borough
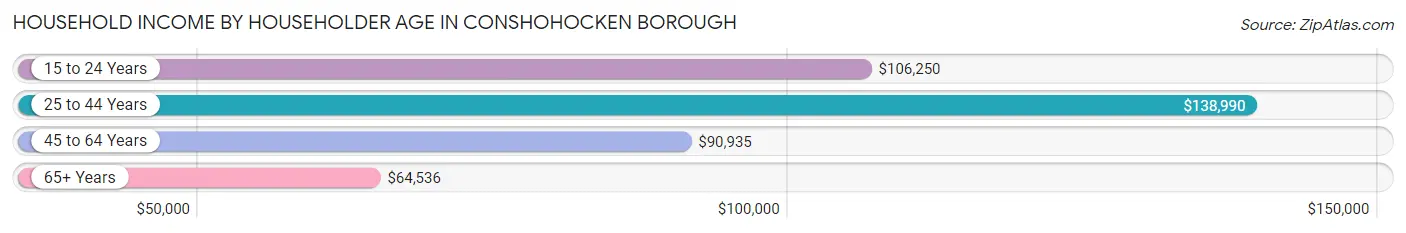
The median household income in Conshohocken borough is $114,523, with the highest median household income of $138,990 found in the 25 to 44 years age bracket for the primary householder. A total of 2,539 households (58.6%) fall into this category. Meanwhile, the 65+ years age bracket for the primary householder has the lowest median household income of $64,536, with 583 households (13.5%) in this group.
| Income Bracket | # Households | Median Income |
| 15 to 24 Years | 258 (5.9%) | $106,250 |
| 25 to 44 Years | 2,539 (58.6%) | $138,990 |
| 45 to 64 Years | 953 (22.0%) | $90,935 |
| 65+ Years | 583 (13.5%) | $64,536 |
| Total | 4,333 (100.0%) | $114,523 |
Poverty in Conshohocken borough
Income Below Poverty by Sex and Age in Conshohocken borough
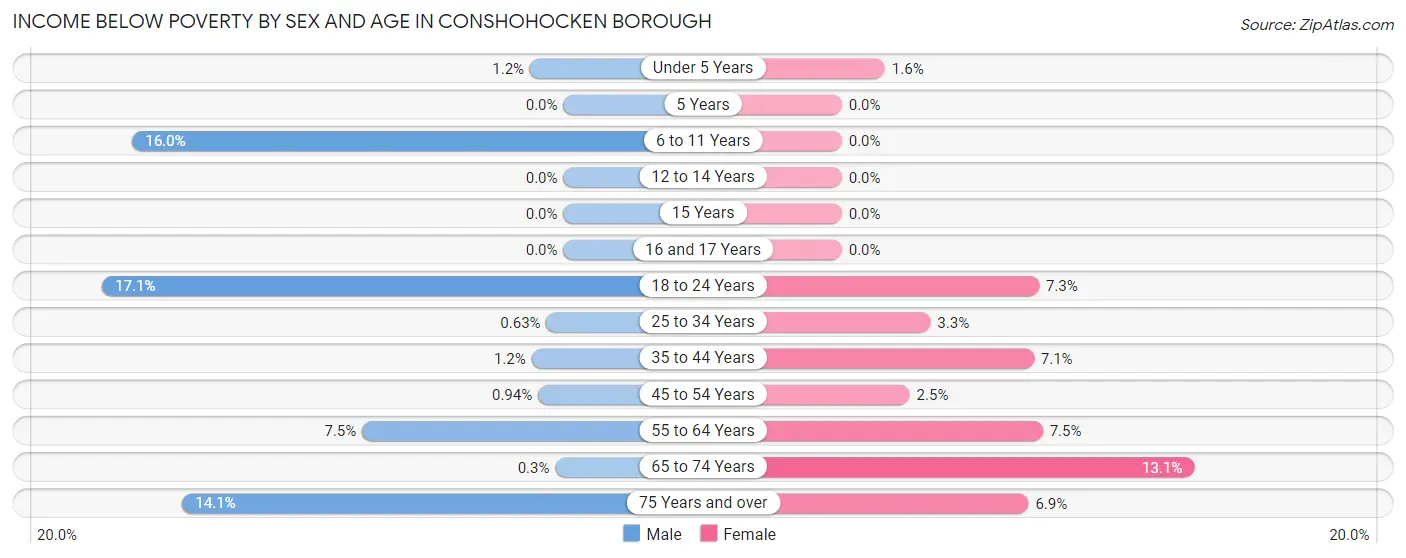
With 3.9% poverty level for males and 5.0% for females among the residents of Conshohocken borough, 18 to 24 year old males and 65 to 74 year old females are the most vulnerable to poverty, with 69 males (17.1%) and 34 females (13.1%) in their respective age groups living below the poverty level.
| Age Bracket | Male | Female |
| Under 5 Years | 2 (1.2%) | 4 (1.6%) |
| 5 Years | 0 (0.0%) | 0 (0.0%) |
| 6 to 11 Years | 36 (16.0%) | 0 (0.0%) |
| 12 to 14 Years | 0 (0.0%) | 0 (0.0%) |
| 15 Years | 0 (0.0%) | 0 (0.0%) |
| 16 and 17 Years | 0 (0.0%) | 0 (0.0%) |
| 18 to 24 Years | 69 (17.1%) | 24 (7.3%) |
| 25 to 34 Years | 11 (0.6%) | 50 (3.3%) |
| 35 to 44 Years | 9 (1.2%) | 44 (7.1%) |
| 45 to 54 Years | 2 (0.9%) | 8 (2.5%) |
| 55 to 64 Years | 39 (7.5%) | 47 (7.5%) |
| 65 to 74 Years | 1 (0.3%) | 34 (13.1%) |
| 75 Years and over | 14 (14.1%) | 14 (6.9%) |
| Total | 183 (3.9%) | 225 (5.0%) |
Income Above Poverty by Sex and Age in Conshohocken borough
According to the poverty statistics in Conshohocken borough, males aged 5 years and females aged 5 years are the age groups that are most secure financially, with 100.0% of males and 100.0% of females in these age groups living above the poverty line.
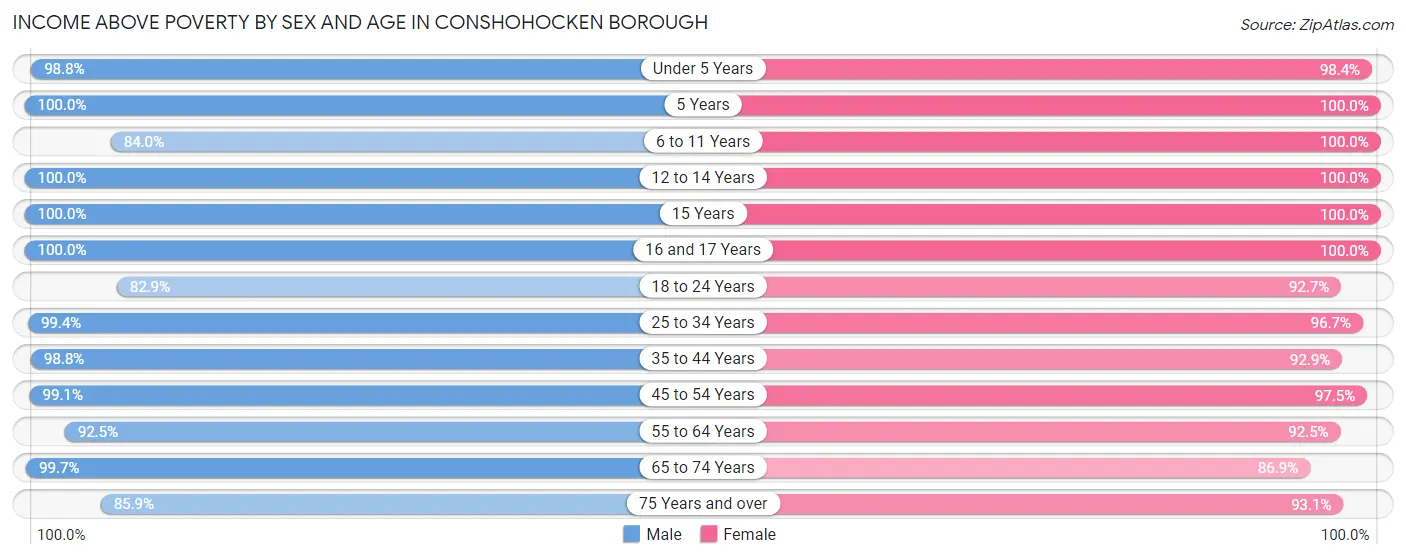
| Age Bracket | Male | Female |
| Under 5 Years | 159 (98.8%) | 246 (98.4%) |
| 5 Years | 14 (100.0%) | 15 (100.0%) |
| 6 to 11 Years | 189 (84.0%) | 192 (100.0%) |
| 12 to 14 Years | 83 (100.0%) | 100 (100.0%) |
| 15 Years | 42 (100.0%) | 24 (100.0%) |
| 16 and 17 Years | 61 (100.0%) | 50 (100.0%) |
| 18 to 24 Years | 334 (82.9%) | 304 (92.7%) |
| 25 to 34 Years | 1,730 (99.4%) | 1,472 (96.7%) |
| 35 to 44 Years | 753 (98.8%) | 573 (92.9%) |
| 45 to 54 Years | 210 (99.1%) | 310 (97.5%) |
| 55 to 64 Years | 483 (92.5%) | 583 (92.5%) |
| 65 to 74 Years | 331 (99.7%) | 226 (86.9%) |
| 75 Years and over | 85 (85.9%) | 188 (93.1%) |
| Total | 4,474 (96.1%) | 4,283 (95.0%) |
Income Below Poverty Among Married-Couple Families in Conshohocken borough
The poverty statistics for married-couple families in Conshohocken borough show that 0.1% or 2 of the total 1,727 families live below the poverty line. Families with 3 or 4 children have the highest poverty rate of 3.8%, comprising of 2 families. On the other hand, families with no children have the lowest poverty rate of 0.0%, which includes 0 families.
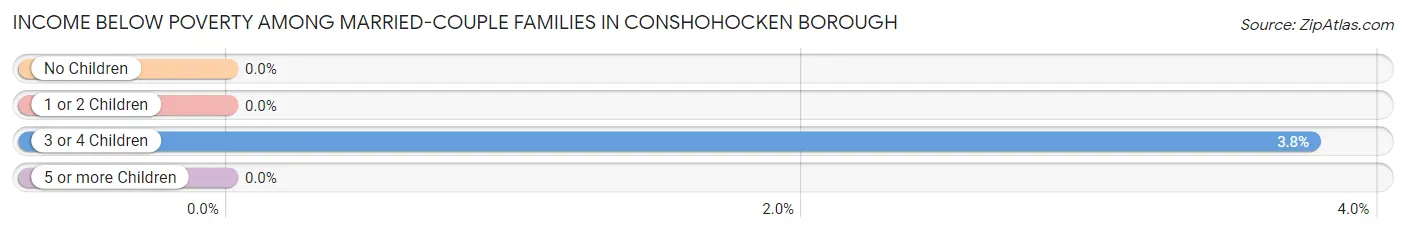
| Children | Above Poverty | Below Poverty |
| No Children | 1,266 (100.0%) | 0 (0.0%) |
| 1 or 2 Children | 374 (100.0%) | 0 (0.0%) |
| 3 or 4 Children | 51 (96.2%) | 2 (3.8%) |
| 5 or more Children | 34 (100.0%) | 0 (0.0%) |
| Total | 1,725 (99.9%) | 2 (0.1%) |
Income Below Poverty Among Single-Parent Households in Conshohocken borough
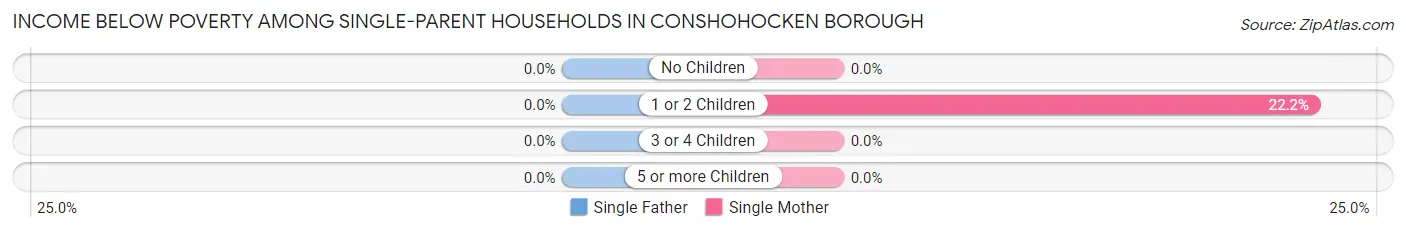
| Children | Single Father | Single Mother |
| No Children | 0 (0.0%) | 0 (0.0%) |
| 1 or 2 Children | 0 (0.0%) | 38 (22.2%) |
| 3 or 4 Children | 0 (0.0%) | 0 (0.0%) |
| 5 or more Children | 0 (0.0%) | 0 (0.0%) |
| Total | 0 (0.0%) | 38 (10.2%) |
Income Below Poverty Among Married-Couple vs Single-Parent Households in Conshohocken borough
The poverty data for Conshohocken borough shows that 2 of the married-couple family households (0.1%) and 38 of the single-parent households (6.8%) are living below the poverty level. Within the married-couple family households, those with 3 or 4 children have the highest poverty rate, with 2 households (3.8%) falling below the poverty line. Among the single-parent households, those with 1 or 2 children have the highest poverty rate, with 38 household (17.8%) living below poverty.
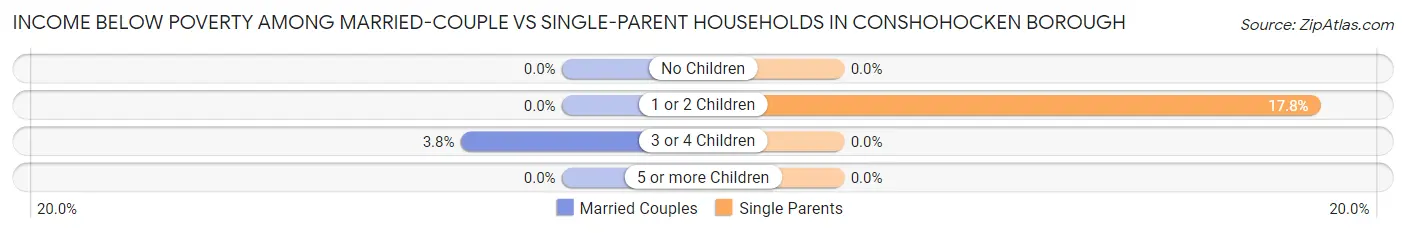
| Children | Married-Couple Families | Single-Parent Households |
| No Children | 0 (0.0%) | 0 (0.0%) |
| 1 or 2 Children | 0 (0.0%) | 38 (17.8%) |
| 3 or 4 Children | 2 (3.8%) | 0 (0.0%) |
| 5 or more Children | 0 (0.0%) | 0 (0.0%) |
| Total | 2 (0.1%) | 38 (6.8%) |
Employment Characteristics in Conshohocken borough
Employment by Class of Employer in Conshohocken borough
Among the 6,435 employed individuals in Conshohocken borough, private company employees (4,922 | 76.5%), not-for-profit organizations (843 | 13.1%), and local government employees (313 | 4.9%) make up the most common classes of employment.
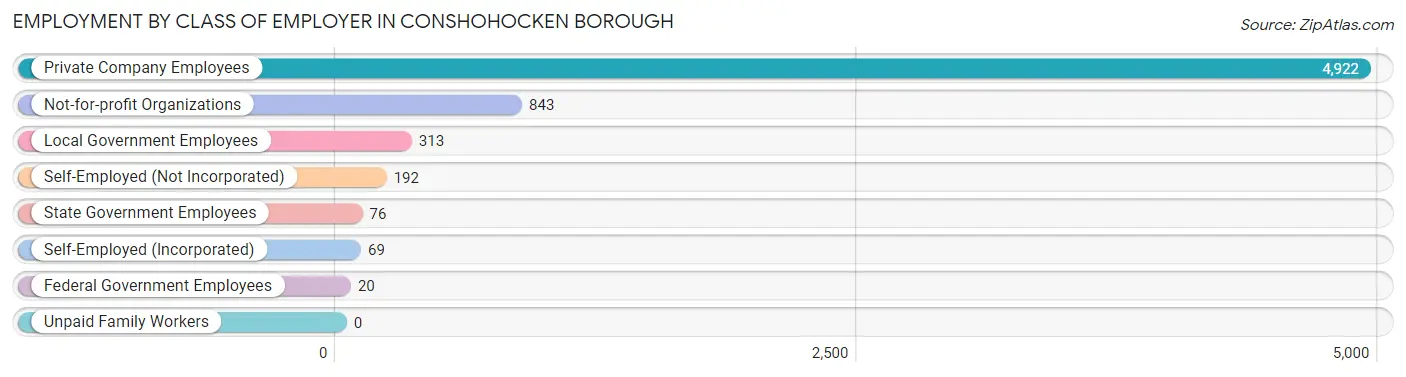
| Employer Class | # Employees | % Employees |
| Private Company Employees | 4,922 | 76.5% |
| Self-Employed (Incorporated) | 69 | 1.1% |
| Self-Employed (Not Incorporated) | 192 | 3.0% |
| Not-for-profit Organizations | 843 | 13.1% |
| Local Government Employees | 313 | 4.9% |
| State Government Employees | 76 | 1.2% |
| Federal Government Employees | 20 | 0.3% |
| Unpaid Family Workers | 0 | 0.0% |
| Total | 6,435 | 100.0% |
Employment Status by Age in Conshohocken borough
According to the labor force statistics for Conshohocken borough, out of the total population over 16 years of age (8,076), 83.5% or 6,743 individuals are in the labor force, with 3.5% or 236 of them unemployed. The age group with the highest labor force participation rate is 45 to 54 years, with 99.6% or 528 individuals in the labor force. Within the labor force, the 55 to 59 years age range has the highest percentage of unemployed individuals, with 11.9% or 46 of them being unemployed.
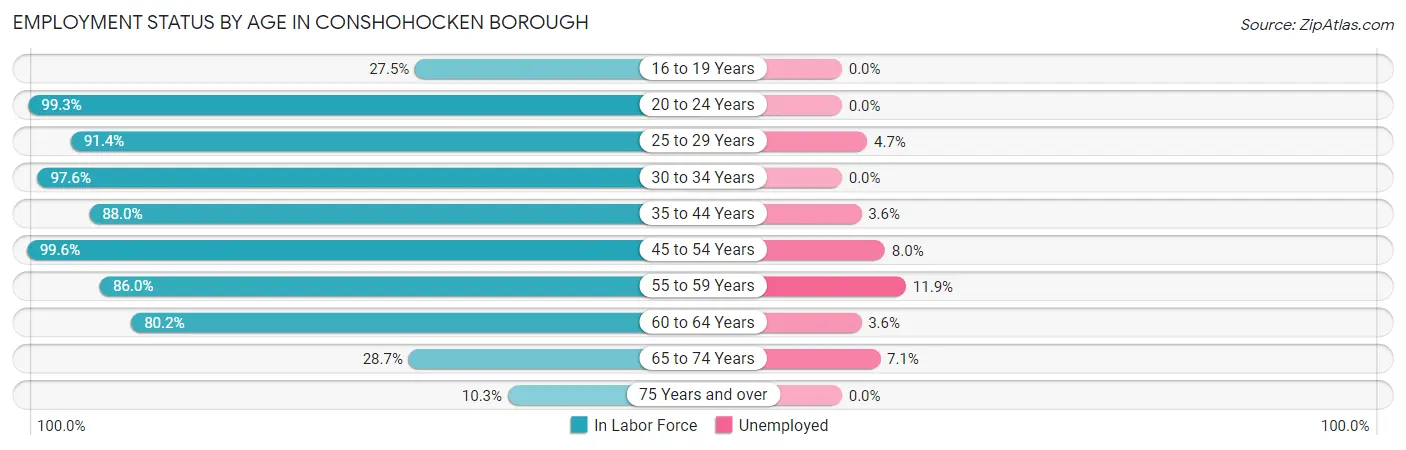
| Age Bracket | In Labor Force | Unemployed |
| 16 to 19 Years | 33 (27.5%) | 0 (0.0%) |
| 20 to 24 Years | 730 (99.3%) | 0 (0.0%) |
| 25 to 29 Years | 1,538 (91.4%) | 72 (4.7%) |
| 30 to 34 Years | 1,546 (97.6%) | 0 (0.0%) |
| 35 to 44 Years | 1,214 (88.0%) | 44 (3.6%) |
| 45 to 54 Years | 528 (99.6%) | 42 (8.0%) |
| 55 to 59 Years | 387 (86.0%) | 46 (11.9%) |
| 60 to 64 Years | 563 (80.2%) | 20 (3.6%) |
| 65 to 74 Years | 170 (28.7%) | 12 (7.1%) |
| 75 Years and over | 31 (10.3%) | 0 (0.0%) |
| Total | 6,743 (83.5%) | 236 (3.5%) |
Employment Status by Educational Attainment in Conshohocken borough
According to labor force statistics for Conshohocken borough, 91.3% of individuals (5,777) out of the total population between 25 and 64 years of age (6,328) are in the labor force, with 3.9% or 225 of them being unemployed. The group with the highest labor force participation rate are those with the educational attainment of less than high school, with 100.0% or 102 individuals in the labor force. Within the labor force, individuals with high school diploma education have the highest percentage of unemployment, with 5.7% or 46 of them being unemployed.
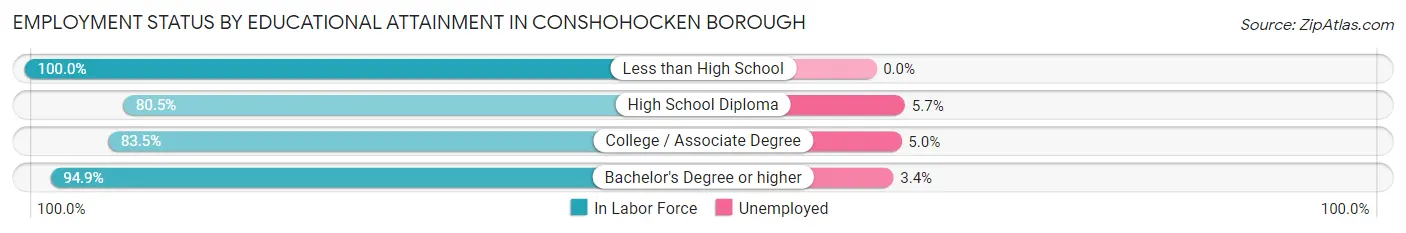
| Educational Attainment | In Labor Force | Unemployed |
| Less than High School | 102 (100.0%) | 0 (0.0%) |
| High School Diploma | 803 (80.5%) | 57 (5.7%) |
| College / Associate Degree | 674 (83.5%) | 40 (5.0%) |
| Bachelor's Degree or higher | 4,196 (94.9%) | 150 (3.4%) |
| Total | 5,777 (91.3%) | 247 (3.9%) |
Employment Occupations by Sex in Conshohocken borough
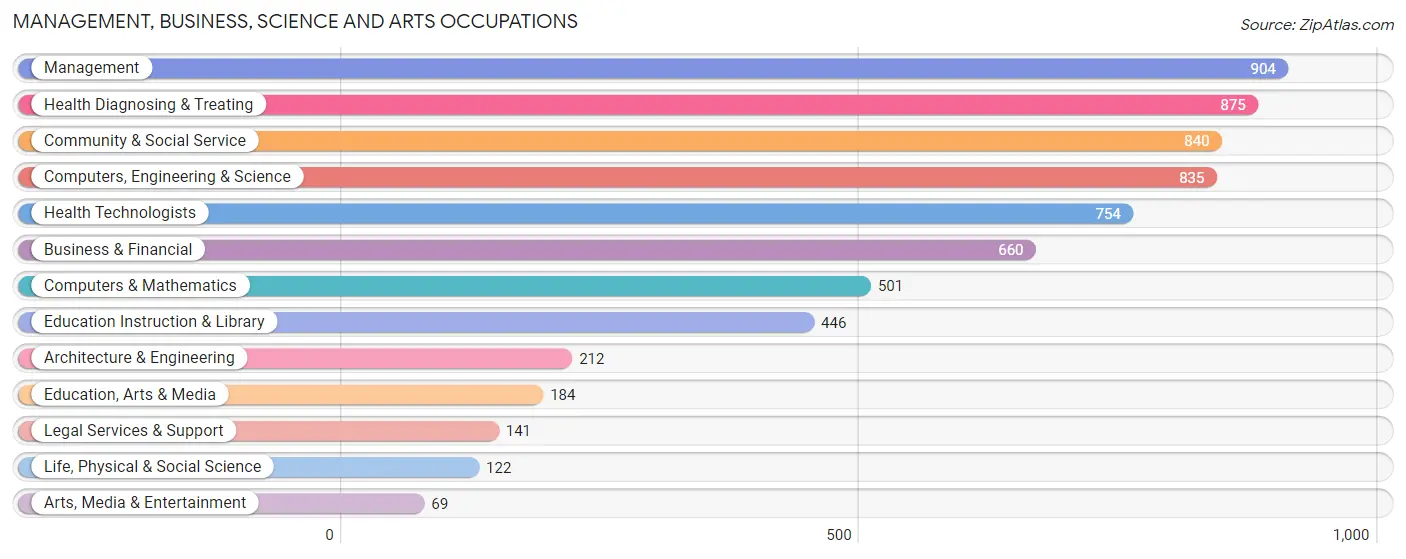
Management, Business, Science and Arts Occupations
The most common Management, Business, Science and Arts occupations in Conshohocken borough are Management (904 | 13.9%), Health Diagnosing & Treating (875 | 13.5%), Community & Social Service (840 | 12.9%), Computers, Engineering & Science (835 | 12.8%), and Health Technologists (754 | 11.6%).
Management, Business, Science and Arts Occupations by Sex
Within the Management, Business, Science and Arts occupations in Conshohocken borough, the most male-oriented occupations are Architecture & Engineering (83.5%), Life, Physical & Social Science (72.1%), and Computers, Engineering & Science (71.4%), while the most female-oriented occupations are Education Instruction & Library (88.6%), Community & Social Service (74.1%), and Health Technologists (70.6%).
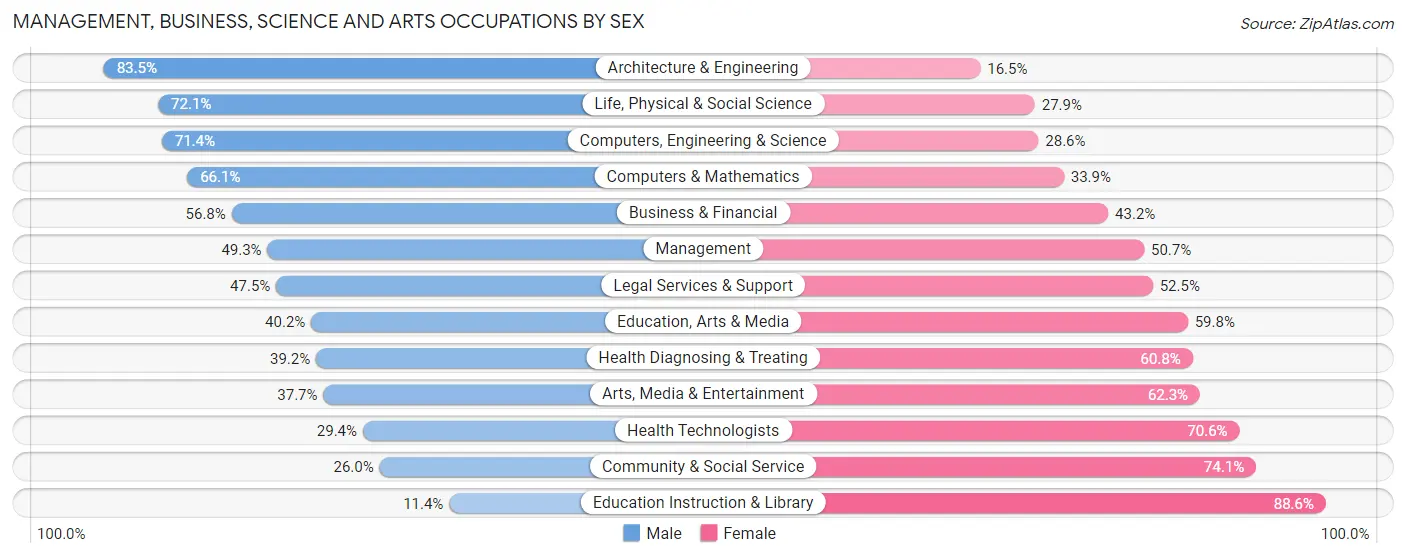
| Occupation | Male | Female |
| Management | 446 (49.3%) | 458 (50.7%) |
| Business & Financial | 375 (56.8%) | 285 (43.2%) |
| Computers, Engineering & Science | 596 (71.4%) | 239 (28.6%) |
| Computers & Mathematics | 331 (66.1%) | 170 (33.9%) |
| Architecture & Engineering | 177 (83.5%) | 35 (16.5%) |
| Life, Physical & Social Science | 88 (72.1%) | 34 (27.9%) |
| Community & Social Service | 218 (26.0%) | 622 (74.1%) |
| Education, Arts & Media | 74 (40.2%) | 110 (59.8%) |
| Legal Services & Support | 67 (47.5%) | 74 (52.5%) |
| Education Instruction & Library | 51 (11.4%) | 395 (88.6%) |
| Arts, Media & Entertainment | 26 (37.7%) | 43 (62.3%) |
| Health Diagnosing & Treating | 343 (39.2%) | 532 (60.8%) |
| Health Technologists | 222 (29.4%) | 532 (70.6%) |
| Total (Category) | 1,978 (48.1%) | 2,136 (51.9%) |
| Total (Overall) | 3,402 (52.3%) | 3,099 (47.7%) |
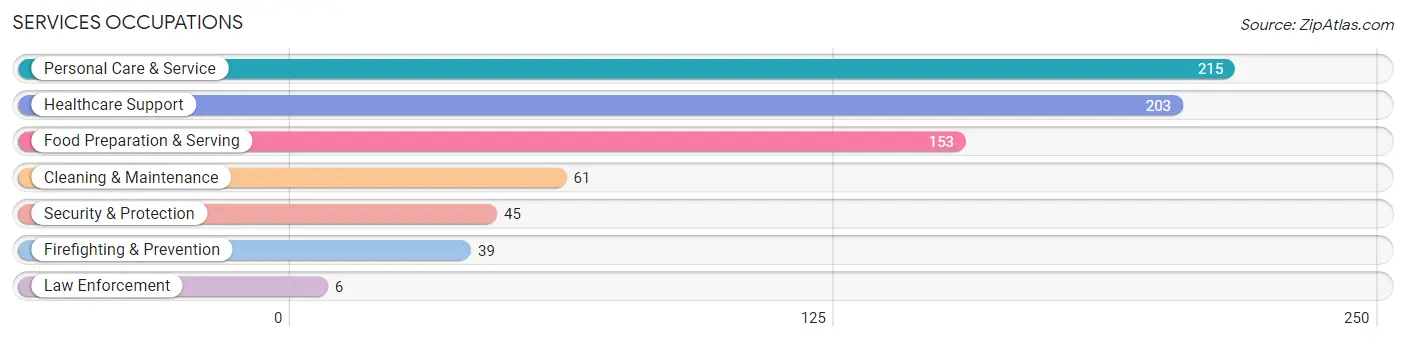
Services Occupations
The most common Services occupations in Conshohocken borough are Personal Care & Service (215 | 3.3%), Healthcare Support (203 | 3.1%), Food Preparation & Serving (153 | 2.4%), Cleaning & Maintenance (61 | 0.9%), and Security & Protection (45 | 0.7%).
Services Occupations by Sex
Within the Services occupations in Conshohocken borough, the most male-oriented occupations are Law Enforcement (100.0%), Food Preparation & Serving (68.6%), and Cleaning & Maintenance (62.3%), while the most female-oriented occupations are Healthcare Support (96.6%), Firefighting & Prevention (59.0%), and Security & Protection (51.1%).
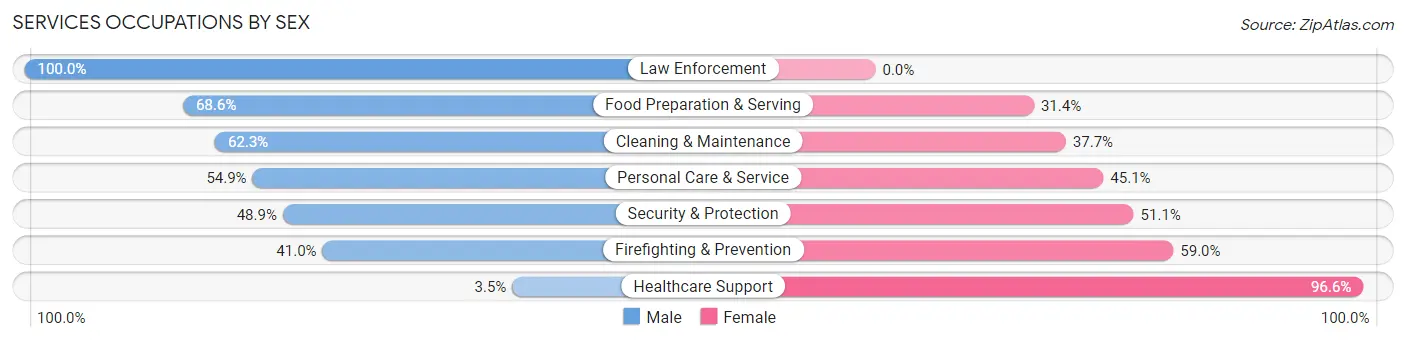
| Occupation | Male | Female |
| Healthcare Support | 7 (3.5%) | 196 (96.6%) |
| Security & Protection | 22 (48.9%) | 23 (51.1%) |
| Firefighting & Prevention | 16 (41.0%) | 23 (59.0%) |
| Law Enforcement | 6 (100.0%) | 0 (0.0%) |
| Food Preparation & Serving | 105 (68.6%) | 48 (31.4%) |
| Cleaning & Maintenance | 38 (62.3%) | 23 (37.7%) |
| Personal Care & Service | 118 (54.9%) | 97 (45.1%) |
| Total (Category) | 290 (42.8%) | 387 (57.2%) |
| Total (Overall) | 3,402 (52.3%) | 3,099 (47.7%) |
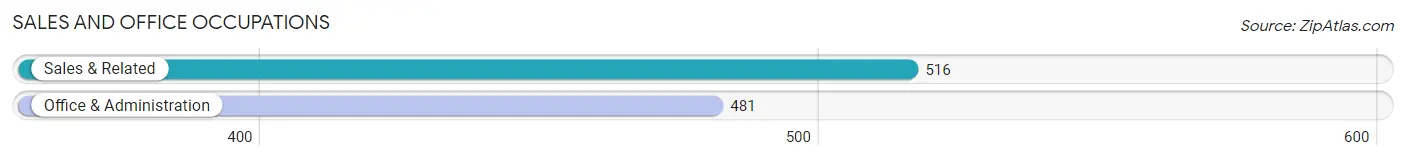
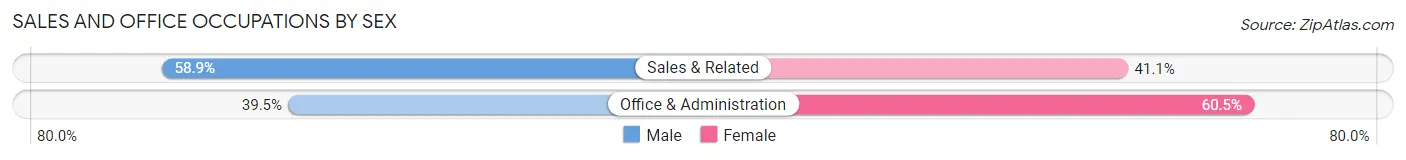
Sales and Office Occupations
The most common Sales and Office occupations in Conshohocken borough are Sales & Related (516 | 7.9%), and Office & Administration (481 | 7.4%).
Sales and Office Occupations by Sex
| Occupation | Male | Female |
| Sales & Related | 304 (58.9%) | 212 (41.1%) |
| Office & Administration | 190 (39.5%) | 291 (60.5%) |
| Total (Category) | 494 (49.5%) | 503 (50.4%) |
| Total (Overall) | 3,402 (52.3%) | 3,099 (47.7%) |
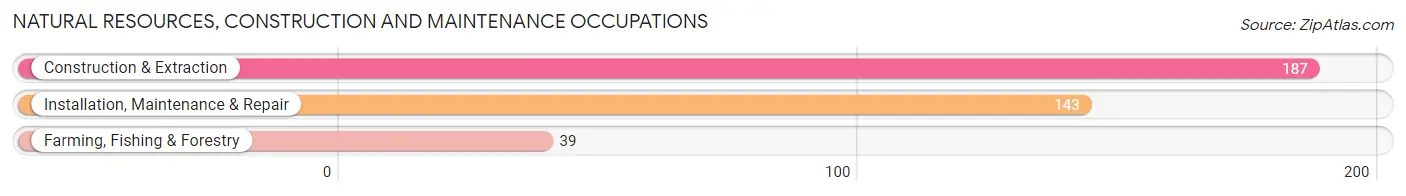
Natural Resources, Construction and Maintenance Occupations
The most common Natural Resources, Construction and Maintenance occupations in Conshohocken borough are Construction & Extraction (187 | 2.9%), Installation, Maintenance & Repair (143 | 2.2%), and Farming, Fishing & Forestry (39 | 0.6%).
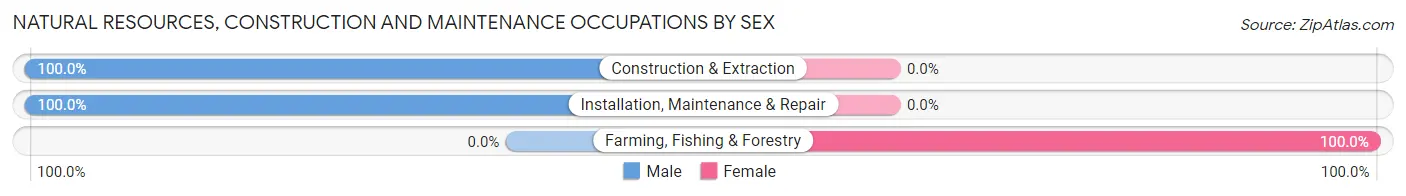
Natural Resources, Construction and Maintenance Occupations by Sex
| Occupation | Male | Female |
| Farming, Fishing & Forestry | 0 (0.0%) | 39 (100.0%) |
| Construction & Extraction | 187 (100.0%) | 0 (0.0%) |
| Installation, Maintenance & Repair | 143 (100.0%) | 0 (0.0%) |
| Total (Category) | 330 (89.4%) | 39 (10.6%) |
| Total (Overall) | 3,402 (52.3%) | 3,099 (47.7%) |
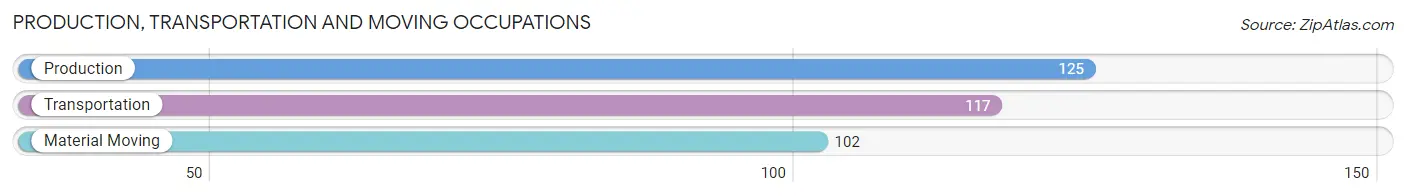
Production, Transportation and Moving Occupations
The most common Production, Transportation and Moving occupations in Conshohocken borough are Production (125 | 1.9%), Transportation (117 | 1.8%), and Material Moving (102 | 1.6%).
Production, Transportation and Moving Occupations by Sex
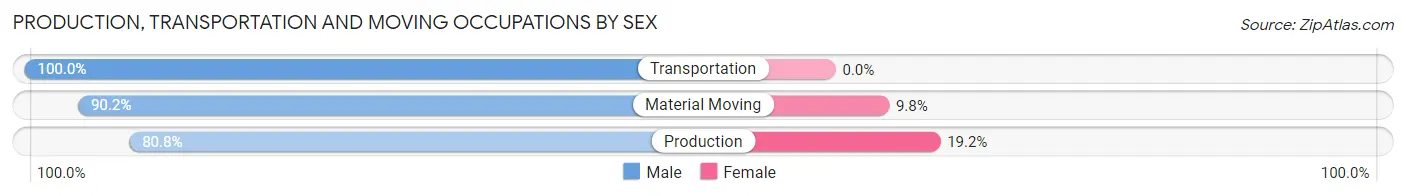
| Occupation | Male | Female |
| Production | 101 (80.8%) | 24 (19.2%) |
| Transportation | 117 (100.0%) | 0 (0.0%) |
| Material Moving | 92 (90.2%) | 10 (9.8%) |
| Total (Category) | 310 (90.1%) | 34 (9.9%) |
| Total (Overall) | 3,402 (52.3%) | 3,099 (47.7%) |
Employment Industries by Sex in Conshohocken borough
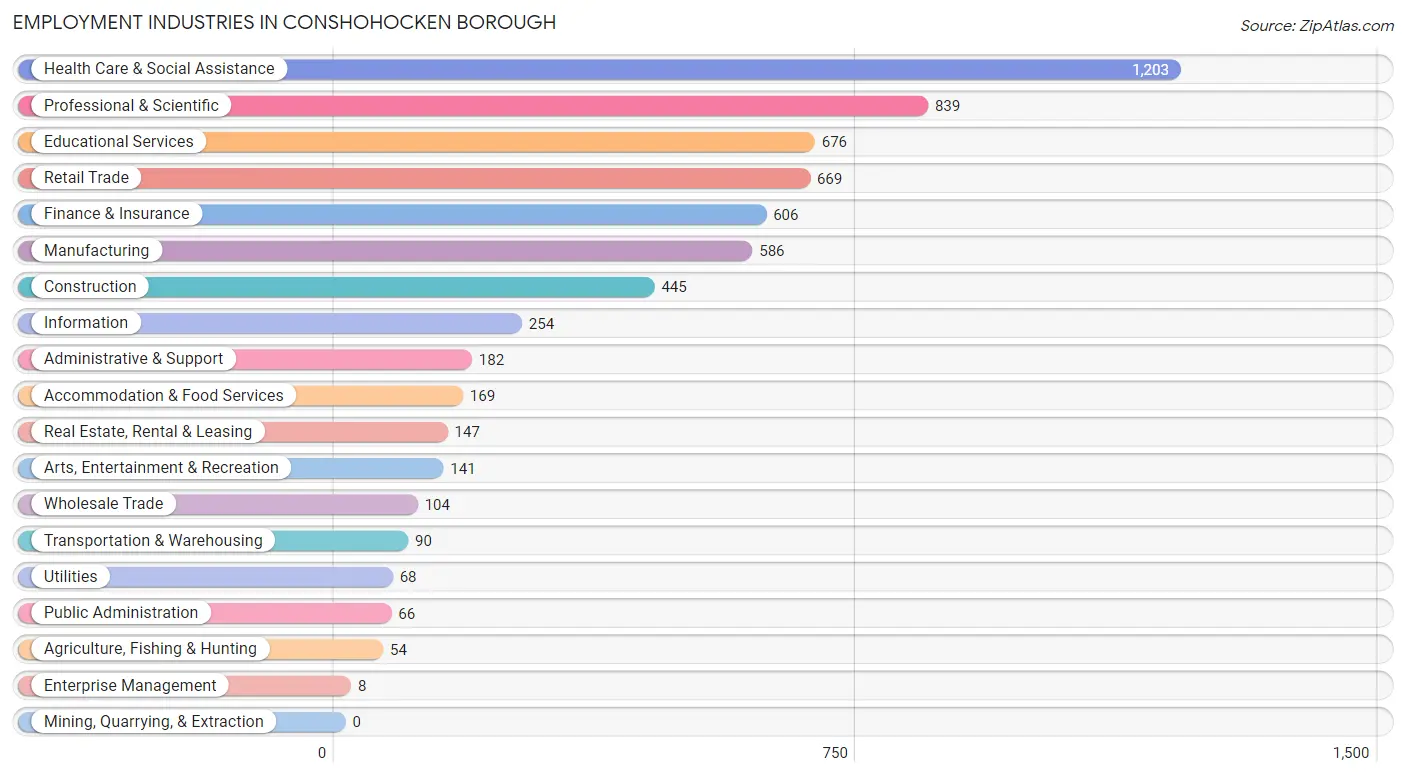
Employment Industries in Conshohocken borough
The major employment industries in Conshohocken borough include Health Care & Social Assistance (1,203 | 18.5%), Professional & Scientific (839 | 12.9%), Educational Services (676 | 10.4%), Retail Trade (669 | 10.3%), and Finance & Insurance (606 | 9.3%).
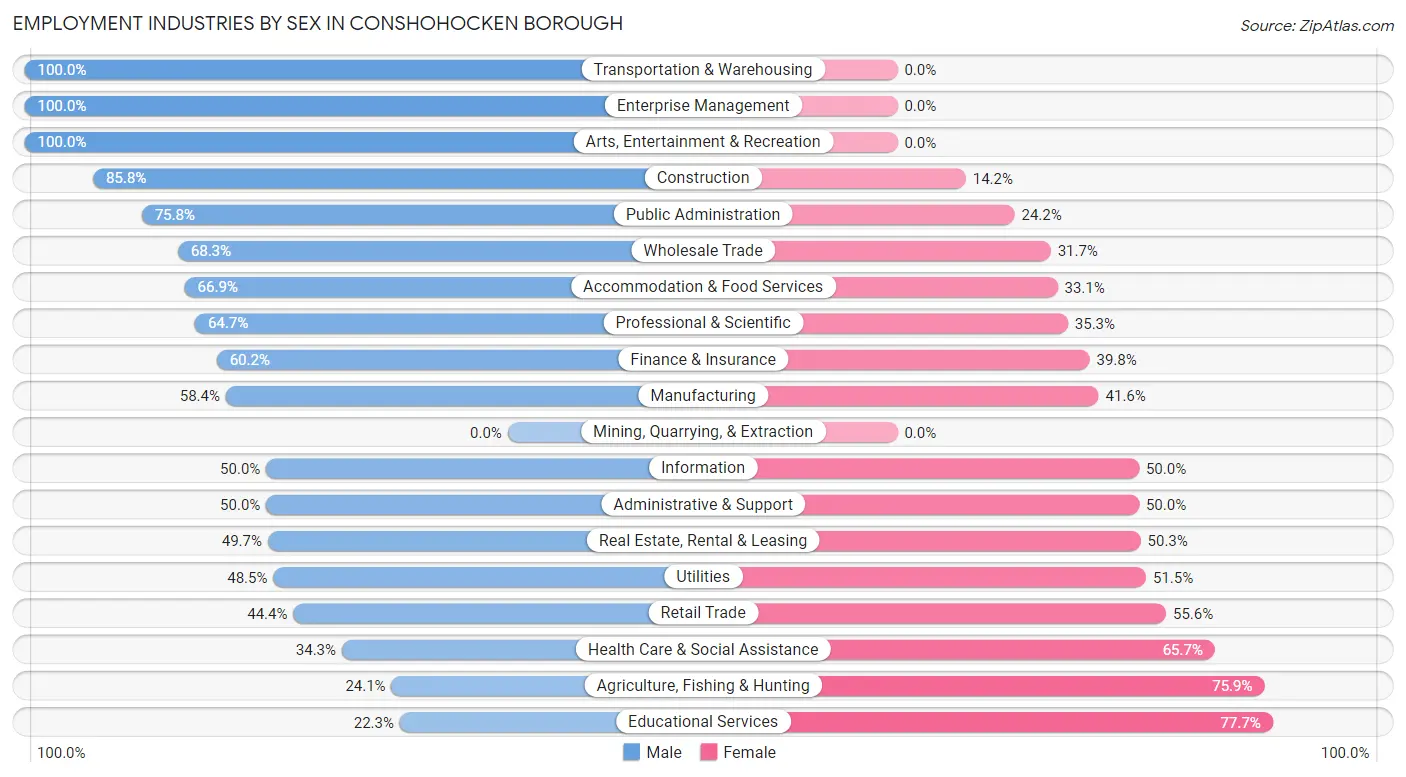
Employment Industries by Sex in Conshohocken borough
The Conshohocken borough industries that see more men than women are Transportation & Warehousing (100.0%), Enterprise Management (100.0%), and Arts, Entertainment & Recreation (100.0%), whereas the industries that tend to have a higher number of women are Educational Services (77.7%), Agriculture, Fishing & Hunting (75.9%), and Health Care & Social Assistance (65.7%).
| Industry | Male | Female |
| Agriculture, Fishing & Hunting | 13 (24.1%) | 41 (75.9%) |
| Mining, Quarrying, & Extraction | 0 (0.0%) | 0 (0.0%) |
| Construction | 382 (85.8%) | 63 (14.2%) |
| Manufacturing | 342 (58.4%) | 244 (41.6%) |
| Wholesale Trade | 71 (68.3%) | 33 (31.7%) |
| Retail Trade | 297 (44.4%) | 372 (55.6%) |
| Transportation & Warehousing | 90 (100.0%) | 0 (0.0%) |
| Utilities | 33 (48.5%) | 35 (51.5%) |
| Information | 127 (50.0%) | 127 (50.0%) |
| Finance & Insurance | 365 (60.2%) | 241 (39.8%) |
| Real Estate, Rental & Leasing | 73 (49.7%) | 74 (50.3%) |
| Professional & Scientific | 543 (64.7%) | 296 (35.3%) |
| Enterprise Management | 8 (100.0%) | 0 (0.0%) |
| Administrative & Support | 91 (50.0%) | 91 (50.0%) |
| Educational Services | 151 (22.3%) | 525 (77.7%) |
| Health Care & Social Assistance | 413 (34.3%) | 790 (65.7%) |
| Arts, Entertainment & Recreation | 141 (100.0%) | 0 (0.0%) |
| Accommodation & Food Services | 113 (66.9%) | 56 (33.1%) |
| Public Administration | 50 (75.8%) | 16 (24.2%) |
| Total | 3,402 (52.3%) | 3,099 (47.7%) |
Education in Conshohocken borough
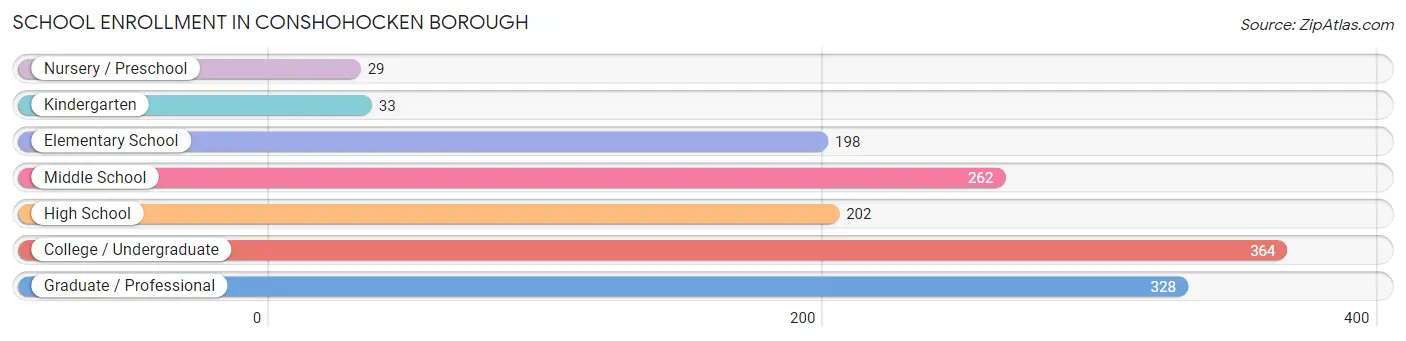
School Enrollment in Conshohocken borough
The most common levels of schooling among the 1,416 students in Conshohocken borough are college / undergraduate (364 | 25.7%), graduate / professional (328 | 23.2%), and middle school (262 | 18.5%).
| School Level | # Students | % Students |
| Nursery / Preschool | 29 | 2.1% |
| Kindergarten | 33 | 2.3% |
| Elementary School | 198 | 14.0% |
| Middle School | 262 | 18.5% |
| High School | 202 | 14.3% |
| College / Undergraduate | 364 | 25.7% |
| Graduate / Professional | 328 | 23.2% |
| Total | 1,416 | 100.0% |
School Enrollment by Age by Funding Source in Conshohocken borough
Out of a total of 1,416 students who are enrolled in schools in Conshohocken borough, 496 (35.0%) attend a private institution, while the remaining 920 (65.0%) are enrolled in public schools. The age group of 3 to 4 year olds has the highest likelihood of being enrolled in private schools, with 15 (100.0% in the age bracket) enrolled. Conversely, the age group of 15 to 17 year olds has the lowest likelihood of being enrolled in a private school, with 177 (100.0% in the age bracket) attending a public institution.
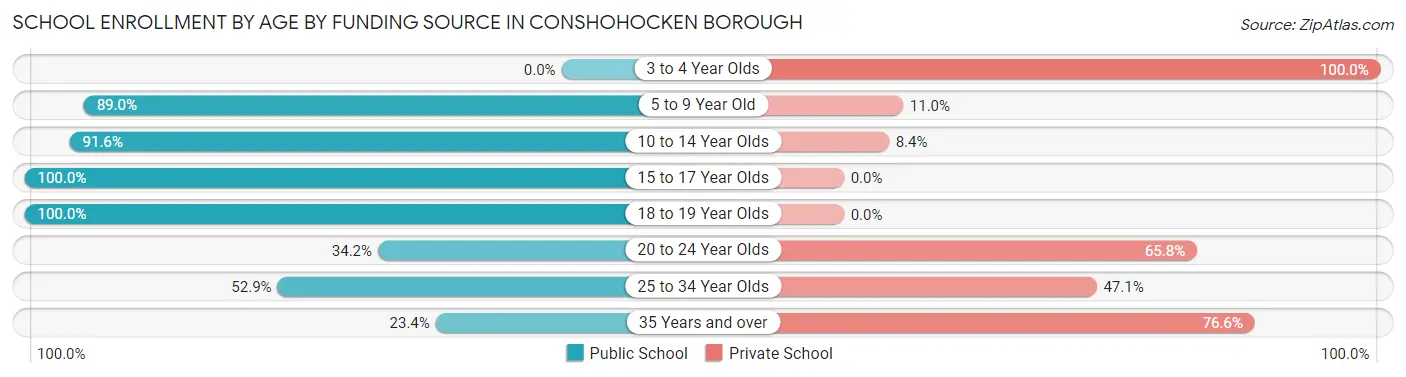
| Age Bracket | Public School | Private School |
| 3 to 4 Year Olds | 0 (0.0%) | 15 (100.0%) |
| 5 to 9 Year Old | 218 (89.0%) | 27 (11.0%) |
| 10 to 14 Year Olds | 262 (91.6%) | 24 (8.4%) |
| 15 to 17 Year Olds | 177 (100.0%) | 0 (0.0%) |
| 18 to 19 Year Olds | 9 (100.0%) | 0 (0.0%) |
| 20 to 24 Year Olds | 92 (34.2%) | 177 (65.8%) |
| 25 to 34 Year Olds | 118 (52.9%) | 105 (47.1%) |
| 35 Years and over | 45 (23.4%) | 147 (76.6%) |
| Total | 920 (65.0%) | 496 (35.0%) |
Educational Attainment by Field of Study in Conshohocken borough
Business (1,076 | 21.4%), science & technology (855 | 17.0%), engineering (602 | 12.0%), social sciences (496 | 9.9%), and education (341 | 6.8%) are the most common fields of study among 5,035 individuals in Conshohocken borough who have obtained a bachelor's degree or higher.
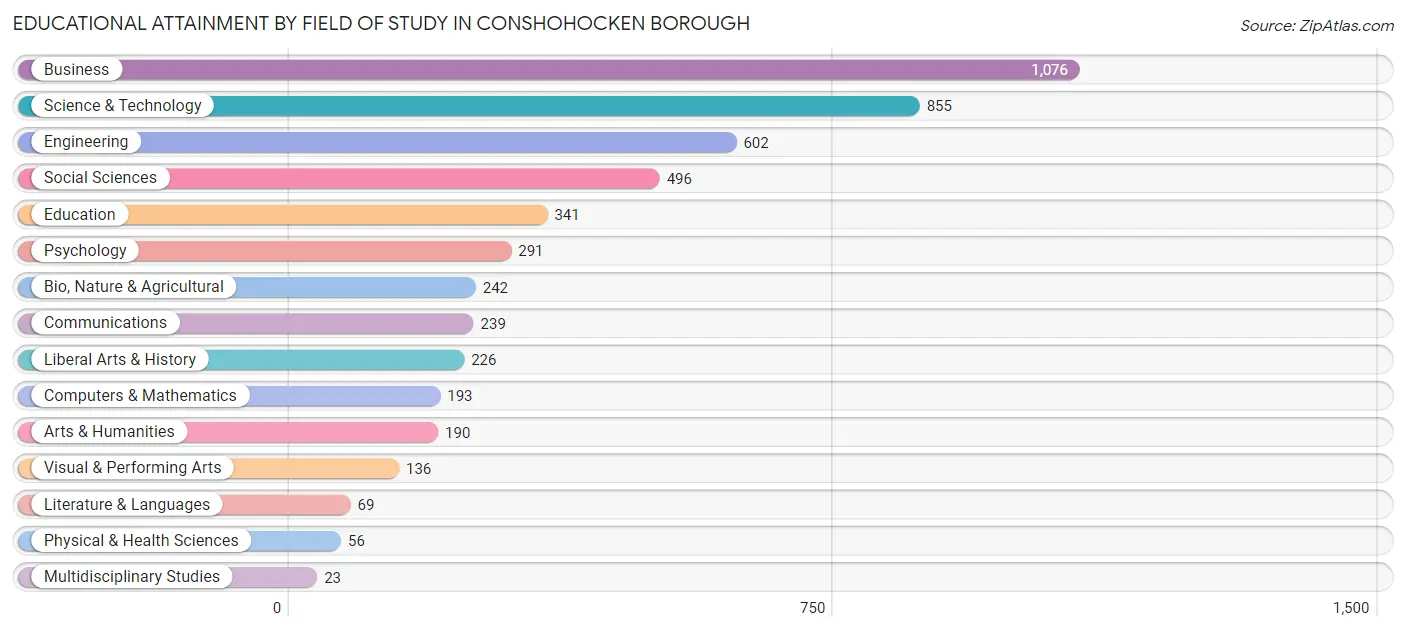
| Field of Study | # Graduates | % Graduates |
| Computers & Mathematics | 193 | 3.8% |
| Bio, Nature & Agricultural | 242 | 4.8% |
| Physical & Health Sciences | 56 | 1.1% |
| Psychology | 291 | 5.8% |
| Social Sciences | 496 | 9.9% |
| Engineering | 602 | 12.0% |
| Multidisciplinary Studies | 23 | 0.5% |
| Science & Technology | 855 | 17.0% |
| Business | 1,076 | 21.4% |
| Education | 341 | 6.8% |
| Literature & Languages | 69 | 1.4% |
| Liberal Arts & History | 226 | 4.5% |
| Visual & Performing Arts | 136 | 2.7% |
| Communications | 239 | 4.8% |
| Arts & Humanities | 190 | 3.8% |
| Total | 5,035 | 100.0% |
Transportation & Commute in Conshohocken borough
Vehicle Availability by Sex in Conshohocken borough
The most prevalent vehicle ownership categories in Conshohocken borough are males with 2 vehicles (1,823, accounting for 53.8%) and females with 2 vehicles (1,827, making up 60.2%).
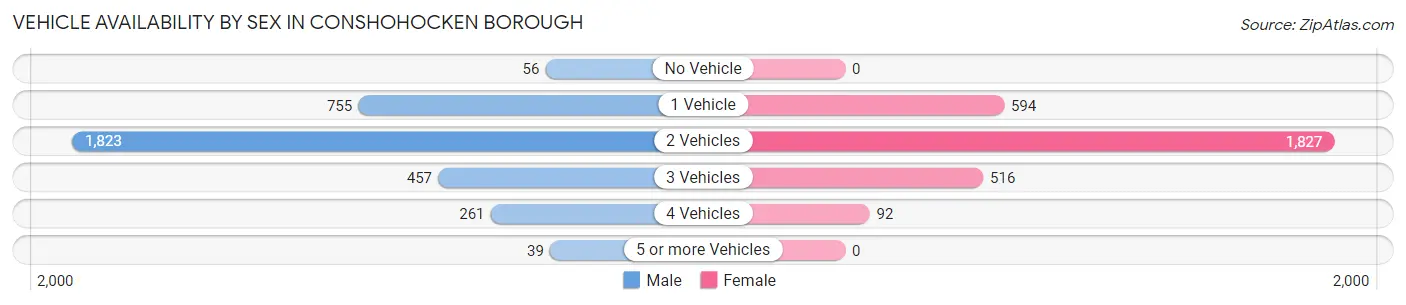
| Vehicles Available | Male | Female |
| No Vehicle | 56 (1.7%) | 0 (0.0%) |
| 1 Vehicle | 755 (22.3%) | 594 (19.6%) |
| 2 Vehicles | 1,823 (53.8%) | 1,827 (60.3%) |
| 3 Vehicles | 457 (13.5%) | 516 (17.0%) |
| 4 Vehicles | 261 (7.7%) | 92 (3.0%) |
| 5 or more Vehicles | 39 (1.1%) | 0 (0.0%) |
| Total | 3,391 (100.0%) | 3,029 (100.0%) |
Commute Time in Conshohocken borough
The most frequently occuring commute durations in Conshohocken borough are 30 to 34 minutes (1,081 commuters, 21.5%), 25 to 29 minutes (950 commuters, 18.9%), and 20 to 24 minutes (544 commuters, 10.8%).
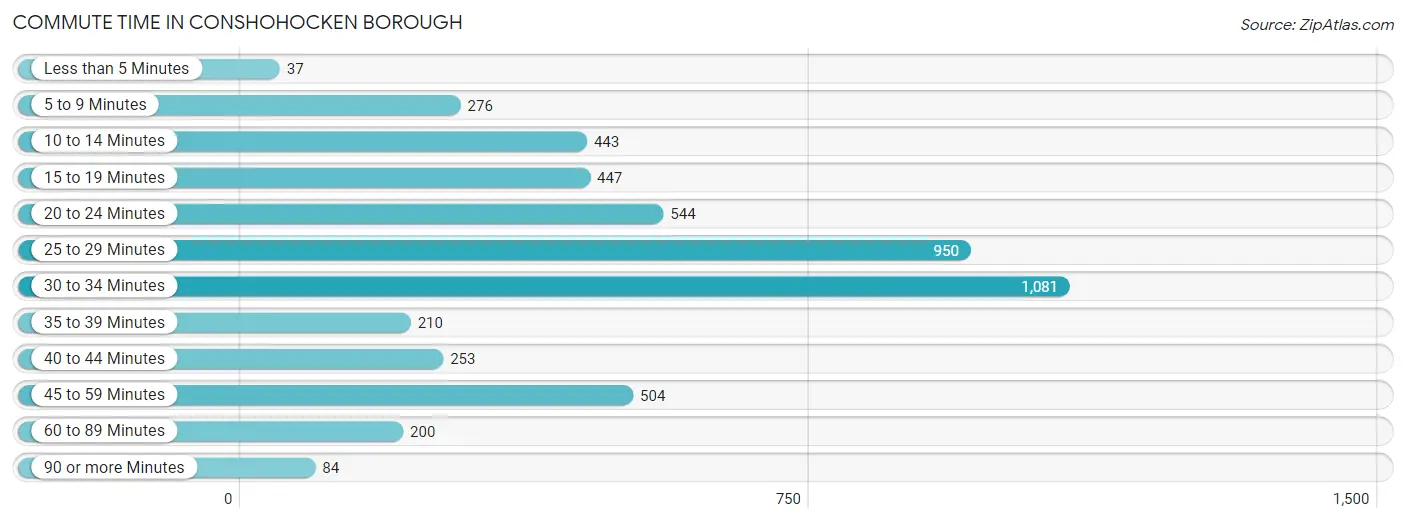
| Commute Time | # Commuters | % Commuters |
| Less than 5 Minutes | 37 | 0.7% |
| 5 to 9 Minutes | 276 | 5.5% |
| 10 to 14 Minutes | 443 | 8.8% |
| 15 to 19 Minutes | 447 | 8.9% |
| 20 to 24 Minutes | 544 | 10.8% |
| 25 to 29 Minutes | 950 | 18.9% |
| 30 to 34 Minutes | 1,081 | 21.5% |
| 35 to 39 Minutes | 210 | 4.2% |
| 40 to 44 Minutes | 253 | 5.0% |
| 45 to 59 Minutes | 504 | 10.0% |
| 60 to 89 Minutes | 200 | 4.0% |
| 90 or more Minutes | 84 | 1.7% |
Commute Time by Sex in Conshohocken borough
The most common commute times in Conshohocken borough are 25 to 29 minutes (617 commuters, 23.1%) for males and 30 to 34 minutes (682 commuters, 28.9%) for females.
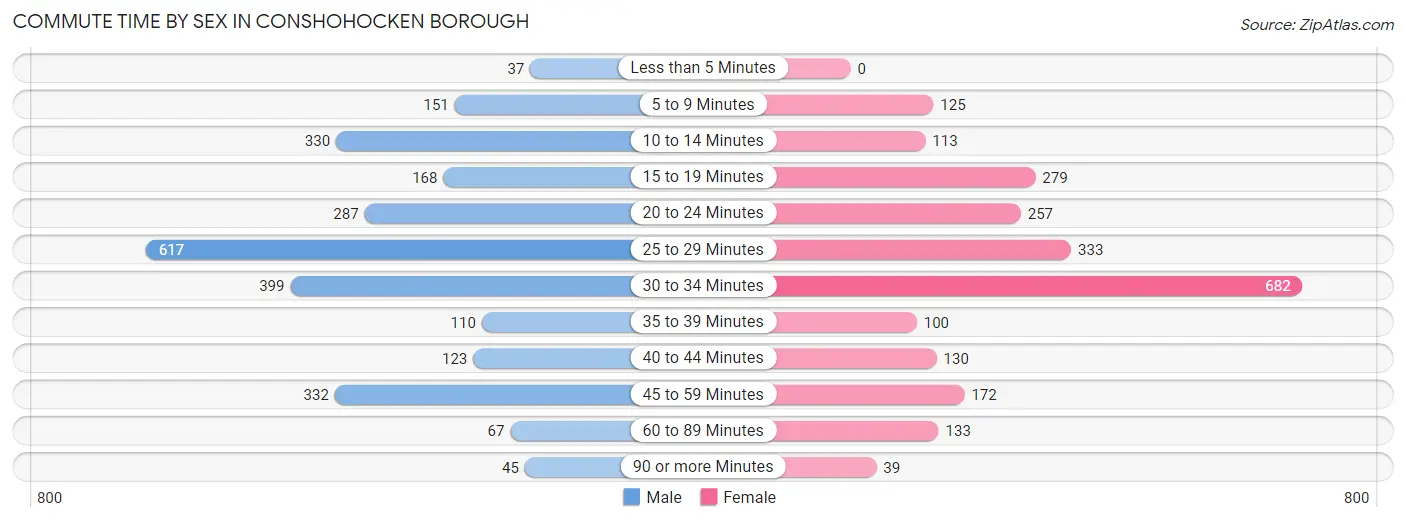
| Commute Time | Male | Female |
| Less than 5 Minutes | 37 (1.4%) | 0 (0.0%) |
| 5 to 9 Minutes | 151 (5.7%) | 125 (5.3%) |
| 10 to 14 Minutes | 330 (12.4%) | 113 (4.8%) |
| 15 to 19 Minutes | 168 (6.3%) | 279 (11.8%) |
| 20 to 24 Minutes | 287 (10.8%) | 257 (10.9%) |
| 25 to 29 Minutes | 617 (23.1%) | 333 (14.1%) |
| 30 to 34 Minutes | 399 (15.0%) | 682 (28.9%) |
| 35 to 39 Minutes | 110 (4.1%) | 100 (4.2%) |
| 40 to 44 Minutes | 123 (4.6%) | 130 (5.5%) |
| 45 to 59 Minutes | 332 (12.4%) | 172 (7.3%) |
| 60 to 89 Minutes | 67 (2.5%) | 133 (5.6%) |
| 90 or more Minutes | 45 (1.7%) | 39 (1.7%) |
Time of Departure to Work by Sex in Conshohocken borough
The most frequent times of departure to work in Conshohocken borough are 7:30 AM to 7:59 AM (403, 15.1%) for males and 7:30 AM to 7:59 AM (548, 23.2%) for females.
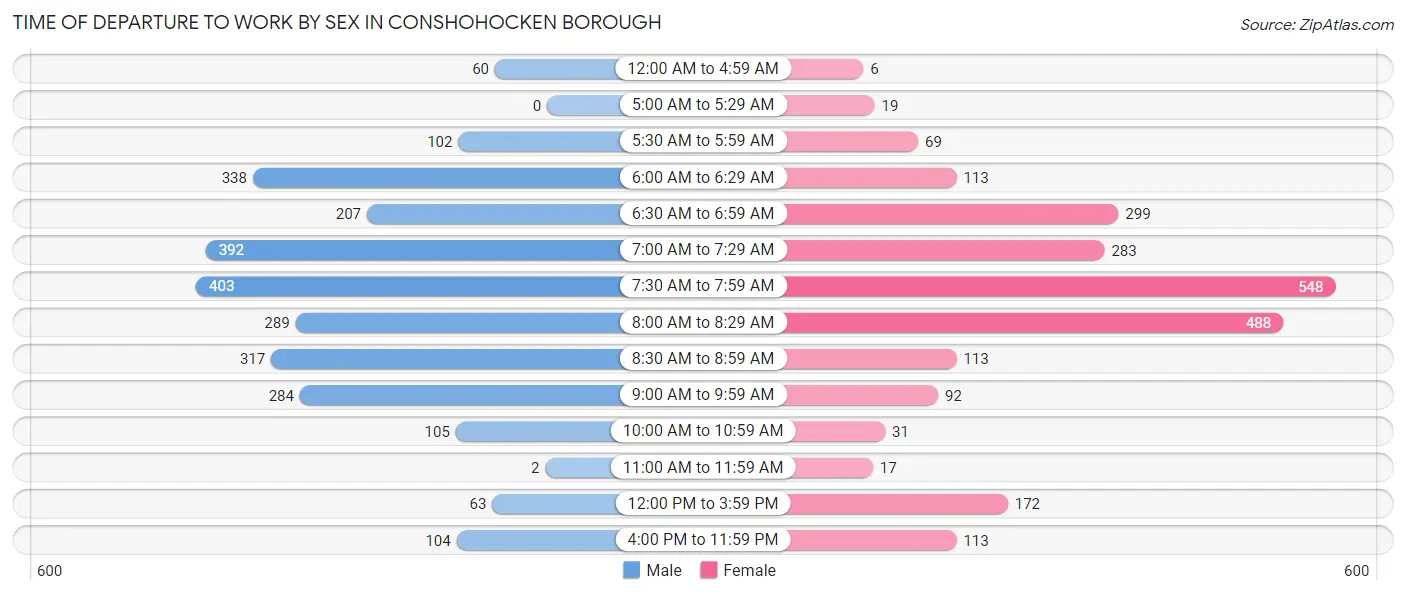
| Time of Departure | Male | Female |
| 12:00 AM to 4:59 AM | 60 (2.2%) | 6 (0.3%) |
| 5:00 AM to 5:29 AM | 0 (0.0%) | 19 (0.8%) |
| 5:30 AM to 5:59 AM | 102 (3.8%) | 69 (2.9%) |
| 6:00 AM to 6:29 AM | 338 (12.7%) | 113 (4.8%) |
| 6:30 AM to 6:59 AM | 207 (7.8%) | 299 (12.7%) |
| 7:00 AM to 7:29 AM | 392 (14.7%) | 283 (12.0%) |
| 7:30 AM to 7:59 AM | 403 (15.1%) | 548 (23.2%) |
| 8:00 AM to 8:29 AM | 289 (10.8%) | 488 (20.6%) |
| 8:30 AM to 8:59 AM | 317 (11.9%) | 113 (4.8%) |
| 9:00 AM to 9:59 AM | 284 (10.6%) | 92 (3.9%) |
| 10:00 AM to 10:59 AM | 105 (3.9%) | 31 (1.3%) |
| 11:00 AM to 11:59 AM | 2 (0.1%) | 17 (0.7%) |
| 12:00 PM to 3:59 PM | 63 (2.4%) | 172 (7.3%) |
| 4:00 PM to 11:59 PM | 104 (3.9%) | 113 (4.8%) |
| Total | 2,666 (100.0%) | 2,363 (100.0%) |
Housing Occupancy in Conshohocken borough
Occupancy by Ownership in Conshohocken borough
Of the total 4,333 dwellings in Conshohocken borough, owner-occupied units account for 2,306 (53.2%), while renter-occupied units make up 2,027 (46.8%).
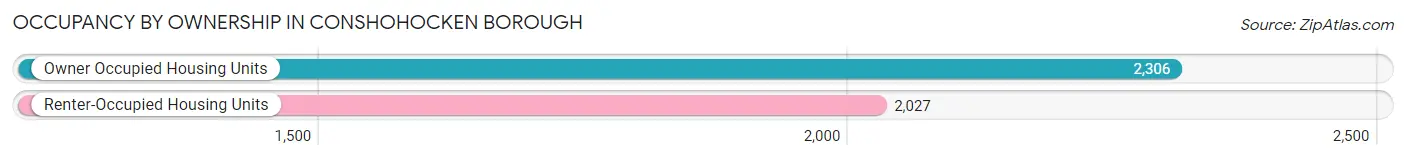
| Occupancy | # Housing Units | % Housing Units |
| Owner Occupied Housing Units | 2,306 | 53.2% |
| Renter-Occupied Housing Units | 2,027 | 46.8% |
| Total Occupied Housing Units | 4,333 | 100.0% |
Occupancy by Household Size in Conshohocken borough
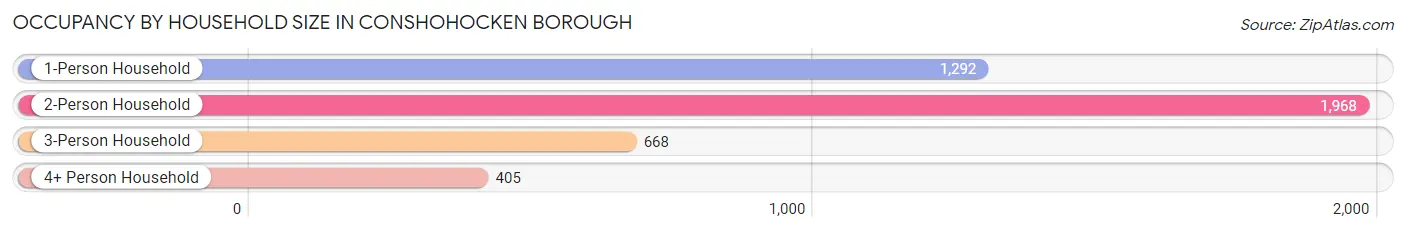
| Household Size | # Housing Units | % Housing Units |
| 1-Person Household | 1,292 | 29.8% |
| 2-Person Household | 1,968 | 45.4% |
| 3-Person Household | 668 | 15.4% |
| 4+ Person Household | 405 | 9.3% |
| Total Housing Units | 4,333 | 100.0% |
Occupancy by Ownership by Household Size in Conshohocken borough
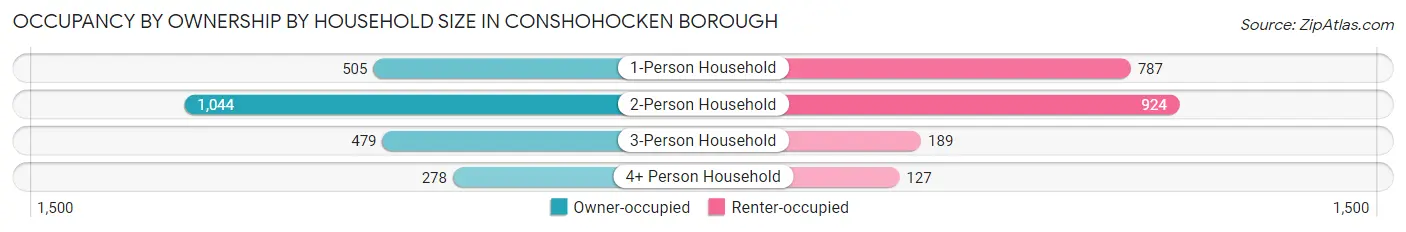
| Household Size | Owner-occupied | Renter-occupied |
| 1-Person Household | 505 (39.1%) | 787 (60.9%) |
| 2-Person Household | 1,044 (53.0%) | 924 (46.9%) |
| 3-Person Household | 479 (71.7%) | 189 (28.3%) |
| 4+ Person Household | 278 (68.6%) | 127 (31.4%) |
| Total Housing Units | 2,306 (53.2%) | 2,027 (46.8%) |
Occupancy by Educational Attainment in Conshohocken borough
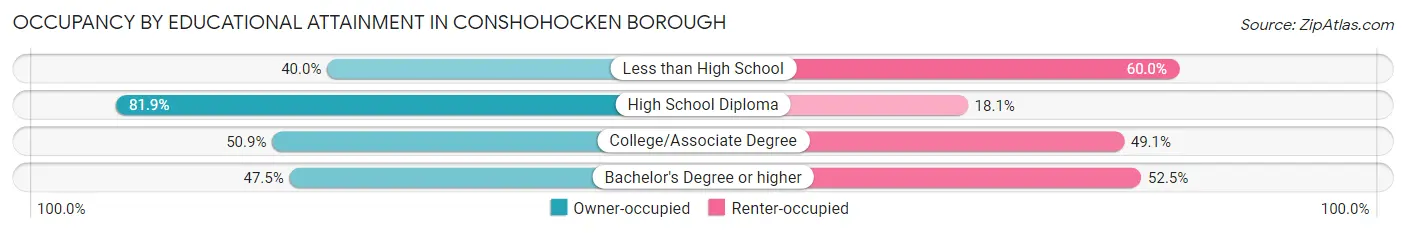
| Household Size | Owner-occupied | Renter-occupied |
| Less than High School | 26 (40.0%) | 39 (60.0%) |
| High School Diploma | 555 (81.9%) | 123 (18.1%) |
| College/Associate Degree | 311 (50.9%) | 300 (49.1%) |
| Bachelor's Degree or higher | 1,414 (47.5%) | 1,565 (52.5%) |
Occupancy by Age of Householder in Conshohocken borough
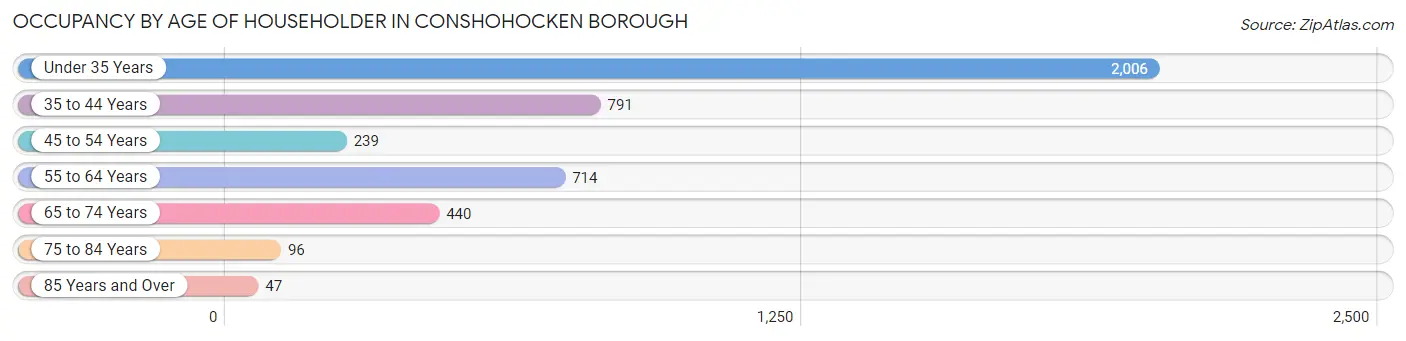
| Age Bracket | # Households | % Households |
| Under 35 Years | 2,006 | 46.3% |
| 35 to 44 Years | 791 | 18.3% |
| 45 to 54 Years | 239 | 5.5% |
| 55 to 64 Years | 714 | 16.5% |
| 65 to 74 Years | 440 | 10.2% |
| 75 to 84 Years | 96 | 2.2% |
| 85 Years and Over | 47 | 1.1% |
| Total | 4,333 | 100.0% |
Housing Finances in Conshohocken borough
Median Income by Occupancy in Conshohocken borough
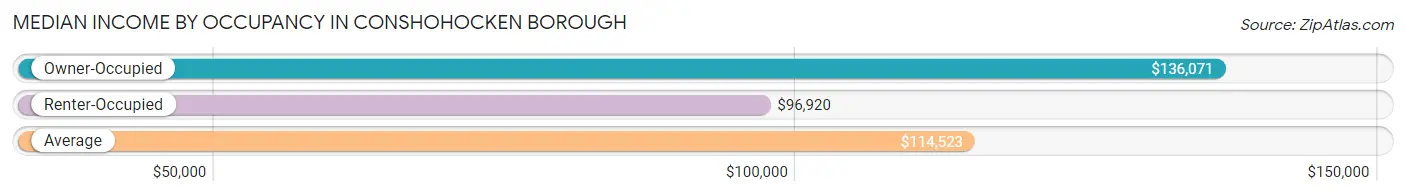
| Occupancy Type | # Households | Median Income |
| Owner-Occupied | 2,306 (53.2%) | $136,071 |
| Renter-Occupied | 2,027 (46.8%) | $96,920 |
| Average | 4,333 (100.0%) | $114,523 |
Occupancy by Householder Income Bracket in Conshohocken borough
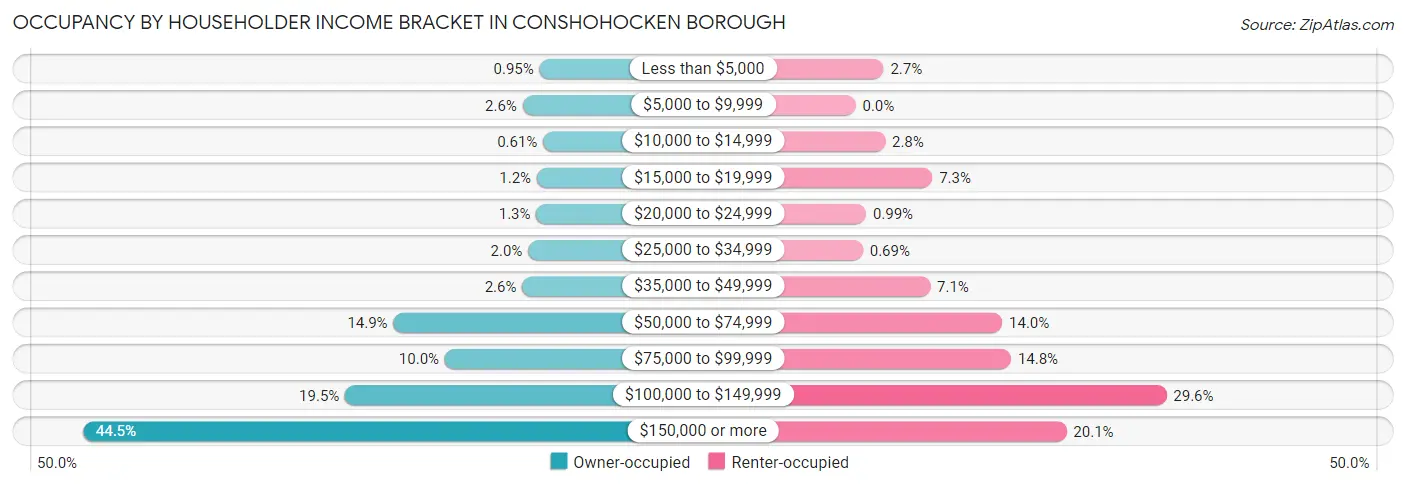
| Income Bracket | Owner-occupied | Renter-occupied |
| Less than $5,000 | 22 (0.9%) | 54 (2.7%) |
| $5,000 to $9,999 | 59 (2.6%) | 0 (0.0%) |
| $10,000 to $14,999 | 14 (0.6%) | 57 (2.8%) |
| $15,000 to $19,999 | 28 (1.2%) | 148 (7.3%) |
| $20,000 to $24,999 | 29 (1.3%) | 20 (1.0%) |
| $25,000 to $34,999 | 47 (2.0%) | 14 (0.7%) |
| $35,000 to $49,999 | 60 (2.6%) | 144 (7.1%) |
| $50,000 to $74,999 | 343 (14.9%) | 283 (14.0%) |
| $75,000 to $99,999 | 230 (10.0%) | 300 (14.8%) |
| $100,000 to $149,999 | 449 (19.5%) | 600 (29.6%) |
| $150,000 or more | 1,025 (44.5%) | 407 (20.1%) |
| Total | 2,306 (100.0%) | 2,027 (100.0%) |
Monthly Housing Cost Tiers in Conshohocken borough
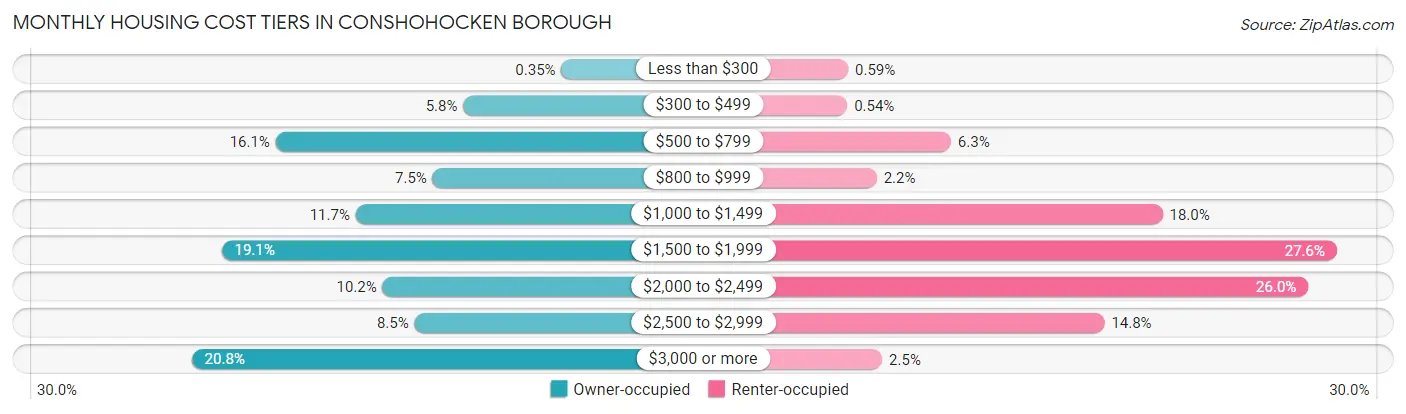
| Monthly Cost | Owner-occupied | Renter-occupied |
| Less than $300 | 8 (0.4%) | 12 (0.6%) |
| $300 to $499 | 133 (5.8%) | 11 (0.5%) |
| $500 to $799 | 372 (16.1%) | 127 (6.3%) |
| $800 to $999 | 172 (7.5%) | 44 (2.2%) |
| $1,000 to $1,499 | 270 (11.7%) | 364 (18.0%) |
| $1,500 to $1,999 | 441 (19.1%) | 559 (27.6%) |
| $2,000 to $2,499 | 236 (10.2%) | 527 (26.0%) |
| $2,500 to $2,999 | 195 (8.5%) | 299 (14.7%) |
| $3,000 or more | 479 (20.8%) | 50 (2.5%) |
| Total | 2,306 (100.0%) | 2,027 (100.0%) |
Physical Housing Characteristics in Conshohocken borough
Housing Structures in Conshohocken borough
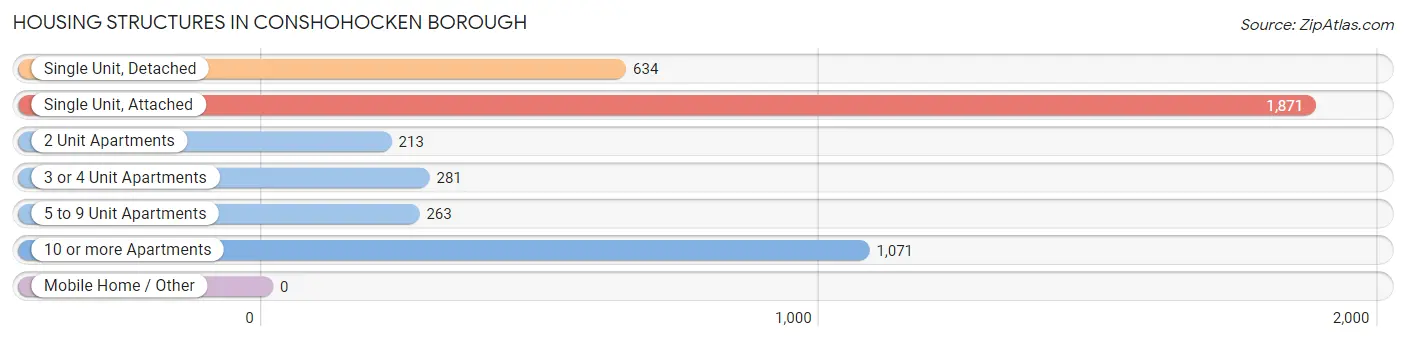
| Structure Type | # Housing Units | % Housing Units |
| Single Unit, Detached | 634 | 14.6% |
| Single Unit, Attached | 1,871 | 43.2% |
| 2 Unit Apartments | 213 | 4.9% |
| 3 or 4 Unit Apartments | 281 | 6.5% |
| 5 to 9 Unit Apartments | 263 | 6.1% |
| 10 or more Apartments | 1,071 | 24.7% |
| Mobile Home / Other | 0 | 0.0% |
| Total | 4,333 | 100.0% |
Housing Structures by Occupancy in Conshohocken borough
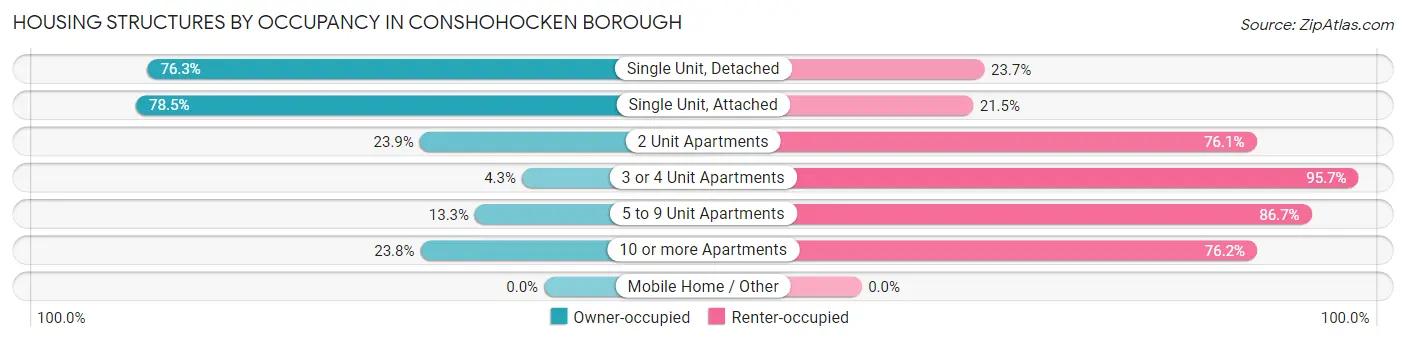
| Structure Type | Owner-occupied | Renter-occupied |
| Single Unit, Detached | 484 (76.3%) | 150 (23.7%) |
| Single Unit, Attached | 1,469 (78.5%) | 402 (21.5%) |
| 2 Unit Apartments | 51 (23.9%) | 162 (76.1%) |
| 3 or 4 Unit Apartments | 12 (4.3%) | 269 (95.7%) |
| 5 to 9 Unit Apartments | 35 (13.3%) | 228 (86.7%) |
| 10 or more Apartments | 255 (23.8%) | 816 (76.2%) |
| Mobile Home / Other | 0 (0.0%) | 0 (0.0%) |
| Total | 2,306 (53.2%) | 2,027 (46.8%) |
Housing Structures by Number of Rooms in Conshohocken borough
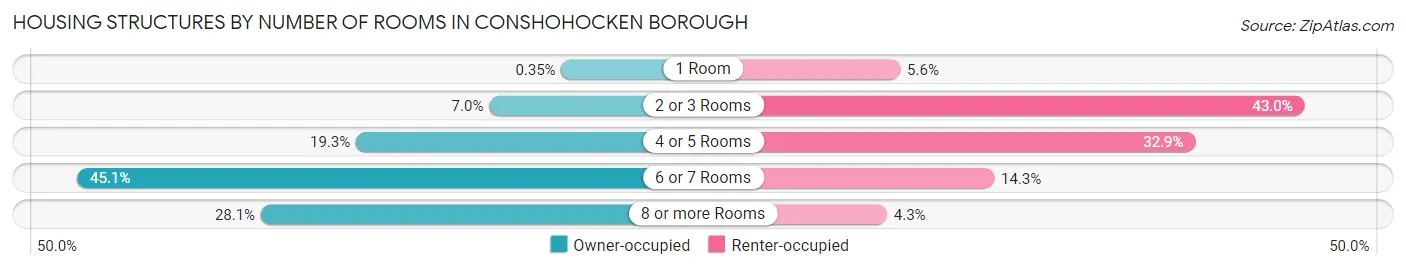
| Number of Rooms | Owner-occupied | Renter-occupied |
| 1 Room | 8 (0.4%) | 113 (5.6%) |
| 2 or 3 Rooms | 162 (7.0%) | 871 (43.0%) |
| 4 or 5 Rooms | 446 (19.3%) | 666 (32.9%) |
| 6 or 7 Rooms | 1,041 (45.1%) | 289 (14.3%) |
| 8 or more Rooms | 649 (28.1%) | 88 (4.3%) |
| Total | 2,306 (100.0%) | 2,027 (100.0%) |
Housing Structure by Heating Type in Conshohocken borough
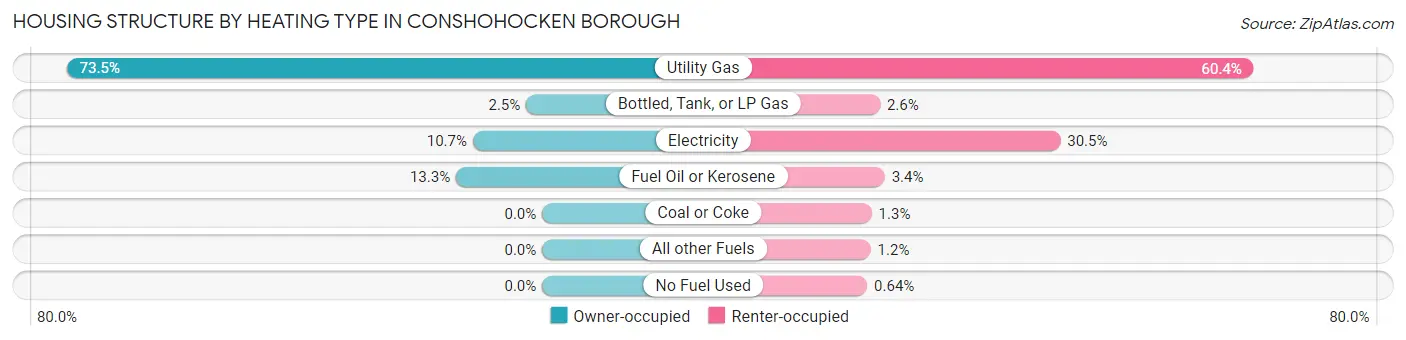
| Heating Type | Owner-occupied | Renter-occupied |
| Utility Gas | 1,695 (73.5%) | 1,224 (60.4%) |
| Bottled, Tank, or LP Gas | 57 (2.5%) | 53 (2.6%) |
| Electricity | 247 (10.7%) | 618 (30.5%) |
| Fuel Oil or Kerosene | 307 (13.3%) | 68 (3.4%) |
| Coal or Coke | 0 (0.0%) | 27 (1.3%) |
| All other Fuels | 0 (0.0%) | 24 (1.2%) |
| No Fuel Used | 0 (0.0%) | 13 (0.6%) |
| Total | 2,306 (100.0%) | 2,027 (100.0%) |
Household Vehicle Usage in Conshohocken borough
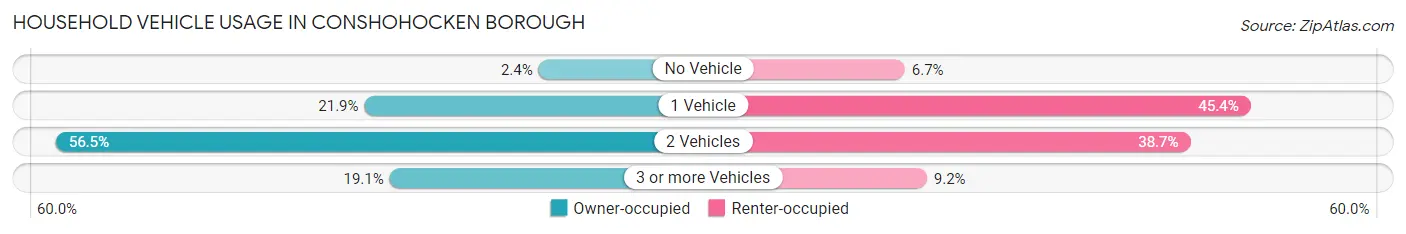
| Vehicles per Household | Owner-occupied | Renter-occupied |
| No Vehicle | 56 (2.4%) | 136 (6.7%) |
| 1 Vehicle | 506 (21.9%) | 921 (45.4%) |
| 2 Vehicles | 1,303 (56.5%) | 784 (38.7%) |
| 3 or more Vehicles | 441 (19.1%) | 186 (9.2%) |
| Total | 2,306 (100.0%) | 2,027 (100.0%) |
Real Estate & Mortgages in Conshohocken borough
Real Estate and Mortgage Overview in Conshohocken borough
| Characteristic | Without Mortgage | With Mortgage |
| Housing Units | 682 | 1,624 |
| Median Property Value | $318,700 | $410,800 |
| Median Household Income | $91,131 | $809 |
| Monthly Housing Costs | $714 | $479 |
| Real Estate Taxes | $3,117 | $0 |
Property Value by Mortgage Status in Conshohocken borough
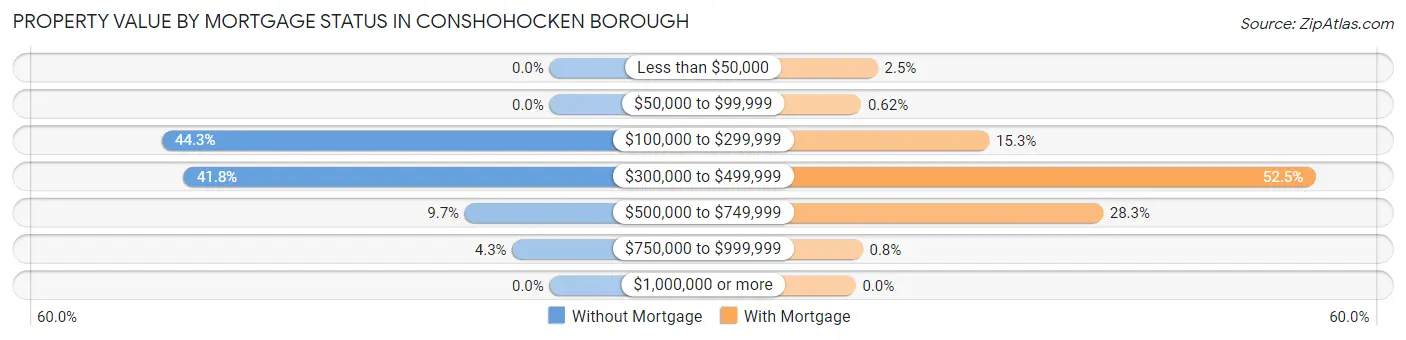
| Property Value | Without Mortgage | With Mortgage |
| Less than $50,000 | 0 (0.0%) | 41 (2.5%) |
| $50,000 to $99,999 | 0 (0.0%) | 10 (0.6%) |
| $100,000 to $299,999 | 302 (44.3%) | 248 (15.3%) |
| $300,000 to $499,999 | 285 (41.8%) | 853 (52.5%) |
| $500,000 to $749,999 | 66 (9.7%) | 459 (28.3%) |
| $750,000 to $999,999 | 29 (4.3%) | 13 (0.8%) |
| $1,000,000 or more | 0 (0.0%) | 0 (0.0%) |
| Total | 682 (100.0%) | 1,624 (100.0%) |
Household Income by Mortgage Status in Conshohocken borough
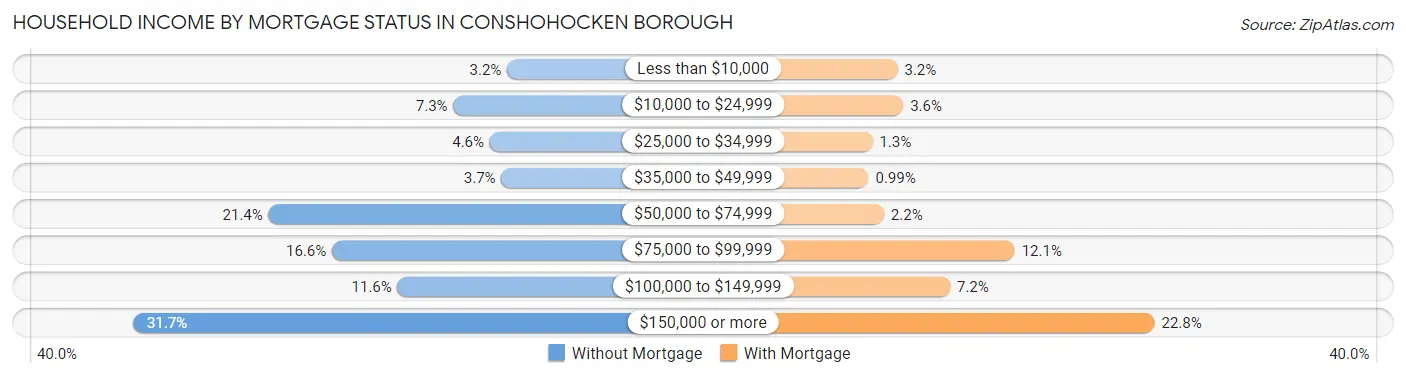
| Household Income | Without Mortgage | With Mortgage |
| Less than $10,000 | 22 (3.2%) | 52 (3.2%) |
| $10,000 to $24,999 | 50 (7.3%) | 59 (3.6%) |
| $25,000 to $34,999 | 31 (4.5%) | 21 (1.3%) |
| $35,000 to $49,999 | 25 (3.7%) | 16 (1.0%) |
| $50,000 to $74,999 | 146 (21.4%) | 35 (2.2%) |
| $75,000 to $99,999 | 113 (16.6%) | 197 (12.1%) |
| $100,000 to $149,999 | 79 (11.6%) | 117 (7.2%) |
| $150,000 or more | 216 (31.7%) | 370 (22.8%) |
| Total | 682 (100.0%) | 1,624 (100.0%) |
Property Value to Household Income Ratio in Conshohocken borough
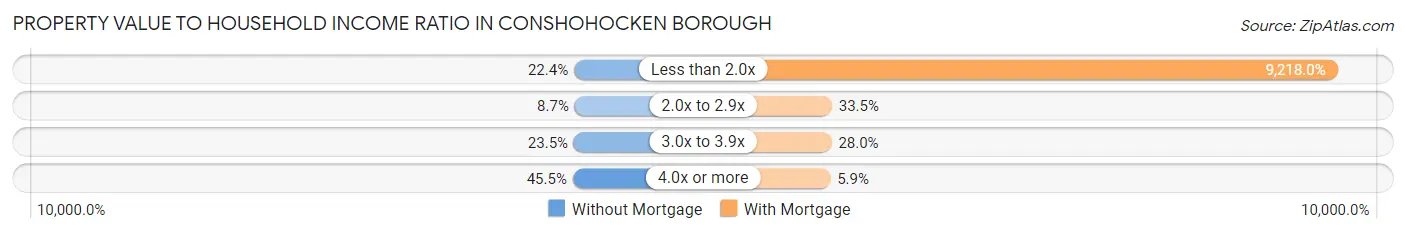
| Value-to-Income Ratio | Without Mortgage | With Mortgage |
| Less than 2.0x | 153 (22.4%) | 149,700 (9,218.0%) |
| 2.0x to 2.9x | 59 (8.6%) | 544 (33.5%) |
| 3.0x to 3.9x | 160 (23.5%) | 455 (28.0%) |
| 4.0x or more | 310 (45.5%) | 96 (5.9%) |
| Total | 682 (100.0%) | 1,624 (100.0%) |
Real Estate Taxes by Mortgage Status in Conshohocken borough
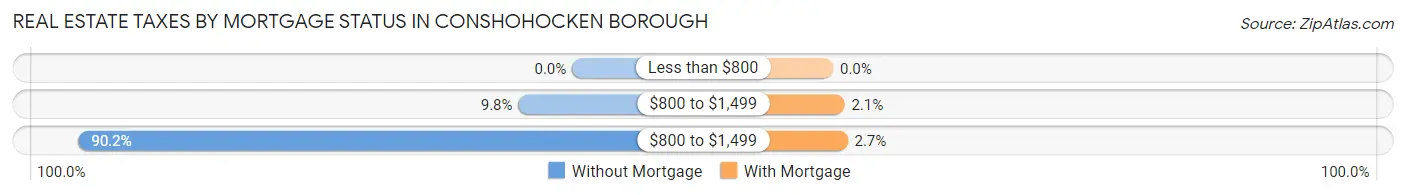
| Property Taxes | Without Mortgage | With Mortgage |
| Less than $800 | 0 (0.0%) | 0 (0.0%) |
| $800 to $1,499 | 67 (9.8%) | 34 (2.1%) |
| $800 to $1,499 | 615 (90.2%) | 43 (2.6%) |
| Total | 682 (100.0%) | 1,624 (100.0%) |
Health & Disability in Conshohocken borough
Health Insurance Coverage by Age in Conshohocken borough
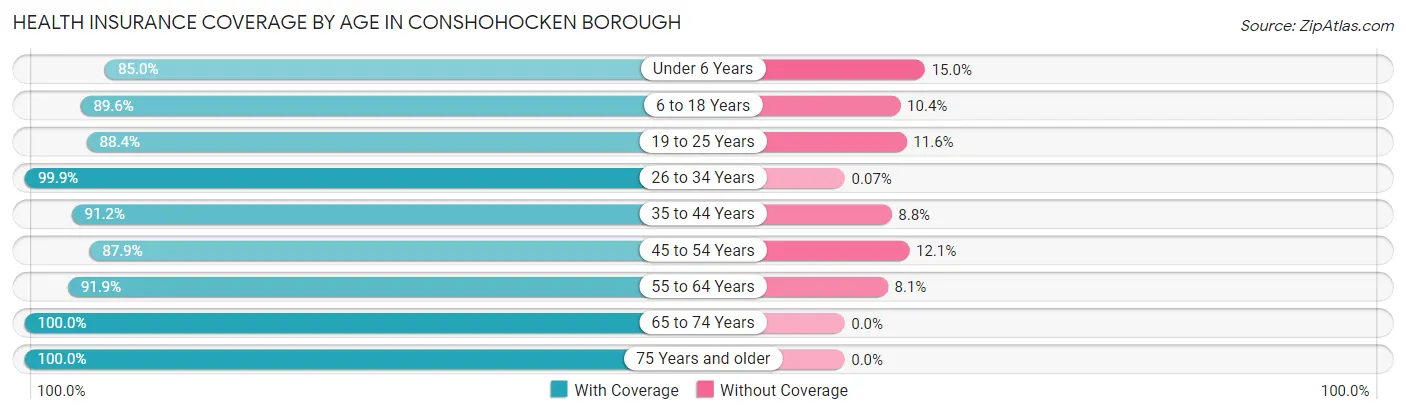
| Age Bracket | With Coverage | Without Coverage |
| Under 6 Years | 374 (85.0%) | 66 (15.0%) |
| 6 to 18 Years | 696 (89.6%) | 81 (10.4%) |
| 19 to 25 Years | 901 (88.4%) | 118 (11.6%) |
| 26 to 34 Years | 2,987 (99.9%) | 2 (0.1%) |
| 35 to 44 Years | 1,258 (91.2%) | 121 (8.8%) |
| 45 to 54 Years | 466 (87.9%) | 64 (12.1%) |
| 55 to 64 Years | 1,059 (91.9%) | 93 (8.1%) |
| 65 to 74 Years | 592 (100.0%) | 0 (0.0%) |
| 75 Years and older | 301 (100.0%) | 0 (0.0%) |
| Total | 8,634 (94.1%) | 545 (5.9%) |
Health Insurance Coverage by Citizenship Status in Conshohocken borough
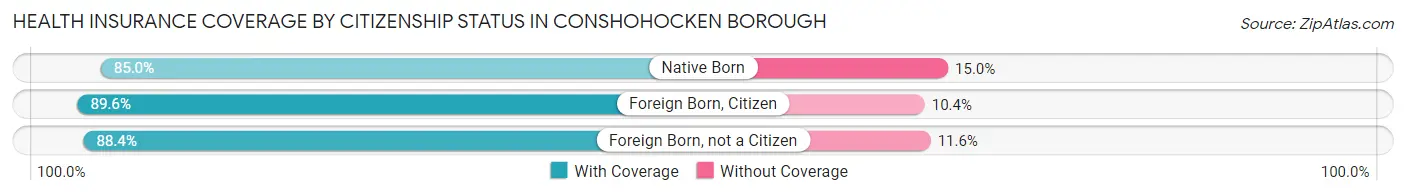
| Citizenship Status | With Coverage | Without Coverage |
| Native Born | 374 (85.0%) | 66 (15.0%) |
| Foreign Born, Citizen | 696 (89.6%) | 81 (10.4%) |
| Foreign Born, not a Citizen | 901 (88.4%) | 118 (11.6%) |
Health Insurance Coverage by Household Income in Conshohocken borough
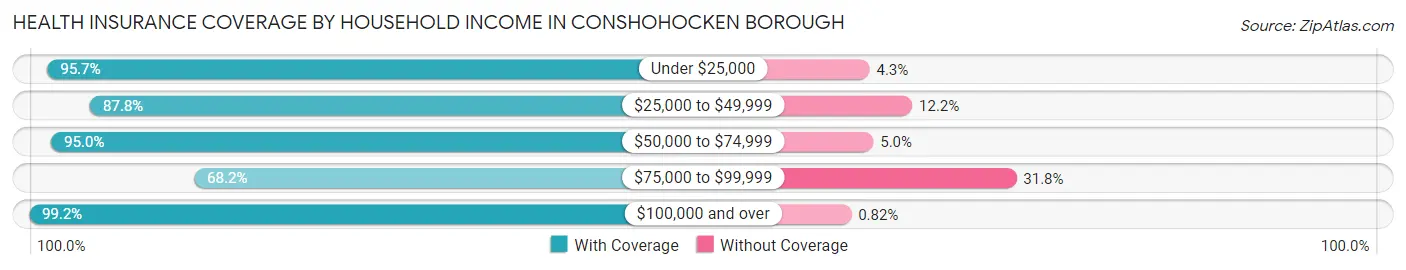
| Household Income | With Coverage | Without Coverage |
| Under $25,000 | 495 (95.7%) | 22 (4.3%) |
| $25,000 to $49,999 | 373 (87.8%) | 52 (12.2%) |
| $50,000 to $74,999 | 1,187 (95.0%) | 62 (5.0%) |
| $75,000 to $99,999 | 771 (68.2%) | 359 (31.8%) |
| $100,000 and over | 5,785 (99.2%) | 48 (0.8%) |
Public vs Private Health Insurance Coverage by Age in Conshohocken borough
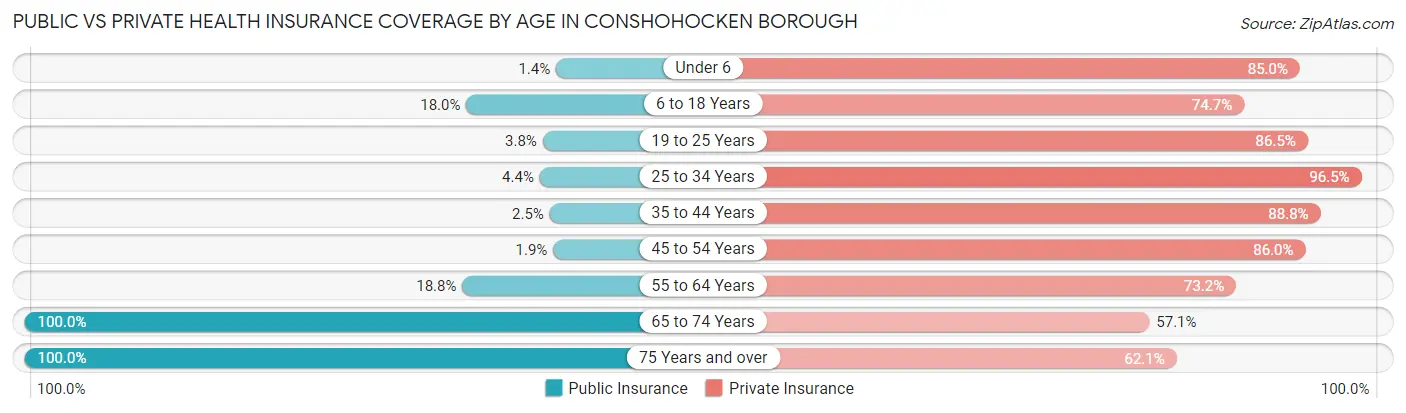
| Age Bracket | Public Insurance | Private Insurance |
| Under 6 | 6 (1.4%) | 374 (85.0%) |
| 6 to 18 Years | 140 (18.0%) | 580 (74.7%) |
| 19 to 25 Years | 39 (3.8%) | 881 (86.5%) |
| 25 to 34 Years | 131 (4.4%) | 2,883 (96.5%) |
| 35 to 44 Years | 35 (2.5%) | 1,225 (88.8%) |
| 45 to 54 Years | 10 (1.9%) | 456 (86.0%) |
| 55 to 64 Years | 216 (18.8%) | 843 (73.2%) |
| 65 to 74 Years | 592 (100.0%) | 338 (57.1%) |
| 75 Years and over | 301 (100.0%) | 187 (62.1%) |
| Total | 1,470 (16.0%) | 7,767 (84.6%) |
Disability Status by Sex by Age in Conshohocken borough
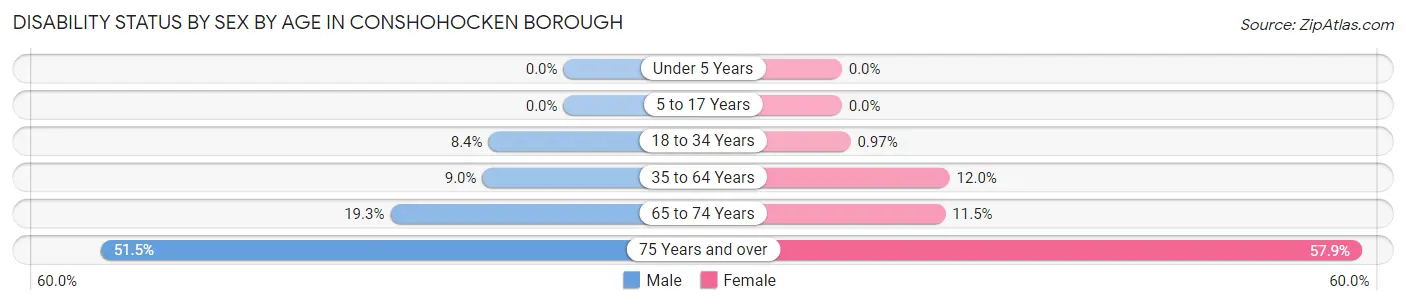
| Age Bracket | Male | Female |
| Under 5 Years | 0 (0.0%) | 0 (0.0%) |
| 5 to 17 Years | 0 (0.0%) | 0 (0.0%) |
| 18 to 34 Years | 180 (8.4%) | 18 (1.0%) |
| 35 to 64 Years | 135 (9.0%) | 188 (12.0%) |
| 65 to 74 Years | 64 (19.3%) | 30 (11.5%) |
| 75 Years and over | 51 (51.5%) | 117 (57.9%) |
Disability Class by Sex by Age in Conshohocken borough
Disability Class: Hearing Difficulty
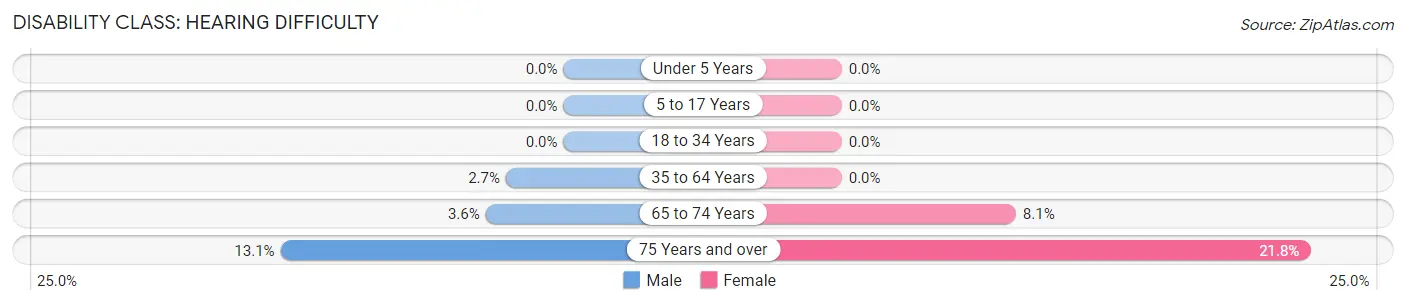
| Age Bracket | Male | Female |
| Under 5 Years | 0 (0.0%) | 0 (0.0%) |
| 5 to 17 Years | 0 (0.0%) | 0 (0.0%) |
| 18 to 34 Years | 0 (0.0%) | 0 (0.0%) |
| 35 to 64 Years | 40 (2.7%) | 0 (0.0%) |
| 65 to 74 Years | 12 (3.6%) | 21 (8.1%) |
| 75 Years and over | 13 (13.1%) | 44 (21.8%) |
Disability Class: Vision Difficulty
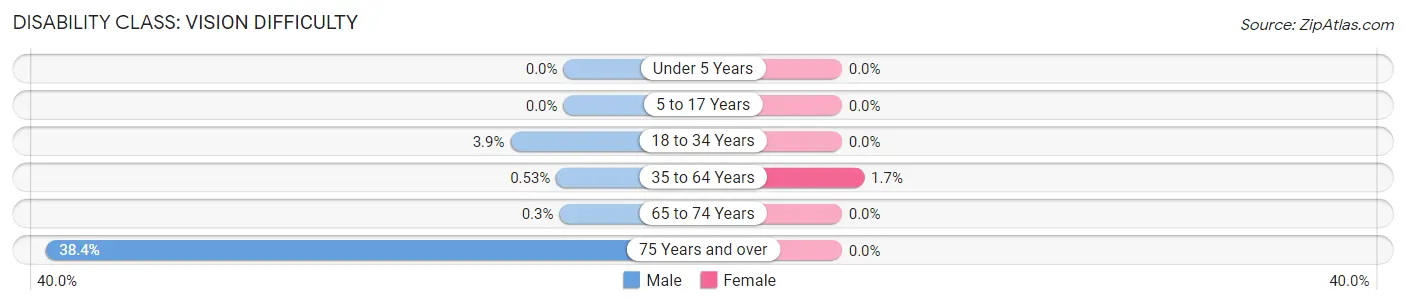
| Age Bracket | Male | Female |
| Under 5 Years | 0 (0.0%) | 0 (0.0%) |
| 5 to 17 Years | 0 (0.0%) | 0 (0.0%) |
| 18 to 34 Years | 85 (3.9%) | 0 (0.0%) |
| 35 to 64 Years | 8 (0.5%) | 26 (1.7%) |
| 65 to 74 Years | 1 (0.3%) | 0 (0.0%) |
| 75 Years and over | 38 (38.4%) | 0 (0.0%) |
Disability Class: Cognitive Difficulty
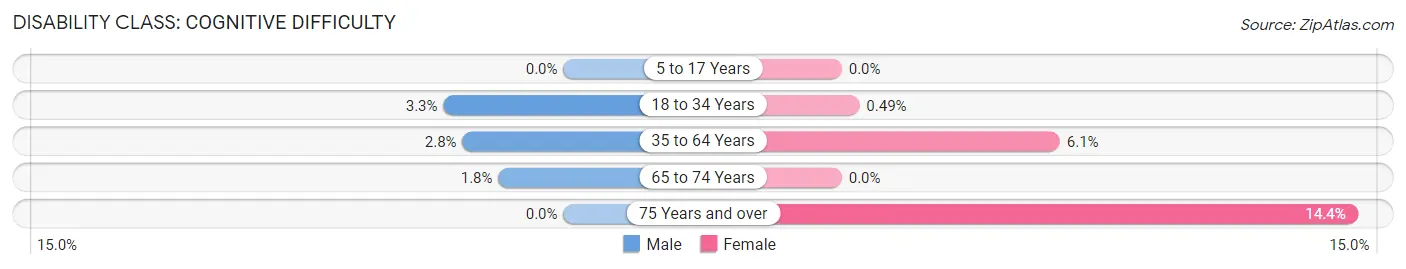
| Age Bracket | Male | Female |
| 5 to 17 Years | 0 (0.0%) | 0 (0.0%) |
| 18 to 34 Years | 72 (3.3%) | 9 (0.5%) |
| 35 to 64 Years | 42 (2.8%) | 95 (6.1%) |
| 65 to 74 Years | 6 (1.8%) | 0 (0.0%) |
| 75 Years and over | 0 (0.0%) | 29 (14.4%) |
Disability Class: Ambulatory Difficulty
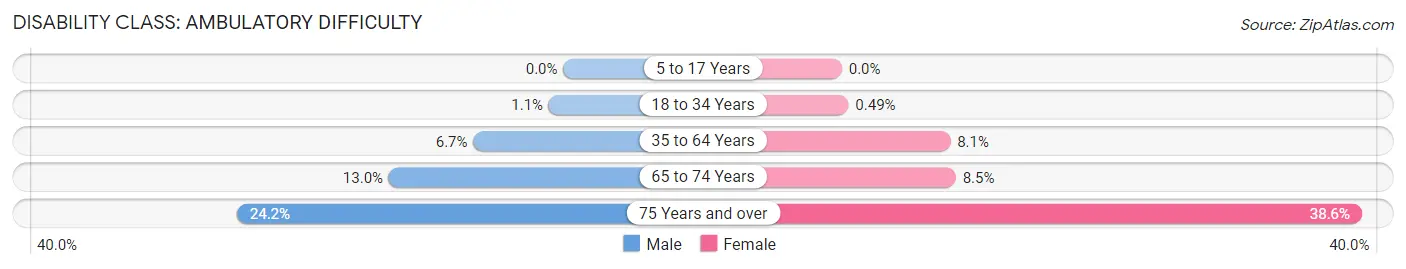
| Age Bracket | Male | Female |
| 5 to 17 Years | 0 (0.0%) | 0 (0.0%) |
| 18 to 34 Years | 23 (1.1%) | 9 (0.5%) |
| 35 to 64 Years | 100 (6.7%) | 126 (8.1%) |
| 65 to 74 Years | 43 (13.0%) | 22 (8.5%) |
| 75 Years and over | 24 (24.2%) | 78 (38.6%) |
Disability Class: Self-Care Difficulty
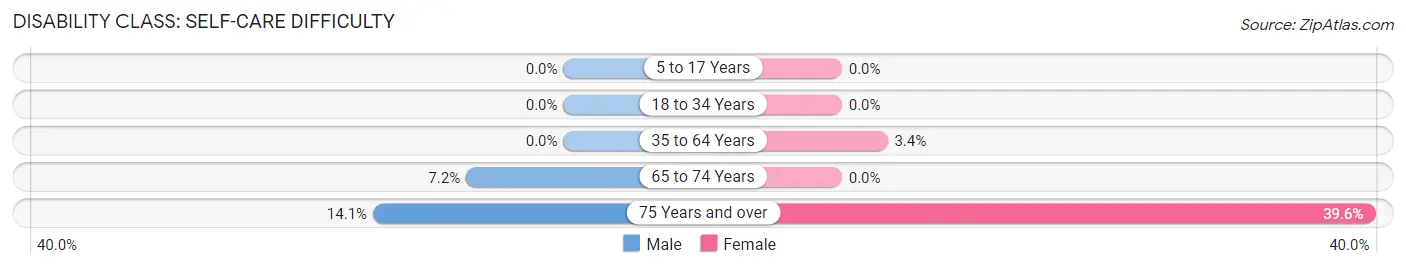
| Age Bracket | Male | Female |
| 5 to 17 Years | 0 (0.0%) | 0 (0.0%) |
| 18 to 34 Years | 0 (0.0%) | 0 (0.0%) |
| 35 to 64 Years | 0 (0.0%) | 53 (3.4%) |
| 65 to 74 Years | 24 (7.2%) | 0 (0.0%) |
| 75 Years and over | 14 (14.1%) | 80 (39.6%) |
Technology Access in Conshohocken borough
Computing Device Access in Conshohocken borough
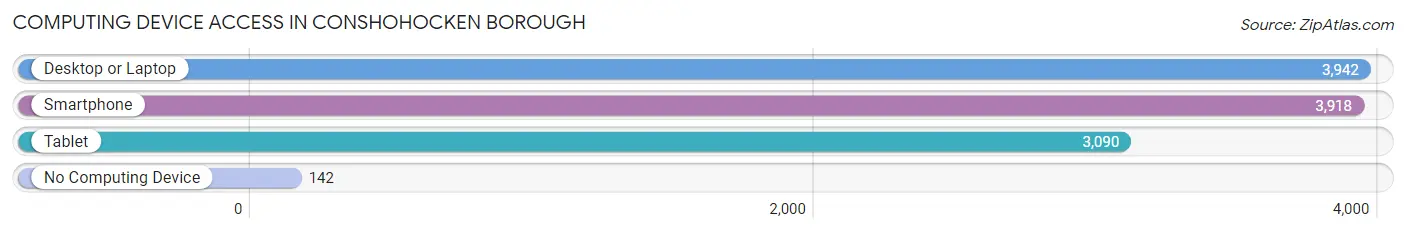
| Device Type | # Households | % Households |
| Desktop or Laptop | 3,942 | 91.0% |
| Smartphone | 3,918 | 90.4% |
| Tablet | 3,090 | 71.3% |
| No Computing Device | 142 | 3.3% |
| Total | 4,333 | 100.0% |
Internet Access in Conshohocken borough
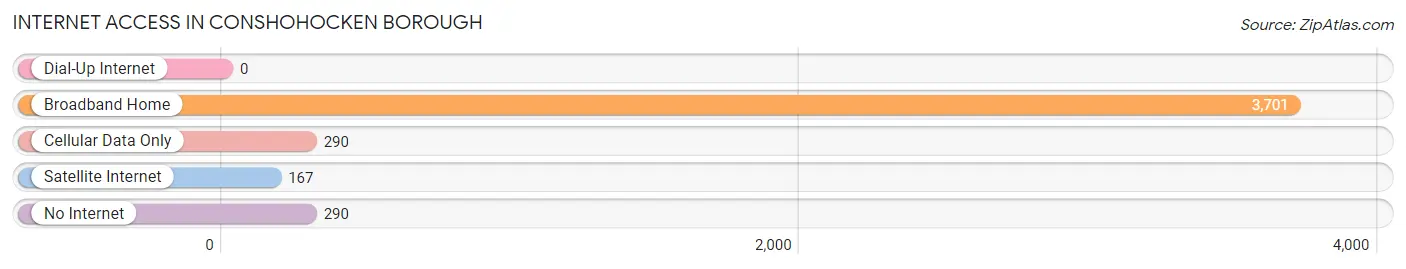
| Internet Type | # Households | % Households |
| Dial-Up Internet | 0 | 0.0% |
| Broadband Home | 3,701 | 85.4% |
| Cellular Data Only | 290 | 6.7% |
| Satellite Internet | 167 | 3.8% |
| No Internet | 290 | 6.7% |
| Total | 4,333 | 100.0% |
Conshohocken borough Summary
Conshohocken Borough is a small borough located in Montgomery County, Pennsylvania. It is situated along the Schuylkill River, just west of Philadelphia. The borough is part of the Greater Philadelphia metropolitan area and is home to a population of 8,500 people.
History
The area that is now Conshohocken was originally inhabited by the Lenni Lenape Native Americans. The first European settlers arrived in the area in the late 17th century. The area was originally part of Philadelphia County, but was incorporated as a borough in 1812. The name “Conshohocken” is derived from the Lenni Lenape word “Kanshihakink”, which means “pleasant valley”.
The borough was an important industrial center during the 19th and early 20th centuries. It was home to several steel mills, paper mills, and other factories. The borough was also home to a large number of immigrants, including Irish, Italian, and Polish immigrants.
Geography
Conshohocken is located in southeastern Pennsylvania, along the Schuylkill River. It is bordered by West Conshohocken to the north, Plymouth Township to the east, Whitemarsh Township to the south, and Lower Merion Township to the west. The borough covers an area of 1.3 square miles and has a population density of 6,400 people per square mile.
The borough is located in the Piedmont region of Pennsylvania, which is characterized by rolling hills and valleys. The borough is located at the intersection of two major highways, the Schuylkill Expressway and the Pennsylvania Turnpike.
Economy
Conshohocken is a primarily residential community, but it is also home to a number of businesses. The borough is home to several corporate headquarters, including the headquarters of the pharmaceutical company GlaxoSmithKline. The borough is also home to a number of small businesses, including restaurants, retail stores, and professional services.
The borough is home to a number of industrial parks, which are home to a variety of businesses, including manufacturing, warehousing, and distribution. The borough is also home to a number of technology companies, including software development firms and web design companies.
Demographics
As of the 2010 census, the population of Conshohocken was 8,500 people. The racial makeup of the borough was 79.3% White, 11.2% African American, 0.3% Native American, 4.2% Asian, and 4.9% from other races. The median household income was $60,000, and the median family income was $71,000.
The borough is home to a large number of immigrants, including Irish, Italian, and Polish immigrants. The borough is also home to a large number of college students, as it is located near several universities, including Villanova University, Drexel University, and the University of Pennsylvania.
Conclusion
Conshohocken is a small borough located in southeastern Pennsylvania, along the Schuylkill River. It is home to a population of 8,500 people and is part of the Greater Philadelphia metropolitan area. The borough is an important industrial center and is home to a number of businesses, including corporate headquarters, small businesses, and industrial parks. The borough is also home to a large number of immigrants, including Irish, Italian, and Polish immigrants.
Common Questions
What is the Total Population of Conshohocken borough?
Total Population of Conshohocken borough is 9,182.
What is the Total Male Population of Conshohocken borough?
Total Male Population of Conshohocken borough is 4,671.
What is the Total Female Population of Conshohocken borough?
Total Female Population of Conshohocken borough is 4,511.
What is the Ratio of Males per 100 Females in Conshohocken borough?
There are 103.55 Males per 100 Females in Conshohocken borough.
What is the Ratio of Females per 100 Males in Conshohocken borough?
There are 96.57 Females per 100 Males in Conshohocken borough.
What is the Median Population Age in Conshohocken borough?
Median Population Age in Conshohocken borough is 32.3 Years.
What is the Average Family Size in Conshohocken borough
Average Family Size in Conshohocken borough is 2.7 People.
What is the Average Household Size in Conshohocken borough
Average Household Size in Conshohocken borough is 2.1 People.
What is Per Capita Income in Conshohocken borough?
Per Capita income in Conshohocken borough is $63,628.
What is the Median Family Income in Conshohocken borough?
Median Family Income in Conshohocken borough is $135,072.
What is the Median Household income in Conshohocken borough?
Median Household Income in Conshohocken borough is $114,523.
What is Income or Wage Gap in Conshohocken borough?
Income or Wage Gap in Conshohocken borough is 3.9%.
Women in Conshohocken borough earn 96.1 cents for every dollar earned by a man.
What is Inequality or Gini Index in Conshohocken borough?
Inequality or Gini Index in Conshohocken borough is 0.38.
How Large is the Labor Force in Conshohocken borough?
There are 6,743 People in the Labor Forcein in Conshohocken borough.
What is the Percentage of People in the Labor Force in Conshohocken borough?
83.5% of People are in the Labor Force in Conshohocken borough.
What is the Unemployment Rate in Conshohocken borough?
Unemployment Rate in Conshohocken borough is 3.5%.