Paoli, PA
Paoli Map
Paoli Overview
6,121
TOTAL POPULATION
2,994
MALE POPULATION
3,127
FEMALE POPULATION
95.75
MALES / 100 FEMALES
104.44
FEMALES / 100 MALES
42.9
MEDIAN AGE
2.9
AVG FAMILY SIZE
2.3
AVG HOUSEHOLD SIZE
$61,959
PER CAPITA INCOME
$145,625
AVG FAMILY INCOME
$107,793
AVG HOUSEHOLD INCOME
36.4%
WAGE / INCOME GAP [ % ]
63.6¢/ $1
WAGE / INCOME GAP [ $ ]
0.44
INEQUALITY / GINI INDEX
3,180
LABOR FORCE [ PEOPLE ]
65.0%
PERCENT IN LABOR FORCE
6.3%
UNEMPLOYMENT RATE
Paoli Zip Codes
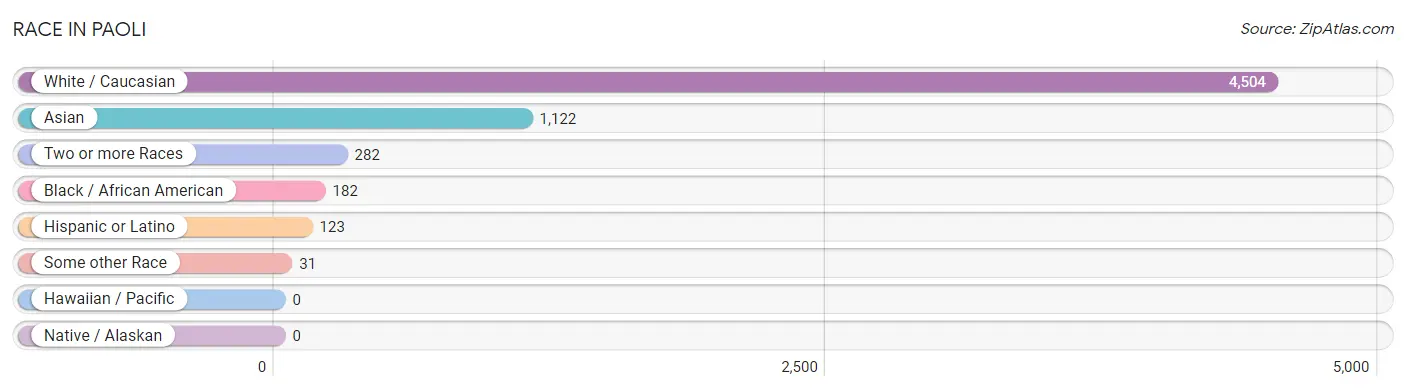
Race in Paoli
The most populous races in Paoli are White / Caucasian (4,504 | 73.6%), Asian (1,122 | 18.3%), and Two or more Races (282 | 4.6%).
| Race | # Population | % Population |
| Asian | 1,122 | 18.3% |
| Black / African American | 182 | 3.0% |
| Hawaiian / Pacific | 0 | 0.0% |
| Hispanic or Latino | 123 | 2.0% |
| Native / Alaskan | 0 | 0.0% |
| White / Caucasian | 4,504 | 73.6% |
| Two or more Races | 282 | 4.6% |
| Some other Race | 31 | 0.5% |
| Total | 6,121 | 100.0% |
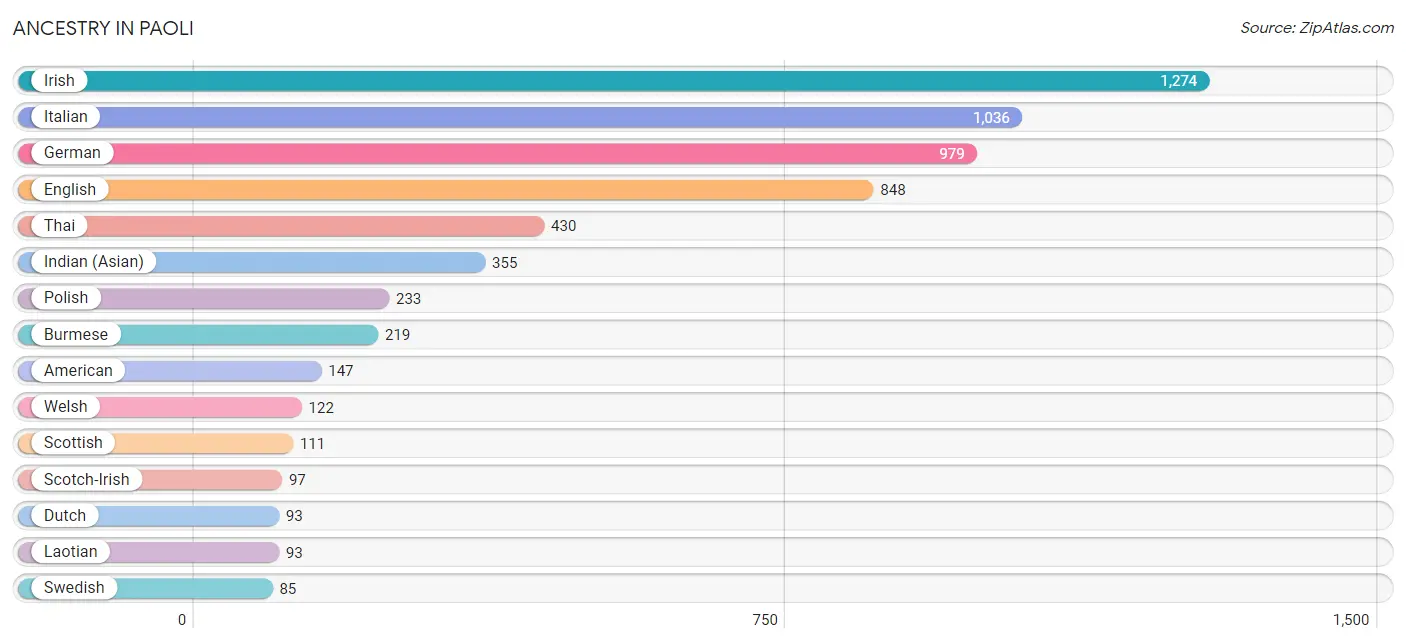
Ancestry in Paoli
The most populous ancestries reported in Paoli are Irish (1,274 | 20.8%), Italian (1,036 | 16.9%), German (979 | 16.0%), English (848 | 13.9%), and Thai (430 | 7.0%), together accounting for 74.6% of all Paoli residents.
| Ancestry | # Population | % Population |
| Afghan | 79 | 1.3% |
| African | 39 | 0.6% |
| American | 147 | 2.4% |
| Arab | 39 | 0.6% |
| Armenian | 11 | 0.2% |
| Belgian | 10 | 0.2% |
| British | 52 | 0.9% |
| Burmese | 219 | 3.6% |
| Canadian | 9 | 0.2% |
| Cherokee | 12 | 0.2% |
| Cuban | 33 | 0.5% |
| Czech | 43 | 0.7% |
| Dutch | 93 | 1.5% |
| Eastern European | 27 | 0.4% |
| Egyptian | 39 | 0.6% |
| English | 848 | 13.9% |
| European | 69 | 1.1% |
| Finnish | 9 | 0.2% |
| French | 31 | 0.5% |
| German | 979 | 16.0% |
| Greek | 46 | 0.7% |
| Hungarian | 19 | 0.3% |
| Indian (Asian) | 355 | 5.8% |
| Iranian | 11 | 0.2% |
| Irish | 1,274 | 20.8% |
| Italian | 1,036 | 16.9% |
| Jamaican | 29 | 0.5% |
| Korean | 35 | 0.6% |
| Laotian | 93 | 1.5% |
| Lithuanian | 55 | 0.9% |
| Mexican | 41 | 0.7% |
| Norwegian | 9 | 0.2% |
| Pennsylvania German | 35 | 0.6% |
| Peruvian | 24 | 0.4% |
| Polish | 233 | 3.8% |
| Portuguese | 12 | 0.2% |
| Romanian | 6 | 0.1% |
| Russian | 16 | 0.3% |
| Scandinavian | 7 | 0.1% |
| Scotch-Irish | 97 | 1.6% |
| Scottish | 111 | 1.8% |
| Shoshone | 7 | 0.1% |
| Slavic | 9 | 0.2% |
| Slovak | 32 | 0.5% |
| Slovene | 8 | 0.1% |
| South American | 24 | 0.4% |
| South American Indian | 7 | 0.1% |
| Spanish | 6 | 0.1% |
| Sri Lankan | 25 | 0.4% |
| Subsaharan African | 39 | 0.6% |
| Swedish | 85 | 1.4% |
| Swiss | 48 | 0.8% |
| Thai | 430 | 7.0% |
| Turkish | 9 | 0.2% |
| Ukrainian | 58 | 0.9% |
| Vietnamese | 19 | 0.3% |
| Welsh | 122 | 2.0% | View All 57 Rows |
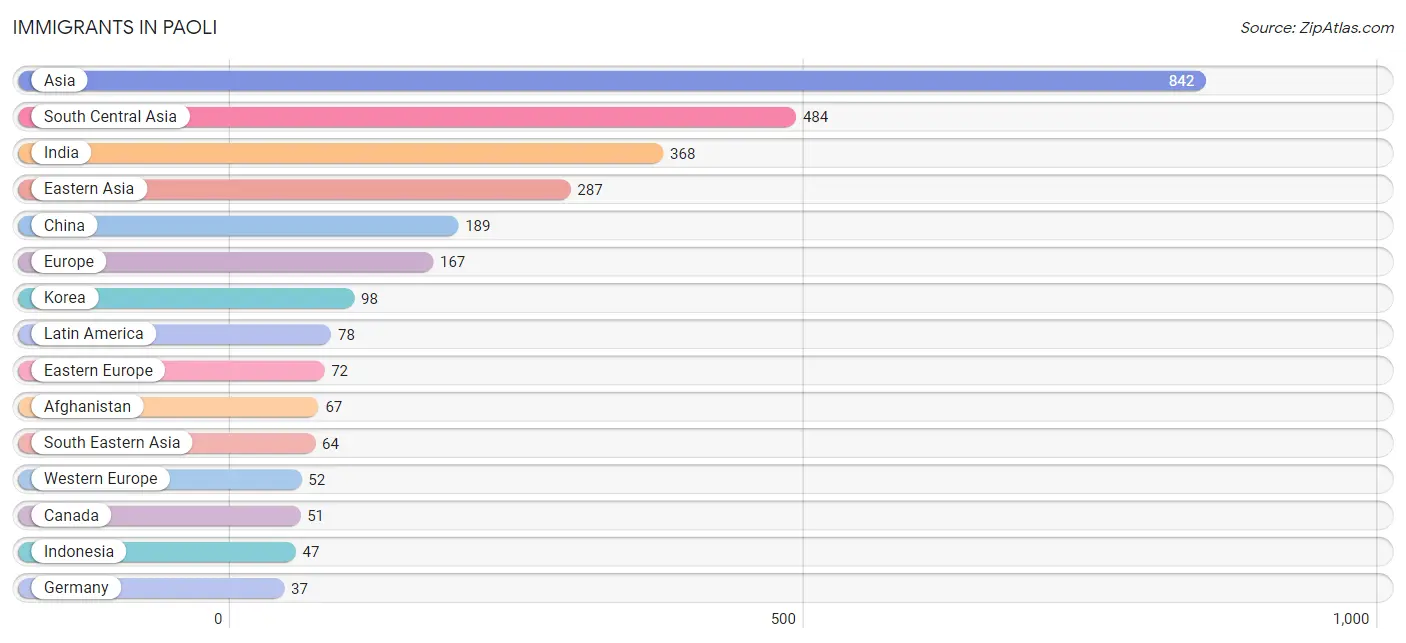
Immigrants in Paoli
The most numerous immigrant groups reported in Paoli came from Asia (842 | 13.8%), South Central Asia (484 | 7.9%), India (368 | 6.0%), Eastern Asia (287 | 4.7%), and China (189 | 3.1%), together accounting for 35.5% of all Paoli residents.
| Immigration Origin | # Population | % Population |
| Afghanistan | 67 | 1.1% |
| Africa | 8 | 0.1% |
| Asia | 842 | 13.8% |
| Bangladesh | 19 | 0.3% |
| Canada | 51 | 0.8% |
| Caribbean | 16 | 0.3% |
| Central America | 35 | 0.6% |
| China | 189 | 3.1% |
| Czechoslovakia | 35 | 0.6% |
| Eastern Asia | 287 | 4.7% |
| Eastern Europe | 72 | 1.2% |
| Egypt | 8 | 0.1% |
| England | 16 | 0.3% |
| Europe | 167 | 2.7% |
| Germany | 37 | 0.6% |
| India | 368 | 6.0% |
| Indonesia | 47 | 0.8% |
| Iran | 18 | 0.3% |
| Ireland | 14 | 0.2% |
| Jamaica | 16 | 0.3% |
| Korea | 98 | 1.6% |
| Kuwait | 7 | 0.1% |
| Latin America | 78 | 1.3% |
| Malaysia | 8 | 0.1% |
| Mexico | 27 | 0.4% |
| Northern Africa | 8 | 0.1% |
| Northern Europe | 31 | 0.5% |
| Pakistan | 12 | 0.2% |
| Panama | 8 | 0.1% |
| Peru | 27 | 0.4% |
| Portugal | 12 | 0.2% |
| South America | 27 | 0.4% |
| South Central Asia | 484 | 7.9% |
| South Eastern Asia | 64 | 1.1% |
| Southern Europe | 12 | 0.2% |
| Switzerland | 15 | 0.3% |
| Taiwan | 16 | 0.3% |
| Ukraine | 37 | 0.6% |
| Vietnam | 9 | 0.2% |
| Western Asia | 7 | 0.1% |
| Western Europe | 52 | 0.9% | View All 41 Rows |
Sex and Age in Paoli
Sex and Age in Paoli
The most populous age groups in Paoli are 30 to 34 Years (284 | 9.5%) for men and 30 to 34 Years (269 | 8.6%) for women.
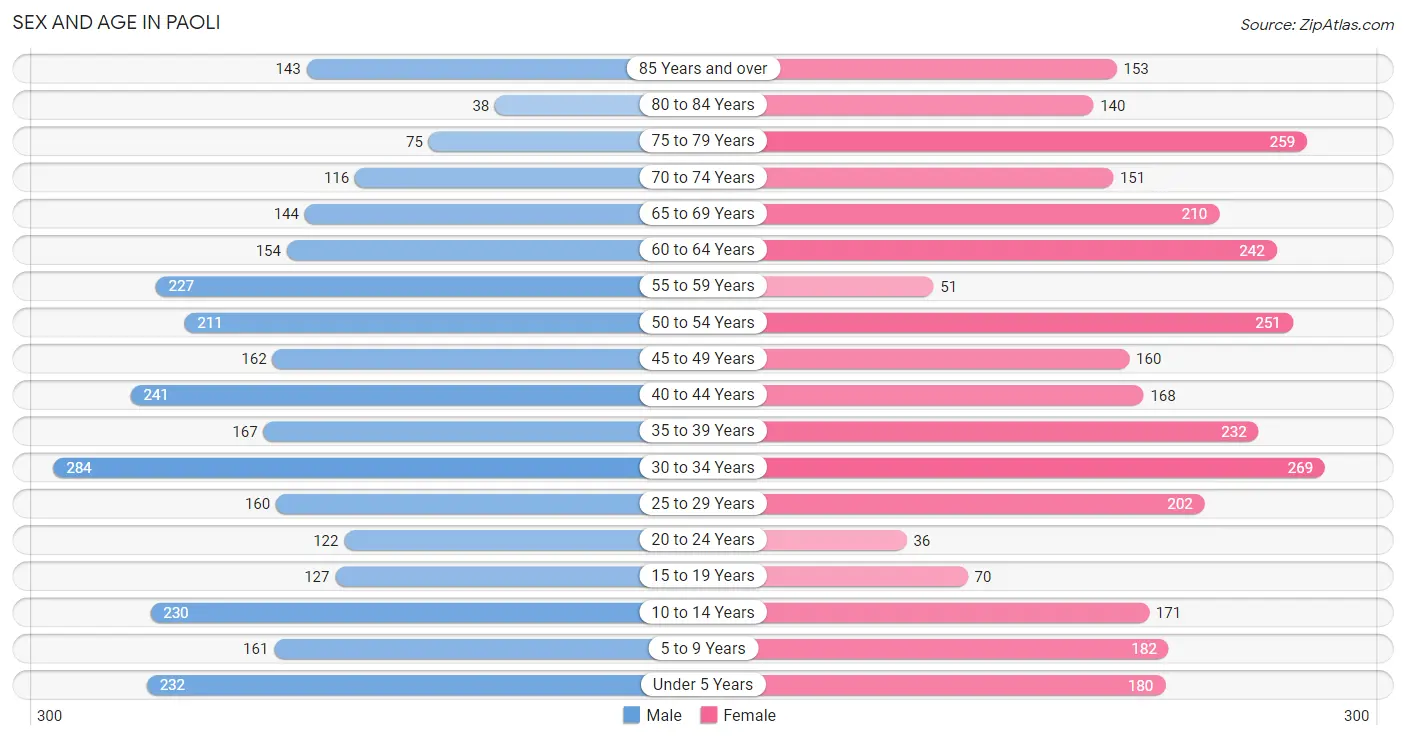
| Age Bracket | Male | Female |
| Under 5 Years | 232 (7.7%) | 180 (5.8%) |
| 5 to 9 Years | 161 (5.4%) | 182 (5.8%) |
| 10 to 14 Years | 230 (7.7%) | 171 (5.5%) |
| 15 to 19 Years | 127 (4.2%) | 70 (2.2%) |
| 20 to 24 Years | 122 (4.1%) | 36 (1.1%) |
| 25 to 29 Years | 160 (5.3%) | 202 (6.5%) |
| 30 to 34 Years | 284 (9.5%) | 269 (8.6%) |
| 35 to 39 Years | 167 (5.6%) | 232 (7.4%) |
| 40 to 44 Years | 241 (8.1%) | 168 (5.4%) |
| 45 to 49 Years | 162 (5.4%) | 160 (5.1%) |
| 50 to 54 Years | 211 (7.0%) | 251 (8.0%) |
| 55 to 59 Years | 227 (7.6%) | 51 (1.6%) |
| 60 to 64 Years | 154 (5.1%) | 242 (7.7%) |
| 65 to 69 Years | 144 (4.8%) | 210 (6.7%) |
| 70 to 74 Years | 116 (3.9%) | 151 (4.8%) |
| 75 to 79 Years | 75 (2.5%) | 259 (8.3%) |
| 80 to 84 Years | 38 (1.3%) | 140 (4.5%) |
| 85 Years and over | 143 (4.8%) | 153 (4.9%) |
| Total | 2,994 (100.0%) | 3,127 (100.0%) |
Families and Households in Paoli
Median Family Size in Paoli
The median family size in Paoli is 2.88 persons per family, with married-couple families (1,325 | 85.4%) accounting for the largest median family size of 2.94 persons per family. On the other hand, single male/father families (77 | 5.0%) represent the smallest median family size with 2.23 persons per family.
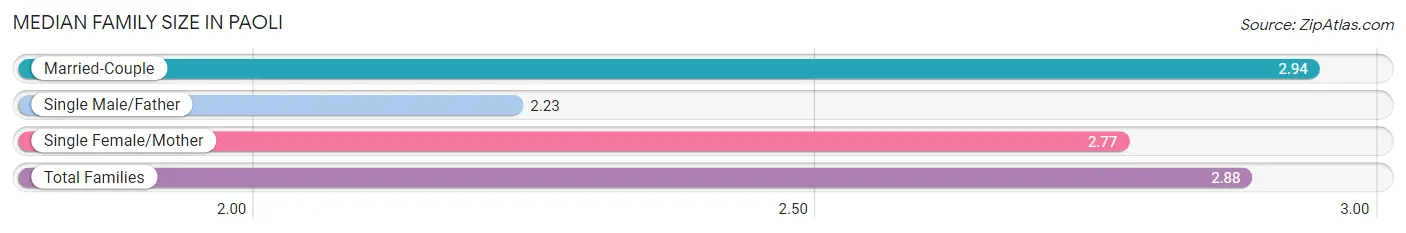
| Family Type | # Families | Family Size |
| Married-Couple | 1,325 (85.4%) | 2.94 |
| Single Male/Father | 77 (5.0%) | 2.23 |
| Single Female/Mother | 150 (9.7%) | 2.77 |
| Total Families | 1,552 (100.0%) | 2.88 |
Median Household Size in Paoli
The median household size in Paoli is 2.34 persons per household, with single female/mother households (150 | 6.0%) accounting for the largest median household size of 3 persons per household. non-family households (963 | 38.3%) represent the smallest median household size with 1.35 persons per household.
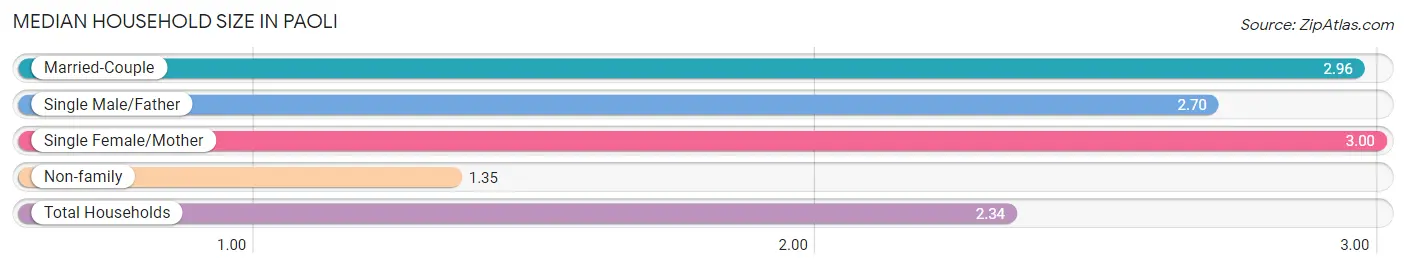
| Household Type | # Households | Household Size |
| Married-Couple | 1,325 (52.7%) | 2.96 |
| Single Male/Father | 77 (3.1%) | 2.70 |
| Single Female/Mother | 150 (6.0%) | 3.00 |
| Non-family | 963 (38.3%) | 1.35 |
| Total Households | 2,515 (100.0%) | 2.34 |
Household Size by Marriage Status in Paoli
Out of a total of 2,515 households in Paoli, 1,552 (61.7%) are family households, while 963 (38.3%) are nonfamily households. The most numerous type of family households are 2-person households, comprising 640, and the most common type of nonfamily households are 1-person households, comprising 756.
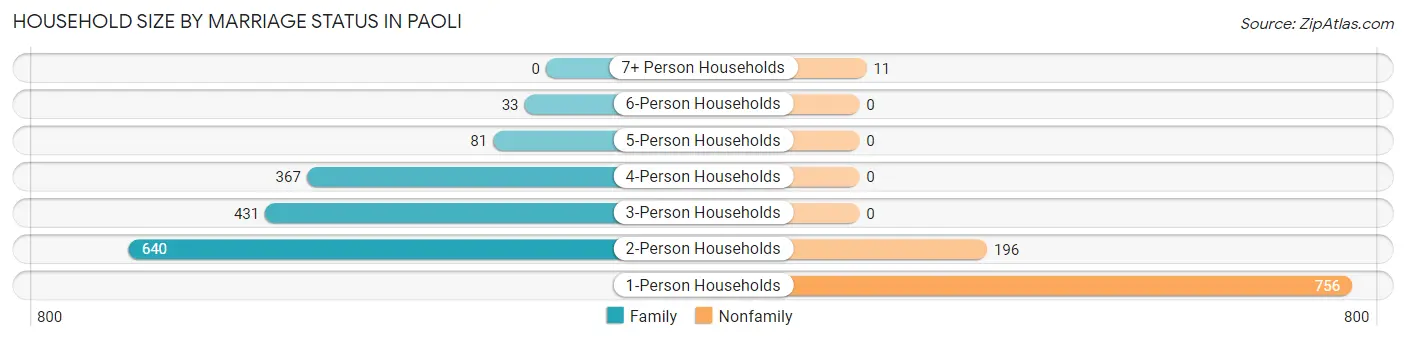
| Household Size | Family Households | Nonfamily Households |
| 1-Person Households | - | 756 (30.1%) |
| 2-Person Households | 640 (25.5%) | 196 (7.8%) |
| 3-Person Households | 431 (17.1%) | 0 (0.0%) |
| 4-Person Households | 367 (14.6%) | 0 (0.0%) |
| 5-Person Households | 81 (3.2%) | 0 (0.0%) |
| 6-Person Households | 33 (1.3%) | 0 (0.0%) |
| 7+ Person Households | 0 (0.0%) | 11 (0.4%) |
| Total | 1,552 (61.7%) | 963 (38.3%) |
Female Fertility in Paoli
Fertility by Age in Paoli
Average fertility rate in Paoli is 59.0 births per 1,000 women. Women in the age bracket of 35 to 50 years have the highest fertility rate with 83.0 births per 1,000 women. Women in the age bracket of 35 to 50 years acount for 69.1% of all women with births.
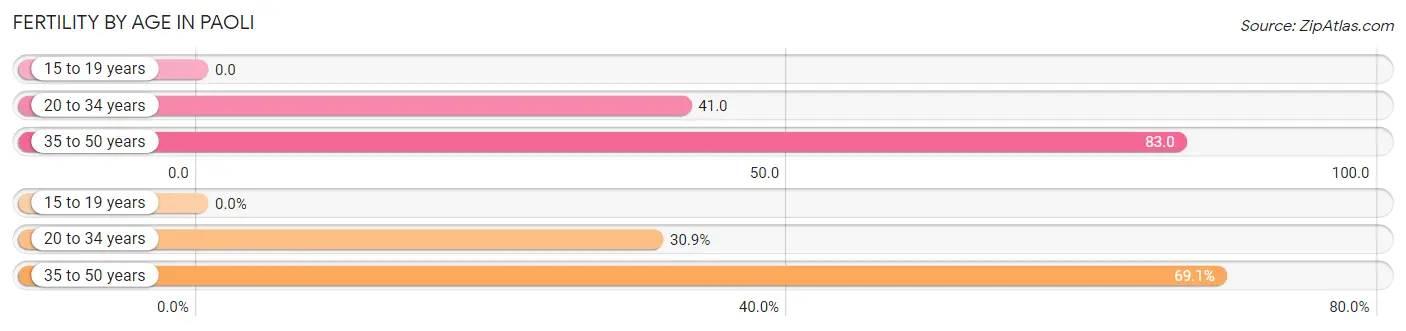
| Age Bracket | Women with Births | Births / 1,000 Women |
| 15 to 19 years | 0 (0.0%) | 0.0 |
| 20 to 34 years | 21 (30.9%) | 41.0 |
| 35 to 50 years | 47 (69.1%) | 83.0 |
| Total | 68 (100.0%) | 59.0 |
Fertility by Age by Marriage Status in Paoli
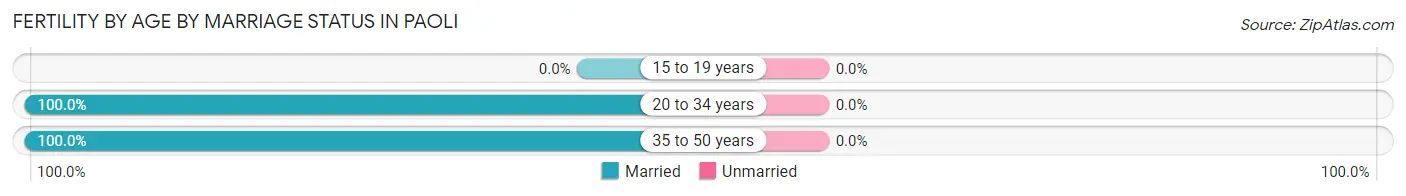
| Age Bracket | Married | Unmarried |
| 15 to 19 years | 0 (0.0%) | 0 (0.0%) |
| 20 to 34 years | 21 (100.0%) | 0 (0.0%) |
| 35 to 50 years | 47 (100.0%) | 0 (0.0%) |
| Total | 68 (100.0%) | 0 (0.0%) |
Fertility by Education in Paoli
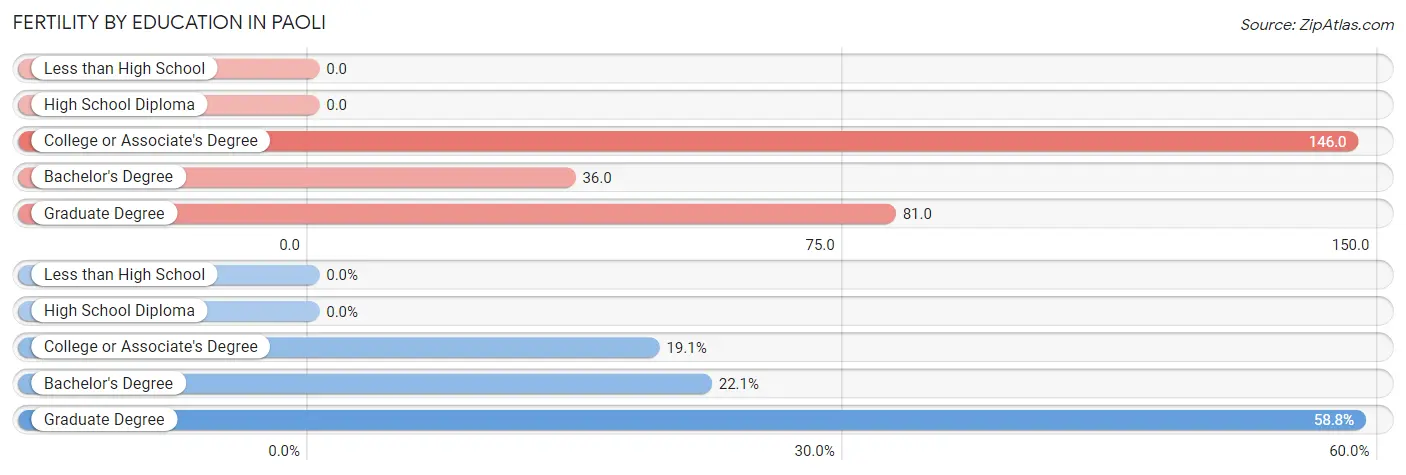
| Educational Attainment | Women with Births | Births / 1,000 Women |
| Less than High School | 0 (0.0%) | 0.0 |
| High School Diploma | 0 (0.0%) | 0.0 |
| College or Associate's Degree | 13 (19.1%) | 146.0 |
| Bachelor's Degree | 15 (22.1%) | 36.0 |
| Graduate Degree | 40 (58.8%) | 81.0 |
| Total | 68 (100.0%) | 59.0 |
Fertility by Education by Marriage Status in Paoli
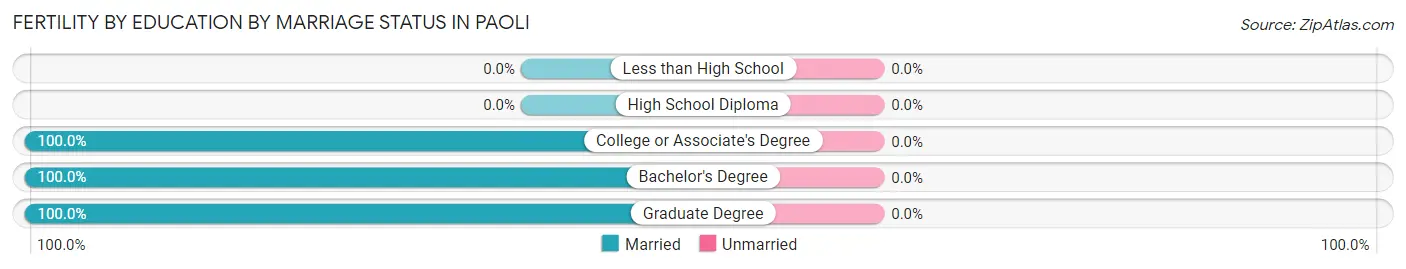
| Educational Attainment | Married | Unmarried |
| Less than High School | 0 (0.0%) | 0 (0.0%) |
| High School Diploma | 0 (0.0%) | 0 (0.0%) |
| College or Associate's Degree | 13 (100.0%) | 0 (0.0%) |
| Bachelor's Degree | 15 (100.0%) | 0 (0.0%) |
| Graduate Degree | 40 (100.0%) | 0 (0.0%) |
| Total | 68 (100.0%) | 0 (0.0%) |
Income in Paoli
Income Overview in Paoli
Per Capita Income in Paoli is $61,959, while median incomes of families and households are $145,625 and $107,793 respectively.
| Characteristic | Number | Measure |
| Per Capita Income | 6,121 | $61,959 |
| Median Family Income | 1,552 | $145,625 |
| Mean Family Income | 1,552 | $176,174 |
| Median Household Income | 2,515 | $107,793 |
| Mean Household Income | 2,515 | $143,131 |
| Income Deficit | 1,552 | $0 |
| Wage / Income Gap (%) | 6,121 | 36.44% |
| Wage / Income Gap ($) | 6,121 | 63.56¢ per $1 |
| Gini / Inequality Index | 6,121 | 0.44 |
Earnings by Sex in Paoli
Average Earnings in Paoli are $70,130, $82,267 for men and $52,292 for women, a difference of 36.4%.
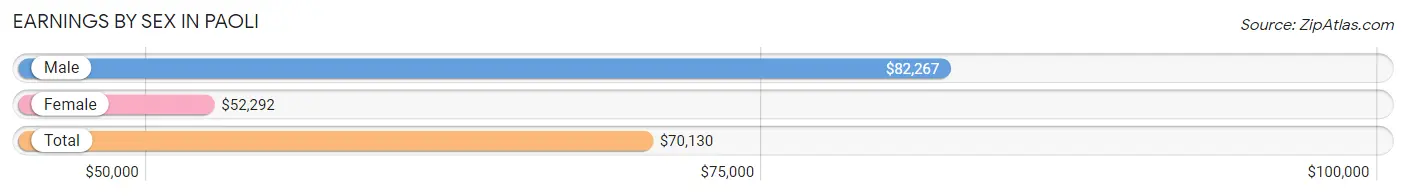
| Sex | Number | Average Earnings |
| Male | 1,826 (54.3%) | $82,267 |
| Female | 1,538 (45.7%) | $52,292 |
| Total | 3,364 (100.0%) | $70,130 |
Earnings by Sex by Income Bracket in Paoli
The most common earnings brackets in Paoli are $100,000+ for men (836 | 45.8%) and $100,000+ for women (419 | 27.2%).
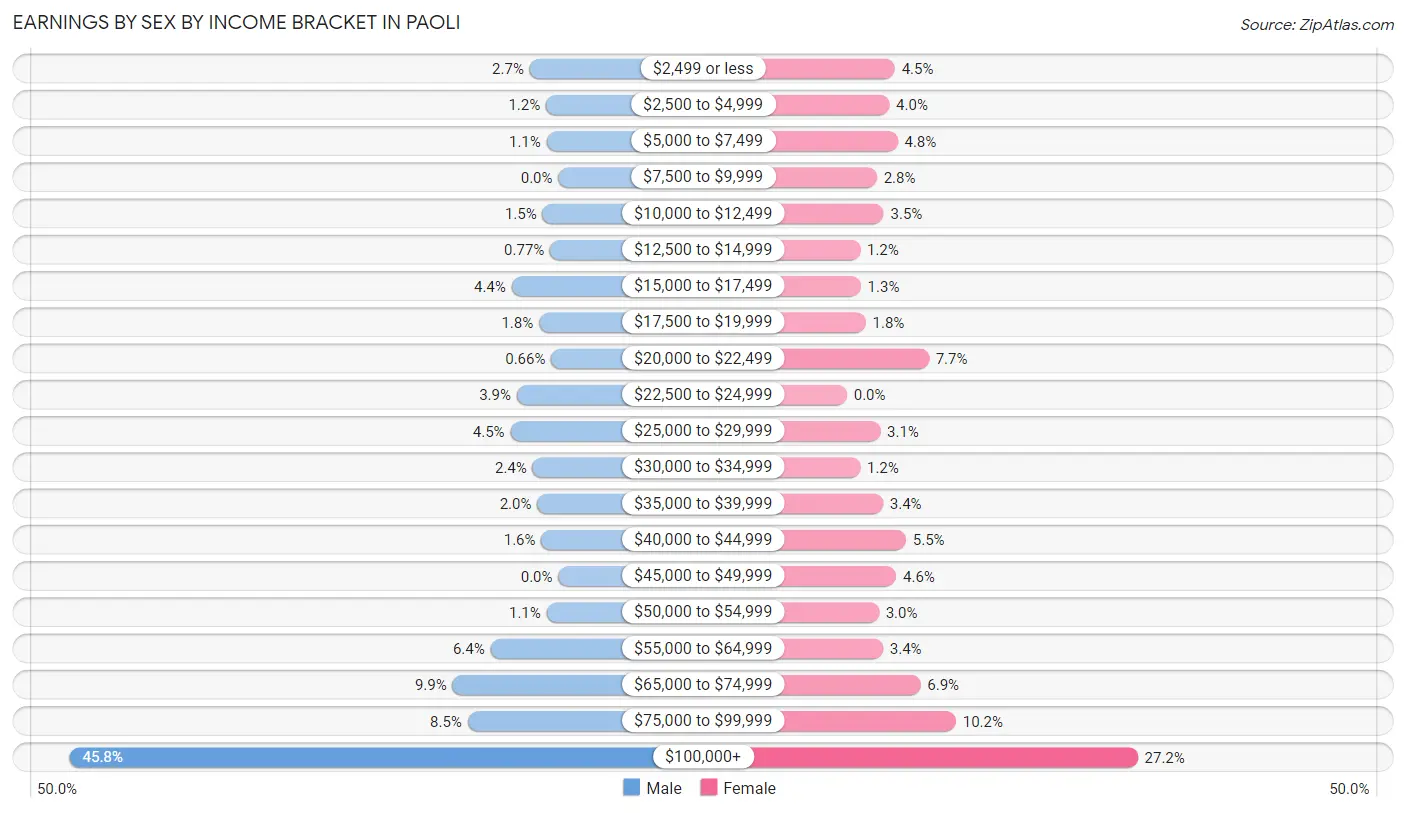
| Income | Male | Female |
| $2,499 or less | 49 (2.7%) | 69 (4.5%) |
| $2,500 to $4,999 | 21 (1.1%) | 61 (4.0%) |
| $5,000 to $7,499 | 20 (1.1%) | 73 (4.8%) |
| $7,500 to $9,999 | 0 (0.0%) | 43 (2.8%) |
| $10,000 to $12,499 | 27 (1.5%) | 53 (3.5%) |
| $12,500 to $14,999 | 14 (0.8%) | 19 (1.2%) |
| $15,000 to $17,499 | 80 (4.4%) | 20 (1.3%) |
| $17,500 to $19,999 | 33 (1.8%) | 27 (1.8%) |
| $20,000 to $22,499 | 12 (0.7%) | 118 (7.7%) |
| $22,500 to $24,999 | 71 (3.9%) | 0 (0.0%) |
| $25,000 to $29,999 | 82 (4.5%) | 48 (3.1%) |
| $30,000 to $34,999 | 44 (2.4%) | 19 (1.2%) |
| $35,000 to $39,999 | 36 (2.0%) | 52 (3.4%) |
| $40,000 to $44,999 | 29 (1.6%) | 85 (5.5%) |
| $45,000 to $49,999 | 0 (0.0%) | 71 (4.6%) |
| $50,000 to $54,999 | 20 (1.1%) | 46 (3.0%) |
| $55,000 to $64,999 | 116 (6.4%) | 52 (3.4%) |
| $65,000 to $74,999 | 181 (9.9%) | 106 (6.9%) |
| $75,000 to $99,999 | 155 (8.5%) | 157 (10.2%) |
| $100,000+ | 836 (45.8%) | 419 (27.2%) |
| Total | 1,826 (100.0%) | 1,538 (100.0%) |
Earnings by Sex by Educational Attainment in Paoli
Average earnings in Paoli are $92,500 for men and $54,338 for women, a difference of 41.3%. Men with an educational attainment of bachelor's degree enjoy the highest average annual earnings of $110,612, while those with college or associate's degree education earn the least with $60,536. Women with an educational attainment of graduate degree earn the most with the average annual earnings of $69,145, while those with high school diploma education have the smallest earnings of $19,141.
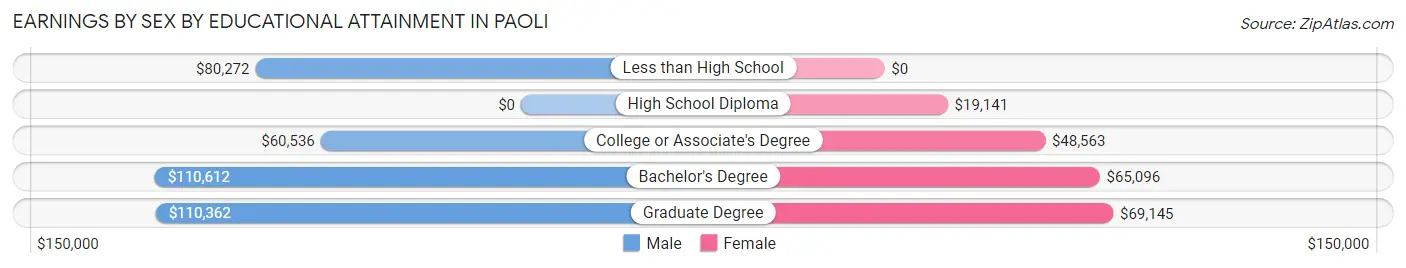
| Educational Attainment | Male Income | Female Income |
| Less than High School | $80,272 | $0 |
| High School Diploma | - | - |
| College or Associate's Degree | $60,536 | $48,563 |
| Bachelor's Degree | $110,612 | $65,096 |
| Graduate Degree | $110,362 | $69,145 |
| Total | $92,500 | $54,338 |
Family Income in Paoli
Family Income Brackets in Paoli
According to the Paoli family income data, there are 506 families falling into the $200,000+ income range, which is the most common income bracket and makes up 32.6% of all families.
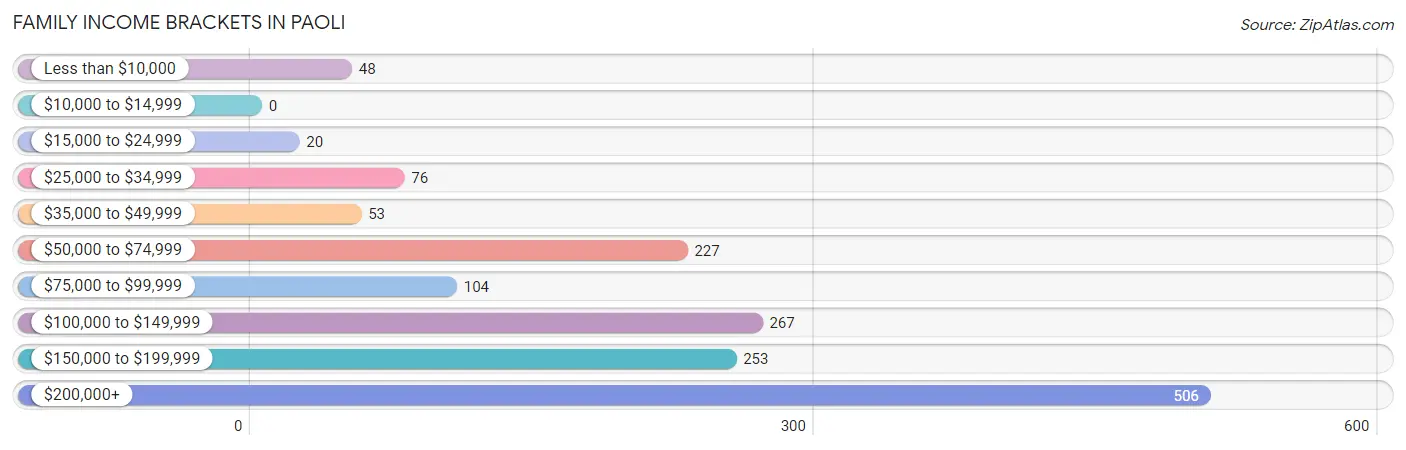
| Income Bracket | # Families | % Families |
| Less than $10,000 | 48 | 3.1% |
| $10,000 to $14,999 | 0 | 0.0% |
| $15,000 to $24,999 | 20 | 1.3% |
| $25,000 to $34,999 | 76 | 4.9% |
| $35,000 to $49,999 | 53 | 3.4% |
| $50,000 to $74,999 | 227 | 14.6% |
| $75,000 to $99,999 | 104 | 6.7% |
| $100,000 to $149,999 | 267 | 17.2% |
| $150,000 to $199,999 | 253 | 16.3% |
| $200,000+ | 506 | 32.6% |
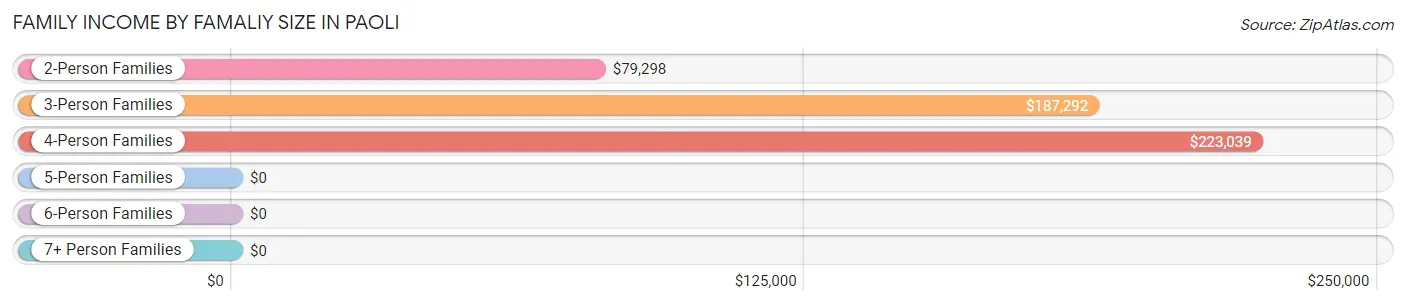
Family Income by Famaliy Size in Paoli
4-person families (302 | 19.5%) account for the highest median family income in Paoli with $223,039 per family, while 3-person families (438 | 28.2%) have the highest median income of $62,431 per family member.
| Income Bracket | # Families | Median Income |
| 2-Person Families | 698 (45.0%) | $79,298 |
| 3-Person Families | 438 (28.2%) | $187,292 |
| 4-Person Families | 302 (19.5%) | $223,039 |
| 5-Person Families | 90 (5.8%) | $0 |
| 6-Person Families | 24 (1.5%) | $0 |
| 7+ Person Families | 0 (0.0%) | $0 |
| Total | 1,552 (100.0%) | $145,625 |
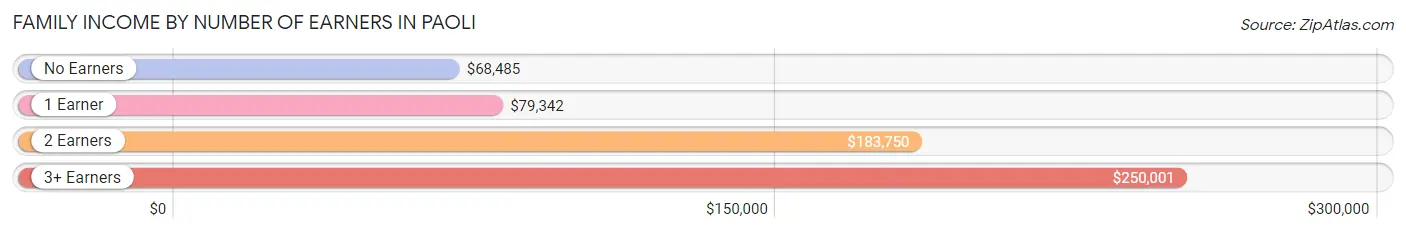
Family Income by Number of Earners in Paoli
The median family income in Paoli is $145,625, with families comprising 3+ earners (172) having the highest median family income of $250,001, while families with no earners (220) have the lowest median family income of $68,485, accounting for 11.1% and 14.2% of families, respectively.
| Number of Earners | # Families | Median Income |
| No Earners | 220 (14.2%) | $68,485 |
| 1 Earner | 386 (24.9%) | $79,342 |
| 2 Earners | 774 (49.9%) | $183,750 |
| 3+ Earners | 172 (11.1%) | $250,001 |
| Total | 1,552 (100.0%) | $145,625 |
Household Income in Paoli
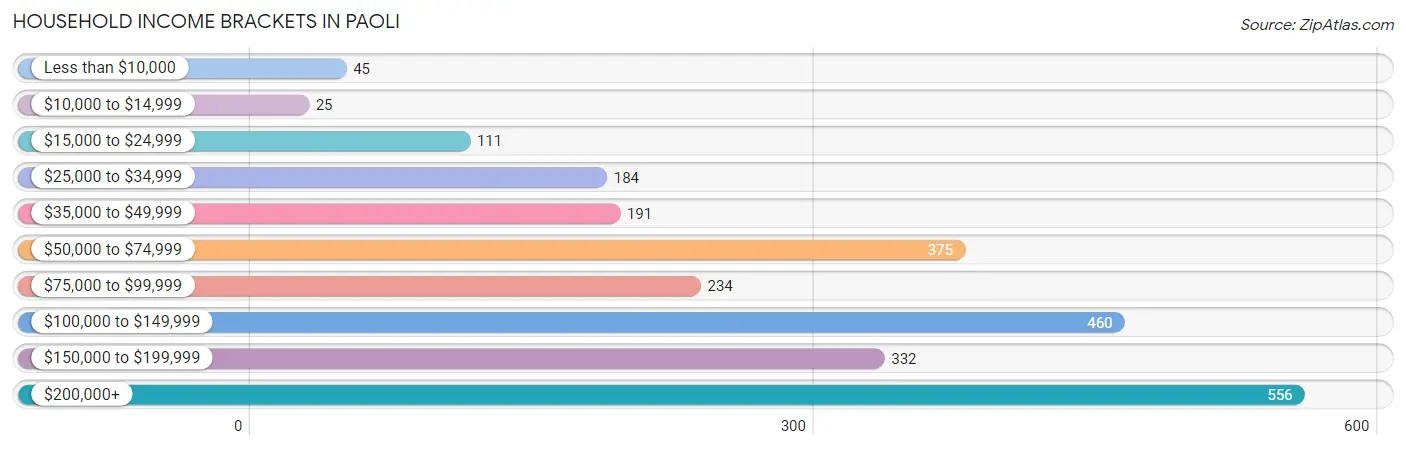
Household Income Brackets in Paoli
With 556 households falling in the category, the $200,000+ income range is the most frequent in Paoli, accounting for 22.1% of all households. In contrast, only 25 households (1.0%) fall into the $10,000 to $14,999 income bracket, making it the least populous group.
| Income Bracket | # Households | % Households |
| Less than $10,000 | 45 | 1.8% |
| $10,000 to $14,999 | 25 | 1.0% |
| $15,000 to $24,999 | 111 | 4.4% |
| $25,000 to $34,999 | 184 | 7.3% |
| $35,000 to $49,999 | 191 | 7.6% |
| $50,000 to $74,999 | 375 | 14.9% |
| $75,000 to $99,999 | 234 | 9.3% |
| $100,000 to $149,999 | 460 | 18.3% |
| $150,000 to $199,999 | 332 | 13.2% |
| $200,000+ | 556 | 22.1% |
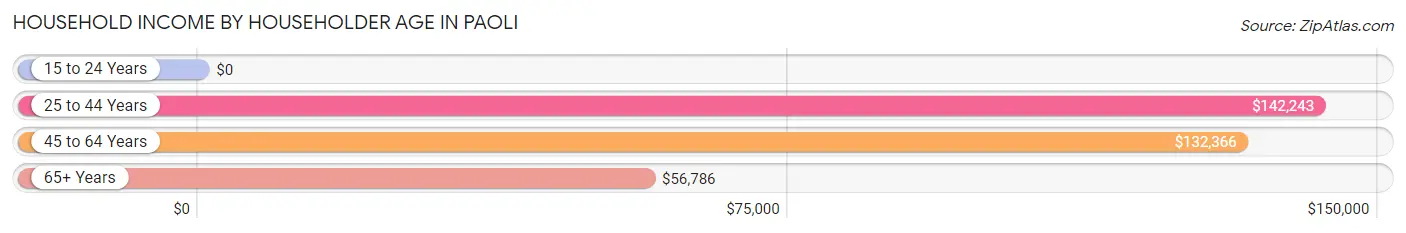
Household Income by Householder Age in Paoli
The median household income in Paoli is $107,793, with the highest median household income of $142,243 found in the 25 to 44 years age bracket for the primary householder. A total of 983 households (39.1%) fall into this category. Meanwhile, the 15 to 24 years age bracket for the primary householder has the lowest median household income of $0, with 13 households (0.5%) in this group.
| Income Bracket | # Households | Median Income |
| 15 to 24 Years | 13 (0.5%) | $0 |
| 25 to 44 Years | 983 (39.1%) | $142,243 |
| 45 to 64 Years | 747 (29.7%) | $132,366 |
| 65+ Years | 772 (30.7%) | $56,786 |
| Total | 2,515 (100.0%) | $107,793 |
Poverty in Paoli
Income Below Poverty by Sex and Age in Paoli
With 3.7% poverty level for males and 3.7% for females among the residents of Paoli, 12 to 14 year old males and 18 to 24 year old females are the most vulnerable to poverty, with 33 males (23.4%) and 13 females (28.3%) in their respective age groups living below the poverty level.
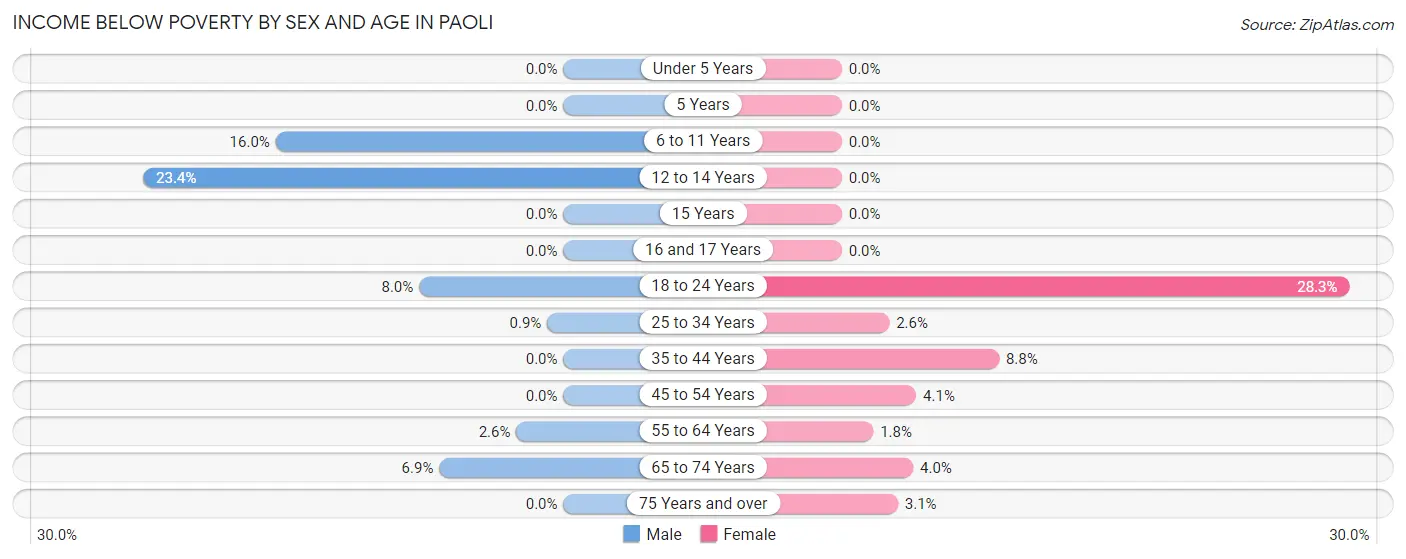
| Age Bracket | Male | Female |
| Under 5 Years | 0 (0.0%) | 0 (0.0%) |
| 5 Years | 0 (0.0%) | 0 (0.0%) |
| 6 to 11 Years | 33 (16.0%) | 0 (0.0%) |
| 12 to 14 Years | 33 (23.4%) | 0 (0.0%) |
| 15 Years | 0 (0.0%) | 0 (0.0%) |
| 16 and 17 Years | 0 (0.0%) | 0 (0.0%) |
| 18 to 24 Years | 11 (8.0%) | 13 (28.3%) |
| 25 to 34 Years | 4 (0.9%) | 12 (2.6%) |
| 35 to 44 Years | 0 (0.0%) | 35 (8.7%) |
| 45 to 54 Years | 0 (0.0%) | 17 (4.1%) |
| 55 to 64 Years | 10 (2.6%) | 5 (1.8%) |
| 65 to 74 Years | 17 (6.9%) | 14 (4.0%) |
| 75 Years and over | 0 (0.0%) | 14 (3.1%) |
| Total | 108 (3.7%) | 110 (3.7%) |
Income Above Poverty by Sex and Age in Paoli
According to the poverty statistics in Paoli, males aged under 5 years and females aged under 5 years are the age groups that are most secure financially, with 100.0% of males and 100.0% of females in these age groups living above the poverty line.
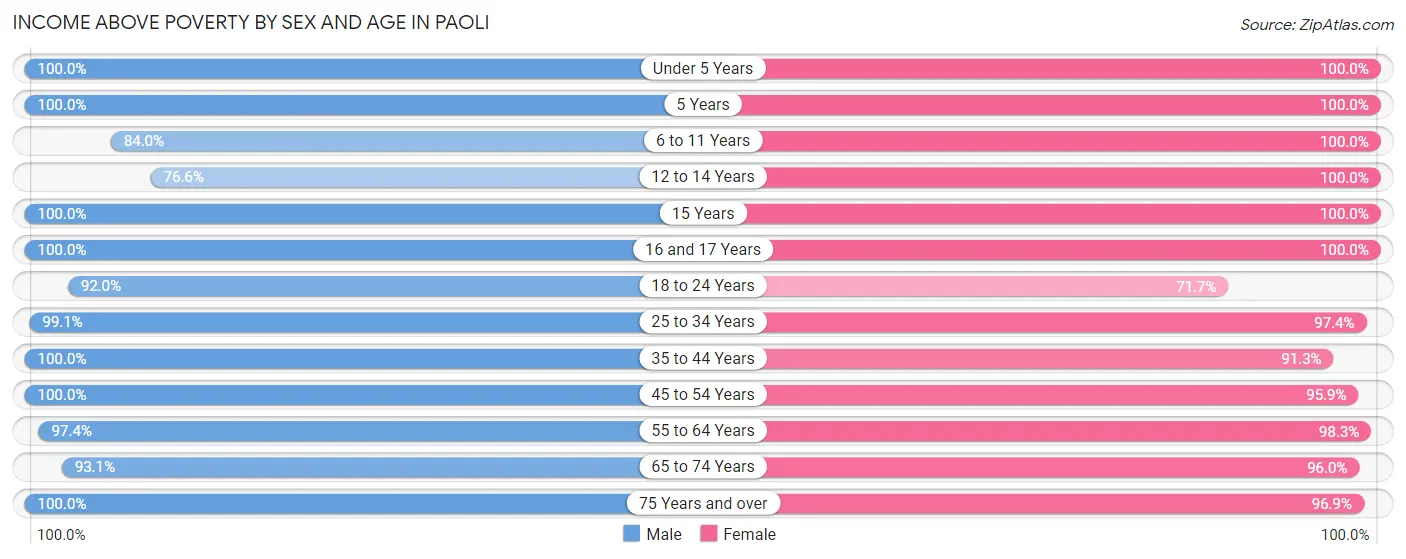
| Age Bracket | Male | Female |
| Under 5 Years | 232 (100.0%) | 168 (100.0%) |
| 5 Years | 29 (100.0%) | 54 (100.0%) |
| 6 to 11 Years | 173 (84.0%) | 183 (100.0%) |
| 12 to 14 Years | 108 (76.6%) | 116 (100.0%) |
| 15 Years | 65 (100.0%) | 8 (100.0%) |
| 16 and 17 Years | 47 (100.0%) | 52 (100.0%) |
| 18 to 24 Years | 126 (92.0%) | 33 (71.7%) |
| 25 to 34 Years | 440 (99.1%) | 442 (97.4%) |
| 35 to 44 Years | 408 (100.0%) | 365 (91.2%) |
| 45 to 54 Years | 365 (100.0%) | 394 (95.9%) |
| 55 to 64 Years | 371 (97.4%) | 280 (98.3%) |
| 65 to 74 Years | 229 (93.1%) | 339 (96.0%) |
| 75 Years and over | 208 (100.0%) | 434 (96.9%) |
| Total | 2,801 (96.3%) | 2,868 (96.3%) |
Income Below Poverty Among Married-Couple Families in Paoli
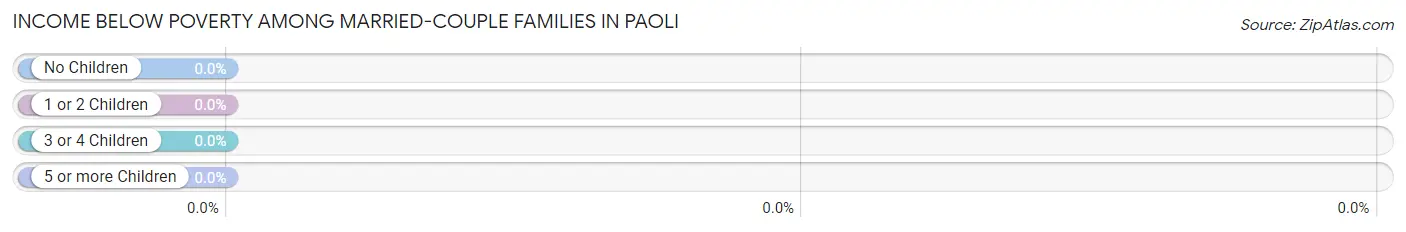
| Children | Above Poverty | Below Poverty |
| No Children | 702 (100.0%) | 0 (0.0%) |
| 1 or 2 Children | 527 (100.0%) | 0 (0.0%) |
| 3 or 4 Children | 96 (100.0%) | 0 (0.0%) |
| 5 or more Children | 0 (0.0%) | 0 (0.0%) |
| Total | 1,325 (100.0%) | 0 (0.0%) |
Income Below Poverty Among Single-Parent Households in Paoli
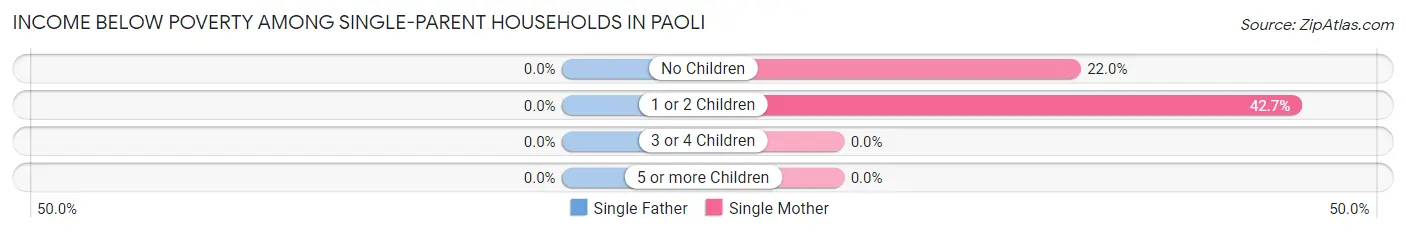
| Children | Single Father | Single Mother |
| No Children | 0 (0.0%) | 13 (22.0%) |
| 1 or 2 Children | 0 (0.0%) | 35 (42.7%) |
| 3 or 4 Children | 0 (0.0%) | 0 (0.0%) |
| 5 or more Children | 0 (0.0%) | 0 (0.0%) |
| Total | 0 (0.0%) | 48 (32.0%) |
Income Below Poverty Among Married-Couple vs Single-Parent Households in Paoli
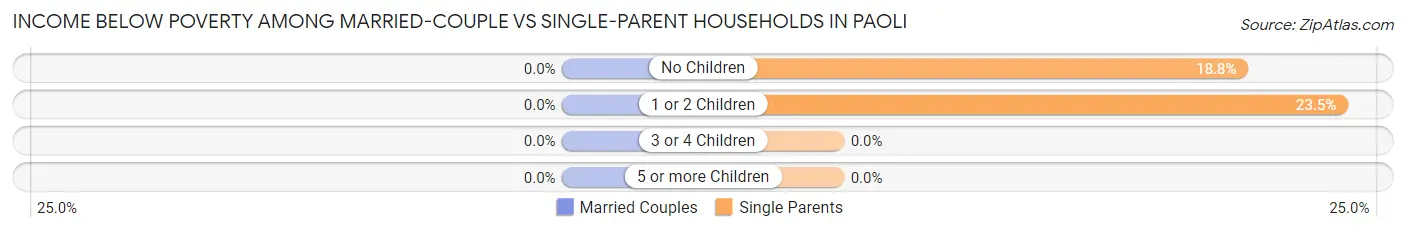
| Children | Married-Couple Families | Single-Parent Households |
| No Children | 0 (0.0%) | 13 (18.8%) |
| 1 or 2 Children | 0 (0.0%) | 35 (23.5%) |
| 3 or 4 Children | 0 (0.0%) | 0 (0.0%) |
| 5 or more Children | 0 (0.0%) | 0 (0.0%) |
| Total | 0 (0.0%) | 48 (21.1%) |
Employment Characteristics in Paoli
Employment by Class of Employer in Paoli
Among the 2,940 employed individuals in Paoli, private company employees (2,001 | 68.1%), not-for-profit organizations (437 | 14.9%), and self-employed (not incorporated) (192 | 6.5%) make up the most common classes of employment.
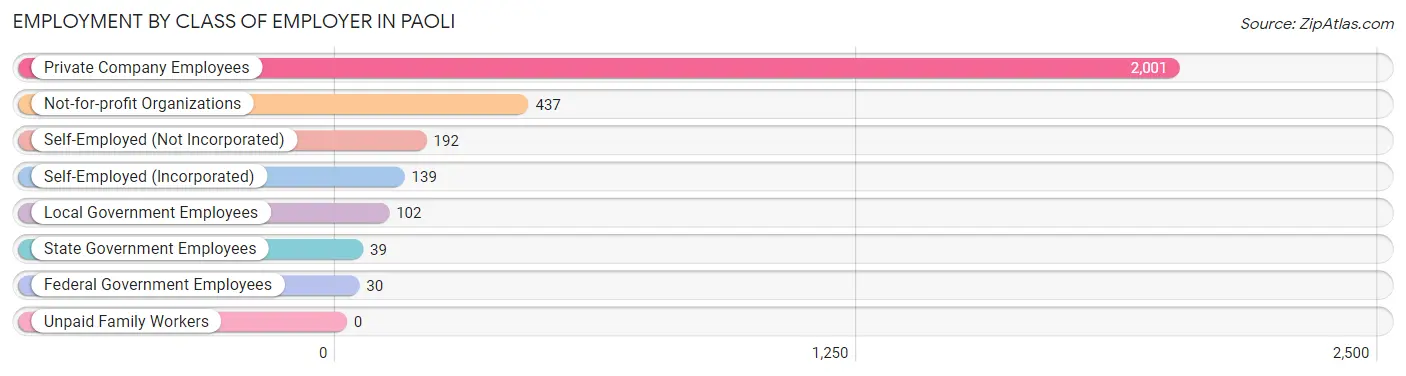
| Employer Class | # Employees | % Employees |
| Private Company Employees | 2,001 | 68.1% |
| Self-Employed (Incorporated) | 139 | 4.7% |
| Self-Employed (Not Incorporated) | 192 | 6.5% |
| Not-for-profit Organizations | 437 | 14.9% |
| Local Government Employees | 102 | 3.5% |
| State Government Employees | 39 | 1.3% |
| Federal Government Employees | 30 | 1.0% |
| Unpaid Family Workers | 0 | 0.0% |
| Total | 2,940 | 100.0% |
Employment Status by Age in Paoli
According to the labor force statistics for Paoli, out of the total population over 16 years of age (4,892), 65.0% or 3,180 individuals are in the labor force, with 6.3% or 200 of them unemployed. The age group with the highest labor force participation rate is 30 to 34 years, with 94.0% or 520 individuals in the labor force. Within the labor force, the 16 to 19 years age range has the highest percentage of unemployed individuals, with 35.5% or 11 of them being unemployed.
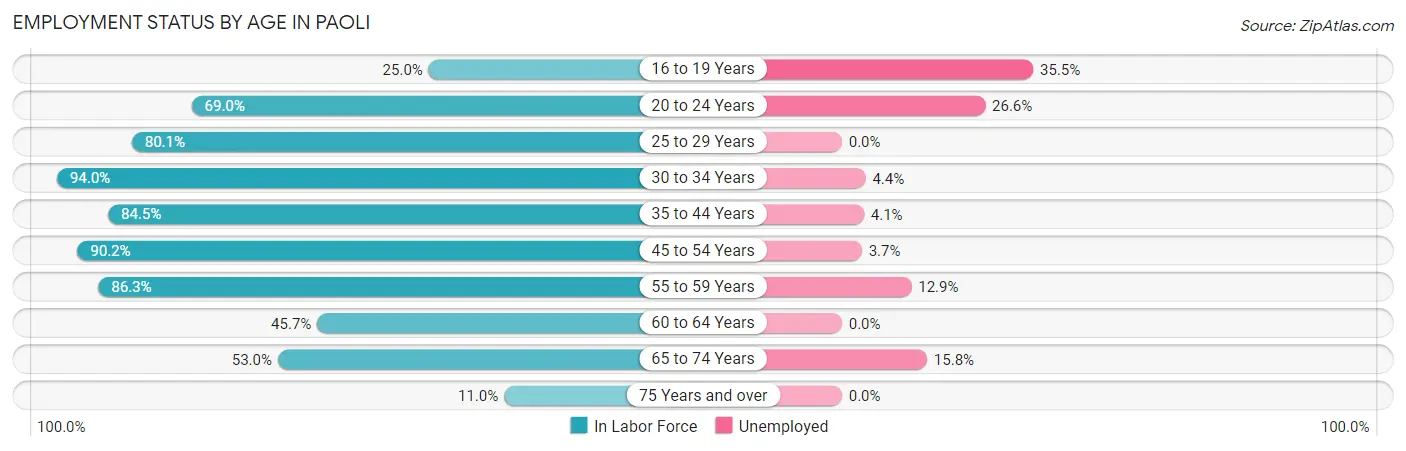
| Age Bracket | In Labor Force | Unemployed |
| 16 to 19 Years | 31 (25.0%) | 11 (35.5%) |
| 20 to 24 Years | 109 (69.0%) | 29 (26.6%) |
| 25 to 29 Years | 290 (80.1%) | 0 (0.0%) |
| 30 to 34 Years | 520 (94.0%) | 23 (4.4%) |
| 35 to 44 Years | 683 (84.5%) | 28 (4.1%) |
| 45 to 54 Years | 707 (90.2%) | 26 (3.7%) |
| 55 to 59 Years | 240 (86.3%) | 31 (12.9%) |
| 60 to 64 Years | 181 (45.7%) | 0 (0.0%) |
| 65 to 74 Years | 329 (53.0%) | 52 (15.8%) |
| 75 Years and over | 89 (11.0%) | 0 (0.0%) |
| Total | 3,180 (65.0%) | 200 (6.3%) |
Employment Status by Educational Attainment in Paoli
According to labor force statistics for Paoli, 82.4% of individuals (2,621) out of the total population between 25 and 64 years of age (3,181) are in the labor force, with 4.1% or 107 of them being unemployed. The group with the highest labor force participation rate are those with the educational attainment of less than high school, with 100.0% or 151 individuals in the labor force. Within the labor force, individuals with high school diploma education have the highest percentage of unemployment, with 15.7% or 20 of them being unemployed.
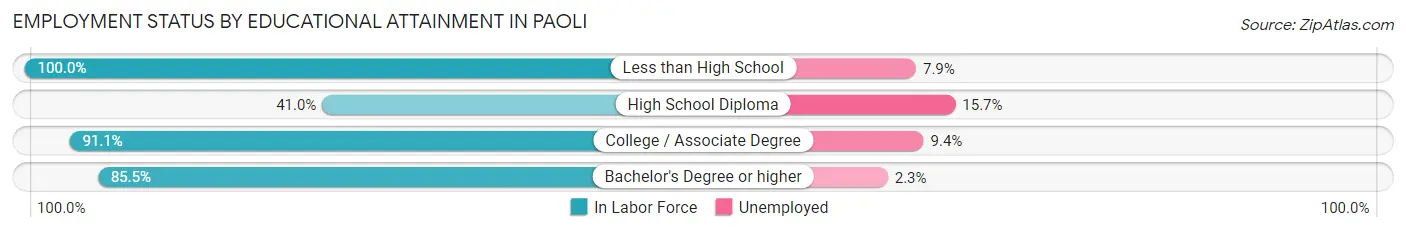
| Educational Attainment | In Labor Force | Unemployed |
| Less than High School | 151 (100.0%) | 12 (7.9%) |
| High School Diploma | 127 (41.0%) | 49 (15.7%) |
| College / Associate Degree | 297 (91.1%) | 31 (9.4%) |
| Bachelor's Degree or higher | 2,047 (85.5%) | 55 (2.3%) |
| Total | 2,621 (82.4%) | 130 (4.1%) |
Employment Occupations by Sex in Paoli
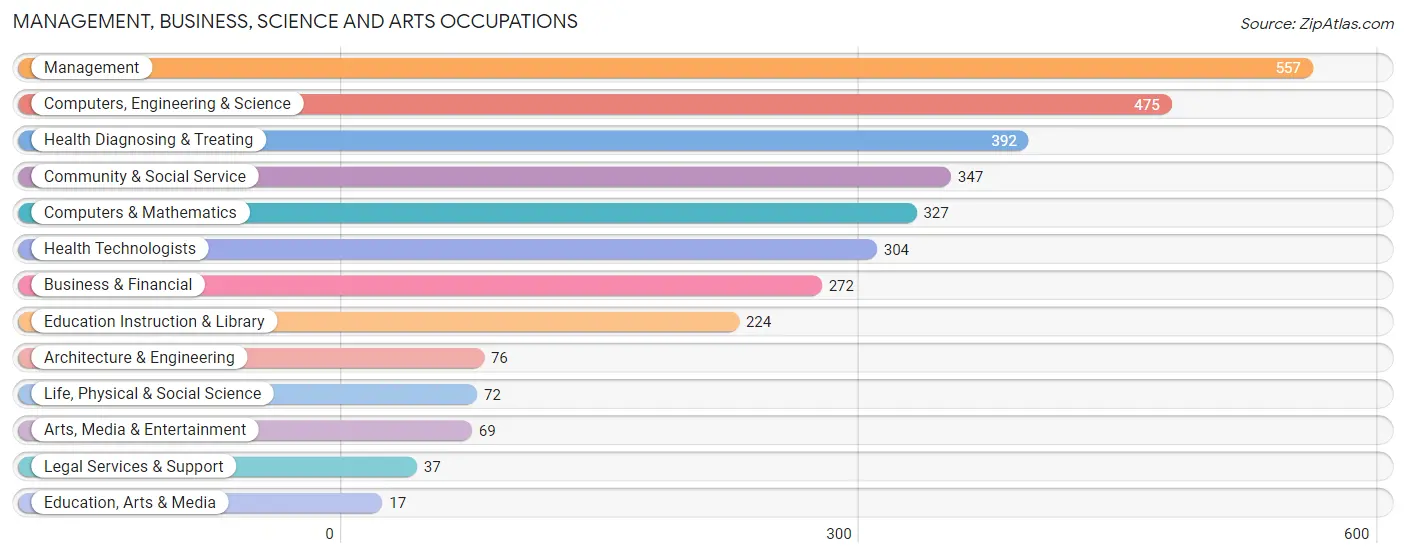
Management, Business, Science and Arts Occupations
The most common Management, Business, Science and Arts occupations in Paoli are Management (557 | 18.7%), Computers, Engineering & Science (475 | 15.9%), Health Diagnosing & Treating (392 | 13.2%), Community & Social Service (347 | 11.7%), and Computers & Mathematics (327 | 11.0%).
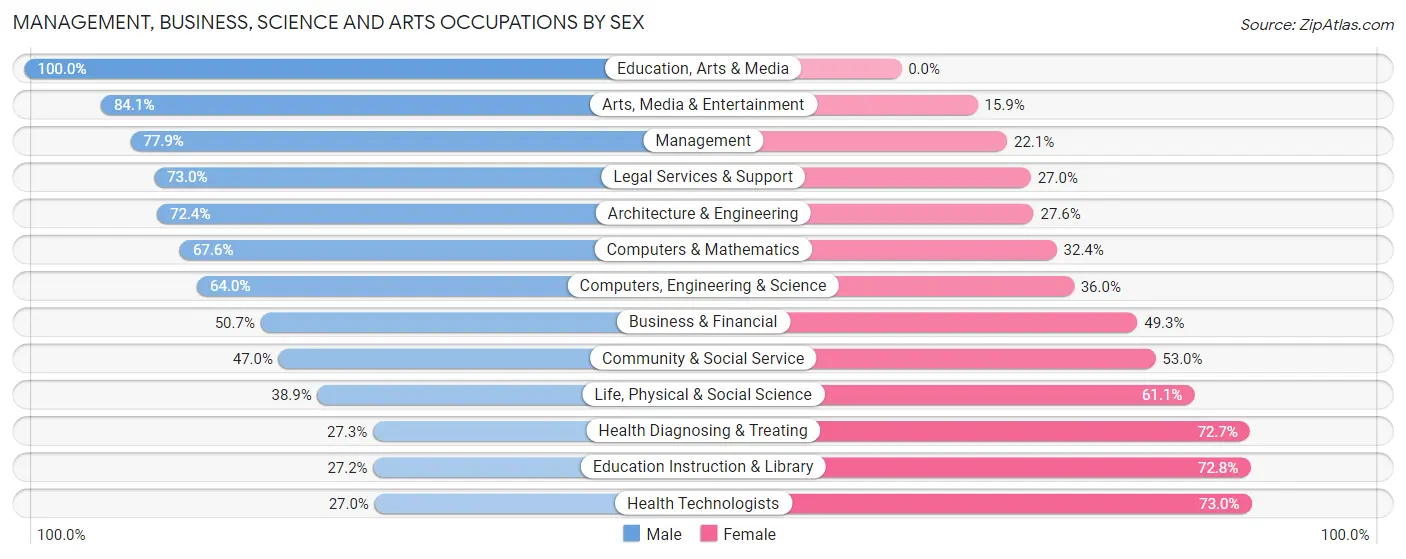
Management, Business, Science and Arts Occupations by Sex
Within the Management, Business, Science and Arts occupations in Paoli, the most male-oriented occupations are Education, Arts & Media (100.0%), Arts, Media & Entertainment (84.1%), and Management (77.9%), while the most female-oriented occupations are Health Technologists (73.0%), Education Instruction & Library (72.8%), and Health Diagnosing & Treating (72.7%).
| Occupation | Male | Female |
| Management | 434 (77.9%) | 123 (22.1%) |
| Business & Financial | 138 (50.7%) | 134 (49.3%) |
| Computers, Engineering & Science | 304 (64.0%) | 171 (36.0%) |
| Computers & Mathematics | 221 (67.6%) | 106 (32.4%) |
| Architecture & Engineering | 55 (72.4%) | 21 (27.6%) |
| Life, Physical & Social Science | 28 (38.9%) | 44 (61.1%) |
| Community & Social Service | 163 (47.0%) | 184 (53.0%) |
| Education, Arts & Media | 17 (100.0%) | 0 (0.0%) |
| Legal Services & Support | 27 (73.0%) | 10 (27.0%) |
| Education Instruction & Library | 61 (27.2%) | 163 (72.8%) |
| Arts, Media & Entertainment | 58 (84.1%) | 11 (15.9%) |
| Health Diagnosing & Treating | 107 (27.3%) | 285 (72.7%) |
| Health Technologists | 82 (27.0%) | 222 (73.0%) |
| Total (Category) | 1,146 (56.1%) | 897 (43.9%) |
| Total (Overall) | 1,695 (56.9%) | 1,284 (43.1%) |
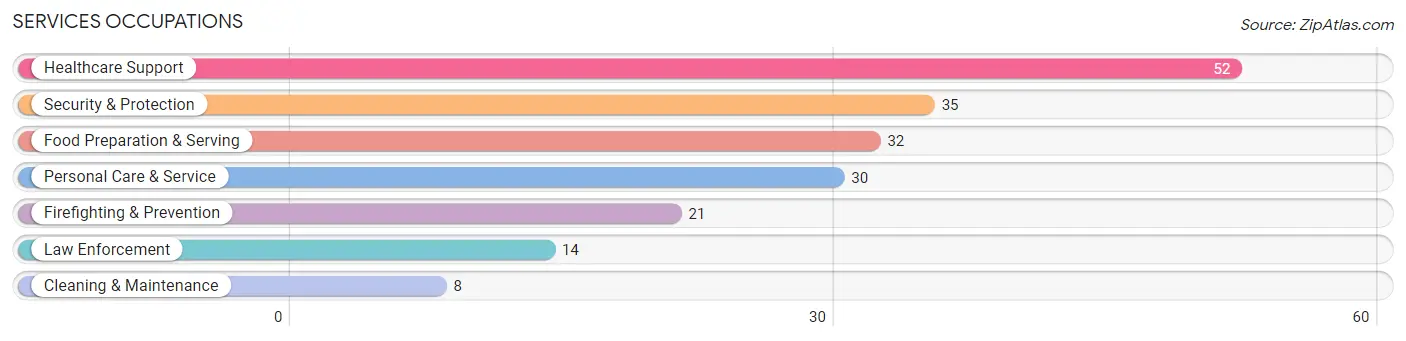
Services Occupations
The most common Services occupations in Paoli are Healthcare Support (52 | 1.8%), Security & Protection (35 | 1.2%), Food Preparation & Serving (32 | 1.1%), Personal Care & Service (30 | 1.0%), and Firefighting & Prevention (21 | 0.7%).
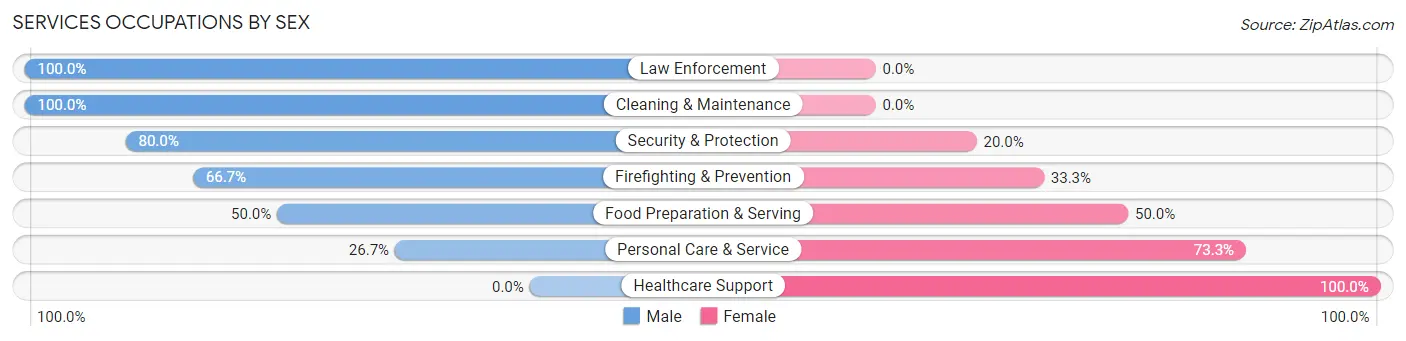
Services Occupations by Sex
Within the Services occupations in Paoli, the most male-oriented occupations are Law Enforcement (100.0%), Cleaning & Maintenance (100.0%), and Security & Protection (80.0%), while the most female-oriented occupations are Healthcare Support (100.0%), Personal Care & Service (73.3%), and Food Preparation & Serving (50.0%).
| Occupation | Male | Female |
| Healthcare Support | 0 (0.0%) | 52 (100.0%) |
| Security & Protection | 28 (80.0%) | 7 (20.0%) |
| Firefighting & Prevention | 14 (66.7%) | 7 (33.3%) |
| Law Enforcement | 14 (100.0%) | 0 (0.0%) |
| Food Preparation & Serving | 16 (50.0%) | 16 (50.0%) |
| Cleaning & Maintenance | 8 (100.0%) | 0 (0.0%) |
| Personal Care & Service | 8 (26.7%) | 22 (73.3%) |
| Total (Category) | 60 (38.2%) | 97 (61.8%) |
| Total (Overall) | 1,695 (56.9%) | 1,284 (43.1%) |
Sales and Office Occupations
The most common Sales and Office occupations in Paoli are Sales & Related (306 | 10.3%), and Office & Administration (174 | 5.8%).
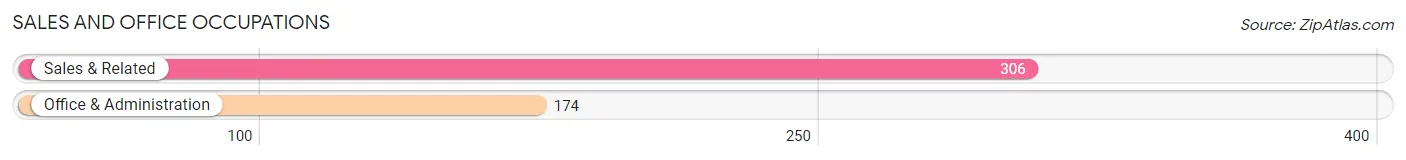
Sales and Office Occupations by Sex
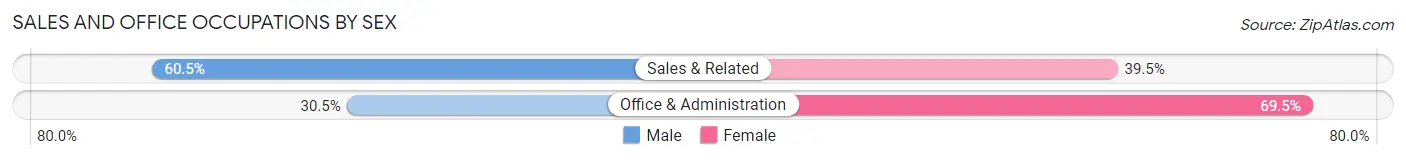
| Occupation | Male | Female |
| Sales & Related | 185 (60.5%) | 121 (39.5%) |
| Office & Administration | 53 (30.5%) | 121 (69.5%) |
| Total (Category) | 238 (49.6%) | 242 (50.4%) |
| Total (Overall) | 1,695 (56.9%) | 1,284 (43.1%) |
Natural Resources, Construction and Maintenance Occupations
The most common Natural Resources, Construction and Maintenance occupations in Paoli are Installation, Maintenance & Repair (55 | 1.8%), Construction & Extraction (31 | 1.0%), and Farming, Fishing & Forestry (13 | 0.4%).
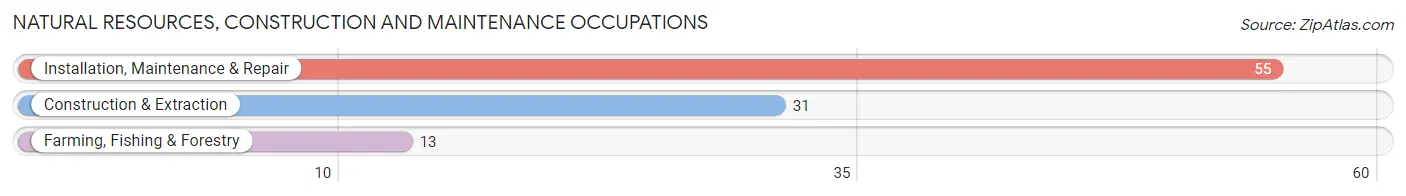
Natural Resources, Construction and Maintenance Occupations by Sex
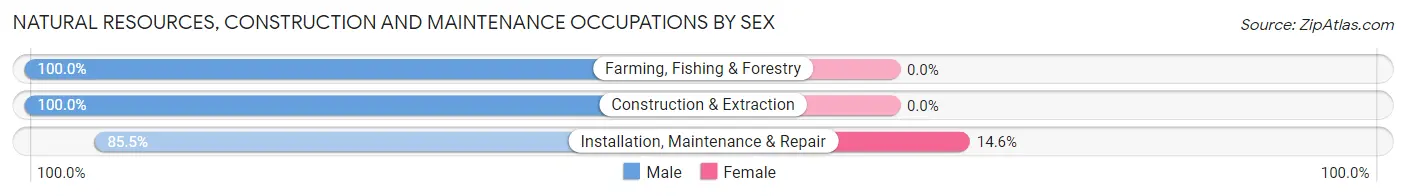
| Occupation | Male | Female |
| Farming, Fishing & Forestry | 13 (100.0%) | 0 (0.0%) |
| Construction & Extraction | 31 (100.0%) | 0 (0.0%) |
| Installation, Maintenance & Repair | 47 (85.5%) | 8 (14.5%) |
| Total (Category) | 91 (91.9%) | 8 (8.1%) |
| Total (Overall) | 1,695 (56.9%) | 1,284 (43.1%) |
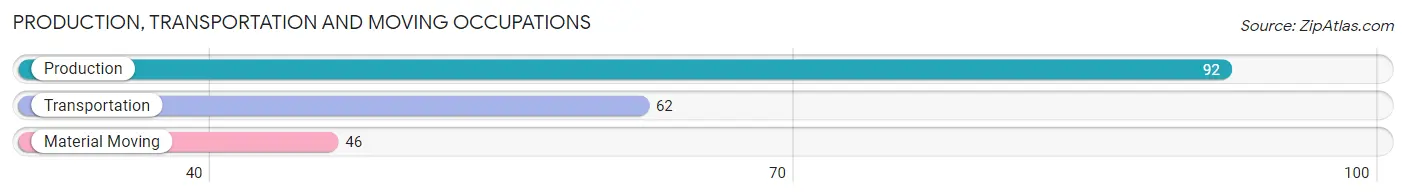
Production, Transportation and Moving Occupations
The most common Production, Transportation and Moving occupations in Paoli are Production (92 | 3.1%), Transportation (62 | 2.1%), and Material Moving (46 | 1.5%).
Production, Transportation and Moving Occupations by Sex
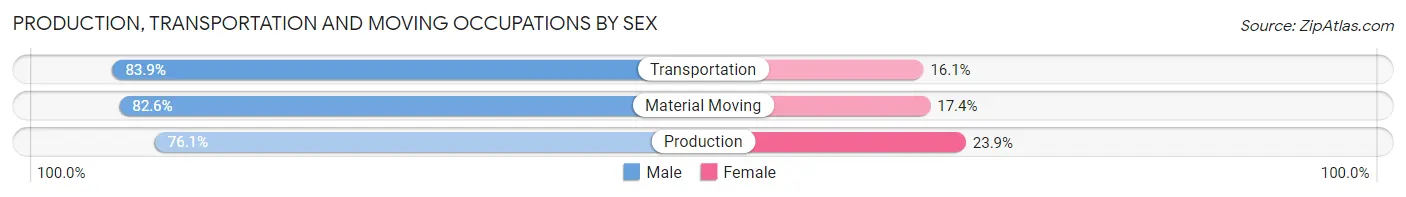
| Occupation | Male | Female |
| Production | 70 (76.1%) | 22 (23.9%) |
| Transportation | 52 (83.9%) | 10 (16.1%) |
| Material Moving | 38 (82.6%) | 8 (17.4%) |
| Total (Category) | 160 (80.0%) | 40 (20.0%) |
| Total (Overall) | 1,695 (56.9%) | 1,284 (43.1%) |
Employment Industries by Sex in Paoli
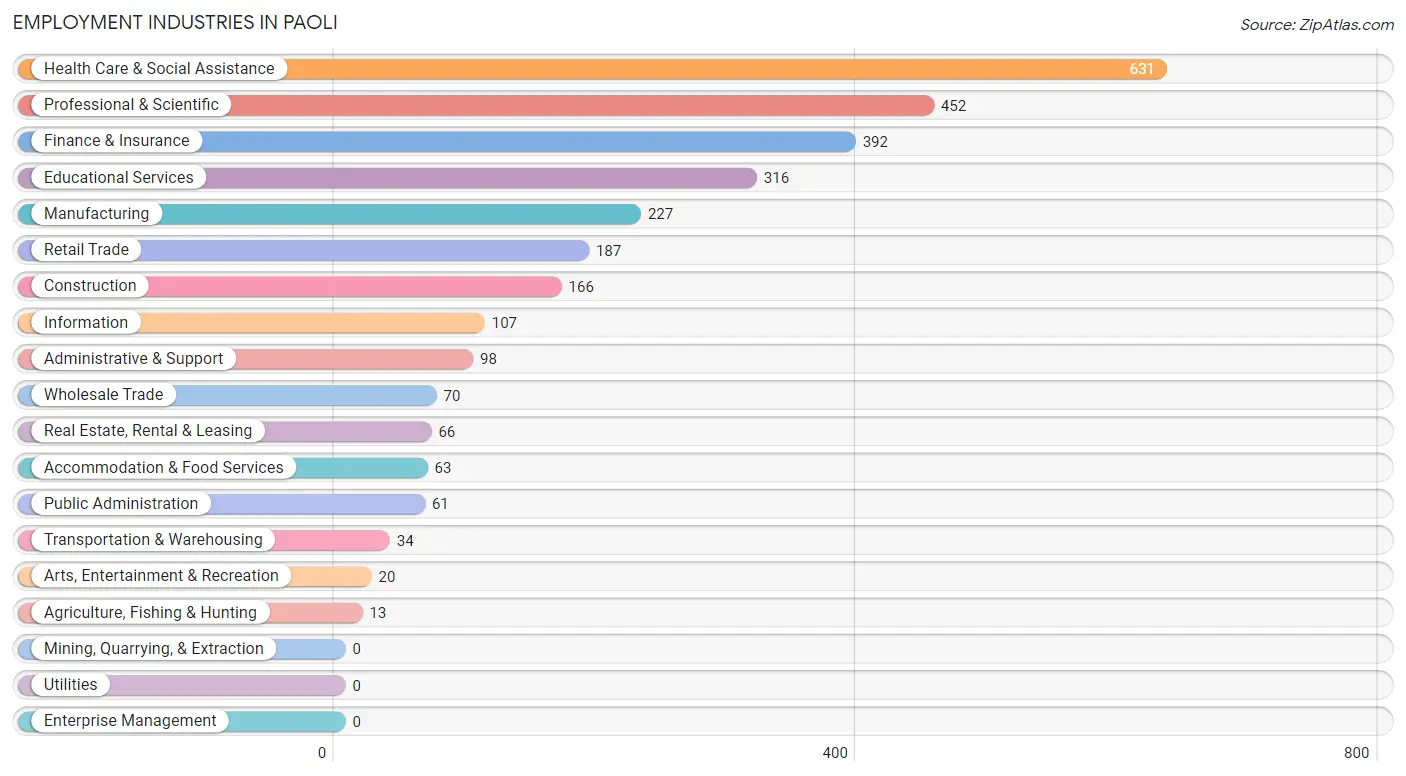
Employment Industries in Paoli
The major employment industries in Paoli include Health Care & Social Assistance (631 | 21.2%), Professional & Scientific (452 | 15.2%), Finance & Insurance (392 | 13.2%), Educational Services (316 | 10.6%), and Manufacturing (227 | 7.6%).
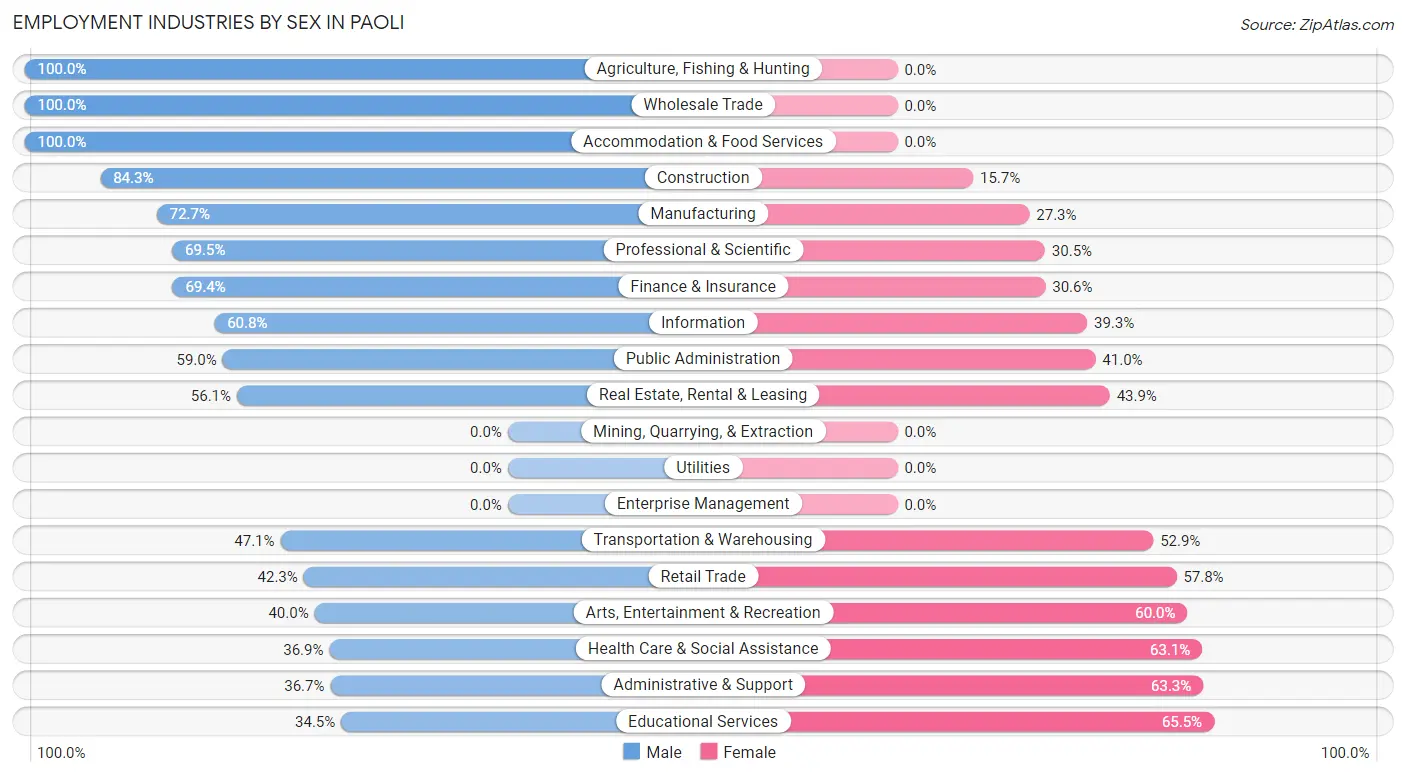
Employment Industries by Sex in Paoli
The Paoli industries that see more men than women are Agriculture, Fishing & Hunting (100.0%), Wholesale Trade (100.0%), and Accommodation & Food Services (100.0%), whereas the industries that tend to have a higher number of women are Educational Services (65.5%), Administrative & Support (63.3%), and Health Care & Social Assistance (63.1%).
| Industry | Male | Female |
| Agriculture, Fishing & Hunting | 13 (100.0%) | 0 (0.0%) |
| Mining, Quarrying, & Extraction | 0 (0.0%) | 0 (0.0%) |
| Construction | 140 (84.3%) | 26 (15.7%) |
| Manufacturing | 165 (72.7%) | 62 (27.3%) |
| Wholesale Trade | 70 (100.0%) | 0 (0.0%) |
| Retail Trade | 79 (42.2%) | 108 (57.8%) |
| Transportation & Warehousing | 16 (47.1%) | 18 (52.9%) |
| Utilities | 0 (0.0%) | 0 (0.0%) |
| Information | 65 (60.8%) | 42 (39.3%) |
| Finance & Insurance | 272 (69.4%) | 120 (30.6%) |
| Real Estate, Rental & Leasing | 37 (56.1%) | 29 (43.9%) |
| Professional & Scientific | 314 (69.5%) | 138 (30.5%) |
| Enterprise Management | 0 (0.0%) | 0 (0.0%) |
| Administrative & Support | 36 (36.7%) | 62 (63.3%) |
| Educational Services | 109 (34.5%) | 207 (65.5%) |
| Health Care & Social Assistance | 233 (36.9%) | 398 (63.1%) |
| Arts, Entertainment & Recreation | 8 (40.0%) | 12 (60.0%) |
| Accommodation & Food Services | 63 (100.0%) | 0 (0.0%) |
| Public Administration | 36 (59.0%) | 25 (41.0%) |
| Total | 1,695 (56.9%) | 1,284 (43.1%) |
Education in Paoli
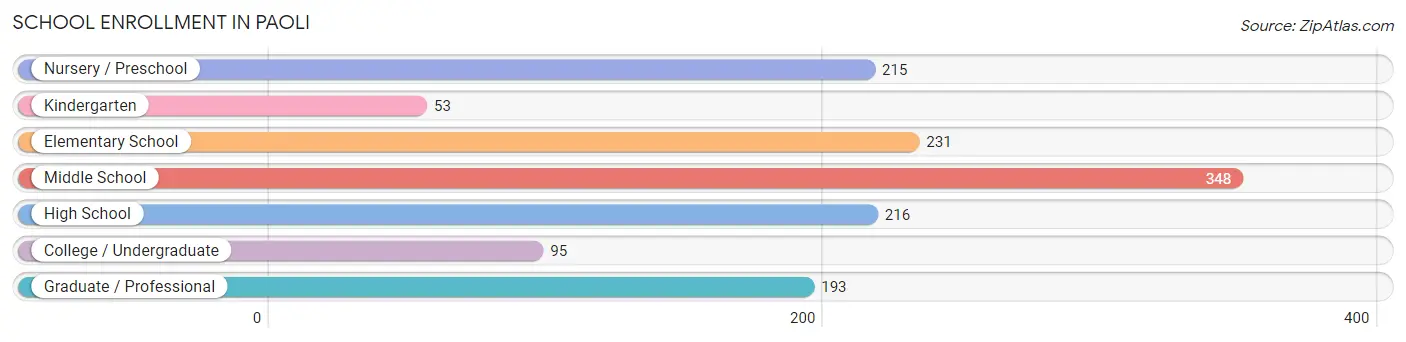
School Enrollment in Paoli
The most common levels of schooling among the 1,351 students in Paoli are middle school (348 | 25.8%), elementary school (231 | 17.1%), and high school (216 | 16.0%).
| School Level | # Students | % Students |
| Nursery / Preschool | 215 | 15.9% |
| Kindergarten | 53 | 3.9% |
| Elementary School | 231 | 17.1% |
| Middle School | 348 | 25.8% |
| High School | 216 | 16.0% |
| College / Undergraduate | 95 | 7.0% |
| Graduate / Professional | 193 | 14.3% |
| Total | 1,351 | 100.0% |
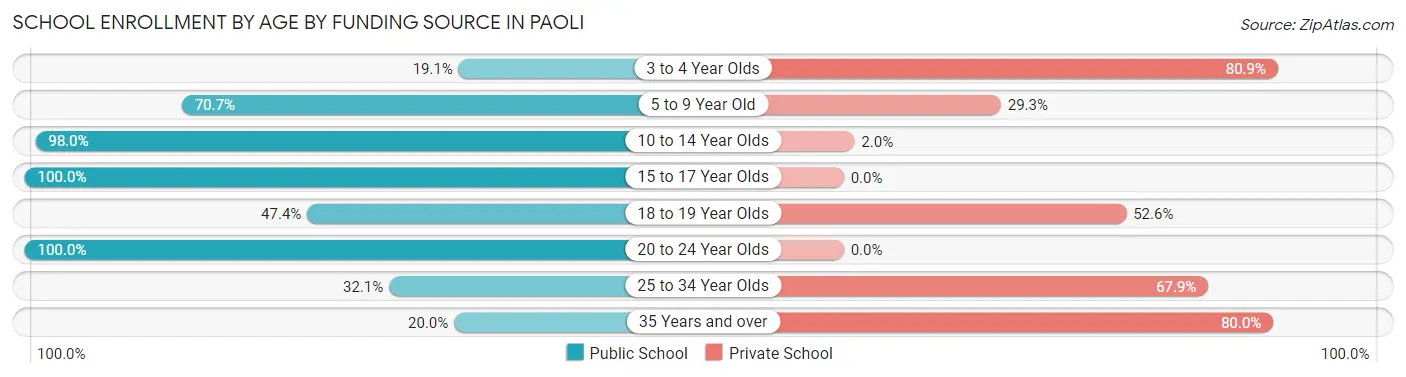
School Enrollment by Age by Funding Source in Paoli
Out of a total of 1,351 students who are enrolled in schools in Paoli, 419 (31.0%) attend a private institution, while the remaining 932 (69.0%) are enrolled in public schools. The age group of 3 to 4 year olds has the highest likelihood of being enrolled in private schools, with 131 (80.9% in the age bracket) enrolled. Conversely, the age group of 15 to 17 year olds has the lowest likelihood of being enrolled in a private school, with 172 (100.0% in the age bracket) attending a public institution.
| Age Bracket | Public School | Private School |
| 3 to 4 Year Olds | 31 (19.1%) | 131 (80.9%) |
| 5 to 9 Year Old | 232 (70.7%) | 96 (29.3%) |
| 10 to 14 Year Olds | 393 (98.0%) | 8 (2.0%) |
| 15 to 17 Year Olds | 172 (100.0%) | 0 (0.0%) |
| 18 to 19 Year Olds | 9 (47.4%) | 10 (52.6%) |
| 20 to 24 Year Olds | 35 (100.0%) | 0 (0.0%) |
| 25 to 34 Year Olds | 35 (32.1%) | 74 (67.9%) |
| 35 Years and over | 25 (20.0%) | 100 (80.0%) |
| Total | 932 (69.0%) | 419 (31.0%) |
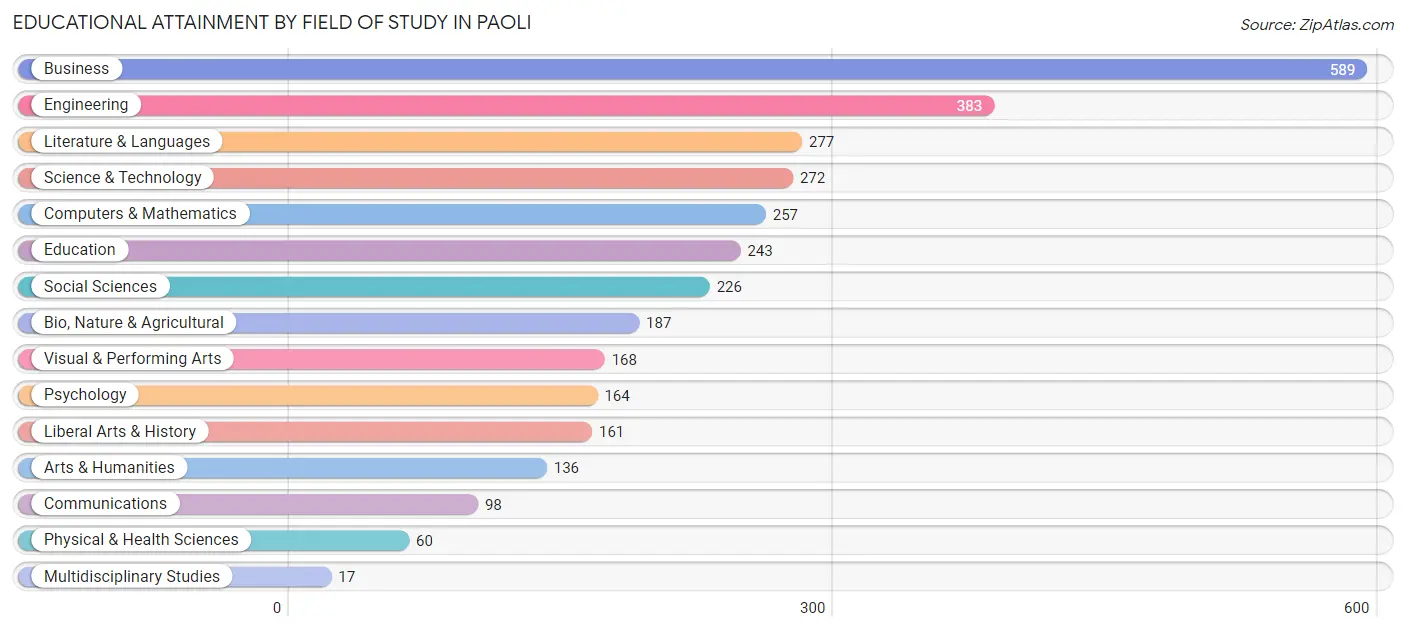
Educational Attainment by Field of Study in Paoli
Business (589 | 18.2%), engineering (383 | 11.8%), literature & languages (277 | 8.6%), science & technology (272 | 8.4%), and computers & mathematics (257 | 7.9%) are the most common fields of study among 3,238 individuals in Paoli who have obtained a bachelor's degree or higher.
| Field of Study | # Graduates | % Graduates |
| Computers & Mathematics | 257 | 7.9% |
| Bio, Nature & Agricultural | 187 | 5.8% |
| Physical & Health Sciences | 60 | 1.8% |
| Psychology | 164 | 5.1% |
| Social Sciences | 226 | 7.0% |
| Engineering | 383 | 11.8% |
| Multidisciplinary Studies | 17 | 0.5% |
| Science & Technology | 272 | 8.4% |
| Business | 589 | 18.2% |
| Education | 243 | 7.5% |
| Literature & Languages | 277 | 8.6% |
| Liberal Arts & History | 161 | 5.0% |
| Visual & Performing Arts | 168 | 5.2% |
| Communications | 98 | 3.0% |
| Arts & Humanities | 136 | 4.2% |
| Total | 3,238 | 100.0% |
Transportation & Commute in Paoli
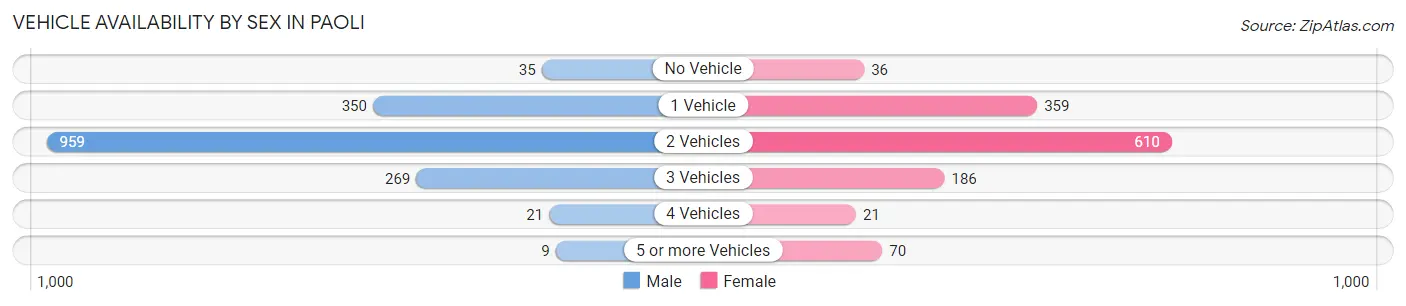
Vehicle Availability by Sex in Paoli
The most prevalent vehicle ownership categories in Paoli are males with 2 vehicles (959, accounting for 58.4%) and females with 2 vehicles (610, making up 74.8%).
| Vehicles Available | Male | Female |
| No Vehicle | 35 (2.1%) | 36 (2.8%) |
| 1 Vehicle | 350 (21.3%) | 359 (28.0%) |
| 2 Vehicles | 959 (58.4%) | 610 (47.6%) |
| 3 Vehicles | 269 (16.4%) | 186 (14.5%) |
| 4 Vehicles | 21 (1.3%) | 21 (1.6%) |
| 5 or more Vehicles | 9 (0.5%) | 70 (5.5%) |
| Total | 1,643 (100.0%) | 1,282 (100.0%) |
Commute Time in Paoli
The most frequently occuring commute durations in Paoli are 15 to 19 minutes (462 commuters, 20.7%), 30 to 34 minutes (332 commuters, 14.9%), and 20 to 24 minutes (329 commuters, 14.7%).
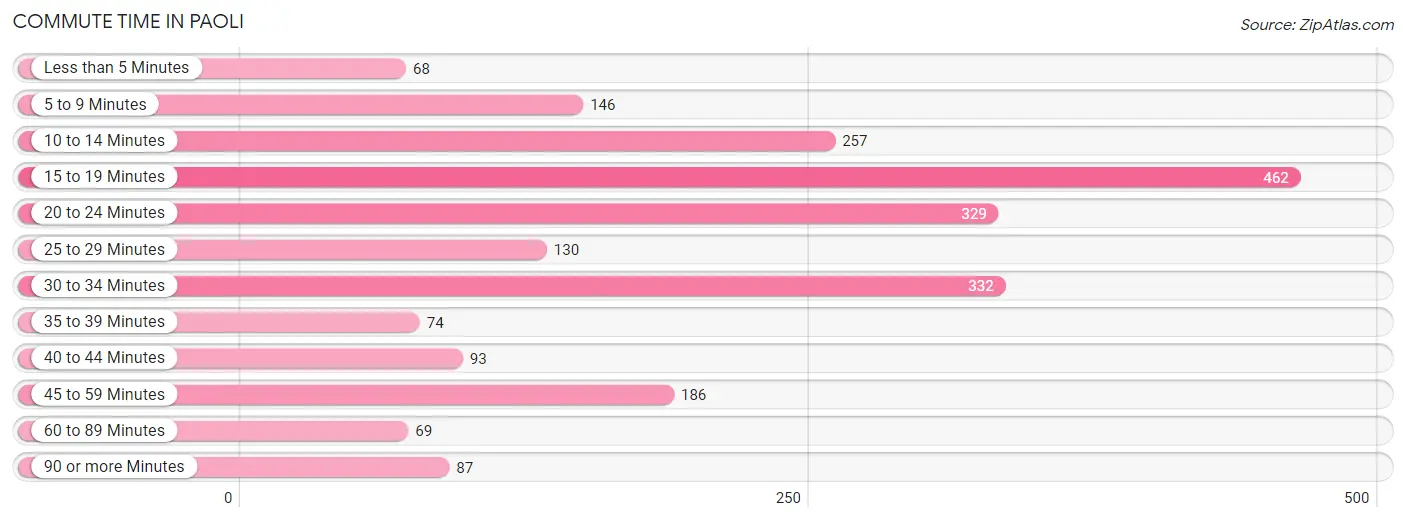
| Commute Time | # Commuters | % Commuters |
| Less than 5 Minutes | 68 | 3.0% |
| 5 to 9 Minutes | 146 | 6.5% |
| 10 to 14 Minutes | 257 | 11.5% |
| 15 to 19 Minutes | 462 | 20.7% |
| 20 to 24 Minutes | 329 | 14.7% |
| 25 to 29 Minutes | 130 | 5.8% |
| 30 to 34 Minutes | 332 | 14.9% |
| 35 to 39 Minutes | 74 | 3.3% |
| 40 to 44 Minutes | 93 | 4.2% |
| 45 to 59 Minutes | 186 | 8.3% |
| 60 to 89 Minutes | 69 | 3.1% |
| 90 or more Minutes | 87 | 3.9% |
Commute Time by Sex in Paoli
The most common commute times in Paoli are 30 to 34 minutes (217 commuters, 18.5%) for males and 15 to 19 minutes (254 commuters, 23.9%) for females.
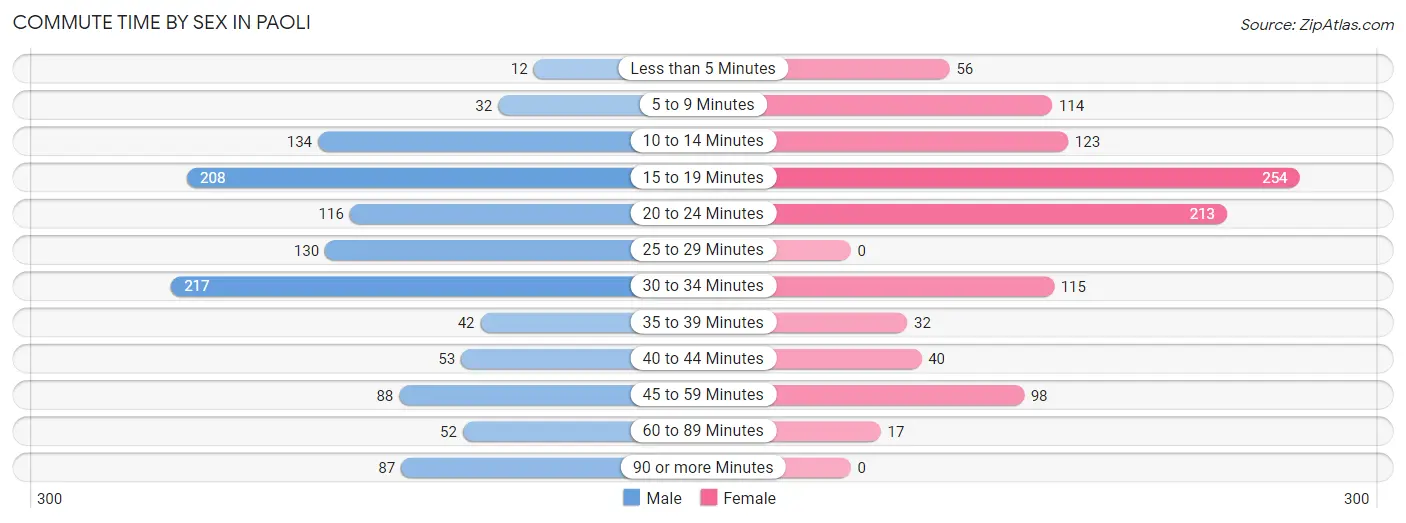
| Commute Time | Male | Female |
| Less than 5 Minutes | 12 (1.0%) | 56 (5.3%) |
| 5 to 9 Minutes | 32 (2.7%) | 114 (10.7%) |
| 10 to 14 Minutes | 134 (11.4%) | 123 (11.6%) |
| 15 to 19 Minutes | 208 (17.8%) | 254 (23.9%) |
| 20 to 24 Minutes | 116 (9.9%) | 213 (20.1%) |
| 25 to 29 Minutes | 130 (11.1%) | 0 (0.0%) |
| 30 to 34 Minutes | 217 (18.5%) | 115 (10.8%) |
| 35 to 39 Minutes | 42 (3.6%) | 32 (3.0%) |
| 40 to 44 Minutes | 53 (4.5%) | 40 (3.8%) |
| 45 to 59 Minutes | 88 (7.5%) | 98 (9.2%) |
| 60 to 89 Minutes | 52 (4.4%) | 17 (1.6%) |
| 90 or more Minutes | 87 (7.4%) | 0 (0.0%) |
Time of Departure to Work by Sex in Paoli
The most frequent times of departure to work in Paoli are 7:30 AM to 7:59 AM (231, 19.7%) for males and 7:00 AM to 7:29 AM (311, 29.3%) for females.
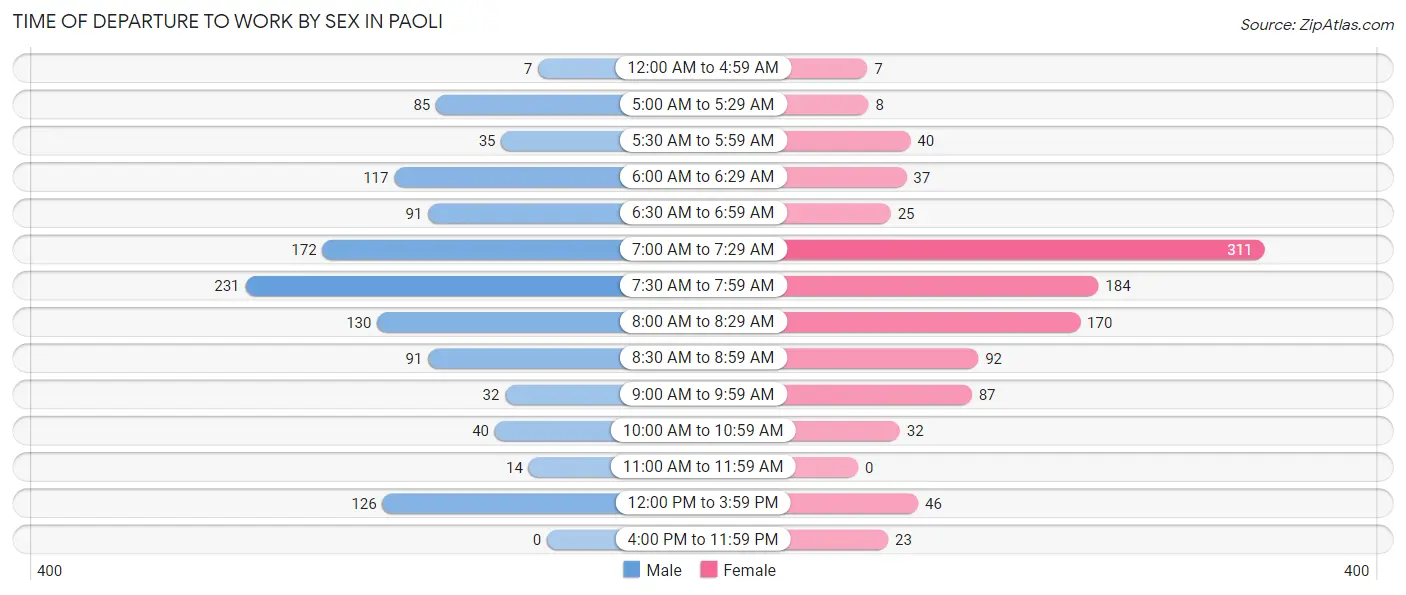
| Time of Departure | Male | Female |
| 12:00 AM to 4:59 AM | 7 (0.6%) | 7 (0.7%) |
| 5:00 AM to 5:29 AM | 85 (7.3%) | 8 (0.7%) |
| 5:30 AM to 5:59 AM | 35 (3.0%) | 40 (3.8%) |
| 6:00 AM to 6:29 AM | 117 (10.0%) | 37 (3.5%) |
| 6:30 AM to 6:59 AM | 91 (7.8%) | 25 (2.4%) |
| 7:00 AM to 7:29 AM | 172 (14.7%) | 311 (29.3%) |
| 7:30 AM to 7:59 AM | 231 (19.7%) | 184 (17.3%) |
| 8:00 AM to 8:29 AM | 130 (11.1%) | 170 (16.0%) |
| 8:30 AM to 8:59 AM | 91 (7.8%) | 92 (8.7%) |
| 9:00 AM to 9:59 AM | 32 (2.7%) | 87 (8.2%) |
| 10:00 AM to 10:59 AM | 40 (3.4%) | 32 (3.0%) |
| 11:00 AM to 11:59 AM | 14 (1.2%) | 0 (0.0%) |
| 12:00 PM to 3:59 PM | 126 (10.8%) | 46 (4.3%) |
| 4:00 PM to 11:59 PM | 0 (0.0%) | 23 (2.2%) |
| Total | 1,171 (100.0%) | 1,062 (100.0%) |
Housing Occupancy in Paoli
Occupancy by Ownership in Paoli
Of the total 2,515 dwellings in Paoli, owner-occupied units account for 1,910 (75.9%), while renter-occupied units make up 605 (24.1%).
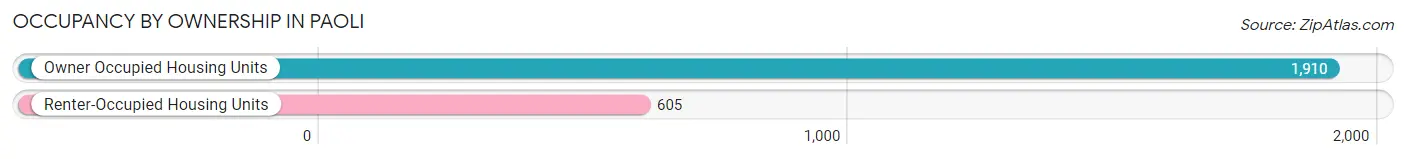
| Occupancy | # Housing Units | % Housing Units |
| Owner Occupied Housing Units | 1,910 | 75.9% |
| Renter-Occupied Housing Units | 605 | 24.1% |
| Total Occupied Housing Units | 2,515 | 100.0% |
Occupancy by Household Size in Paoli
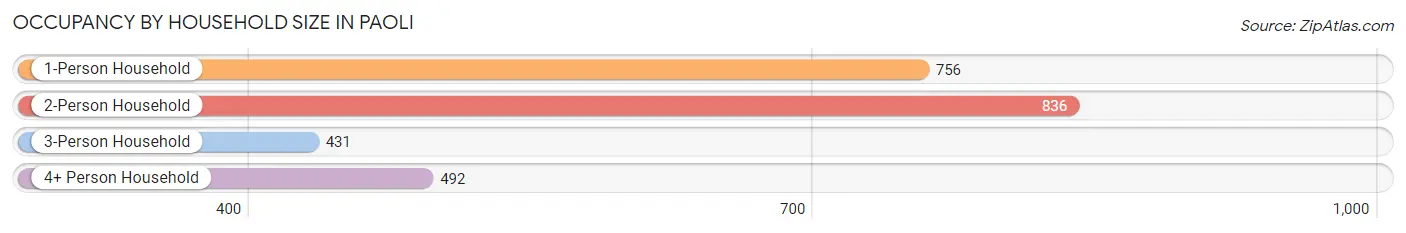
| Household Size | # Housing Units | % Housing Units |
| 1-Person Household | 756 | 30.1% |
| 2-Person Household | 836 | 33.2% |
| 3-Person Household | 431 | 17.1% |
| 4+ Person Household | 492 | 19.6% |
| Total Housing Units | 2,515 | 100.0% |
Occupancy by Ownership by Household Size in Paoli
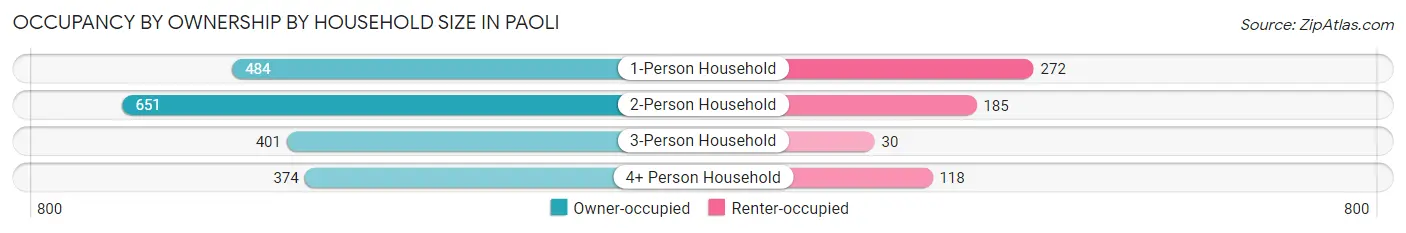
| Household Size | Owner-occupied | Renter-occupied |
| 1-Person Household | 484 (64.0%) | 272 (36.0%) |
| 2-Person Household | 651 (77.9%) | 185 (22.1%) |
| 3-Person Household | 401 (93.0%) | 30 (7.0%) |
| 4+ Person Household | 374 (76.0%) | 118 (24.0%) |
| Total Housing Units | 1,910 (75.9%) | 605 (24.1%) |
Occupancy by Educational Attainment in Paoli
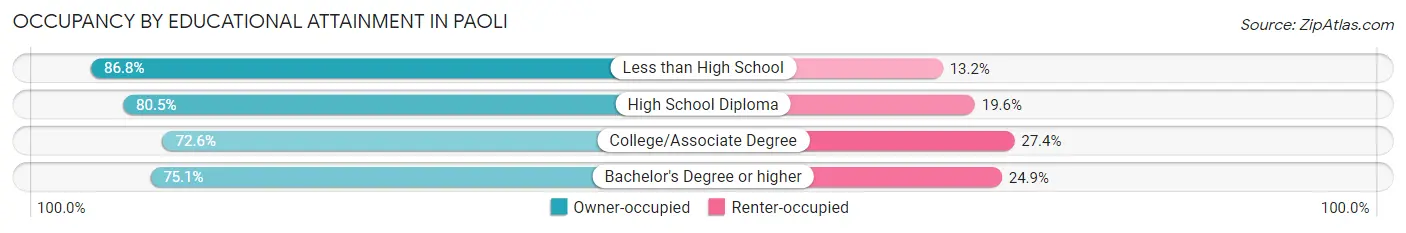
| Household Size | Owner-occupied | Renter-occupied |
| Less than High School | 79 (86.8%) | 12 (13.2%) |
| High School Diploma | 284 (80.4%) | 69 (19.6%) |
| College/Associate Degree | 236 (72.6%) | 89 (27.4%) |
| Bachelor's Degree or higher | 1,311 (75.1%) | 435 (24.9%) |
Occupancy by Age of Householder in Paoli
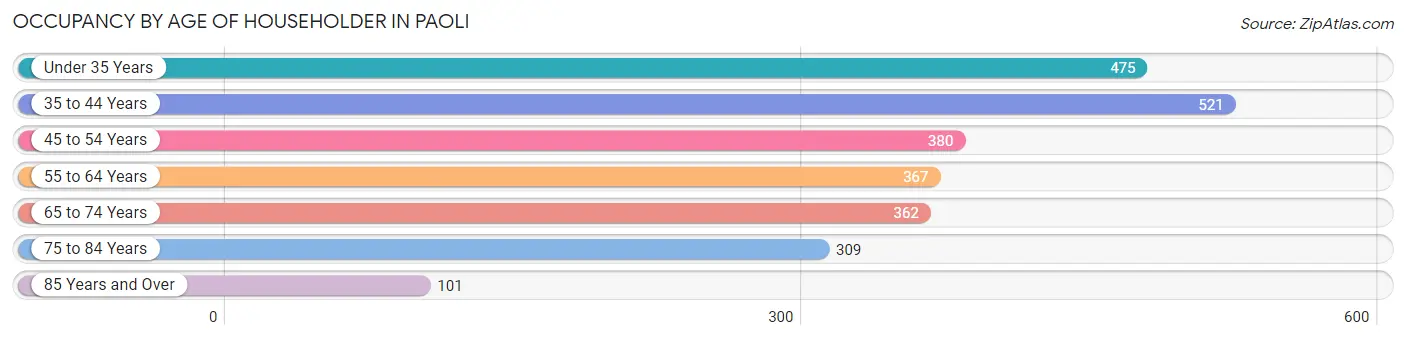
| Age Bracket | # Households | % Households |
| Under 35 Years | 475 | 18.9% |
| 35 to 44 Years | 521 | 20.7% |
| 45 to 54 Years | 380 | 15.1% |
| 55 to 64 Years | 367 | 14.6% |
| 65 to 74 Years | 362 | 14.4% |
| 75 to 84 Years | 309 | 12.3% |
| 85 Years and Over | 101 | 4.0% |
| Total | 2,515 | 100.0% |
Housing Finances in Paoli
Median Income by Occupancy in Paoli
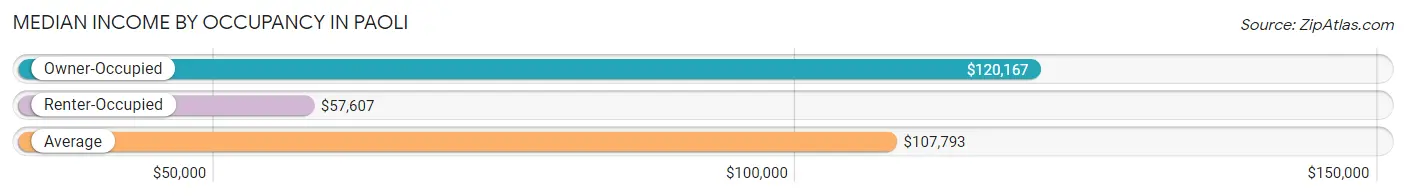
| Occupancy Type | # Households | Median Income |
| Owner-Occupied | 1,910 (75.9%) | $120,167 |
| Renter-Occupied | 605 (24.1%) | $57,607 |
| Average | 2,515 (100.0%) | $107,793 |
Occupancy by Householder Income Bracket in Paoli
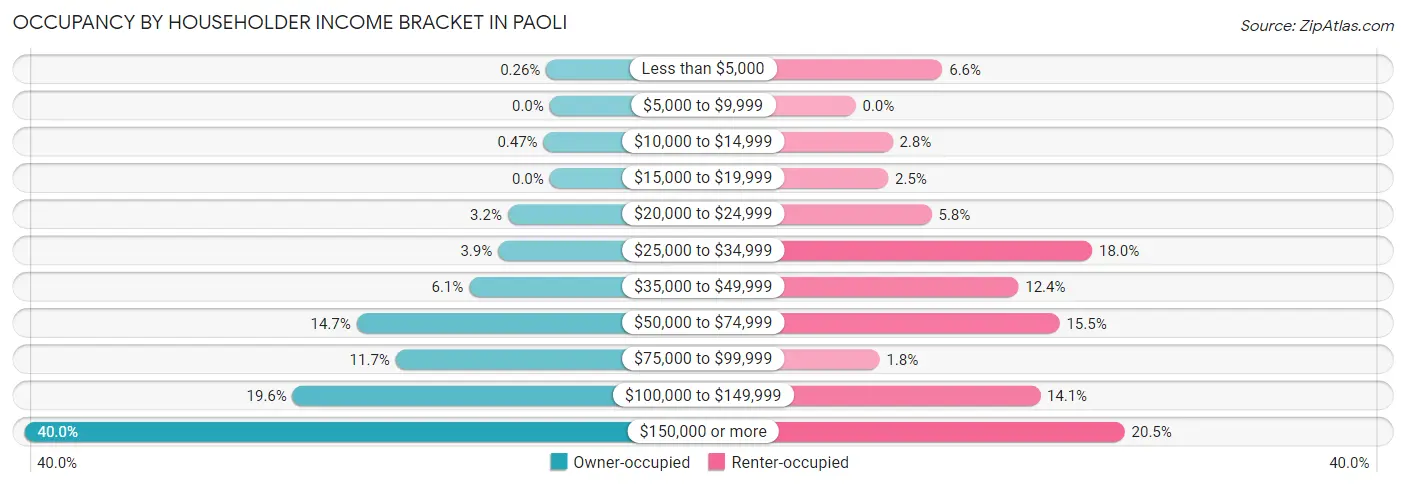
| Income Bracket | Owner-occupied | Renter-occupied |
| Less than $5,000 | 5 (0.3%) | 40 (6.6%) |
| $5,000 to $9,999 | 0 (0.0%) | 0 (0.0%) |
| $10,000 to $14,999 | 9 (0.5%) | 17 (2.8%) |
| $15,000 to $19,999 | 0 (0.0%) | 15 (2.5%) |
| $20,000 to $24,999 | 61 (3.2%) | 35 (5.8%) |
| $25,000 to $34,999 | 75 (3.9%) | 109 (18.0%) |
| $35,000 to $49,999 | 117 (6.1%) | 75 (12.4%) |
| $50,000 to $74,999 | 281 (14.7%) | 94 (15.5%) |
| $75,000 to $99,999 | 224 (11.7%) | 11 (1.8%) |
| $100,000 to $149,999 | 374 (19.6%) | 85 (14.1%) |
| $150,000 or more | 764 (40.0%) | 124 (20.5%) |
| Total | 1,910 (100.0%) | 605 (100.0%) |
Monthly Housing Cost Tiers in Paoli
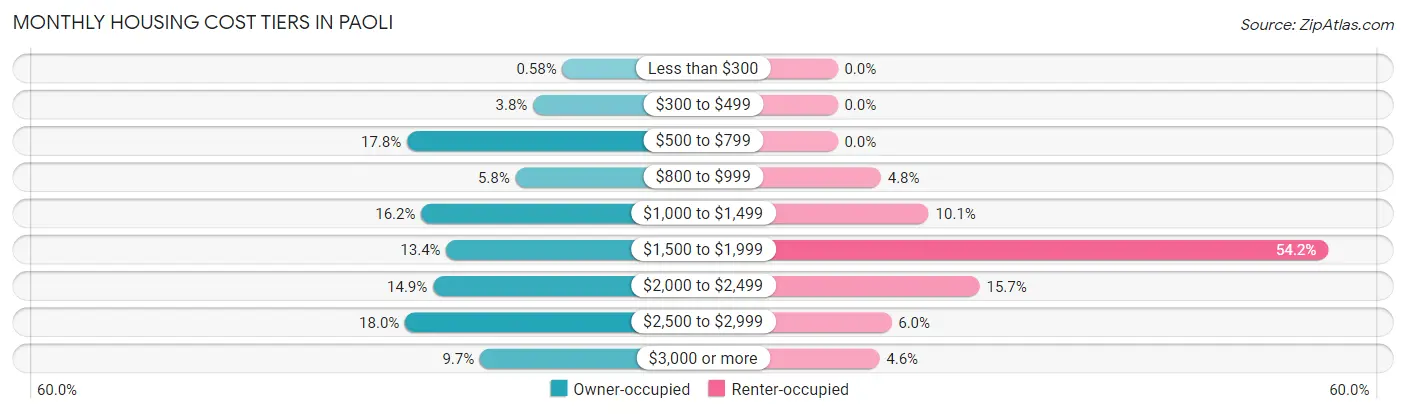
| Monthly Cost | Owner-occupied | Renter-occupied |
| Less than $300 | 11 (0.6%) | 0 (0.0%) |
| $300 to $499 | 73 (3.8%) | 0 (0.0%) |
| $500 to $799 | 339 (17.7%) | 0 (0.0%) |
| $800 to $999 | 110 (5.8%) | 29 (4.8%) |
| $1,000 to $1,499 | 309 (16.2%) | 61 (10.1%) |
| $1,500 to $1,999 | 256 (13.4%) | 328 (54.2%) |
| $2,000 to $2,499 | 284 (14.9%) | 95 (15.7%) |
| $2,500 to $2,999 | 343 (18.0%) | 36 (5.9%) |
| $3,000 or more | 185 (9.7%) | 28 (4.6%) |
| Total | 1,910 (100.0%) | 605 (100.0%) |
Physical Housing Characteristics in Paoli
Housing Structures in Paoli
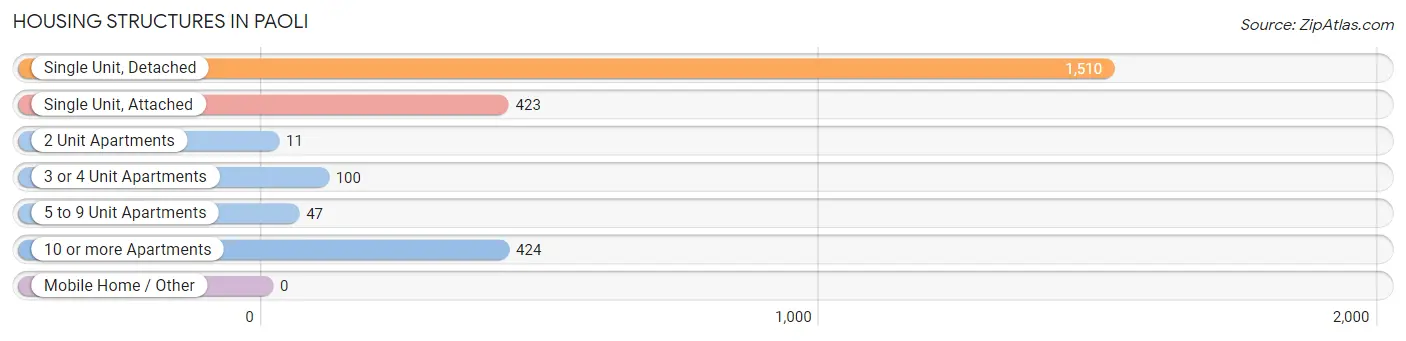
| Structure Type | # Housing Units | % Housing Units |
| Single Unit, Detached | 1,510 | 60.0% |
| Single Unit, Attached | 423 | 16.8% |
| 2 Unit Apartments | 11 | 0.4% |
| 3 or 4 Unit Apartments | 100 | 4.0% |
| 5 to 9 Unit Apartments | 47 | 1.9% |
| 10 or more Apartments | 424 | 16.9% |
| Mobile Home / Other | 0 | 0.0% |
| Total | 2,515 | 100.0% |
Housing Structures by Occupancy in Paoli
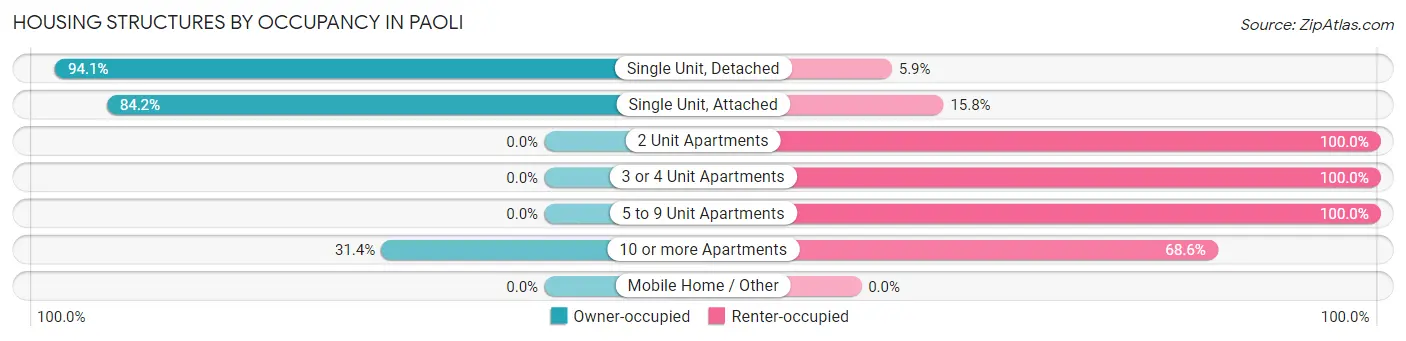
| Structure Type | Owner-occupied | Renter-occupied |
| Single Unit, Detached | 1,421 (94.1%) | 89 (5.9%) |
| Single Unit, Attached | 356 (84.2%) | 67 (15.8%) |
| 2 Unit Apartments | 0 (0.0%) | 11 (100.0%) |
| 3 or 4 Unit Apartments | 0 (0.0%) | 100 (100.0%) |
| 5 to 9 Unit Apartments | 0 (0.0%) | 47 (100.0%) |
| 10 or more Apartments | 133 (31.4%) | 291 (68.6%) |
| Mobile Home / Other | 0 (0.0%) | 0 (0.0%) |
| Total | 1,910 (75.9%) | 605 (24.1%) |
Housing Structures by Number of Rooms in Paoli
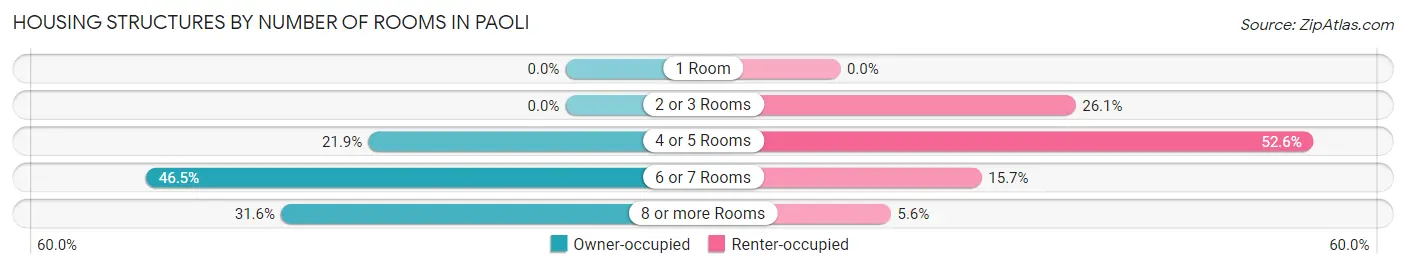
| Number of Rooms | Owner-occupied | Renter-occupied |
| 1 Room | 0 (0.0%) | 0 (0.0%) |
| 2 or 3 Rooms | 0 (0.0%) | 158 (26.1%) |
| 4 or 5 Rooms | 418 (21.9%) | 318 (52.6%) |
| 6 or 7 Rooms | 889 (46.5%) | 95 (15.7%) |
| 8 or more Rooms | 603 (31.6%) | 34 (5.6%) |
| Total | 1,910 (100.0%) | 605 (100.0%) |
Housing Structure by Heating Type in Paoli
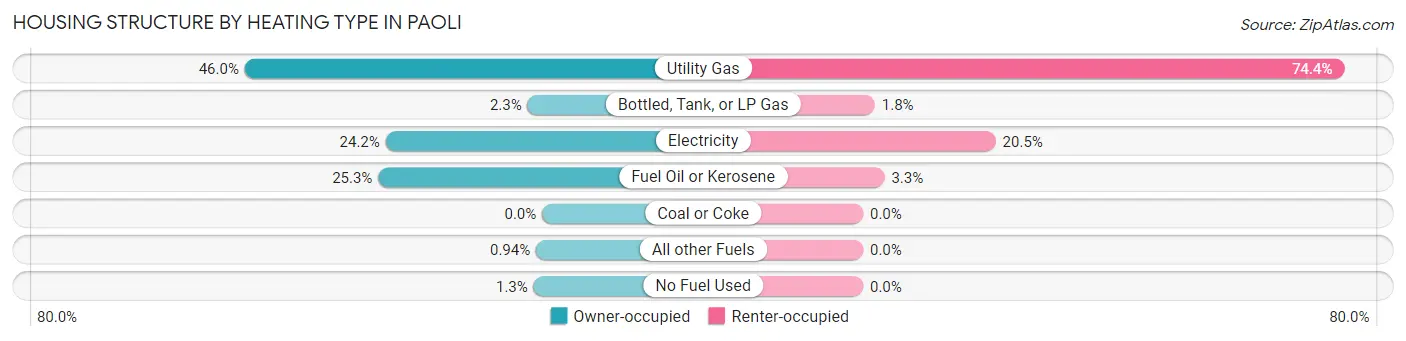
| Heating Type | Owner-occupied | Renter-occupied |
| Utility Gas | 878 (46.0%) | 450 (74.4%) |
| Bottled, Tank, or LP Gas | 43 (2.2%) | 11 (1.8%) |
| Electricity | 462 (24.2%) | 124 (20.5%) |
| Fuel Oil or Kerosene | 484 (25.3%) | 20 (3.3%) |
| Coal or Coke | 0 (0.0%) | 0 (0.0%) |
| All other Fuels | 18 (0.9%) | 0 (0.0%) |
| No Fuel Used | 25 (1.3%) | 0 (0.0%) |
| Total | 1,910 (100.0%) | 605 (100.0%) |
Household Vehicle Usage in Paoli
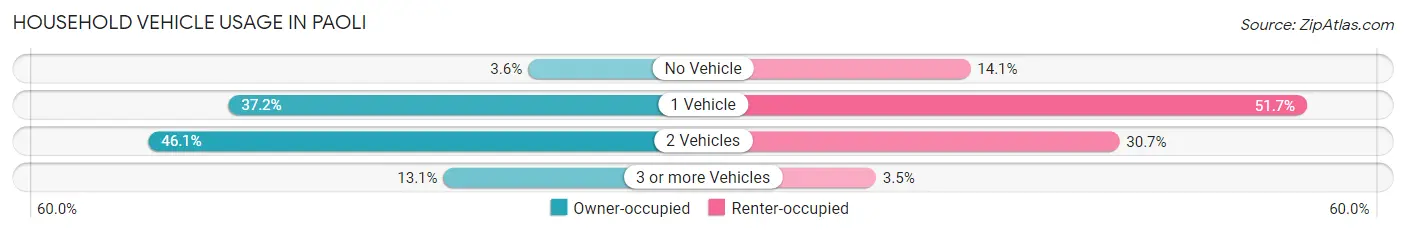
| Vehicles per Household | Owner-occupied | Renter-occupied |
| No Vehicle | 69 (3.6%) | 85 (14.1%) |
| 1 Vehicle | 710 (37.2%) | 313 (51.7%) |
| 2 Vehicles | 881 (46.1%) | 186 (30.7%) |
| 3 or more Vehicles | 250 (13.1%) | 21 (3.5%) |
| Total | 1,910 (100.0%) | 605 (100.0%) |
Real Estate & Mortgages in Paoli
Real Estate and Mortgage Overview in Paoli
| Characteristic | Without Mortgage | With Mortgage |
| Housing Units | 729 | 1,181 |
| Median Property Value | $419,200 | $460,400 |
| Median Household Income | $83,285 | $578 |
| Monthly Housing Costs | $749 | $185 |
| Real Estate Taxes | $3,989 | $0 |
Property Value by Mortgage Status in Paoli
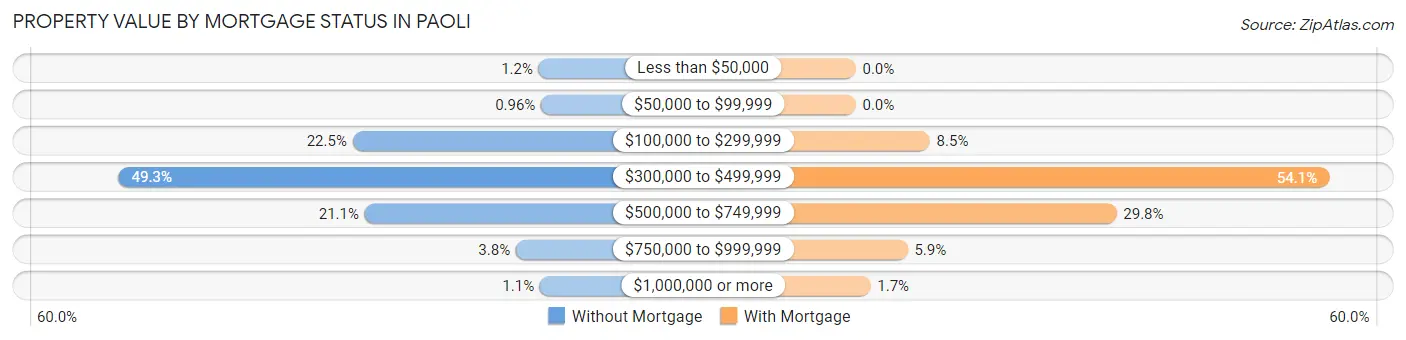
| Property Value | Without Mortgage | With Mortgage |
| Less than $50,000 | 9 (1.2%) | 0 (0.0%) |
| $50,000 to $99,999 | 7 (1.0%) | 0 (0.0%) |
| $100,000 to $299,999 | 164 (22.5%) | 100 (8.5%) |
| $300,000 to $499,999 | 359 (49.2%) | 639 (54.1%) |
| $500,000 to $749,999 | 154 (21.1%) | 352 (29.8%) |
| $750,000 to $999,999 | 28 (3.8%) | 70 (5.9%) |
| $1,000,000 or more | 8 (1.1%) | 20 (1.7%) |
| Total | 729 (100.0%) | 1,181 (100.0%) |
Household Income by Mortgage Status in Paoli
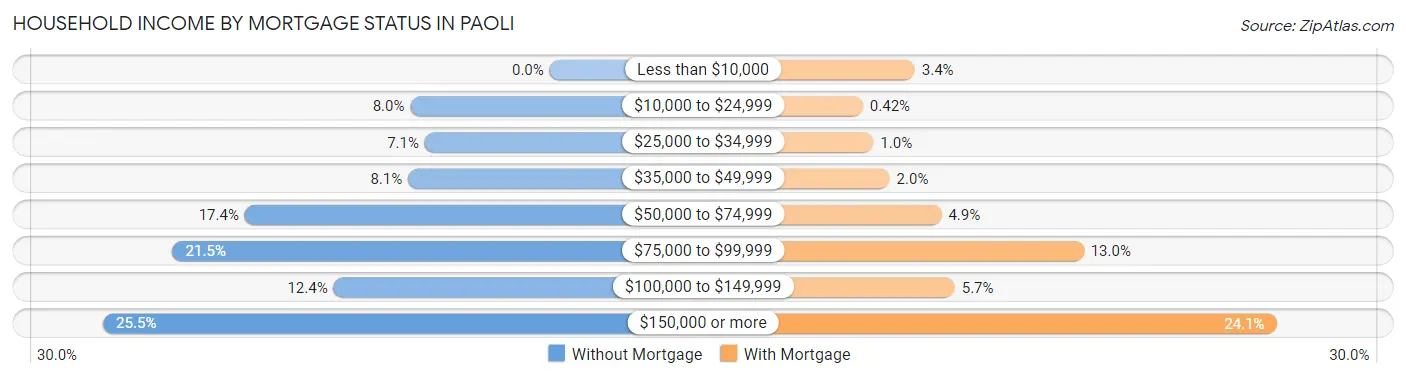
| Household Income | Without Mortgage | With Mortgage |
| Less than $10,000 | 0 (0.0%) | 40 (3.4%) |
| $10,000 to $24,999 | 58 (8.0%) | 5 (0.4%) |
| $25,000 to $34,999 | 52 (7.1%) | 12 (1.0%) |
| $35,000 to $49,999 | 59 (8.1%) | 23 (1.9%) |
| $50,000 to $74,999 | 127 (17.4%) | 58 (4.9%) |
| $75,000 to $99,999 | 157 (21.5%) | 154 (13.0%) |
| $100,000 to $149,999 | 90 (12.3%) | 67 (5.7%) |
| $150,000 or more | 186 (25.5%) | 284 (24.0%) |
| Total | 729 (100.0%) | 1,181 (100.0%) |
Property Value to Household Income Ratio in Paoli
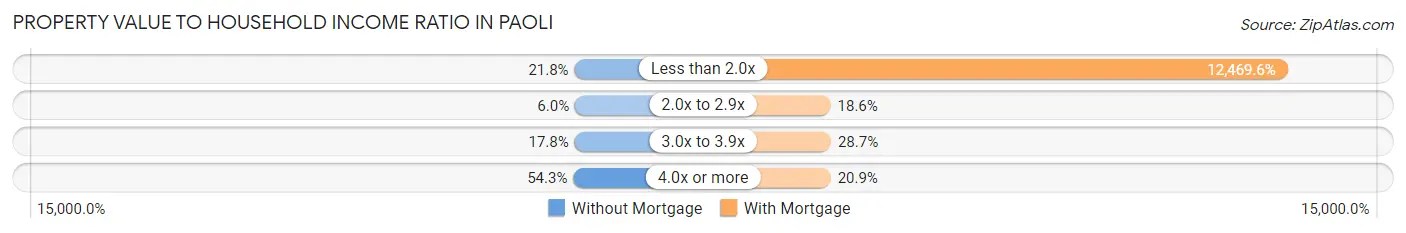
| Value-to-Income Ratio | Without Mortgage | With Mortgage |
| Less than 2.0x | 159 (21.8%) | 147,266 (12,469.6%) |
| 2.0x to 2.9x | 44 (6.0%) | 220 (18.6%) |
| 3.0x to 3.9x | 130 (17.8%) | 339 (28.7%) |
| 4.0x or more | 396 (54.3%) | 247 (20.9%) |
| Total | 729 (100.0%) | 1,181 (100.0%) |
Real Estate Taxes by Mortgage Status in Paoli
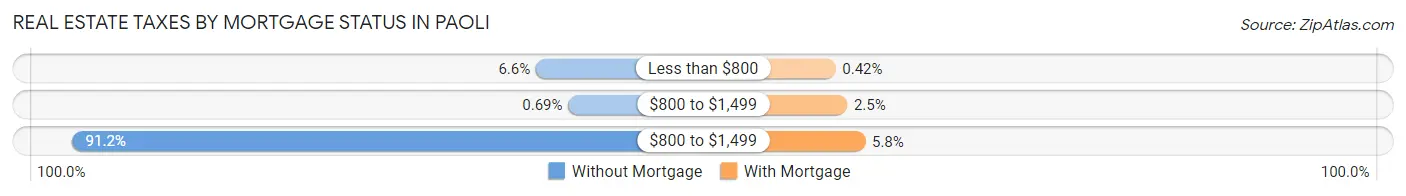
| Property Taxes | Without Mortgage | With Mortgage |
| Less than $800 | 48 (6.6%) | 5 (0.4%) |
| $800 to $1,499 | 5 (0.7%) | 30 (2.5%) |
| $800 to $1,499 | 665 (91.2%) | 69 (5.8%) |
| Total | 729 (100.0%) | 1,181 (100.0%) |
Health & Disability in Paoli
Health Insurance Coverage by Age in Paoli
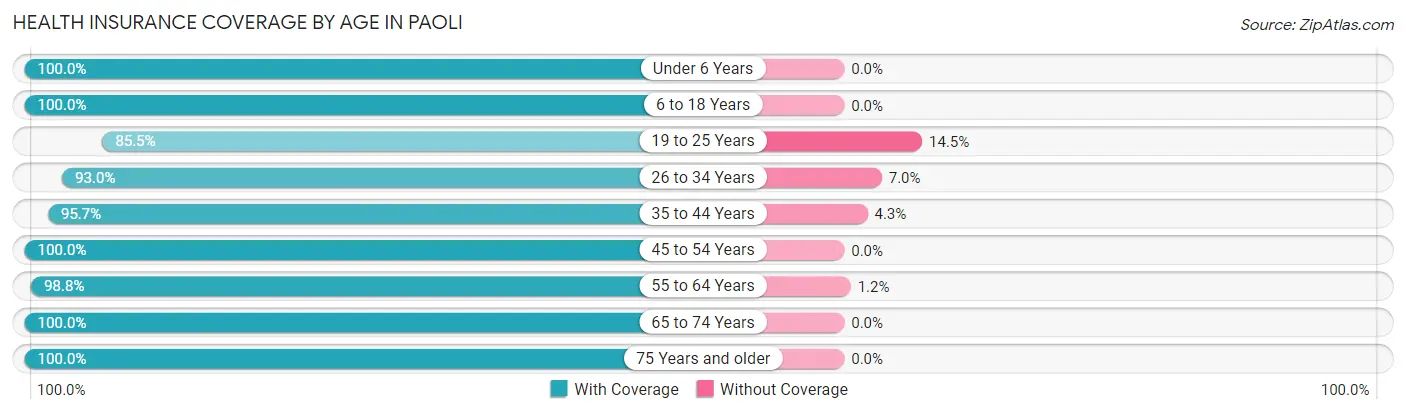
| Age Bracket | With Coverage | Without Coverage |
| Under 6 Years | 510 (100.0%) | 0 (0.0%) |
| 6 to 18 Years | 833 (100.0%) | 0 (0.0%) |
| 19 to 25 Years | 165 (85.5%) | 28 (14.5%) |
| 26 to 34 Years | 812 (93.0%) | 61 (7.0%) |
| 35 to 44 Years | 773 (95.7%) | 35 (4.3%) |
| 45 to 54 Years | 776 (100.0%) | 0 (0.0%) |
| 55 to 64 Years | 658 (98.8%) | 8 (1.2%) |
| 65 to 74 Years | 599 (100.0%) | 0 (0.0%) |
| 75 Years and older | 656 (100.0%) | 0 (0.0%) |
| Total | 5,782 (97.8%) | 132 (2.2%) |
Health Insurance Coverage by Citizenship Status in Paoli
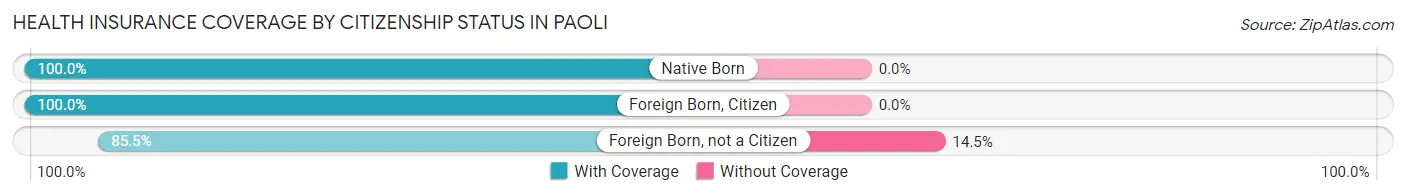
| Citizenship Status | With Coverage | Without Coverage |
| Native Born | 510 (100.0%) | 0 (0.0%) |
| Foreign Born, Citizen | 833 (100.0%) | 0 (0.0%) |
| Foreign Born, not a Citizen | 165 (85.5%) | 28 (14.5%) |
Health Insurance Coverage by Household Income in Paoli
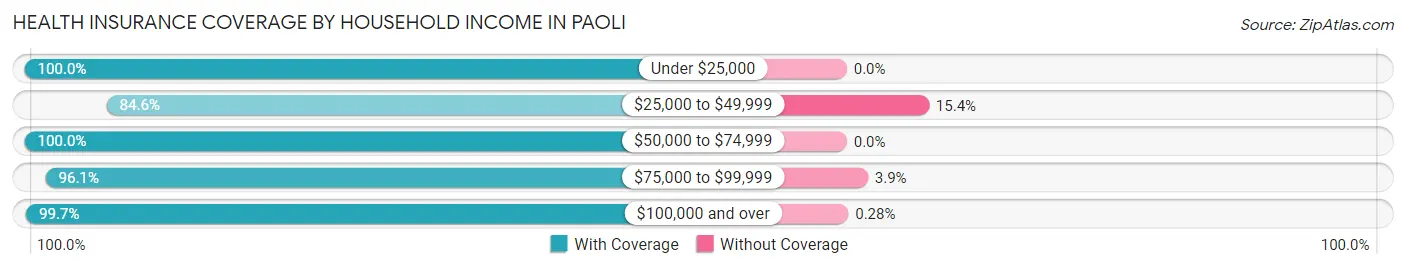
| Household Income | With Coverage | Without Coverage |
| Under $25,000 | 213 (100.0%) | 0 (0.0%) |
| $25,000 to $49,999 | 539 (84.6%) | 98 (15.4%) |
| $50,000 to $74,999 | 700 (100.0%) | 0 (0.0%) |
| $75,000 to $99,999 | 415 (96.1%) | 17 (3.9%) |
| $100,000 and over | 3,884 (99.7%) | 11 (0.3%) |
Public vs Private Health Insurance Coverage by Age in Paoli
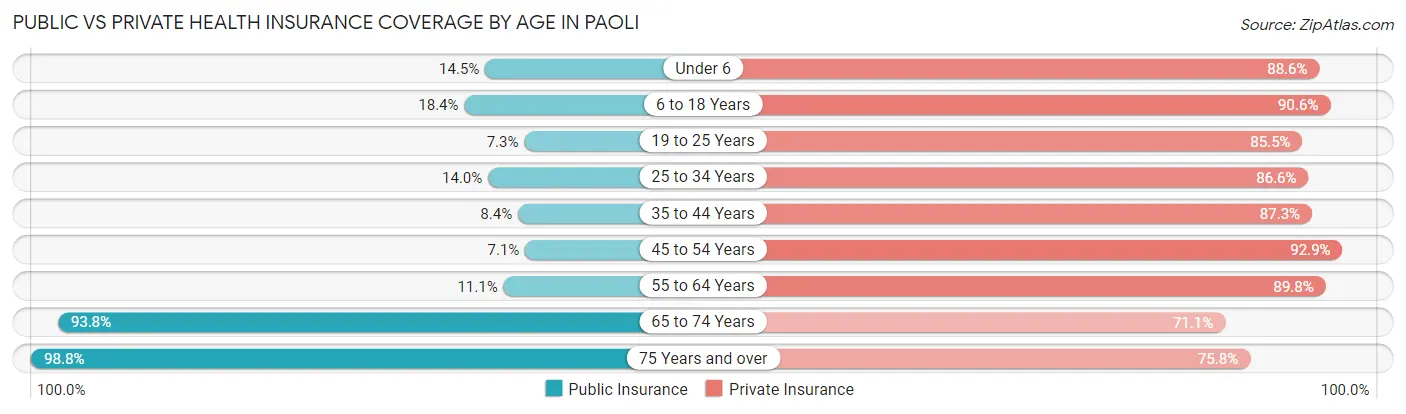
| Age Bracket | Public Insurance | Private Insurance |
| Under 6 | 74 (14.5%) | 452 (88.6%) |
| 6 to 18 Years | 153 (18.4%) | 755 (90.6%) |
| 19 to 25 Years | 14 (7.2%) | 165 (85.5%) |
| 25 to 34 Years | 122 (14.0%) | 756 (86.6%) |
| 35 to 44 Years | 68 (8.4%) | 705 (87.3%) |
| 45 to 54 Years | 55 (7.1%) | 721 (92.9%) |
| 55 to 64 Years | 74 (11.1%) | 598 (89.8%) |
| 65 to 74 Years | 562 (93.8%) | 426 (71.1%) |
| 75 Years and over | 648 (98.8%) | 497 (75.8%) |
| Total | 1,770 (29.9%) | 5,075 (85.8%) |
Disability Status by Sex by Age in Paoli
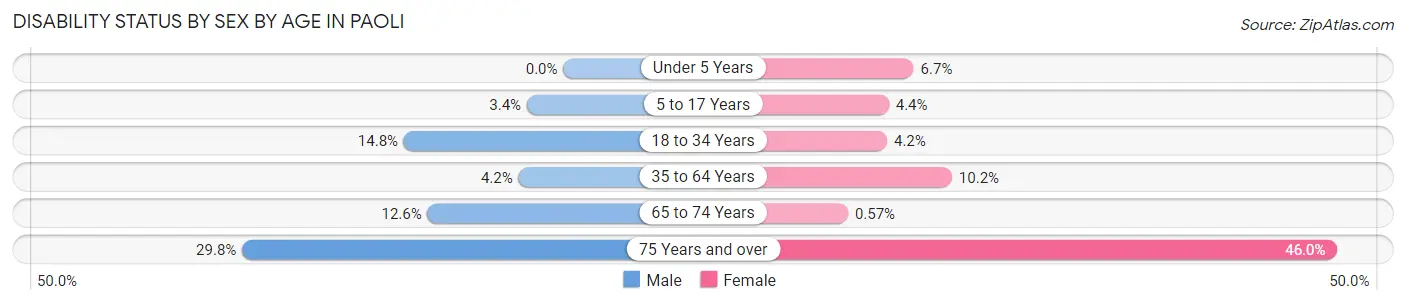
| Age Bracket | Male | Female |
| Under 5 Years | 0 (0.0%) | 12 (6.7%) |
| 5 to 17 Years | 17 (3.4%) | 18 (4.4%) |
| 18 to 34 Years | 86 (14.8%) | 21 (4.2%) |
| 35 to 64 Years | 48 (4.2%) | 112 (10.2%) |
| 65 to 74 Years | 31 (12.6%) | 2 (0.6%) |
| 75 Years and over | 62 (29.8%) | 206 (46.0%) |
Disability Class by Sex by Age in Paoli
Disability Class: Hearing Difficulty
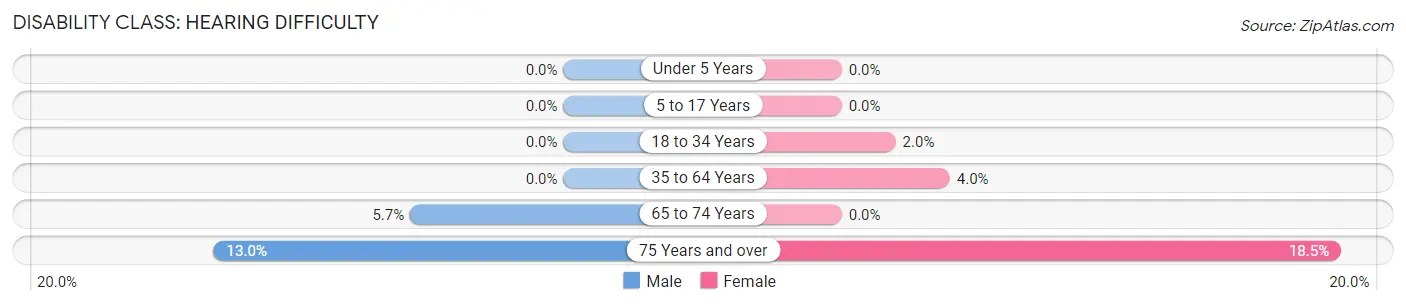
| Age Bracket | Male | Female |
| Under 5 Years | 0 (0.0%) | 0 (0.0%) |
| 5 to 17 Years | 0 (0.0%) | 0 (0.0%) |
| 18 to 34 Years | 0 (0.0%) | 10 (2.0%) |
| 35 to 64 Years | 0 (0.0%) | 44 (4.0%) |
| 65 to 74 Years | 14 (5.7%) | 0 (0.0%) |
| 75 Years and over | 27 (13.0%) | 83 (18.5%) |
Disability Class: Vision Difficulty
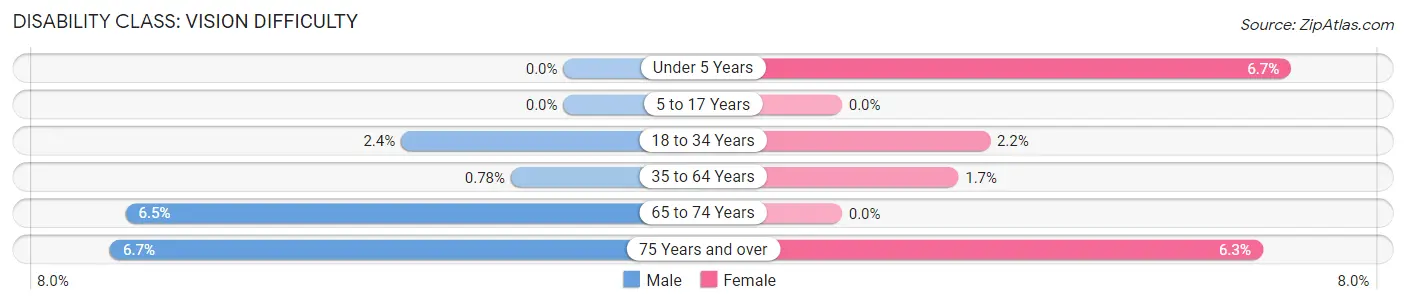
| Age Bracket | Male | Female |
| Under 5 Years | 0 (0.0%) | 12 (6.7%) |
| 5 to 17 Years | 0 (0.0%) | 0 (0.0%) |
| 18 to 34 Years | 14 (2.4%) | 11 (2.2%) |
| 35 to 64 Years | 9 (0.8%) | 19 (1.7%) |
| 65 to 74 Years | 16 (6.5%) | 0 (0.0%) |
| 75 Years and over | 14 (6.7%) | 28 (6.2%) |
Disability Class: Cognitive Difficulty
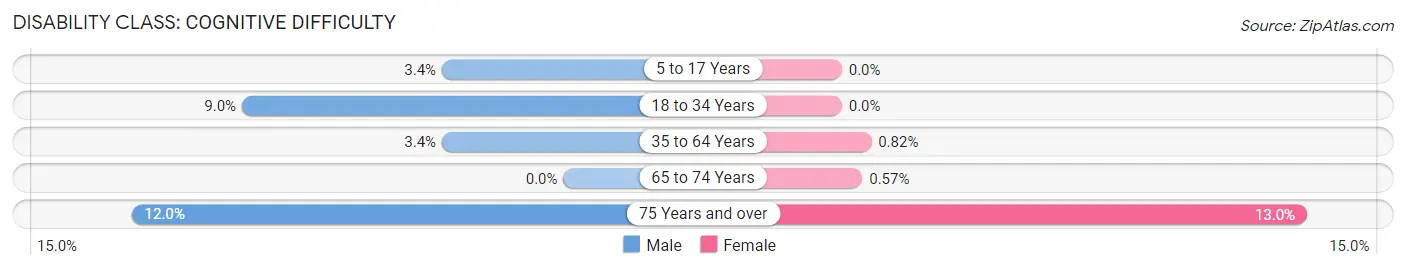
| Age Bracket | Male | Female |
| 5 to 17 Years | 17 (3.4%) | 0 (0.0%) |
| 18 to 34 Years | 52 (8.9%) | 0 (0.0%) |
| 35 to 64 Years | 39 (3.4%) | 9 (0.8%) |
| 65 to 74 Years | 0 (0.0%) | 2 (0.6%) |
| 75 Years and over | 25 (12.0%) | 58 (13.0%) |
Disability Class: Ambulatory Difficulty
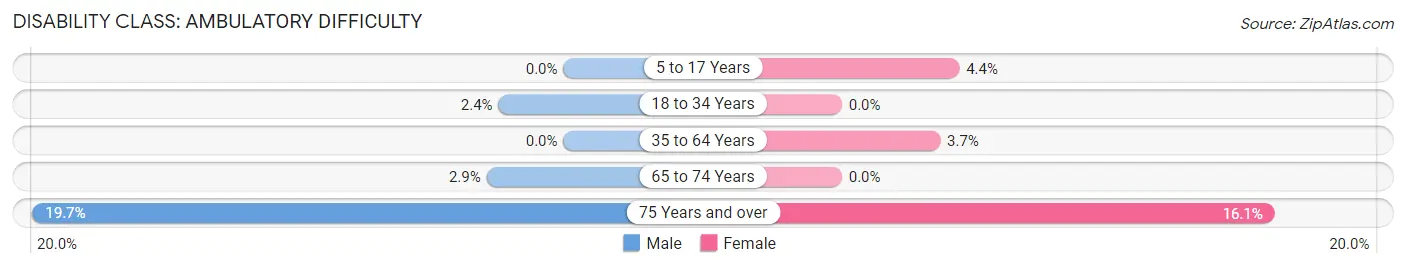
| Age Bracket | Male | Female |
| 5 to 17 Years | 0 (0.0%) | 18 (4.4%) |
| 18 to 34 Years | 14 (2.4%) | 0 (0.0%) |
| 35 to 64 Years | 0 (0.0%) | 40 (3.6%) |
| 65 to 74 Years | 7 (2.9%) | 0 (0.0%) |
| 75 Years and over | 41 (19.7%) | 72 (16.1%) |
Disability Class: Self-Care Difficulty
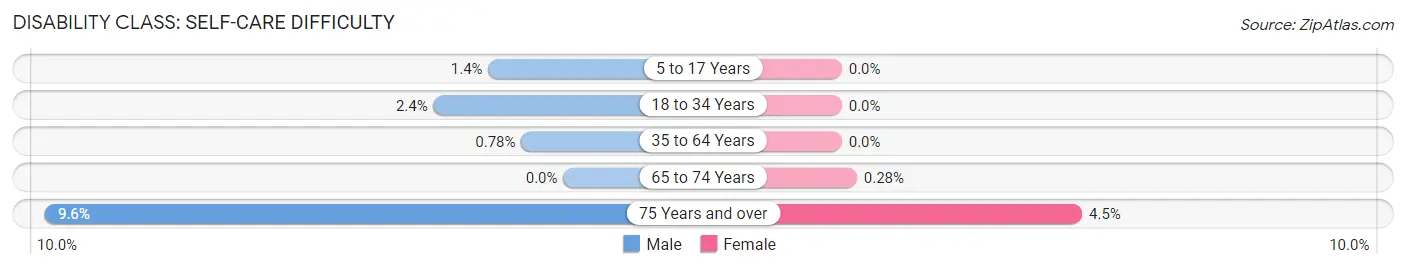
| Age Bracket | Male | Female |
| 5 to 17 Years | 7 (1.4%) | 0 (0.0%) |
| 18 to 34 Years | 14 (2.4%) | 0 (0.0%) |
| 35 to 64 Years | 9 (0.8%) | 0 (0.0%) |
| 65 to 74 Years | 0 (0.0%) | 1 (0.3%) |
| 75 Years and over | 20 (9.6%) | 20 (4.5%) |
Technology Access in Paoli
Computing Device Access in Paoli
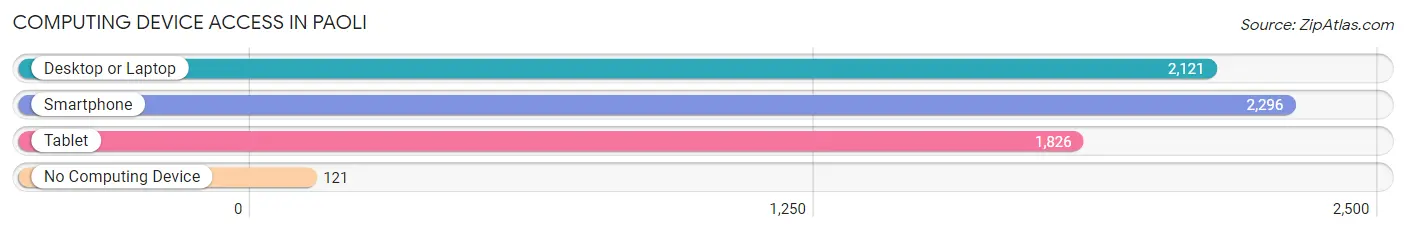
| Device Type | # Households | % Households |
| Desktop or Laptop | 2,121 | 84.3% |
| Smartphone | 2,296 | 91.3% |
| Tablet | 1,826 | 72.6% |
| No Computing Device | 121 | 4.8% |
| Total | 2,515 | 100.0% |
Internet Access in Paoli
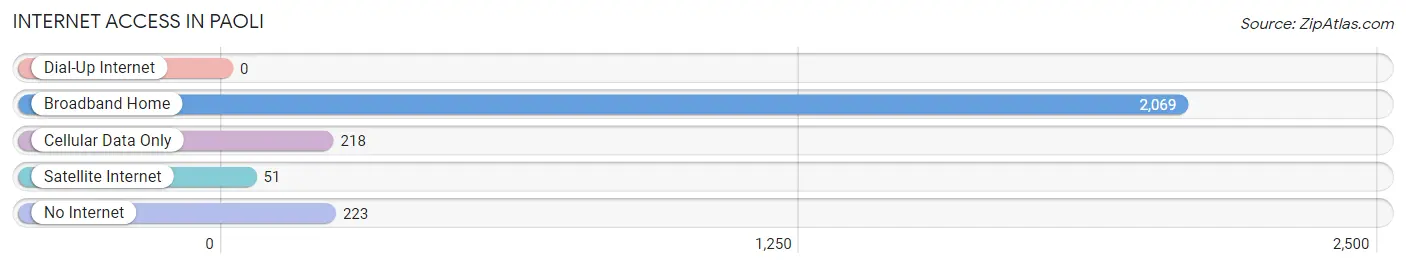
| Internet Type | # Households | % Households |
| Dial-Up Internet | 0 | 0.0% |
| Broadband Home | 2,069 | 82.3% |
| Cellular Data Only | 218 | 8.7% |
| Satellite Internet | 51 | 2.0% |
| No Internet | 223 | 8.9% |
| Total | 2,515 | 100.0% |
Paoli Summary
Paoli, Pennsylvania is a small town located in Chester County, about 25 miles west of Philadelphia. It is part of the Greater Philadelphia metropolitan area and is home to about 5,000 people. The town is known for its historic buildings, quaint downtown, and its proximity to the Main Line.
History
Paoli was founded in 1769 by Welsh Quakers who had migrated to the area from Pennsylvania. The town was named after General Pasquale Paoli, a Corsican patriot who had fought against the French. The town was originally a farming community, but it soon developed into a small industrial center. The first industry in the area was a paper mill, which was built in 1790. The paper mill was followed by a grist mill, a saw mill, and a tannery.
In the 19th century, Paoli became a popular summer resort for wealthy Philadelphians. The town was known for its beautiful scenery and its proximity to the Main Line. The town also had several hotels and inns, which attracted visitors from all over the country.
Geography
Paoli is located in southeastern Pennsylvania, about 25 miles west of Philadelphia. It is part of the Greater Philadelphia metropolitan area. The town is situated in the rolling hills of Chester County, and is surrounded by farmland and woodlands. The town is bisected by the Paoli Pike, a major thoroughfare that connects the town to the Main Line.
Economy
Paoli’s economy is largely based on tourism and retail. The town is home to several small businesses, including restaurants, shops, and galleries. The town also has several historic sites, including the Paoli Battlefield, which is a popular tourist attraction.
The town is also home to several large employers, including the Paoli Hospital, the Paoli Shopping Center, and the Paoli Business Park. The Paoli Business Park is home to several corporate offices, including those of the Vanguard Group and the Vanguard Charitable Endowment Program.
Demographics
As of the 2010 census, the population of Paoli was 5,575. The racial makeup of the town was 87.3% White, 8.2% African American, 0.3% Native American, 1.2% Asian, and 2.9% from other races. The median household income was $68,958, and the median family income was $77,958.
Paoli is a diverse community, with a variety of religious and cultural backgrounds. The town is home to several churches, including the Paoli Presbyterian Church, the Paoli United Methodist Church, and the Paoli Baptist Church. The town also has a large Jewish community, with several synagogues and Jewish organizations.
Conclusion
Paoli, Pennsylvania is a small town located in Chester County, about 25 miles west of Philadelphia. It is part of the Greater Philadelphia metropolitan area and is home to about 5,000 people. The town is known for its historic buildings, quaint downtown, and its proximity to the Main Line. The town’s economy is largely based on tourism and retail, and it is home to several large employers. The population of Paoli is diverse, with a variety of religious and cultural backgrounds.
Common Questions
What is the Total Population of Paoli?
Total Population of Paoli is 6,121.
What is the Total Male Population of Paoli?
Total Male Population of Paoli is 2,994.
What is the Total Female Population of Paoli?
Total Female Population of Paoli is 3,127.
What is the Ratio of Males per 100 Females in Paoli?
There are 95.75 Males per 100 Females in Paoli.
What is the Ratio of Females per 100 Males in Paoli?
There are 104.44 Females per 100 Males in Paoli.
What is the Median Population Age in Paoli?
Median Population Age in Paoli is 42.9 Years.
What is the Average Family Size in Paoli
Average Family Size in Paoli is 2.9 People.
What is the Average Household Size in Paoli
Average Household Size in Paoli is 2.3 People.
What is Per Capita Income in Paoli?
Per Capita income in Paoli is $61,959.
What is the Median Family Income in Paoli?
Median Family Income in Paoli is $145,625.
What is the Median Household income in Paoli?
Median Household Income in Paoli is $107,793.
What is Income or Wage Gap in Paoli?
Income or Wage Gap in Paoli is 36.4%.
Women in Paoli earn 63.6 cents for every dollar earned by a man.
What is Inequality or Gini Index in Paoli?
Inequality or Gini Index in Paoli is 0.44.
How Large is the Labor Force in Paoli?
There are 3,180 People in the Labor Forcein in Paoli.
What is the Percentage of People in the Labor Force in Paoli?
65.0% of People are in the Labor Force in Paoli.
What is the Unemployment Rate in Paoli?
Unemployment Rate in Paoli is 6.3%.