Carnot Moon, PA
Carnot Moon Map
Carnot Moon Overview
13,345
TOTAL POPULATION
6,340
MALE POPULATION
7,005
FEMALE POPULATION
90.51
MALES / 100 FEMALES
110.49
FEMALES / 100 MALES
33.3
MEDIAN AGE
3.1
AVG FAMILY SIZE
2.4
AVG HOUSEHOLD SIZE
$46,486
PER CAPITA INCOME
$132,683
AVG FAMILY INCOME
$89,573
AVG HOUSEHOLD INCOME
38.6%
WAGE / INCOME GAP [ % ]
61.4¢/ $1
WAGE / INCOME GAP [ $ ]
0.42
INEQUALITY / GINI INDEX
7,910
LABOR FORCE [ PEOPLE ]
68.2%
PERCENT IN LABOR FORCE
5.9%
UNEMPLOYMENT RATE
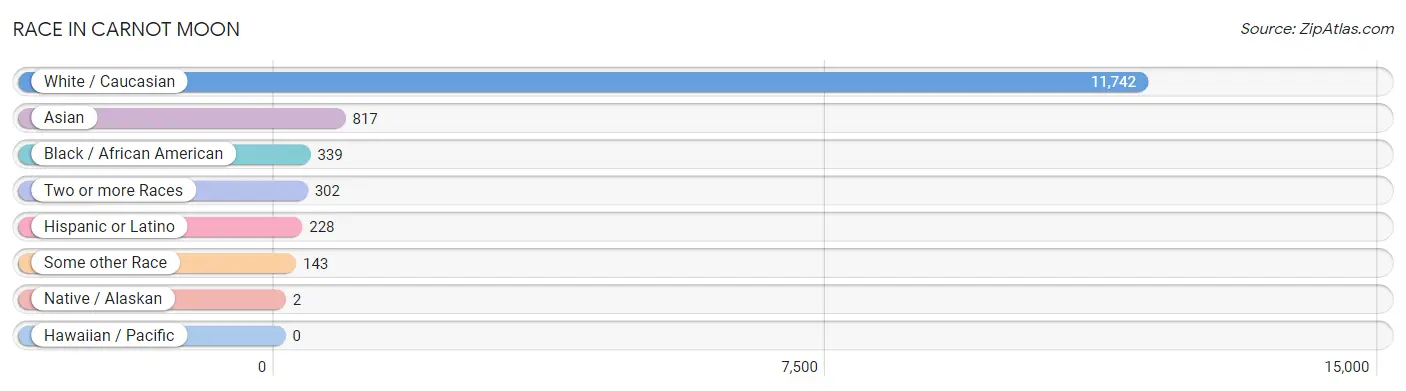
Race in Carnot Moon
The most populous races in Carnot Moon are White / Caucasian (11,742 | 88.0%), Asian (817 | 6.1%), and Black / African American (339 | 2.5%).
| Race | # Population | % Population |
| Asian | 817 | 6.1% |
| Black / African American | 339 | 2.5% |
| Hawaiian / Pacific | 0 | 0.0% |
| Hispanic or Latino | 228 | 1.7% |
| Native / Alaskan | 2 | 0.0% |
| White / Caucasian | 11,742 | 88.0% |
| Two or more Races | 302 | 2.3% |
| Some other Race | 143 | 1.1% |
| Total | 13,345 | 100.0% |
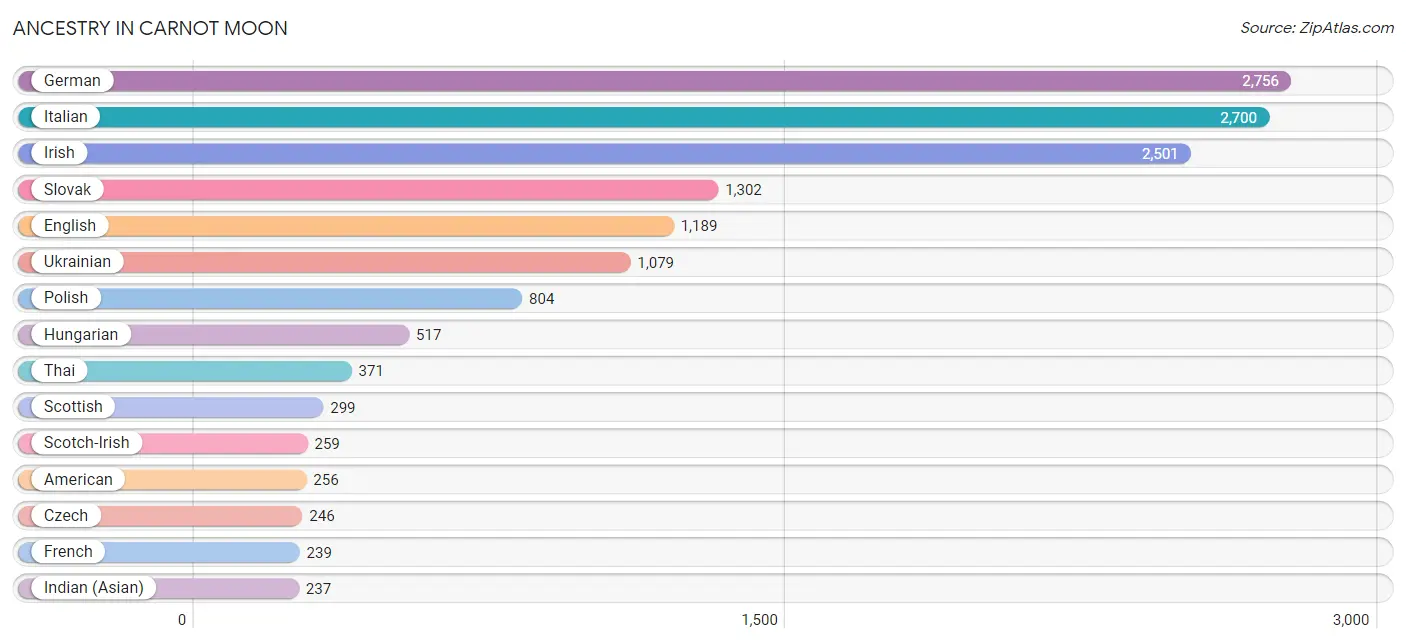
Ancestry in Carnot Moon
The most populous ancestries reported in Carnot Moon are German (2,756 | 20.6%), Italian (2,700 | 20.2%), Irish (2,501 | 18.7%), Slovak (1,302 | 9.8%), and English (1,189 | 8.9%), together accounting for 78.3% of all Carnot Moon residents.
| Ancestry | # Population | % Population |
| African | 22 | 0.2% |
| American | 256 | 1.9% |
| Arab | 111 | 0.8% |
| Argentinean | 4 | 0.0% |
| Austrian | 18 | 0.1% |
| Belgian | 72 | 0.5% |
| Bhutanese | 6 | 0.0% |
| Brazilian | 19 | 0.1% |
| British | 46 | 0.3% |
| Burmese | 68 | 0.5% |
| Canadian | 14 | 0.1% |
| Carpatho Rusyn | 16 | 0.1% |
| Central American | 45 | 0.3% |
| Cherokee | 46 | 0.3% |
| Colombian | 28 | 0.2% |
| Croatian | 72 | 0.5% |
| Czech | 246 | 1.8% |
| Czechoslovakian | 109 | 0.8% |
| Dominican | 13 | 0.1% |
| Dutch | 43 | 0.3% |
| Eastern European | 68 | 0.5% |
| Ecuadorian | 9 | 0.1% |
| English | 1,189 | 8.9% |
| Ethiopian | 3 | 0.0% |
| European | 159 | 1.2% |
| Filipino | 9 | 0.1% |
| French | 239 | 1.8% |
| French Canadian | 41 | 0.3% |
| German | 2,756 | 20.6% |
| Greek | 57 | 0.4% |
| Guyanese | 8 | 0.1% |
| Haitian | 21 | 0.2% |
| Honduran | 4 | 0.0% |
| Hungarian | 517 | 3.9% |
| Indian (Asian) | 237 | 1.8% |
| Iranian | 10 | 0.1% |
| Irish | 2,501 | 18.7% |
| Italian | 2,700 | 20.2% |
| Jamaican | 11 | 0.1% |
| Korean | 9 | 0.1% |
| Lebanese | 23 | 0.2% |
| Lithuanian | 25 | 0.2% |
| Mexican | 65 | 0.5% |
| Northern European | 55 | 0.4% |
| Norwegian | 4 | 0.0% |
| Pakistani | 24 | 0.2% |
| Pennsylvania German | 4 | 0.0% |
| Polish | 804 | 6.0% |
| Portuguese | 11 | 0.1% |
| Puerto Rican | 53 | 0.4% |
| Romanian | 13 | 0.1% |
| Russian | 154 | 1.1% |
| Salvadoran | 41 | 0.3% |
| Scotch-Irish | 259 | 1.9% |
| Scottish | 299 | 2.2% |
| Serbian | 104 | 0.8% |
| Slavic | 12 | 0.1% |
| Slovak | 1,302 | 9.8% |
| Slovene | 62 | 0.5% |
| South American | 41 | 0.3% |
| Sri Lankan | 66 | 0.5% |
| Subsaharan African | 25 | 0.2% |
| Swedish | 28 | 0.2% |
| Swiss | 11 | 0.1% |
| Syrian | 5 | 0.0% |
| Thai | 371 | 2.8% |
| Ukrainian | 1,079 | 8.1% |
| Welsh | 117 | 0.9% |
| Yugoslavian | 10 | 0.1% | View All 69 Rows |
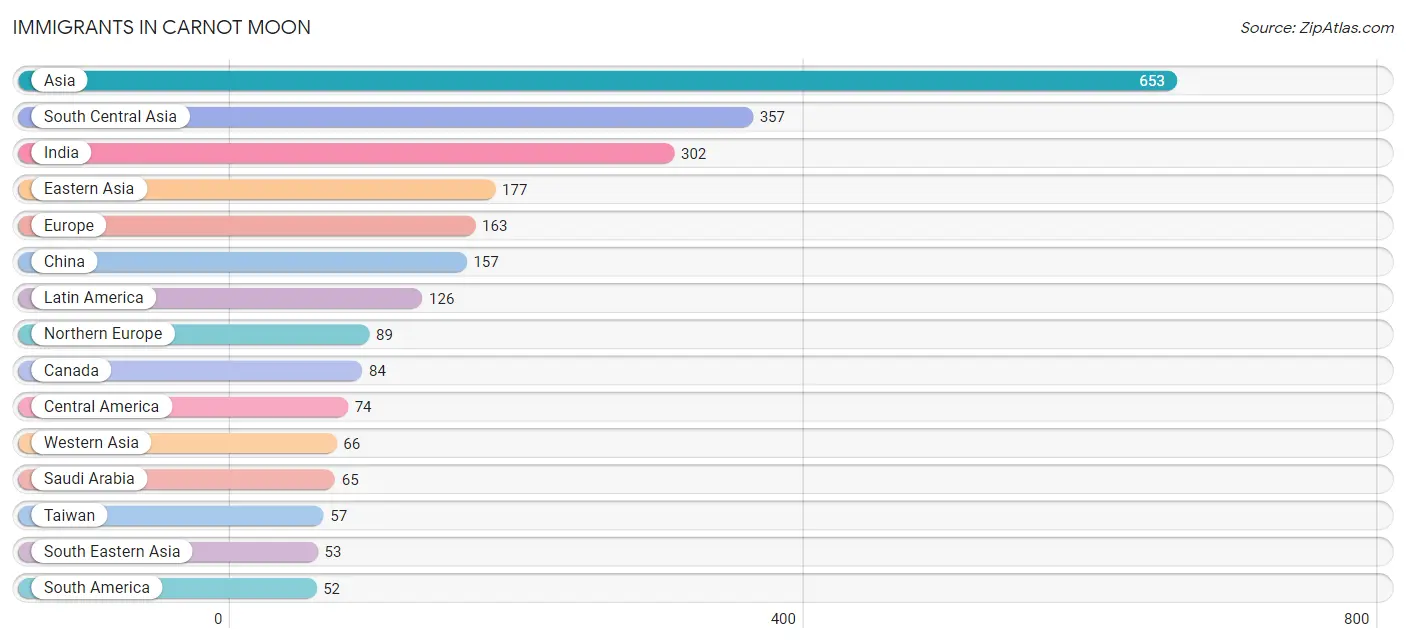
Immigrants in Carnot Moon
The most numerous immigrant groups reported in Carnot Moon came from Asia (653 | 4.9%), South Central Asia (357 | 2.7%), India (302 | 2.3%), Eastern Asia (177 | 1.3%), and Europe (163 | 1.2%), together accounting for 12.4% of all Carnot Moon residents.
| Immigration Origin | # Population | % Population |
| Africa | 20 | 0.2% |
| Argentina | 4 | 0.0% |
| Asia | 653 | 4.9% |
| Belgium | 27 | 0.2% |
| Brazil | 11 | 0.1% |
| Canada | 84 | 0.6% |
| Central America | 74 | 0.5% |
| China | 157 | 1.2% |
| Colombia | 12 | 0.1% |
| Eastern Asia | 177 | 1.3% |
| Eastern Europe | 13 | 0.1% |
| Ecuador | 8 | 0.1% |
| El Salvador | 41 | 0.3% |
| England | 50 | 0.4% |
| Europe | 163 | 1.2% |
| Ghana | 4 | 0.0% |
| Guyana | 17 | 0.1% |
| Hong Kong | 20 | 0.2% |
| India | 302 | 2.3% |
| Iran | 9 | 0.1% |
| Ireland | 25 | 0.2% |
| Israel | 1 | 0.0% |
| Italy | 34 | 0.3% |
| Korea | 20 | 0.2% |
| Latin America | 126 | 0.9% |
| Lithuania | 13 | 0.1% |
| Mexico | 33 | 0.3% |
| Northern Europe | 89 | 0.7% |
| Oceania | 15 | 0.1% |
| Pakistan | 46 | 0.3% |
| Philippines | 23 | 0.2% |
| Saudi Arabia | 65 | 0.5% |
| South America | 52 | 0.4% |
| South Central Asia | 357 | 2.7% |
| South Eastern Asia | 53 | 0.4% |
| Southern Europe | 34 | 0.3% |
| Taiwan | 57 | 0.4% |
| Thailand | 30 | 0.2% |
| Western Africa | 20 | 0.2% |
| Western Asia | 66 | 0.5% |
| Western Europe | 27 | 0.2% | View All 41 Rows |
Sex and Age in Carnot Moon
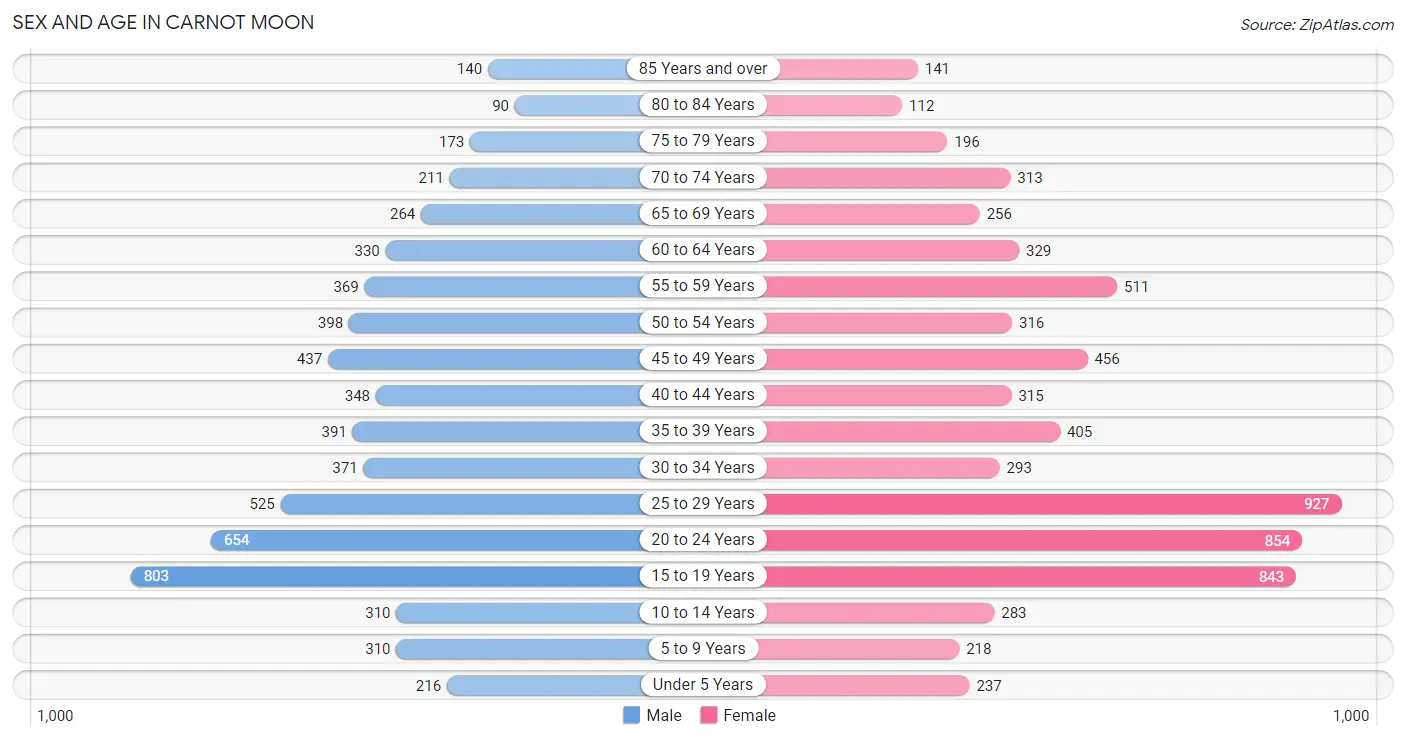
Sex and Age in Carnot Moon
The most populous age groups in Carnot Moon are 15 to 19 Years (803 | 12.7%) for men and 25 to 29 Years (927 | 13.2%) for women.
| Age Bracket | Male | Female |
| Under 5 Years | 216 (3.4%) | 237 (3.4%) |
| 5 to 9 Years | 310 (4.9%) | 218 (3.1%) |
| 10 to 14 Years | 310 (4.9%) | 283 (4.0%) |
| 15 to 19 Years | 803 (12.7%) | 843 (12.0%) |
| 20 to 24 Years | 654 (10.3%) | 854 (12.2%) |
| 25 to 29 Years | 525 (8.3%) | 927 (13.2%) |
| 30 to 34 Years | 371 (5.9%) | 293 (4.2%) |
| 35 to 39 Years | 391 (6.2%) | 405 (5.8%) |
| 40 to 44 Years | 348 (5.5%) | 315 (4.5%) |
| 45 to 49 Years | 437 (6.9%) | 456 (6.5%) |
| 50 to 54 Years | 398 (6.3%) | 316 (4.5%) |
| 55 to 59 Years | 369 (5.8%) | 511 (7.3%) |
| 60 to 64 Years | 330 (5.2%) | 329 (4.7%) |
| 65 to 69 Years | 264 (4.2%) | 256 (3.6%) |
| 70 to 74 Years | 211 (3.3%) | 313 (4.5%) |
| 75 to 79 Years | 173 (2.7%) | 196 (2.8%) |
| 80 to 84 Years | 90 (1.4%) | 112 (1.6%) |
| 85 Years and over | 140 (2.2%) | 141 (2.0%) |
| Total | 6,340 (100.0%) | 7,005 (100.0%) |
Families and Households in Carnot Moon
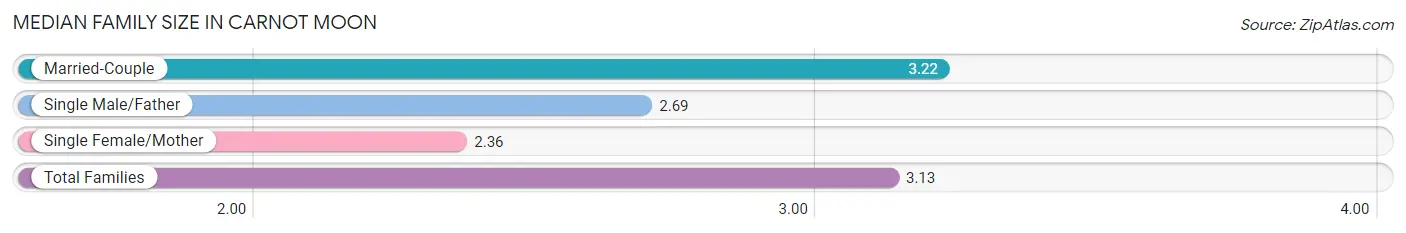
Median Family Size in Carnot Moon
The median family size in Carnot Moon is 3.13 persons per family, with married-couple families (2,476 | 88.2%) accounting for the largest median family size of 3.22 persons per family. On the other hand, single female/mother families (214 | 7.6%) represent the smallest median family size with 2.36 persons per family.
| Family Type | # Families | Family Size |
| Married-Couple | 2,476 (88.2%) | 3.22 |
| Single Male/Father | 118 (4.2%) | 2.69 |
| Single Female/Mother | 214 (7.6%) | 2.36 |
| Total Families | 2,808 (100.0%) | 3.13 |
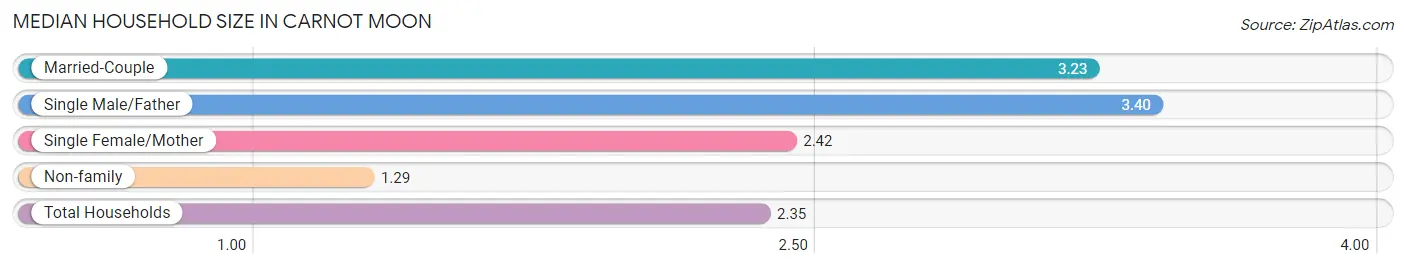
Median Household Size in Carnot Moon
The median household size in Carnot Moon is 2.35 persons per household, with single male/father households (118 | 2.4%) accounting for the largest median household size of 3.4 persons per household. non-family households (2,206 | 44.0%) represent the smallest median household size with 1.29 persons per household.
| Household Type | # Households | Household Size |
| Married-Couple | 2,476 (49.4%) | 3.23 |
| Single Male/Father | 118 (2.4%) | 3.40 |
| Single Female/Mother | 214 (4.3%) | 2.42 |
| Non-family | 2,206 (44.0%) | 1.29 |
| Total Households | 5,014 (100.0%) | 2.35 |
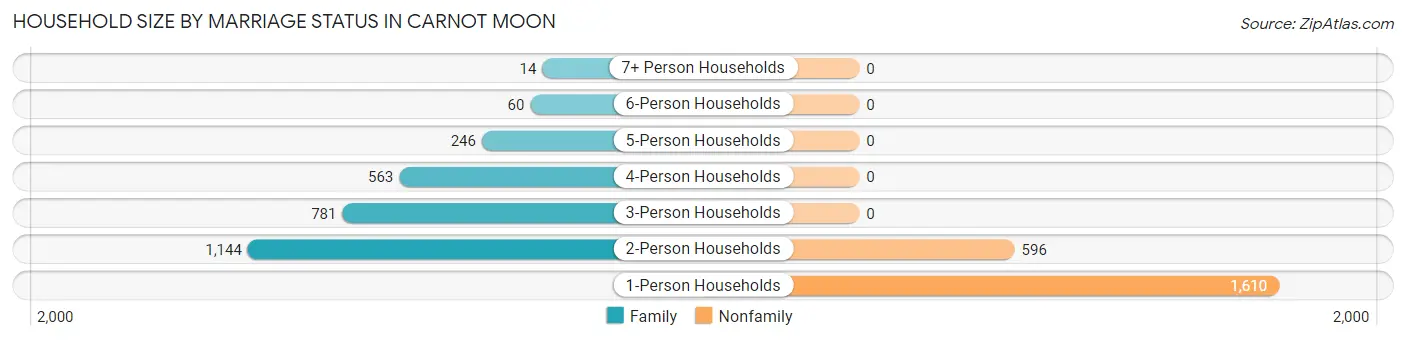
Household Size by Marriage Status in Carnot Moon
Out of a total of 5,014 households in Carnot Moon, 2,808 (56.0%) are family households, while 2,206 (44.0%) are nonfamily households. The most numerous type of family households are 2-person households, comprising 1,144, and the most common type of nonfamily households are 1-person households, comprising 1,610.
| Household Size | Family Households | Nonfamily Households |
| 1-Person Households | - | 1,610 (32.1%) |
| 2-Person Households | 1,144 (22.8%) | 596 (11.9%) |
| 3-Person Households | 781 (15.6%) | 0 (0.0%) |
| 4-Person Households | 563 (11.2%) | 0 (0.0%) |
| 5-Person Households | 246 (4.9%) | 0 (0.0%) |
| 6-Person Households | 60 (1.2%) | 0 (0.0%) |
| 7+ Person Households | 14 (0.3%) | 0 (0.0%) |
| Total | 2,808 (56.0%) | 2,206 (44.0%) |
Female Fertility in Carnot Moon
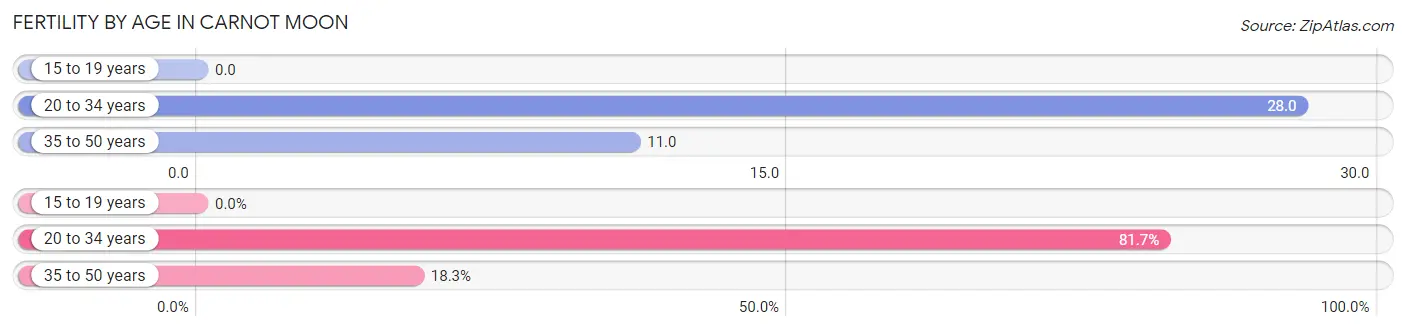
Fertility by Age in Carnot Moon
Average fertility rate in Carnot Moon is 17.0 births per 1,000 women. Women in the age bracket of 20 to 34 years have the highest fertility rate with 28.0 births per 1,000 women. Women in the age bracket of 20 to 34 years acount for 81.7% of all women with births.
| Age Bracket | Women with Births | Births / 1,000 Women |
| 15 to 19 years | 0 (0.0%) | 0.0 |
| 20 to 34 years | 58 (81.7%) | 28.0 |
| 35 to 50 years | 13 (18.3%) | 11.0 |
| Total | 71 (100.0%) | 17.0 |
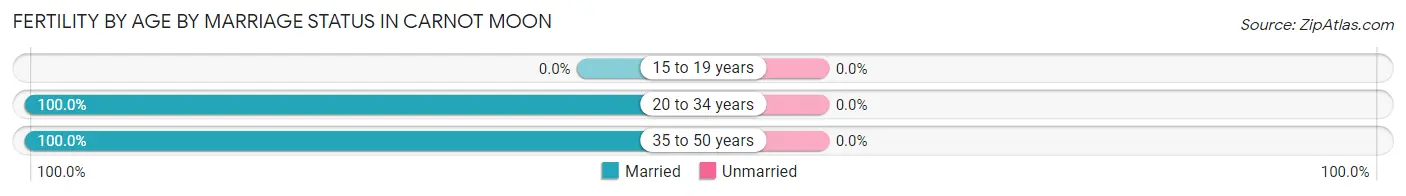
Fertility by Age by Marriage Status in Carnot Moon
| Age Bracket | Married | Unmarried |
| 15 to 19 years | 0 (0.0%) | 0 (0.0%) |
| 20 to 34 years | 58 (100.0%) | 0 (0.0%) |
| 35 to 50 years | 13 (100.0%) | 0 (0.0%) |
| Total | 71 (100.0%) | 0 (0.0%) |
Fertility by Education in Carnot Moon
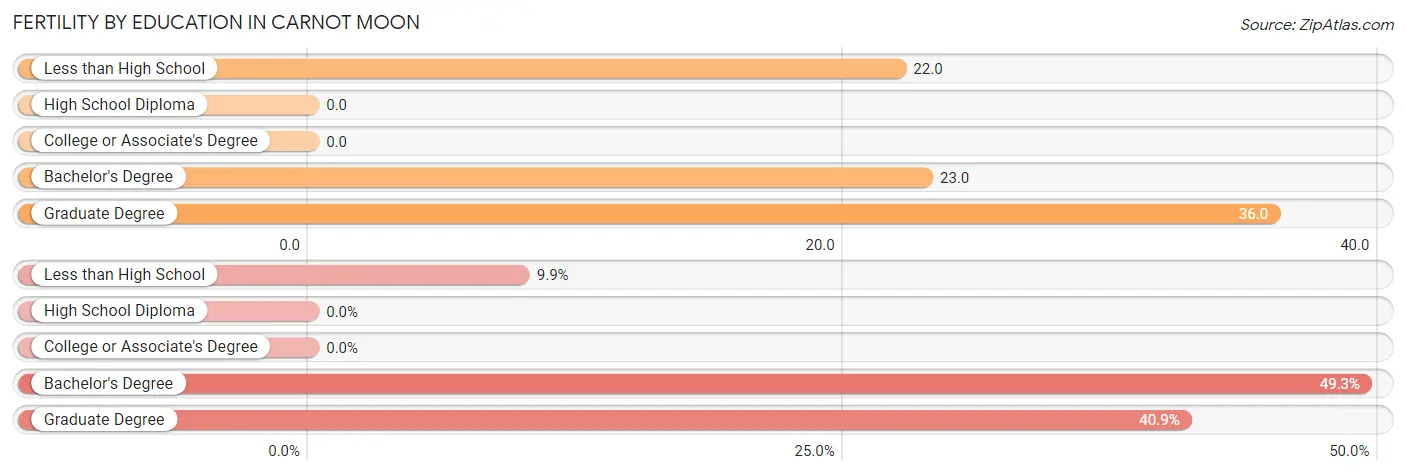
| Educational Attainment | Women with Births | Births / 1,000 Women |
| Less than High School | 7 (9.9%) | 22.0 |
| High School Diploma | 0 (0.0%) | 0.0 |
| College or Associate's Degree | 0 (0.0%) | 0.0 |
| Bachelor's Degree | 35 (49.3%) | 23.0 |
| Graduate Degree | 29 (40.8%) | 36.0 |
| Total | 71 (100.0%) | 17.0 |
Fertility by Education by Marriage Status in Carnot Moon
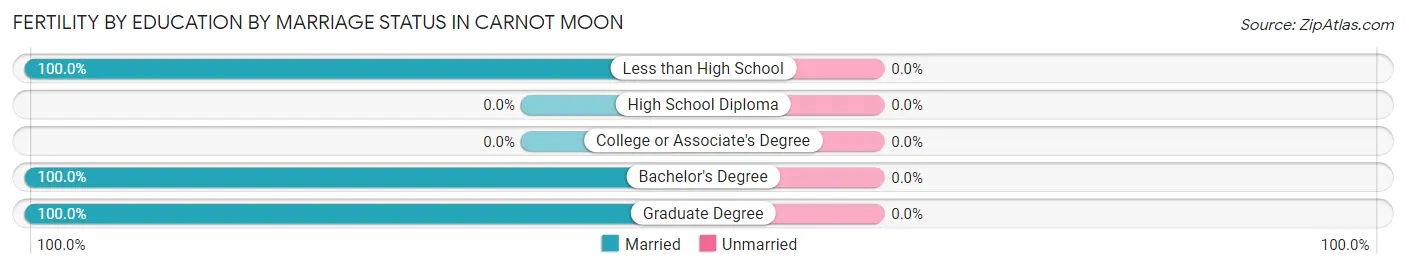
| Educational Attainment | Married | Unmarried |
| Less than High School | 7 (100.0%) | 0 (0.0%) |
| High School Diploma | 0 (0.0%) | 0 (0.0%) |
| College or Associate's Degree | 0 (0.0%) | 0 (0.0%) |
| Bachelor's Degree | 35 (100.0%) | 0 (0.0%) |
| Graduate Degree | 29 (100.0%) | 0 (0.0%) |
| Total | 71 (100.0%) | 0 (0.0%) |
Income in Carnot Moon
Income Overview in Carnot Moon
Per Capita Income in Carnot Moon is $46,486, while median incomes of families and households are $132,683 and $89,573 respectively.
| Characteristic | Number | Measure |
| Per Capita Income | 13,345 | $46,486 |
| Median Family Income | 2,808 | $132,683 |
| Mean Family Income | 2,808 | $154,132 |
| Median Household Income | 5,014 | $89,573 |
| Mean Household Income | 5,014 | $118,528 |
| Income Deficit | 2,808 | $0 |
| Wage / Income Gap (%) | 13,345 | 38.61% |
| Wage / Income Gap ($) | 13,345 | 61.39¢ per $1 |
| Gini / Inequality Index | 13,345 | 0.42 |
Earnings by Sex in Carnot Moon
Average Earnings in Carnot Moon are $40,016, $57,364 for men and $35,216 for women, a difference of 38.6%.
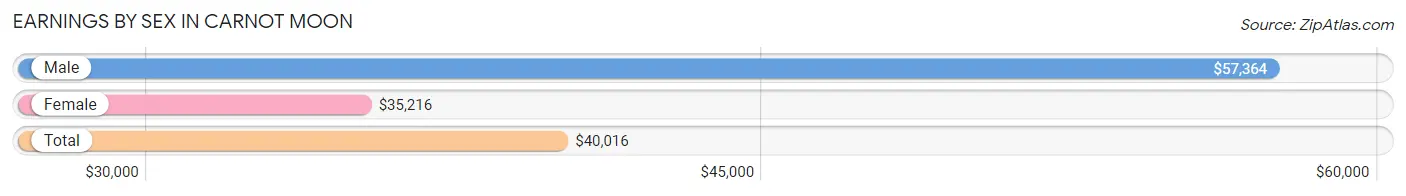
| Sex | Number | Average Earnings |
| Male | 4,086 (45.8%) | $57,364 |
| Female | 4,839 (54.2%) | $35,216 |
| Total | 8,925 (100.0%) | $40,016 |
Earnings by Sex by Income Bracket in Carnot Moon
The most common earnings brackets in Carnot Moon are $100,000+ for men (942 | 23.1%) and $35,000 to $39,999 for women (574 | 11.9%).
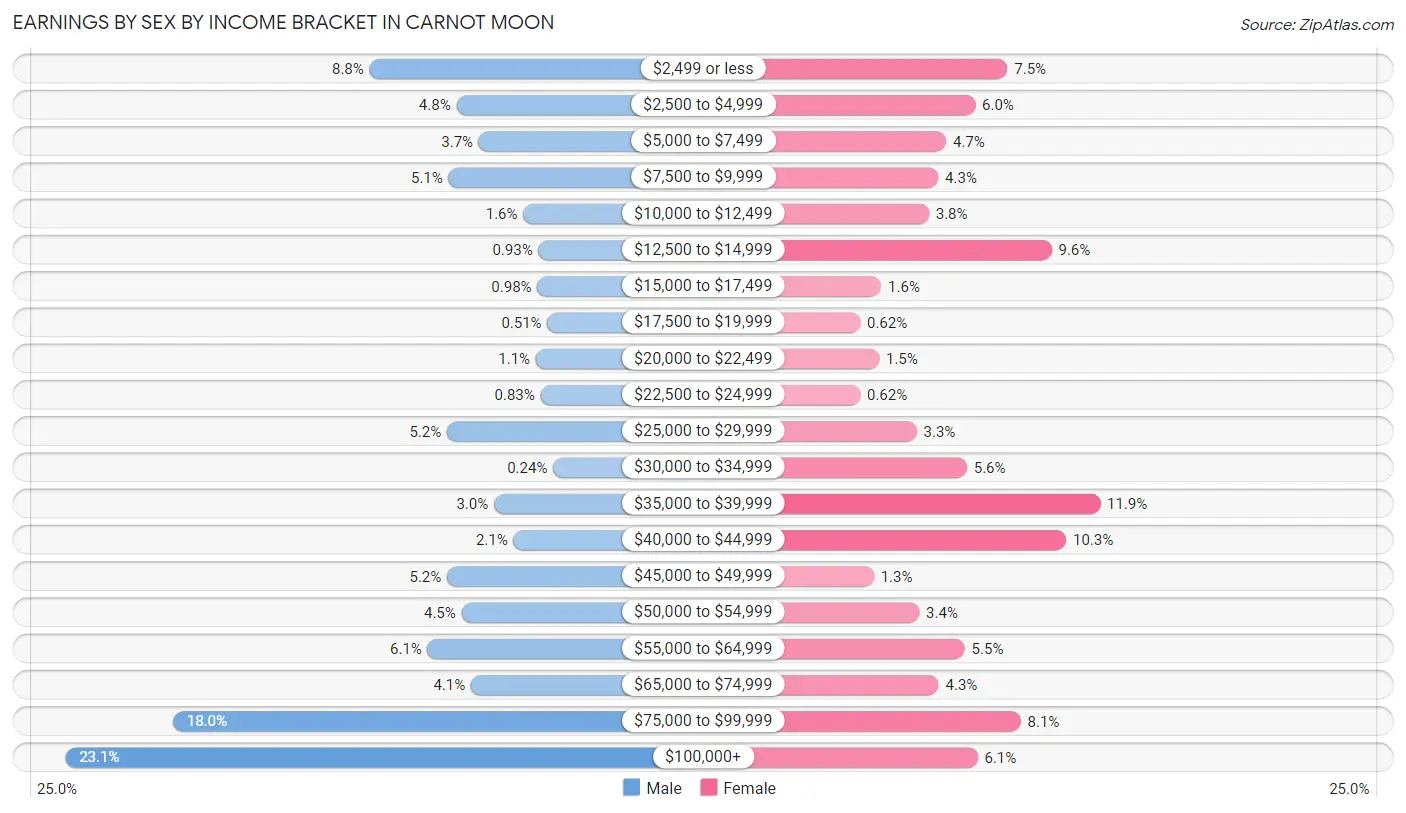
| Income | Male | Female |
| $2,499 or less | 361 (8.8%) | 364 (7.5%) |
| $2,500 to $4,999 | 195 (4.8%) | 291 (6.0%) |
| $5,000 to $7,499 | 152 (3.7%) | 225 (4.6%) |
| $7,500 to $9,999 | 210 (5.1%) | 207 (4.3%) |
| $10,000 to $12,499 | 67 (1.6%) | 186 (3.8%) |
| $12,500 to $14,999 | 38 (0.9%) | 464 (9.6%) |
| $15,000 to $17,499 | 40 (1.0%) | 78 (1.6%) |
| $17,500 to $19,999 | 21 (0.5%) | 30 (0.6%) |
| $20,000 to $22,499 | 43 (1.1%) | 73 (1.5%) |
| $22,500 to $24,999 | 34 (0.8%) | 30 (0.6%) |
| $25,000 to $29,999 | 213 (5.2%) | 158 (3.3%) |
| $30,000 to $34,999 | 10 (0.2%) | 272 (5.6%) |
| $35,000 to $39,999 | 123 (3.0%) | 574 (11.9%) |
| $40,000 to $44,999 | 86 (2.1%) | 497 (10.3%) |
| $45,000 to $49,999 | 213 (5.2%) | 61 (1.3%) |
| $50,000 to $54,999 | 185 (4.5%) | 164 (3.4%) |
| $55,000 to $64,999 | 250 (6.1%) | 267 (5.5%) |
| $65,000 to $74,999 | 167 (4.1%) | 208 (4.3%) |
| $75,000 to $99,999 | 736 (18.0%) | 394 (8.1%) |
| $100,000+ | 942 (23.1%) | 296 (6.1%) |
| Total | 4,086 (100.0%) | 4,839 (100.0%) |
Earnings by Sex by Educational Attainment in Carnot Moon
Average earnings in Carnot Moon are $82,262 for men and $40,167 for women, a difference of 51.2%. Men with an educational attainment of bachelor's degree enjoy the highest average annual earnings of $97,701, while those with less than high school education earn the least with $53,872. Women with an educational attainment of graduate degree earn the most with the average annual earnings of $42,181, while those with college or associate's degree education have the smallest earnings of $36,211.
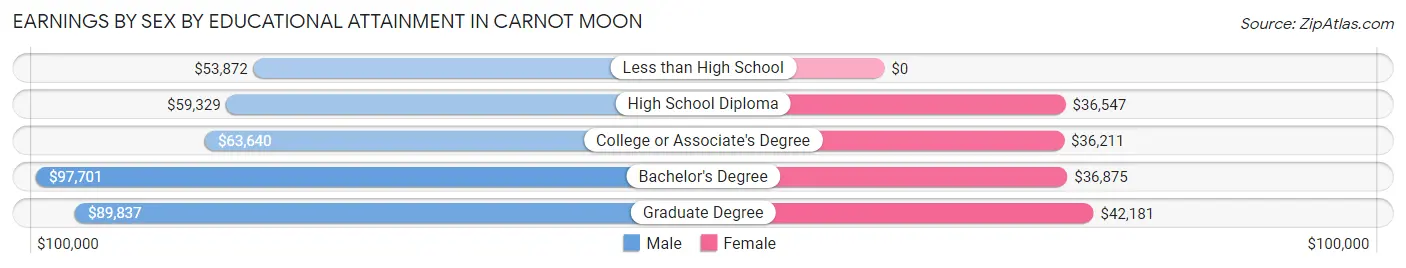
| Educational Attainment | Male Income | Female Income |
| Less than High School | $53,872 | $0 |
| High School Diploma | $59,329 | $36,547 |
| College or Associate's Degree | $63,640 | $36,211 |
| Bachelor's Degree | $97,701 | $36,875 |
| Graduate Degree | $89,837 | $42,181 |
| Total | $82,262 | $40,167 |
Family Income in Carnot Moon
Family Income Brackets in Carnot Moon
According to the Carnot Moon family income data, there are 696 families falling into the $100,000 to $149,999 income range, which is the most common income bracket and makes up 24.8% of all families. Conversely, the $10,000 to $14,999 income bracket is the least frequent group with only 8 families (0.3%) belonging to this category.
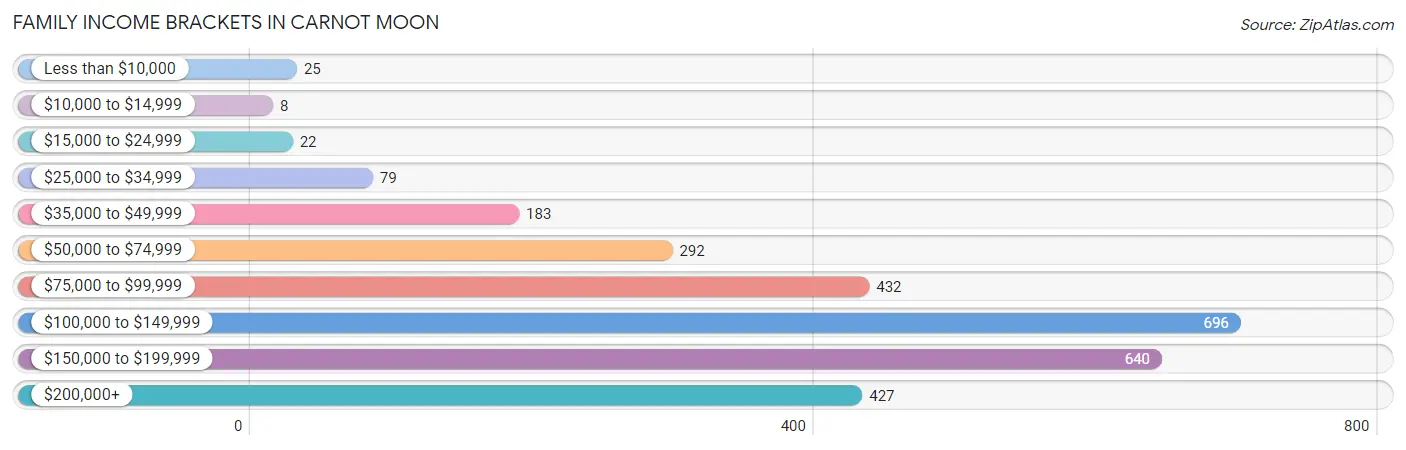
| Income Bracket | # Families | % Families |
| Less than $10,000 | 25 | 0.9% |
| $10,000 to $14,999 | 8 | 0.3% |
| $15,000 to $24,999 | 22 | 0.8% |
| $25,000 to $34,999 | 79 | 2.8% |
| $35,000 to $49,999 | 183 | 6.5% |
| $50,000 to $74,999 | 292 | 10.4% |
| $75,000 to $99,999 | 432 | 15.4% |
| $100,000 to $149,999 | 696 | 24.8% |
| $150,000 to $199,999 | 640 | 22.8% |
| $200,000+ | 427 | 15.2% |
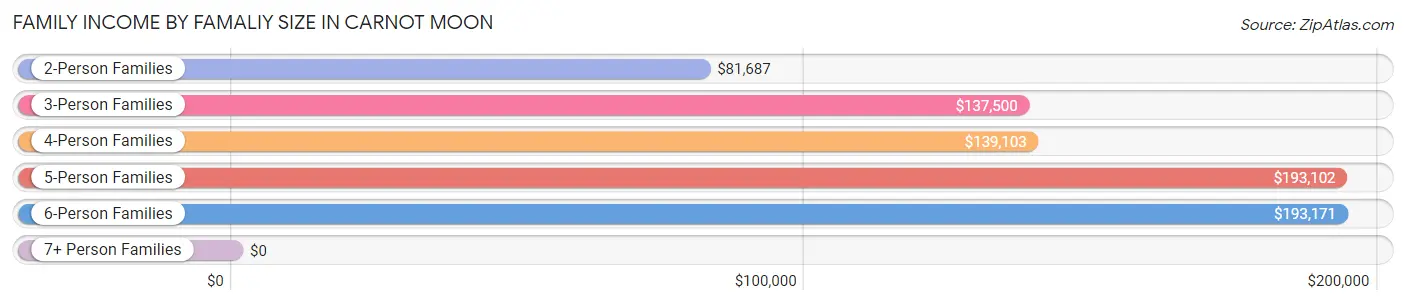
Family Income by Famaliy Size in Carnot Moon
6-person families (60 | 2.1%) account for the highest median family income in Carnot Moon with $193,171 per family, while 3-person families (734 | 26.1%) have the highest median income of $45,833 per family member.
| Income Bracket | # Families | Median Income |
| 2-Person Families | 1,204 (42.9%) | $81,687 |
| 3-Person Families | 734 (26.1%) | $137,500 |
| 4-Person Families | 564 (20.1%) | $139,103 |
| 5-Person Families | 246 (8.8%) | $193,102 |
| 6-Person Families | 60 (2.1%) | $193,171 |
| 7+ Person Families | 0 (0.0%) | $0 |
| Total | 2,808 (100.0%) | $132,683 |
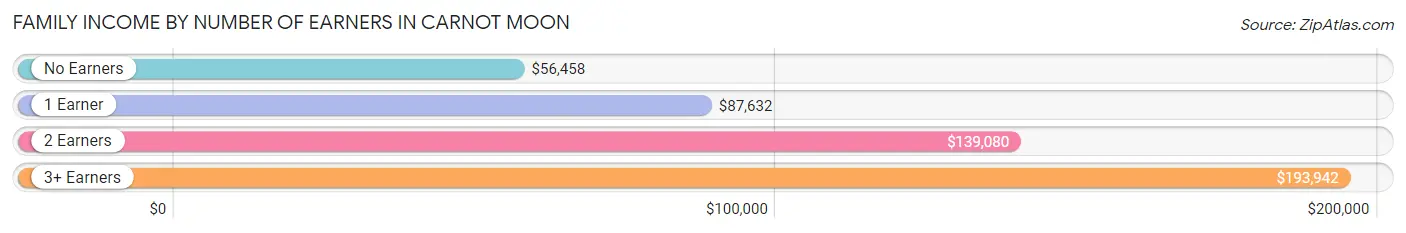
Family Income by Number of Earners in Carnot Moon
The median family income in Carnot Moon is $132,683, with families comprising 3+ earners (407) having the highest median family income of $193,942, while families with no earners (360) have the lowest median family income of $56,458, accounting for 14.5% and 12.8% of families, respectively.
| Number of Earners | # Families | Median Income |
| No Earners | 360 (12.8%) | $56,458 |
| 1 Earner | 642 (22.9%) | $87,632 |
| 2 Earners | 1,399 (49.8%) | $139,080 |
| 3+ Earners | 407 (14.5%) | $193,942 |
| Total | 2,808 (100.0%) | $132,683 |
Household Income in Carnot Moon
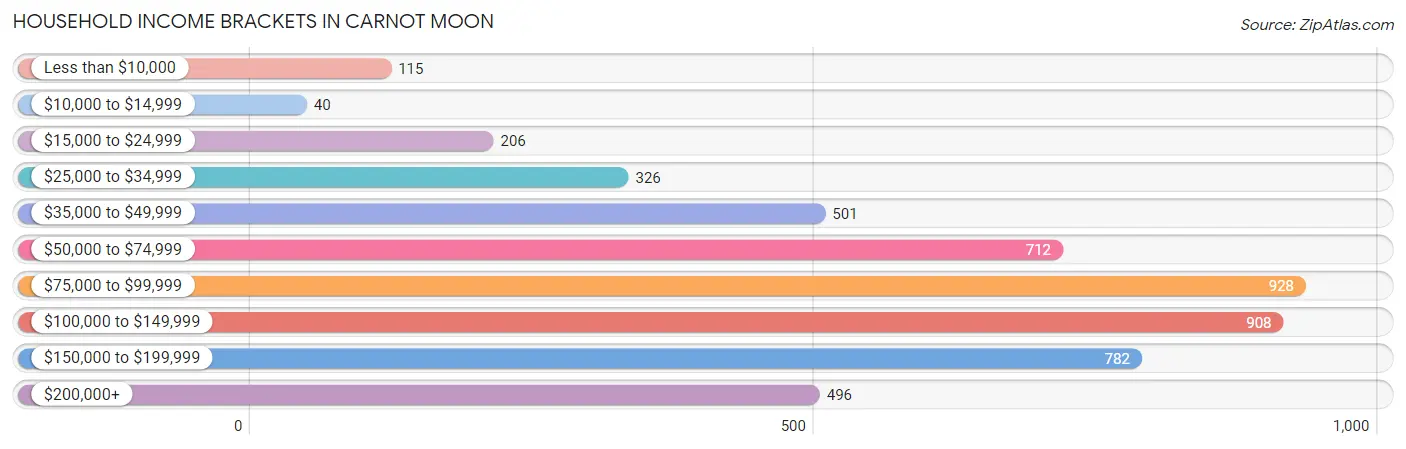
Household Income Brackets in Carnot Moon
With 928 households falling in the category, the $75,000 to $99,999 income range is the most frequent in Carnot Moon, accounting for 18.5% of all households. In contrast, only 40 households (0.8%) fall into the $10,000 to $14,999 income bracket, making it the least populous group.
| Income Bracket | # Households | % Households |
| Less than $10,000 | 115 | 2.3% |
| $10,000 to $14,999 | 40 | 0.8% |
| $15,000 to $24,999 | 206 | 4.1% |
| $25,000 to $34,999 | 326 | 6.5% |
| $35,000 to $49,999 | 501 | 10.0% |
| $50,000 to $74,999 | 712 | 14.2% |
| $75,000 to $99,999 | 928 | 18.5% |
| $100,000 to $149,999 | 908 | 18.1% |
| $150,000 to $199,999 | 782 | 15.6% |
| $200,000+ | 496 | 9.9% |
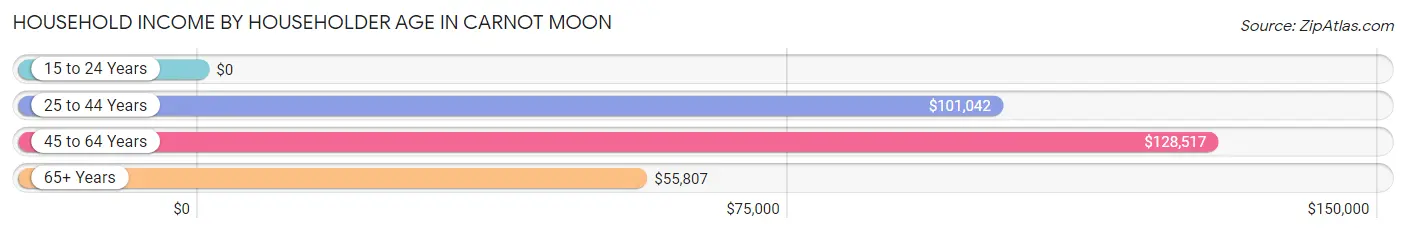
Household Income by Householder Age in Carnot Moon
The median household income in Carnot Moon is $89,573, with the highest median household income of $128,517 found in the 45 to 64 years age bracket for the primary householder. A total of 1,821 households (36.3%) fall into this category. Meanwhile, the 15 to 24 years age bracket for the primary householder has the lowest median household income of $0, with 406 households (8.1%) in this group.
| Income Bracket | # Households | Median Income |
| 15 to 24 Years | 406 (8.1%) | $0 |
| 25 to 44 Years | 1,522 (30.4%) | $101,042 |
| 45 to 64 Years | 1,821 (36.3%) | $128,517 |
| 65+ Years | 1,265 (25.2%) | $55,807 |
| Total | 5,014 (100.0%) | $89,573 |
Poverty in Carnot Moon
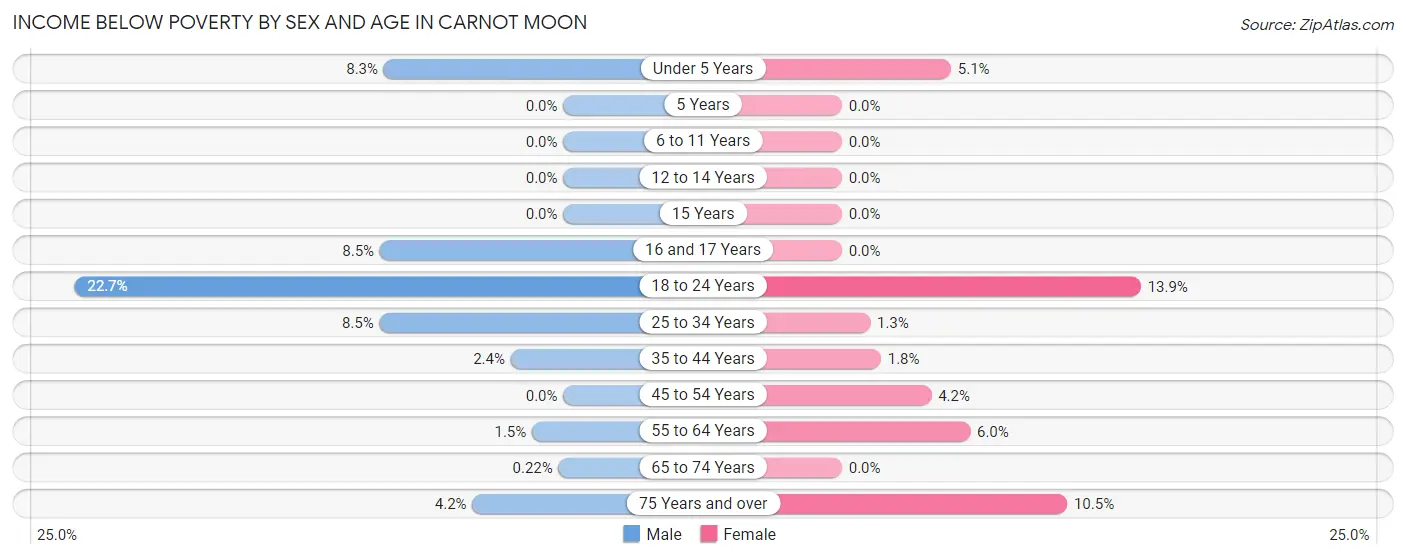
Income Below Poverty by Sex and Age in Carnot Moon
With 4.5% poverty level for males and 4.5% for females among the residents of Carnot Moon, 18 to 24 year old males and 18 to 24 year old females are the most vulnerable to poverty, with 98 males (22.7%) and 114 females (13.9%) in their respective age groups living below the poverty level.
| Age Bracket | Male | Female |
| Under 5 Years | 18 (8.3%) | 12 (5.1%) |
| 5 Years | 0 (0.0%) | 0 (0.0%) |
| 6 to 11 Years | 0 (0.0%) | 0 (0.0%) |
| 12 to 14 Years | 0 (0.0%) | 0 (0.0%) |
| 15 Years | 0 (0.0%) | 0 (0.0%) |
| 16 and 17 Years | 12 (8.5%) | 0 (0.0%) |
| 18 to 24 Years | 98 (22.7%) | 114 (13.9%) |
| 25 to 34 Years | 75 (8.5%) | 16 (1.3%) |
| 35 to 44 Years | 18 (2.4%) | 13 (1.8%) |
| 45 to 54 Years | 0 (0.0%) | 32 (4.2%) |
| 55 to 64 Years | 10 (1.5%) | 50 (5.9%) |
| 65 to 74 Years | 1 (0.2%) | 0 (0.0%) |
| 75 Years and over | 17 (4.2%) | 46 (10.4%) |
| Total | 249 (4.5%) | 283 (4.5%) |
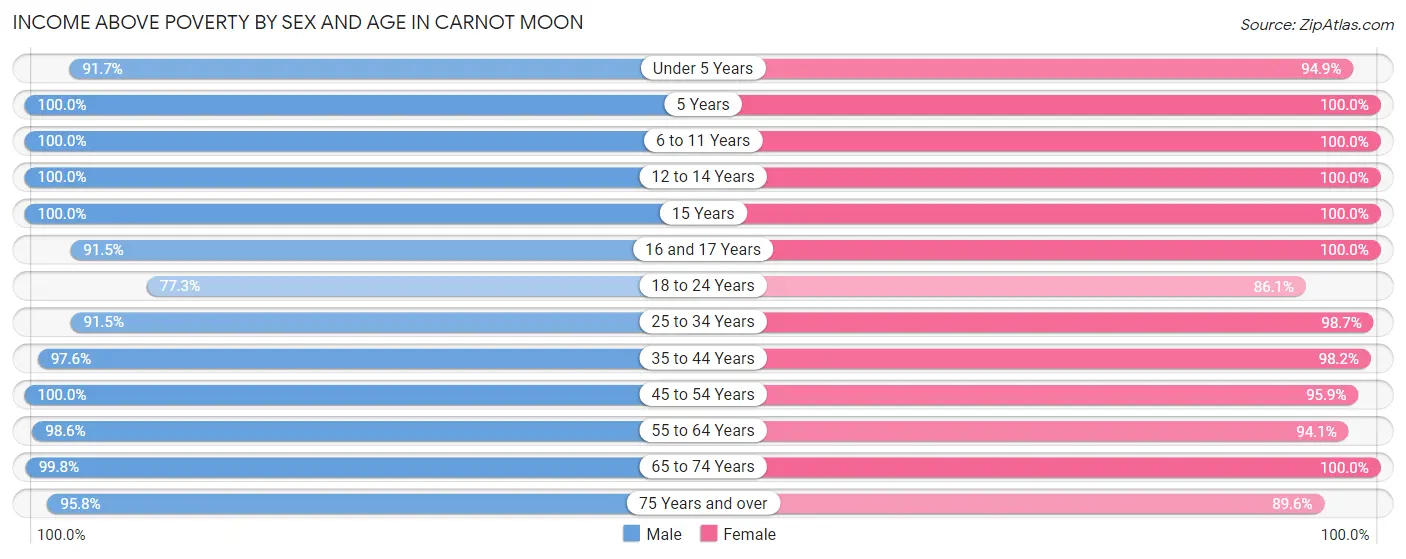
Income Above Poverty by Sex and Age in Carnot Moon
According to the poverty statistics in Carnot Moon, males aged 5 years and females aged 5 years are the age groups that are most secure financially, with 100.0% of males and 100.0% of females in these age groups living above the poverty line.
| Age Bracket | Male | Female |
| Under 5 Years | 198 (91.7%) | 225 (94.9%) |
| 5 Years | 25 (100.0%) | 91 (100.0%) |
| 6 to 11 Years | 402 (100.0%) | 215 (100.0%) |
| 12 to 14 Years | 179 (100.0%) | 195 (100.0%) |
| 15 Years | 85 (100.0%) | 88 (100.0%) |
| 16 and 17 Years | 129 (91.5%) | 109 (100.0%) |
| 18 to 24 Years | 334 (77.3%) | 708 (86.1%) |
| 25 to 34 Years | 804 (91.5%) | 1,203 (98.7%) |
| 35 to 44 Years | 721 (97.6%) | 707 (98.2%) |
| 45 to 54 Years | 835 (100.0%) | 740 (95.9%) |
| 55 to 64 Years | 680 (98.6%) | 790 (94.1%) |
| 65 to 74 Years | 464 (99.8%) | 569 (100.0%) |
| 75 Years and over | 386 (95.8%) | 394 (89.5%) |
| Total | 5,242 (95.5%) | 6,034 (95.5%) |
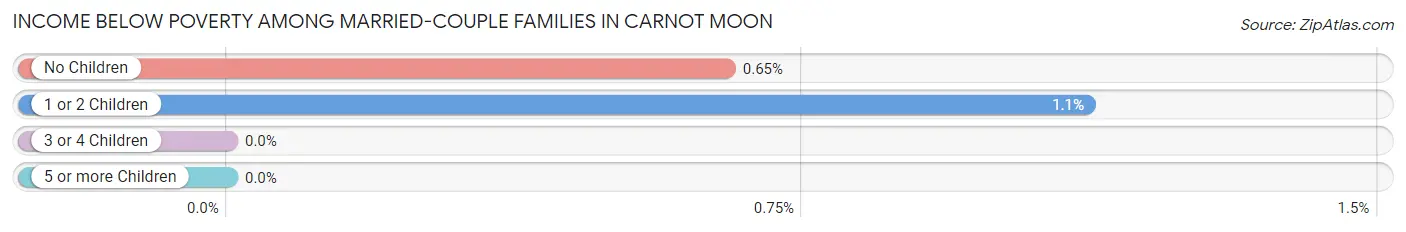
Income Below Poverty Among Married-Couple Families in Carnot Moon
The poverty statistics for married-couple families in Carnot Moon show that 0.8% or 20 of the total 2,476 families live below the poverty line. Families with 1 or 2 children have the highest poverty rate of 1.1%, comprising of 11 families. On the other hand, families with 3 or 4 children have the lowest poverty rate of 0.0%, which includes 0 families.
| Children | Above Poverty | Below Poverty |
| No Children | 1,384 (99.4%) | 9 (0.6%) |
| 1 or 2 Children | 967 (98.9%) | 11 (1.1%) |
| 3 or 4 Children | 105 (100.0%) | 0 (0.0%) |
| 5 or more Children | 0 (0.0%) | 0 (0.0%) |
| Total | 2,456 (99.2%) | 20 (0.8%) |
Income Below Poverty Among Single-Parent Households in Carnot Moon
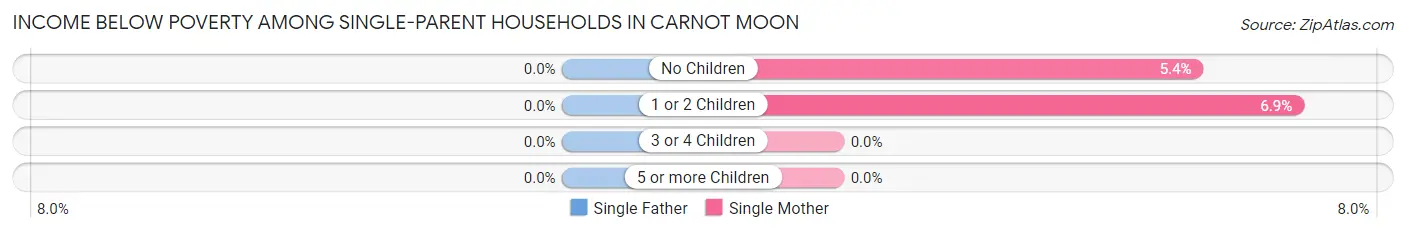
| Children | Single Father | Single Mother |
| No Children | 0 (0.0%) | 6 (5.4%) |
| 1 or 2 Children | 0 (0.0%) | 7 (6.9%) |
| 3 or 4 Children | 0 (0.0%) | 0 (0.0%) |
| 5 or more Children | 0 (0.0%) | 0 (0.0%) |
| Total | 0 (0.0%) | 13 (6.1%) |
Income Below Poverty Among Married-Couple vs Single-Parent Households in Carnot Moon
The poverty data for Carnot Moon shows that 20 of the married-couple family households (0.8%) and 13 of the single-parent households (3.9%) are living below the poverty level. Within the married-couple family households, those with 1 or 2 children have the highest poverty rate, with 11 households (1.1%) falling below the poverty line. Among the single-parent households, those with no children have the highest poverty rate, with 6 household (5.0%) living below poverty.
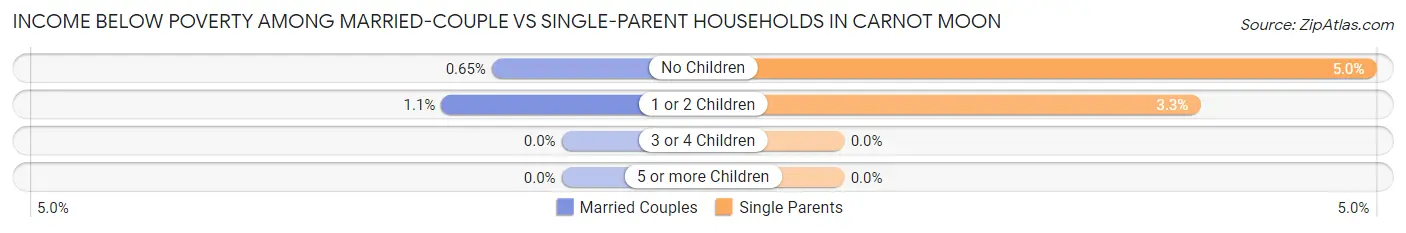
| Children | Married-Couple Families | Single-Parent Households |
| No Children | 9 (0.6%) | 6 (5.0%) |
| 1 or 2 Children | 11 (1.1%) | 7 (3.3%) |
| 3 or 4 Children | 0 (0.0%) | 0 (0.0%) |
| 5 or more Children | 0 (0.0%) | 0 (0.0%) |
| Total | 20 (0.8%) | 13 (3.9%) |
Employment Characteristics in Carnot Moon
Employment by Class of Employer in Carnot Moon
Among the 7,187 employed individuals in Carnot Moon, private company employees (5,109 | 71.1%), not-for-profit organizations (1,233 | 17.2%), and local government employees (367 | 5.1%) make up the most common classes of employment.
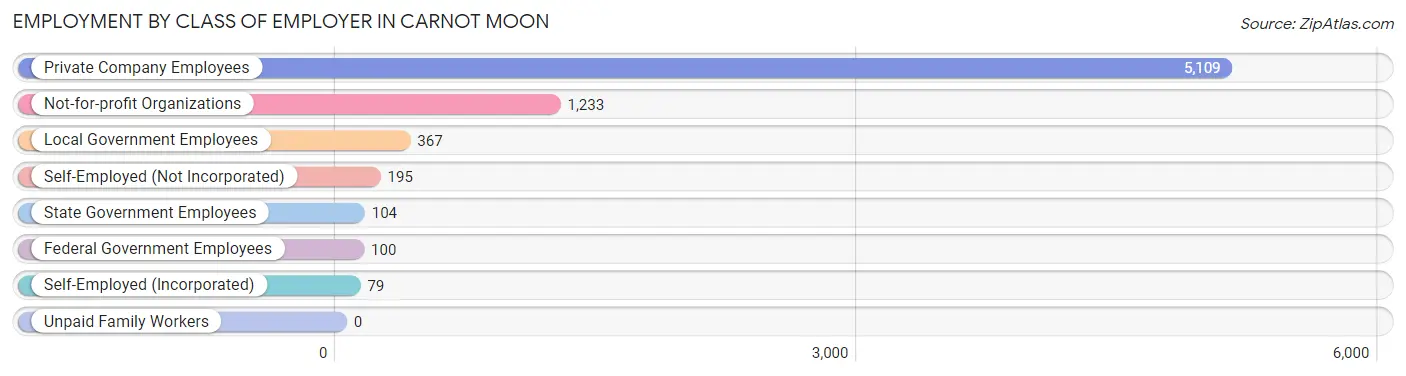
| Employer Class | # Employees | % Employees |
| Private Company Employees | 5,109 | 71.1% |
| Self-Employed (Incorporated) | 79 | 1.1% |
| Self-Employed (Not Incorporated) | 195 | 2.7% |
| Not-for-profit Organizations | 1,233 | 17.2% |
| Local Government Employees | 367 | 5.1% |
| State Government Employees | 104 | 1.5% |
| Federal Government Employees | 100 | 1.4% |
| Unpaid Family Workers | 0 | 0.0% |
| Total | 7,187 | 100.0% |
Employment Status by Age in Carnot Moon
According to the labor force statistics for Carnot Moon, out of the total population over 16 years of age (11,598), 68.2% or 7,910 individuals are in the labor force, with 5.9% or 467 of them unemployed. The age group with the highest labor force participation rate is 25 to 29 years, with 92.4% or 1,342 individuals in the labor force. Within the labor force, the 55 to 59 years age range has the highest percentage of unemployed individuals, with 29.6% or 189 of them being unemployed.
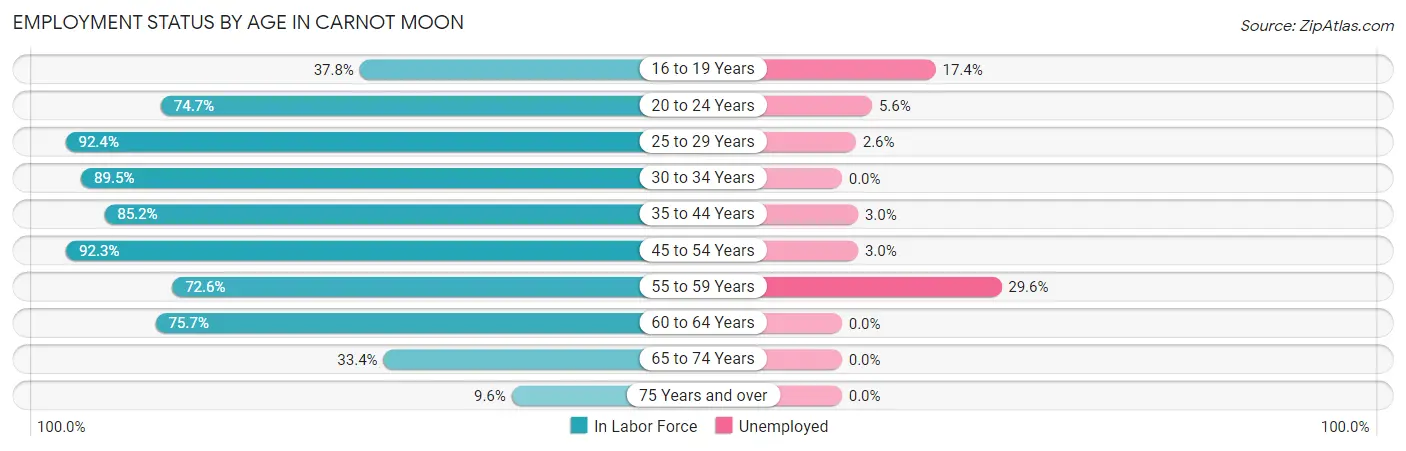
| Age Bracket | In Labor Force | Unemployed |
| 16 to 19 Years | 557 (37.8%) | 97 (17.4%) |
| 20 to 24 Years | 1,126 (74.7%) | 63 (5.6%) |
| 25 to 29 Years | 1,342 (92.4%) | 35 (2.6%) |
| 30 to 34 Years | 594 (89.5%) | 0 (0.0%) |
| 35 to 44 Years | 1,243 (85.2%) | 37 (3.0%) |
| 45 to 54 Years | 1,483 (92.3%) | 44 (3.0%) |
| 55 to 59 Years | 639 (72.6%) | 189 (29.6%) |
| 60 to 64 Years | 499 (75.7%) | 0 (0.0%) |
| 65 to 74 Years | 349 (33.4%) | 0 (0.0%) |
| 75 Years and over | 82 (9.6%) | 0 (0.0%) |
| Total | 7,910 (68.2%) | 467 (5.9%) |
Employment Status by Educational Attainment in Carnot Moon
According to labor force statistics for Carnot Moon, 86.3% of individuals (5,800) out of the total population between 25 and 64 years of age (6,721) are in the labor force, with 5.3% or 307 of them being unemployed. The group with the highest labor force participation rate are those with the educational attainment of less than high school, with 98.7% or 150 individuals in the labor force. Within the labor force, individuals with bachelor's degree or higher education have the highest percentage of unemployment, with 6.8% or 252 of them being unemployed.
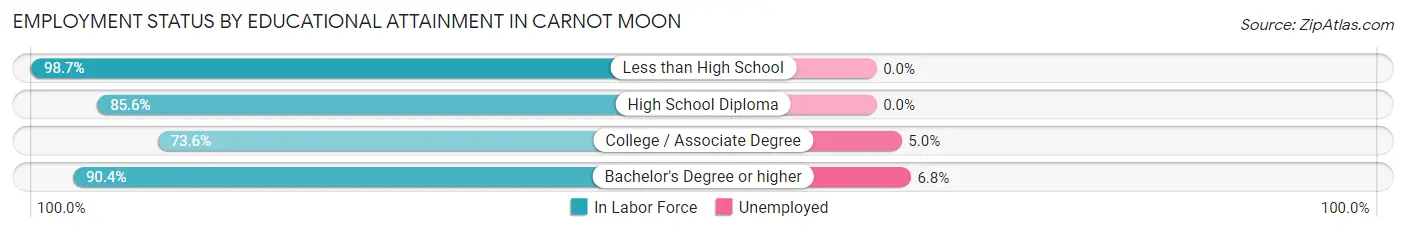
| Educational Attainment | In Labor Force | Unemployed |
| Less than High School | 150 (98.7%) | 0 (0.0%) |
| High School Diploma | 891 (85.6%) | 0 (0.0%) |
| College / Associate Degree | 1,055 (73.6%) | 72 (5.0%) |
| Bachelor's Degree or higher | 3,701 (90.4%) | 278 (6.8%) |
| Total | 5,800 (86.3%) | 356 (5.3%) |
Employment Occupations by Sex in Carnot Moon
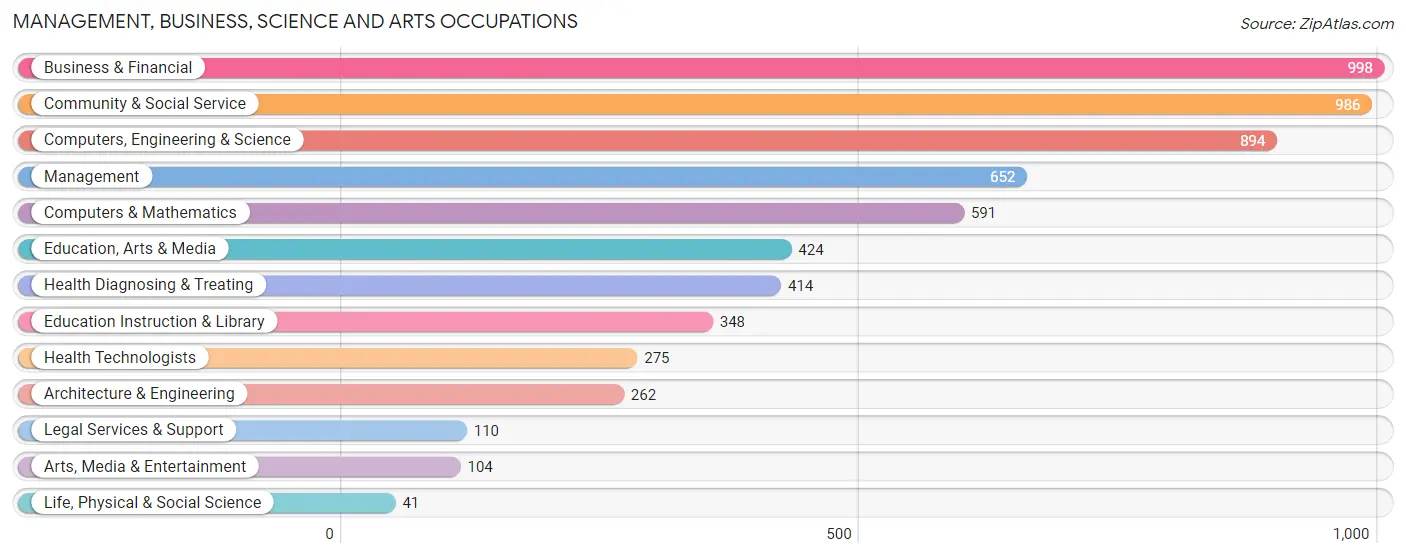
Management, Business, Science and Arts Occupations
The most common Management, Business, Science and Arts occupations in Carnot Moon are Business & Financial (998 | 13.4%), Community & Social Service (986 | 13.2%), Computers, Engineering & Science (894 | 12.0%), Management (652 | 8.7%), and Computers & Mathematics (591 | 7.9%).
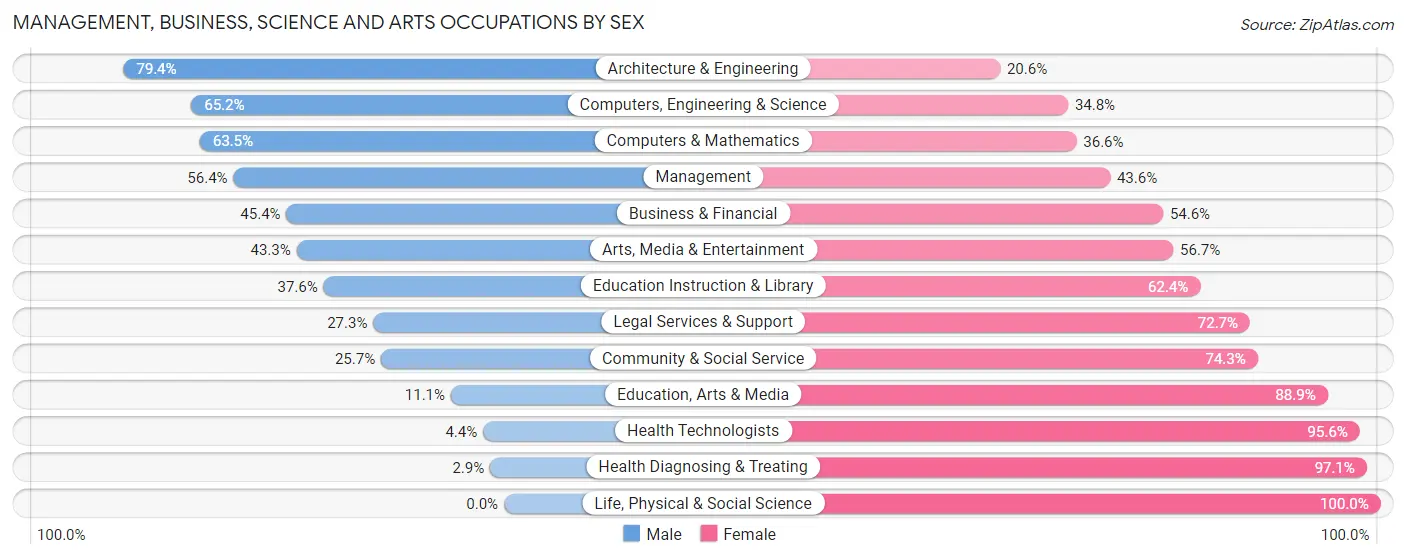
Management, Business, Science and Arts Occupations by Sex
Within the Management, Business, Science and Arts occupations in Carnot Moon, the most male-oriented occupations are Architecture & Engineering (79.4%), Computers, Engineering & Science (65.2%), and Computers & Mathematics (63.4%), while the most female-oriented occupations are Life, Physical & Social Science (100.0%), Health Diagnosing & Treating (97.1%), and Health Technologists (95.6%).
| Occupation | Male | Female |
| Management | 368 (56.4%) | 284 (43.6%) |
| Business & Financial | 453 (45.4%) | 545 (54.6%) |
| Computers, Engineering & Science | 583 (65.2%) | 311 (34.8%) |
| Computers & Mathematics | 375 (63.4%) | 216 (36.5%) |
| Architecture & Engineering | 208 (79.4%) | 54 (20.6%) |
| Life, Physical & Social Science | 0 (0.0%) | 41 (100.0%) |
| Community & Social Service | 253 (25.7%) | 733 (74.3%) |
| Education, Arts & Media | 47 (11.1%) | 377 (88.9%) |
| Legal Services & Support | 30 (27.3%) | 80 (72.7%) |
| Education Instruction & Library | 131 (37.6%) | 217 (62.4%) |
| Arts, Media & Entertainment | 45 (43.3%) | 59 (56.7%) |
| Health Diagnosing & Treating | 12 (2.9%) | 402 (97.1%) |
| Health Technologists | 12 (4.4%) | 263 (95.6%) |
| Total (Category) | 1,669 (42.3%) | 2,275 (57.7%) |
| Total (Overall) | 3,330 (44.7%) | 4,118 (55.3%) |
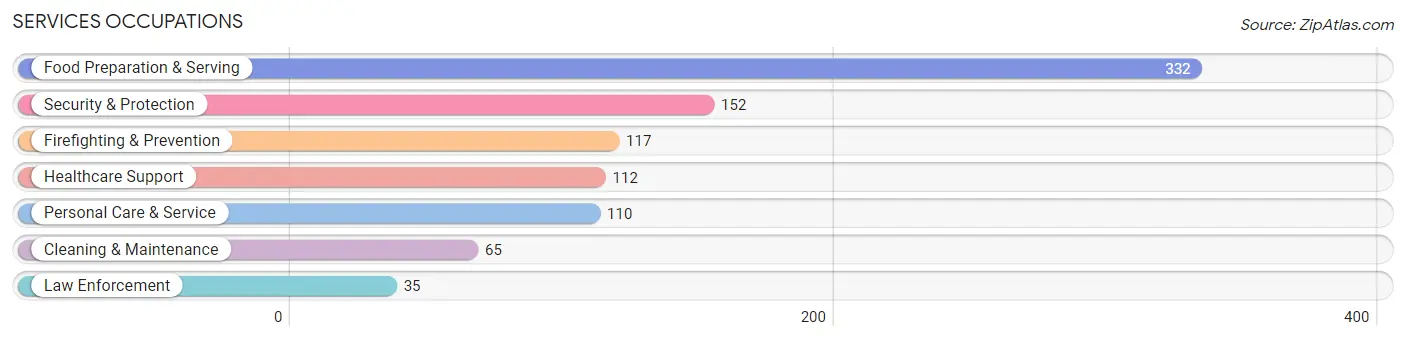
Services Occupations
The most common Services occupations in Carnot Moon are Food Preparation & Serving (332 | 4.5%), Security & Protection (152 | 2.0%), Firefighting & Prevention (117 | 1.6%), Healthcare Support (112 | 1.5%), and Personal Care & Service (110 | 1.5%).
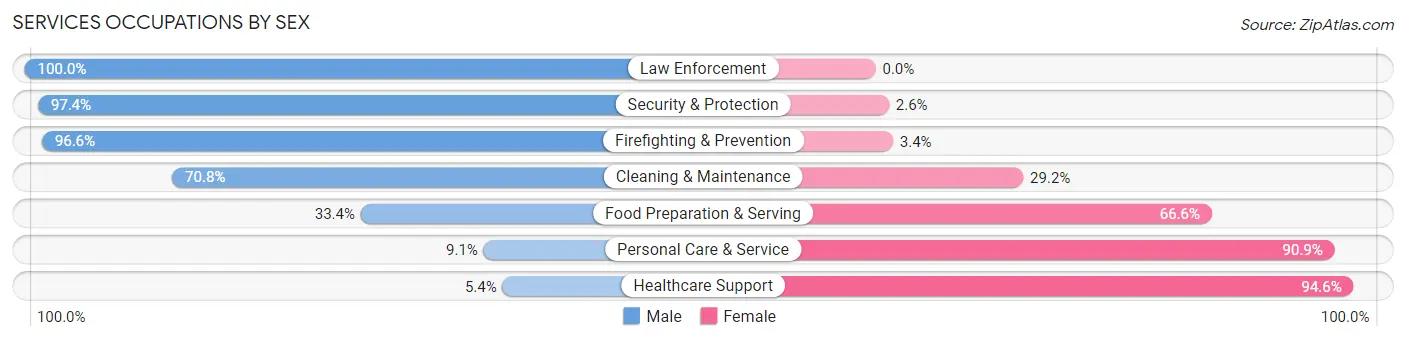
Services Occupations by Sex
Within the Services occupations in Carnot Moon, the most male-oriented occupations are Law Enforcement (100.0%), Security & Protection (97.4%), and Firefighting & Prevention (96.6%), while the most female-oriented occupations are Healthcare Support (94.6%), Personal Care & Service (90.9%), and Food Preparation & Serving (66.6%).
| Occupation | Male | Female |
| Healthcare Support | 6 (5.4%) | 106 (94.6%) |
| Security & Protection | 148 (97.4%) | 4 (2.6%) |
| Firefighting & Prevention | 113 (96.6%) | 4 (3.4%) |
| Law Enforcement | 35 (100.0%) | 0 (0.0%) |
| Food Preparation & Serving | 111 (33.4%) | 221 (66.6%) |
| Cleaning & Maintenance | 46 (70.8%) | 19 (29.2%) |
| Personal Care & Service | 10 (9.1%) | 100 (90.9%) |
| Total (Category) | 321 (41.6%) | 450 (58.4%) |
| Total (Overall) | 3,330 (44.7%) | 4,118 (55.3%) |
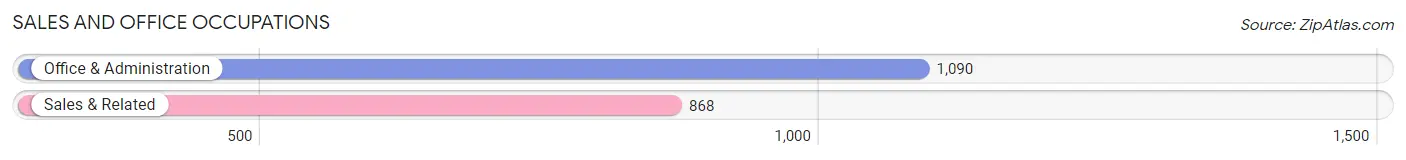
Sales and Office Occupations
The most common Sales and Office occupations in Carnot Moon are Office & Administration (1,090 | 14.6%), and Sales & Related (868 | 11.7%).
Sales and Office Occupations by Sex
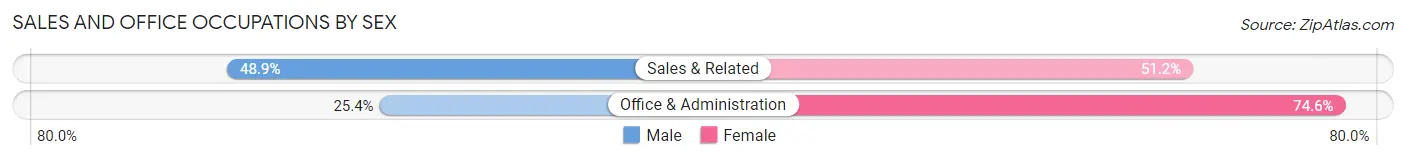
| Occupation | Male | Female |
| Sales & Related | 424 (48.8%) | 444 (51.1%) |
| Office & Administration | 277 (25.4%) | 813 (74.6%) |
| Total (Category) | 701 (35.8%) | 1,257 (64.2%) |
| Total (Overall) | 3,330 (44.7%) | 4,118 (55.3%) |
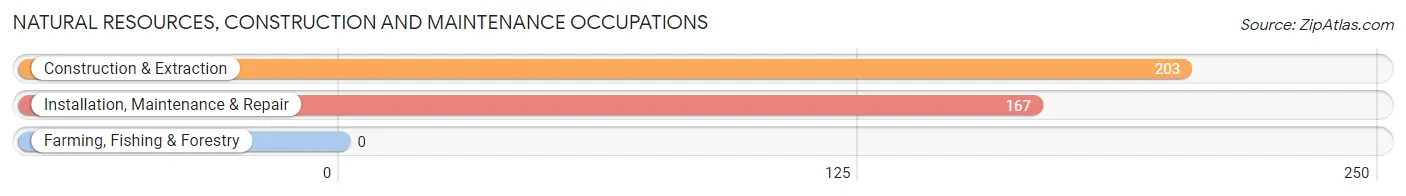
Natural Resources, Construction and Maintenance Occupations
The most common Natural Resources, Construction and Maintenance occupations in Carnot Moon are Construction & Extraction (203 | 2.7%), and Installation, Maintenance & Repair (167 | 2.2%).
Natural Resources, Construction and Maintenance Occupations by Sex
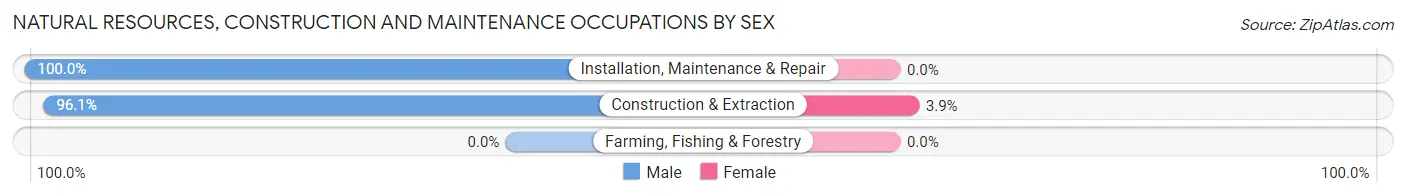
| Occupation | Male | Female |
| Farming, Fishing & Forestry | 0 (0.0%) | 0 (0.0%) |
| Construction & Extraction | 195 (96.1%) | 8 (3.9%) |
| Installation, Maintenance & Repair | 167 (100.0%) | 0 (0.0%) |
| Total (Category) | 362 (97.8%) | 8 (2.2%) |
| Total (Overall) | 3,330 (44.7%) | 4,118 (55.3%) |
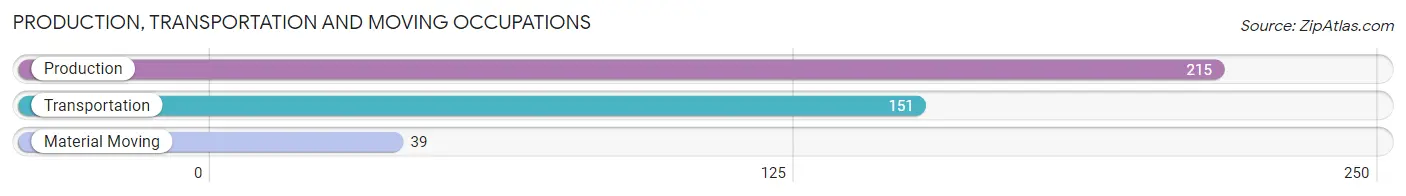
Production, Transportation and Moving Occupations
The most common Production, Transportation and Moving occupations in Carnot Moon are Production (215 | 2.9%), Transportation (151 | 2.0%), and Material Moving (39 | 0.5%).
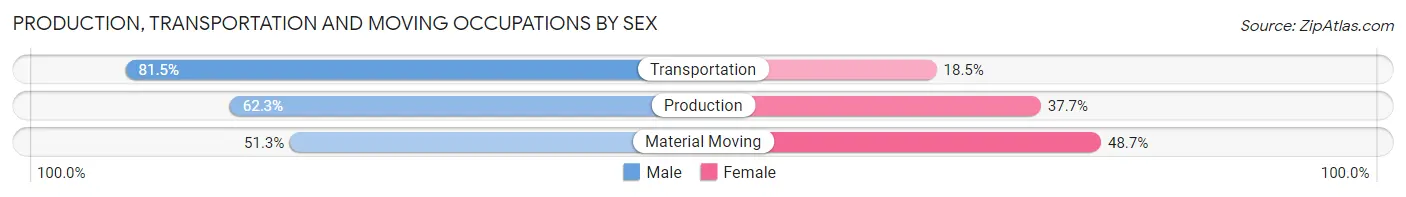
Production, Transportation and Moving Occupations by Sex
| Occupation | Male | Female |
| Production | 134 (62.3%) | 81 (37.7%) |
| Transportation | 123 (81.5%) | 28 (18.5%) |
| Material Moving | 20 (51.3%) | 19 (48.7%) |
| Total (Category) | 277 (68.4%) | 128 (31.6%) |
| Total (Overall) | 3,330 (44.7%) | 4,118 (55.3%) |
Employment Industries by Sex in Carnot Moon
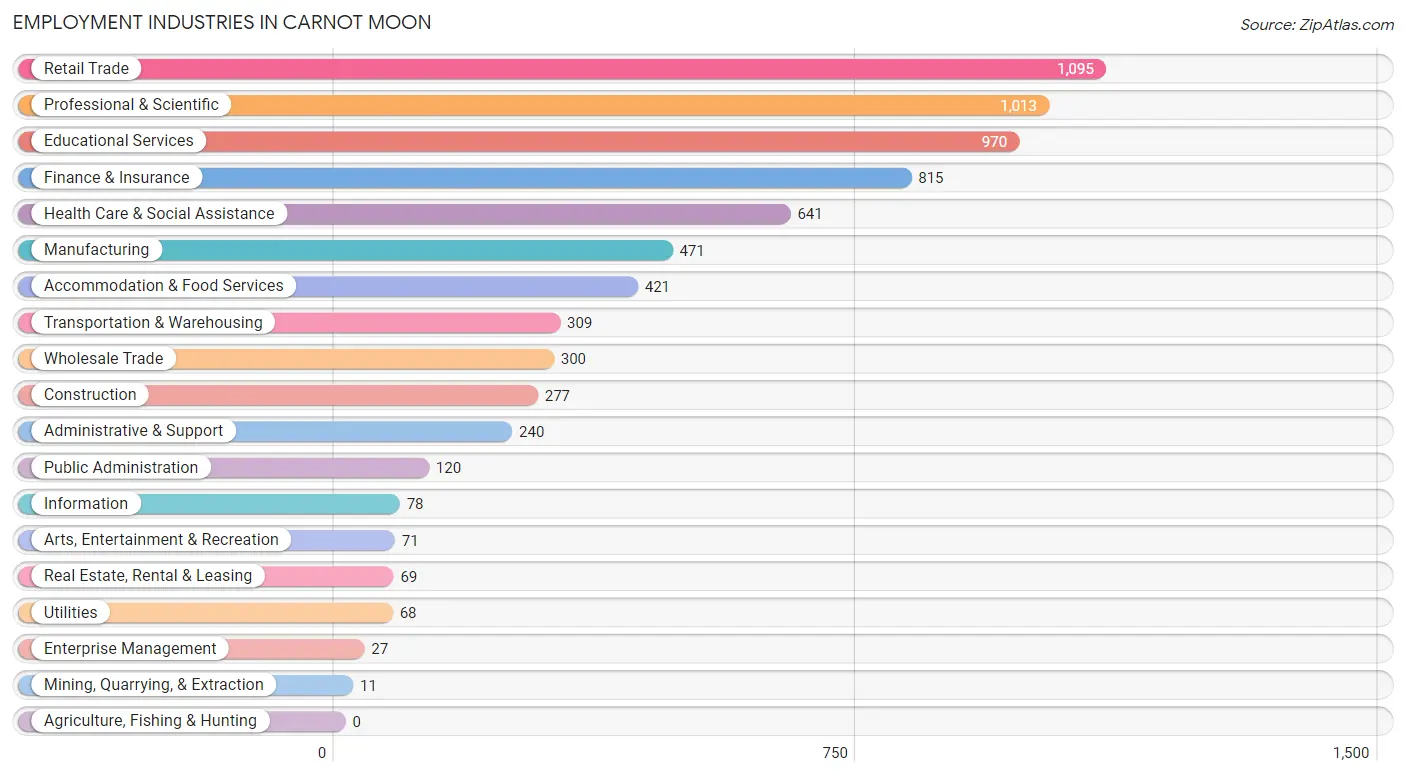
Employment Industries in Carnot Moon
The major employment industries in Carnot Moon include Retail Trade (1,095 | 14.7%), Professional & Scientific (1,013 | 13.6%), Educational Services (970 | 13.0%), Finance & Insurance (815 | 10.9%), and Health Care & Social Assistance (641 | 8.6%).
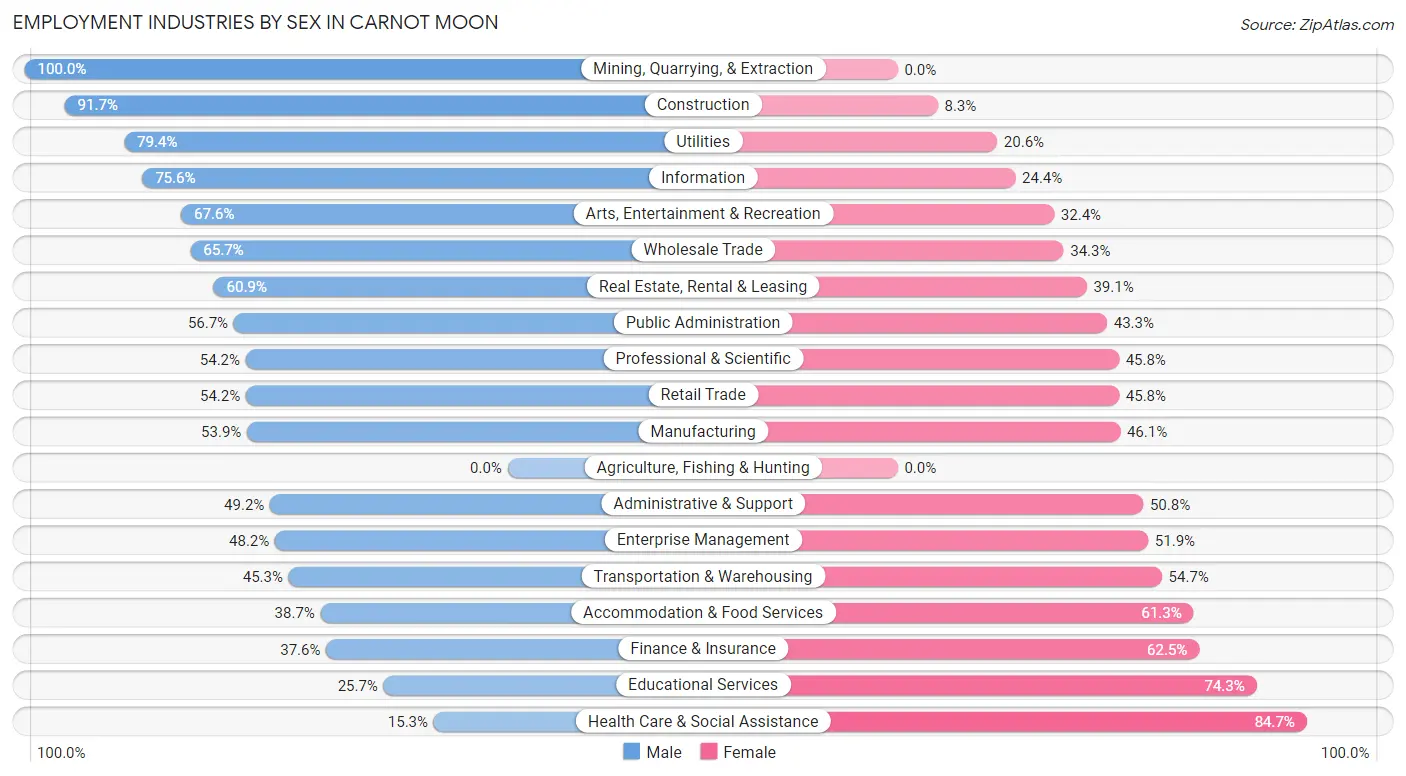
Employment Industries by Sex in Carnot Moon
The Carnot Moon industries that see more men than women are Mining, Quarrying, & Extraction (100.0%), Construction (91.7%), and Utilities (79.4%), whereas the industries that tend to have a higher number of women are Health Care & Social Assistance (84.7%), Educational Services (74.3%), and Finance & Insurance (62.5%).
| Industry | Male | Female |
| Agriculture, Fishing & Hunting | 0 (0.0%) | 0 (0.0%) |
| Mining, Quarrying, & Extraction | 11 (100.0%) | 0 (0.0%) |
| Construction | 254 (91.7%) | 23 (8.3%) |
| Manufacturing | 254 (53.9%) | 217 (46.1%) |
| Wholesale Trade | 197 (65.7%) | 103 (34.3%) |
| Retail Trade | 593 (54.2%) | 502 (45.8%) |
| Transportation & Warehousing | 140 (45.3%) | 169 (54.7%) |
| Utilities | 54 (79.4%) | 14 (20.6%) |
| Information | 59 (75.6%) | 19 (24.4%) |
| Finance & Insurance | 306 (37.6%) | 509 (62.5%) |
| Real Estate, Rental & Leasing | 42 (60.9%) | 27 (39.1%) |
| Professional & Scientific | 549 (54.2%) | 464 (45.8%) |
| Enterprise Management | 13 (48.1%) | 14 (51.8%) |
| Administrative & Support | 118 (49.2%) | 122 (50.8%) |
| Educational Services | 249 (25.7%) | 721 (74.3%) |
| Health Care & Social Assistance | 98 (15.3%) | 543 (84.7%) |
| Arts, Entertainment & Recreation | 48 (67.6%) | 23 (32.4%) |
| Accommodation & Food Services | 163 (38.7%) | 258 (61.3%) |
| Public Administration | 68 (56.7%) | 52 (43.3%) |
| Total | 3,330 (44.7%) | 4,118 (55.3%) |
Education in Carnot Moon
School Enrollment in Carnot Moon
The most common levels of schooling among the 4,067 students in Carnot Moon are college / undergraduate (2,104 | 51.7%), high school (585 | 14.4%), and elementary school (465 | 11.4%).
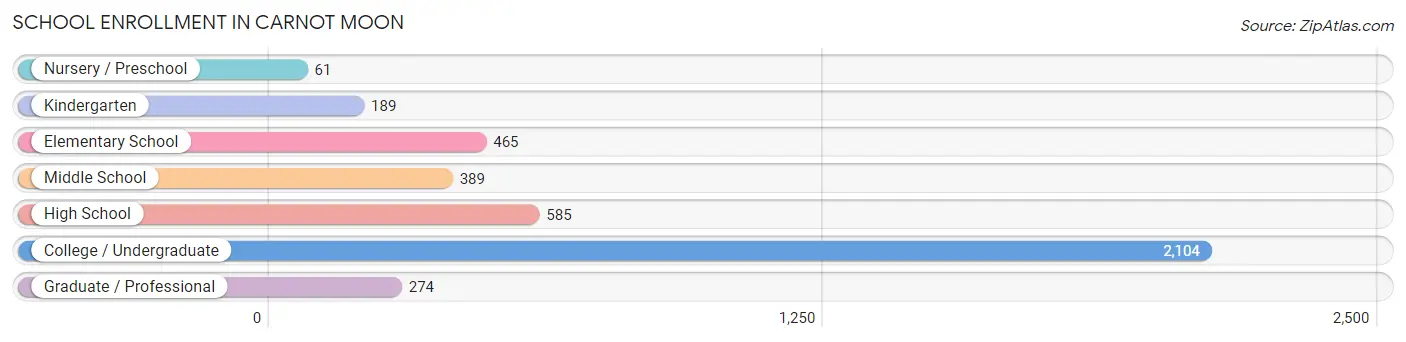
| School Level | # Students | % Students |
| Nursery / Preschool | 61 | 1.5% |
| Kindergarten | 189 | 4.6% |
| Elementary School | 465 | 11.4% |
| Middle School | 389 | 9.6% |
| High School | 585 | 14.4% |
| College / Undergraduate | 2,104 | 51.7% |
| Graduate / Professional | 274 | 6.7% |
| Total | 4,067 | 100.0% |
School Enrollment by Age by Funding Source in Carnot Moon
Out of a total of 4,067 students who are enrolled in schools in Carnot Moon, 1,598 (39.3%) attend a private institution, while the remaining 2,469 (60.7%) are enrolled in public schools. The age group of 3 to 4 year olds has the highest likelihood of being enrolled in private schools, with 61 (100.0% in the age bracket) enrolled. Conversely, the age group of 15 to 17 year olds has the lowest likelihood of being enrolled in a private school, with 426 (96.4% in the age bracket) attending a public institution.
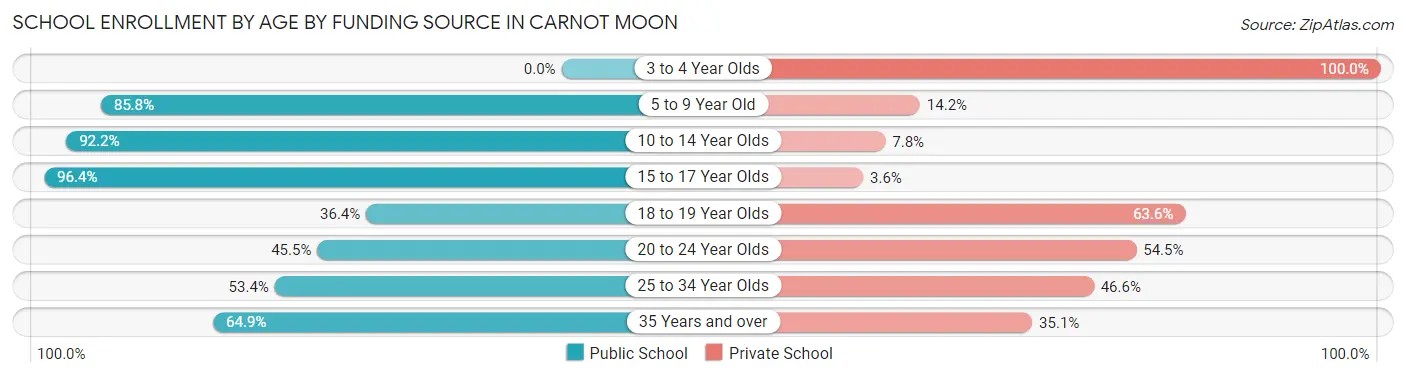
| Age Bracket | Public School | Private School |
| 3 to 4 Year Olds | 0 (0.0%) | 61 (100.0%) |
| 5 to 9 Year Old | 453 (85.8%) | 75 (14.2%) |
| 10 to 14 Year Olds | 547 (92.2%) | 46 (7.8%) |
| 15 to 17 Year Olds | 426 (96.4%) | 16 (3.6%) |
| 18 to 19 Year Olds | 429 (36.4%) | 750 (63.6%) |
| 20 to 24 Year Olds | 449 (45.5%) | 538 (54.5%) |
| 25 to 34 Year Olds | 78 (53.4%) | 68 (46.6%) |
| 35 Years and over | 85 (64.9%) | 46 (35.1%) |
| Total | 2,469 (60.7%) | 1,598 (39.3%) |
Educational Attainment by Field of Study in Carnot Moon
Business (994 | 19.9%), education (713 | 14.3%), psychology (516 | 10.3%), computers & mathematics (418 | 8.4%), and engineering (410 | 8.2%) are the most common fields of study among 4,993 individuals in Carnot Moon who have obtained a bachelor's degree or higher.
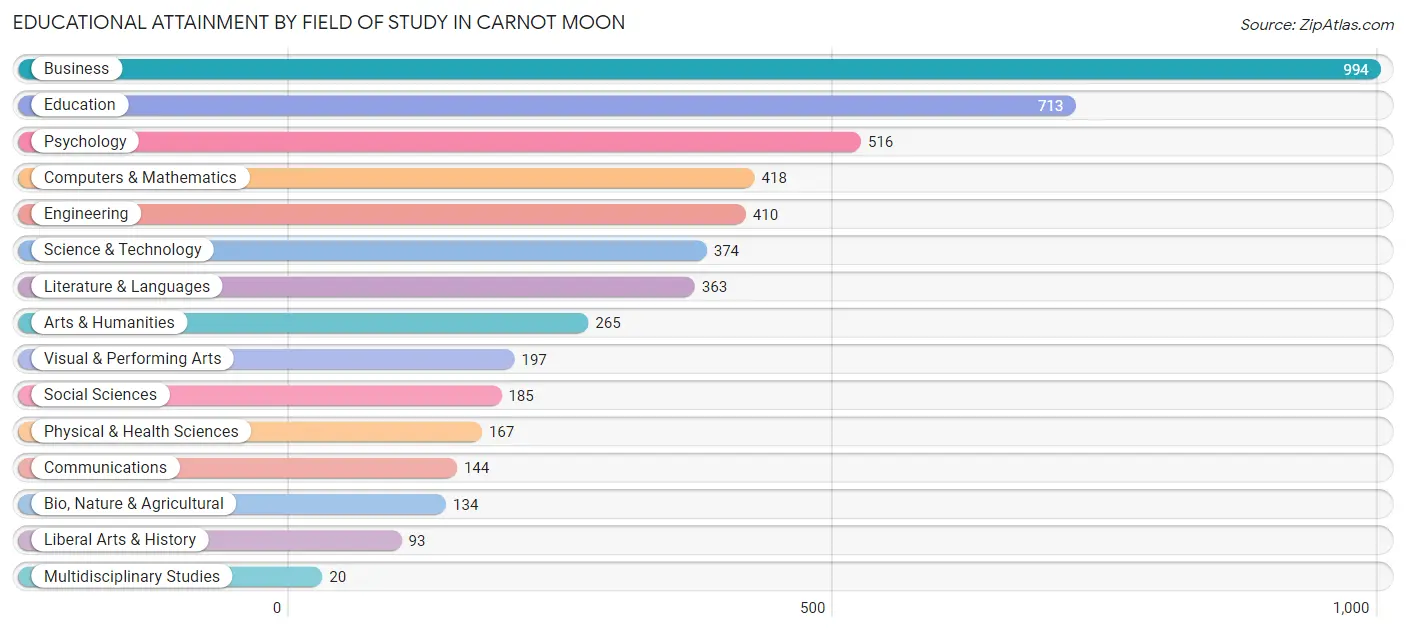
| Field of Study | # Graduates | % Graduates |
| Computers & Mathematics | 418 | 8.4% |
| Bio, Nature & Agricultural | 134 | 2.7% |
| Physical & Health Sciences | 167 | 3.3% |
| Psychology | 516 | 10.3% |
| Social Sciences | 185 | 3.7% |
| Engineering | 410 | 8.2% |
| Multidisciplinary Studies | 20 | 0.4% |
| Science & Technology | 374 | 7.5% |
| Business | 994 | 19.9% |
| Education | 713 | 14.3% |
| Literature & Languages | 363 | 7.3% |
| Liberal Arts & History | 93 | 1.9% |
| Visual & Performing Arts | 197 | 4.0% |
| Communications | 144 | 2.9% |
| Arts & Humanities | 265 | 5.3% |
| Total | 4,993 | 100.0% |
Transportation & Commute in Carnot Moon
Vehicle Availability by Sex in Carnot Moon
The most prevalent vehicle ownership categories in Carnot Moon are males with 2 vehicles (1,306, accounting for 44.0%) and females with 2 vehicles (1,348, making up 35.0%).
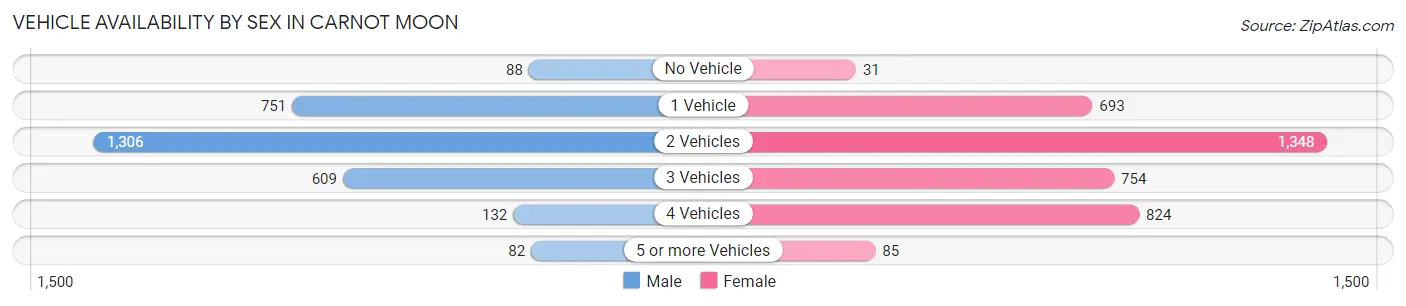
| Vehicles Available | Male | Female |
| No Vehicle | 88 (3.0%) | 31 (0.8%) |
| 1 Vehicle | 751 (25.3%) | 693 (18.5%) |
| 2 Vehicles | 1,306 (44.0%) | 1,348 (36.1%) |
| 3 Vehicles | 609 (20.5%) | 754 (20.2%) |
| 4 Vehicles | 132 (4.4%) | 824 (22.1%) |
| 5 or more Vehicles | 82 (2.8%) | 85 (2.3%) |
| Total | 2,968 (100.0%) | 3,735 (100.0%) |
Commute Time in Carnot Moon
The most frequently occuring commute durations in Carnot Moon are 45 to 59 minutes (975 commuters, 15.6%), 20 to 24 minutes (847 commuters, 13.6%), and 30 to 34 minutes (832 commuters, 13.4%).
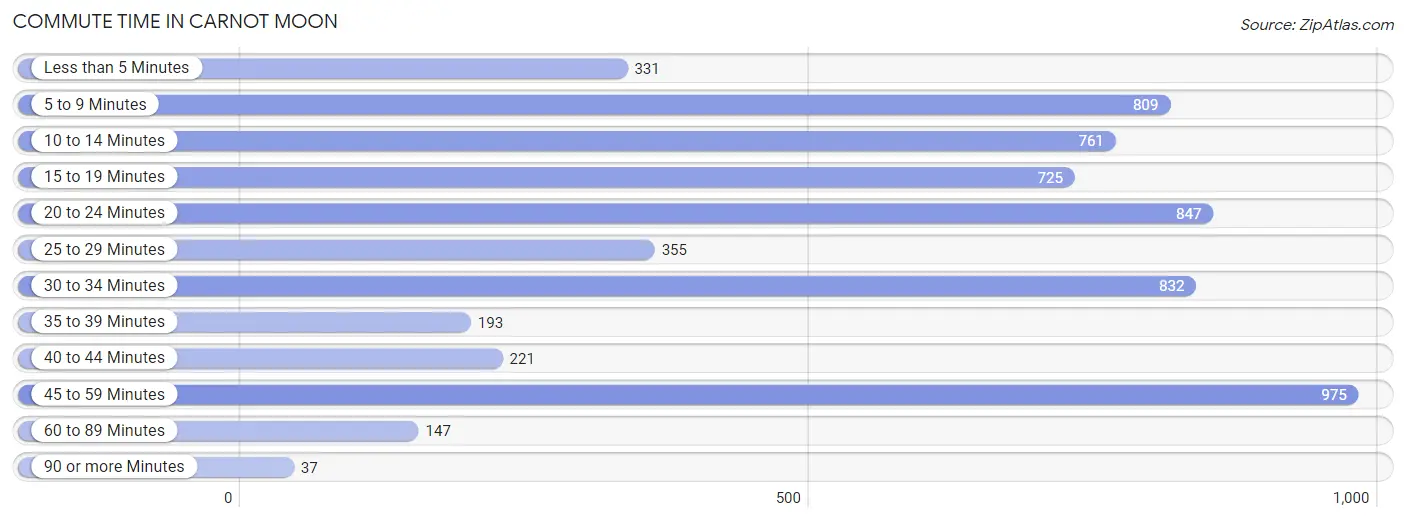
| Commute Time | # Commuters | % Commuters |
| Less than 5 Minutes | 331 | 5.3% |
| 5 to 9 Minutes | 809 | 13.0% |
| 10 to 14 Minutes | 761 | 12.2% |
| 15 to 19 Minutes | 725 | 11.6% |
| 20 to 24 Minutes | 847 | 13.6% |
| 25 to 29 Minutes | 355 | 5.7% |
| 30 to 34 Minutes | 832 | 13.4% |
| 35 to 39 Minutes | 193 | 3.1% |
| 40 to 44 Minutes | 221 | 3.5% |
| 45 to 59 Minutes | 975 | 15.6% |
| 60 to 89 Minutes | 147 | 2.4% |
| 90 or more Minutes | 37 | 0.6% |
Commute Time by Sex in Carnot Moon
The most common commute times in Carnot Moon are 30 to 34 minutes (493 commuters, 17.9%) for males and 45 to 59 minutes (649 commuters, 18.7%) for females.
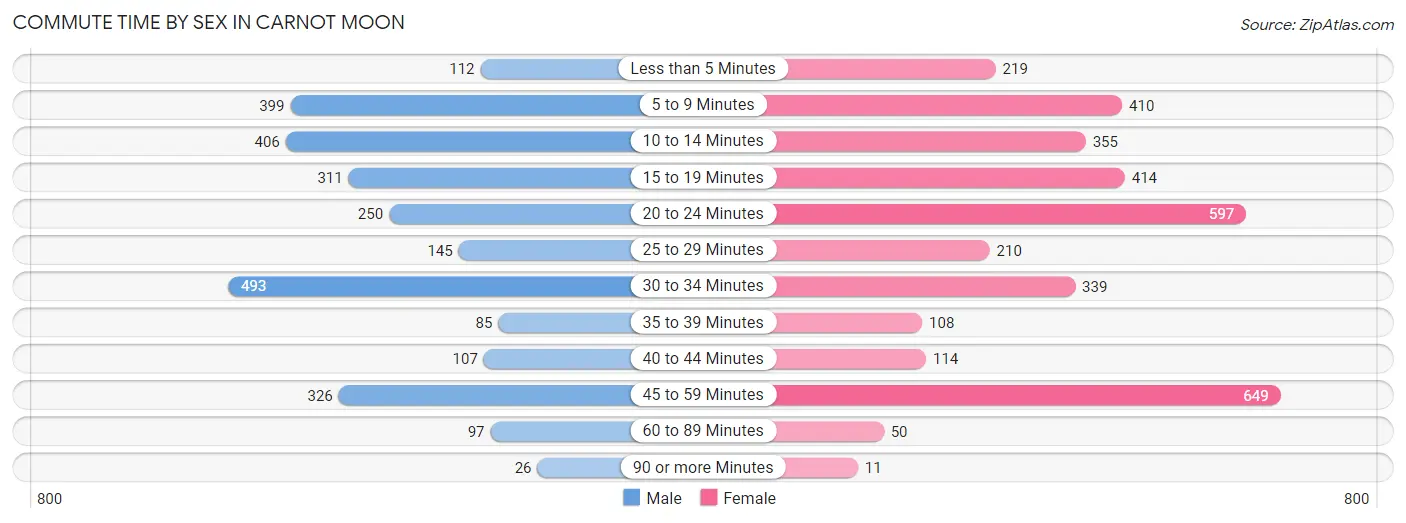
| Commute Time | Male | Female |
| Less than 5 Minutes | 112 (4.1%) | 219 (6.3%) |
| 5 to 9 Minutes | 399 (14.5%) | 410 (11.8%) |
| 10 to 14 Minutes | 406 (14.7%) | 355 (10.2%) |
| 15 to 19 Minutes | 311 (11.3%) | 414 (11.9%) |
| 20 to 24 Minutes | 250 (9.1%) | 597 (17.2%) |
| 25 to 29 Minutes | 145 (5.3%) | 210 (6.0%) |
| 30 to 34 Minutes | 493 (17.9%) | 339 (9.8%) |
| 35 to 39 Minutes | 85 (3.1%) | 108 (3.1%) |
| 40 to 44 Minutes | 107 (3.9%) | 114 (3.3%) |
| 45 to 59 Minutes | 326 (11.8%) | 649 (18.7%) |
| 60 to 89 Minutes | 97 (3.5%) | 50 (1.4%) |
| 90 or more Minutes | 26 (0.9%) | 11 (0.3%) |
Time of Departure to Work by Sex in Carnot Moon
The most frequent times of departure to work in Carnot Moon are 7:00 AM to 7:29 AM (567, 20.6%) for males and 8:00 AM to 8:29 AM (836, 24.0%) for females.
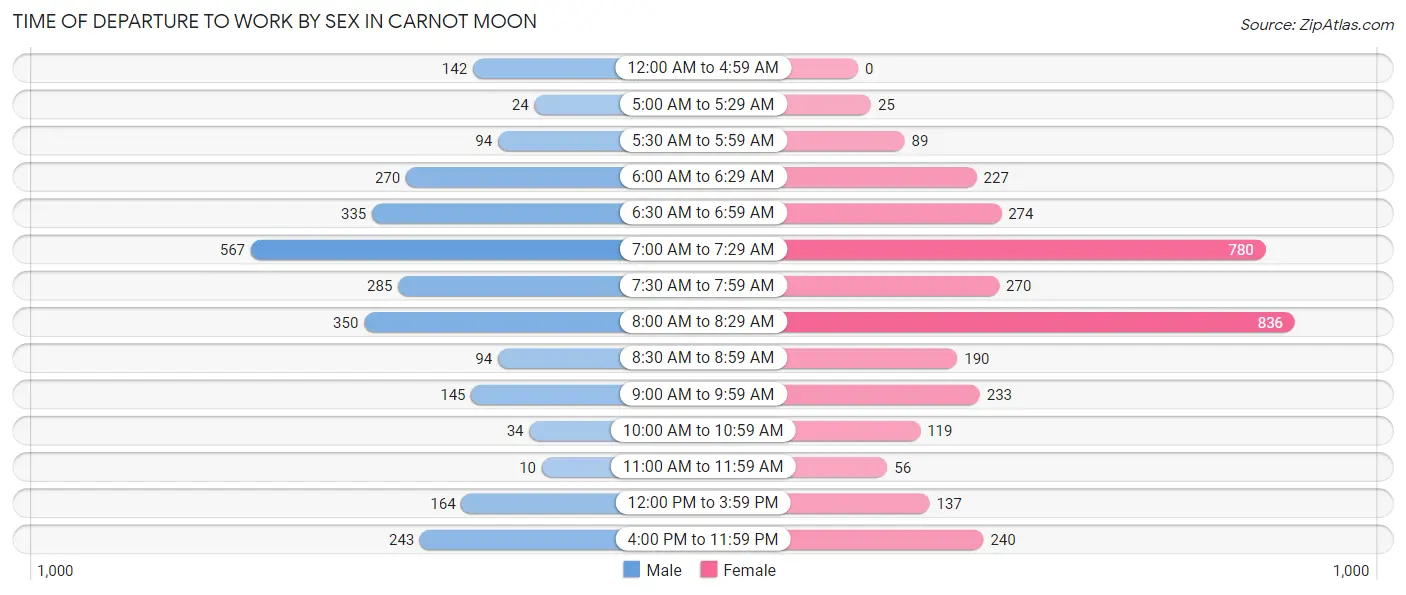
| Time of Departure | Male | Female |
| 12:00 AM to 4:59 AM | 142 (5.1%) | 0 (0.0%) |
| 5:00 AM to 5:29 AM | 24 (0.9%) | 25 (0.7%) |
| 5:30 AM to 5:59 AM | 94 (3.4%) | 89 (2.6%) |
| 6:00 AM to 6:29 AM | 270 (9.8%) | 227 (6.5%) |
| 6:30 AM to 6:59 AM | 335 (12.1%) | 274 (7.9%) |
| 7:00 AM to 7:29 AM | 567 (20.6%) | 780 (22.4%) |
| 7:30 AM to 7:59 AM | 285 (10.3%) | 270 (7.8%) |
| 8:00 AM to 8:29 AM | 350 (12.7%) | 836 (24.0%) |
| 8:30 AM to 8:59 AM | 94 (3.4%) | 190 (5.5%) |
| 9:00 AM to 9:59 AM | 145 (5.3%) | 233 (6.7%) |
| 10:00 AM to 10:59 AM | 34 (1.2%) | 119 (3.4%) |
| 11:00 AM to 11:59 AM | 10 (0.4%) | 56 (1.6%) |
| 12:00 PM to 3:59 PM | 164 (5.9%) | 137 (3.9%) |
| 4:00 PM to 11:59 PM | 243 (8.8%) | 240 (6.9%) |
| Total | 2,757 (100.0%) | 3,476 (100.0%) |
Housing Occupancy in Carnot Moon
Occupancy by Ownership in Carnot Moon
Of the total 5,014 dwellings in Carnot Moon, owner-occupied units account for 3,145 (62.7%), while renter-occupied units make up 1,869 (37.3%).
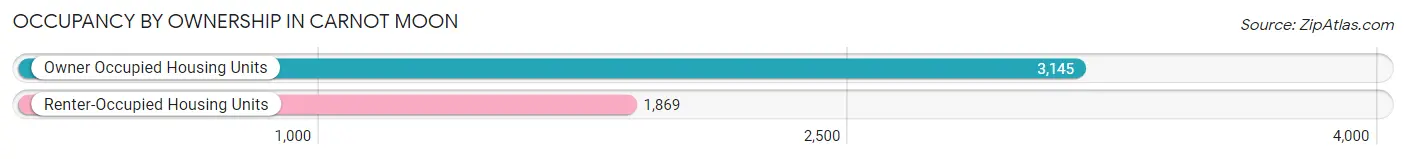
| Occupancy | # Housing Units | % Housing Units |
| Owner Occupied Housing Units | 3,145 | 62.7% |
| Renter-Occupied Housing Units | 1,869 | 37.3% |
| Total Occupied Housing Units | 5,014 | 100.0% |
Occupancy by Household Size in Carnot Moon
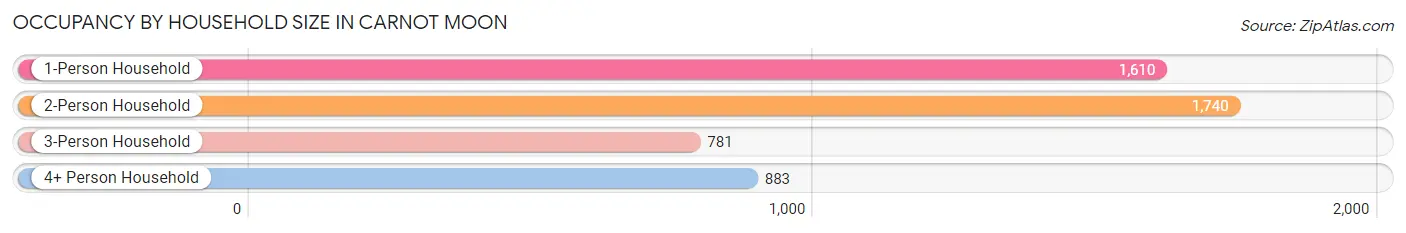
| Household Size | # Housing Units | % Housing Units |
| 1-Person Household | 1,610 | 32.1% |
| 2-Person Household | 1,740 | 34.7% |
| 3-Person Household | 781 | 15.6% |
| 4+ Person Household | 883 | 17.6% |
| Total Housing Units | 5,014 | 100.0% |
Occupancy by Ownership by Household Size in Carnot Moon
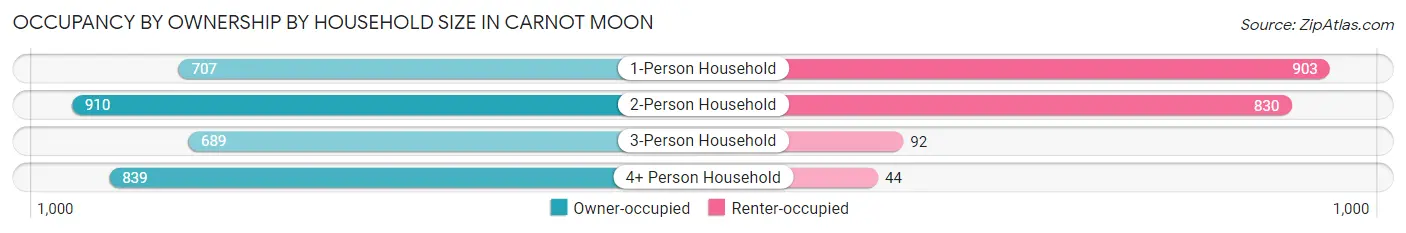
| Household Size | Owner-occupied | Renter-occupied |
| 1-Person Household | 707 (43.9%) | 903 (56.1%) |
| 2-Person Household | 910 (52.3%) | 830 (47.7%) |
| 3-Person Household | 689 (88.2%) | 92 (11.8%) |
| 4+ Person Household | 839 (95.0%) | 44 (5.0%) |
| Total Housing Units | 3,145 (62.7%) | 1,869 (37.3%) |
Occupancy by Educational Attainment in Carnot Moon
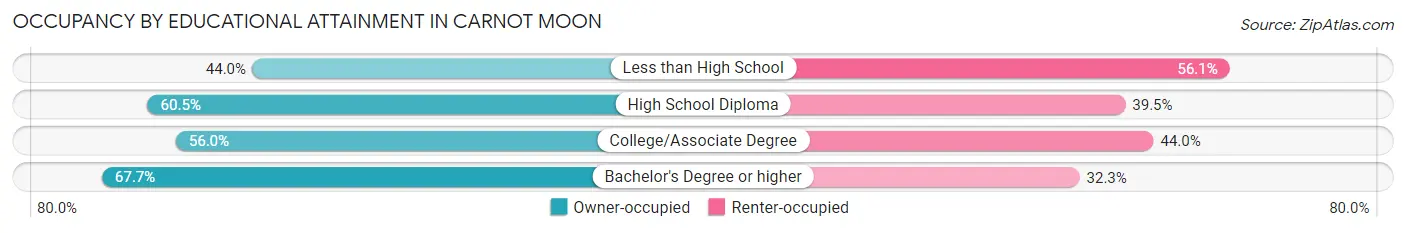
| Household Size | Owner-occupied | Renter-occupied |
| Less than High School | 69 (44.0%) | 88 (56.0%) |
| High School Diploma | 534 (60.5%) | 349 (39.5%) |
| College/Associate Degree | 714 (56.0%) | 561 (44.0%) |
| Bachelor's Degree or higher | 1,828 (67.7%) | 871 (32.3%) |
Occupancy by Age of Householder in Carnot Moon
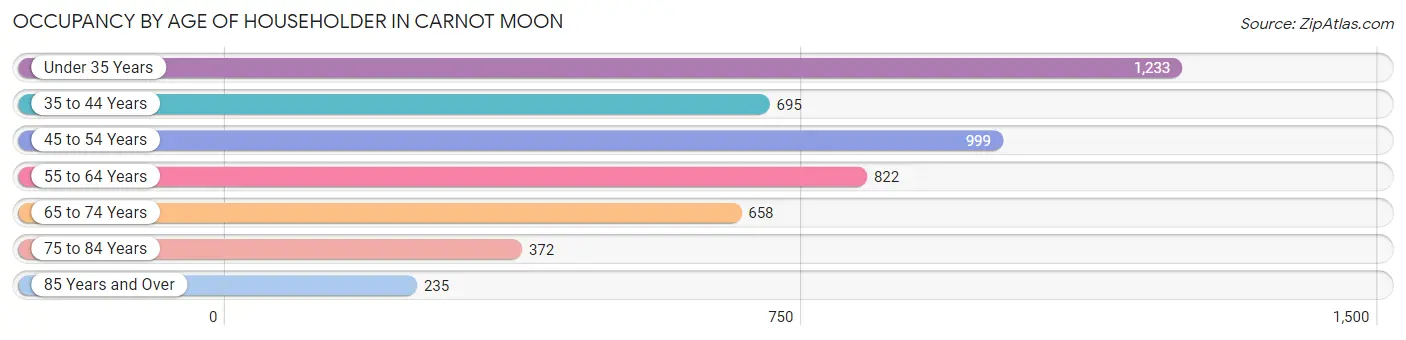
| Age Bracket | # Households | % Households |
| Under 35 Years | 1,233 | 24.6% |
| 35 to 44 Years | 695 | 13.9% |
| 45 to 54 Years | 999 | 19.9% |
| 55 to 64 Years | 822 | 16.4% |
| 65 to 74 Years | 658 | 13.1% |
| 75 to 84 Years | 372 | 7.4% |
| 85 Years and Over | 235 | 4.7% |
| Total | 5,014 | 100.0% |
Housing Finances in Carnot Moon
Median Income by Occupancy in Carnot Moon
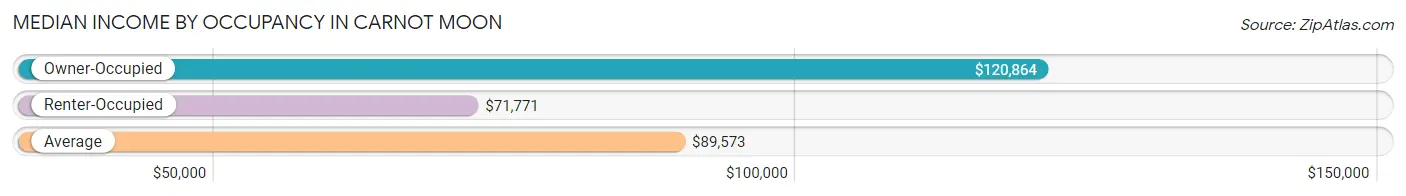
| Occupancy Type | # Households | Median Income |
| Owner-Occupied | 3,145 (62.7%) | $120,864 |
| Renter-Occupied | 1,869 (37.3%) | $71,771 |
| Average | 5,014 (100.0%) | $89,573 |
Occupancy by Householder Income Bracket in Carnot Moon
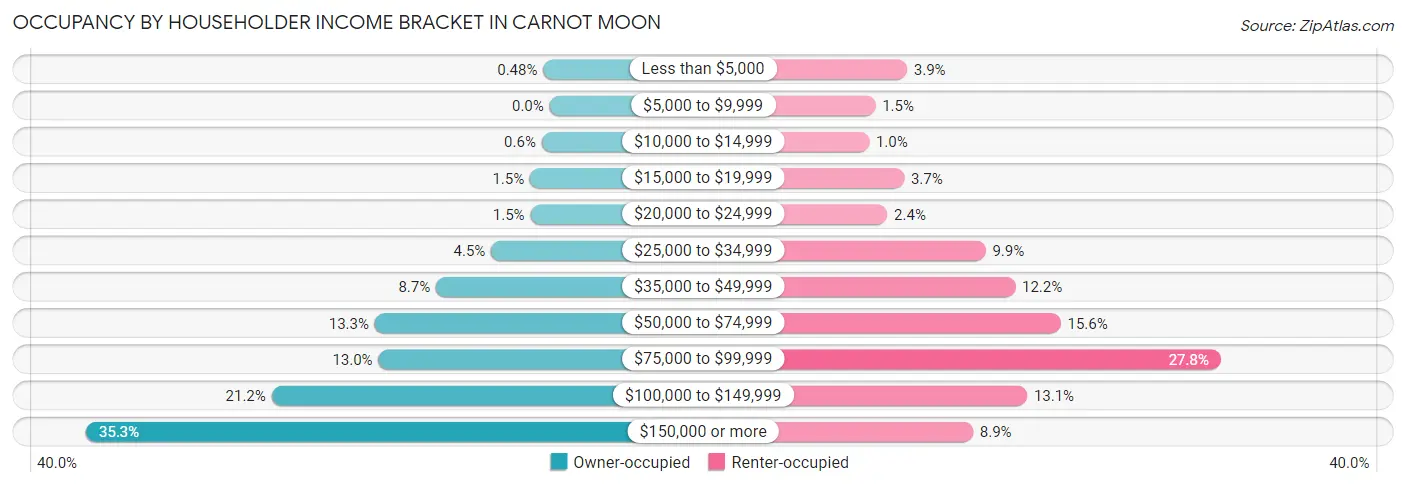
| Income Bracket | Owner-occupied | Renter-occupied |
| Less than $5,000 | 15 (0.5%) | 73 (3.9%) |
| $5,000 to $9,999 | 0 (0.0%) | 28 (1.5%) |
| $10,000 to $14,999 | 19 (0.6%) | 19 (1.0%) |
| $15,000 to $19,999 | 47 (1.5%) | 69 (3.7%) |
| $20,000 to $24,999 | 46 (1.5%) | 45 (2.4%) |
| $25,000 to $34,999 | 140 (4.4%) | 185 (9.9%) |
| $35,000 to $49,999 | 272 (8.6%) | 227 (12.1%) |
| $50,000 to $74,999 | 419 (13.3%) | 292 (15.6%) |
| $75,000 to $99,999 | 410 (13.0%) | 520 (27.8%) |
| $100,000 to $149,999 | 666 (21.2%) | 244 (13.1%) |
| $150,000 or more | 1,111 (35.3%) | 167 (8.9%) |
| Total | 3,145 (100.0%) | 1,869 (100.0%) |
Monthly Housing Cost Tiers in Carnot Moon
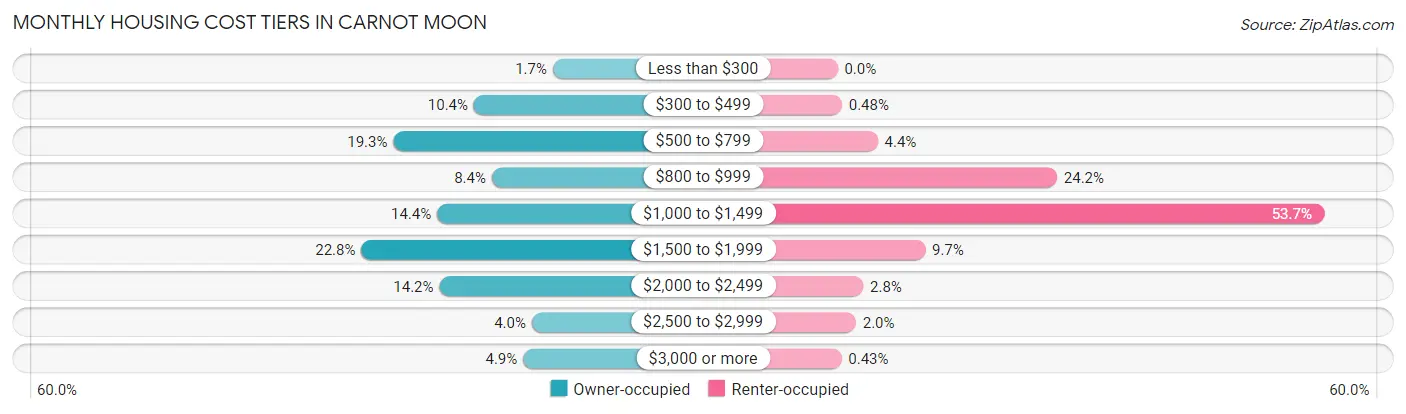
| Monthly Cost | Owner-occupied | Renter-occupied |
| Less than $300 | 52 (1.7%) | 0 (0.0%) |
| $300 to $499 | 326 (10.4%) | 9 (0.5%) |
| $500 to $799 | 606 (19.3%) | 83 (4.4%) |
| $800 to $999 | 264 (8.4%) | 453 (24.2%) |
| $1,000 to $1,499 | 454 (14.4%) | 1,004 (53.7%) |
| $1,500 to $1,999 | 717 (22.8%) | 181 (9.7%) |
| $2,000 to $2,499 | 446 (14.2%) | 53 (2.8%) |
| $2,500 to $2,999 | 125 (4.0%) | 38 (2.0%) |
| $3,000 or more | 155 (4.9%) | 8 (0.4%) |
| Total | 3,145 (100.0%) | 1,869 (100.0%) |
Physical Housing Characteristics in Carnot Moon
Housing Structures in Carnot Moon
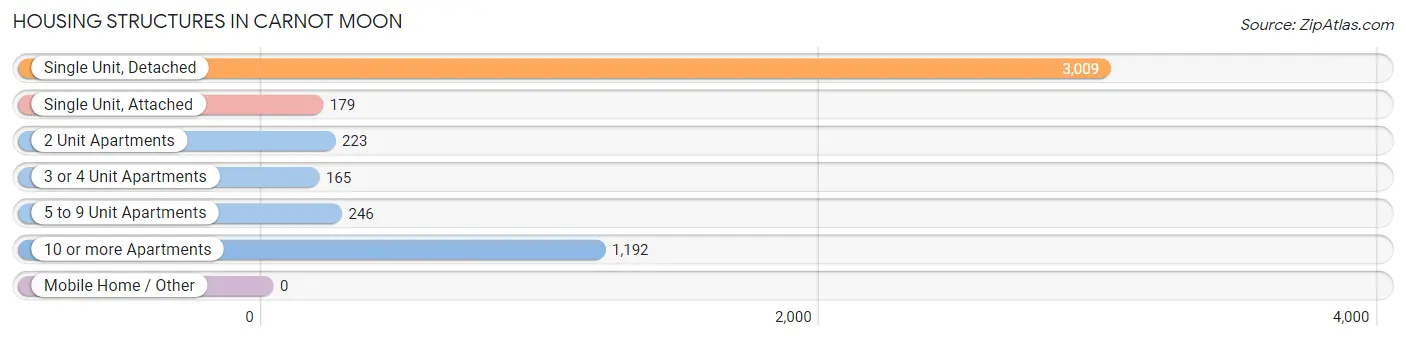
| Structure Type | # Housing Units | % Housing Units |
| Single Unit, Detached | 3,009 | 60.0% |
| Single Unit, Attached | 179 | 3.6% |
| 2 Unit Apartments | 223 | 4.4% |
| 3 or 4 Unit Apartments | 165 | 3.3% |
| 5 to 9 Unit Apartments | 246 | 4.9% |
| 10 or more Apartments | 1,192 | 23.8% |
| Mobile Home / Other | 0 | 0.0% |
| Total | 5,014 | 100.0% |
Housing Structures by Occupancy in Carnot Moon
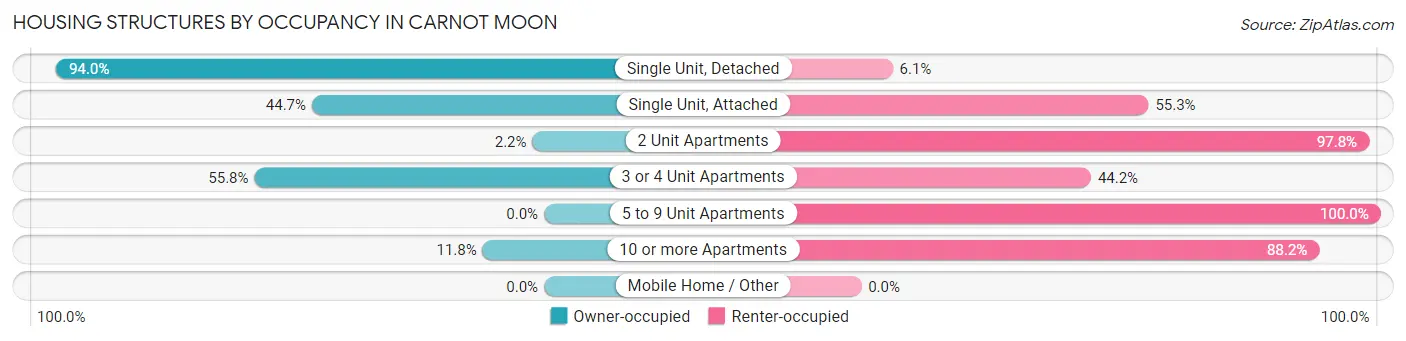
| Structure Type | Owner-occupied | Renter-occupied |
| Single Unit, Detached | 2,827 (94.0%) | 182 (6.0%) |
| Single Unit, Attached | 80 (44.7%) | 99 (55.3%) |
| 2 Unit Apartments | 5 (2.2%) | 218 (97.8%) |
| 3 or 4 Unit Apartments | 92 (55.8%) | 73 (44.2%) |
| 5 to 9 Unit Apartments | 0 (0.0%) | 246 (100.0%) |
| 10 or more Apartments | 141 (11.8%) | 1,051 (88.2%) |
| Mobile Home / Other | 0 (0.0%) | 0 (0.0%) |
| Total | 3,145 (62.7%) | 1,869 (37.3%) |
Housing Structures by Number of Rooms in Carnot Moon
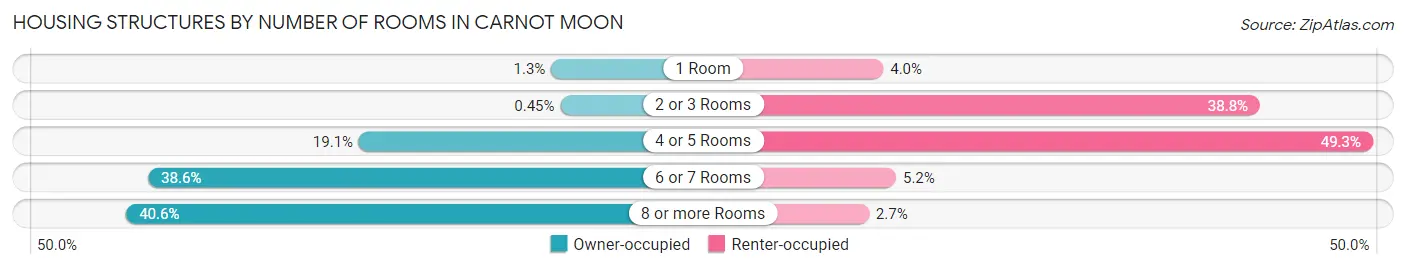
| Number of Rooms | Owner-occupied | Renter-occupied |
| 1 Room | 41 (1.3%) | 75 (4.0%) |
| 2 or 3 Rooms | 14 (0.4%) | 726 (38.8%) |
| 4 or 5 Rooms | 600 (19.1%) | 921 (49.3%) |
| 6 or 7 Rooms | 1,213 (38.6%) | 97 (5.2%) |
| 8 or more Rooms | 1,277 (40.6%) | 50 (2.7%) |
| Total | 3,145 (100.0%) | 1,869 (100.0%) |
Housing Structure by Heating Type in Carnot Moon
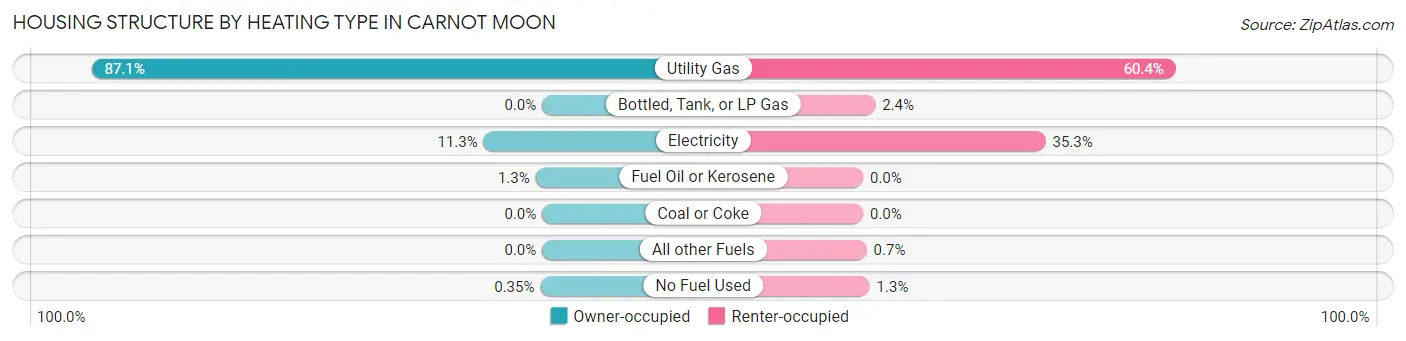
| Heating Type | Owner-occupied | Renter-occupied |
| Utility Gas | 2,738 (87.1%) | 1,129 (60.4%) |
| Bottled, Tank, or LP Gas | 0 (0.0%) | 44 (2.4%) |
| Electricity | 356 (11.3%) | 659 (35.3%) |
| Fuel Oil or Kerosene | 40 (1.3%) | 0 (0.0%) |
| Coal or Coke | 0 (0.0%) | 0 (0.0%) |
| All other Fuels | 0 (0.0%) | 13 (0.7%) |
| No Fuel Used | 11 (0.4%) | 24 (1.3%) |
| Total | 3,145 (100.0%) | 1,869 (100.0%) |
Household Vehicle Usage in Carnot Moon
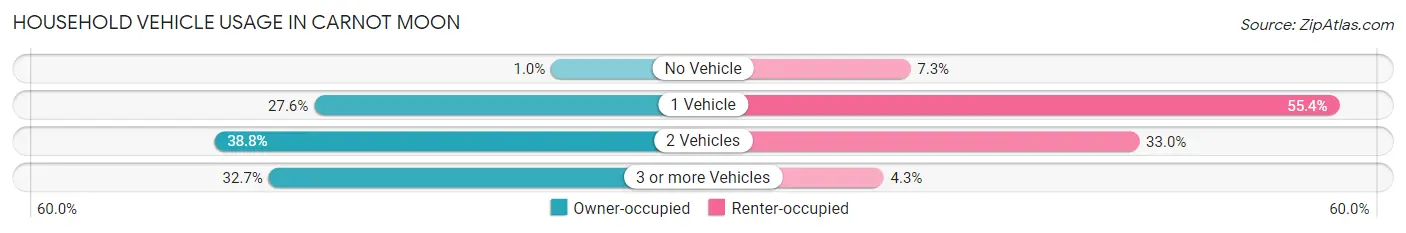
| Vehicles per Household | Owner-occupied | Renter-occupied |
| No Vehicle | 32 (1.0%) | 137 (7.3%) |
| 1 Vehicle | 867 (27.6%) | 1,035 (55.4%) |
| 2 Vehicles | 1,219 (38.8%) | 616 (33.0%) |
| 3 or more Vehicles | 1,027 (32.7%) | 81 (4.3%) |
| Total | 3,145 (100.0%) | 1,869 (100.0%) |
Real Estate & Mortgages in Carnot Moon
Real Estate and Mortgage Overview in Carnot Moon
| Characteristic | Without Mortgage | With Mortgage |
| Housing Units | 1,170 | 1,975 |
| Median Property Value | $195,600 | $247,700 |
| Median Household Income | $78,779 | $844 |
| Monthly Housing Costs | $624 | $155 |
| Real Estate Taxes | $3,200 | $21 |
Property Value by Mortgage Status in Carnot Moon
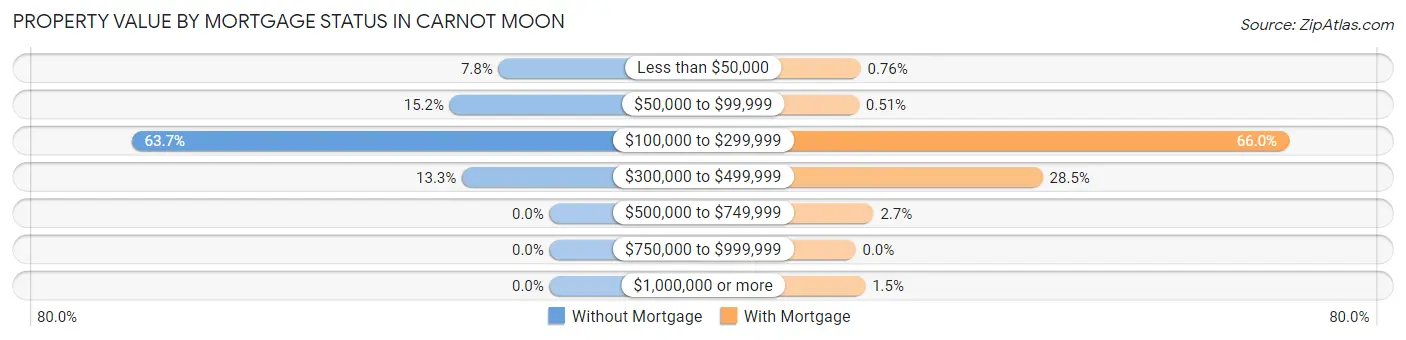
| Property Value | Without Mortgage | With Mortgage |
| Less than $50,000 | 91 (7.8%) | 15 (0.8%) |
| $50,000 to $99,999 | 178 (15.2%) | 10 (0.5%) |
| $100,000 to $299,999 | 745 (63.7%) | 1,304 (66.0%) |
| $300,000 to $499,999 | 156 (13.3%) | 563 (28.5%) |
| $500,000 to $749,999 | 0 (0.0%) | 54 (2.7%) |
| $750,000 to $999,999 | 0 (0.0%) | 0 (0.0%) |
| $1,000,000 or more | 0 (0.0%) | 29 (1.5%) |
| Total | 1,170 (100.0%) | 1,975 (100.0%) |
Household Income by Mortgage Status in Carnot Moon
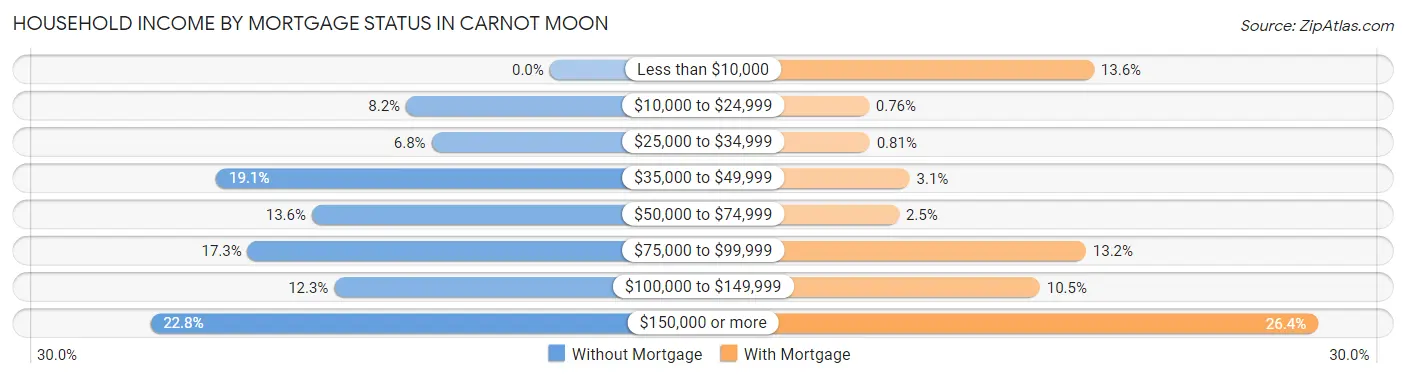
| Household Income | Without Mortgage | With Mortgage |
| Less than $10,000 | 0 (0.0%) | 269 (13.6%) |
| $10,000 to $24,999 | 96 (8.2%) | 15 (0.8%) |
| $25,000 to $34,999 | 79 (6.8%) | 16 (0.8%) |
| $35,000 to $49,999 | 223 (19.1%) | 61 (3.1%) |
| $50,000 to $74,999 | 159 (13.6%) | 49 (2.5%) |
| $75,000 to $99,999 | 202 (17.3%) | 260 (13.2%) |
| $100,000 to $149,999 | 144 (12.3%) | 208 (10.5%) |
| $150,000 or more | 267 (22.8%) | 522 (26.4%) |
| Total | 1,170 (100.0%) | 1,975 (100.0%) |
Property Value to Household Income Ratio in Carnot Moon
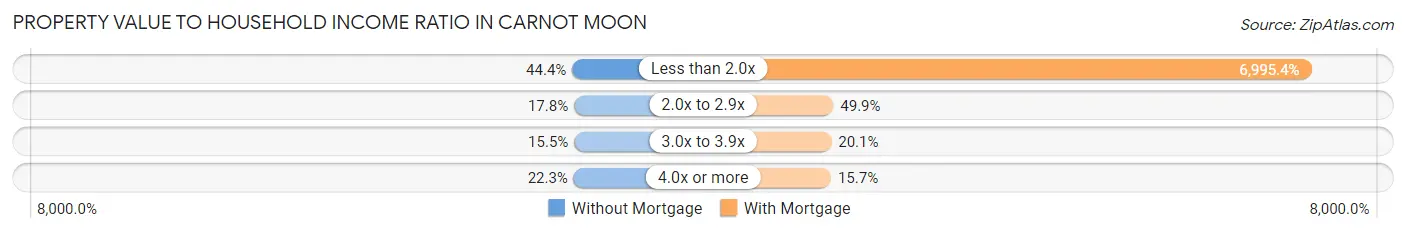
| Value-to-Income Ratio | Without Mortgage | With Mortgage |
| Less than 2.0x | 520 (44.4%) | 138,159 (6,995.4%) |
| 2.0x to 2.9x | 208 (17.8%) | 985 (49.9%) |
| 3.0x to 3.9x | 181 (15.5%) | 397 (20.1%) |
| 4.0x or more | 261 (22.3%) | 310 (15.7%) |
| Total | 1,170 (100.0%) | 1,975 (100.0%) |
Real Estate Taxes by Mortgage Status in Carnot Moon
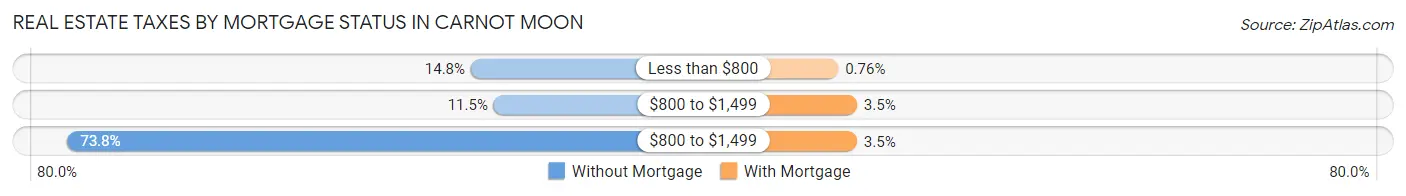
| Property Taxes | Without Mortgage | With Mortgage |
| Less than $800 | 173 (14.8%) | 15 (0.8%) |
| $800 to $1,499 | 134 (11.5%) | 69 (3.5%) |
| $800 to $1,499 | 863 (73.8%) | 69 (3.5%) |
| Total | 1,170 (100.0%) | 1,975 (100.0%) |
Health & Disability in Carnot Moon
Health Insurance Coverage by Age in Carnot Moon
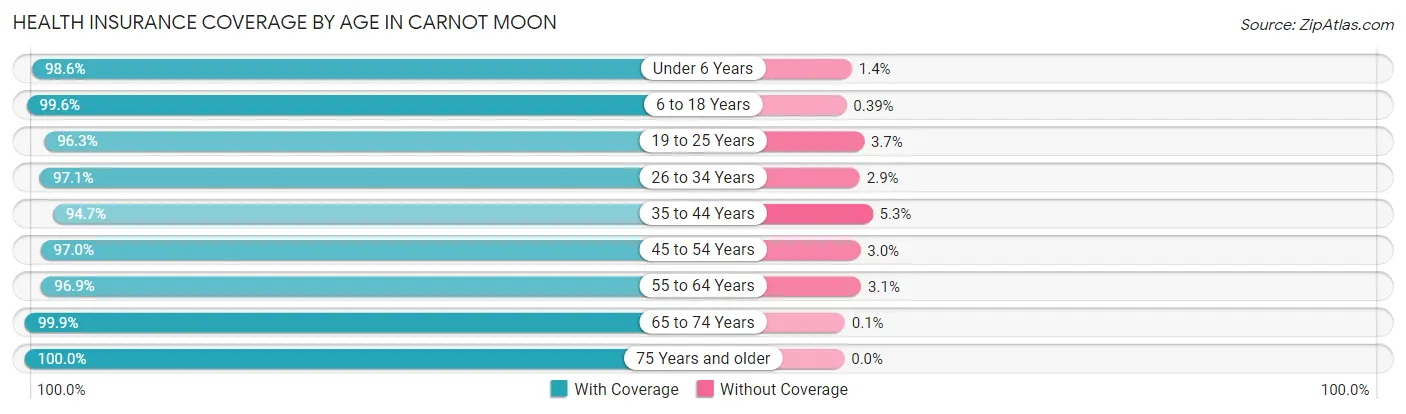
| Age Bracket | With Coverage | Without Coverage |
| Under 6 Years | 561 (98.6%) | 8 (1.4%) |
| 6 to 18 Years | 2,018 (99.6%) | 8 (0.4%) |
| 19 to 25 Years | 2,231 (96.3%) | 85 (3.7%) |
| 26 to 34 Years | 1,872 (97.1%) | 56 (2.9%) |
| 35 to 44 Years | 1,382 (94.7%) | 77 (5.3%) |
| 45 to 54 Years | 1,559 (97.0%) | 48 (3.0%) |
| 55 to 64 Years | 1,482 (96.9%) | 48 (3.1%) |
| 65 to 74 Years | 1,033 (99.9%) | 1 (0.1%) |
| 75 Years and older | 843 (100.0%) | 0 (0.0%) |
| Total | 12,981 (97.5%) | 331 (2.5%) |
Health Insurance Coverage by Citizenship Status in Carnot Moon
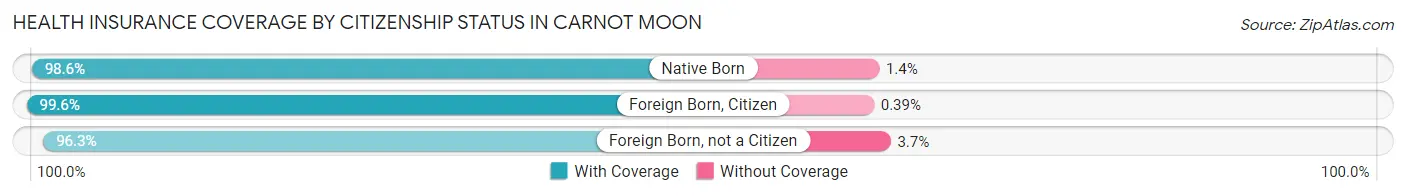
| Citizenship Status | With Coverage | Without Coverage |
| Native Born | 561 (98.6%) | 8 (1.4%) |
| Foreign Born, Citizen | 2,018 (99.6%) | 8 (0.4%) |
| Foreign Born, not a Citizen | 2,231 (96.3%) | 85 (3.7%) |
Health Insurance Coverage by Household Income in Carnot Moon
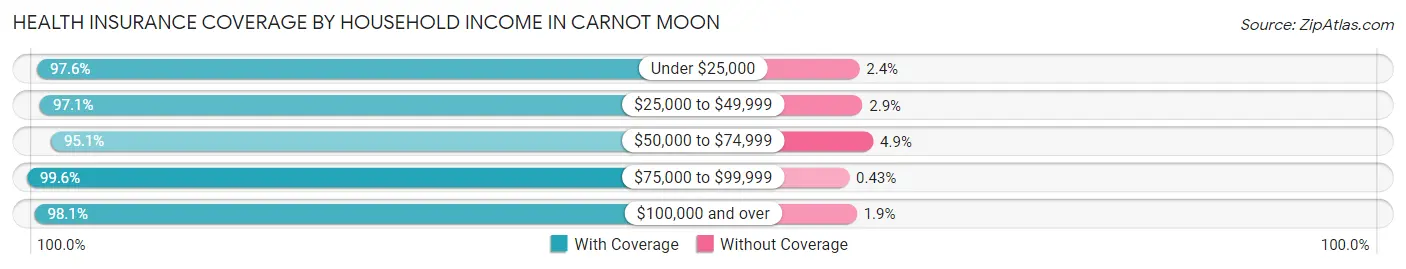
| Household Income | With Coverage | Without Coverage |
| Under $25,000 | 455 (97.6%) | 11 (2.4%) |
| $25,000 to $49,999 | 1,166 (97.1%) | 35 (2.9%) |
| $50,000 to $74,999 | 1,154 (95.1%) | 60 (4.9%) |
| $75,000 to $99,999 | 1,845 (99.6%) | 8 (0.4%) |
| $100,000 and over | 6,899 (98.1%) | 131 (1.9%) |
Public vs Private Health Insurance Coverage by Age in Carnot Moon
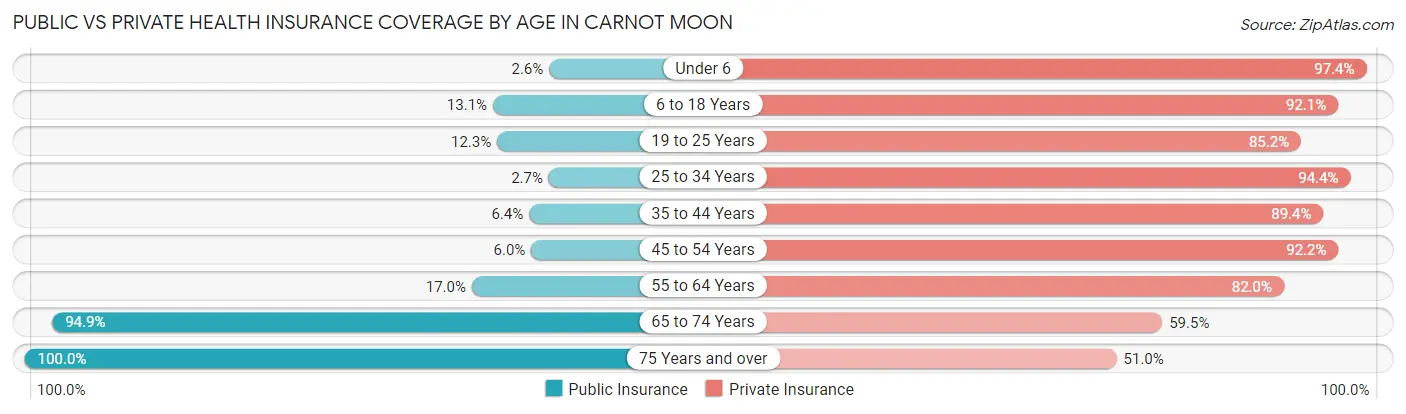
| Age Bracket | Public Insurance | Private Insurance |
| Under 6 | 15 (2.6%) | 554 (97.4%) |
| 6 to 18 Years | 265 (13.1%) | 1,866 (92.1%) |
| 19 to 25 Years | 285 (12.3%) | 1,974 (85.2%) |
| 25 to 34 Years | 52 (2.7%) | 1,820 (94.4%) |
| 35 to 44 Years | 93 (6.4%) | 1,304 (89.4%) |
| 45 to 54 Years | 96 (6.0%) | 1,481 (92.2%) |
| 55 to 64 Years | 260 (17.0%) | 1,255 (82.0%) |
| 65 to 74 Years | 981 (94.9%) | 615 (59.5%) |
| 75 Years and over | 843 (100.0%) | 430 (51.0%) |
| Total | 2,890 (21.7%) | 11,299 (84.9%) |
Disability Status by Sex by Age in Carnot Moon
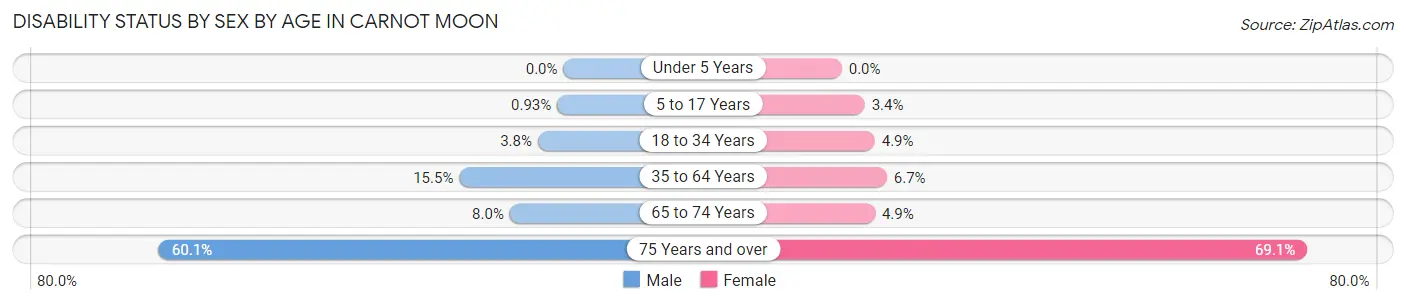
| Age Bracket | Male | Female |
| Under 5 Years | 0 (0.0%) | 0 (0.0%) |
| 5 to 17 Years | 8 (0.9%) | 24 (3.4%) |
| 18 to 34 Years | 80 (3.8%) | 133 (4.9%) |
| 35 to 64 Years | 350 (15.5%) | 156 (6.7%) |
| 65 to 74 Years | 37 (8.0%) | 28 (4.9%) |
| 75 Years and over | 242 (60.1%) | 304 (69.1%) |
Disability Class by Sex by Age in Carnot Moon
Disability Class: Hearing Difficulty
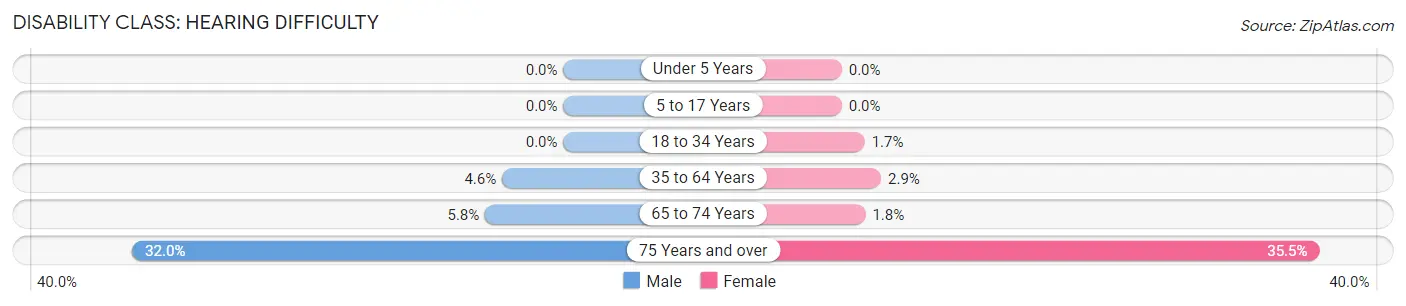
| Age Bracket | Male | Female |
| Under 5 Years | 0 (0.0%) | 0 (0.0%) |
| 5 to 17 Years | 0 (0.0%) | 0 (0.0%) |
| 18 to 34 Years | 0 (0.0%) | 46 (1.7%) |
| 35 to 64 Years | 103 (4.5%) | 68 (2.9%) |
| 65 to 74 Years | 27 (5.8%) | 10 (1.8%) |
| 75 Years and over | 129 (32.0%) | 156 (35.4%) |
Disability Class: Vision Difficulty
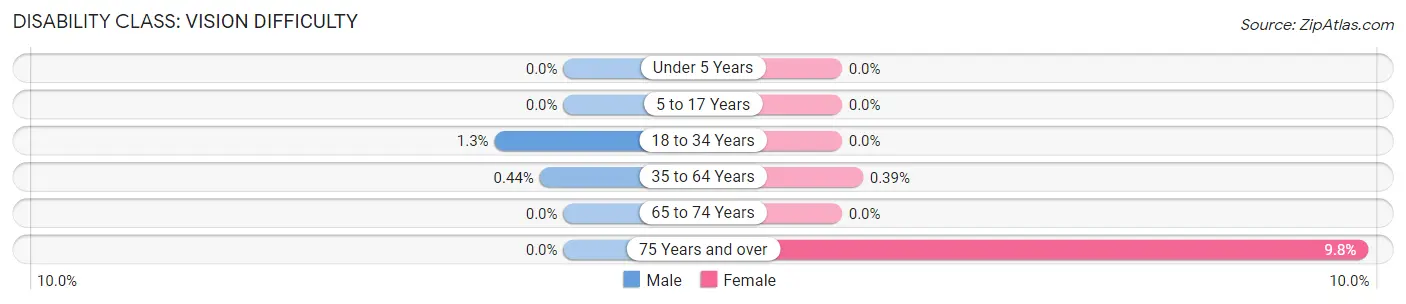
| Age Bracket | Male | Female |
| Under 5 Years | 0 (0.0%) | 0 (0.0%) |
| 5 to 17 Years | 0 (0.0%) | 0 (0.0%) |
| 18 to 34 Years | 27 (1.3%) | 0 (0.0%) |
| 35 to 64 Years | 10 (0.4%) | 9 (0.4%) |
| 65 to 74 Years | 0 (0.0%) | 0 (0.0%) |
| 75 Years and over | 0 (0.0%) | 43 (9.8%) |
Disability Class: Cognitive Difficulty
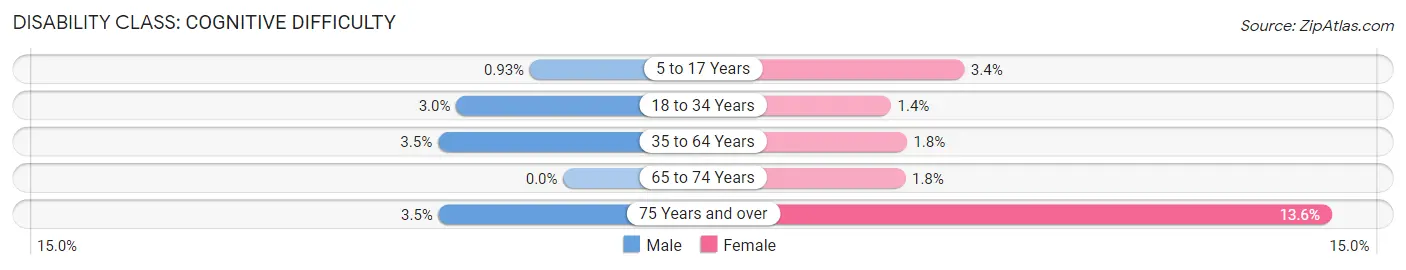
| Age Bracket | Male | Female |
| 5 to 17 Years | 8 (0.9%) | 24 (3.4%) |
| 18 to 34 Years | 63 (3.0%) | 37 (1.4%) |
| 35 to 64 Years | 79 (3.5%) | 42 (1.8%) |
| 65 to 74 Years | 0 (0.0%) | 10 (1.8%) |
| 75 Years and over | 14 (3.5%) | 60 (13.6%) |
Disability Class: Ambulatory Difficulty
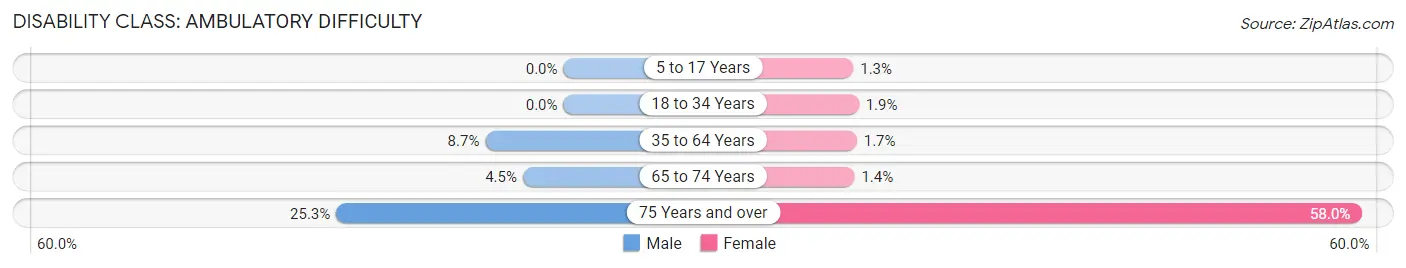
| Age Bracket | Male | Female |
| 5 to 17 Years | 0 (0.0%) | 9 (1.3%) |
| 18 to 34 Years | 0 (0.0%) | 51 (1.9%) |
| 35 to 64 Years | 197 (8.7%) | 39 (1.7%) |
| 65 to 74 Years | 21 (4.5%) | 8 (1.4%) |
| 75 Years and over | 102 (25.3%) | 255 (58.0%) |
Disability Class: Self-Care Difficulty
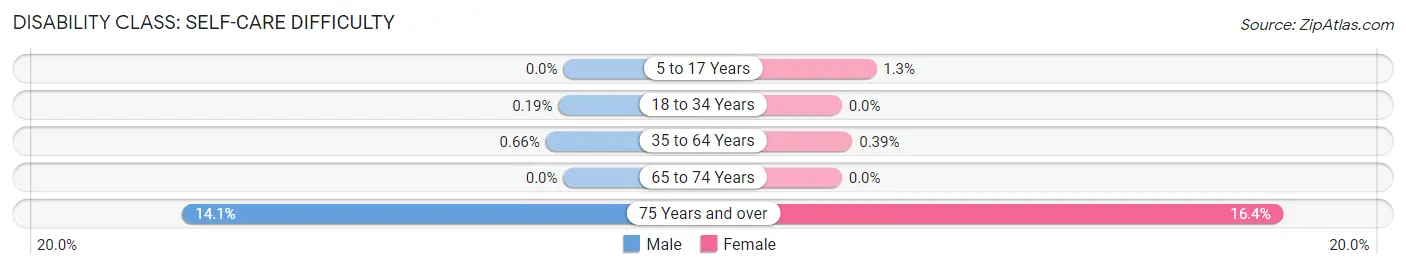
| Age Bracket | Male | Female |
| 5 to 17 Years | 0 (0.0%) | 9 (1.3%) |
| 18 to 34 Years | 4 (0.2%) | 0 (0.0%) |
| 35 to 64 Years | 15 (0.7%) | 9 (0.4%) |
| 65 to 74 Years | 0 (0.0%) | 0 (0.0%) |
| 75 Years and over | 57 (14.1%) | 72 (16.4%) |
Technology Access in Carnot Moon
Computing Device Access in Carnot Moon
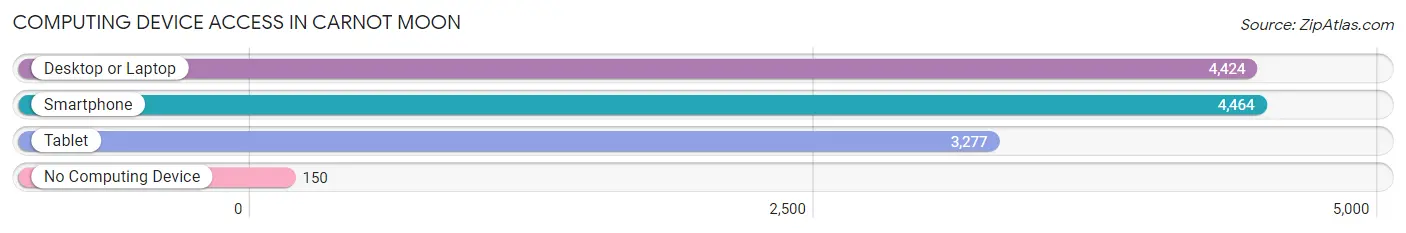
| Device Type | # Households | % Households |
| Desktop or Laptop | 4,424 | 88.2% |
| Smartphone | 4,464 | 89.0% |
| Tablet | 3,277 | 65.4% |
| No Computing Device | 150 | 3.0% |
| Total | 5,014 | 100.0% |
Internet Access in Carnot Moon
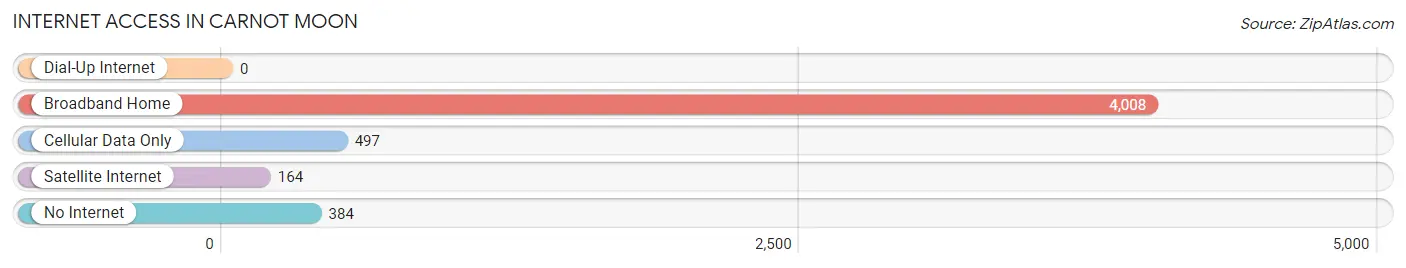
| Internet Type | # Households | % Households |
| Dial-Up Internet | 0 | 0.0% |
| Broadband Home | 4,008 | 79.9% |
| Cellular Data Only | 497 | 9.9% |
| Satellite Internet | 164 | 3.3% |
| No Internet | 384 | 7.7% |
| Total | 5,014 | 100.0% |
Carnot Moon Summary
Carnot Moon is a borough located in Beaver County, Pennsylvania. It is situated along the Ohio River, approximately 25 miles northwest of Pittsburgh. The population was 1,845 at the 2010 census.
History
Carnot Moon was founded in 1832 by a group of settlers from the nearby town of Moon Township. The town was named after French scientist Sadi Carnot, who developed the Carnot cycle, a thermodynamic cycle used to measure the efficiency of a heat engine. The town was incorporated in 1867.
Geography
Carnot Moon is located at 40°37'17" North, 80°20'45" West (40.6214, -80.3458). According to the United States Census Bureau, the borough has a total area of 0.7 square miles, all of it land.
Economy
Carnot Moon is a small, rural community with a limited economy. The primary industries are agriculture and tourism. The town is home to several small businesses, including a grocery store, a hardware store, and a few restaurants.
Demographics
As of the census of 2000, there were 1,845 people, 745 households, and 517 families residing in the borough. The population density was 2,637.2 people per square mile (1,017.2/km²). There were 790 housing units at an average density of 1,125.2 per square mile (433.3/km²). The racial makeup of the borough was 98.7% White, 0.3% African American, 0.2% Native American, 0.2% Asian, 0.1% from other races, and 0.5% from two or more races. Hispanic or Latino of any race were 0.7% of the population.
There were 745 households, out of which 28.2% had children under the age of 18 living with them, 54.2% were married couples living together, 10.2% had a female householder with no husband present, and 31.7% were non-families. 28.2% of all households were made up of individuals, and 14.2% had someone living alone who was 65 years of age or older. The average household size was 2.47 and the average family size was 3.03.
In the borough the population was spread out, with 23.2% under the age of 18, 7.2% from 18 to 24, 28.2% from 25 to 44, 24.2% from 45 to 64, and 17.2% who were 65 years of age or older. The median age was 40 years. For every 100 females, there were 92.2 males. For every 100 females age 18 and over, there were 88.2 males.
The median income for a household in the borough was $37,500, and the median income for a family was $45,000. Males had a median income of $35,000 versus $22,500 for females. The per capita income for the borough was $17,945. About 5.2% of families and 7.2% of the population were below the poverty line, including 8.2% of those under age 18 and 8.2% of those age 65 or over.
Common Questions
What is the Total Population of Carnot Moon?
Total Population of Carnot Moon is 13,345.
What is the Total Male Population of Carnot Moon?
Total Male Population of Carnot Moon is 6,340.
What is the Total Female Population of Carnot Moon?
Total Female Population of Carnot Moon is 7,005.
What is the Ratio of Males per 100 Females in Carnot Moon?
There are 90.51 Males per 100 Females in Carnot Moon.
What is the Ratio of Females per 100 Males in Carnot Moon?
There are 110.49 Females per 100 Males in Carnot Moon.
What is the Median Population Age in Carnot Moon?
Median Population Age in Carnot Moon is 33.3 Years.
What is the Average Family Size in Carnot Moon
Average Family Size in Carnot Moon is 3.1 People.
What is the Average Household Size in Carnot Moon
Average Household Size in Carnot Moon is 2.4 People.
What is Per Capita Income in Carnot Moon?
Per Capita income in Carnot Moon is $46,486.
What is the Median Family Income in Carnot Moon?
Median Family Income in Carnot Moon is $132,683.
What is the Median Household income in Carnot Moon?
Median Household Income in Carnot Moon is $89,573.
What is Income or Wage Gap in Carnot Moon?
Income or Wage Gap in Carnot Moon is 38.6%.
Women in Carnot Moon earn 61.4 cents for every dollar earned by a man.
What is Inequality or Gini Index in Carnot Moon?
Inequality or Gini Index in Carnot Moon is 0.42.
How Large is the Labor Force in Carnot Moon?
There are 7,910 People in the Labor Forcein in Carnot Moon.
What is the Percentage of People in the Labor Force in Carnot Moon?
68.2% of People are in the Labor Force in Carnot Moon.
What is the Unemployment Rate in Carnot Moon?
Unemployment Rate in Carnot Moon is 5.9%.