Shiloh, PA
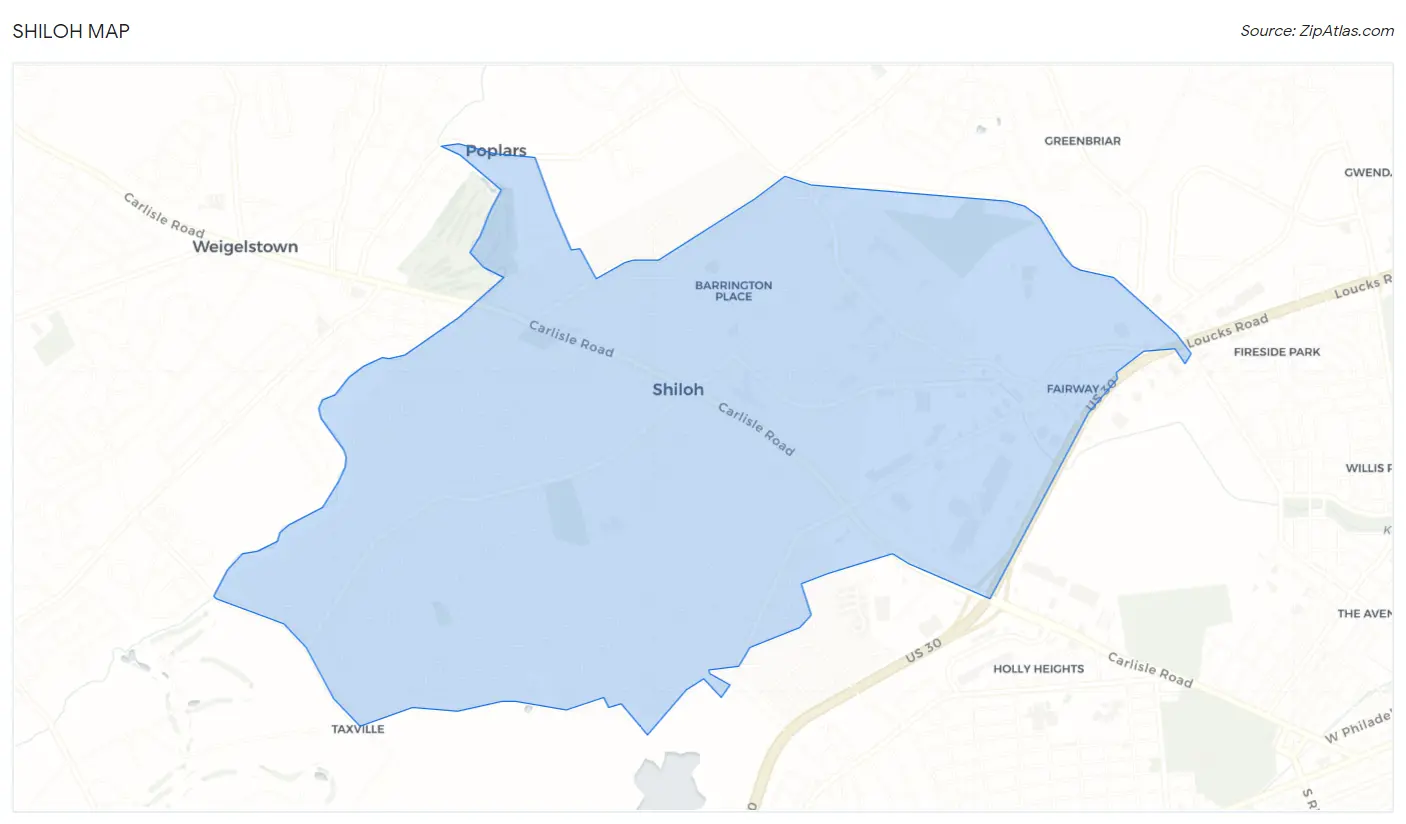
Shiloh Map
Shiloh Overview
11,290
TOTAL POPULATION
5,714
MALE POPULATION
5,576
FEMALE POPULATION
102.47
MALES / 100 FEMALES
97.58
FEMALES / 100 MALES
47.0
MEDIAN AGE
2.9
AVG FAMILY SIZE
2.3
AVG HOUSEHOLD SIZE
$40,918
PER CAPITA INCOME
$116,951
AVG FAMILY INCOME
$78,750
AVG HOUSEHOLD INCOME
38.4%
WAGE / INCOME GAP [ % ]
61.6¢/ $1
WAGE / INCOME GAP [ $ ]
0.39
INEQUALITY / GINI INDEX
6,230
LABOR FORCE [ PEOPLE ]
63.6%
PERCENT IN LABOR FORCE
1.3%
UNEMPLOYMENT RATE
Race in Shiloh
The most populous races in Shiloh are White / Caucasian (9,311 | 82.5%), Hispanic or Latino (1,321 | 11.7%), and Two or more Races (703 | 6.2%).
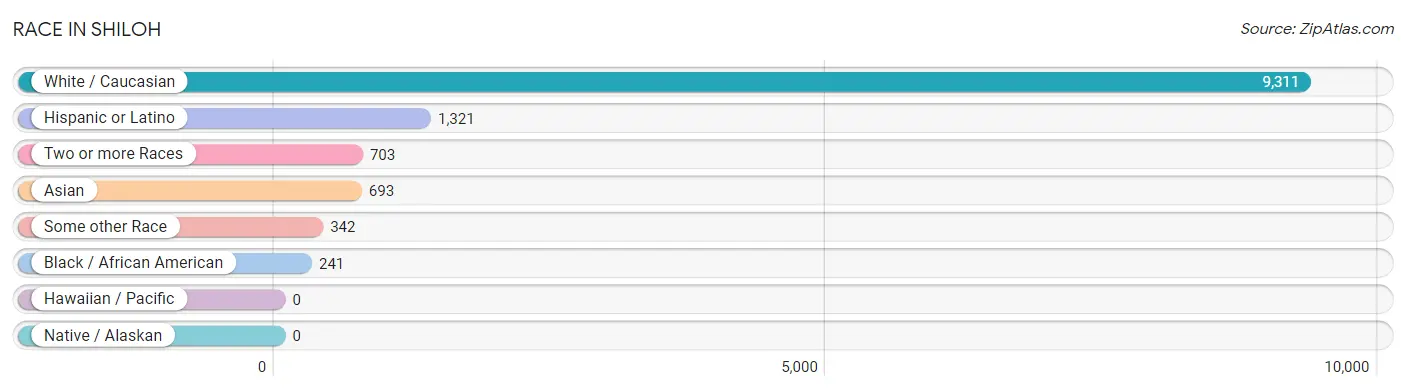
| Race | # Population | % Population |
| Asian | 693 | 6.1% |
| Black / African American | 241 | 2.1% |
| Hawaiian / Pacific | 0 | 0.0% |
| Hispanic or Latino | 1,321 | 11.7% |
| Native / Alaskan | 0 | 0.0% |
| White / Caucasian | 9,311 | 82.5% |
| Two or more Races | 703 | 6.2% |
| Some other Race | 342 | 3.0% |
| Total | 11,290 | 100.0% |
Ancestry in Shiloh
The most populous ancestries reported in Shiloh are German (4,014 | 35.5%), Puerto Rican (1,195 | 10.6%), Irish (889 | 7.9%), English (886 | 7.9%), and Italian (814 | 7.2%), together accounting for 69.1% of all Shiloh residents.
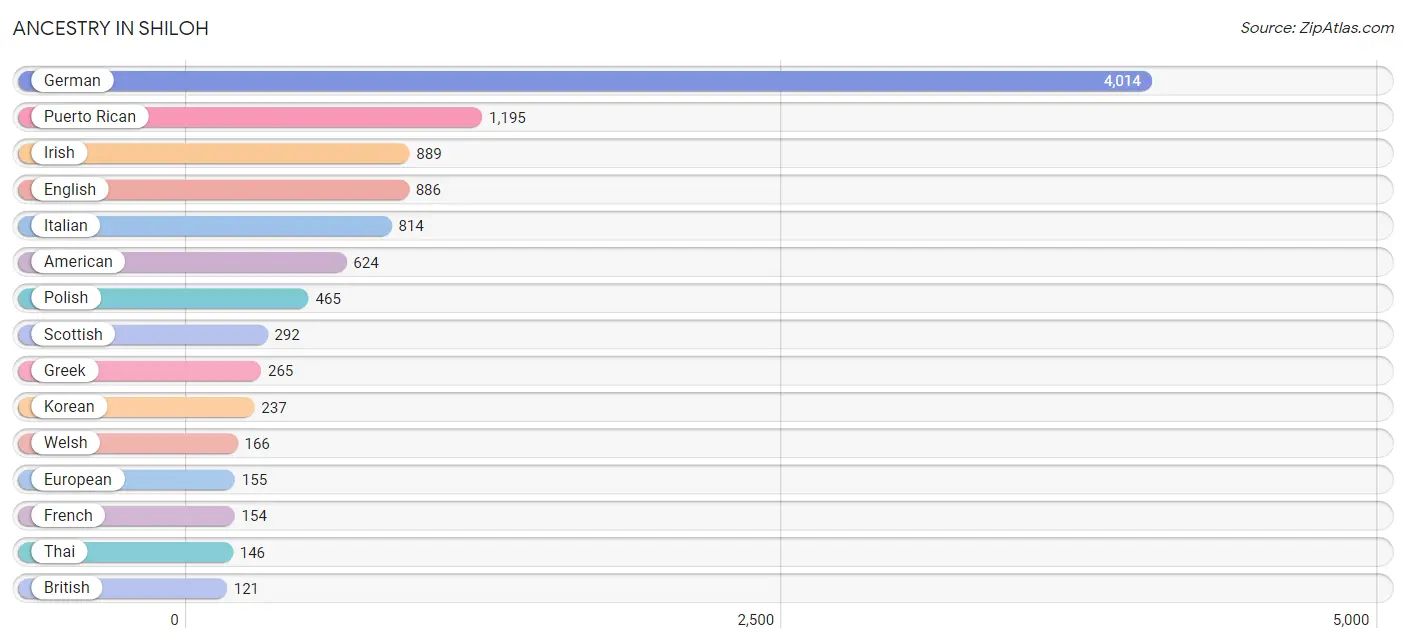
| Ancestry | # Population | % Population |
| African | 64 | 0.6% |
| American | 624 | 5.5% |
| Australian | 18 | 0.2% |
| Austrian | 7 | 0.1% |
| Bhutanese | 14 | 0.1% |
| Brazilian | 83 | 0.7% |
| British | 121 | 1.1% |
| Burmese | 76 | 0.7% |
| Cherokee | 42 | 0.4% |
| Cuban | 15 | 0.1% |
| Dominican | 55 | 0.5% |
| Dutch | 99 | 0.9% |
| Eastern European | 4 | 0.0% |
| English | 886 | 7.9% |
| European | 155 | 1.4% |
| French | 154 | 1.4% |
| French Canadian | 23 | 0.2% |
| German | 4,014 | 35.5% |
| Greek | 265 | 2.4% |
| Haitian | 20 | 0.2% |
| Hungarian | 27 | 0.2% |
| Irish | 889 | 7.9% |
| Italian | 814 | 7.2% |
| Japanese | 7 | 0.1% |
| Korean | 237 | 2.1% |
| Lithuanian | 63 | 0.6% |
| Mexican | 45 | 0.4% |
| Northern European | 32 | 0.3% |
| Norwegian | 29 | 0.3% |
| Pennsylvania German | 90 | 0.8% |
| Polish | 465 | 4.1% |
| Portuguese | 38 | 0.3% |
| Puerto Rican | 1,195 | 10.6% |
| Russian | 20 | 0.2% |
| Scandinavian | 34 | 0.3% |
| Scotch-Irish | 39 | 0.4% |
| Scottish | 292 | 2.6% |
| Slovak | 71 | 0.6% |
| Sri Lankan | 110 | 1.0% |
| Subsaharan African | 64 | 0.6% |
| Swedish | 23 | 0.2% |
| Swiss | 94 | 0.8% |
| Thai | 146 | 1.3% |
| Ukrainian | 11 | 0.1% |
| Welsh | 166 | 1.5% | View All 45 Rows |
Immigrants in Shiloh
The most numerous immigrant groups reported in Shiloh came from Asia (500 | 4.4%), South Central Asia (252 | 2.2%), South Eastern Asia (228 | 2.0%), Philippines (165 | 1.5%), and India (127 | 1.1%), together accounting for 11.3% of all Shiloh residents.
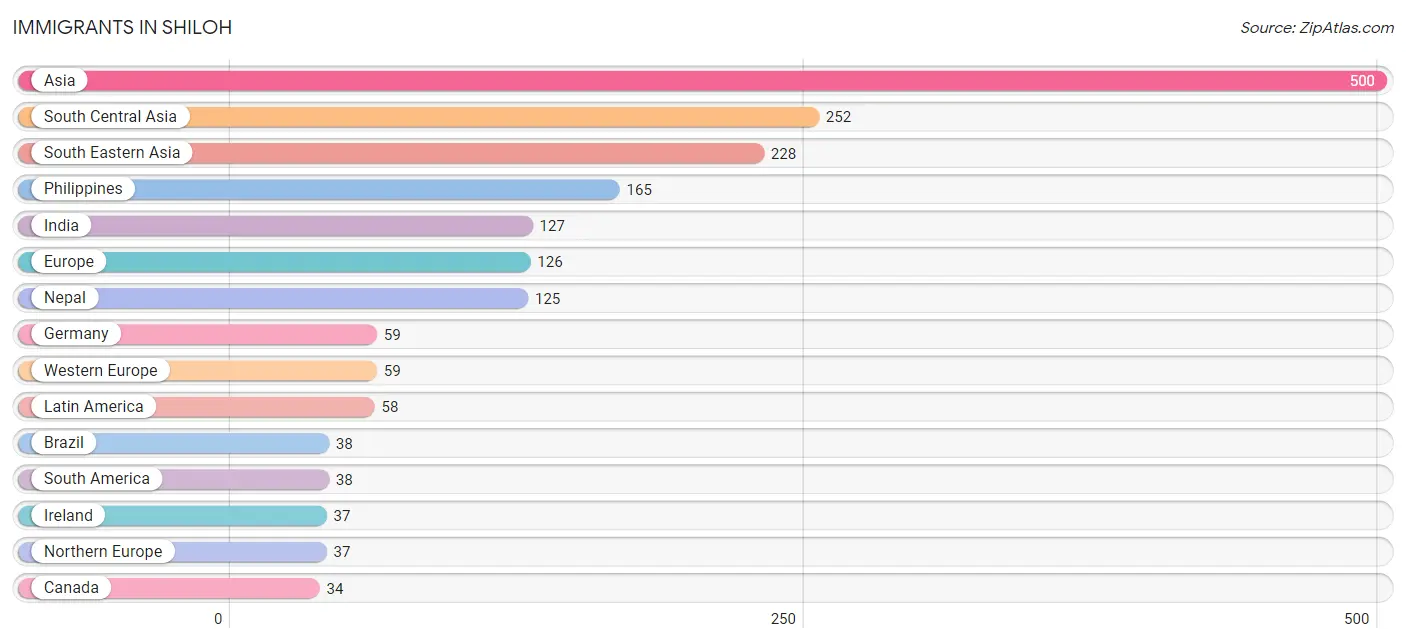
| Immigration Origin | # Population | % Population |
| Asia | 500 | 4.4% |
| Brazil | 38 | 0.3% |
| Cambodia | 12 | 0.1% |
| Canada | 34 | 0.3% |
| Caribbean | 20 | 0.2% |
| Eastern Asia | 20 | 0.2% |
| Europe | 126 | 1.1% |
| Germany | 59 | 0.5% |
| Greece | 30 | 0.3% |
| Haiti | 20 | 0.2% |
| India | 127 | 1.1% |
| Ireland | 37 | 0.3% |
| Korea | 20 | 0.2% |
| Laos | 27 | 0.2% |
| Latin America | 58 | 0.5% |
| Nepal | 125 | 1.1% |
| Northern Europe | 37 | 0.3% |
| Philippines | 165 | 1.5% |
| South America | 38 | 0.3% |
| South Central Asia | 252 | 2.2% |
| South Eastern Asia | 228 | 2.0% |
| Southern Europe | 30 | 0.3% |
| Vietnam | 24 | 0.2% |
| Western Europe | 59 | 0.5% | View All 24 Rows |
Sex and Age in Shiloh
Sex and Age in Shiloh
The most populous age groups in Shiloh are 55 to 59 Years (574 | 10.1%) for men and 45 to 49 Years (613 | 11.0%) for women.
| Age Bracket | Male | Female |
| Under 5 Years | 342 (6.0%) | 193 (3.5%) |
| 5 to 9 Years | 231 (4.0%) | 250 (4.5%) |
| 10 to 14 Years | 183 (3.2%) | 177 (3.2%) |
| 15 to 19 Years | 468 (8.2%) | 352 (6.3%) |
| 20 to 24 Years | 318 (5.6%) | 393 (7.0%) |
| 25 to 29 Years | 460 (8.1%) | 272 (4.9%) |
| 30 to 34 Years | 129 (2.3%) | 304 (5.4%) |
| 35 to 39 Years | 413 (7.2%) | 228 (4.1%) |
| 40 to 44 Years | 326 (5.7%) | 279 (5.0%) |
| 45 to 49 Years | 435 (7.6%) | 613 (11.0%) |
| 50 to 54 Years | 353 (6.2%) | 430 (7.7%) |
| 55 to 59 Years | 574 (10.1%) | 310 (5.6%) |
| 60 to 64 Years | 316 (5.5%) | 352 (6.3%) |
| 65 to 69 Years | 275 (4.8%) | 483 (8.7%) |
| 70 to 74 Years | 302 (5.3%) | 281 (5.0%) |
| 75 to 79 Years | 164 (2.9%) | 268 (4.8%) |
| 80 to 84 Years | 170 (3.0%) | 208 (3.7%) |
| 85 Years and over | 255 (4.5%) | 183 (3.3%) |
| Total | 5,714 (100.0%) | 5,576 (100.0%) |
Families and Households in Shiloh
Median Family Size in Shiloh
The median family size in Shiloh is 2.93 persons per family, with single male/father families (14 | 0.5%) accounting for the largest median family size of 5.93 persons per family. On the other hand, single female/mother families (293 | 9.5%) represent the smallest median family size with 2.61 persons per family.
| Family Type | # Families | Family Size |
| Married-Couple | 2,766 (90.0%) | 2.94 |
| Single Male/Father | 14 (0.5%) | 5.93 |
| Single Female/Mother | 293 (9.5%) | 2.61 |
| Total Families | 3,073 (100.0%) | 2.93 |
Median Household Size in Shiloh
The median household size in Shiloh is 2.32 persons per household, with single male/father households (14 | 0.3%) accounting for the largest median household size of 6.43 persons per household. non-family households (1,634 | 34.7%) represent the smallest median household size with 1.12 persons per household.
| Household Type | # Households | Household Size |
| Married-Couple | 2,766 (58.8%) | 2.96 |
| Single Male/Father | 14 (0.3%) | 6.43 |
| Single Female/Mother | 293 (6.2%) | 2.68 |
| Non-family | 1,634 (34.7%) | 1.12 |
| Total Households | 4,707 (100.0%) | 2.32 |
Household Size by Marriage Status in Shiloh
Out of a total of 4,707 households in Shiloh, 3,073 (65.3%) are family households, while 1,634 (34.7%) are nonfamily households. The most numerous type of family households are 2-person households, comprising 1,330, and the most common type of nonfamily households are 1-person households, comprising 1,433.
| Household Size | Family Households | Nonfamily Households |
| 1-Person Households | - | 1,433 (30.4%) |
| 2-Person Households | 1,330 (28.3%) | 201 (4.3%) |
| 3-Person Households | 905 (19.2%) | 0 (0.0%) |
| 4-Person Households | 568 (12.1%) | 0 (0.0%) |
| 5-Person Households | 188 (4.0%) | 0 (0.0%) |
| 6-Person Households | 47 (1.0%) | 0 (0.0%) |
| 7+ Person Households | 35 (0.7%) | 0 (0.0%) |
| Total | 3,073 (65.3%) | 1,634 (34.7%) |
Female Fertility in Shiloh
Fertility by Age in Shiloh
Average fertility rate in Shiloh is 69.0 births per 1,000 women. Women in the age bracket of 20 to 34 years have the highest fertility rate with 157.0 births per 1,000 women. Women in the age bracket of 20 to 34 years acount for 87.4% of all women with births.
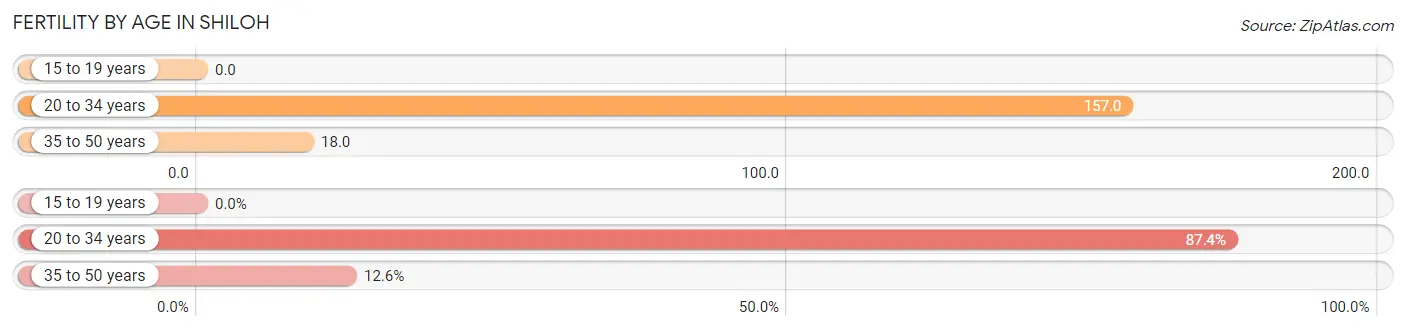
| Age Bracket | Women with Births | Births / 1,000 Women |
| 15 to 19 years | 0 (0.0%) | 0.0 |
| 20 to 34 years | 152 (87.4%) | 157.0 |
| 35 to 50 years | 22 (12.6%) | 18.0 |
| Total | 174 (100.0%) | 69.0 |
Fertility by Age by Marriage Status in Shiloh
66.1% of women with births (174) in Shiloh are married. The highest percentage of unmarried women with births falls into 20 to 34 years age bracket with 38.8% of them unmarried at the time of birth, while the lowest percentage of unmarried women with births belong to 35 to 50 years age bracket with 0.0% of them unmarried.
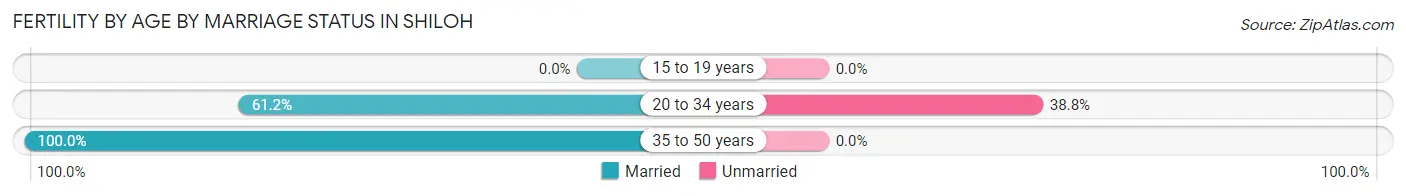
| Age Bracket | Married | Unmarried |
| 15 to 19 years | 0 (0.0%) | 0 (0.0%) |
| 20 to 34 years | 93 (61.2%) | 59 (38.8%) |
| 35 to 50 years | 22 (100.0%) | 0 (0.0%) |
| Total | 115 (66.1%) | 59 (33.9%) |
Fertility by Education in Shiloh
Average fertility rate in Shiloh is 69.0 births per 1,000 women. Women with the education attainment of bachelor's degree have the highest fertility rate of 131.0 births per 1,000 women, while women with the education attainment of high school diploma have the lowest fertility at 32.0 births per 1,000 women. Women with the education attainment of bachelor's degree represent 36.8% of all women with births.
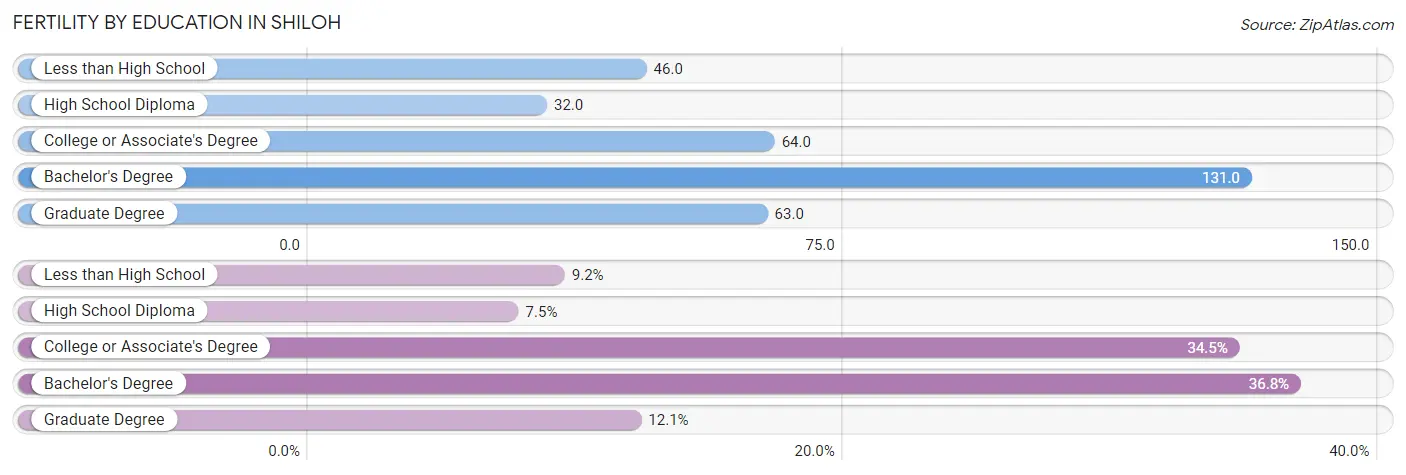
| Educational Attainment | Women with Births | Births / 1,000 Women |
| Less than High School | 16 (9.2%) | 46.0 |
| High School Diploma | 13 (7.5%) | 32.0 |
| College or Associate's Degree | 60 (34.5%) | 64.0 |
| Bachelor's Degree | 64 (36.8%) | 131.0 |
| Graduate Degree | 21 (12.1%) | 63.0 |
| Total | 174 (100.0%) | 69.0 |
Fertility by Education by Marriage Status in Shiloh
33.9% of women with births in Shiloh are unmarried. Women with the educational attainment of less than high school are most likely to be married with 100.0% of them married at childbirth, while women with the educational attainment of college or associate's degree are least likely to be married with 98.3% of them unmarried at childbirth.
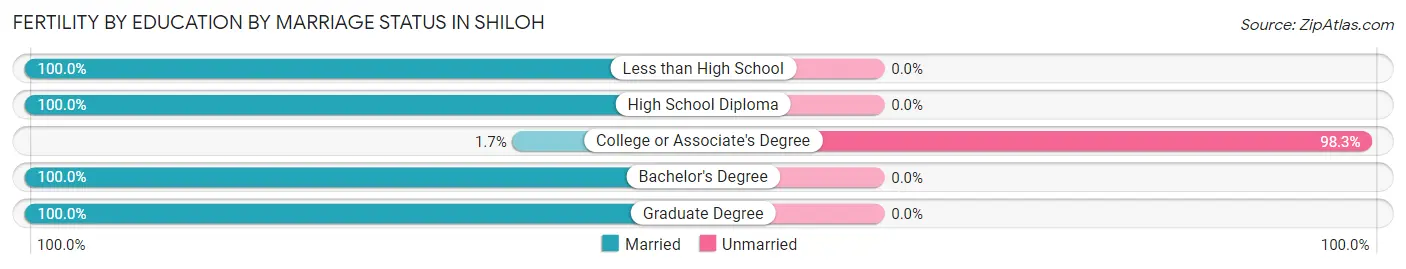
| Educational Attainment | Married | Unmarried |
| Less than High School | 16 (100.0%) | 0 (0.0%) |
| High School Diploma | 13 (100.0%) | 0 (0.0%) |
| College or Associate's Degree | 1 (1.7%) | 59 (98.3%) |
| Bachelor's Degree | 64 (100.0%) | 0 (0.0%) |
| Graduate Degree | 21 (100.0%) | 0 (0.0%) |
| Total | 115 (66.1%) | 59 (33.9%) |
Income in Shiloh
Income Overview in Shiloh
Per Capita Income in Shiloh is $40,918, while median incomes of families and households are $116,951 and $78,750 respectively.
| Characteristic | Number | Measure |
| Per Capita Income | 11,290 | $40,918 |
| Median Family Income | 3,073 | $116,951 |
| Mean Family Income | 3,073 | $122,188 |
| Median Household Income | 4,707 | $78,750 |
| Mean Household Income | 4,707 | $99,205 |
| Income Deficit | 3,073 | $0 |
| Wage / Income Gap (%) | 11,290 | 38.39% |
| Wage / Income Gap ($) | 11,290 | 61.61¢ per $1 |
| Gini / Inequality Index | 11,290 | 0.39 |
Earnings by Sex in Shiloh
Average Earnings in Shiloh are $47,103, $59,610 for men and $36,726 for women, a difference of 38.4%.
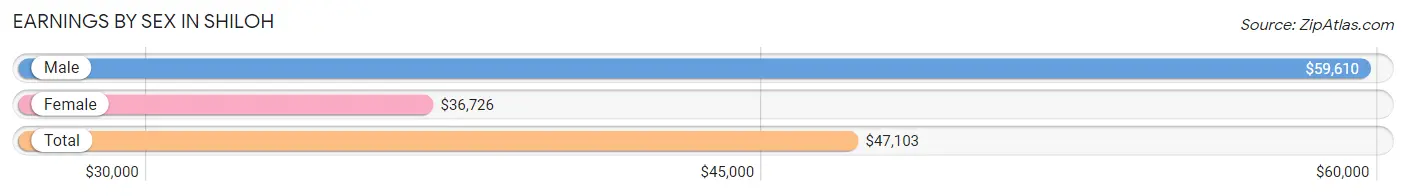
| Sex | Number | Average Earnings |
| Male | 3,322 (50.6%) | $59,610 |
| Female | 3,241 (49.4%) | $36,726 |
| Total | 6,563 (100.0%) | $47,103 |
Earnings by Sex by Income Bracket in Shiloh
The most common earnings brackets in Shiloh are $100,000+ for men (610 | 18.4%) and $65,000 to $74,999 for women (321 | 9.9%).
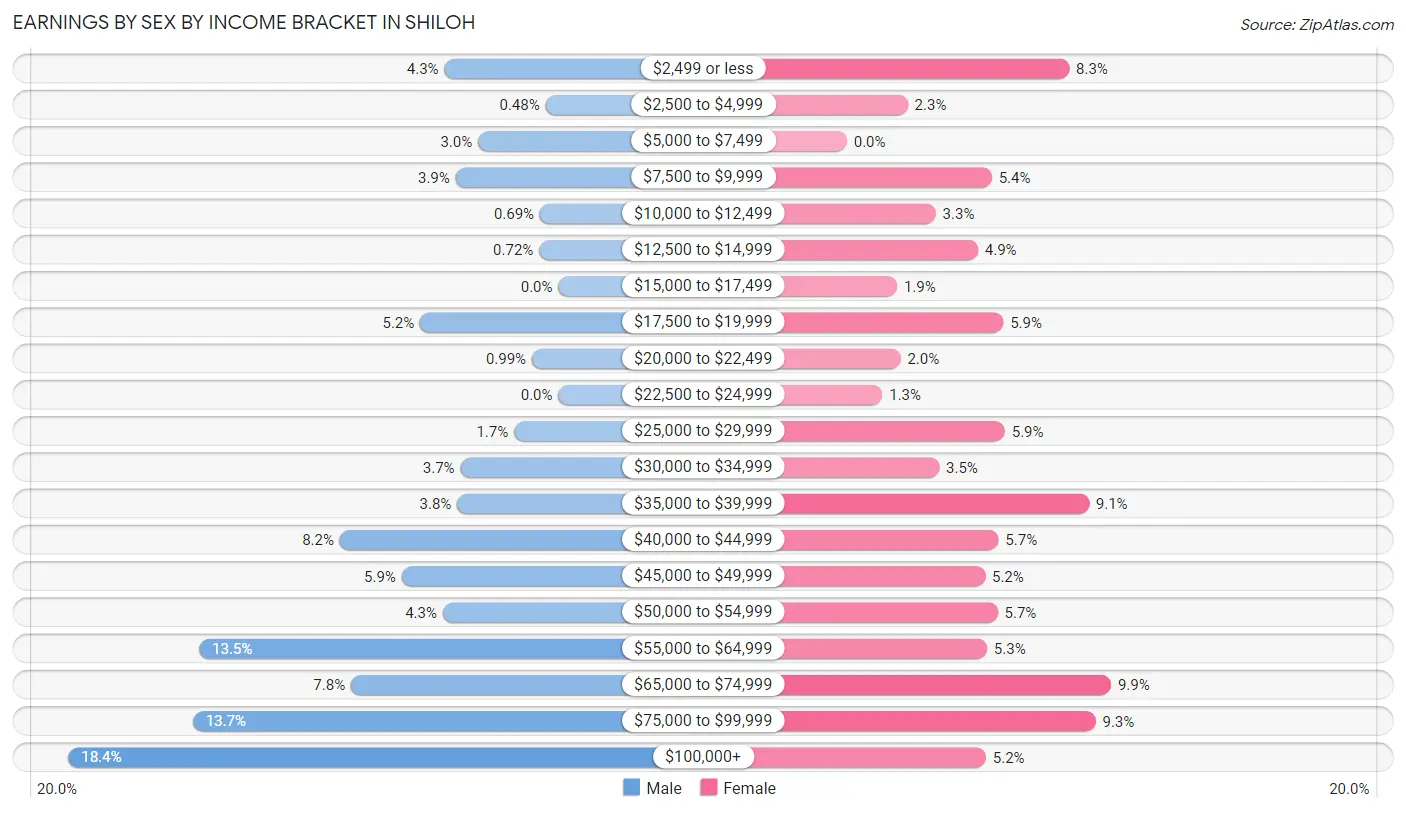
| Income | Male | Female |
| $2,499 or less | 142 (4.3%) | 270 (8.3%) |
| $2,500 to $4,999 | 16 (0.5%) | 74 (2.3%) |
| $5,000 to $7,499 | 100 (3.0%) | 0 (0.0%) |
| $7,500 to $9,999 | 128 (3.8%) | 176 (5.4%) |
| $10,000 to $12,499 | 23 (0.7%) | 108 (3.3%) |
| $12,500 to $14,999 | 24 (0.7%) | 159 (4.9%) |
| $15,000 to $17,499 | 0 (0.0%) | 61 (1.9%) |
| $17,500 to $19,999 | 172 (5.2%) | 190 (5.9%) |
| $20,000 to $22,499 | 33 (1.0%) | 65 (2.0%) |
| $22,500 to $24,999 | 0 (0.0%) | 43 (1.3%) |
| $25,000 to $29,999 | 55 (1.7%) | 192 (5.9%) |
| $30,000 to $34,999 | 122 (3.7%) | 112 (3.5%) |
| $35,000 to $39,999 | 126 (3.8%) | 294 (9.1%) |
| $40,000 to $44,999 | 272 (8.2%) | 184 (5.7%) |
| $45,000 to $49,999 | 195 (5.9%) | 168 (5.2%) |
| $50,000 to $54,999 | 144 (4.3%) | 183 (5.7%) |
| $55,000 to $64,999 | 447 (13.5%) | 170 (5.2%) |
| $65,000 to $74,999 | 258 (7.8%) | 321 (9.9%) |
| $75,000 to $99,999 | 455 (13.7%) | 302 (9.3%) |
| $100,000+ | 610 (18.4%) | 169 (5.2%) |
| Total | 3,322 (100.0%) | 3,241 (100.0%) |
Earnings by Sex by Educational Attainment in Shiloh
Average earnings in Shiloh are $63,279 for men and $44,401 for women, a difference of 29.8%. Men with an educational attainment of graduate degree enjoy the highest average annual earnings of $91,409, while those with less than high school education earn the least with $51,034. Women with an educational attainment of graduate degree earn the most with the average annual earnings of $78,640, while those with less than high school education have the smallest earnings of $13,750.
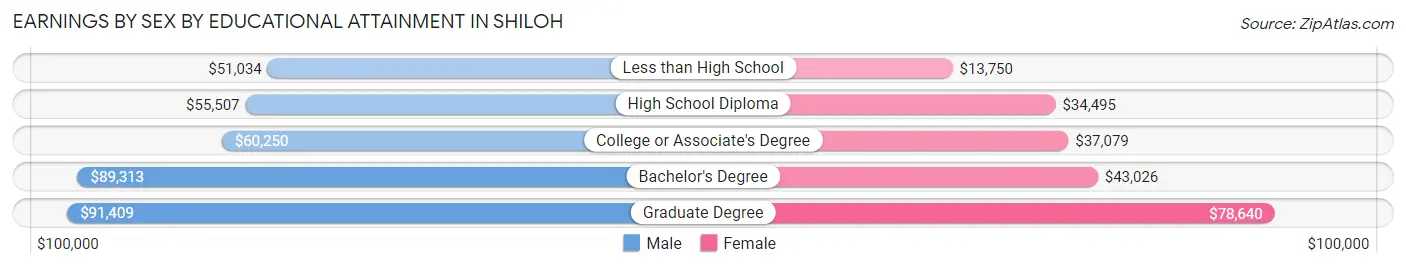
| Educational Attainment | Male Income | Female Income |
| Less than High School | $51,034 | $13,750 |
| High School Diploma | $55,507 | $34,495 |
| College or Associate's Degree | $60,250 | $37,079 |
| Bachelor's Degree | $89,313 | $43,026 |
| Graduate Degree | $91,409 | $78,640 |
| Total | $63,279 | $44,401 |
Family Income in Shiloh
Family Income Brackets in Shiloh
According to the Shiloh family income data, there are 937 families falling into the $100,000 to $149,999 income range, which is the most common income bracket and makes up 30.5% of all families.
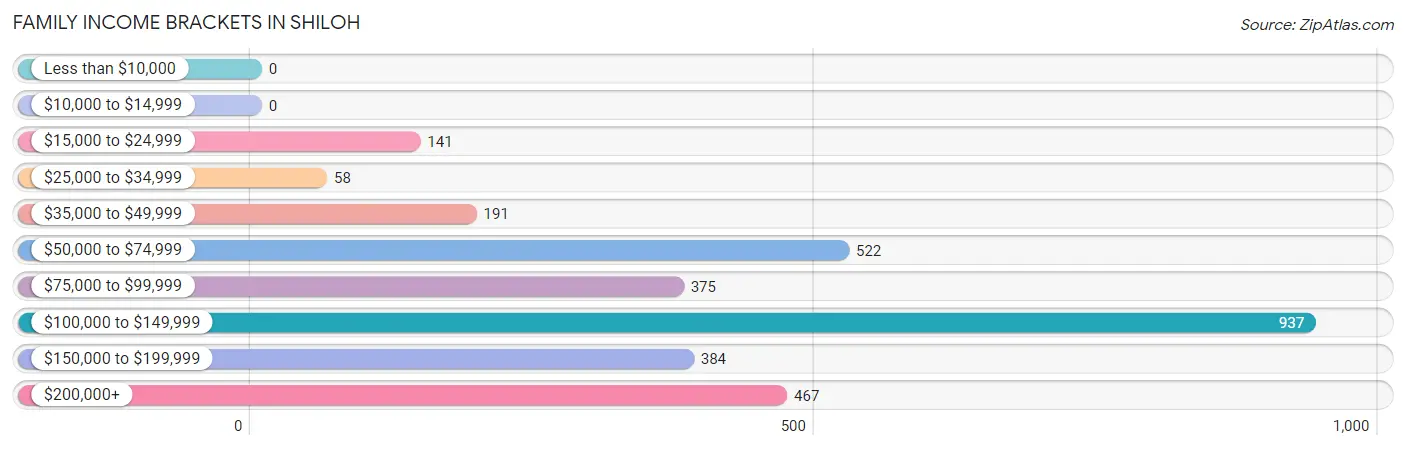
| Income Bracket | # Families | % Families |
| Less than $10,000 | 0 | 0.0% |
| $10,000 to $14,999 | 0 | 0.0% |
| $15,000 to $24,999 | 141 | 4.6% |
| $25,000 to $34,999 | 58 | 1.9% |
| $35,000 to $49,999 | 191 | 6.2% |
| $50,000 to $74,999 | 522 | 17.0% |
| $75,000 to $99,999 | 375 | 12.2% |
| $100,000 to $149,999 | 937 | 30.5% |
| $150,000 to $199,999 | 384 | 12.5% |
| $200,000+ | 467 | 15.2% |
Family Income by Famaliy Size in Shiloh
3-person families (911 | 29.6%) account for the highest median family income in Shiloh with $148,813 per family, while 3-person families (911 | 29.6%) have the highest median income of $49,604 per family member.
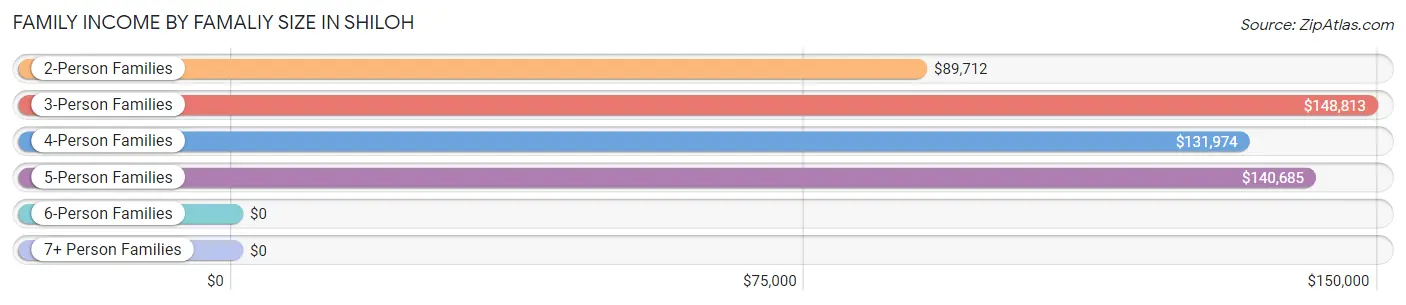
| Income Bracket | # Families | Median Income |
| 2-Person Families | 1,330 (43.3%) | $89,712 |
| 3-Person Families | 911 (29.6%) | $148,813 |
| 4-Person Families | 602 (19.6%) | $131,974 |
| 5-Person Families | 181 (5.9%) | $140,685 |
| 6-Person Families | 14 (0.5%) | $0 |
| 7+ Person Families | 35 (1.1%) | $0 |
| Total | 3,073 (100.0%) | $116,951 |
Family Income by Number of Earners in Shiloh
The median family income in Shiloh is $116,951, with families comprising 3+ earners (756) having the highest median family income of $141,290, while families with no earners (364) have the lowest median family income of $59,605, accounting for 24.6% and 11.8% of families, respectively.
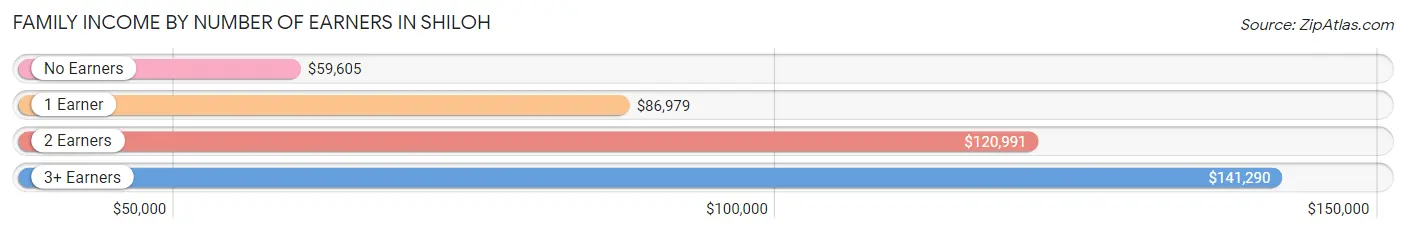
| Number of Earners | # Families | Median Income |
| No Earners | 364 (11.8%) | $59,605 |
| 1 Earner | 576 (18.7%) | $86,979 |
| 2 Earners | 1,377 (44.8%) | $120,991 |
| 3+ Earners | 756 (24.6%) | $141,290 |
| Total | 3,073 (100.0%) | $116,951 |
Household Income in Shiloh
Household Income Brackets in Shiloh
With 1,078 households falling in the category, the $100,000 to $149,999 income range is the most frequent in Shiloh, accounting for 22.9% of all households. In contrast, only 33 households (0.7%) fall into the $10,000 to $14,999 income bracket, making it the least populous group.
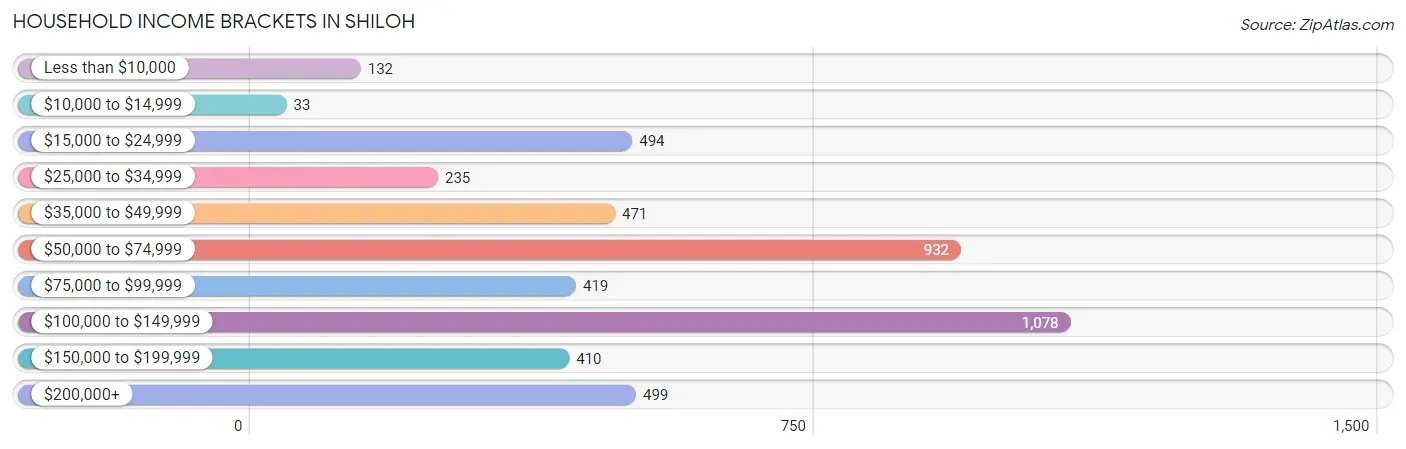
| Income Bracket | # Households | % Households |
| Less than $10,000 | 132 | 2.8% |
| $10,000 to $14,999 | 33 | 0.7% |
| $15,000 to $24,999 | 494 | 10.5% |
| $25,000 to $34,999 | 235 | 5.0% |
| $35,000 to $49,999 | 471 | 10.0% |
| $50,000 to $74,999 | 932 | 19.8% |
| $75,000 to $99,999 | 419 | 8.9% |
| $100,000 to $149,999 | 1,078 | 22.9% |
| $150,000 to $199,999 | 410 | 8.7% |
| $200,000+ | 499 | 10.6% |
Household Income by Householder Age in Shiloh
The median household income in Shiloh is $78,750, with the highest median household income of $121,029 found in the 45 to 64 years age bracket for the primary householder. A total of 2,012 households (42.7%) fall into this category. Meanwhile, the 65+ years age bracket for the primary householder has the lowest median household income of $40,000, with 1,512 households (32.1%) in this group.
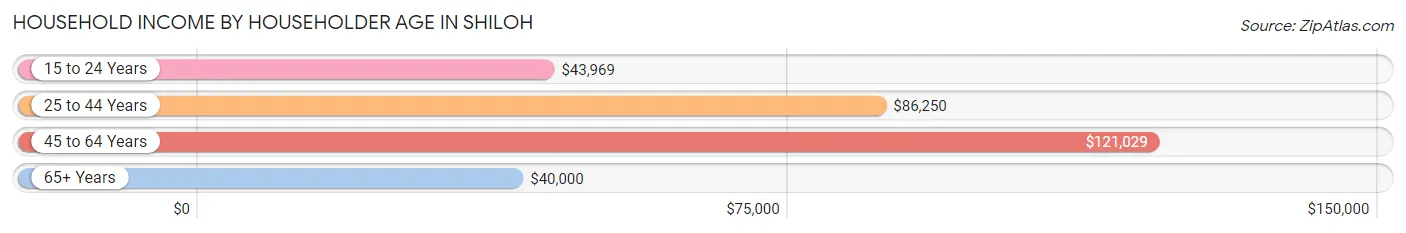
| Income Bracket | # Households | Median Income |
| 15 to 24 Years | 87 (1.8%) | $43,969 |
| 25 to 44 Years | 1,096 (23.3%) | $86,250 |
| 45 to 64 Years | 2,012 (42.7%) | $121,029 |
| 65+ Years | 1,512 (32.1%) | $40,000 |
| Total | 4,707 (100.0%) | $78,750 |
Poverty in Shiloh
Income Below Poverty by Sex and Age in Shiloh
With 2.9% poverty level for males and 5.1% for females among the residents of Shiloh, 6 to 11 year old males and 25 to 34 year old females are the most vulnerable to poverty, with 61 males (26.1%) and 101 females (17.5%) in their respective age groups living below the poverty level.
| Age Bracket | Male | Female |
| Under 5 Years | 0 (0.0%) | 15 (7.8%) |
| 5 Years | 0 (0.0%) | 0 (0.0%) |
| 6 to 11 Years | 61 (26.1%) | 16 (5.3%) |
| 12 to 14 Years | 0 (0.0%) | 0 (0.0%) |
| 15 Years | 0 (0.0%) | 0 (0.0%) |
| 16 and 17 Years | 0 (0.0%) | 0 (0.0%) |
| 18 to 24 Years | 0 (0.0%) | 16 (3.4%) |
| 25 to 34 Years | 13 (2.2%) | 101 (17.5%) |
| 35 to 44 Years | 1 (0.1%) | 0 (0.0%) |
| 45 to 54 Years | 7 (0.9%) | 12 (1.2%) |
| 55 to 64 Years | 70 (7.9%) | 31 (4.8%) |
| 65 to 74 Years | 0 (0.0%) | 33 (4.7%) |
| 75 Years and over | 14 (2.5%) | 51 (9.2%) |
| Total | 166 (2.9%) | 275 (5.1%) |
Income Above Poverty by Sex and Age in Shiloh
According to the poverty statistics in Shiloh, males aged under 5 years and females aged 5 years are the age groups that are most secure financially, with 100.0% of males and 100.0% of females in these age groups living above the poverty line.
| Age Bracket | Male | Female |
| Under 5 Years | 342 (100.0%) | 178 (92.2%) |
| 5 Years | 38 (100.0%) | 62 (100.0%) |
| 6 to 11 Years | 173 (73.9%) | 283 (94.7%) |
| 12 to 14 Years | 138 (100.0%) | 66 (100.0%) |
| 15 Years | 59 (100.0%) | 59 (100.0%) |
| 16 and 17 Years | 280 (100.0%) | 216 (100.0%) |
| 18 to 24 Years | 443 (100.0%) | 450 (96.6%) |
| 25 to 34 Years | 576 (97.8%) | 475 (82.5%) |
| 35 to 44 Years | 729 (99.9%) | 503 (100.0%) |
| 45 to 54 Years | 776 (99.1%) | 1,016 (98.8%) |
| 55 to 64 Years | 814 (92.1%) | 613 (95.2%) |
| 65 to 74 Years | 577 (100.0%) | 670 (95.3%) |
| 75 Years and over | 539 (97.5%) | 504 (90.8%) |
| Total | 5,484 (97.1%) | 5,095 (94.9%) |
Income Below Poverty Among Married-Couple Families in Shiloh
| Children | Above Poverty | Below Poverty |
| No Children | 1,593 (100.0%) | 0 (0.0%) |
| 1 or 2 Children | 1,073 (100.0%) | 0 (0.0%) |
| 3 or 4 Children | 99 (100.0%) | 0 (0.0%) |
| 5 or more Children | 1 (100.0%) | 0 (0.0%) |
| Total | 2,766 (100.0%) | 0 (0.0%) |
Income Below Poverty Among Single-Parent Households in Shiloh
| Children | Single Father | Single Mother |
| No Children | 0 (0.0%) | 0 (0.0%) |
| 1 or 2 Children | 0 (0.0%) | 78 (40.0%) |
| 3 or 4 Children | 0 (0.0%) | 0 (0.0%) |
| 5 or more Children | 0 (0.0%) | 0 (0.0%) |
| Total | 0 (0.0%) | 78 (26.6%) |
Income Below Poverty Among Married-Couple vs Single-Parent Households in Shiloh
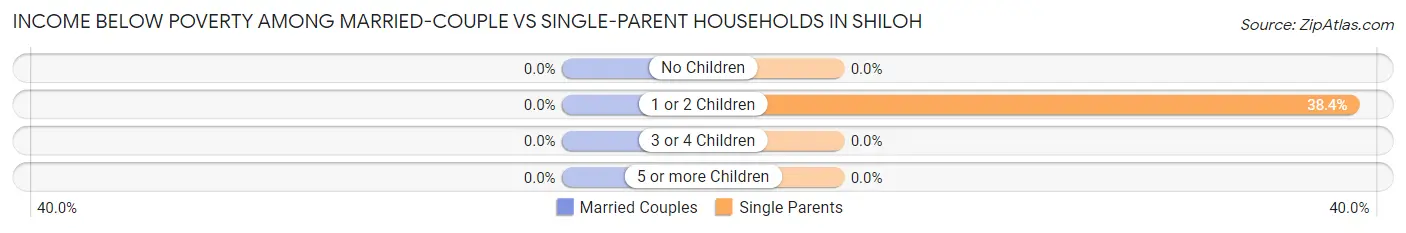
| Children | Married-Couple Families | Single-Parent Households |
| No Children | 0 (0.0%) | 0 (0.0%) |
| 1 or 2 Children | 0 (0.0%) | 78 (38.4%) |
| 3 or 4 Children | 0 (0.0%) | 0 (0.0%) |
| 5 or more Children | 0 (0.0%) | 0 (0.0%) |
| Total | 0 (0.0%) | 78 (25.4%) |
Employment Characteristics in Shiloh
Employment by Class of Employer in Shiloh
Among the 6,007 employed individuals in Shiloh, private company employees (4,112 | 68.4%), not-for-profit organizations (1,142 | 19.0%), and local government employees (383 | 6.4%) make up the most common classes of employment.
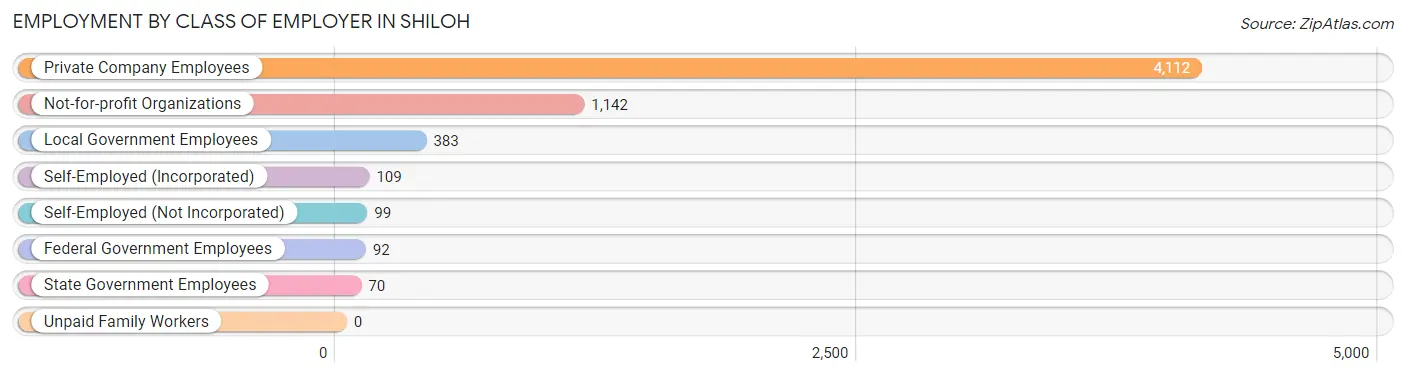
| Employer Class | # Employees | % Employees |
| Private Company Employees | 4,112 | 68.4% |
| Self-Employed (Incorporated) | 109 | 1.8% |
| Self-Employed (Not Incorporated) | 99 | 1.7% |
| Not-for-profit Organizations | 1,142 | 19.0% |
| Local Government Employees | 383 | 6.4% |
| State Government Employees | 70 | 1.2% |
| Federal Government Employees | 92 | 1.5% |
| Unpaid Family Workers | 0 | 0.0% |
| Total | 6,007 | 100.0% |
Employment Status by Age in Shiloh
According to the labor force statistics for Shiloh, out of the total population over 16 years of age (9,796), 63.6% or 6,230 individuals are in the labor force, with 1.3% or 81 of them unemployed. The age group with the highest labor force participation rate is 35 to 44 years, with 93.7% or 1,168 individuals in the labor force. Within the labor force, the 65 to 74 years age range has the highest percentage of unemployed individuals, with 12.1% or 32 of them being unemployed.
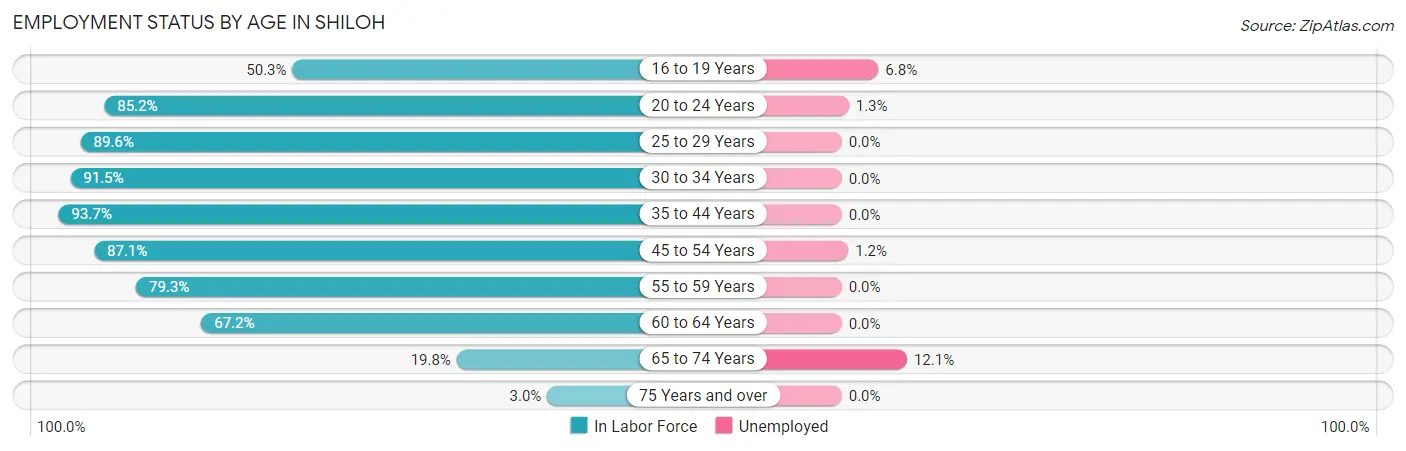
| Age Bracket | In Labor Force | Unemployed |
| 16 to 19 Years | 353 (50.3%) | 24 (6.8%) |
| 20 to 24 Years | 606 (85.2%) | 8 (1.3%) |
| 25 to 29 Years | 656 (89.6%) | 0 (0.0%) |
| 30 to 34 Years | 396 (91.5%) | 0 (0.0%) |
| 35 to 44 Years | 1,168 (93.7%) | 0 (0.0%) |
| 45 to 54 Years | 1,595 (87.1%) | 19 (1.2%) |
| 55 to 59 Years | 701 (79.3%) | 0 (0.0%) |
| 60 to 64 Years | 449 (67.2%) | 0 (0.0%) |
| 65 to 74 Years | 266 (19.8%) | 32 (12.1%) |
| 75 Years and over | 37 (3.0%) | 0 (0.0%) |
| Total | 6,230 (63.6%) | 81 (1.3%) |
Employment Status by Educational Attainment in Shiloh
According to labor force statistics for Shiloh, 85.7% of individuals (4,965) out of the total population between 25 and 64 years of age (5,794) are in the labor force, with 0.4% or 20 of them being unemployed. The group with the highest labor force participation rate are those with the educational attainment of bachelor's degree or higher, with 94.5% or 1,635 individuals in the labor force. Within the labor force, individuals with college / associate degree education have the highest percentage of unemployment, with 1.0% or 19 of them being unemployed.
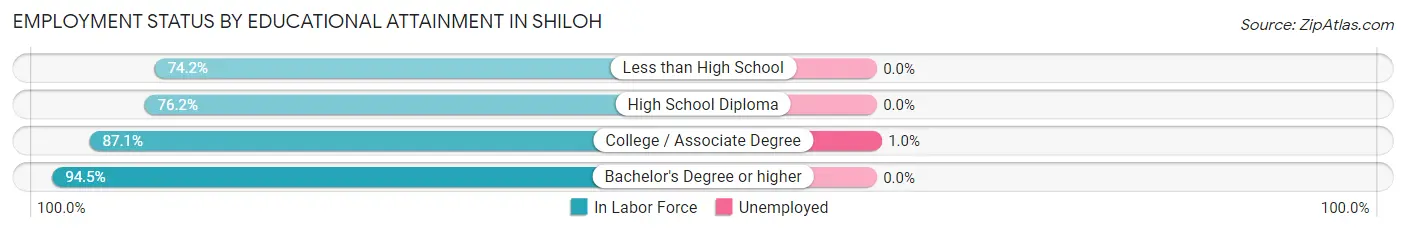
| Educational Attainment | In Labor Force | Unemployed |
| Less than High School | 144 (74.2%) | 0 (0.0%) |
| High School Diploma | 1,297 (76.2%) | 0 (0.0%) |
| College / Associate Degree | 1,888 (87.1%) | 22 (1.0%) |
| Bachelor's Degree or higher | 1,635 (94.5%) | 0 (0.0%) |
| Total | 4,965 (85.7%) | 23 (0.4%) |
Employment Occupations by Sex in Shiloh
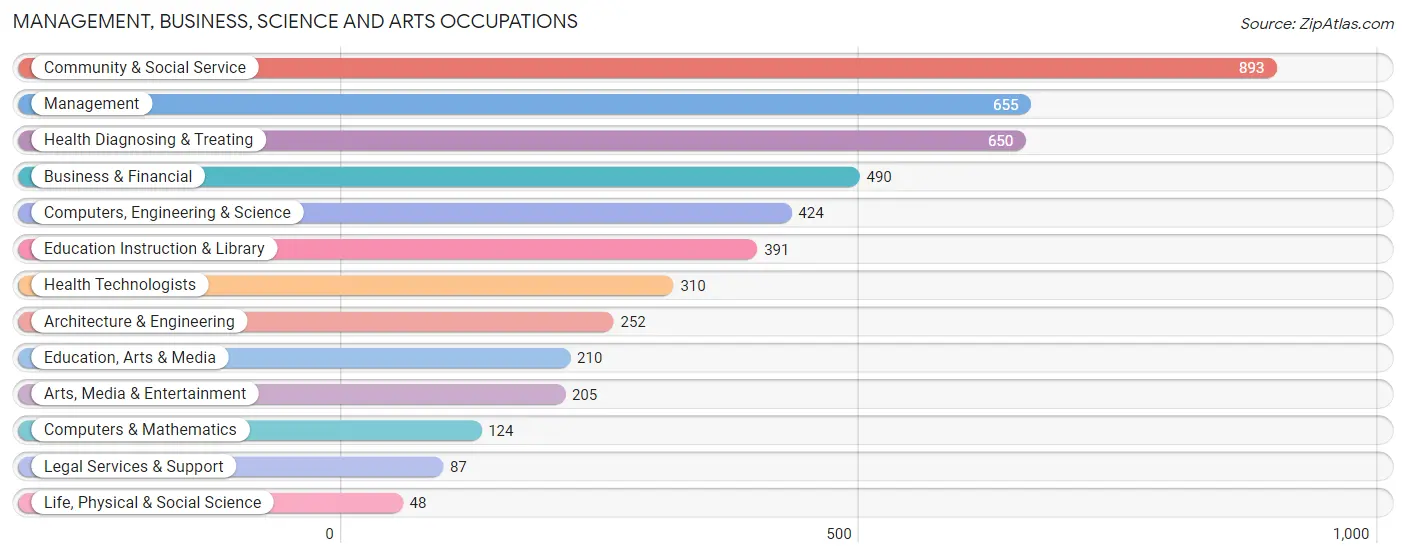
Management, Business, Science and Arts Occupations
The most common Management, Business, Science and Arts occupations in Shiloh are Community & Social Service (893 | 14.5%), Management (655 | 10.7%), Health Diagnosing & Treating (650 | 10.6%), Business & Financial (490 | 8.0%), and Computers, Engineering & Science (424 | 6.9%).
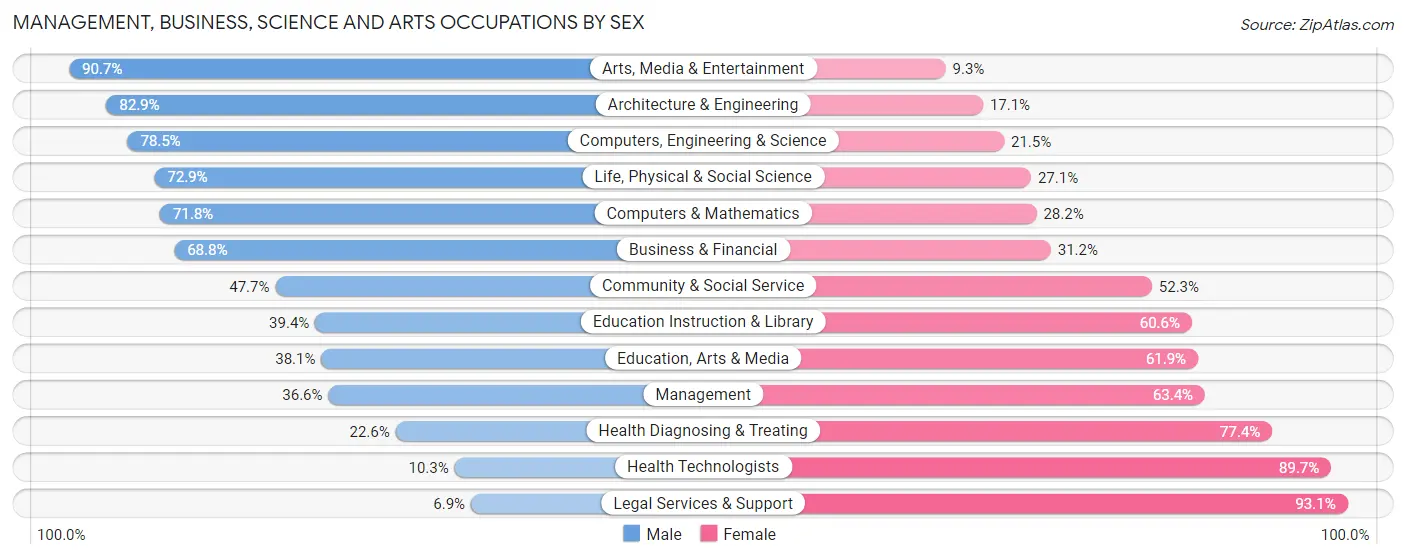
Management, Business, Science and Arts Occupations by Sex
Within the Management, Business, Science and Arts occupations in Shiloh, the most male-oriented occupations are Arts, Media & Entertainment (90.7%), Architecture & Engineering (82.9%), and Computers, Engineering & Science (78.5%), while the most female-oriented occupations are Legal Services & Support (93.1%), Health Technologists (89.7%), and Health Diagnosing & Treating (77.4%).
| Occupation | Male | Female |
| Management | 240 (36.6%) | 415 (63.4%) |
| Business & Financial | 337 (68.8%) | 153 (31.2%) |
| Computers, Engineering & Science | 333 (78.5%) | 91 (21.5%) |
| Computers & Mathematics | 89 (71.8%) | 35 (28.2%) |
| Architecture & Engineering | 209 (82.9%) | 43 (17.1%) |
| Life, Physical & Social Science | 35 (72.9%) | 13 (27.1%) |
| Community & Social Service | 426 (47.7%) | 467 (52.3%) |
| Education, Arts & Media | 80 (38.1%) | 130 (61.9%) |
| Legal Services & Support | 6 (6.9%) | 81 (93.1%) |
| Education Instruction & Library | 154 (39.4%) | 237 (60.6%) |
| Arts, Media & Entertainment | 186 (90.7%) | 19 (9.3%) |
| Health Diagnosing & Treating | 147 (22.6%) | 503 (77.4%) |
| Health Technologists | 32 (10.3%) | 278 (89.7%) |
| Total (Category) | 1,483 (47.6%) | 1,629 (52.3%) |
| Total (Overall) | 3,201 (52.1%) | 2,942 (47.9%) |
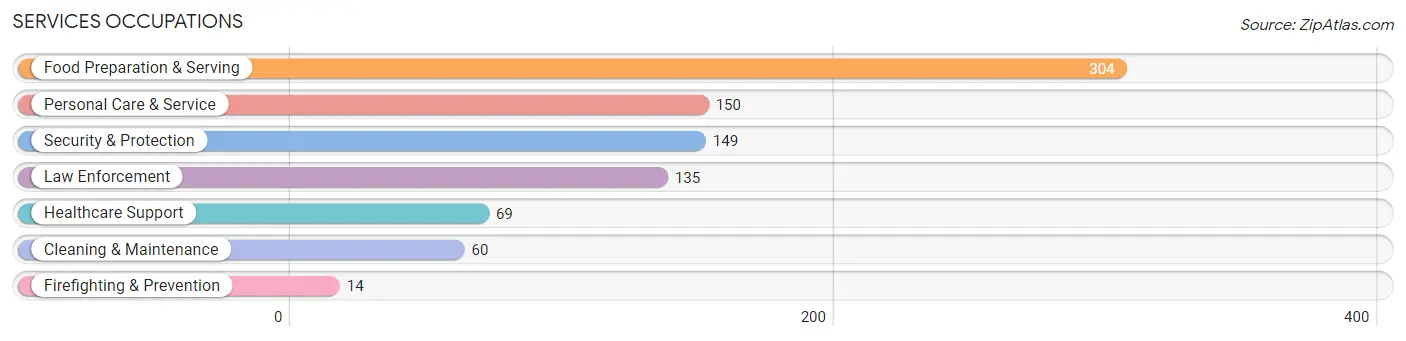
Services Occupations
The most common Services occupations in Shiloh are Food Preparation & Serving (304 | 5.0%), Personal Care & Service (150 | 2.4%), Security & Protection (149 | 2.4%), Law Enforcement (135 | 2.2%), and Healthcare Support (69 | 1.1%).
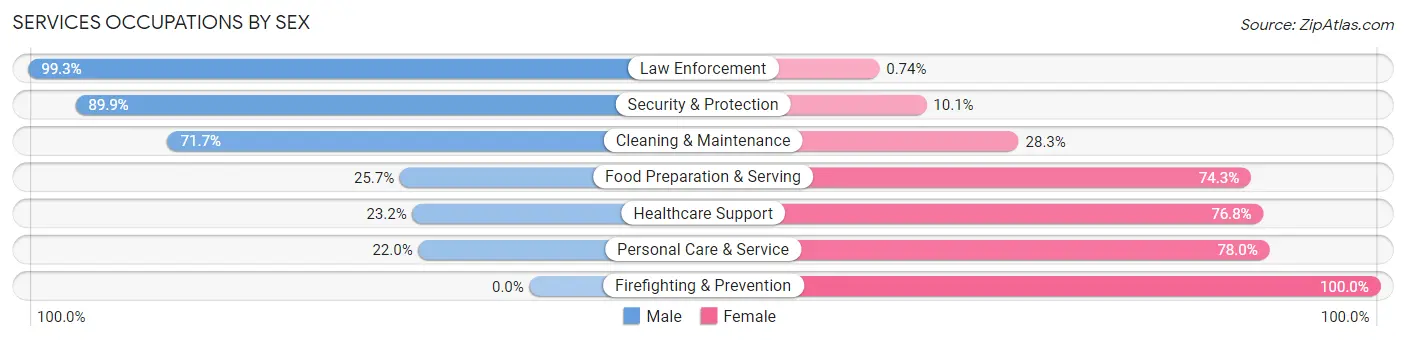
Services Occupations by Sex
Within the Services occupations in Shiloh, the most male-oriented occupations are Law Enforcement (99.3%), Security & Protection (89.9%), and Cleaning & Maintenance (71.7%), while the most female-oriented occupations are Firefighting & Prevention (100.0%), Personal Care & Service (78.0%), and Healthcare Support (76.8%).
| Occupation | Male | Female |
| Healthcare Support | 16 (23.2%) | 53 (76.8%) |
| Security & Protection | 134 (89.9%) | 15 (10.1%) |
| Firefighting & Prevention | 0 (0.0%) | 14 (100.0%) |
| Law Enforcement | 134 (99.3%) | 1 (0.7%) |
| Food Preparation & Serving | 78 (25.7%) | 226 (74.3%) |
| Cleaning & Maintenance | 43 (71.7%) | 17 (28.3%) |
| Personal Care & Service | 33 (22.0%) | 117 (78.0%) |
| Total (Category) | 304 (41.5%) | 428 (58.5%) |
| Total (Overall) | 3,201 (52.1%) | 2,942 (47.9%) |
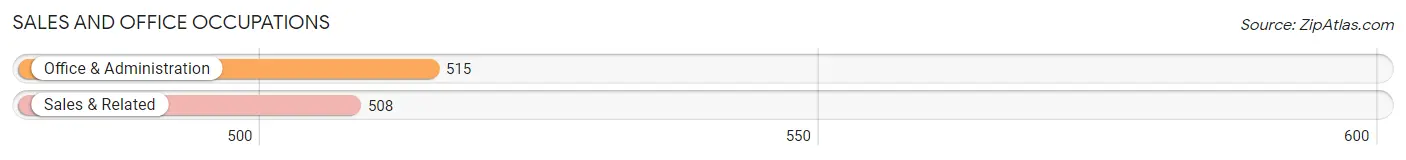
Sales and Office Occupations
The most common Sales and Office occupations in Shiloh are Office & Administration (515 | 8.4%), and Sales & Related (508 | 8.3%).
Sales and Office Occupations by Sex
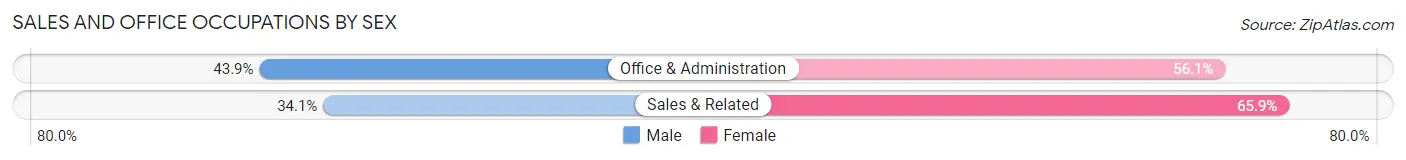
| Occupation | Male | Female |
| Sales & Related | 173 (34.1%) | 335 (65.9%) |
| Office & Administration | 226 (43.9%) | 289 (56.1%) |
| Total (Category) | 399 (39.0%) | 624 (61.0%) |
| Total (Overall) | 3,201 (52.1%) | 2,942 (47.9%) |
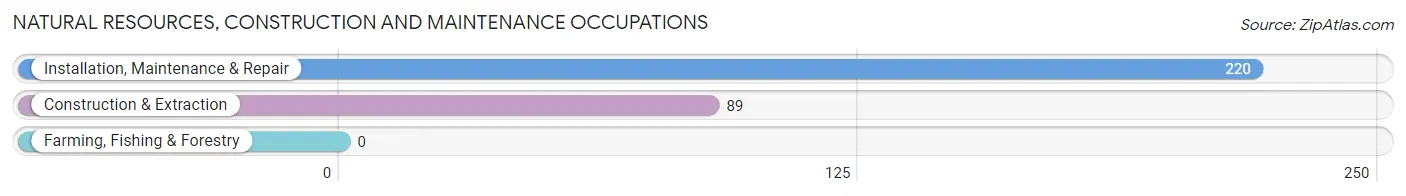
Natural Resources, Construction and Maintenance Occupations
The most common Natural Resources, Construction and Maintenance occupations in Shiloh are Installation, Maintenance & Repair (220 | 3.6%), and Construction & Extraction (89 | 1.5%).
Natural Resources, Construction and Maintenance Occupations by Sex
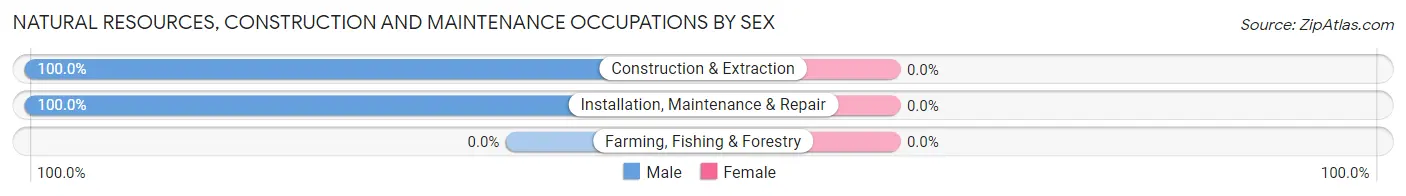
| Occupation | Male | Female |
| Farming, Fishing & Forestry | 0 (0.0%) | 0 (0.0%) |
| Construction & Extraction | 89 (100.0%) | 0 (0.0%) |
| Installation, Maintenance & Repair | 220 (100.0%) | 0 (0.0%) |
| Total (Category) | 309 (100.0%) | 0 (0.0%) |
| Total (Overall) | 3,201 (52.1%) | 2,942 (47.9%) |
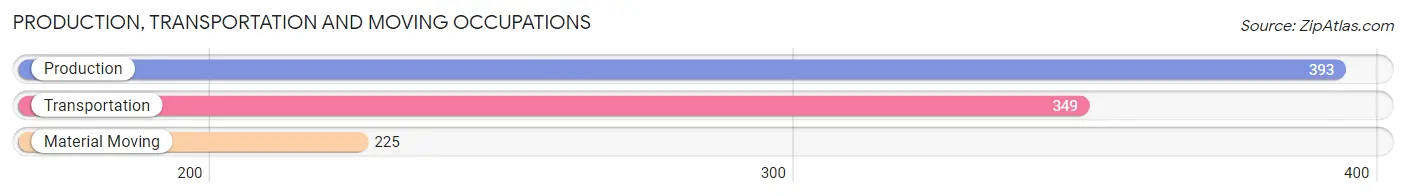
Production, Transportation and Moving Occupations
The most common Production, Transportation and Moving occupations in Shiloh are Production (393 | 6.4%), Transportation (349 | 5.7%), and Material Moving (225 | 3.7%).
Production, Transportation and Moving Occupations by Sex
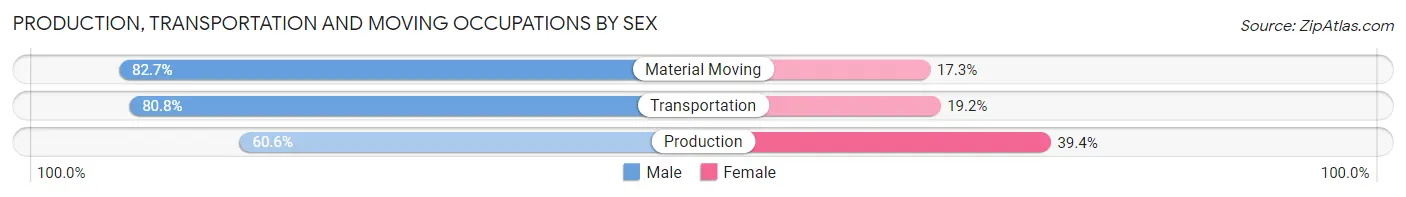
| Occupation | Male | Female |
| Production | 238 (60.6%) | 155 (39.4%) |
| Transportation | 282 (80.8%) | 67 (19.2%) |
| Material Moving | 186 (82.7%) | 39 (17.3%) |
| Total (Category) | 706 (73.0%) | 261 (27.0%) |
| Total (Overall) | 3,201 (52.1%) | 2,942 (47.9%) |
Employment Industries by Sex in Shiloh
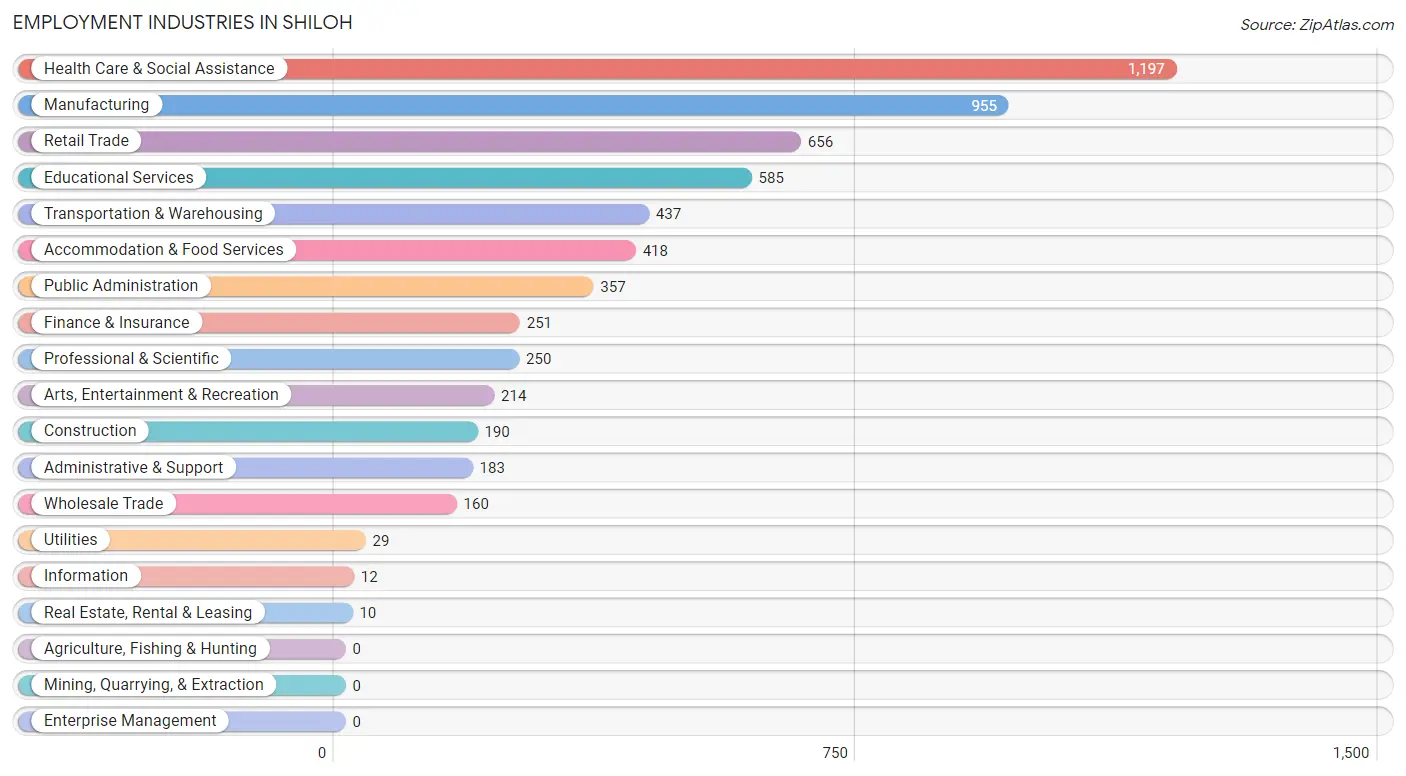
Employment Industries in Shiloh
The major employment industries in Shiloh include Health Care & Social Assistance (1,197 | 19.5%), Manufacturing (955 | 15.5%), Retail Trade (656 | 10.7%), Educational Services (585 | 9.5%), and Transportation & Warehousing (437 | 7.1%).
Employment Industries by Sex in Shiloh
The Shiloh industries that see more men than women are Utilities (100.0%), Arts, Entertainment & Recreation (89.7%), and Administrative & Support (84.7%), whereas the industries that tend to have a higher number of women are Information (100.0%), Real Estate, Rental & Leasing (100.0%), and Health Care & Social Assistance (79.2%).
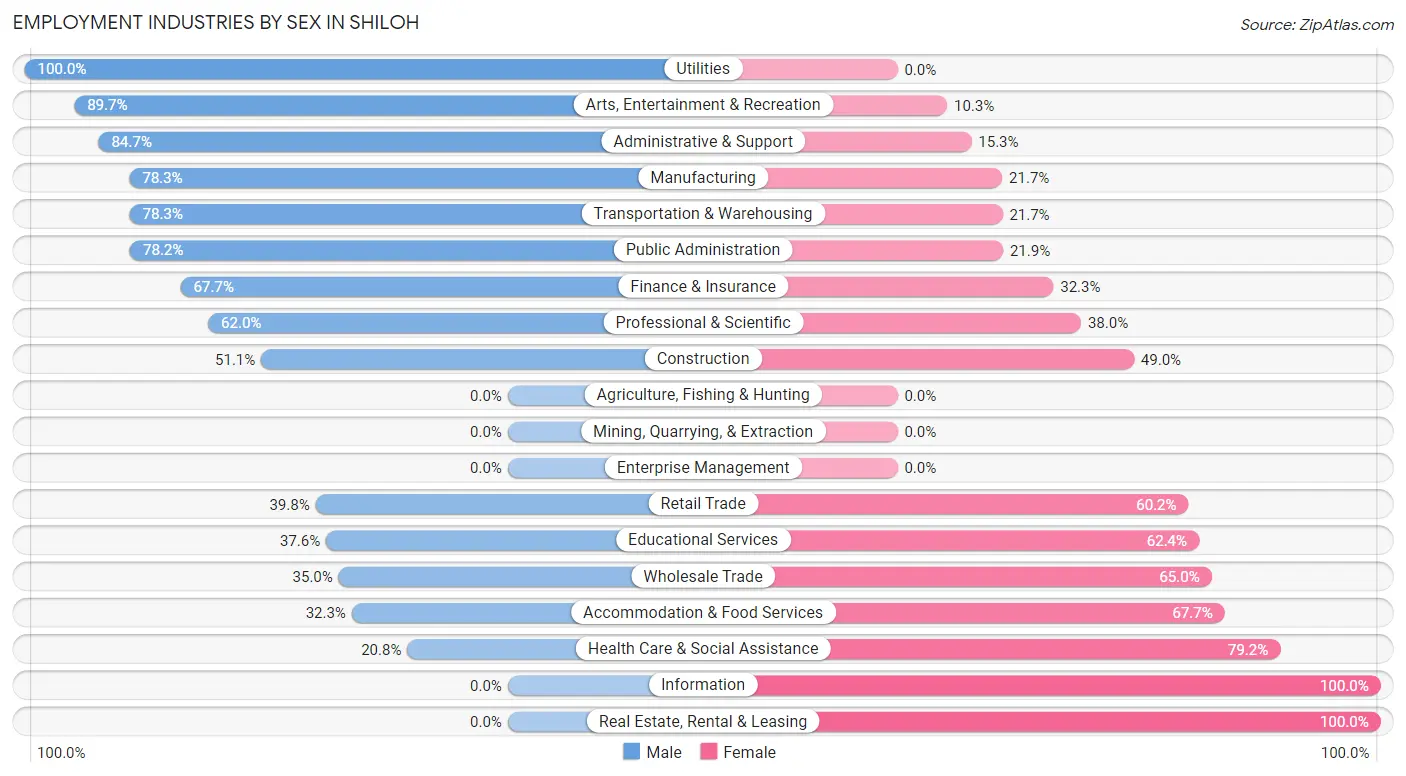
| Industry | Male | Female |
| Agriculture, Fishing & Hunting | 0 (0.0%) | 0 (0.0%) |
| Mining, Quarrying, & Extraction | 0 (0.0%) | 0 (0.0%) |
| Construction | 97 (51.0%) | 93 (48.9%) |
| Manufacturing | 748 (78.3%) | 207 (21.7%) |
| Wholesale Trade | 56 (35.0%) | 104 (65.0%) |
| Retail Trade | 261 (39.8%) | 395 (60.2%) |
| Transportation & Warehousing | 342 (78.3%) | 95 (21.7%) |
| Utilities | 29 (100.0%) | 0 (0.0%) |
| Information | 0 (0.0%) | 12 (100.0%) |
| Finance & Insurance | 170 (67.7%) | 81 (32.3%) |
| Real Estate, Rental & Leasing | 0 (0.0%) | 10 (100.0%) |
| Professional & Scientific | 155 (62.0%) | 95 (38.0%) |
| Enterprise Management | 0 (0.0%) | 0 (0.0%) |
| Administrative & Support | 155 (84.7%) | 28 (15.3%) |
| Educational Services | 220 (37.6%) | 365 (62.4%) |
| Health Care & Social Assistance | 249 (20.8%) | 948 (79.2%) |
| Arts, Entertainment & Recreation | 192 (89.7%) | 22 (10.3%) |
| Accommodation & Food Services | 135 (32.3%) | 283 (67.7%) |
| Public Administration | 279 (78.1%) | 78 (21.8%) |
| Total | 3,201 (52.1%) | 2,942 (47.9%) |
Education in Shiloh
School Enrollment in Shiloh
The most common levels of schooling among the 2,165 students in Shiloh are high school (737 | 34.0%), college / undergraduate (446 | 20.6%), and elementary school (314 | 14.5%).
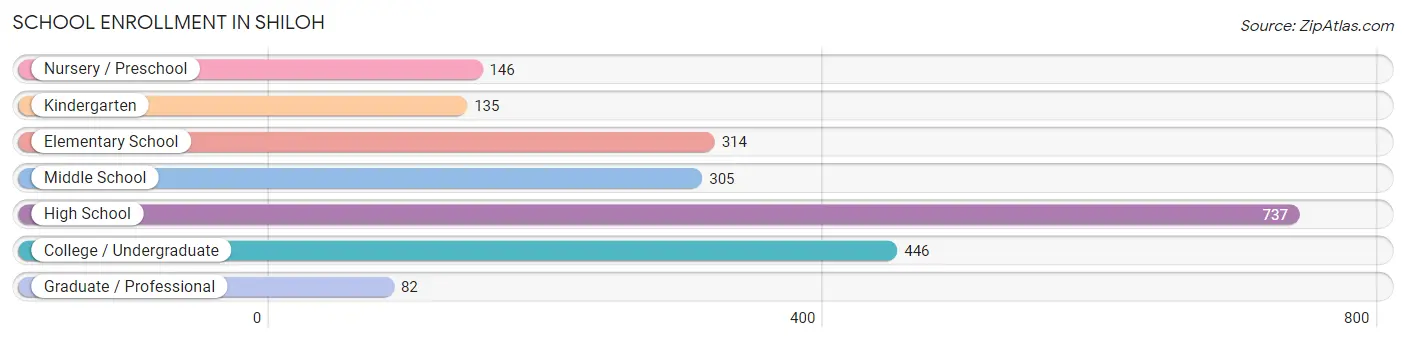
| School Level | # Students | % Students |
| Nursery / Preschool | 146 | 6.7% |
| Kindergarten | 135 | 6.2% |
| Elementary School | 314 | 14.5% |
| Middle School | 305 | 14.1% |
| High School | 737 | 34.0% |
| College / Undergraduate | 446 | 20.6% |
| Graduate / Professional | 82 | 3.8% |
| Total | 2,165 | 100.0% |
School Enrollment by Age by Funding Source in Shiloh
Out of a total of 2,165 students who are enrolled in schools in Shiloh, 310 (14.3%) attend a private institution, while the remaining 1,855 (85.7%) are enrolled in public schools. The age group of 35 years and over has the highest likelihood of being enrolled in private schools, with 53 (72.6% in the age bracket) enrolled. Conversely, the age group of 10 to 14 year olds has the lowest likelihood of being enrolled in a private school, with 360 (100.0% in the age bracket) attending a public institution.
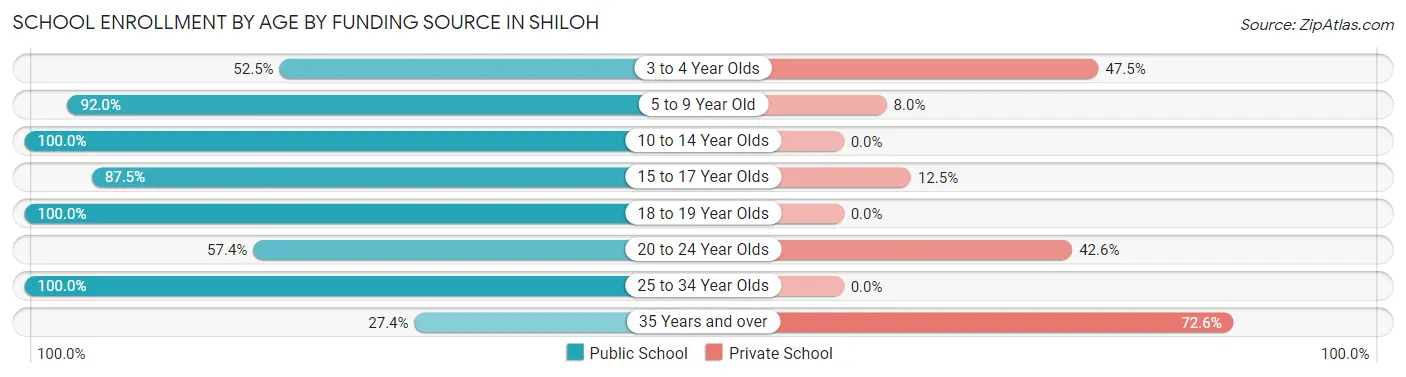
| Age Bracket | Public School | Private School |
| 3 to 4 Year Olds | 62 (52.5%) | 56 (47.5%) |
| 5 to 9 Year Old | 425 (92.0%) | 37 (8.0%) |
| 10 to 14 Year Olds | 360 (100.0%) | 0 (0.0%) |
| 15 to 17 Year Olds | 537 (87.5%) | 77 (12.5%) |
| 18 to 19 Year Olds | 129 (100.0%) | 0 (0.0%) |
| 20 to 24 Year Olds | 116 (57.4%) | 86 (42.6%) |
| 25 to 34 Year Olds | 207 (100.0%) | 0 (0.0%) |
| 35 Years and over | 20 (27.4%) | 53 (72.6%) |
| Total | 1,855 (85.7%) | 310 (14.3%) |
Educational Attainment by Field of Study in Shiloh
Education (438 | 18.6%), business (371 | 15.8%), psychology (267 | 11.4%), science & technology (253 | 10.8%), and liberal arts & history (237 | 10.1%) are the most common fields of study among 2,348 individuals in Shiloh who have obtained a bachelor's degree or higher.
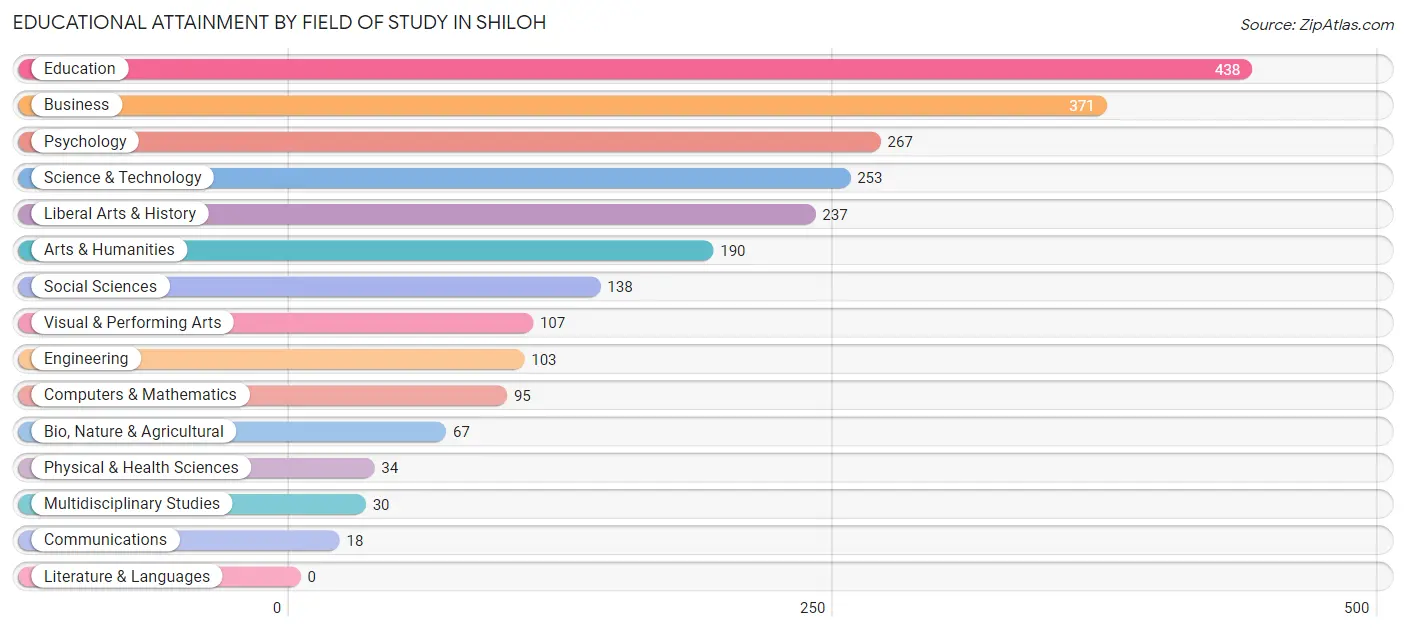
| Field of Study | # Graduates | % Graduates |
| Computers & Mathematics | 95 | 4.1% |
| Bio, Nature & Agricultural | 67 | 2.9% |
| Physical & Health Sciences | 34 | 1.5% |
| Psychology | 267 | 11.4% |
| Social Sciences | 138 | 5.9% |
| Engineering | 103 | 4.4% |
| Multidisciplinary Studies | 30 | 1.3% |
| Science & Technology | 253 | 10.8% |
| Business | 371 | 15.8% |
| Education | 438 | 18.6% |
| Literature & Languages | 0 | 0.0% |
| Liberal Arts & History | 237 | 10.1% |
| Visual & Performing Arts | 107 | 4.6% |
| Communications | 18 | 0.8% |
| Arts & Humanities | 190 | 8.1% |
| Total | 2,348 | 100.0% |
Transportation & Commute in Shiloh
Vehicle Availability by Sex in Shiloh
The most prevalent vehicle ownership categories in Shiloh are males with 2 vehicles (1,558, accounting for 49.1%) and females with 2 vehicles (1,097, making up 55.3%).
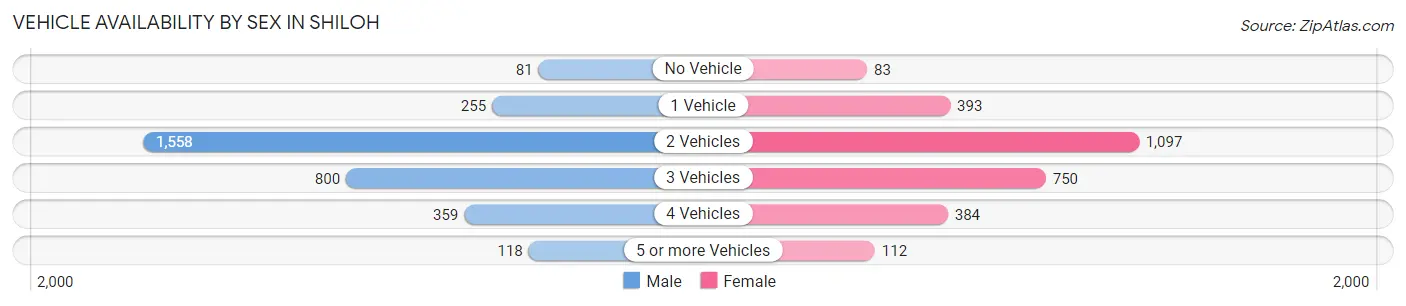
| Vehicles Available | Male | Female |
| No Vehicle | 81 (2.5%) | 83 (2.9%) |
| 1 Vehicle | 255 (8.0%) | 393 (13.9%) |
| 2 Vehicles | 1,558 (49.1%) | 1,097 (38.9%) |
| 3 Vehicles | 800 (25.2%) | 750 (26.6%) |
| 4 Vehicles | 359 (11.3%) | 384 (13.6%) |
| 5 or more Vehicles | 118 (3.7%) | 112 (4.0%) |
| Total | 3,171 (100.0%) | 2,819 (100.0%) |
Commute Time in Shiloh
The most frequently occuring commute durations in Shiloh are 20 to 24 minutes (1,295 commuters, 24.1%), 15 to 19 minutes (756 commuters, 14.1%), and 30 to 34 minutes (718 commuters, 13.4%).
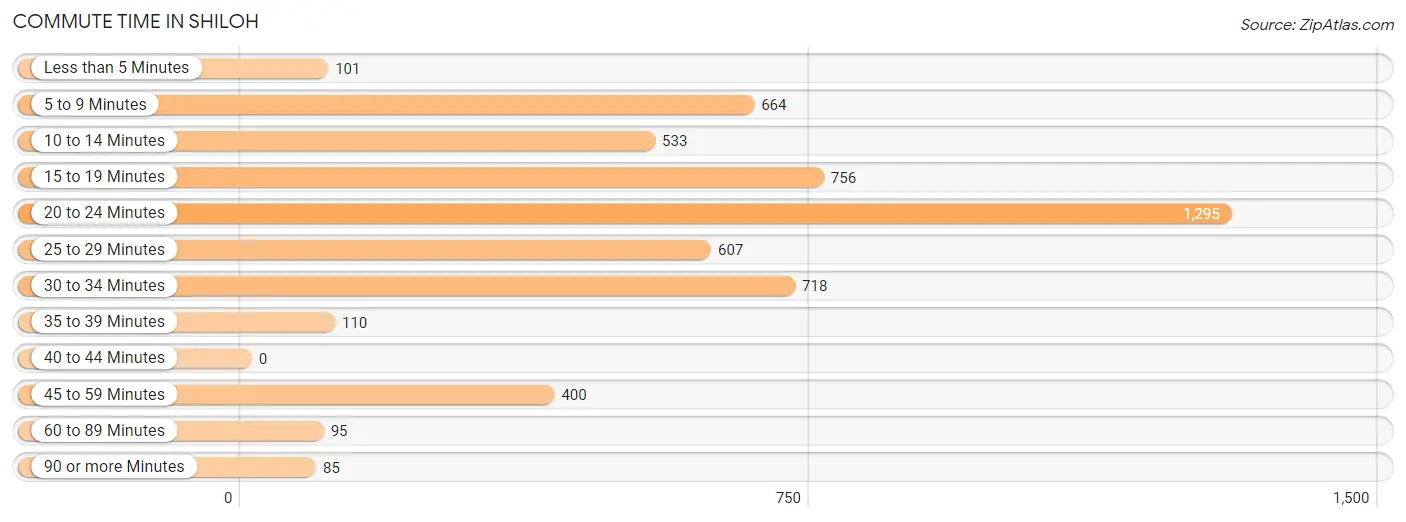
| Commute Time | # Commuters | % Commuters |
| Less than 5 Minutes | 101 | 1.9% |
| 5 to 9 Minutes | 664 | 12.4% |
| 10 to 14 Minutes | 533 | 9.9% |
| 15 to 19 Minutes | 756 | 14.1% |
| 20 to 24 Minutes | 1,295 | 24.1% |
| 25 to 29 Minutes | 607 | 11.3% |
| 30 to 34 Minutes | 718 | 13.4% |
| 35 to 39 Minutes | 110 | 2.1% |
| 40 to 44 Minutes | 0 | 0.0% |
| 45 to 59 Minutes | 400 | 7.5% |
| 60 to 89 Minutes | 95 | 1.8% |
| 90 or more Minutes | 85 | 1.6% |
Commute Time by Sex in Shiloh
The most common commute times in Shiloh are 20 to 24 minutes (567 commuters, 19.3%) for males and 20 to 24 minutes (728 commuters, 30.0%) for females.
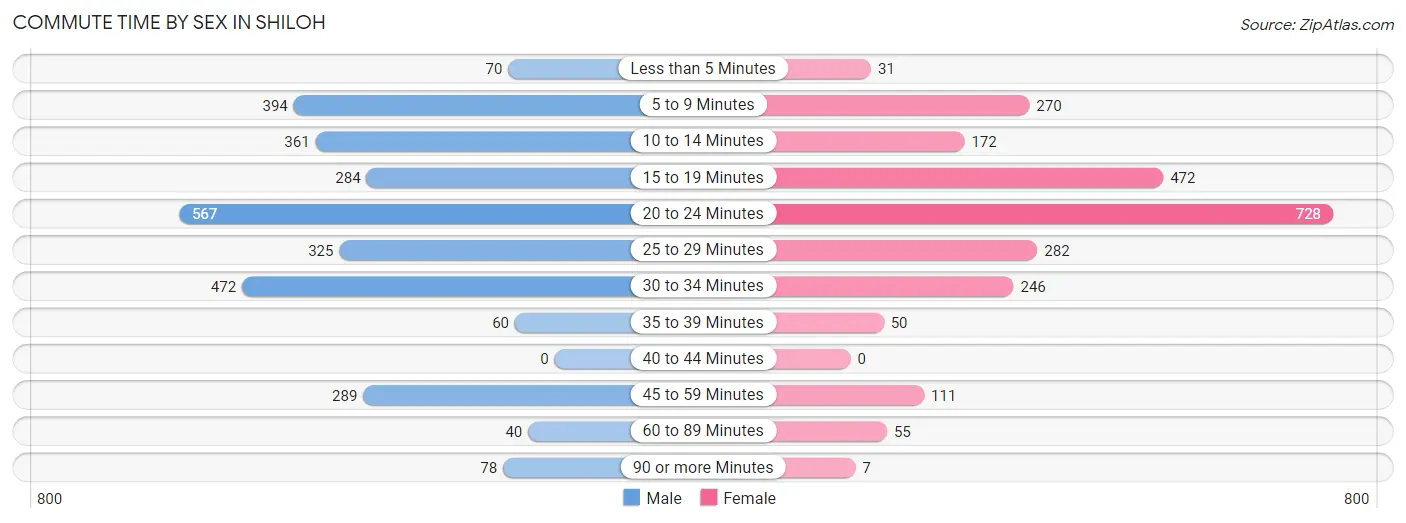
| Commute Time | Male | Female |
| Less than 5 Minutes | 70 (2.4%) | 31 (1.3%) |
| 5 to 9 Minutes | 394 (13.4%) | 270 (11.1%) |
| 10 to 14 Minutes | 361 (12.3%) | 172 (7.1%) |
| 15 to 19 Minutes | 284 (9.7%) | 472 (19.5%) |
| 20 to 24 Minutes | 567 (19.3%) | 728 (30.0%) |
| 25 to 29 Minutes | 325 (11.1%) | 282 (11.6%) |
| 30 to 34 Minutes | 472 (16.1%) | 246 (10.2%) |
| 35 to 39 Minutes | 60 (2.0%) | 50 (2.1%) |
| 40 to 44 Minutes | 0 (0.0%) | 0 (0.0%) |
| 45 to 59 Minutes | 289 (9.8%) | 111 (4.6%) |
| 60 to 89 Minutes | 40 (1.4%) | 55 (2.3%) |
| 90 or more Minutes | 78 (2.6%) | 7 (0.3%) |
Time of Departure to Work by Sex in Shiloh
The most frequent times of departure to work in Shiloh are 7:00 AM to 7:29 AM (426, 14.5%) for males and 6:30 AM to 6:59 AM (407, 16.8%) for females.
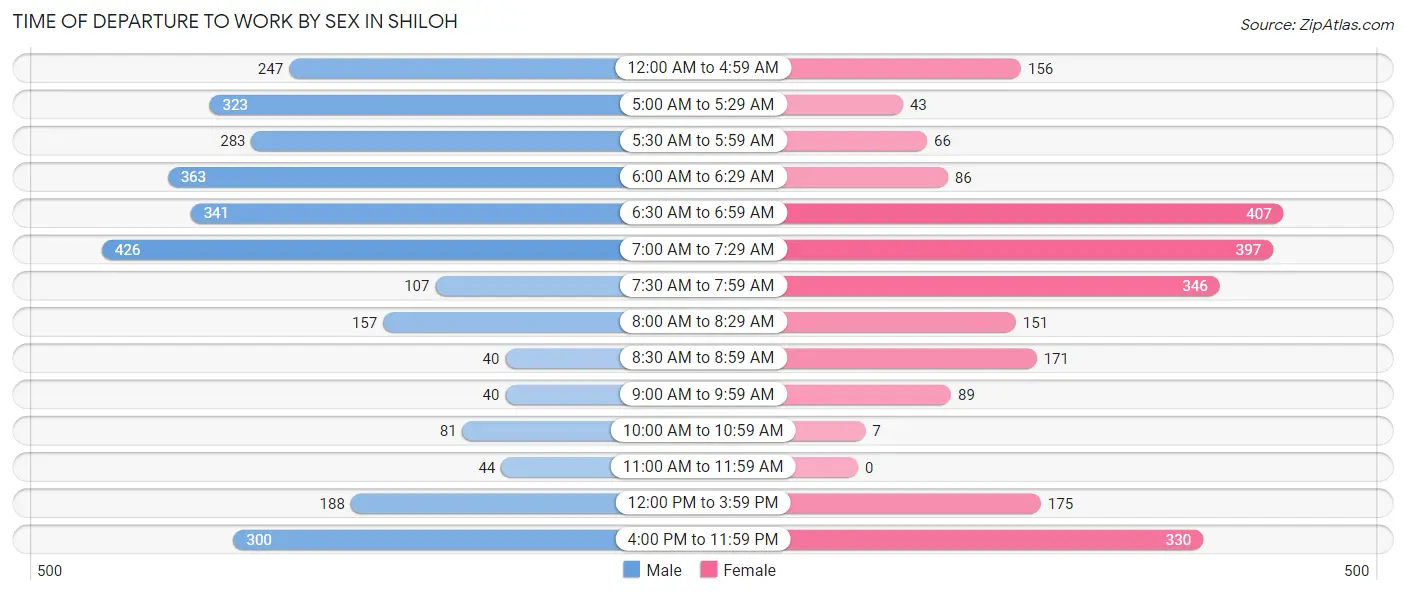
| Time of Departure | Male | Female |
| 12:00 AM to 4:59 AM | 247 (8.4%) | 156 (6.4%) |
| 5:00 AM to 5:29 AM | 323 (11.0%) | 43 (1.8%) |
| 5:30 AM to 5:59 AM | 283 (9.6%) | 66 (2.7%) |
| 6:00 AM to 6:29 AM | 363 (12.3%) | 86 (3.5%) |
| 6:30 AM to 6:59 AM | 341 (11.6%) | 407 (16.8%) |
| 7:00 AM to 7:29 AM | 426 (14.5%) | 397 (16.4%) |
| 7:30 AM to 7:59 AM | 107 (3.6%) | 346 (14.3%) |
| 8:00 AM to 8:29 AM | 157 (5.3%) | 151 (6.2%) |
| 8:30 AM to 8:59 AM | 40 (1.4%) | 171 (7.0%) |
| 9:00 AM to 9:59 AM | 40 (1.4%) | 89 (3.7%) |
| 10:00 AM to 10:59 AM | 81 (2.8%) | 7 (0.3%) |
| 11:00 AM to 11:59 AM | 44 (1.5%) | 0 (0.0%) |
| 12:00 PM to 3:59 PM | 188 (6.4%) | 175 (7.2%) |
| 4:00 PM to 11:59 PM | 300 (10.2%) | 330 (13.6%) |
| Total | 2,940 (100.0%) | 2,424 (100.0%) |
Housing Occupancy in Shiloh
Occupancy by Ownership in Shiloh
Of the total 4,707 dwellings in Shiloh, owner-occupied units account for 3,076 (65.3%), while renter-occupied units make up 1,631 (34.6%).
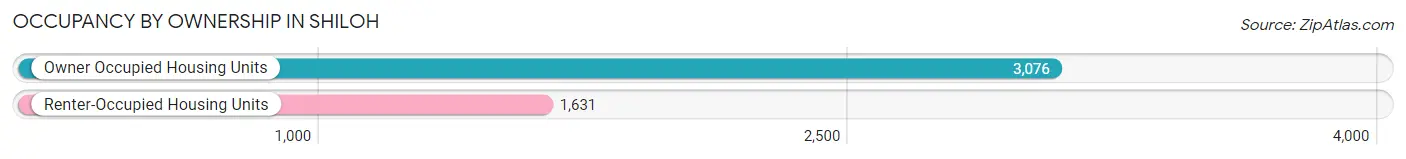
| Occupancy | # Housing Units | % Housing Units |
| Owner Occupied Housing Units | 3,076 | 65.3% |
| Renter-Occupied Housing Units | 1,631 | 34.6% |
| Total Occupied Housing Units | 4,707 | 100.0% |
Occupancy by Household Size in Shiloh
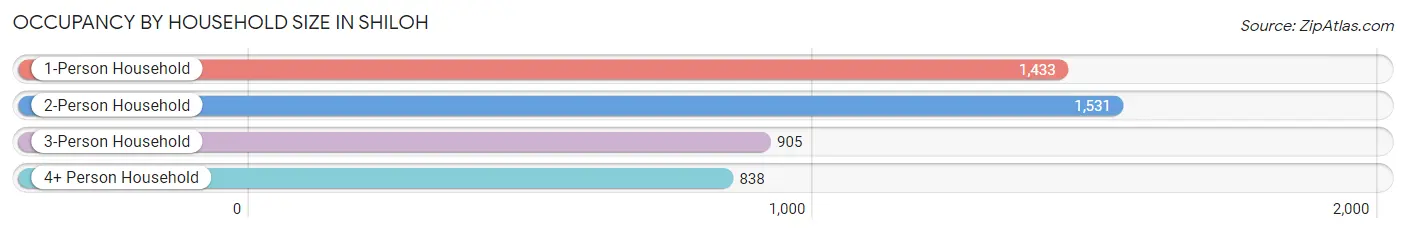
| Household Size | # Housing Units | % Housing Units |
| 1-Person Household | 1,433 | 30.4% |
| 2-Person Household | 1,531 | 32.5% |
| 3-Person Household | 905 | 19.2% |
| 4+ Person Household | 838 | 17.8% |
| Total Housing Units | 4,707 | 100.0% |
Occupancy by Ownership by Household Size in Shiloh
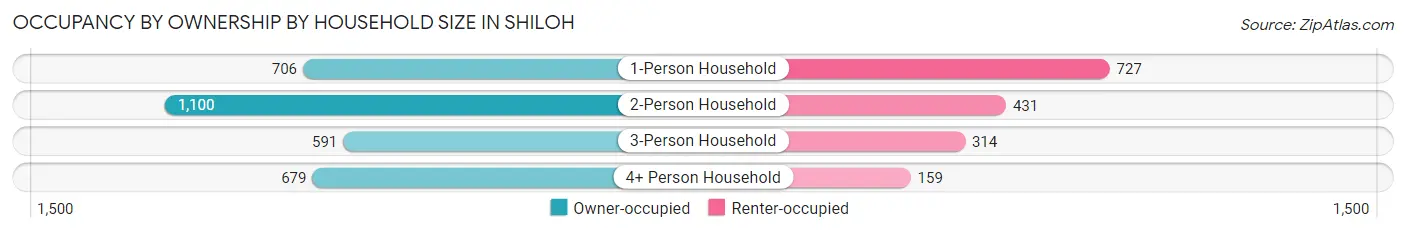
| Household Size | Owner-occupied | Renter-occupied |
| 1-Person Household | 706 (49.3%) | 727 (50.7%) |
| 2-Person Household | 1,100 (71.9%) | 431 (28.1%) |
| 3-Person Household | 591 (65.3%) | 314 (34.7%) |
| 4+ Person Household | 679 (81.0%) | 159 (19.0%) |
| Total Housing Units | 3,076 (65.3%) | 1,631 (34.6%) |
Occupancy by Educational Attainment in Shiloh
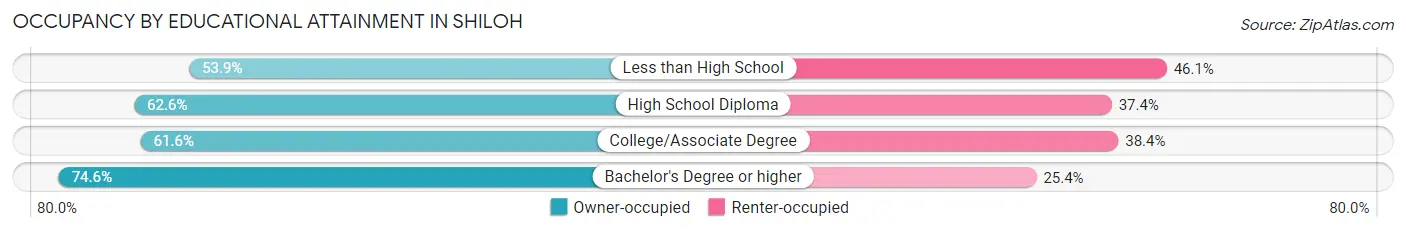
| Household Size | Owner-occupied | Renter-occupied |
| Less than High School | 110 (53.9%) | 94 (46.1%) |
| High School Diploma | 902 (62.6%) | 538 (37.4%) |
| College/Associate Degree | 1,046 (61.6%) | 652 (38.4%) |
| Bachelor's Degree or higher | 1,018 (74.6%) | 347 (25.4%) |
Occupancy by Age of Householder in Shiloh
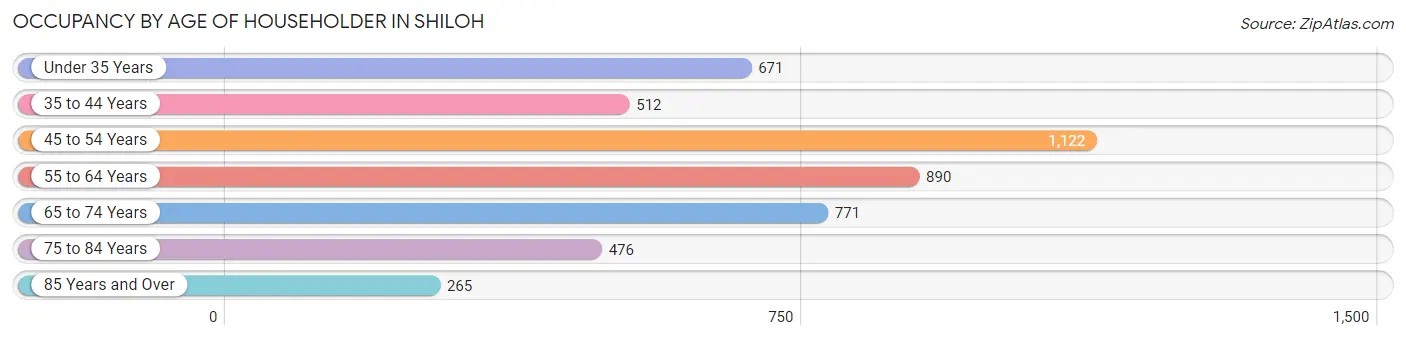
| Age Bracket | # Households | % Households |
| Under 35 Years | 671 | 14.3% |
| 35 to 44 Years | 512 | 10.9% |
| 45 to 54 Years | 1,122 | 23.8% |
| 55 to 64 Years | 890 | 18.9% |
| 65 to 74 Years | 771 | 16.4% |
| 75 to 84 Years | 476 | 10.1% |
| 85 Years and Over | 265 | 5.6% |
| Total | 4,707 | 100.0% |
Housing Finances in Shiloh
Median Income by Occupancy in Shiloh
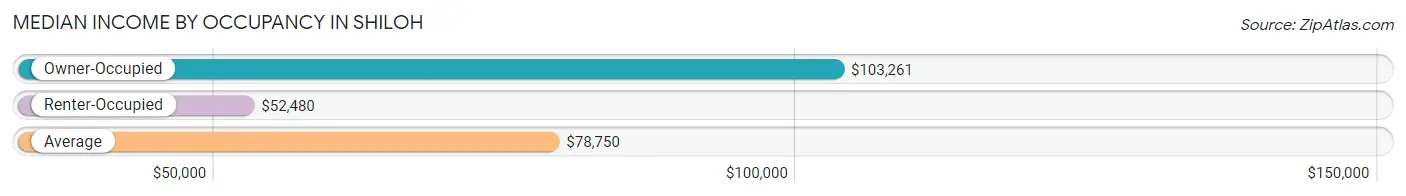
| Occupancy Type | # Households | Median Income |
| Owner-Occupied | 3,076 (65.3%) | $103,261 |
| Renter-Occupied | 1,631 (34.6%) | $52,480 |
| Average | 4,707 (100.0%) | $78,750 |
Occupancy by Householder Income Bracket in Shiloh
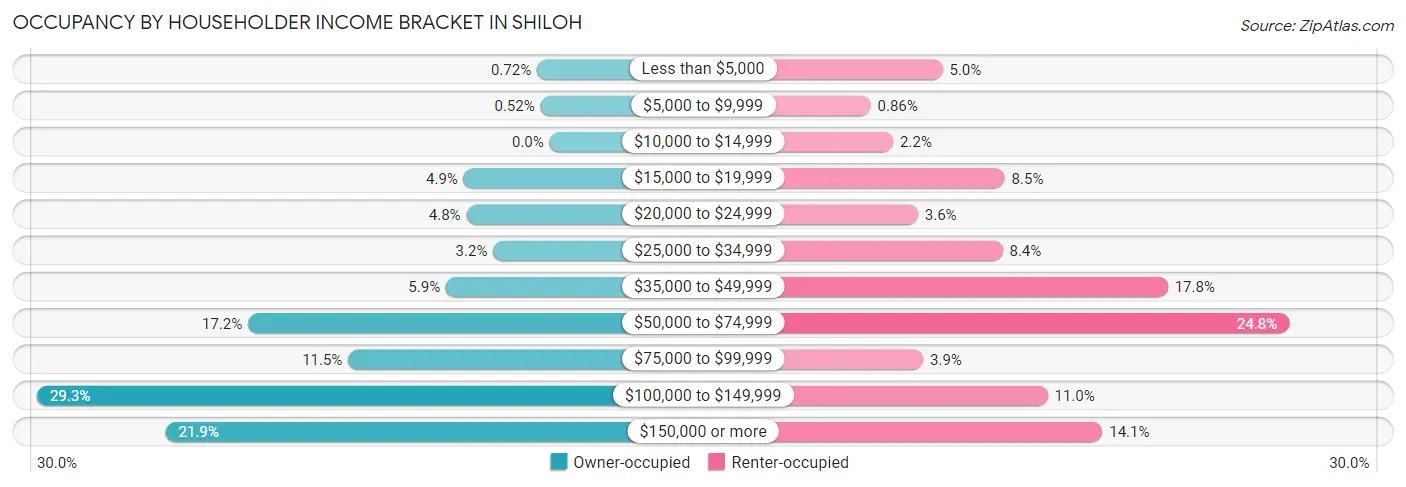
| Income Bracket | Owner-occupied | Renter-occupied |
| Less than $5,000 | 22 (0.7%) | 81 (5.0%) |
| $5,000 to $9,999 | 16 (0.5%) | 14 (0.9%) |
| $10,000 to $14,999 | 0 (0.0%) | 35 (2.1%) |
| $15,000 to $19,999 | 151 (4.9%) | 139 (8.5%) |
| $20,000 to $24,999 | 146 (4.8%) | 58 (3.6%) |
| $25,000 to $34,999 | 99 (3.2%) | 137 (8.4%) |
| $35,000 to $49,999 | 182 (5.9%) | 291 (17.8%) |
| $50,000 to $74,999 | 530 (17.2%) | 404 (24.8%) |
| $75,000 to $99,999 | 354 (11.5%) | 63 (3.9%) |
| $100,000 to $149,999 | 901 (29.3%) | 179 (11.0%) |
| $150,000 or more | 675 (21.9%) | 230 (14.1%) |
| Total | 3,076 (100.0%) | 1,631 (100.0%) |
Monthly Housing Cost Tiers in Shiloh
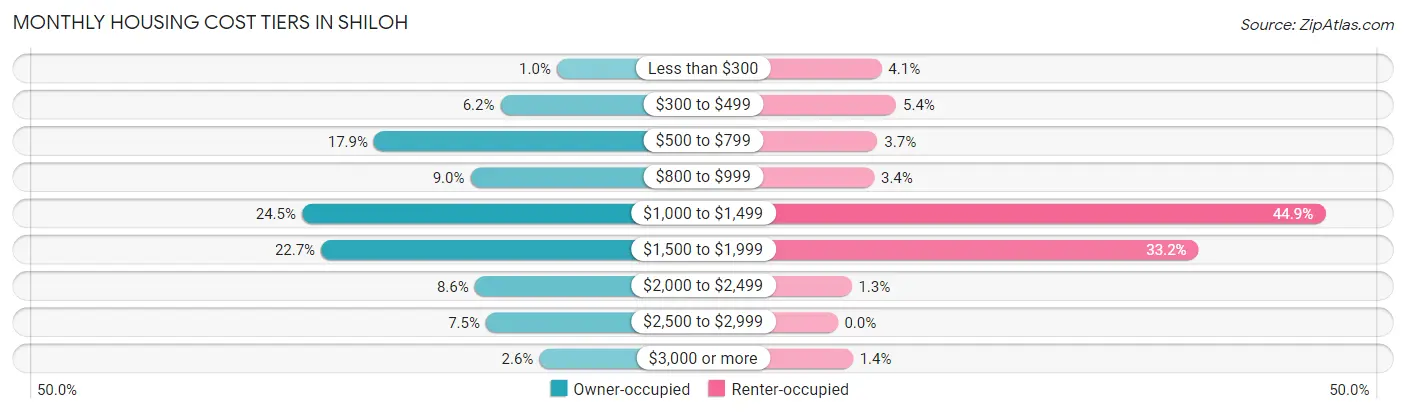
| Monthly Cost | Owner-occupied | Renter-occupied |
| Less than $300 | 31 (1.0%) | 66 (4.1%) |
| $300 to $499 | 191 (6.2%) | 88 (5.4%) |
| $500 to $799 | 549 (17.8%) | 60 (3.7%) |
| $800 to $999 | 276 (9.0%) | 55 (3.4%) |
| $1,000 to $1,499 | 753 (24.5%) | 732 (44.9%) |
| $1,500 to $1,999 | 699 (22.7%) | 542 (33.2%) |
| $2,000 to $2,499 | 264 (8.6%) | 21 (1.3%) |
| $2,500 to $2,999 | 232 (7.5%) | 0 (0.0%) |
| $3,000 or more | 81 (2.6%) | 23 (1.4%) |
| Total | 3,076 (100.0%) | 1,631 (100.0%) |
Physical Housing Characteristics in Shiloh
Housing Structures in Shiloh
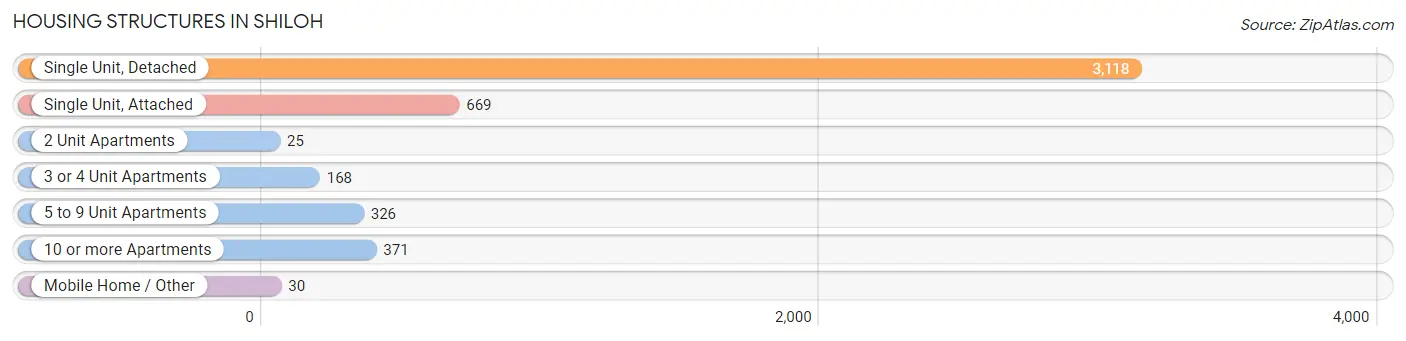
| Structure Type | # Housing Units | % Housing Units |
| Single Unit, Detached | 3,118 | 66.2% |
| Single Unit, Attached | 669 | 14.2% |
| 2 Unit Apartments | 25 | 0.5% |
| 3 or 4 Unit Apartments | 168 | 3.6% |
| 5 to 9 Unit Apartments | 326 | 6.9% |
| 10 or more Apartments | 371 | 7.9% |
| Mobile Home / Other | 30 | 0.6% |
| Total | 4,707 | 100.0% |
Housing Structures by Occupancy in Shiloh
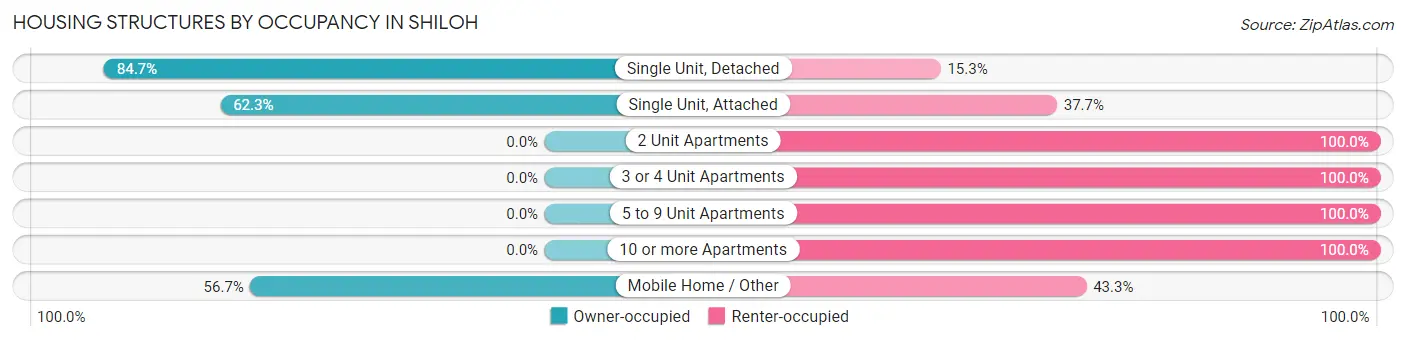
| Structure Type | Owner-occupied | Renter-occupied |
| Single Unit, Detached | 2,642 (84.7%) | 476 (15.3%) |
| Single Unit, Attached | 417 (62.3%) | 252 (37.7%) |
| 2 Unit Apartments | 0 (0.0%) | 25 (100.0%) |
| 3 or 4 Unit Apartments | 0 (0.0%) | 168 (100.0%) |
| 5 to 9 Unit Apartments | 0 (0.0%) | 326 (100.0%) |
| 10 or more Apartments | 0 (0.0%) | 371 (100.0%) |
| Mobile Home / Other | 17 (56.7%) | 13 (43.3%) |
| Total | 3,076 (65.3%) | 1,631 (34.6%) |
Housing Structures by Number of Rooms in Shiloh
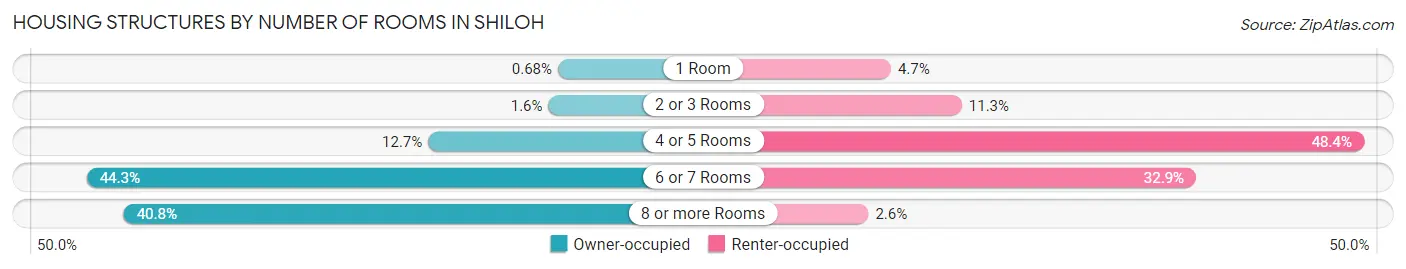
| Number of Rooms | Owner-occupied | Renter-occupied |
| 1 Room | 21 (0.7%) | 77 (4.7%) |
| 2 or 3 Rooms | 48 (1.6%) | 184 (11.3%) |
| 4 or 5 Rooms | 390 (12.7%) | 790 (48.4%) |
| 6 or 7 Rooms | 1,361 (44.3%) | 537 (32.9%) |
| 8 or more Rooms | 1,256 (40.8%) | 43 (2.6%) |
| Total | 3,076 (100.0%) | 1,631 (100.0%) |
Housing Structure by Heating Type in Shiloh
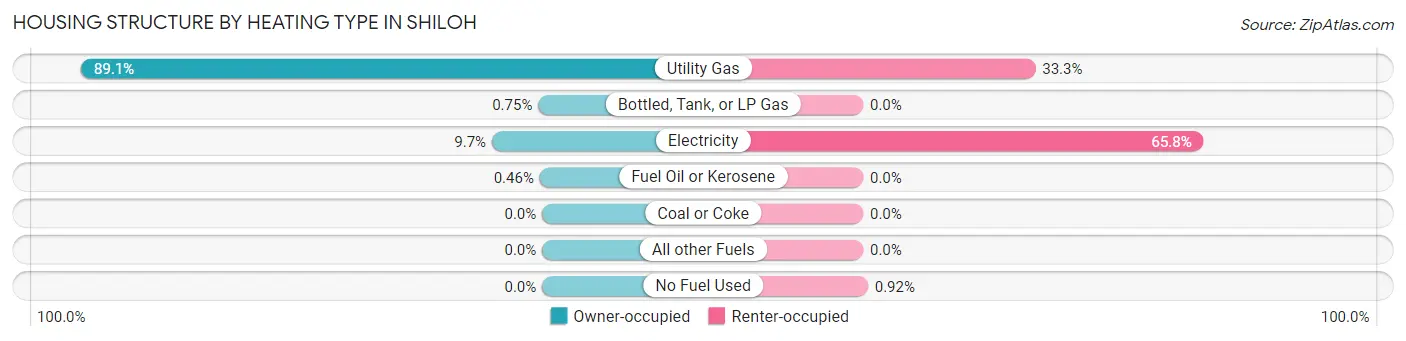
| Heating Type | Owner-occupied | Renter-occupied |
| Utility Gas | 2,741 (89.1%) | 543 (33.3%) |
| Bottled, Tank, or LP Gas | 23 (0.7%) | 0 (0.0%) |
| Electricity | 298 (9.7%) | 1,073 (65.8%) |
| Fuel Oil or Kerosene | 14 (0.5%) | 0 (0.0%) |
| Coal or Coke | 0 (0.0%) | 0 (0.0%) |
| All other Fuels | 0 (0.0%) | 0 (0.0%) |
| No Fuel Used | 0 (0.0%) | 15 (0.9%) |
| Total | 3,076 (100.0%) | 1,631 (100.0%) |
Household Vehicle Usage in Shiloh
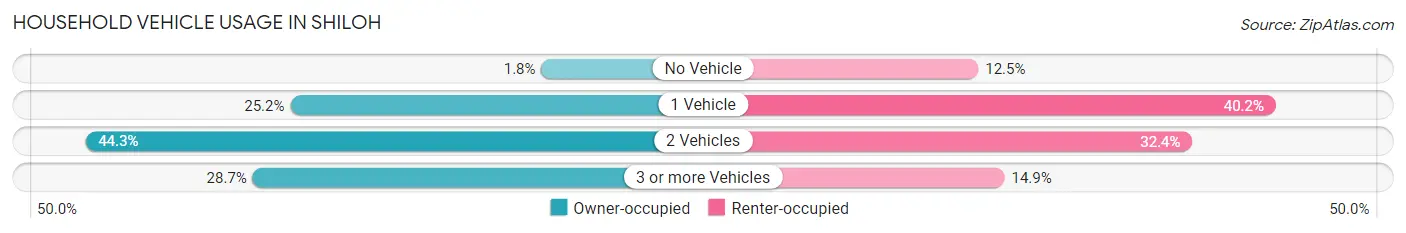
| Vehicles per Household | Owner-occupied | Renter-occupied |
| No Vehicle | 54 (1.8%) | 203 (12.4%) |
| 1 Vehicle | 775 (25.2%) | 656 (40.2%) |
| 2 Vehicles | 1,364 (44.3%) | 529 (32.4%) |
| 3 or more Vehicles | 883 (28.7%) | 243 (14.9%) |
| Total | 3,076 (100.0%) | 1,631 (100.0%) |
Real Estate & Mortgages in Shiloh
Real Estate and Mortgage Overview in Shiloh
| Characteristic | Without Mortgage | With Mortgage |
| Housing Units | 1,144 | 1,932 |
| Median Property Value | $216,100 | $224,100 |
| Median Household Income | $66,144 | $533 |
| Monthly Housing Costs | $698 | $81 |
| Real Estate Taxes | $4,100 | $0 |
Property Value by Mortgage Status in Shiloh
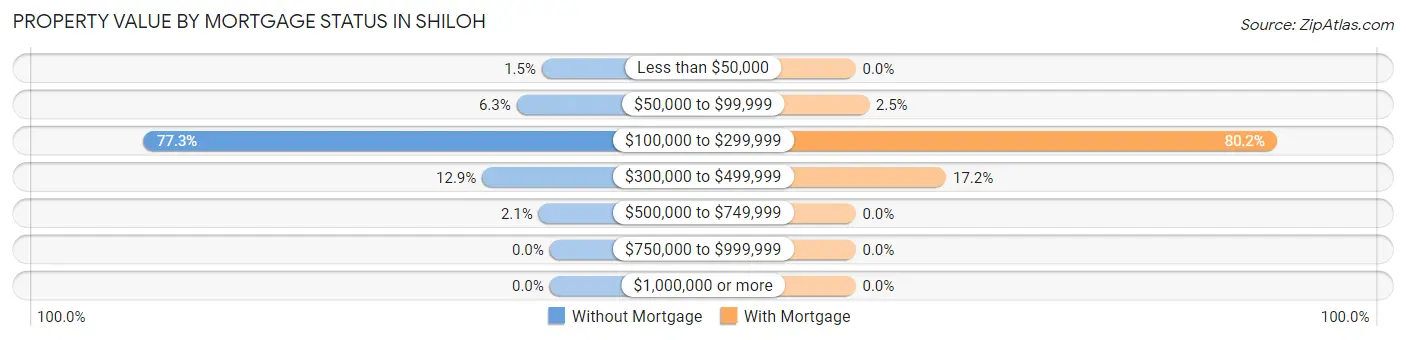
| Property Value | Without Mortgage | With Mortgage |
| Less than $50,000 | 17 (1.5%) | 0 (0.0%) |
| $50,000 to $99,999 | 72 (6.3%) | 49 (2.5%) |
| $100,000 to $299,999 | 884 (77.3%) | 1,550 (80.2%) |
| $300,000 to $499,999 | 147 (12.9%) | 333 (17.2%) |
| $500,000 to $749,999 | 24 (2.1%) | 0 (0.0%) |
| $750,000 to $999,999 | 0 (0.0%) | 0 (0.0%) |
| $1,000,000 or more | 0 (0.0%) | 0 (0.0%) |
| Total | 1,144 (100.0%) | 1,932 (100.0%) |
Household Income by Mortgage Status in Shiloh
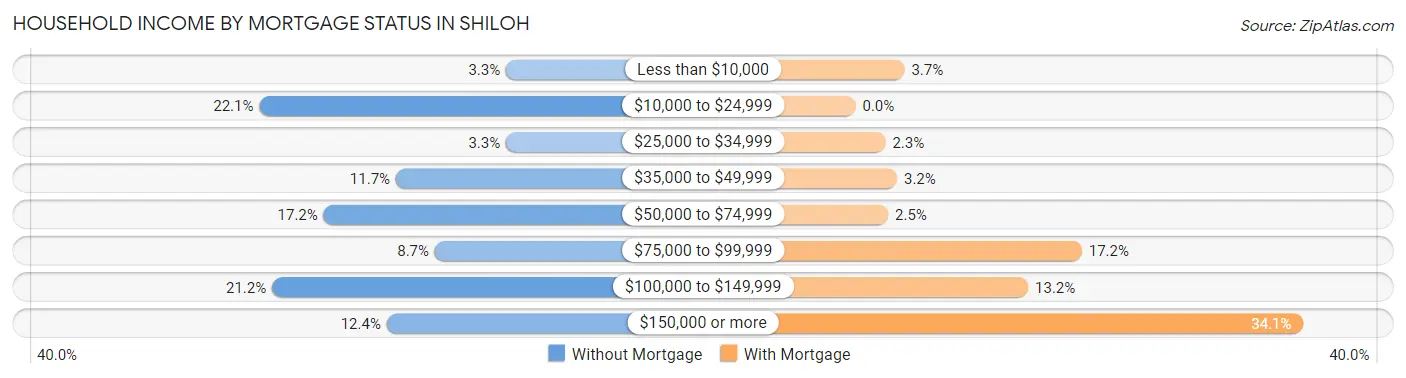
| Household Income | Without Mortgage | With Mortgage |
| Less than $10,000 | 38 (3.3%) | 72 (3.7%) |
| $10,000 to $24,999 | 253 (22.1%) | 0 (0.0%) |
| $25,000 to $34,999 | 38 (3.3%) | 44 (2.3%) |
| $35,000 to $49,999 | 134 (11.7%) | 61 (3.2%) |
| $50,000 to $74,999 | 197 (17.2%) | 48 (2.5%) |
| $75,000 to $99,999 | 100 (8.7%) | 333 (17.2%) |
| $100,000 to $149,999 | 242 (21.1%) | 254 (13.2%) |
| $150,000 or more | 142 (12.4%) | 659 (34.1%) |
| Total | 1,144 (100.0%) | 1,932 (100.0%) |
Property Value to Household Income Ratio in Shiloh
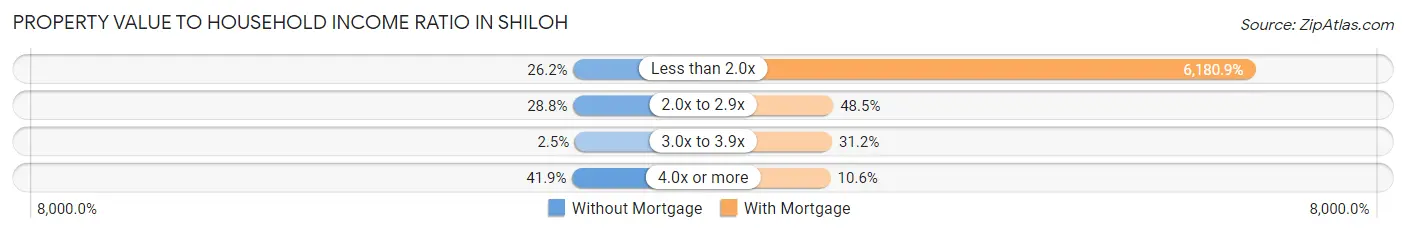
| Value-to-Income Ratio | Without Mortgage | With Mortgage |
| Less than 2.0x | 300 (26.2%) | 119,414 (6,180.9%) |
| 2.0x to 2.9x | 329 (28.8%) | 937 (48.5%) |
| 3.0x to 3.9x | 28 (2.5%) | 603 (31.2%) |
| 4.0x or more | 479 (41.9%) | 204 (10.6%) |
| Total | 1,144 (100.0%) | 1,932 (100.0%) |
Real Estate Taxes by Mortgage Status in Shiloh
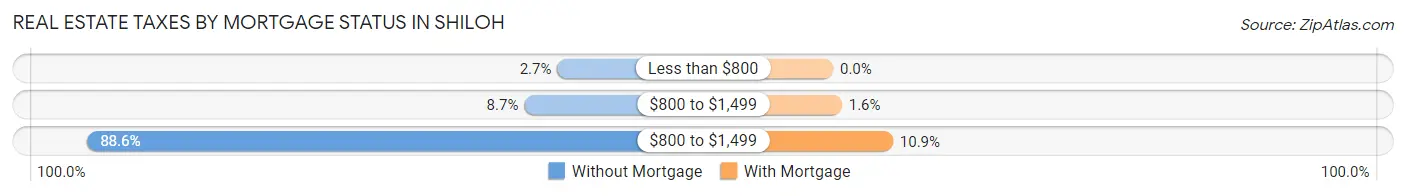
| Property Taxes | Without Mortgage | With Mortgage |
| Less than $800 | 31 (2.7%) | 0 (0.0%) |
| $800 to $1,499 | 100 (8.7%) | 31 (1.6%) |
| $800 to $1,499 | 1,013 (88.5%) | 211 (10.9%) |
| Total | 1,144 (100.0%) | 1,932 (100.0%) |
Health & Disability in Shiloh
Health Insurance Coverage by Age in Shiloh
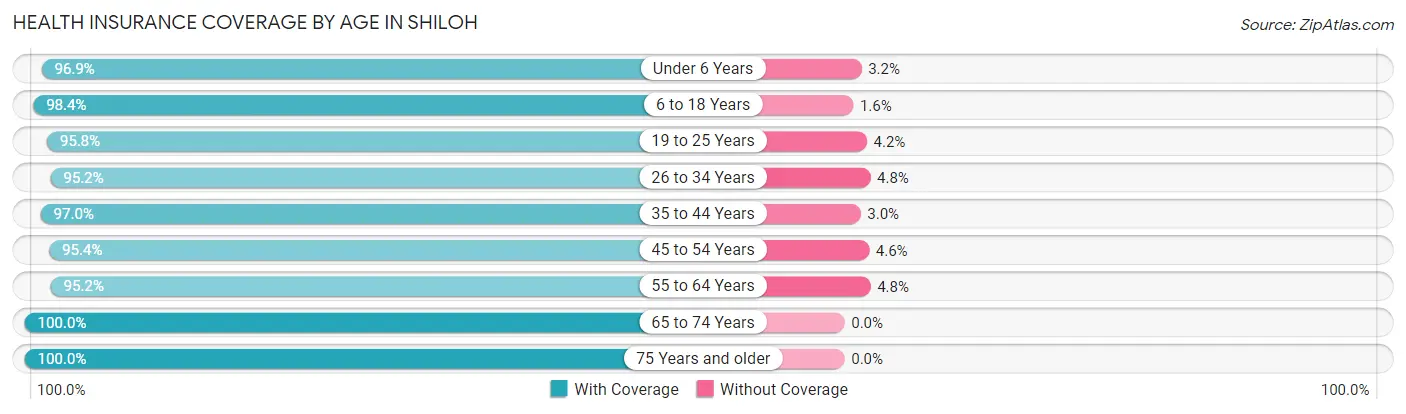
| Age Bracket | With Coverage | Without Coverage |
| Under 6 Years | 615 (96.9%) | 20 (3.2%) |
| 6 to 18 Years | 1,405 (98.4%) | 23 (1.6%) |
| 19 to 25 Years | 922 (95.8%) | 40 (4.2%) |
| 26 to 34 Years | 989 (95.2%) | 50 (4.8%) |
| 35 to 44 Years | 1,196 (97.0%) | 37 (3.0%) |
| 45 to 54 Years | 1,728 (95.4%) | 83 (4.6%) |
| 55 to 64 Years | 1,454 (95.2%) | 74 (4.8%) |
| 65 to 74 Years | 1,280 (100.0%) | 0 (0.0%) |
| 75 Years and older | 1,108 (100.0%) | 0 (0.0%) |
| Total | 10,697 (97.0%) | 327 (3.0%) |
Health Insurance Coverage by Citizenship Status in Shiloh
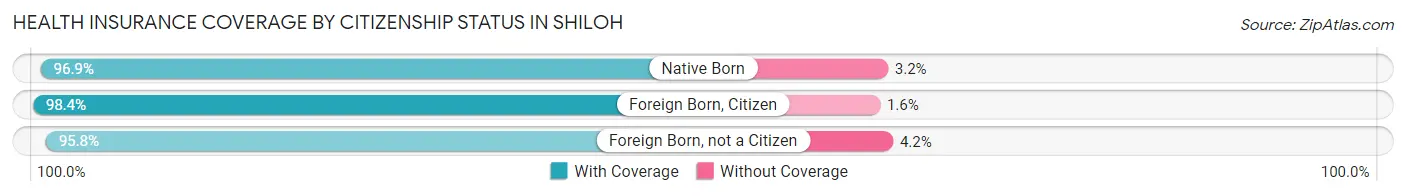
| Citizenship Status | With Coverage | Without Coverage |
| Native Born | 615 (96.9%) | 20 (3.2%) |
| Foreign Born, Citizen | 1,405 (98.4%) | 23 (1.6%) |
| Foreign Born, not a Citizen | 922 (95.8%) | 40 (4.2%) |
Health Insurance Coverage by Household Income in Shiloh
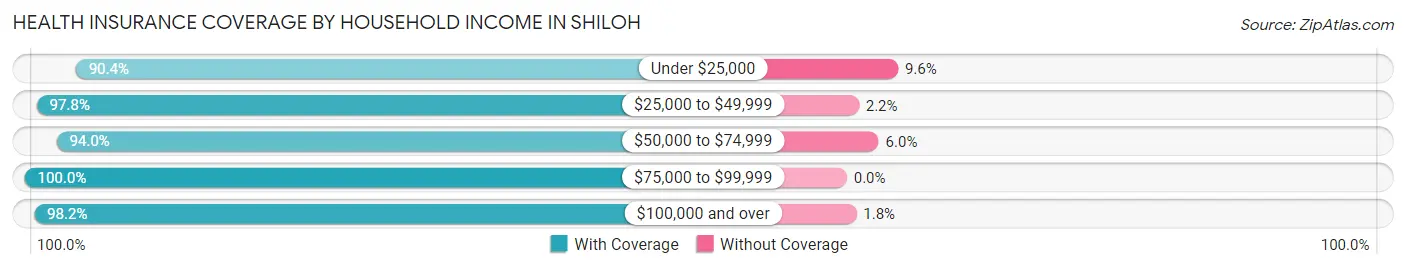
| Household Income | With Coverage | Without Coverage |
| Under $25,000 | 783 (90.4%) | 83 (9.6%) |
| $25,000 to $49,999 | 1,006 (97.8%) | 23 (2.2%) |
| $50,000 to $74,999 | 1,797 (94.0%) | 114 (6.0%) |
| $75,000 to $99,999 | 1,105 (100.0%) | 0 (0.0%) |
| $100,000 and over | 5,882 (98.2%) | 107 (1.8%) |
Public vs Private Health Insurance Coverage by Age in Shiloh
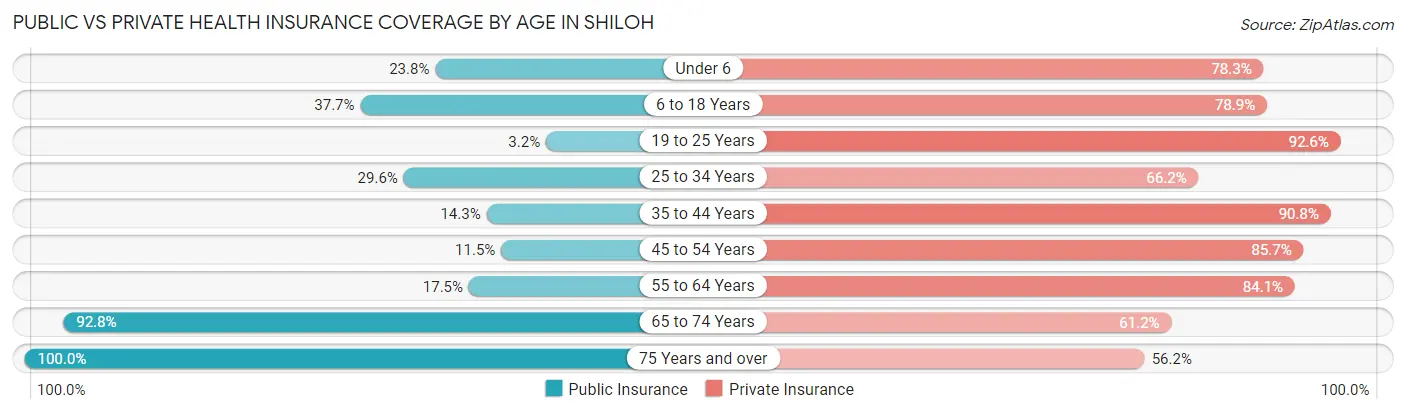
| Age Bracket | Public Insurance | Private Insurance |
| Under 6 | 151 (23.8%) | 497 (78.3%) |
| 6 to 18 Years | 538 (37.7%) | 1,127 (78.9%) |
| 19 to 25 Years | 31 (3.2%) | 891 (92.6%) |
| 25 to 34 Years | 308 (29.6%) | 688 (66.2%) |
| 35 to 44 Years | 176 (14.3%) | 1,119 (90.7%) |
| 45 to 54 Years | 209 (11.5%) | 1,552 (85.7%) |
| 55 to 64 Years | 268 (17.5%) | 1,285 (84.1%) |
| 65 to 74 Years | 1,188 (92.8%) | 783 (61.2%) |
| 75 Years and over | 1,108 (100.0%) | 623 (56.2%) |
| Total | 3,977 (36.1%) | 8,565 (77.7%) |
Disability Status by Sex by Age in Shiloh
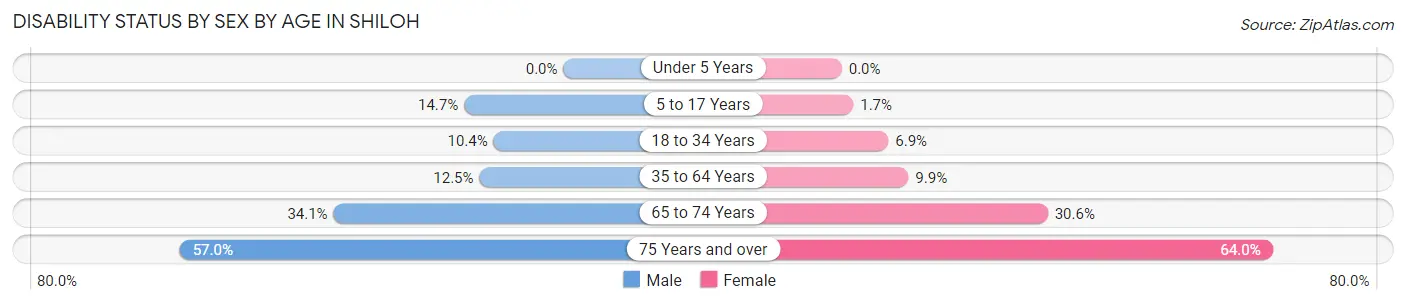
| Age Bracket | Male | Female |
| Under 5 Years | 0 (0.0%) | 0 (0.0%) |
| 5 to 17 Years | 111 (14.7%) | 12 (1.7%) |
| 18 to 34 Years | 107 (10.4%) | 72 (6.9%) |
| 35 to 64 Years | 299 (12.5%) | 215 (9.9%) |
| 65 to 74 Years | 197 (34.1%) | 215 (30.6%) |
| 75 Years and over | 315 (57.0%) | 355 (64.0%) |
Disability Class by Sex by Age in Shiloh
Disability Class: Hearing Difficulty
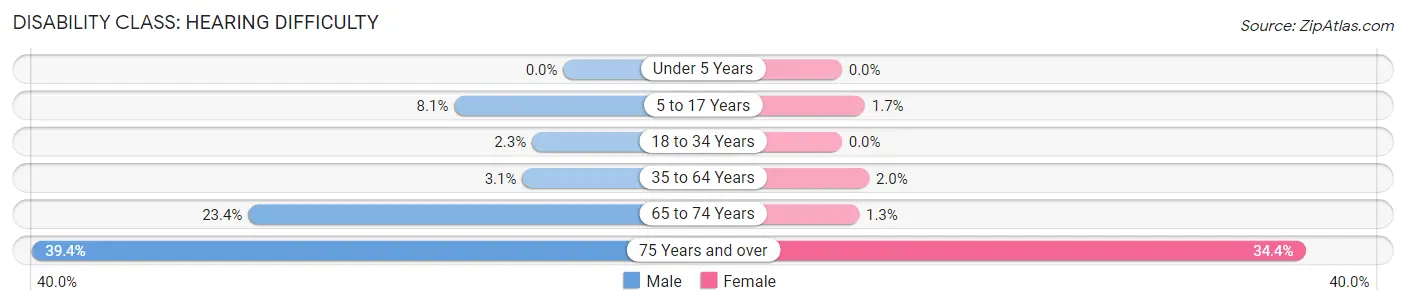
| Age Bracket | Male | Female |
| Under 5 Years | 0 (0.0%) | 0 (0.0%) |
| 5 to 17 Years | 61 (8.1%) | 12 (1.7%) |
| 18 to 34 Years | 24 (2.3%) | 0 (0.0%) |
| 35 to 64 Years | 73 (3.0%) | 44 (2.0%) |
| 65 to 74 Years | 135 (23.4%) | 9 (1.3%) |
| 75 Years and over | 218 (39.4%) | 191 (34.4%) |
Disability Class: Vision Difficulty
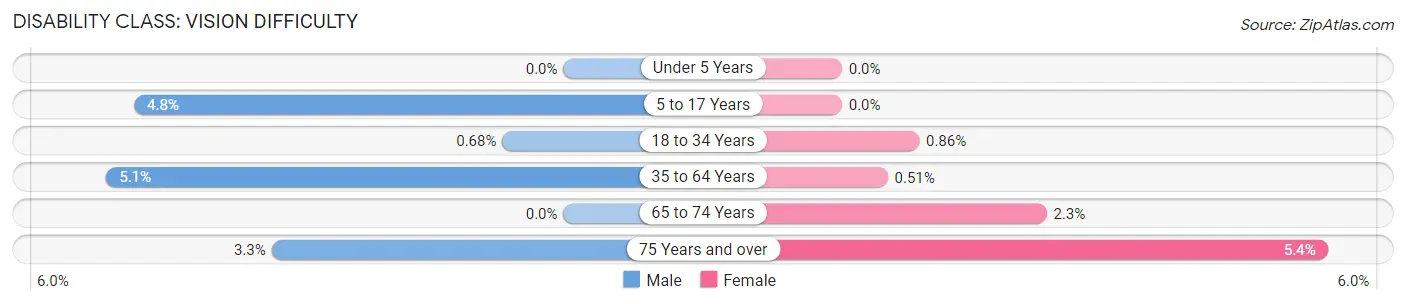
| Age Bracket | Male | Female |
| Under 5 Years | 0 (0.0%) | 0 (0.0%) |
| 5 to 17 Years | 36 (4.8%) | 0 (0.0%) |
| 18 to 34 Years | 7 (0.7%) | 9 (0.9%) |
| 35 to 64 Years | 122 (5.1%) | 11 (0.5%) |
| 65 to 74 Years | 0 (0.0%) | 16 (2.3%) |
| 75 Years and over | 18 (3.3%) | 30 (5.4%) |
Disability Class: Cognitive Difficulty
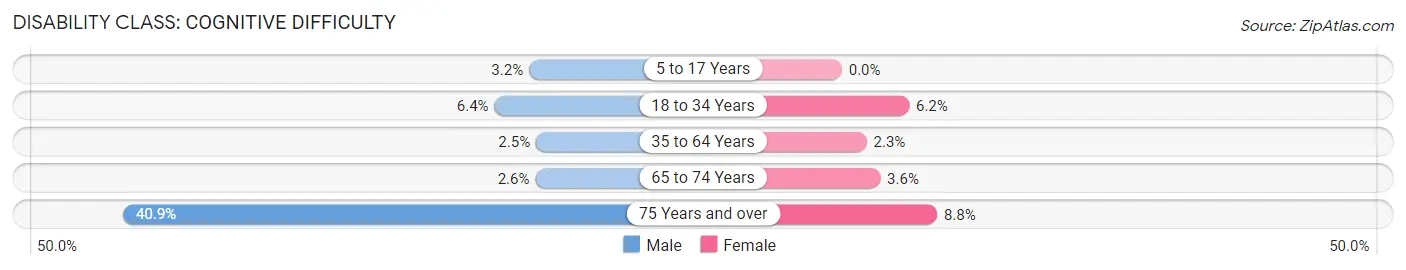
| Age Bracket | Male | Female |
| 5 to 17 Years | 24 (3.2%) | 0 (0.0%) |
| 18 to 34 Years | 66 (6.4%) | 65 (6.2%) |
| 35 to 64 Years | 61 (2.5%) | 50 (2.3%) |
| 65 to 74 Years | 15 (2.6%) | 25 (3.6%) |
| 75 Years and over | 226 (40.9%) | 49 (8.8%) |
Disability Class: Ambulatory Difficulty
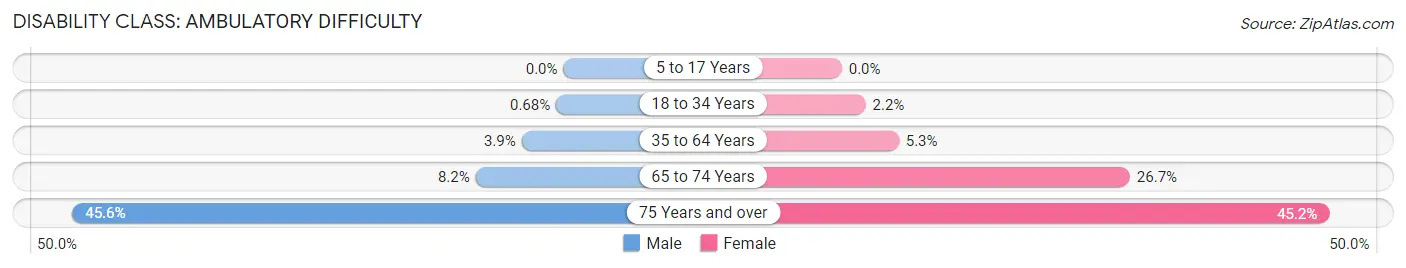
| Age Bracket | Male | Female |
| 5 to 17 Years | 0 (0.0%) | 0 (0.0%) |
| 18 to 34 Years | 7 (0.7%) | 23 (2.2%) |
| 35 to 64 Years | 93 (3.9%) | 115 (5.3%) |
| 65 to 74 Years | 47 (8.2%) | 188 (26.7%) |
| 75 Years and over | 252 (45.6%) | 251 (45.2%) |
Disability Class: Self-Care Difficulty
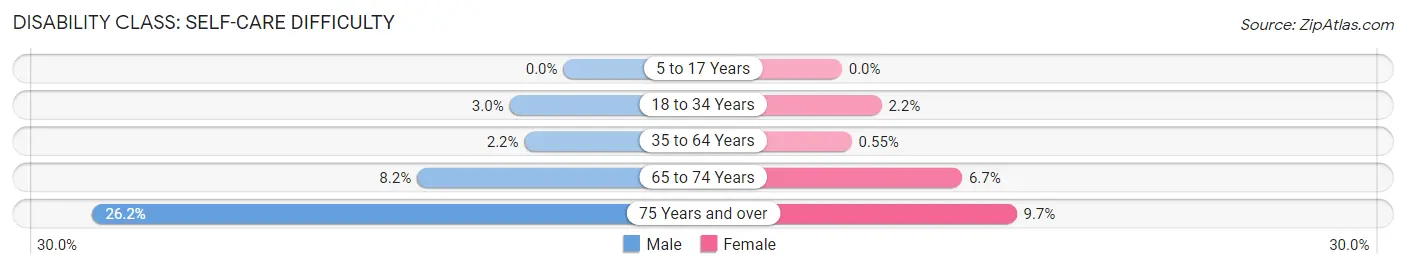
| Age Bracket | Male | Female |
| 5 to 17 Years | 0 (0.0%) | 0 (0.0%) |
| 18 to 34 Years | 31 (3.0%) | 23 (2.2%) |
| 35 to 64 Years | 52 (2.2%) | 12 (0.5%) |
| 65 to 74 Years | 47 (8.2%) | 47 (6.7%) |
| 75 Years and over | 145 (26.2%) | 54 (9.7%) |
Technology Access in Shiloh
Computing Device Access in Shiloh
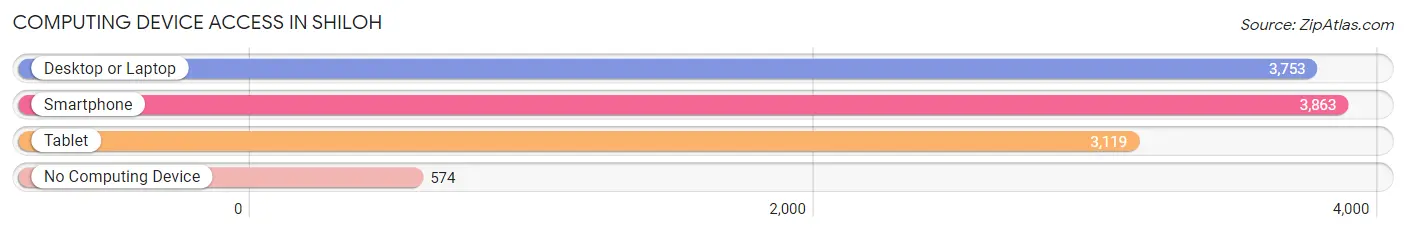
| Device Type | # Households | % Households |
| Desktop or Laptop | 3,753 | 79.7% |
| Smartphone | 3,863 | 82.1% |
| Tablet | 3,119 | 66.3% |
| No Computing Device | 574 | 12.2% |
| Total | 4,707 | 100.0% |
Internet Access in Shiloh
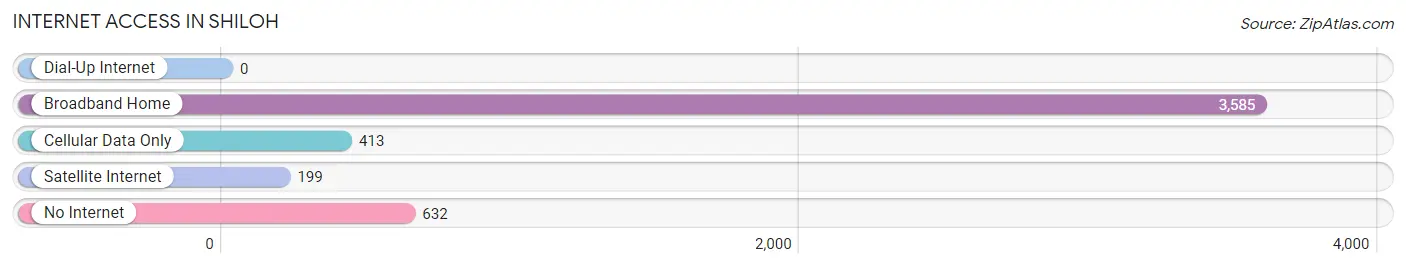
| Internet Type | # Households | % Households |
| Dial-Up Internet | 0 | 0.0% |
| Broadband Home | 3,585 | 76.2% |
| Cellular Data Only | 413 | 8.8% |
| Satellite Internet | 199 | 4.2% |
| No Internet | 632 | 13.4% |
| Total | 4,707 | 100.0% |
Shiloh Summary
Shiloh, Pennsylvania is a small borough located in the southeastern corner of York County, Pennsylvania. It is situated along the Susquehanna River, approximately 10 miles south of the city of York. The population of Shiloh was 1,845 as of the 2010 census.
Geography
Shiloh is located at 39°51'45"N 76°37'45"W (39.8624, -76.6293). According to the United States Census Bureau, the borough has a total area of 0.7 square miles (1.8 km2), all of it land.
History
Shiloh was first settled in 1750 by German immigrants. The town was originally known as "Shilohville" and was incorporated as a borough in 1872. The name "Shiloh" is derived from the Hebrew Bible, where it is the name of a place of peace and rest.
The town was an important stop on the Underground Railroad, with many of the town's residents helping to hide and transport escaped slaves.
Economy
Shiloh is a small, rural community with a primarily agricultural economy. The town is home to several small businesses, including a grocery store, a hardware store, and a few restaurants.
The town is also home to a number of small manufacturing companies, including a plastics manufacturer, a metal fabricator, and a machine shop.
Demographics
As of the 2010 census, the population of Shiloh was 1,845. The racial makeup of the borough was 97.2% White, 0.7% African American, 0.2% Native American, 0.3% Asian, 0.2% from other races, and 1.6% from two or more races. Hispanic or Latino of any race were 1.2% of the population.
The median income for a household in the borough was $45,000, and the median income for a family was $50,000. The per capita income for the borough was $20,000. About 8.2% of families and 10.2% of the population were below the poverty line, including 14.2% of those under age 18 and 8.2% of those age 65 or over.
Conclusion
Shiloh, Pennsylvania is a small borough located in the southeastern corner of York County. It is a rural community with a primarily agricultural economy, and is home to several small businesses and manufacturing companies. The population of Shiloh was 1,845 as of the 2010 census, and the median income for a household in the borough was $45,000. Shiloh has a long history, having been settled in 1750 and playing an important role in the Underground Railroad.
Common Questions
What is the Total Population of Shiloh?
Total Population of Shiloh is 11,290.
What is the Total Male Population of Shiloh?
Total Male Population of Shiloh is 5,714.
What is the Total Female Population of Shiloh?
Total Female Population of Shiloh is 5,576.
What is the Ratio of Males per 100 Females in Shiloh?
There are 102.47 Males per 100 Females in Shiloh.
What is the Ratio of Females per 100 Males in Shiloh?
There are 97.58 Females per 100 Males in Shiloh.
What is the Median Population Age in Shiloh?
Median Population Age in Shiloh is 47.0 Years.
What is the Average Family Size in Shiloh
Average Family Size in Shiloh is 2.9 People.
What is the Average Household Size in Shiloh
Average Household Size in Shiloh is 2.3 People.
What is Per Capita Income in Shiloh?
Per Capita income in Shiloh is $40,918.
What is the Median Family Income in Shiloh?
Median Family Income in Shiloh is $116,951.
What is the Median Household income in Shiloh?
Median Household Income in Shiloh is $78,750.
What is Income or Wage Gap in Shiloh?
Income or Wage Gap in Shiloh is 38.4%.
Women in Shiloh earn 61.6 cents for every dollar earned by a man.
What is Inequality or Gini Index in Shiloh?
Inequality or Gini Index in Shiloh is 0.39.
How Large is the Labor Force in Shiloh?
There are 6,230 People in the Labor Forcein in Shiloh.
What is the Percentage of People in the Labor Force in Shiloh?
63.6% of People are in the Labor Force in Shiloh.
What is the Unemployment Rate in Shiloh?
Unemployment Rate in Shiloh is 1.3%.