Hemlock Farms, PA
Hemlock Farms Map
Hemlock Farms Overview
3,647
TOTAL POPULATION
1,926
MALE POPULATION
1,721
FEMALE POPULATION
111.91
MALES / 100 FEMALES
89.36
FEMALES / 100 MALES
56.1
MEDIAN AGE
2.5
AVG FAMILY SIZE
2.1
AVG HOUSEHOLD SIZE
$46,800
PER CAPITA INCOME
$92,757
AVG FAMILY INCOME
$79,002
AVG HOUSEHOLD INCOME
25.3%
WAGE / INCOME GAP [ % ]
74.7¢/ $1
WAGE / INCOME GAP [ $ ]
0.37
INEQUALITY / GINI INDEX
1,839
LABOR FORCE [ PEOPLE ]
56.8%
PERCENT IN LABOR FORCE
11.6%
UNEMPLOYMENT RATE
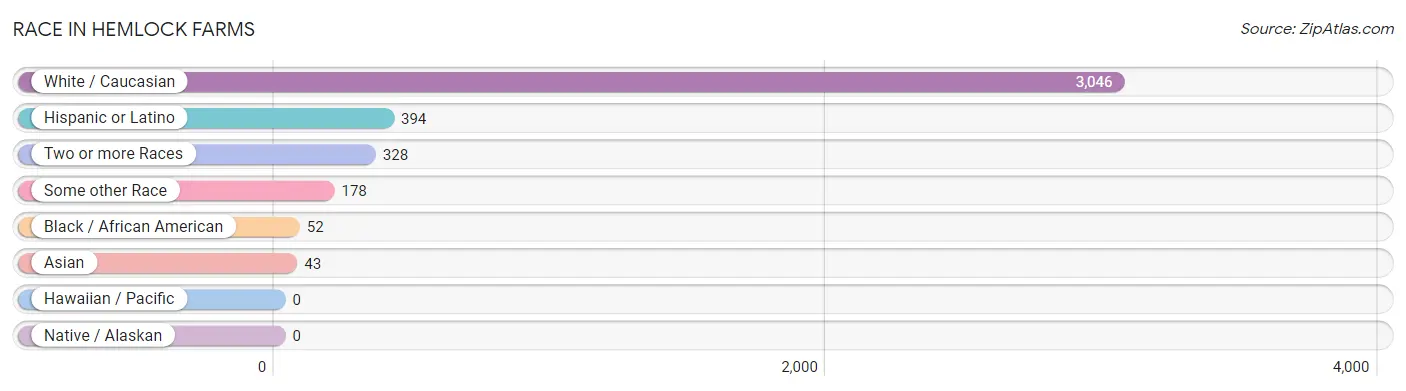
Race in Hemlock Farms
The most populous races in Hemlock Farms are White / Caucasian (3,046 | 83.5%), Hispanic or Latino (394 | 10.8%), and Two or more Races (328 | 9.0%).
| Race | # Population | % Population |
| Asian | 43 | 1.2% |
| Black / African American | 52 | 1.4% |
| Hawaiian / Pacific | 0 | 0.0% |
| Hispanic or Latino | 394 | 10.8% |
| Native / Alaskan | 0 | 0.0% |
| White / Caucasian | 3,046 | 83.5% |
| Two or more Races | 328 | 9.0% |
| Some other Race | 178 | 4.9% |
| Total | 3,647 | 100.0% |
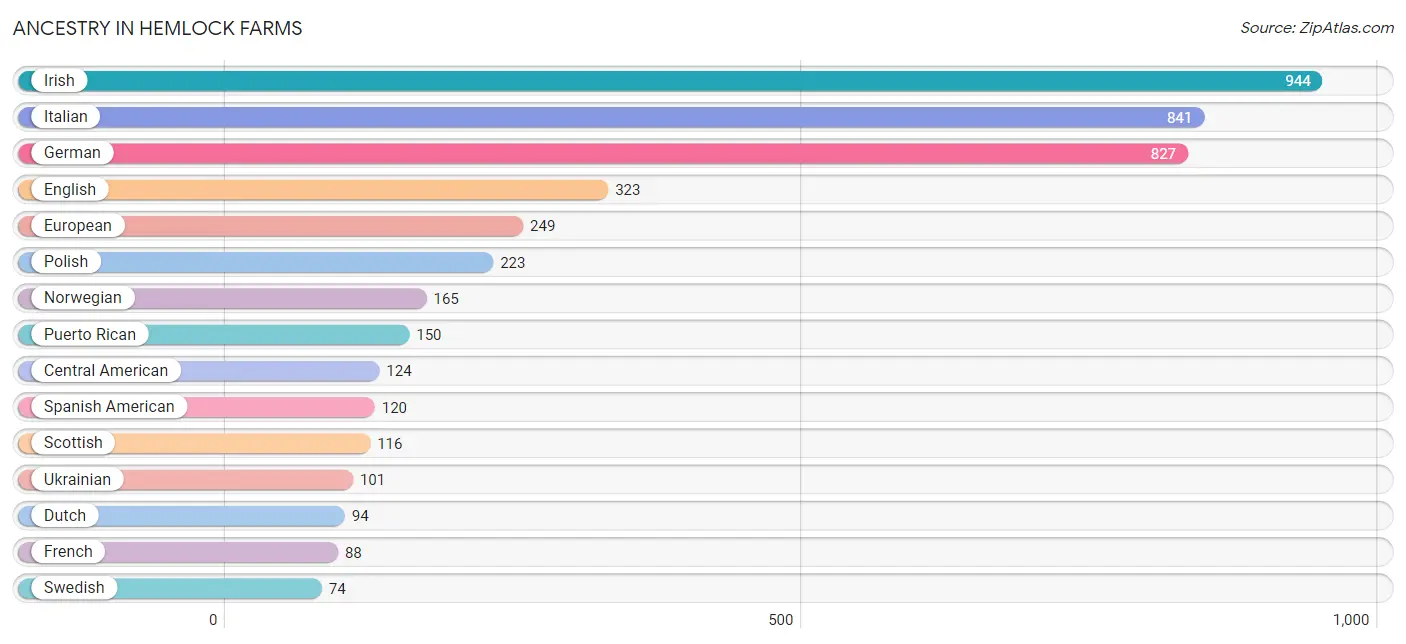
Ancestry in Hemlock Farms
The most populous ancestries reported in Hemlock Farms are Irish (944 | 25.9%), Italian (841 | 23.1%), German (827 | 22.7%), English (323 | 8.9%), and European (249 | 6.8%), together accounting for 87.3% of all Hemlock Farms residents.
| Ancestry | # Population | % Population |
| American | 71 | 1.9% |
| Armenian | 26 | 0.7% |
| Austrian | 41 | 1.1% |
| Central American | 124 | 3.4% |
| Danish | 52 | 1.4% |
| Dutch | 94 | 2.6% |
| Eastern European | 35 | 1.0% |
| English | 323 | 8.9% |
| European | 249 | 6.8% |
| Finnish | 33 | 0.9% |
| French | 88 | 2.4% |
| German | 827 | 22.7% |
| Guatemalan | 66 | 1.8% |
| Hungarian | 18 | 0.5% |
| Indian (Asian) | 43 | 1.2% |
| Irish | 944 | 25.9% |
| Italian | 841 | 23.1% |
| Norwegian | 165 | 4.5% |
| Polish | 223 | 6.1% |
| Portuguese | 27 | 0.7% |
| Puerto Rican | 150 | 4.1% |
| Romanian | 33 | 0.9% |
| Salvadoran | 58 | 1.6% |
| Scandinavian | 41 | 1.1% |
| Scottish | 116 | 3.2% |
| Spanish American | 120 | 3.3% |
| Swedish | 74 | 2.0% |
| Ukrainian | 101 | 2.8% | View All 28 Rows |
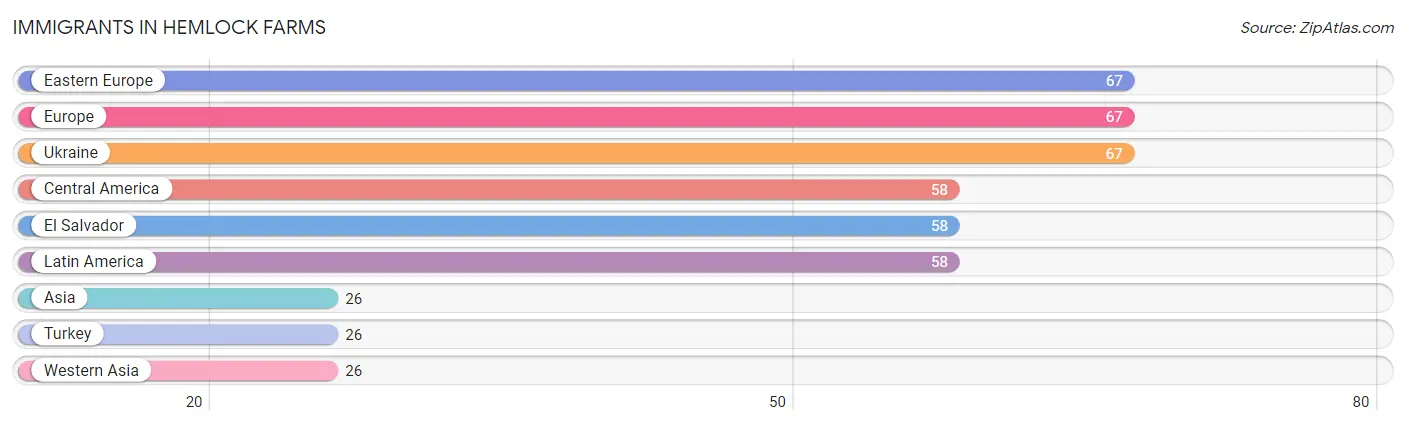
Immigrants in Hemlock Farms
The most numerous immigrant groups reported in Hemlock Farms came from Eastern Europe (67 | 1.8%), Europe (67 | 1.8%), Ukraine (67 | 1.8%), Central America (58 | 1.6%), and El Salvador (58 | 1.6%), together accounting for 8.7% of all Hemlock Farms residents.
| Immigration Origin | # Population | % Population |
| Asia | 26 | 0.7% |
| Central America | 58 | 1.6% |
| Eastern Europe | 67 | 1.8% |
| El Salvador | 58 | 1.6% |
| Europe | 67 | 1.8% |
| Latin America | 58 | 1.6% |
| Turkey | 26 | 0.7% |
| Ukraine | 67 | 1.8% |
| Western Asia | 26 | 0.7% | View All 9 Rows |
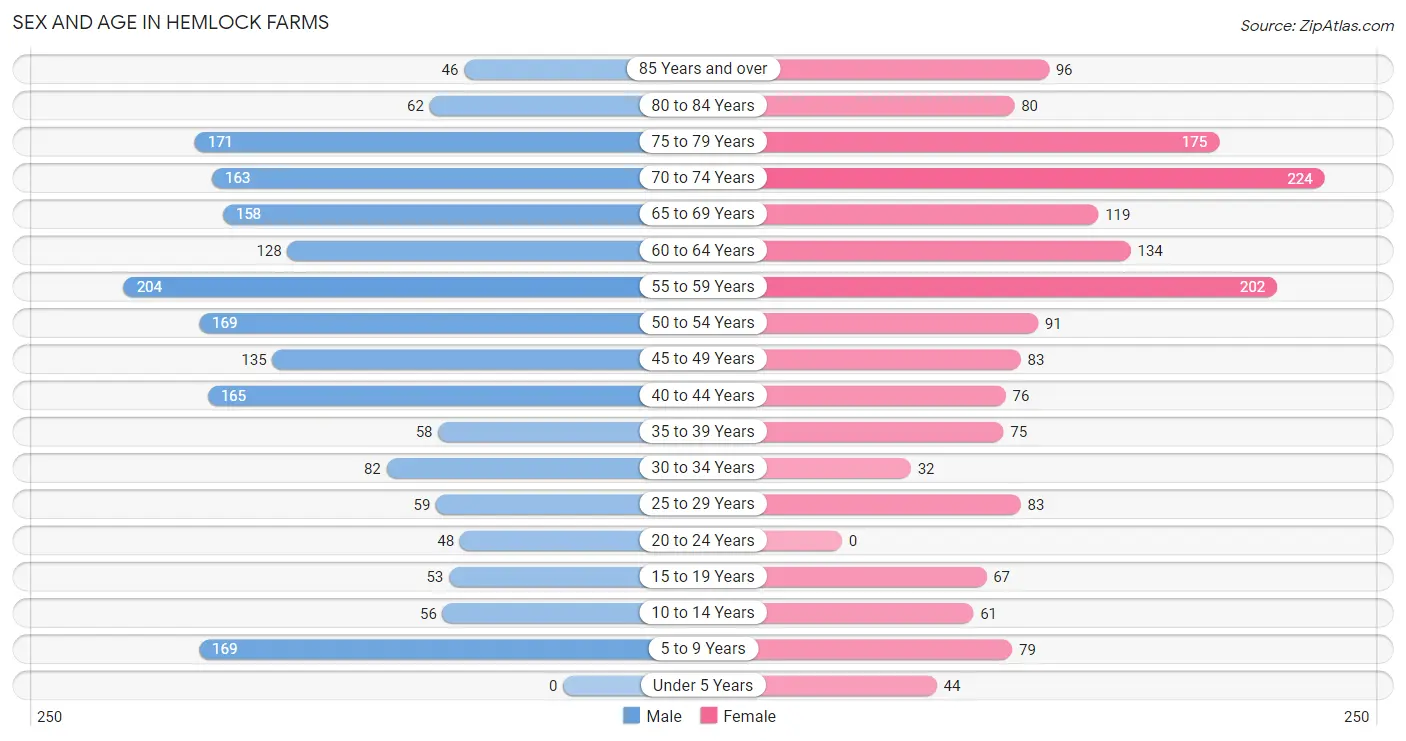
Sex and Age in Hemlock Farms
Sex and Age in Hemlock Farms
The most populous age groups in Hemlock Farms are 55 to 59 Years (204 | 10.6%) for men and 70 to 74 Years (224 | 13.0%) for women.
| Age Bracket | Male | Female |
| Under 5 Years | 0 (0.0%) | 44 (2.6%) |
| 5 to 9 Years | 169 (8.8%) | 79 (4.6%) |
| 10 to 14 Years | 56 (2.9%) | 61 (3.5%) |
| 15 to 19 Years | 53 (2.8%) | 67 (3.9%) |
| 20 to 24 Years | 48 (2.5%) | 0 (0.0%) |
| 25 to 29 Years | 59 (3.1%) | 83 (4.8%) |
| 30 to 34 Years | 82 (4.3%) | 32 (1.9%) |
| 35 to 39 Years | 58 (3.0%) | 75 (4.4%) |
| 40 to 44 Years | 165 (8.6%) | 76 (4.4%) |
| 45 to 49 Years | 135 (7.0%) | 83 (4.8%) |
| 50 to 54 Years | 169 (8.8%) | 91 (5.3%) |
| 55 to 59 Years | 204 (10.6%) | 202 (11.7%) |
| 60 to 64 Years | 128 (6.7%) | 134 (7.8%) |
| 65 to 69 Years | 158 (8.2%) | 119 (6.9%) |
| 70 to 74 Years | 163 (8.5%) | 224 (13.0%) |
| 75 to 79 Years | 171 (8.9%) | 175 (10.2%) |
| 80 to 84 Years | 62 (3.2%) | 80 (4.6%) |
| 85 Years and over | 46 (2.4%) | 96 (5.6%) |
| Total | 1,926 (100.0%) | 1,721 (100.0%) |
Families and Households in Hemlock Farms
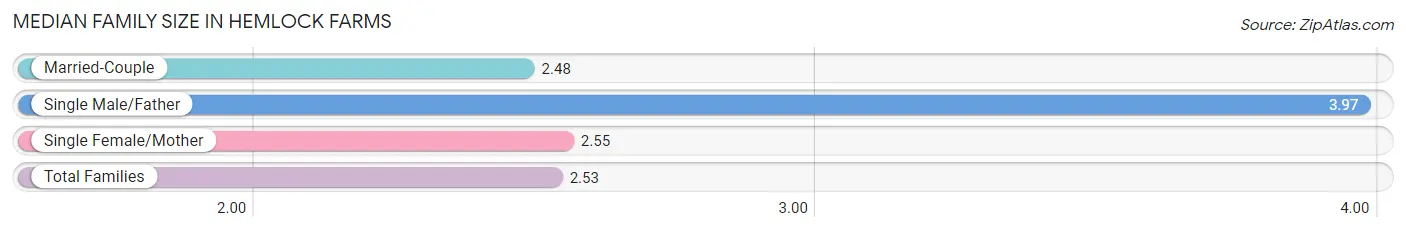
Median Family Size in Hemlock Farms
The median family size in Hemlock Farms is 2.53 persons per family, with single male/father families (32 | 3.1%) accounting for the largest median family size of 3.97 persons per family. On the other hand, married-couple families (947 | 90.8%) represent the smallest median family size with 2.48 persons per family.
| Family Type | # Families | Family Size |
| Married-Couple | 947 (90.8%) | 2.48 |
| Single Male/Father | 32 (3.1%) | 3.97 |
| Single Female/Mother | 64 (6.1%) | 2.55 |
| Total Families | 1,043 (100.0%) | 2.53 |
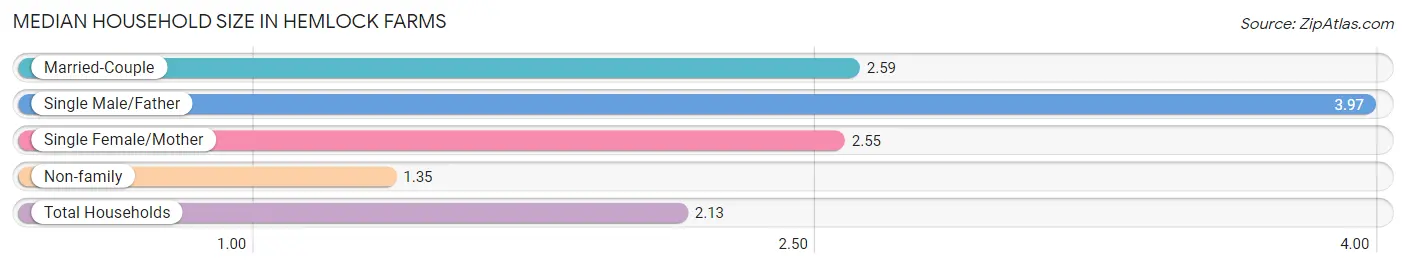
Median Household Size in Hemlock Farms
The median household size in Hemlock Farms is 2.13 persons per household, with single male/father households (32 | 1.9%) accounting for the largest median household size of 3.97 persons per household. non-family households (670 | 39.1%) represent the smallest median household size with 1.35 persons per household.
| Household Type | # Households | Household Size |
| Married-Couple | 947 (55.3%) | 2.59 |
| Single Male/Father | 32 (1.9%) | 3.97 |
| Single Female/Mother | 64 (3.7%) | 2.55 |
| Non-family | 670 (39.1%) | 1.35 |
| Total Households | 1,713 (100.0%) | 2.13 |
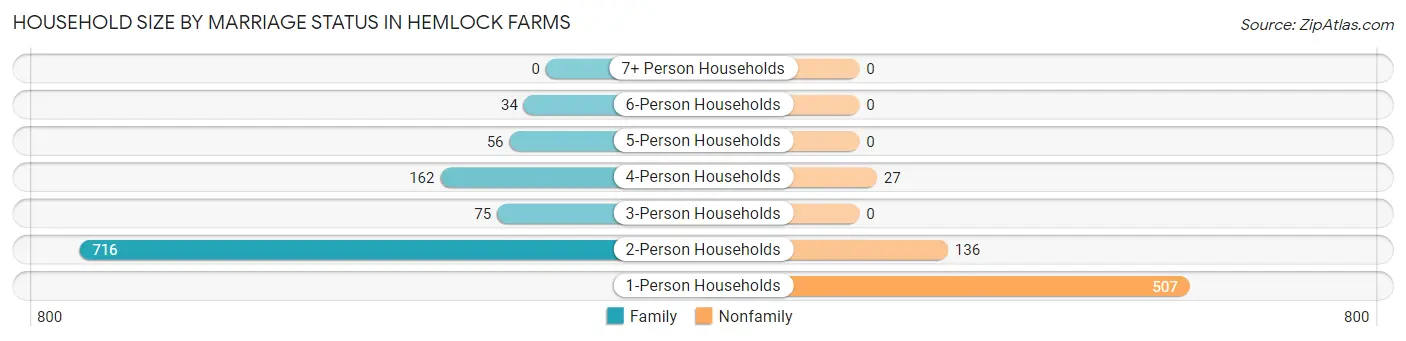
Household Size by Marriage Status in Hemlock Farms
Out of a total of 1,713 households in Hemlock Farms, 1,043 (60.9%) are family households, while 670 (39.1%) are nonfamily households. The most numerous type of family households are 2-person households, comprising 716, and the most common type of nonfamily households are 1-person households, comprising 507.
| Household Size | Family Households | Nonfamily Households |
| 1-Person Households | - | 507 (29.6%) |
| 2-Person Households | 716 (41.8%) | 136 (7.9%) |
| 3-Person Households | 75 (4.4%) | 0 (0.0%) |
| 4-Person Households | 162 (9.5%) | 27 (1.6%) |
| 5-Person Households | 56 (3.3%) | 0 (0.0%) |
| 6-Person Households | 34 (2.0%) | 0 (0.0%) |
| 7+ Person Households | 0 (0.0%) | 0 (0.0%) |
| Total | 1,043 (60.9%) | 670 (39.1%) |
Female Fertility in Hemlock Farms
Fertility by Age in Hemlock Farms
Average fertility rate in Hemlock Farms is 17.0 births per 1,000 women. Women in the age bracket of 35 to 50 years have the highest fertility rate with 30.0 births per 1,000 women. Women in the age bracket of 35 to 50 years acount for 100.0% of all women with births.
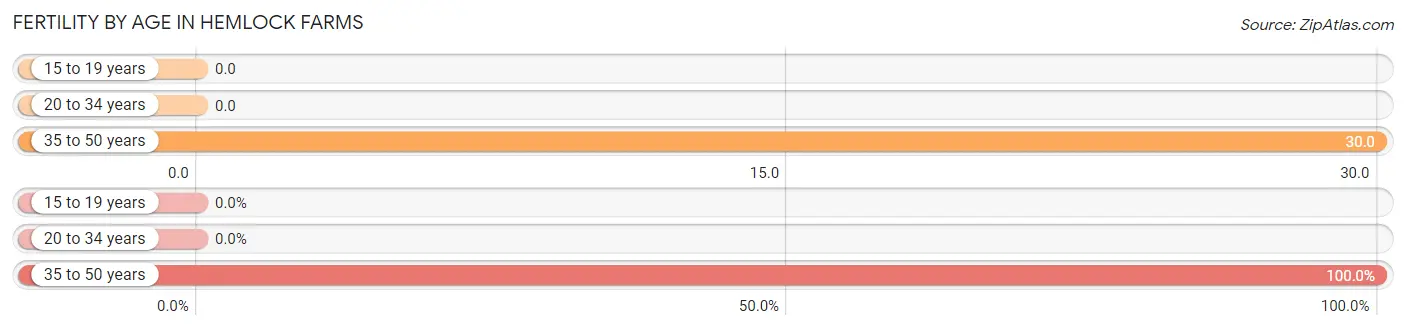
| Age Bracket | Women with Births | Births / 1,000 Women |
| 15 to 19 years | 0 (0.0%) | 0.0 |
| 20 to 34 years | 0 (0.0%) | 0.0 |
| 35 to 50 years | 7 (100.0%) | 30.0 |
| Total | 7 (100.0%) | 17.0 |
Fertility by Age by Marriage Status in Hemlock Farms
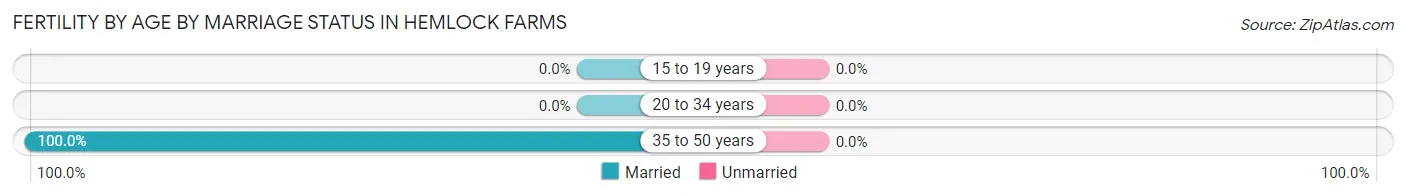
| Age Bracket | Married | Unmarried |
| 15 to 19 years | 0 (0.0%) | 0 (0.0%) |
| 20 to 34 years | 0 (0.0%) | 0 (0.0%) |
| 35 to 50 years | 7 (100.0%) | 0 (0.0%) |
| Total | 7 (100.0%) | 0 (0.0%) |
Fertility by Education in Hemlock Farms
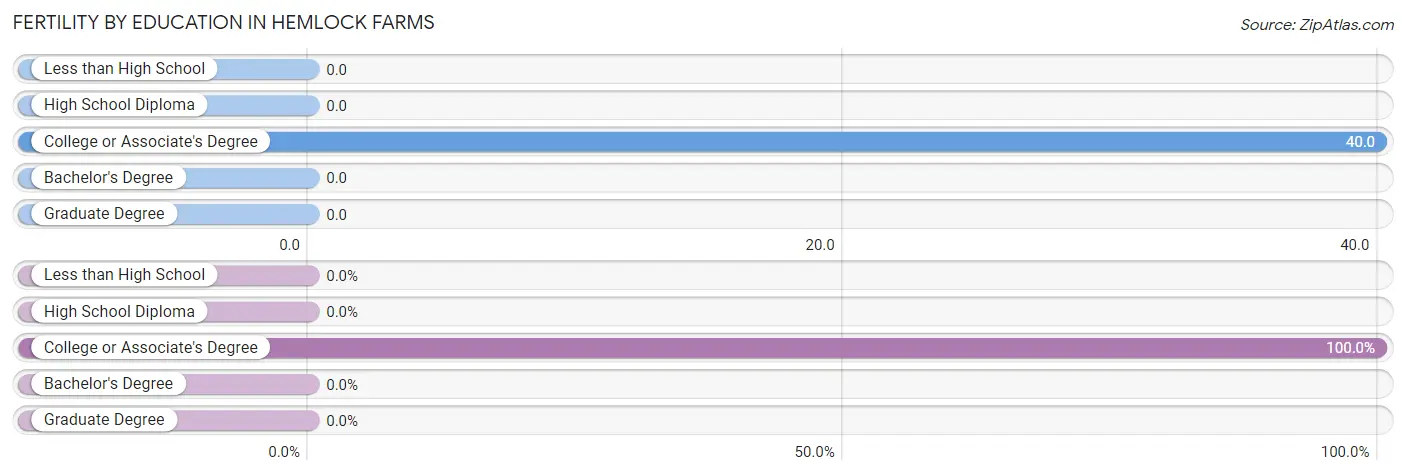
| Educational Attainment | Women with Births | Births / 1,000 Women |
| Less than High School | 0 (0.0%) | 0.0 |
| High School Diploma | 0 (0.0%) | 0.0 |
| College or Associate's Degree | 7 (100.0%) | 40.0 |
| Bachelor's Degree | 0 (0.0%) | 0.0 |
| Graduate Degree | 0 (0.0%) | 0.0 |
| Total | 7 (100.0%) | 17.0 |
Fertility by Education by Marriage Status in Hemlock Farms
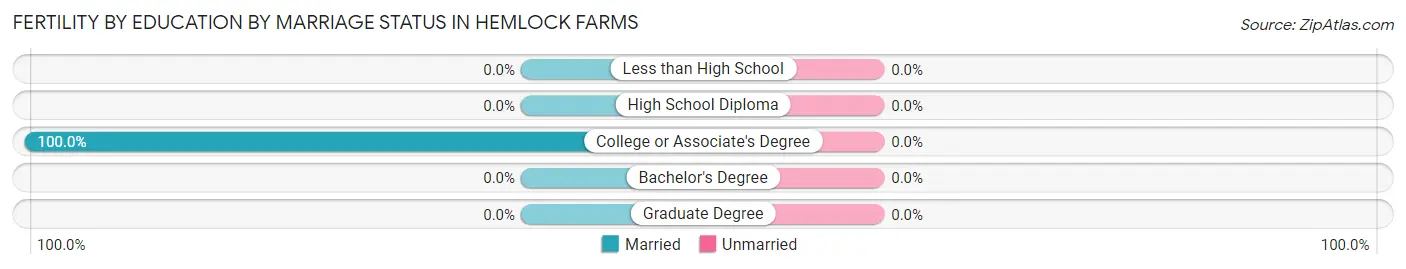
| Educational Attainment | Married | Unmarried |
| Less than High School | 0 (0.0%) | 0 (0.0%) |
| High School Diploma | 0 (0.0%) | 0 (0.0%) |
| College or Associate's Degree | 7 (100.0%) | 0 (0.0%) |
| Bachelor's Degree | 0 (0.0%) | 0 (0.0%) |
| Graduate Degree | 0 (0.0%) | 0 (0.0%) |
| Total | 7 (100.0%) | 0 (0.0%) |
Income in Hemlock Farms
Income Overview in Hemlock Farms
Per Capita Income in Hemlock Farms is $46,800, while median incomes of families and households are $92,757 and $79,002 respectively.
| Characteristic | Number | Measure |
| Per Capita Income | 3,647 | $46,800 |
| Median Family Income | 1,043 | $92,757 |
| Mean Family Income | 1,043 | $114,750 |
| Median Household Income | 1,713 | $79,002 |
| Mean Household Income | 1,713 | $99,343 |
| Income Deficit | 1,043 | $0 |
| Wage / Income Gap (%) | 3,647 | 25.26% |
| Wage / Income Gap ($) | 3,647 | 74.74¢ per $1 |
| Gini / Inequality Index | 3,647 | 0.37 |
Earnings by Sex in Hemlock Farms
Average Earnings in Hemlock Farms are $50,521, $53,786 for men and $40,202 for women, a difference of 25.3%.
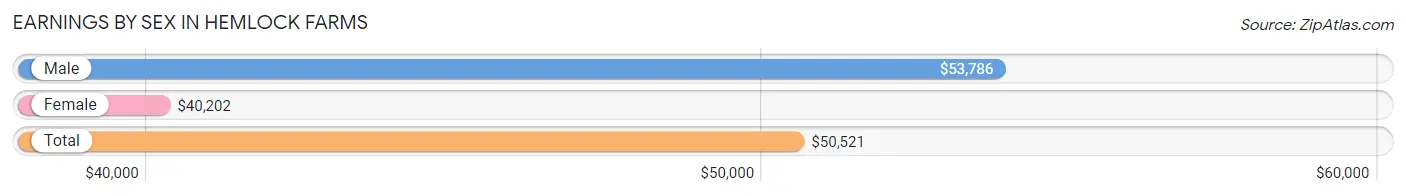
| Sex | Number | Average Earnings |
| Male | 960 (52.1%) | $53,786 |
| Female | 884 (47.9%) | $40,202 |
| Total | 1,844 (100.0%) | $50,521 |
Earnings by Sex by Income Bracket in Hemlock Farms
The most common earnings brackets in Hemlock Farms are $75,000 to $99,999 for men (170 | 17.7%) and $22,500 to $24,999 for women (134 | 15.2%).
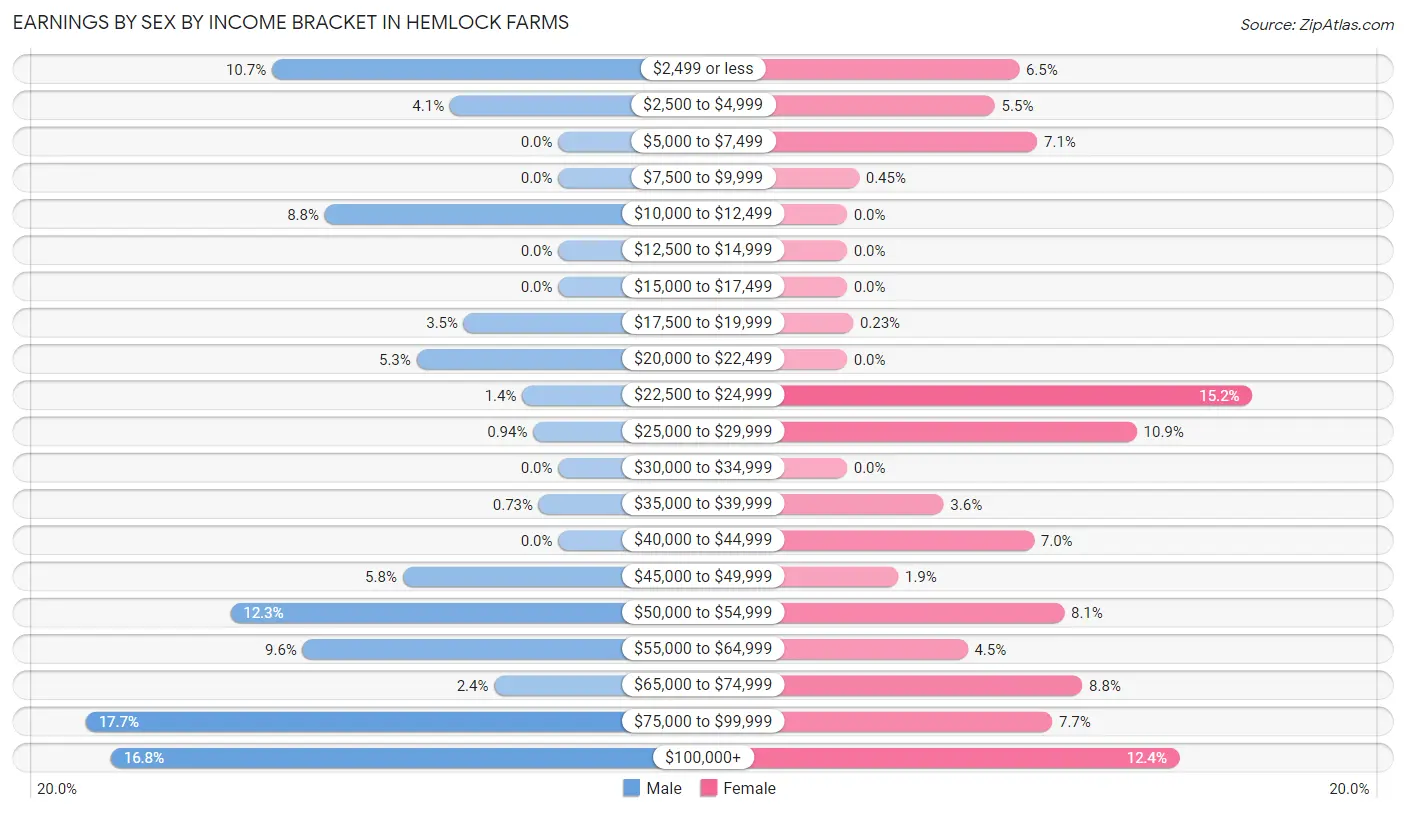
| Income | Male | Female |
| $2,499 or less | 103 (10.7%) | 57 (6.5%) |
| $2,500 to $4,999 | 39 (4.1%) | 49 (5.5%) |
| $5,000 to $7,499 | 0 (0.0%) | 63 (7.1%) |
| $7,500 to $9,999 | 0 (0.0%) | 4 (0.4%) |
| $10,000 to $12,499 | 84 (8.7%) | 0 (0.0%) |
| $12,500 to $14,999 | 0 (0.0%) | 0 (0.0%) |
| $15,000 to $17,499 | 0 (0.0%) | 0 (0.0%) |
| $17,500 to $19,999 | 34 (3.5%) | 2 (0.2%) |
| $20,000 to $22,499 | 51 (5.3%) | 0 (0.0%) |
| $22,500 to $24,999 | 13 (1.3%) | 134 (15.2%) |
| $25,000 to $29,999 | 9 (0.9%) | 96 (10.9%) |
| $30,000 to $34,999 | 0 (0.0%) | 0 (0.0%) |
| $35,000 to $39,999 | 7 (0.7%) | 32 (3.6%) |
| $40,000 to $44,999 | 0 (0.0%) | 62 (7.0%) |
| $45,000 to $49,999 | 56 (5.8%) | 17 (1.9%) |
| $50,000 to $54,999 | 118 (12.3%) | 72 (8.1%) |
| $55,000 to $64,999 | 92 (9.6%) | 40 (4.5%) |
| $65,000 to $74,999 | 23 (2.4%) | 78 (8.8%) |
| $75,000 to $99,999 | 170 (17.7%) | 68 (7.7%) |
| $100,000+ | 161 (16.8%) | 110 (12.4%) |
| Total | 960 (100.0%) | 884 (100.0%) |
Earnings by Sex by Educational Attainment in Hemlock Farms
Average earnings in Hemlock Farms are $54,643 for men and $41,552 for women, a difference of 24.0%. Men with an educational attainment of high school diploma enjoy the highest average annual earnings of $55,372, while those with college or associate's degree education earn the least with $53,475. Women with an educational attainment of graduate degree earn the most with the average annual earnings of $76,042, while those with college or associate's degree education have the smallest earnings of $28,500.
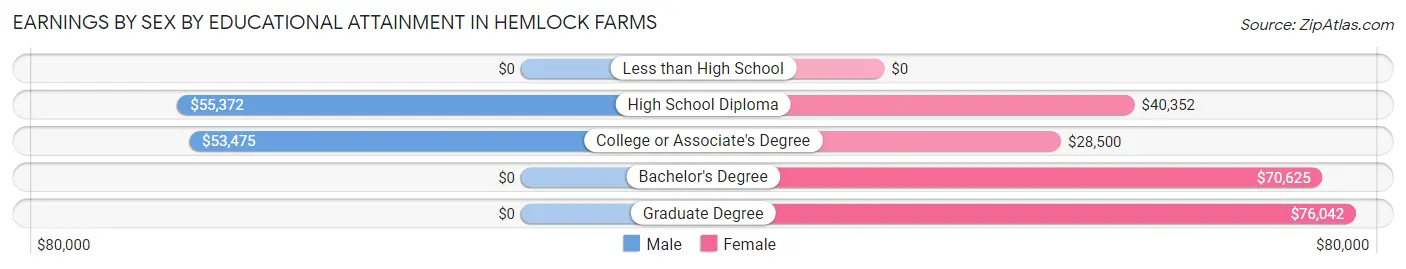
| Educational Attainment | Male Income | Female Income |
| Less than High School | - | - |
| High School Diploma | $55,372 | $40,352 |
| College or Associate's Degree | $53,475 | $28,500 |
| Bachelor's Degree | - | - |
| Graduate Degree | - | - |
| Total | $54,643 | $41,552 |
Family Income in Hemlock Farms
Family Income Brackets in Hemlock Farms
According to the Hemlock Farms family income data, there are 246 families falling into the $100,000 to $149,999 income range, which is the most common income bracket and makes up 23.6% of all families.
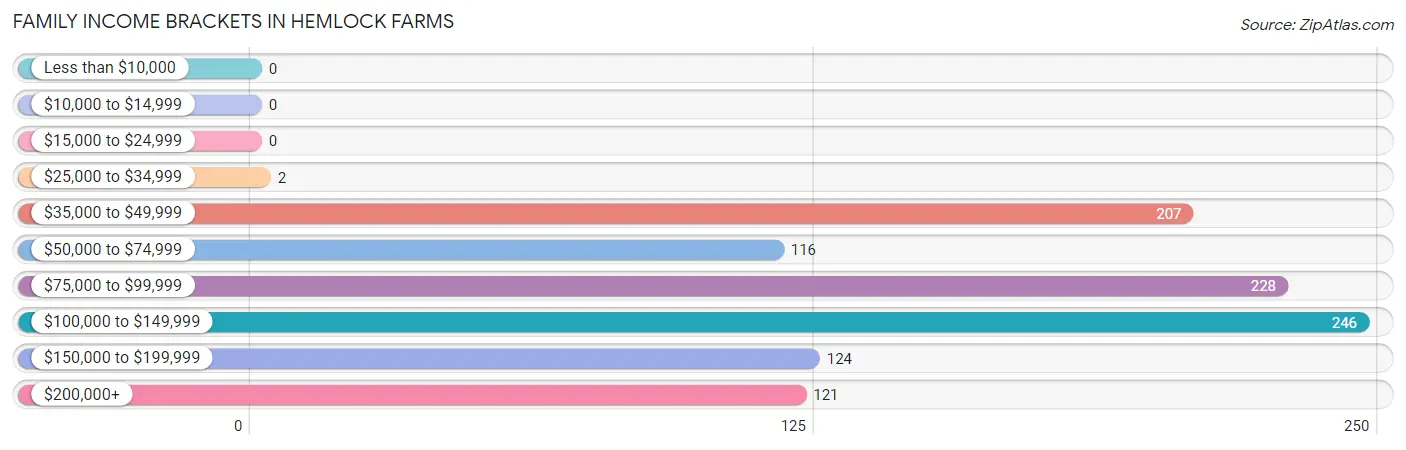
| Income Bracket | # Families | % Families |
| Less than $10,000 | 0 | 0.0% |
| $10,000 to $14,999 | 0 | 0.0% |
| $15,000 to $24,999 | 0 | 0.0% |
| $25,000 to $34,999 | 2 | 0.2% |
| $35,000 to $49,999 | 207 | 19.8% |
| $50,000 to $74,999 | 116 | 11.1% |
| $75,000 to $99,999 | 228 | 21.9% |
| $100,000 to $149,999 | 246 | 23.6% |
| $150,000 to $199,999 | 124 | 11.9% |
| $200,000+ | 121 | 11.6% |
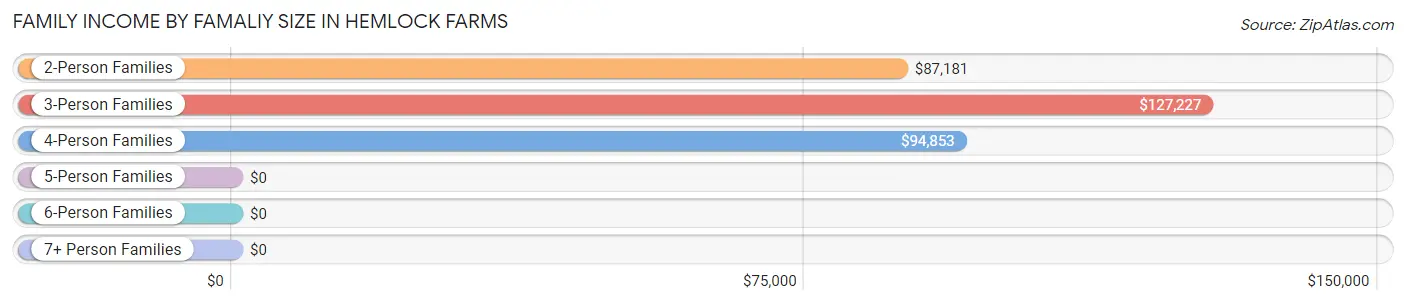
Family Income by Famaliy Size in Hemlock Farms
3-person families (75 | 7.2%) account for the highest median family income in Hemlock Farms with $127,227 per family, while 2-person families (716 | 68.6%) have the highest median income of $43,590 per family member.
| Income Bracket | # Families | Median Income |
| 2-Person Families | 716 (68.6%) | $87,181 |
| 3-Person Families | 75 (7.2%) | $127,227 |
| 4-Person Families | 196 (18.8%) | $94,853 |
| 5-Person Families | 56 (5.4%) | $0 |
| 6-Person Families | 0 (0.0%) | $0 |
| 7+ Person Families | 0 (0.0%) | $0 |
| Total | 1,043 (100.0%) | $92,757 |
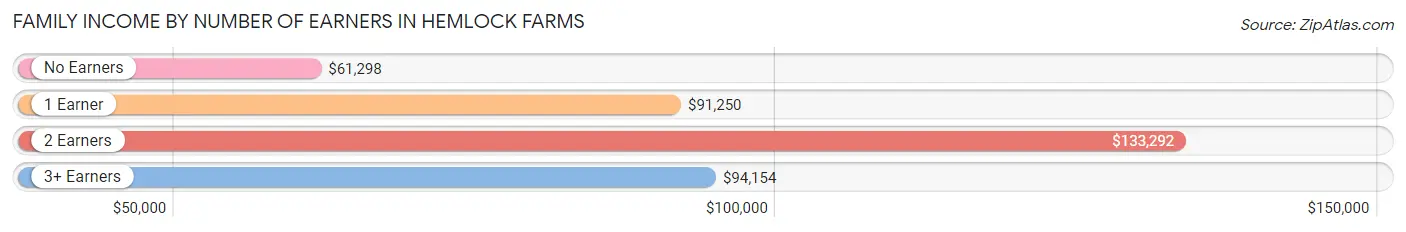
Family Income by Number of Earners in Hemlock Farms
The median family income in Hemlock Farms is $92,757, with families comprising 2 earners (431) having the highest median family income of $133,292, while families with no earners (287) have the lowest median family income of $61,298, accounting for 41.3% and 27.5% of families, respectively.
| Number of Earners | # Families | Median Income |
| No Earners | 287 (27.5%) | $61,298 |
| 1 Earner | 280 (26.9%) | $91,250 |
| 2 Earners | 431 (41.3%) | $133,292 |
| 3+ Earners | 45 (4.3%) | $94,154 |
| Total | 1,043 (100.0%) | $92,757 |
Household Income in Hemlock Farms
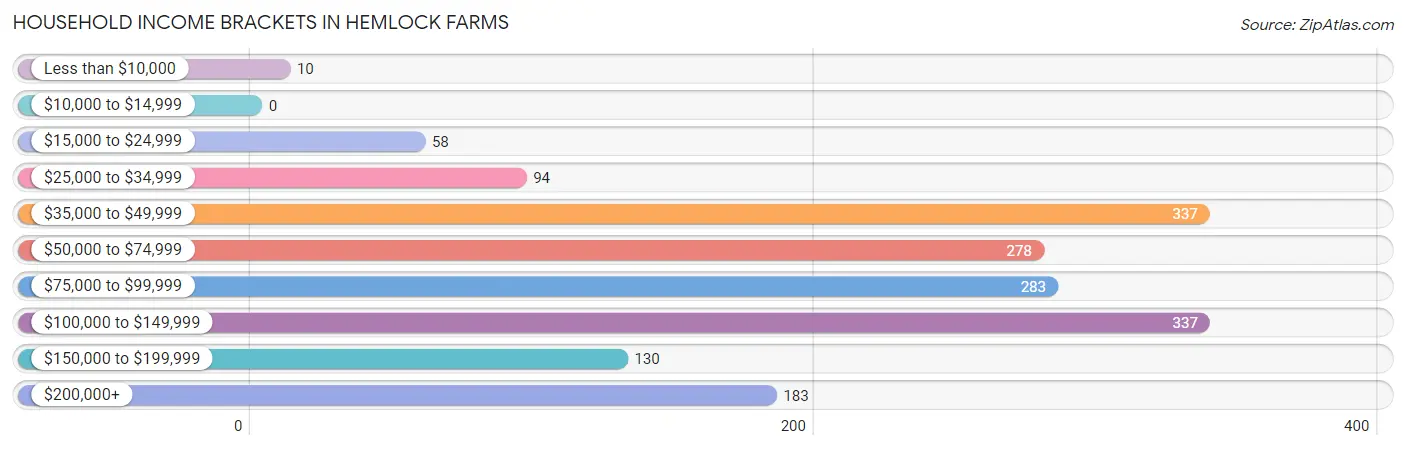
Household Income Brackets in Hemlock Farms
With 337 households falling in the category, the $35,000 to $49,999 income range is the most frequent in Hemlock Farms, accounting for 19.7% of all households.
| Income Bracket | # Households | % Households |
| Less than $10,000 | 10 | 0.6% |
| $10,000 to $14,999 | 0 | 0.0% |
| $15,000 to $24,999 | 58 | 3.4% |
| $25,000 to $34,999 | 94 | 5.5% |
| $35,000 to $49,999 | 337 | 19.7% |
| $50,000 to $74,999 | 278 | 16.2% |
| $75,000 to $99,999 | 283 | 16.5% |
| $100,000 to $149,999 | 337 | 19.7% |
| $150,000 to $199,999 | 130 | 7.6% |
| $200,000+ | 183 | 10.7% |
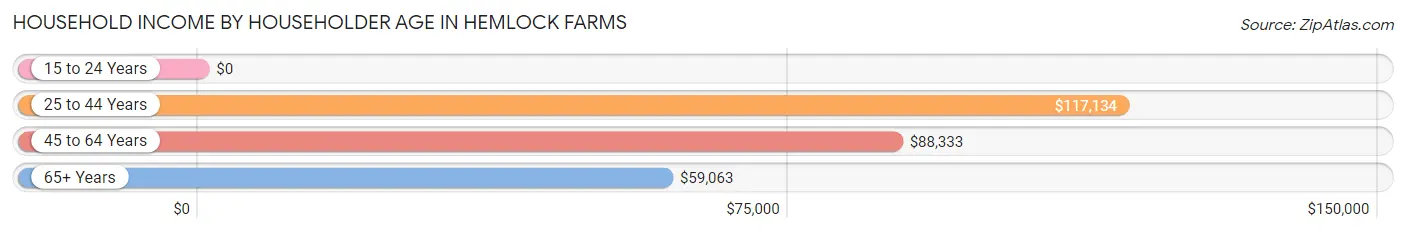
Household Income by Householder Age in Hemlock Farms
The median household income in Hemlock Farms is $79,002, with the highest median household income of $117,134 found in the 25 to 44 years age bracket for the primary householder. A total of 197 households (11.5%) fall into this category.
| Income Bracket | # Households | Median Income |
| 15 to 24 Years | 0 (0.0%) | $0 |
| 25 to 44 Years | 197 (11.5%) | $117,134 |
| 45 to 64 Years | 726 (42.4%) | $88,333 |
| 65+ Years | 790 (46.1%) | $59,063 |
| Total | 1,713 (100.0%) | $79,002 |
Poverty in Hemlock Farms
Income Below Poverty by Sex and Age in Hemlock Farms
With 4.1% poverty level for males and 5.8% for females among the residents of Hemlock Farms, 18 to 24 year old males and 75 year old and over females are the most vulnerable to poverty, with 48 males (47.5%) and 63 females (17.9%) in their respective age groups living below the poverty level.
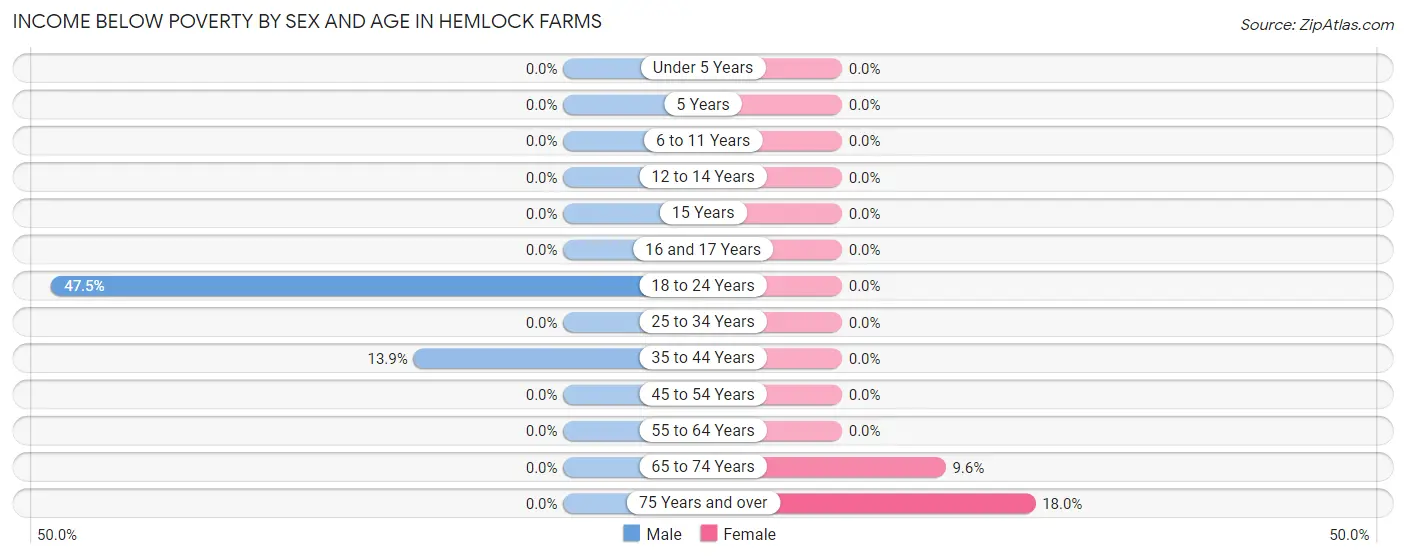
| Age Bracket | Male | Female |
| Under 5 Years | 0 (0.0%) | 0 (0.0%) |
| 5 Years | 0 (0.0%) | 0 (0.0%) |
| 6 to 11 Years | 0 (0.0%) | 0 (0.0%) |
| 12 to 14 Years | 0 (0.0%) | 0 (0.0%) |
| 15 Years | 0 (0.0%) | 0 (0.0%) |
| 16 and 17 Years | 0 (0.0%) | 0 (0.0%) |
| 18 to 24 Years | 48 (47.5%) | 0 (0.0%) |
| 25 to 34 Years | 0 (0.0%) | 0 (0.0%) |
| 35 to 44 Years | 31 (13.9%) | 0 (0.0%) |
| 45 to 54 Years | 0 (0.0%) | 0 (0.0%) |
| 55 to 64 Years | 0 (0.0%) | 0 (0.0%) |
| 65 to 74 Years | 0 (0.0%) | 33 (9.6%) |
| 75 Years and over | 0 (0.0%) | 63 (17.9%) |
| Total | 79 (4.1%) | 96 (5.8%) |
Income Above Poverty by Sex and Age in Hemlock Farms
According to the poverty statistics in Hemlock Farms, males aged 6 to 11 years and females aged under 5 years are the age groups that are most secure financially, with 100.0% of males and 100.0% of females in these age groups living above the poverty line.
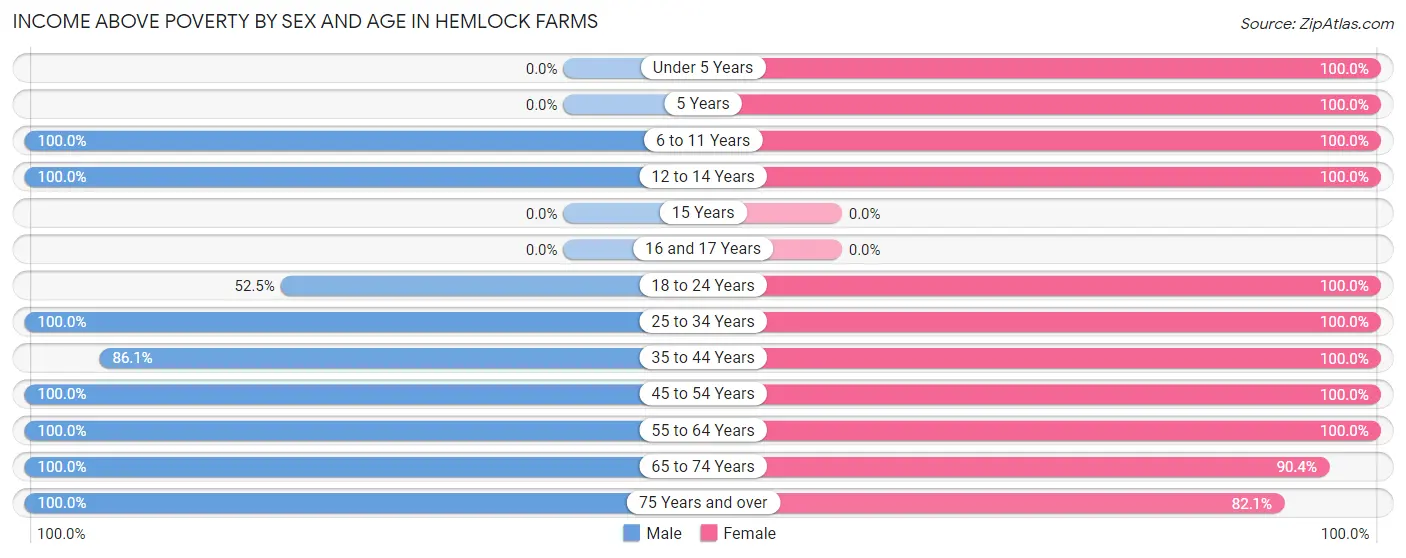
| Age Bracket | Male | Female |
| Under 5 Years | 0 (0.0%) | 19 (100.0%) |
| 5 Years | 0 (0.0%) | 25 (100.0%) |
| 6 to 11 Years | 208 (100.0%) | 54 (100.0%) |
| 12 to 14 Years | 17 (100.0%) | 36 (100.0%) |
| 15 Years | 0 (0.0%) | 0 (0.0%) |
| 16 and 17 Years | 0 (0.0%) | 0 (0.0%) |
| 18 to 24 Years | 53 (52.5%) | 67 (100.0%) |
| 25 to 34 Years | 141 (100.0%) | 115 (100.0%) |
| 35 to 44 Years | 192 (86.1%) | 151 (100.0%) |
| 45 to 54 Years | 304 (100.0%) | 174 (100.0%) |
| 55 to 64 Years | 332 (100.0%) | 336 (100.0%) |
| 65 to 74 Years | 321 (100.0%) | 310 (90.4%) |
| 75 Years and over | 279 (100.0%) | 288 (82.1%) |
| Total | 1,847 (95.9%) | 1,575 (94.3%) |
Income Below Poverty Among Married-Couple Families in Hemlock Farms
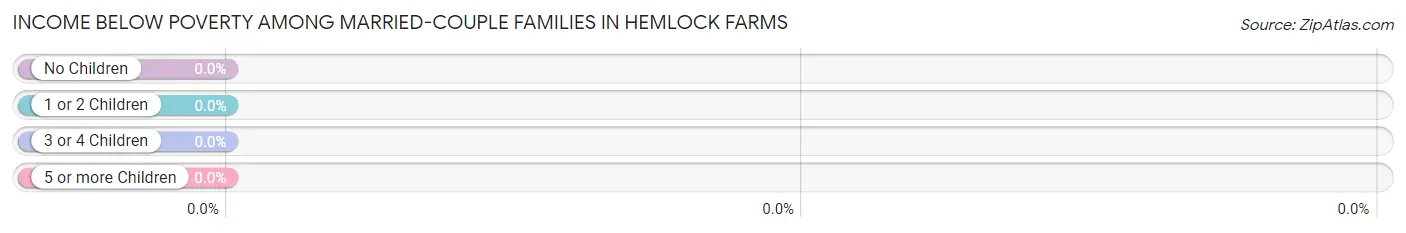
| Children | Above Poverty | Below Poverty |
| No Children | 724 (100.0%) | 0 (0.0%) |
| 1 or 2 Children | 167 (100.0%) | 0 (0.0%) |
| 3 or 4 Children | 56 (100.0%) | 0 (0.0%) |
| 5 or more Children | 0 (0.0%) | 0 (0.0%) |
| Total | 947 (100.0%) | 0 (0.0%) |
Income Below Poverty Among Single-Parent Households in Hemlock Farms
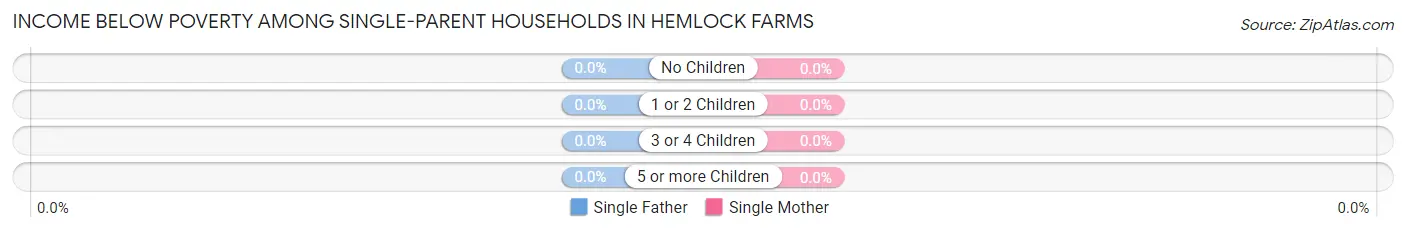
| Children | Single Father | Single Mother |
| No Children | 0 (0.0%) | 0 (0.0%) |
| 1 or 2 Children | 0 (0.0%) | 0 (0.0%) |
| 3 or 4 Children | 0 (0.0%) | 0 (0.0%) |
| 5 or more Children | 0 (0.0%) | 0 (0.0%) |
| Total | 0 (0.0%) | 0 (0.0%) |
Income Below Poverty Among Married-Couple vs Single-Parent Households in Hemlock Farms
| Children | Married-Couple Families | Single-Parent Households |
| No Children | 0 (0.0%) | 0 (0.0%) |
| 1 or 2 Children | 0 (0.0%) | 0 (0.0%) |
| 3 or 4 Children | 0 (0.0%) | 0 (0.0%) |
| 5 or more Children | 0 (0.0%) | 0 (0.0%) |
| Total | 0 (0.0%) | 0 (0.0%) |
Employment Characteristics in Hemlock Farms
Employment by Class of Employer in Hemlock Farms
Among the 1,536 employed individuals in Hemlock Farms, private company employees (1,018 | 66.3%), local government employees (230 | 15.0%), and not-for-profit organizations (116 | 7.5%) make up the most common classes of employment.
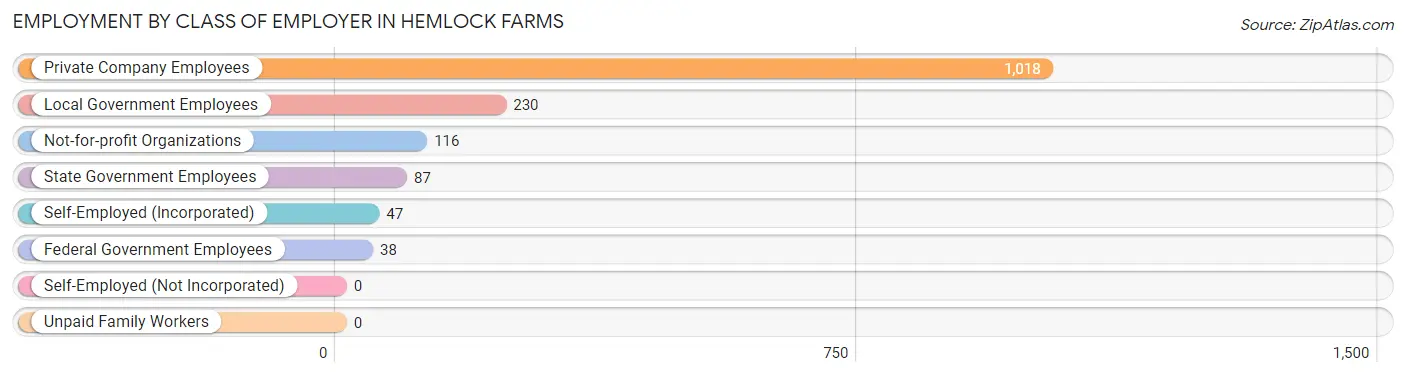
| Employer Class | # Employees | % Employees |
| Private Company Employees | 1,018 | 66.3% |
| Self-Employed (Incorporated) | 47 | 3.1% |
| Self-Employed (Not Incorporated) | 0 | 0.0% |
| Not-for-profit Organizations | 116 | 7.5% |
| Local Government Employees | 230 | 15.0% |
| State Government Employees | 87 | 5.7% |
| Federal Government Employees | 38 | 2.5% |
| Unpaid Family Workers | 0 | 0.0% |
| Total | 1,536 | 100.0% |
Employment Status by Age in Hemlock Farms
According to the labor force statistics for Hemlock Farms, out of the total population over 16 years of age (3,238), 56.8% or 1,839 individuals are in the labor force, with 11.6% or 213 of them unemployed. The age group with the highest labor force participation rate is 20 to 24 years, with 100.0% or 48 individuals in the labor force. Within the labor force, the 16 to 19 years age range has the highest percentage of unemployed individuals, with 94.0% or 63 of them being unemployed.
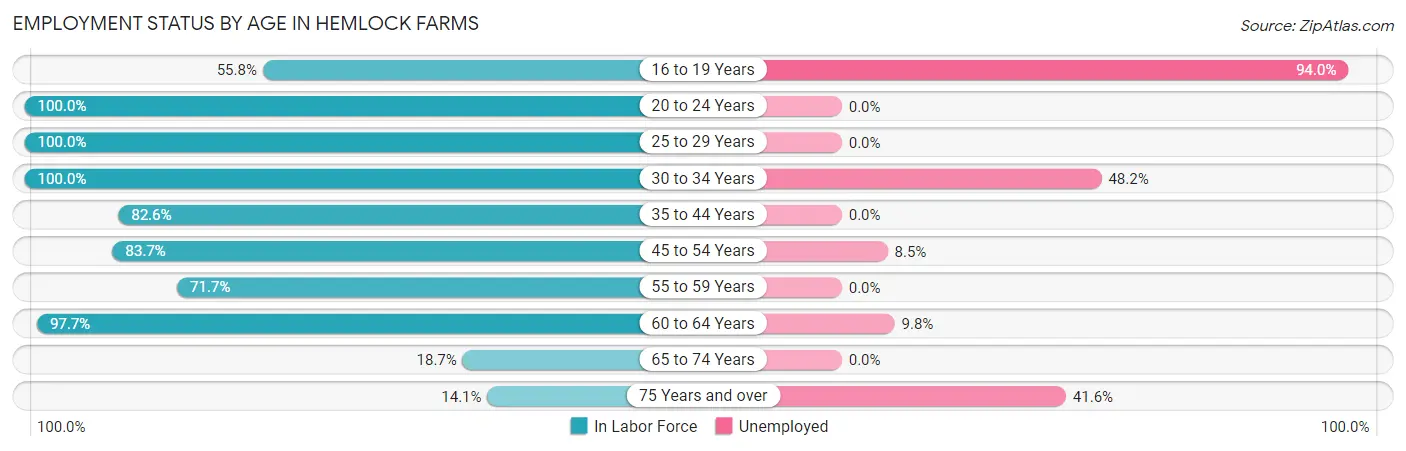
| Age Bracket | In Labor Force | Unemployed |
| 16 to 19 Years | 67 (55.8%) | 63 (94.0%) |
| 20 to 24 Years | 48 (100.0%) | 0 (0.0%) |
| 25 to 29 Years | 142 (100.0%) | 0 (0.0%) |
| 30 to 34 Years | 114 (100.0%) | 55 (48.2%) |
| 35 to 44 Years | 309 (82.6%) | 0 (0.0%) |
| 45 to 54 Years | 400 (83.7%) | 34 (8.5%) |
| 55 to 59 Years | 291 (71.7%) | 0 (0.0%) |
| 60 to 64 Years | 256 (97.7%) | 25 (9.8%) |
| 65 to 74 Years | 124 (18.7%) | 0 (0.0%) |
| 75 Years and over | 89 (14.1%) | 37 (41.6%) |
| Total | 1,839 (56.8%) | 213 (11.6%) |
Employment Status by Educational Attainment in Hemlock Farms
According to labor force statistics for Hemlock Farms, 85.1% of individuals (1,511) out of the total population between 25 and 64 years of age (1,776) are in the labor force, with 7.5% or 113 of them being unemployed. The group with the highest labor force participation rate are those with the educational attainment of less than high school, with 93.3% or 56 individuals in the labor force. Within the labor force, individuals with bachelor's degree or higher education have the highest percentage of unemployment, with 10.1% or 34 of them being unemployed.
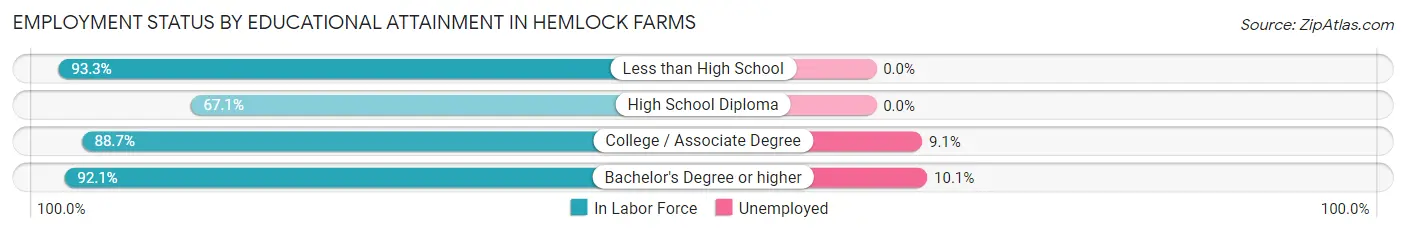
| Educational Attainment | In Labor Force | Unemployed |
| Less than High School | 56 (93.3%) | 0 (0.0%) |
| High School Diploma | 243 (67.1%) | 0 (0.0%) |
| College / Associate Degree | 875 (88.7%) | 90 (9.1%) |
| Bachelor's Degree or higher | 338 (92.1%) | 37 (10.1%) |
| Total | 1,511 (85.1%) | 133 (7.5%) |
Employment Occupations by Sex in Hemlock Farms
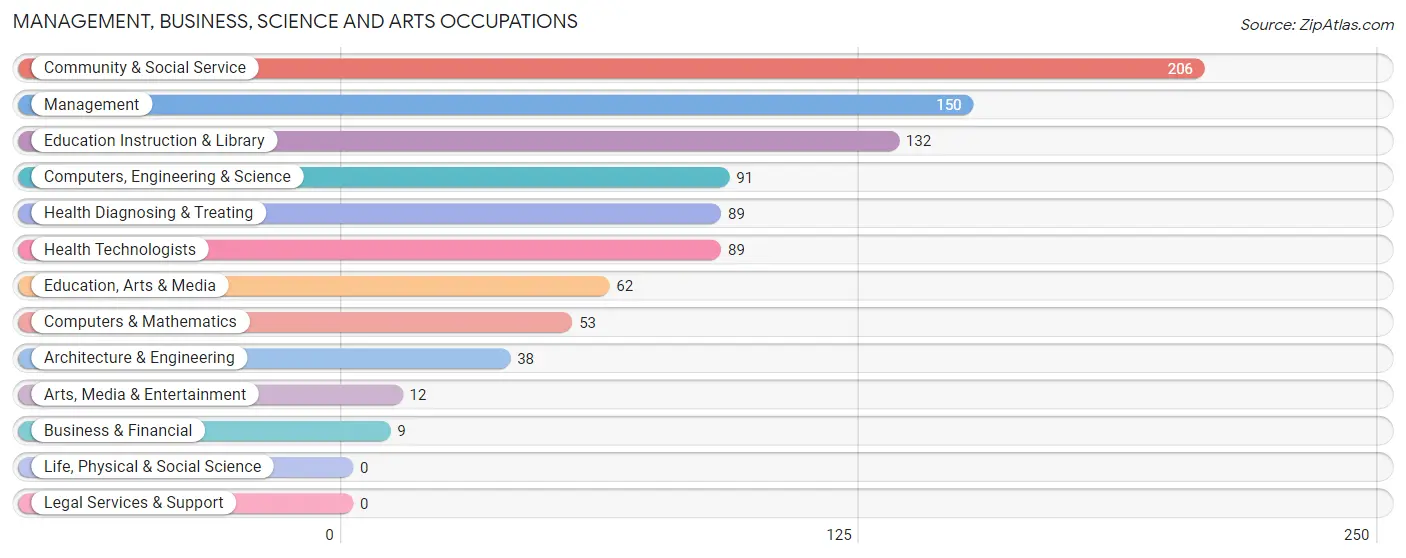
Management, Business, Science and Arts Occupations
The most common Management, Business, Science and Arts occupations in Hemlock Farms are Community & Social Service (206 | 12.7%), Management (150 | 9.2%), Education Instruction & Library (132 | 8.1%), Computers, Engineering & Science (91 | 5.6%), and Health Diagnosing & Treating (89 | 5.5%).
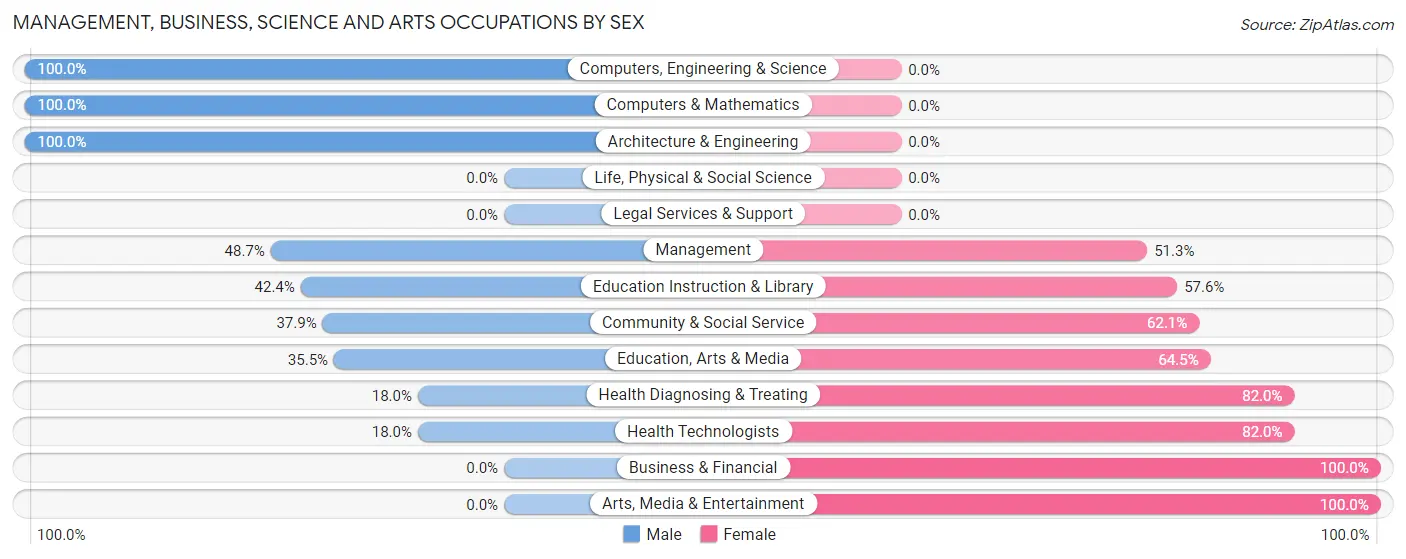
Management, Business, Science and Arts Occupations by Sex
Within the Management, Business, Science and Arts occupations in Hemlock Farms, the most male-oriented occupations are Computers, Engineering & Science (100.0%), Computers & Mathematics (100.0%), and Architecture & Engineering (100.0%), while the most female-oriented occupations are Business & Financial (100.0%), Arts, Media & Entertainment (100.0%), and Health Diagnosing & Treating (82.0%).
| Occupation | Male | Female |
| Management | 73 (48.7%) | 77 (51.3%) |
| Business & Financial | 0 (0.0%) | 9 (100.0%) |
| Computers, Engineering & Science | 91 (100.0%) | 0 (0.0%) |
| Computers & Mathematics | 53 (100.0%) | 0 (0.0%) |
| Architecture & Engineering | 38 (100.0%) | 0 (0.0%) |
| Life, Physical & Social Science | 0 (0.0%) | 0 (0.0%) |
| Community & Social Service | 78 (37.9%) | 128 (62.1%) |
| Education, Arts & Media | 22 (35.5%) | 40 (64.5%) |
| Legal Services & Support | 0 (0.0%) | 0 (0.0%) |
| Education Instruction & Library | 56 (42.4%) | 76 (57.6%) |
| Arts, Media & Entertainment | 0 (0.0%) | 12 (100.0%) |
| Health Diagnosing & Treating | 16 (18.0%) | 73 (82.0%) |
| Health Technologists | 16 (18.0%) | 73 (82.0%) |
| Total (Category) | 258 (47.3%) | 287 (52.7%) |
| Total (Overall) | 871 (53.6%) | 755 (46.4%) |
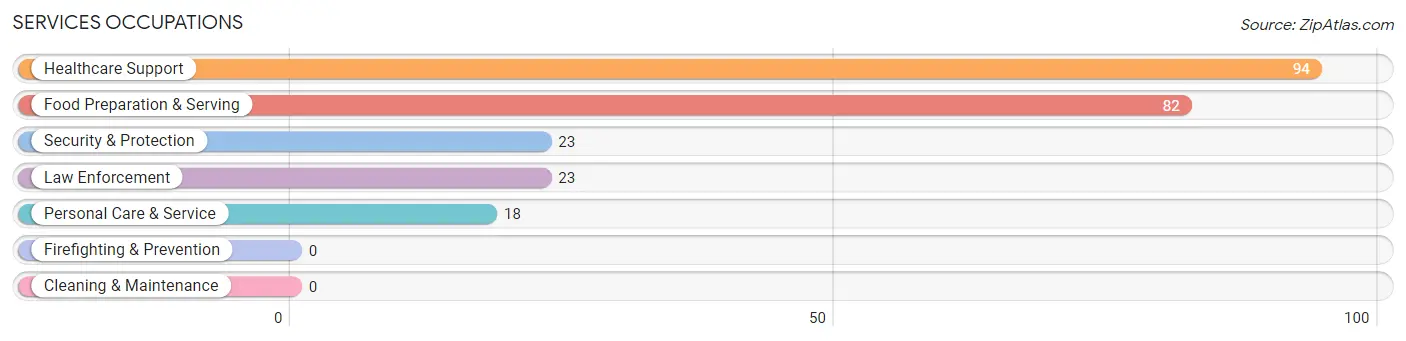
Services Occupations
The most common Services occupations in Hemlock Farms are Healthcare Support (94 | 5.8%), Food Preparation & Serving (82 | 5.0%), Security & Protection (23 | 1.4%), Law Enforcement (23 | 1.4%), and Personal Care & Service (18 | 1.1%).
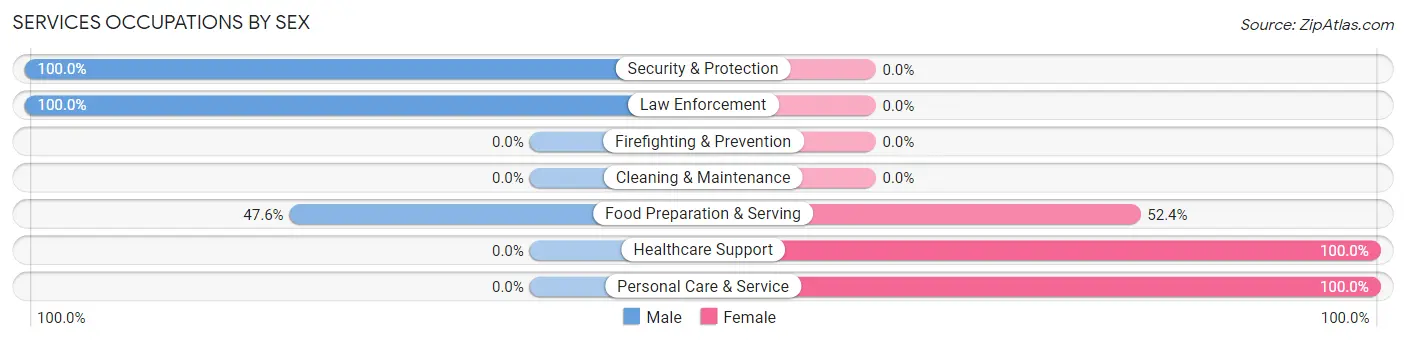
Services Occupations by Sex
Within the Services occupations in Hemlock Farms, the most male-oriented occupations are Security & Protection (100.0%), Law Enforcement (100.0%), and Food Preparation & Serving (47.6%), while the most female-oriented occupations are Healthcare Support (100.0%), Personal Care & Service (100.0%), and Food Preparation & Serving (52.4%).
| Occupation | Male | Female |
| Healthcare Support | 0 (0.0%) | 94 (100.0%) |
| Security & Protection | 23 (100.0%) | 0 (0.0%) |
| Firefighting & Prevention | 0 (0.0%) | 0 (0.0%) |
| Law Enforcement | 23 (100.0%) | 0 (0.0%) |
| Food Preparation & Serving | 39 (47.6%) | 43 (52.4%) |
| Cleaning & Maintenance | 0 (0.0%) | 0 (0.0%) |
| Personal Care & Service | 0 (0.0%) | 18 (100.0%) |
| Total (Category) | 62 (28.6%) | 155 (71.4%) |
| Total (Overall) | 871 (53.6%) | 755 (46.4%) |
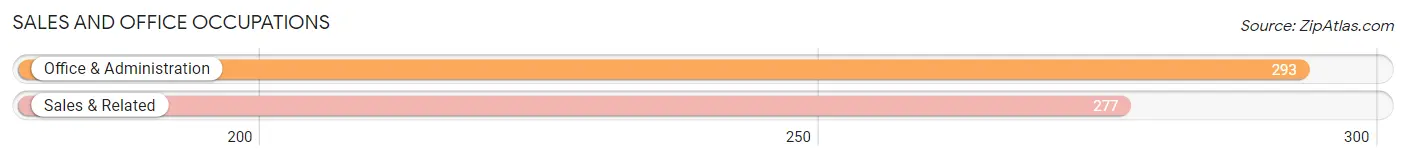
Sales and Office Occupations
The most common Sales and Office occupations in Hemlock Farms are Office & Administration (293 | 18.0%), and Sales & Related (277 | 17.0%).
Sales and Office Occupations by Sex
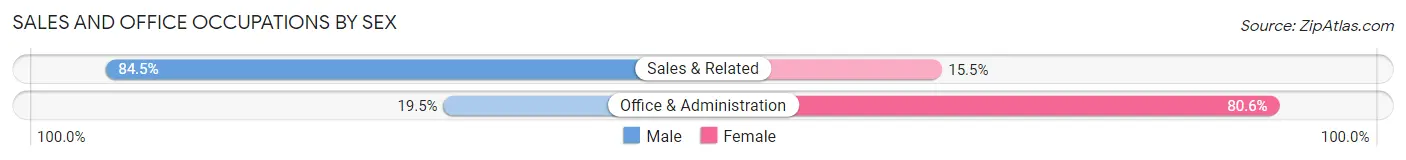
| Occupation | Male | Female |
| Sales & Related | 234 (84.5%) | 43 (15.5%) |
| Office & Administration | 57 (19.5%) | 236 (80.5%) |
| Total (Category) | 291 (51.0%) | 279 (48.9%) |
| Total (Overall) | 871 (53.6%) | 755 (46.4%) |
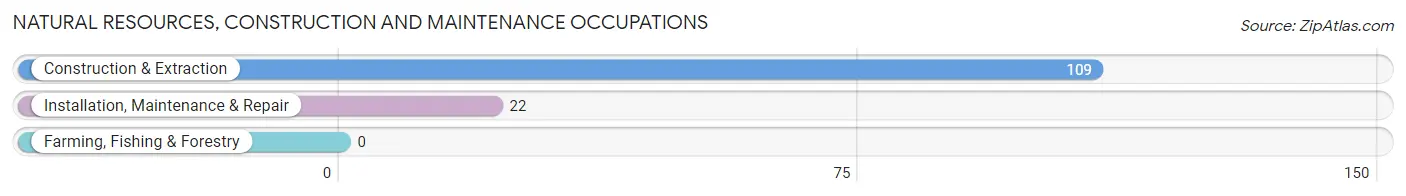
Natural Resources, Construction and Maintenance Occupations
The most common Natural Resources, Construction and Maintenance occupations in Hemlock Farms are Construction & Extraction (109 | 6.7%), and Installation, Maintenance & Repair (22 | 1.3%).
Natural Resources, Construction and Maintenance Occupations by Sex
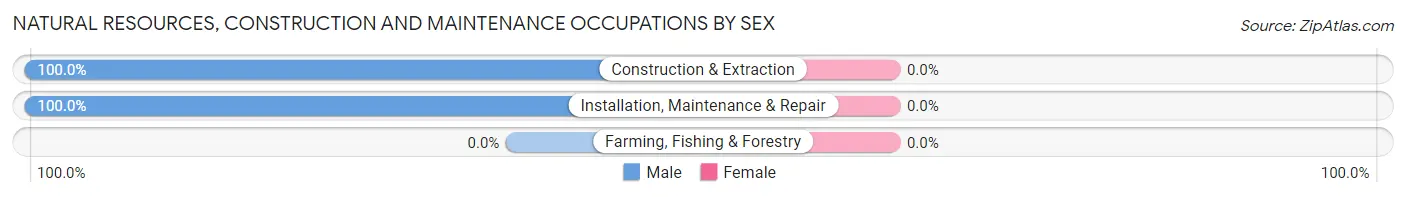
| Occupation | Male | Female |
| Farming, Fishing & Forestry | 0 (0.0%) | 0 (0.0%) |
| Construction & Extraction | 109 (100.0%) | 0 (0.0%) |
| Installation, Maintenance & Repair | 22 (100.0%) | 0 (0.0%) |
| Total (Category) | 131 (100.0%) | 0 (0.0%) |
| Total (Overall) | 871 (53.6%) | 755 (46.4%) |
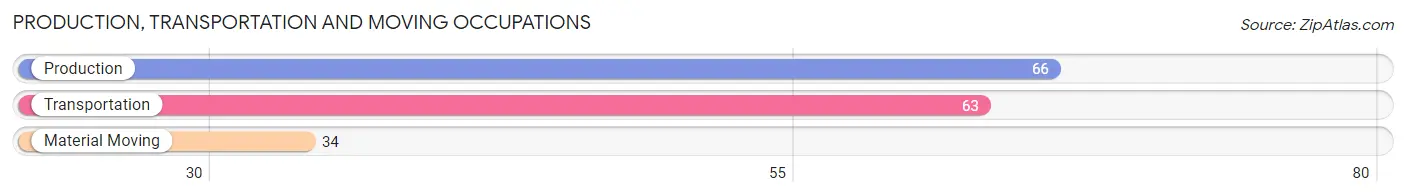
Production, Transportation and Moving Occupations
The most common Production, Transportation and Moving occupations in Hemlock Farms are Production (66 | 4.1%), Transportation (63 | 3.9%), and Material Moving (34 | 2.1%).
Production, Transportation and Moving Occupations by Sex
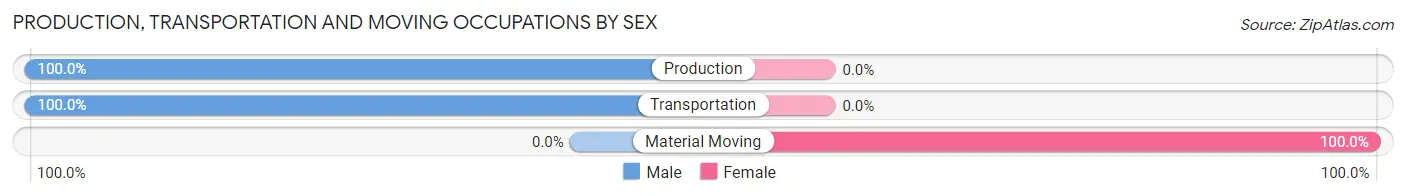
| Occupation | Male | Female |
| Production | 66 (100.0%) | 0 (0.0%) |
| Transportation | 63 (100.0%) | 0 (0.0%) |
| Material Moving | 0 (0.0%) | 34 (100.0%) |
| Total (Category) | 129 (79.1%) | 34 (20.9%) |
| Total (Overall) | 871 (53.6%) | 755 (46.4%) |
Employment Industries by Sex in Hemlock Farms
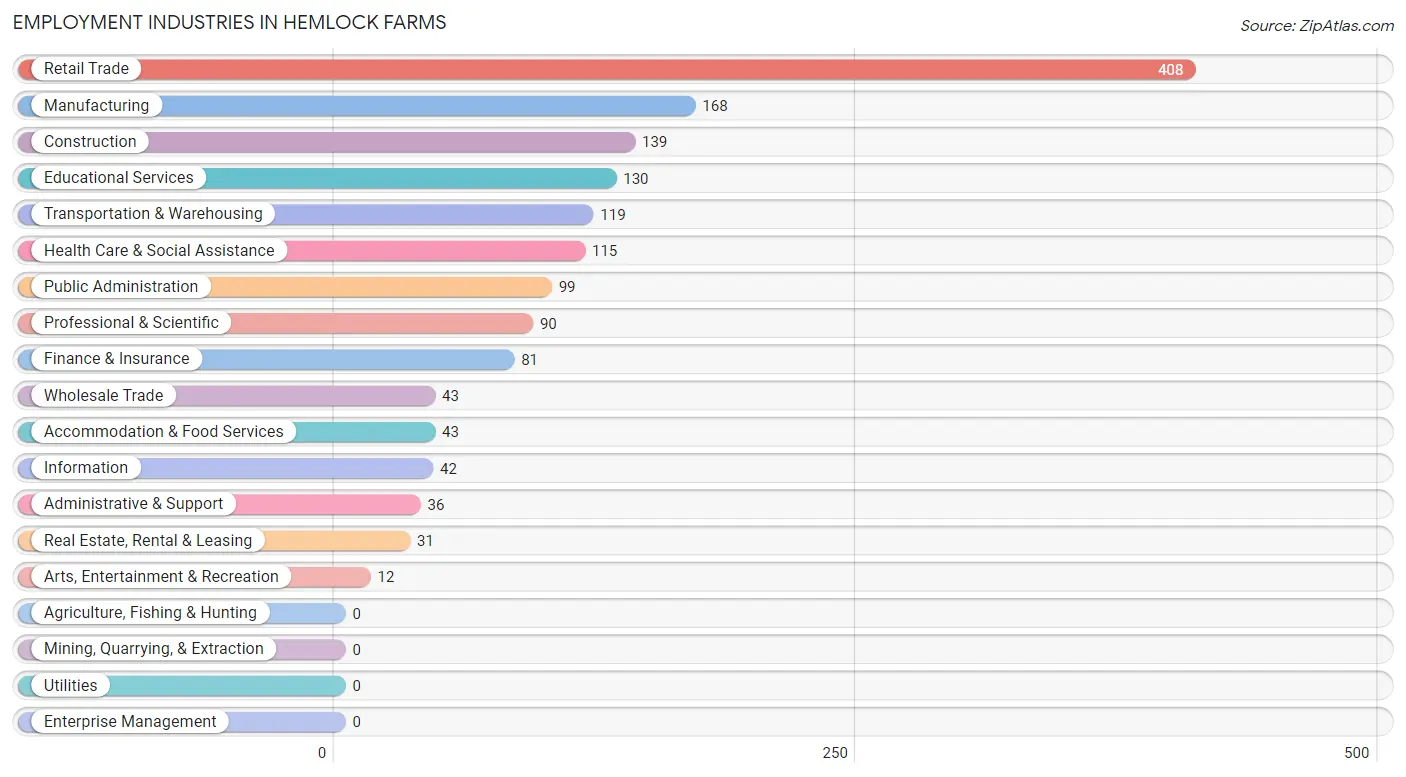
Employment Industries in Hemlock Farms
The major employment industries in Hemlock Farms include Retail Trade (408 | 25.1%), Manufacturing (168 | 10.3%), Construction (139 | 8.6%), Educational Services (130 | 8.0%), and Transportation & Warehousing (119 | 7.3%).
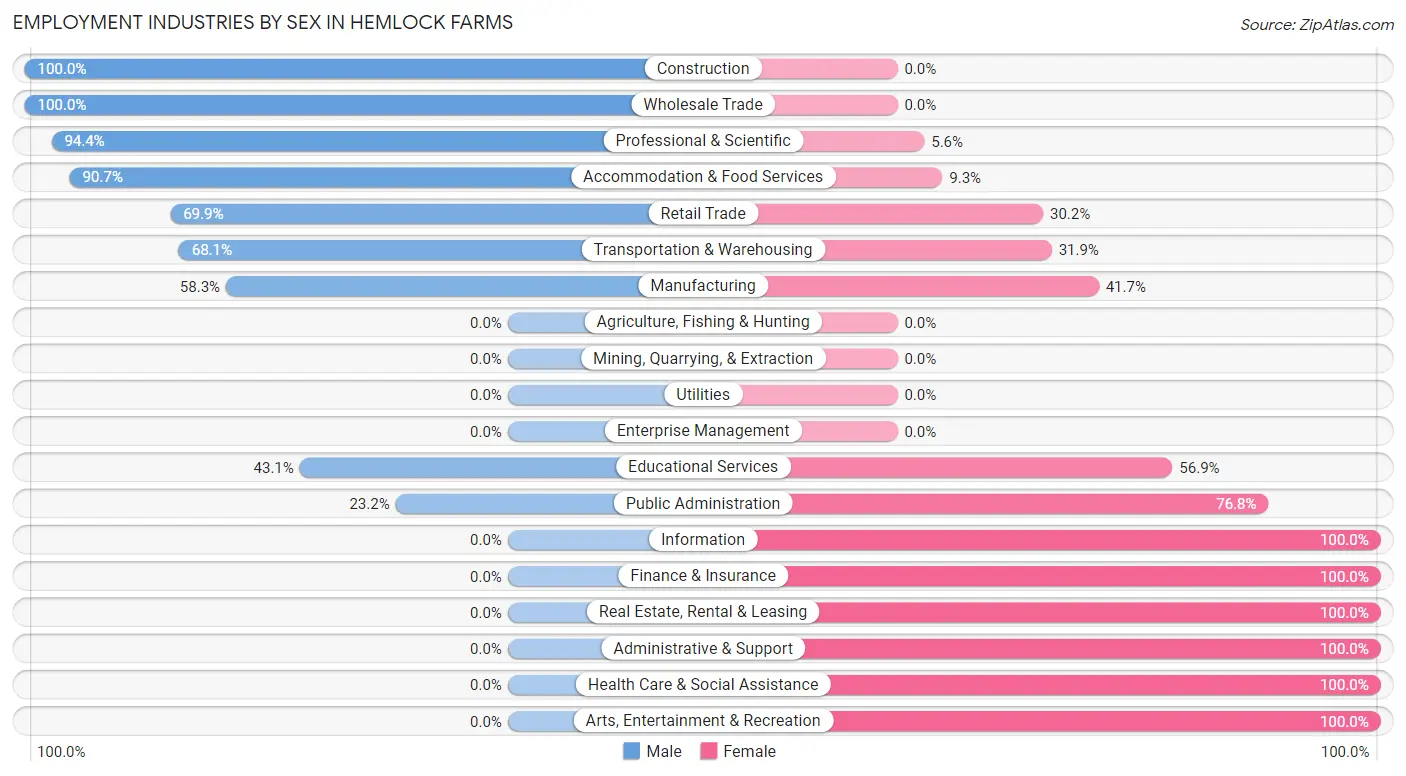
Employment Industries by Sex in Hemlock Farms
The Hemlock Farms industries that see more men than women are Construction (100.0%), Wholesale Trade (100.0%), and Professional & Scientific (94.4%), whereas the industries that tend to have a higher number of women are Information (100.0%), Finance & Insurance (100.0%), and Real Estate, Rental & Leasing (100.0%).
| Industry | Male | Female |
| Agriculture, Fishing & Hunting | 0 (0.0%) | 0 (0.0%) |
| Mining, Quarrying, & Extraction | 0 (0.0%) | 0 (0.0%) |
| Construction | 139 (100.0%) | 0 (0.0%) |
| Manufacturing | 98 (58.3%) | 70 (41.7%) |
| Wholesale Trade | 43 (100.0%) | 0 (0.0%) |
| Retail Trade | 285 (69.9%) | 123 (30.1%) |
| Transportation & Warehousing | 81 (68.1%) | 38 (31.9%) |
| Utilities | 0 (0.0%) | 0 (0.0%) |
| Information | 0 (0.0%) | 42 (100.0%) |
| Finance & Insurance | 0 (0.0%) | 81 (100.0%) |
| Real Estate, Rental & Leasing | 0 (0.0%) | 31 (100.0%) |
| Professional & Scientific | 85 (94.4%) | 5 (5.6%) |
| Enterprise Management | 0 (0.0%) | 0 (0.0%) |
| Administrative & Support | 0 (0.0%) | 36 (100.0%) |
| Educational Services | 56 (43.1%) | 74 (56.9%) |
| Health Care & Social Assistance | 0 (0.0%) | 115 (100.0%) |
| Arts, Entertainment & Recreation | 0 (0.0%) | 12 (100.0%) |
| Accommodation & Food Services | 39 (90.7%) | 4 (9.3%) |
| Public Administration | 23 (23.2%) | 76 (76.8%) |
| Total | 871 (53.6%) | 755 (46.4%) |
Education in Hemlock Farms
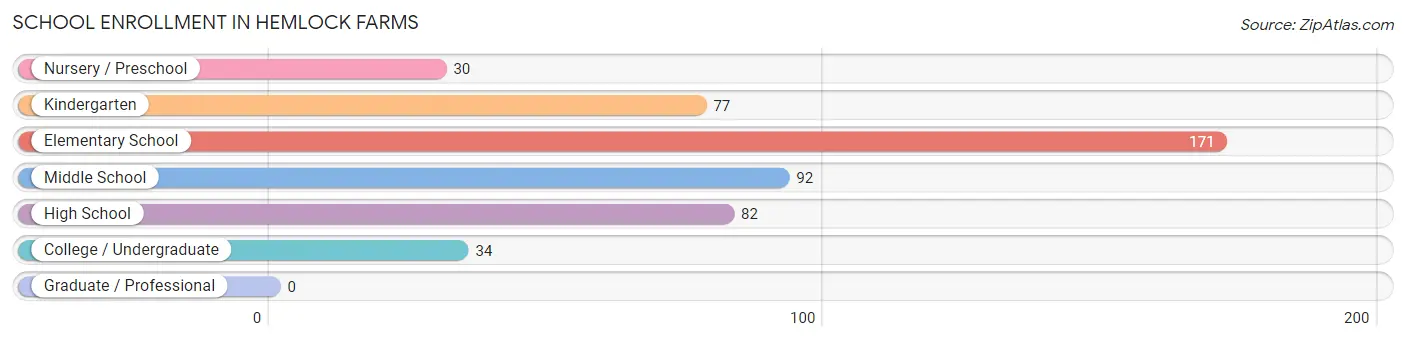
School Enrollment in Hemlock Farms
The most common levels of schooling among the 486 students in Hemlock Farms are elementary school (171 | 35.2%), middle school (92 | 18.9%), and high school (82 | 16.9%).
| School Level | # Students | % Students |
| Nursery / Preschool | 30 | 6.2% |
| Kindergarten | 77 | 15.8% |
| Elementary School | 171 | 35.2% |
| Middle School | 92 | 18.9% |
| High School | 82 | 16.9% |
| College / Undergraduate | 34 | 7.0% |
| Graduate / Professional | 0 | 0.0% |
| Total | 486 | 100.0% |
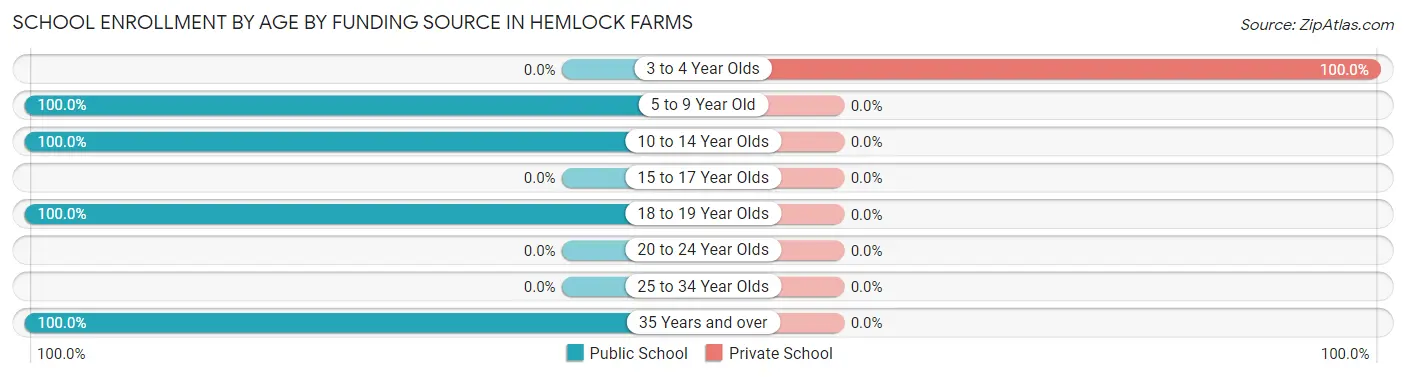
School Enrollment by Age by Funding Source in Hemlock Farms
Out of a total of 486 students who are enrolled in schools in Hemlock Farms, 30 (6.2%) attend a private institution, while the remaining 456 (93.8%) are enrolled in public schools. The age group of 3 to 4 year olds has the highest likelihood of being enrolled in private schools, with 30 (100.0% in the age bracket) enrolled. Conversely, the age group of 5 to 9 year old has the lowest likelihood of being enrolled in a private school, with 248 (100.0% in the age bracket) attending a public institution.
| Age Bracket | Public School | Private School |
| 3 to 4 Year Olds | 0 (0.0%) | 30 (100.0%) |
| 5 to 9 Year Old | 248 (100.0%) | 0 (0.0%) |
| 10 to 14 Year Olds | 117 (100.0%) | 0 (0.0%) |
| 15 to 17 Year Olds | 0 (0.0%) | 0 (0.0%) |
| 18 to 19 Year Olds | 57 (100.0%) | 0 (0.0%) |
| 20 to 24 Year Olds | 0 (0.0%) | 0 (0.0%) |
| 25 to 34 Year Olds | 0 (0.0%) | 0 (0.0%) |
| 35 Years and over | 34 (100.0%) | 0 (0.0%) |
| Total | 456 (93.8%) | 30 (6.2%) |
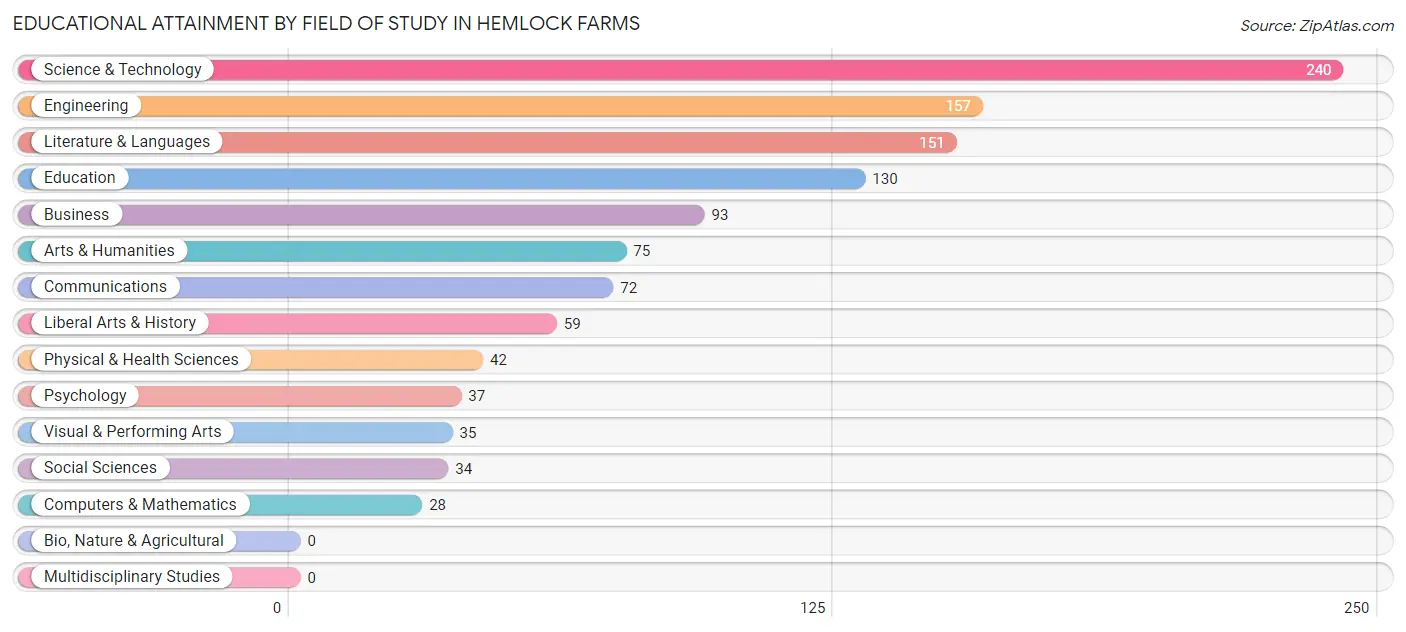
Educational Attainment by Field of Study in Hemlock Farms
Science & technology (240 | 20.8%), engineering (157 | 13.6%), literature & languages (151 | 13.1%), education (130 | 11.3%), and business (93 | 8.1%) are the most common fields of study among 1,153 individuals in Hemlock Farms who have obtained a bachelor's degree or higher.
| Field of Study | # Graduates | % Graduates |
| Computers & Mathematics | 28 | 2.4% |
| Bio, Nature & Agricultural | 0 | 0.0% |
| Physical & Health Sciences | 42 | 3.6% |
| Psychology | 37 | 3.2% |
| Social Sciences | 34 | 2.9% |
| Engineering | 157 | 13.6% |
| Multidisciplinary Studies | 0 | 0.0% |
| Science & Technology | 240 | 20.8% |
| Business | 93 | 8.1% |
| Education | 130 | 11.3% |
| Literature & Languages | 151 | 13.1% |
| Liberal Arts & History | 59 | 5.1% |
| Visual & Performing Arts | 35 | 3.0% |
| Communications | 72 | 6.2% |
| Arts & Humanities | 75 | 6.5% |
| Total | 1,153 | 100.0% |
Transportation & Commute in Hemlock Farms
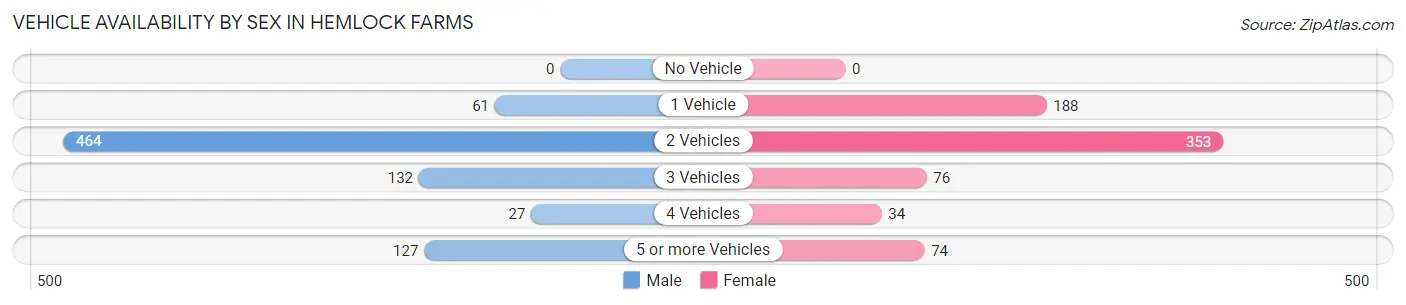
Vehicle Availability by Sex in Hemlock Farms
The most prevalent vehicle ownership categories in Hemlock Farms are males with 2 vehicles (464, accounting for 57.2%) and females with 2 vehicles (353, making up 64.0%).
| Vehicles Available | Male | Female |
| No Vehicle | 0 (0.0%) | 0 (0.0%) |
| 1 Vehicle | 61 (7.5%) | 188 (25.9%) |
| 2 Vehicles | 464 (57.2%) | 353 (48.7%) |
| 3 Vehicles | 132 (16.3%) | 76 (10.5%) |
| 4 Vehicles | 27 (3.3%) | 34 (4.7%) |
| 5 or more Vehicles | 127 (15.7%) | 74 (10.2%) |
| Total | 811 (100.0%) | 725 (100.0%) |
Commute Time in Hemlock Farms
The most frequently occuring commute durations in Hemlock Farms are 90 or more minutes (250 commuters, 21.0%), 45 to 59 minutes (230 commuters, 19.3%), and 5 to 9 minutes (178 commuters, 15.0%).
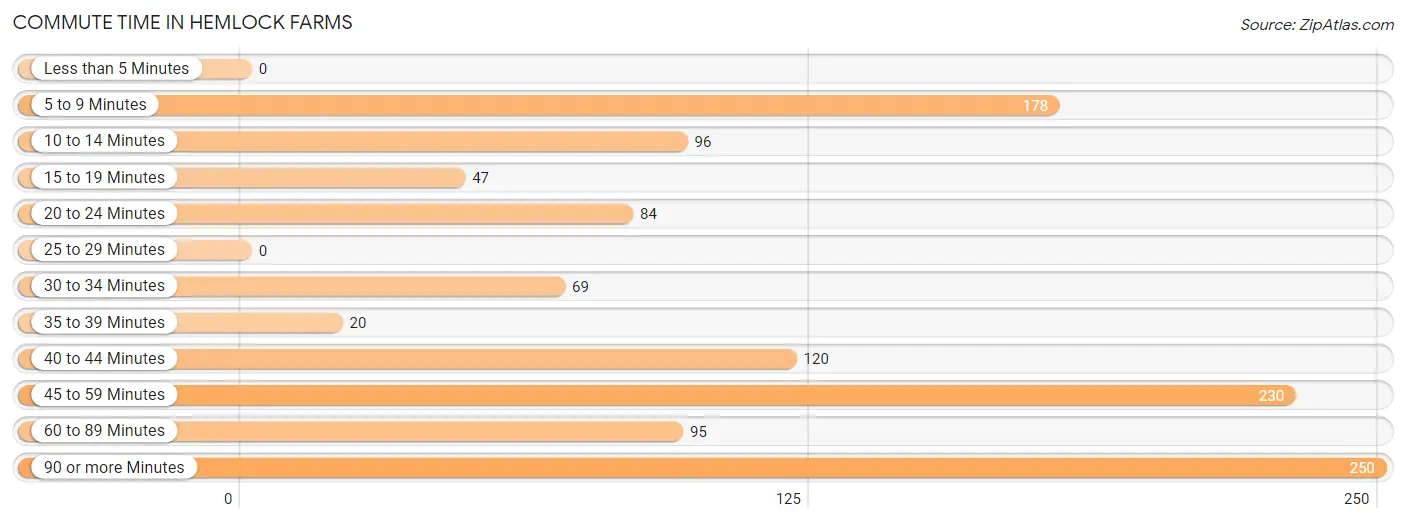
| Commute Time | # Commuters | % Commuters |
| Less than 5 Minutes | 0 | 0.0% |
| 5 to 9 Minutes | 178 | 15.0% |
| 10 to 14 Minutes | 96 | 8.1% |
| 15 to 19 Minutes | 47 | 4.0% |
| 20 to 24 Minutes | 84 | 7.1% |
| 25 to 29 Minutes | 0 | 0.0% |
| 30 to 34 Minutes | 69 | 5.8% |
| 35 to 39 Minutes | 20 | 1.7% |
| 40 to 44 Minutes | 120 | 10.1% |
| 45 to 59 Minutes | 230 | 19.3% |
| 60 to 89 Minutes | 95 | 8.0% |
| 90 or more Minutes | 250 | 21.0% |
Commute Time by Sex in Hemlock Farms
The most common commute times in Hemlock Farms are 45 to 59 minutes (213 commuters, 31.2%) for males and 5 to 9 minutes (97 commuters, 19.1%) for females.
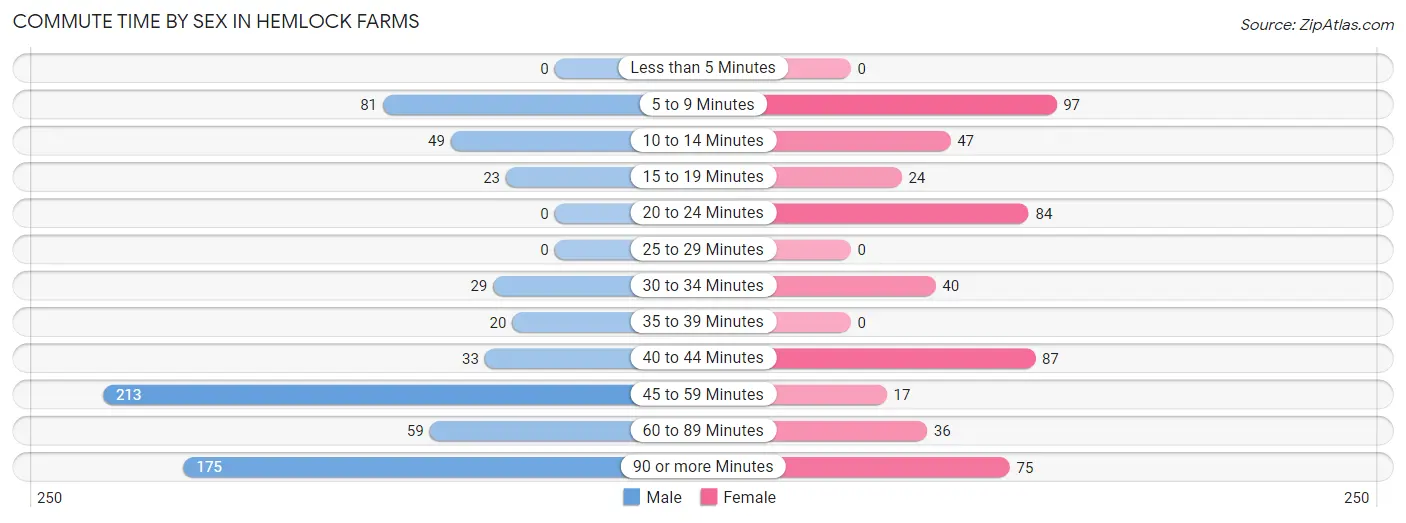
| Commute Time | Male | Female |
| Less than 5 Minutes | 0 (0.0%) | 0 (0.0%) |
| 5 to 9 Minutes | 81 (11.9%) | 97 (19.1%) |
| 10 to 14 Minutes | 49 (7.2%) | 47 (9.3%) |
| 15 to 19 Minutes | 23 (3.4%) | 24 (4.7%) |
| 20 to 24 Minutes | 0 (0.0%) | 84 (16.6%) |
| 25 to 29 Minutes | 0 (0.0%) | 0 (0.0%) |
| 30 to 34 Minutes | 29 (4.3%) | 40 (7.9%) |
| 35 to 39 Minutes | 20 (2.9%) | 0 (0.0%) |
| 40 to 44 Minutes | 33 (4.8%) | 87 (17.2%) |
| 45 to 59 Minutes | 213 (31.2%) | 17 (3.4%) |
| 60 to 89 Minutes | 59 (8.6%) | 36 (7.1%) |
| 90 or more Minutes | 175 (25.7%) | 75 (14.8%) |
Time of Departure to Work by Sex in Hemlock Farms
The most frequent times of departure to work in Hemlock Farms are 12:00 AM to 4:59 AM (173, 25.4%) for males and 8:00 AM to 8:29 AM (100, 19.7%) for females.
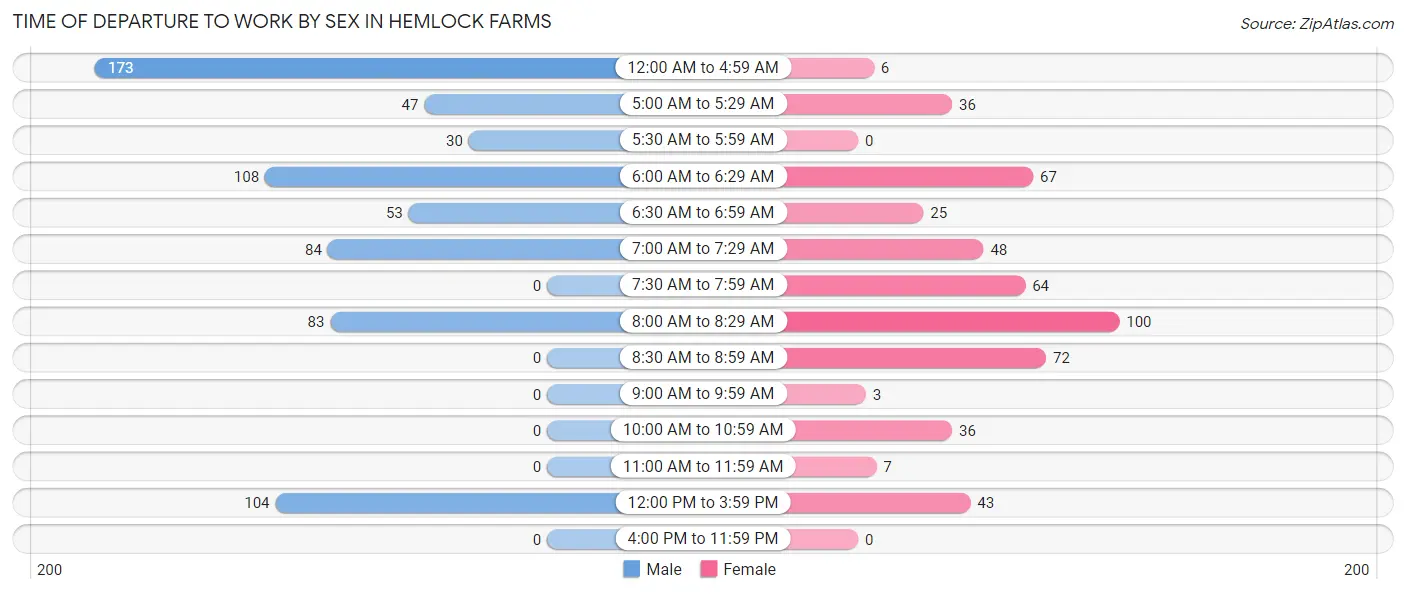
| Time of Departure | Male | Female |
| 12:00 AM to 4:59 AM | 173 (25.4%) | 6 (1.2%) |
| 5:00 AM to 5:29 AM | 47 (6.9%) | 36 (7.1%) |
| 5:30 AM to 5:59 AM | 30 (4.4%) | 0 (0.0%) |
| 6:00 AM to 6:29 AM | 108 (15.8%) | 67 (13.2%) |
| 6:30 AM to 6:59 AM | 53 (7.8%) | 25 (4.9%) |
| 7:00 AM to 7:29 AM | 84 (12.3%) | 48 (9.5%) |
| 7:30 AM to 7:59 AM | 0 (0.0%) | 64 (12.6%) |
| 8:00 AM to 8:29 AM | 83 (12.2%) | 100 (19.7%) |
| 8:30 AM to 8:59 AM | 0 (0.0%) | 72 (14.2%) |
| 9:00 AM to 9:59 AM | 0 (0.0%) | 3 (0.6%) |
| 10:00 AM to 10:59 AM | 0 (0.0%) | 36 (7.1%) |
| 11:00 AM to 11:59 AM | 0 (0.0%) | 7 (1.4%) |
| 12:00 PM to 3:59 PM | 104 (15.2%) | 43 (8.5%) |
| 4:00 PM to 11:59 PM | 0 (0.0%) | 0 (0.0%) |
| Total | 682 (100.0%) | 507 (100.0%) |
Housing Occupancy in Hemlock Farms
Occupancy by Ownership in Hemlock Farms
Of the total 1,713 dwellings in Hemlock Farms, owner-occupied units account for 1,423 (83.1%), while renter-occupied units make up 290 (16.9%).
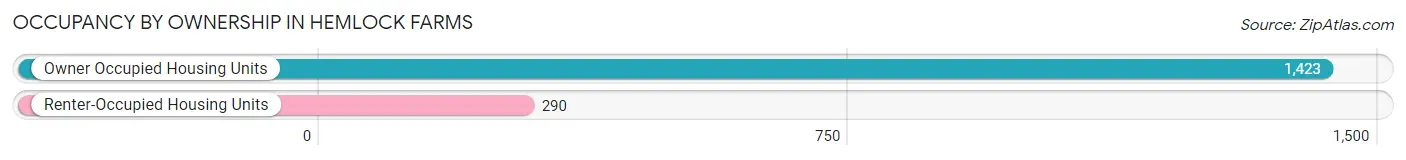
| Occupancy | # Housing Units | % Housing Units |
| Owner Occupied Housing Units | 1,423 | 83.1% |
| Renter-Occupied Housing Units | 290 | 16.9% |
| Total Occupied Housing Units | 1,713 | 100.0% |
Occupancy by Household Size in Hemlock Farms
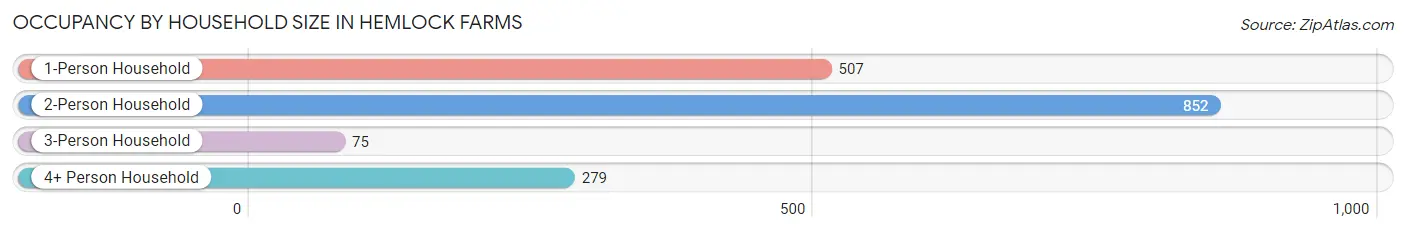
| Household Size | # Housing Units | % Housing Units |
| 1-Person Household | 507 | 29.6% |
| 2-Person Household | 852 | 49.7% |
| 3-Person Household | 75 | 4.4% |
| 4+ Person Household | 279 | 16.3% |
| Total Housing Units | 1,713 | 100.0% |
Occupancy by Ownership by Household Size in Hemlock Farms
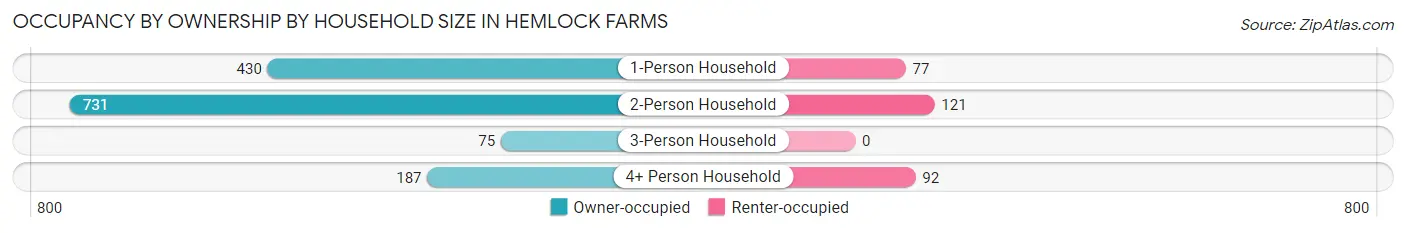
| Household Size | Owner-occupied | Renter-occupied |
| 1-Person Household | 430 (84.8%) | 77 (15.2%) |
| 2-Person Household | 731 (85.8%) | 121 (14.2%) |
| 3-Person Household | 75 (100.0%) | 0 (0.0%) |
| 4+ Person Household | 187 (67.0%) | 92 (33.0%) |
| Total Housing Units | 1,423 (83.1%) | 290 (16.9%) |
Occupancy by Educational Attainment in Hemlock Farms
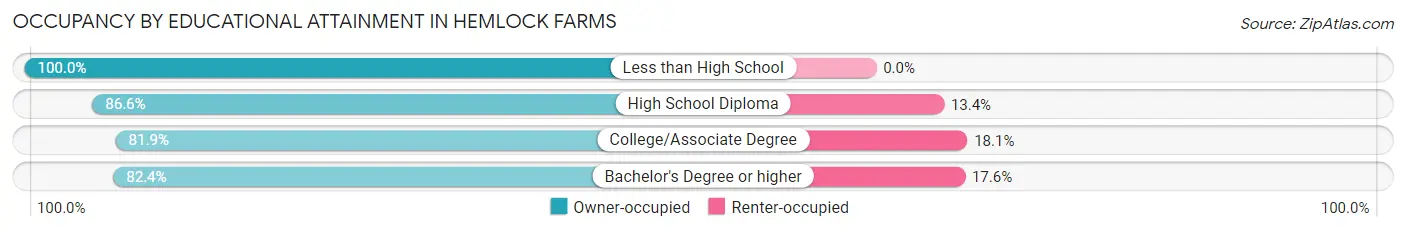
| Household Size | Owner-occupied | Renter-occupied |
| Less than High School | 8 (100.0%) | 0 (0.0%) |
| High School Diploma | 277 (86.6%) | 43 (13.4%) |
| College/Associate Degree | 558 (81.9%) | 123 (18.1%) |
| Bachelor's Degree or higher | 580 (82.4%) | 124 (17.6%) |
Occupancy by Age of Householder in Hemlock Farms
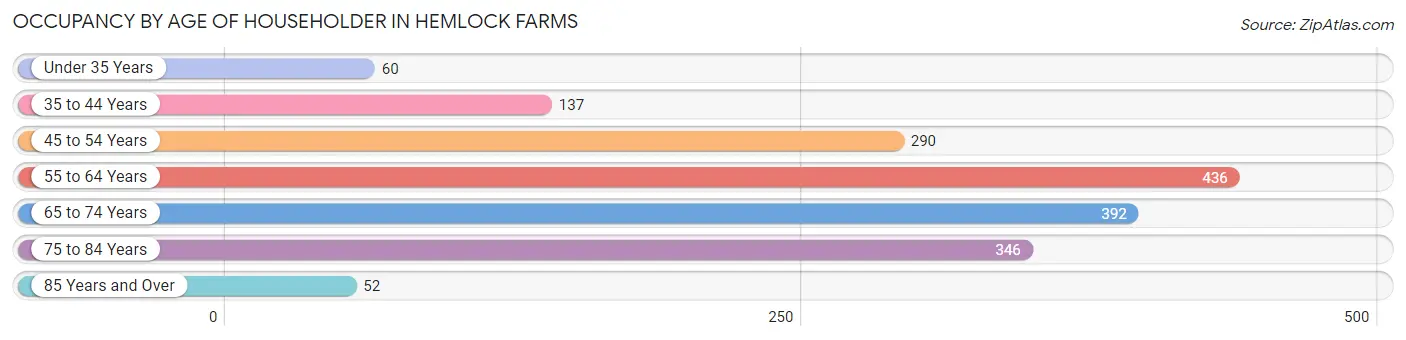
| Age Bracket | # Households | % Households |
| Under 35 Years | 60 | 3.5% |
| 35 to 44 Years | 137 | 8.0% |
| 45 to 54 Years | 290 | 16.9% |
| 55 to 64 Years | 436 | 25.5% |
| 65 to 74 Years | 392 | 22.9% |
| 75 to 84 Years | 346 | 20.2% |
| 85 Years and Over | 52 | 3.0% |
| Total | 1,713 | 100.0% |
Housing Finances in Hemlock Farms
Median Income by Occupancy in Hemlock Farms
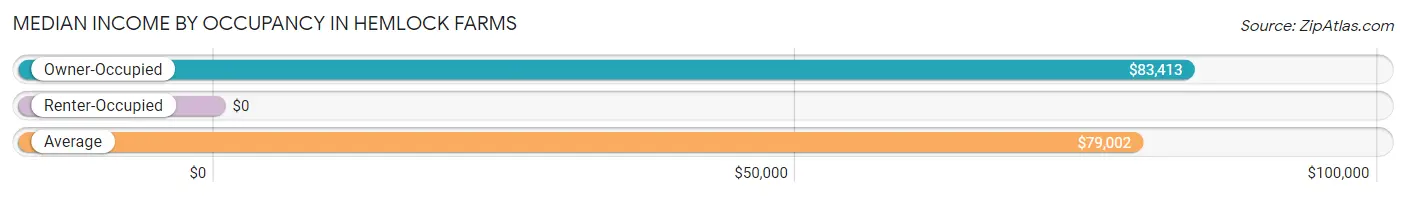
| Occupancy Type | # Households | Median Income |
| Owner-Occupied | 1,423 (83.1%) | $83,413 |
| Renter-Occupied | 290 (16.9%) | $0 |
| Average | 1,713 (100.0%) | $79,002 |
Occupancy by Householder Income Bracket in Hemlock Farms
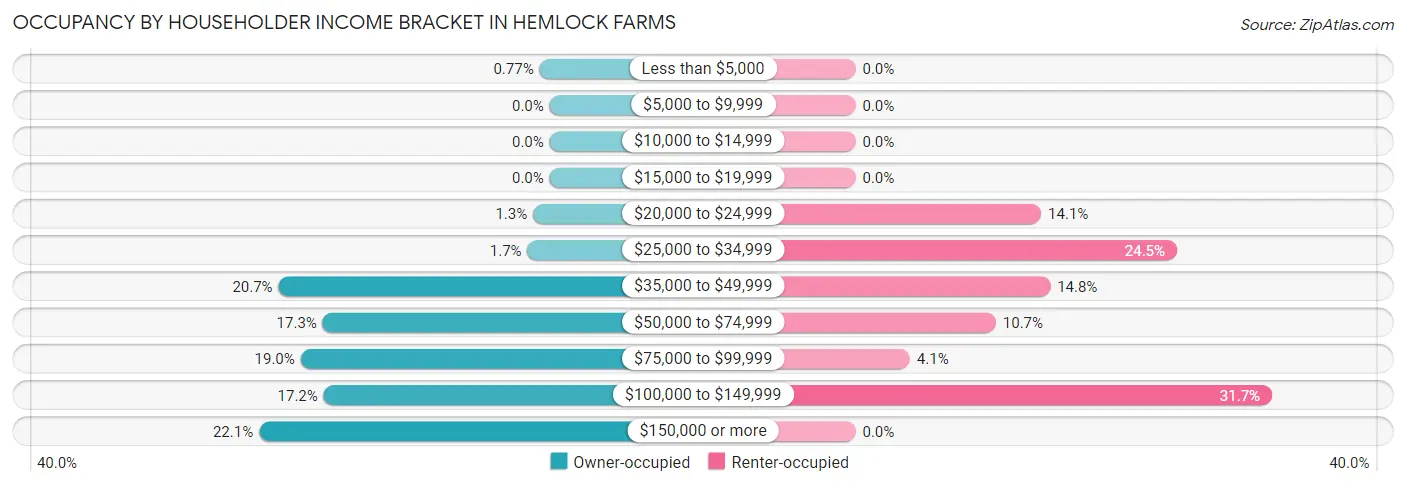
| Income Bracket | Owner-occupied | Renter-occupied |
| Less than $5,000 | 11 (0.8%) | 0 (0.0%) |
| $5,000 to $9,999 | 0 (0.0%) | 0 (0.0%) |
| $10,000 to $14,999 | 0 (0.0%) | 0 (0.0%) |
| $15,000 to $19,999 | 0 (0.0%) | 0 (0.0%) |
| $20,000 to $24,999 | 18 (1.3%) | 41 (14.1%) |
| $25,000 to $34,999 | 24 (1.7%) | 71 (24.5%) |
| $35,000 to $49,999 | 294 (20.7%) | 43 (14.8%) |
| $50,000 to $74,999 | 246 (17.3%) | 31 (10.7%) |
| $75,000 to $99,999 | 270 (19.0%) | 12 (4.1%) |
| $100,000 to $149,999 | 245 (17.2%) | 92 (31.7%) |
| $150,000 or more | 315 (22.1%) | 0 (0.0%) |
| Total | 1,423 (100.0%) | 290 (100.0%) |
Monthly Housing Cost Tiers in Hemlock Farms
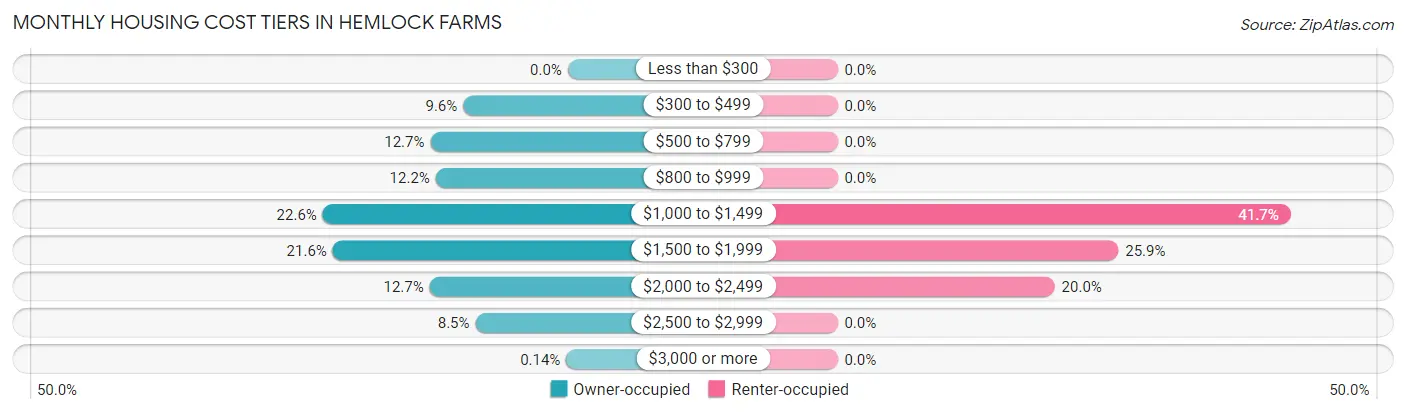
| Monthly Cost | Owner-occupied | Renter-occupied |
| Less than $300 | 0 (0.0%) | 0 (0.0%) |
| $300 to $499 | 137 (9.6%) | 0 (0.0%) |
| $500 to $799 | 180 (12.7%) | 0 (0.0%) |
| $800 to $999 | 173 (12.2%) | 0 (0.0%) |
| $1,000 to $1,499 | 321 (22.6%) | 121 (41.7%) |
| $1,500 to $1,999 | 308 (21.6%) | 75 (25.9%) |
| $2,000 to $2,499 | 181 (12.7%) | 58 (20.0%) |
| $2,500 to $2,999 | 121 (8.5%) | 0 (0.0%) |
| $3,000 or more | 2 (0.1%) | 0 (0.0%) |
| Total | 1,423 (100.0%) | 290 (100.0%) |
Physical Housing Characteristics in Hemlock Farms
Housing Structures in Hemlock Farms
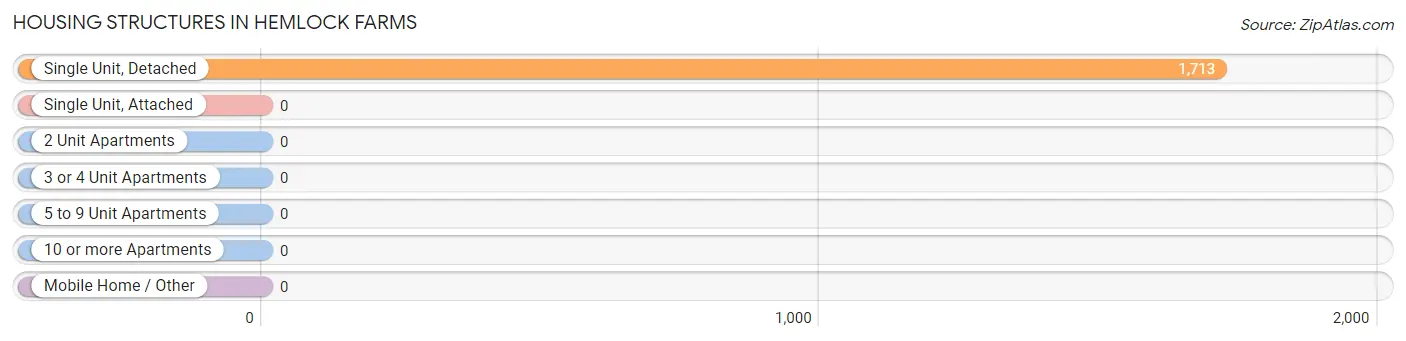
| Structure Type | # Housing Units | % Housing Units |
| Single Unit, Detached | 1,713 | 100.0% |
| Single Unit, Attached | 0 | 0.0% |
| 2 Unit Apartments | 0 | 0.0% |
| 3 or 4 Unit Apartments | 0 | 0.0% |
| 5 to 9 Unit Apartments | 0 | 0.0% |
| 10 or more Apartments | 0 | 0.0% |
| Mobile Home / Other | 0 | 0.0% |
| Total | 1,713 | 100.0% |
Housing Structures by Occupancy in Hemlock Farms
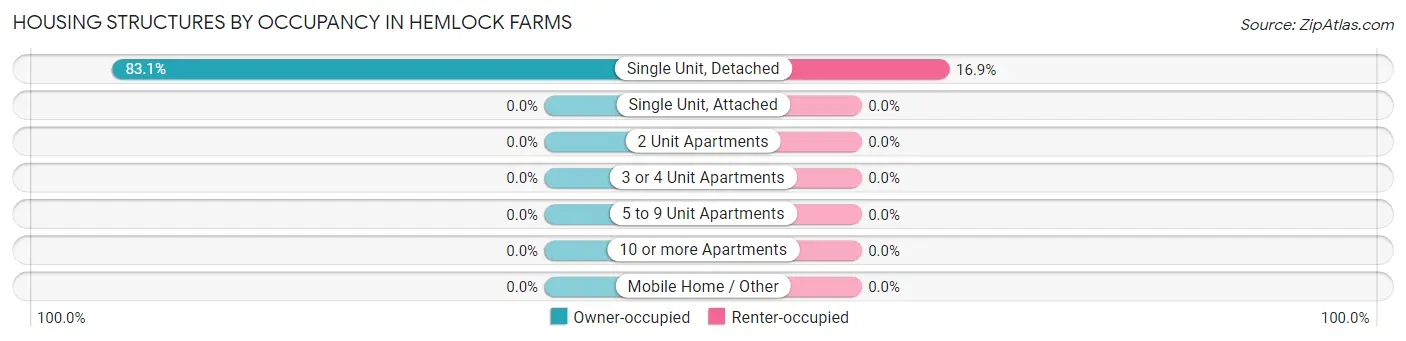
| Structure Type | Owner-occupied | Renter-occupied |
| Single Unit, Detached | 1,423 (83.1%) | 290 (16.9%) |
| Single Unit, Attached | 0 (0.0%) | 0 (0.0%) |
| 2 Unit Apartments | 0 (0.0%) | 0 (0.0%) |
| 3 or 4 Unit Apartments | 0 (0.0%) | 0 (0.0%) |
| 5 to 9 Unit Apartments | 0 (0.0%) | 0 (0.0%) |
| 10 or more Apartments | 0 (0.0%) | 0 (0.0%) |
| Mobile Home / Other | 0 (0.0%) | 0 (0.0%) |
| Total | 1,423 (83.1%) | 290 (16.9%) |
Housing Structures by Number of Rooms in Hemlock Farms
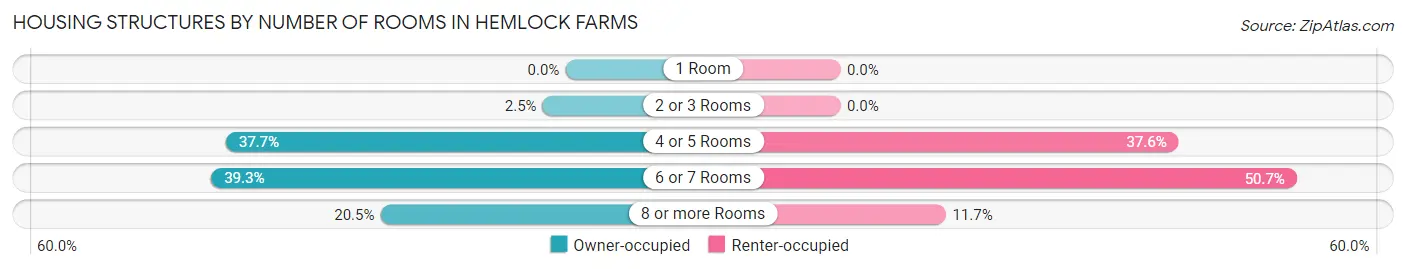
| Number of Rooms | Owner-occupied | Renter-occupied |
| 1 Room | 0 (0.0%) | 0 (0.0%) |
| 2 or 3 Rooms | 36 (2.5%) | 0 (0.0%) |
| 4 or 5 Rooms | 536 (37.7%) | 109 (37.6%) |
| 6 or 7 Rooms | 559 (39.3%) | 147 (50.7%) |
| 8 or more Rooms | 292 (20.5%) | 34 (11.7%) |
| Total | 1,423 (100.0%) | 290 (100.0%) |
Housing Structure by Heating Type in Hemlock Farms
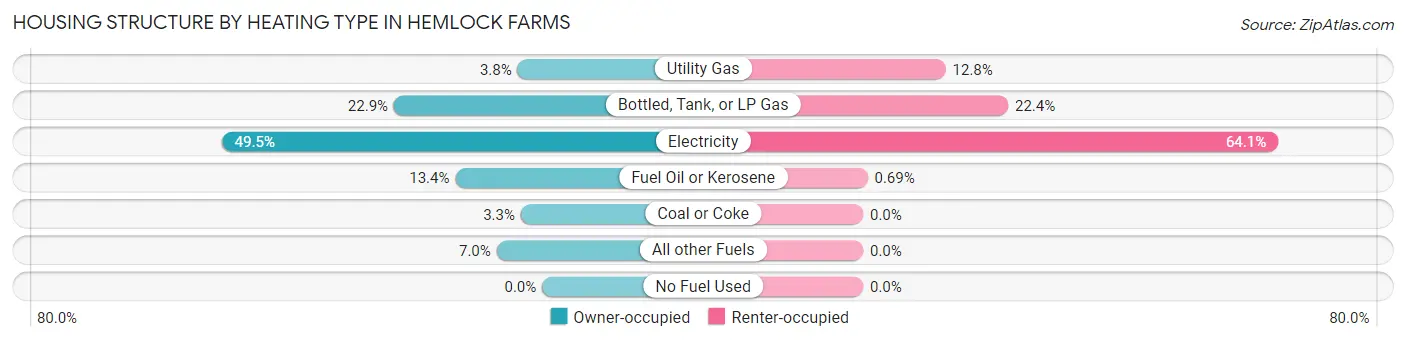
| Heating Type | Owner-occupied | Renter-occupied |
| Utility Gas | 54 (3.8%) | 37 (12.8%) |
| Bottled, Tank, or LP Gas | 326 (22.9%) | 65 (22.4%) |
| Electricity | 705 (49.5%) | 186 (64.1%) |
| Fuel Oil or Kerosene | 191 (13.4%) | 2 (0.7%) |
| Coal or Coke | 47 (3.3%) | 0 (0.0%) |
| All other Fuels | 100 (7.0%) | 0 (0.0%) |
| No Fuel Used | 0 (0.0%) | 0 (0.0%) |
| Total | 1,423 (100.0%) | 290 (100.0%) |
Household Vehicle Usage in Hemlock Farms
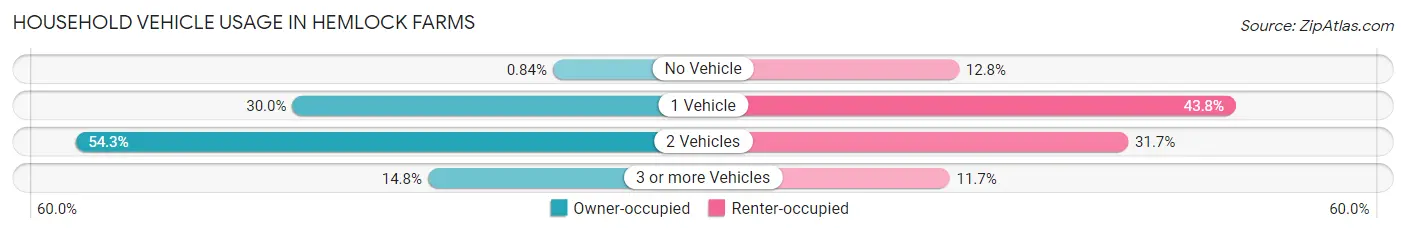
| Vehicles per Household | Owner-occupied | Renter-occupied |
| No Vehicle | 12 (0.8%) | 37 (12.8%) |
| 1 Vehicle | 427 (30.0%) | 127 (43.8%) |
| 2 Vehicles | 773 (54.3%) | 92 (31.7%) |
| 3 or more Vehicles | 211 (14.8%) | 34 (11.7%) |
| Total | 1,423 (100.0%) | 290 (100.0%) |
Real Estate & Mortgages in Hemlock Farms
Real Estate and Mortgage Overview in Hemlock Farms
| Characteristic | Without Mortgage | With Mortgage |
| Housing Units | 466 | 957 |
| Median Property Value | $244,600 | $239,100 |
| Median Household Income | $83,269 | $247 |
| Monthly Housing Costs | $711 | $2 |
| Real Estate Taxes | $3,330 | $0 |
Property Value by Mortgage Status in Hemlock Farms
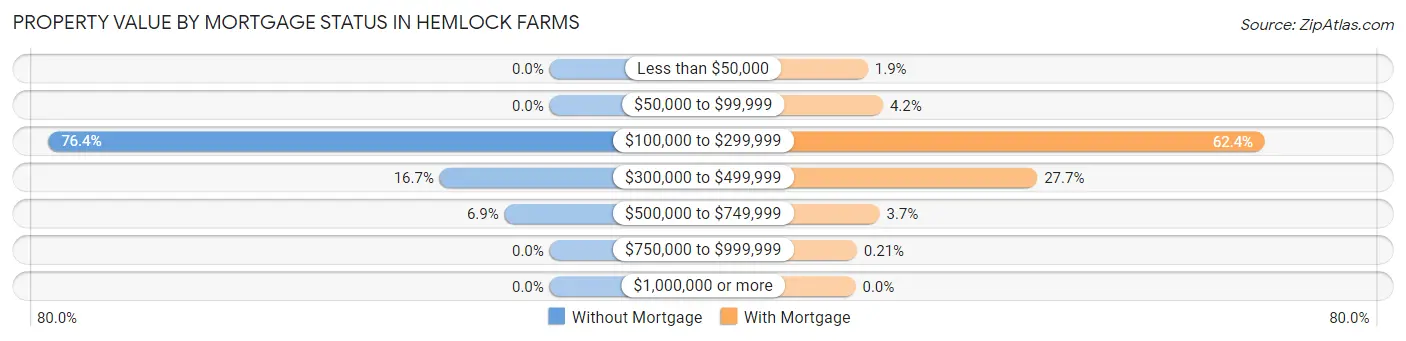
| Property Value | Without Mortgage | With Mortgage |
| Less than $50,000 | 0 (0.0%) | 18 (1.9%) |
| $50,000 to $99,999 | 0 (0.0%) | 40 (4.2%) |
| $100,000 to $299,999 | 356 (76.4%) | 597 (62.4%) |
| $300,000 to $499,999 | 78 (16.7%) | 265 (27.7%) |
| $500,000 to $749,999 | 32 (6.9%) | 35 (3.7%) |
| $750,000 to $999,999 | 0 (0.0%) | 2 (0.2%) |
| $1,000,000 or more | 0 (0.0%) | 0 (0.0%) |
| Total | 466 (100.0%) | 957 (100.0%) |
Household Income by Mortgage Status in Hemlock Farms
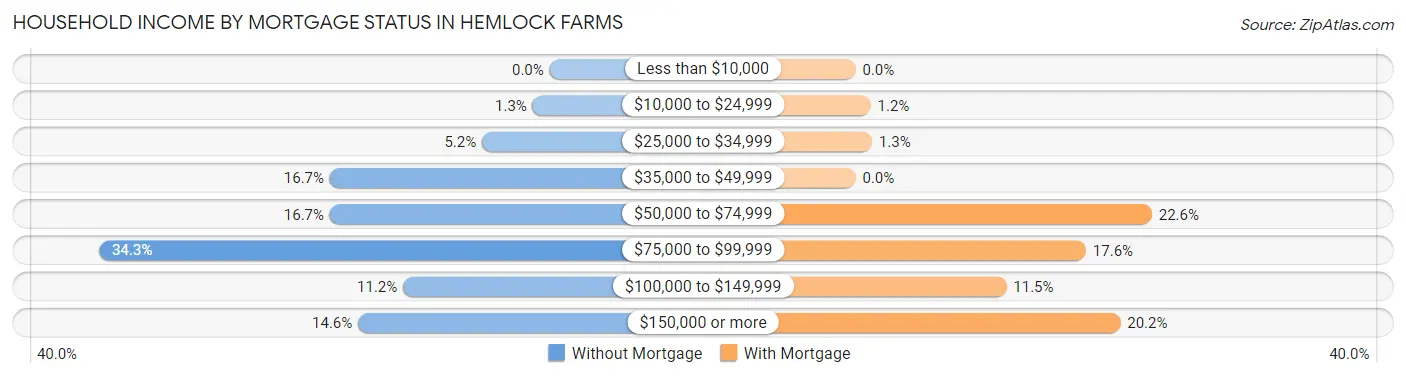
| Household Income | Without Mortgage | With Mortgage |
| Less than $10,000 | 0 (0.0%) | 0 (0.0%) |
| $10,000 to $24,999 | 6 (1.3%) | 11 (1.1%) |
| $25,000 to $34,999 | 24 (5.1%) | 12 (1.3%) |
| $35,000 to $49,999 | 78 (16.7%) | 0 (0.0%) |
| $50,000 to $74,999 | 78 (16.7%) | 216 (22.6%) |
| $75,000 to $99,999 | 160 (34.3%) | 168 (17.5%) |
| $100,000 to $149,999 | 52 (11.2%) | 110 (11.5%) |
| $150,000 or more | 68 (14.6%) | 193 (20.2%) |
| Total | 466 (100.0%) | 957 (100.0%) |
Property Value to Household Income Ratio in Hemlock Farms
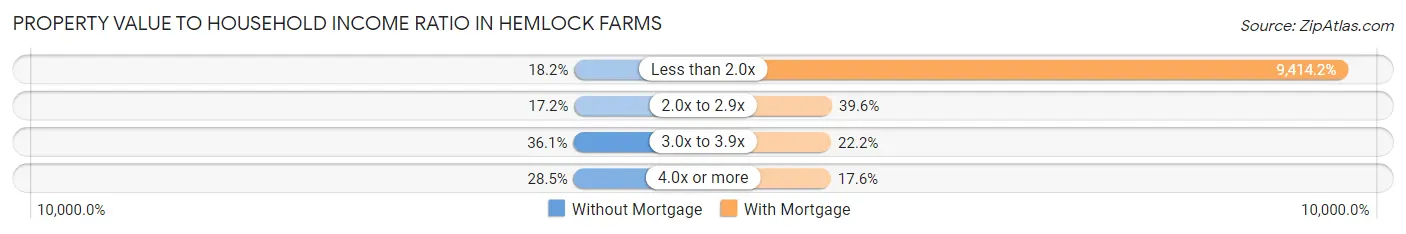
| Value-to-Income Ratio | Without Mortgage | With Mortgage |
| Less than 2.0x | 85 (18.2%) | 90,094 (9,414.2%) |
| 2.0x to 2.9x | 80 (17.2%) | 379 (39.6%) |
| 3.0x to 3.9x | 168 (36.0%) | 212 (22.2%) |
| 4.0x or more | 133 (28.5%) | 168 (17.5%) |
| Total | 466 (100.0%) | 957 (100.0%) |
Real Estate Taxes by Mortgage Status in Hemlock Farms
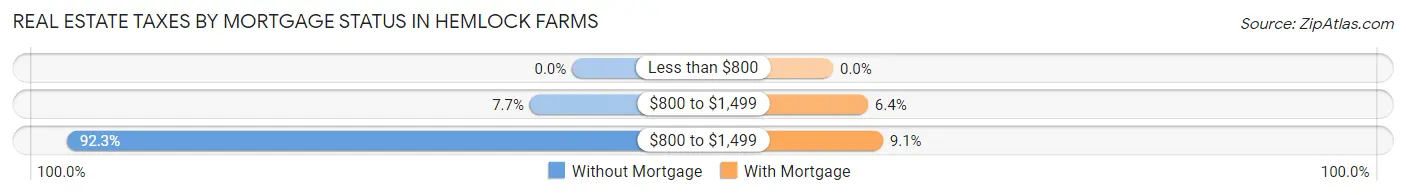
| Property Taxes | Without Mortgage | With Mortgage |
| Less than $800 | 0 (0.0%) | 0 (0.0%) |
| $800 to $1,499 | 36 (7.7%) | 61 (6.4%) |
| $800 to $1,499 | 430 (92.3%) | 87 (9.1%) |
| Total | 466 (100.0%) | 957 (100.0%) |
Health & Disability in Hemlock Farms
Health Insurance Coverage by Age in Hemlock Farms
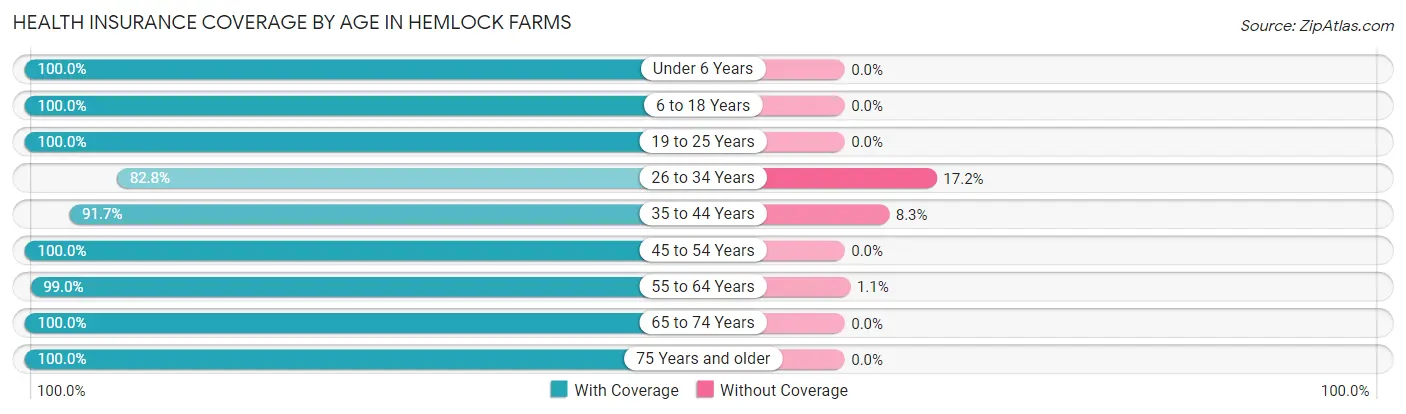
| Age Bracket | With Coverage | Without Coverage |
| Under 6 Years | 69 (100.0%) | 0 (0.0%) |
| 6 to 18 Years | 460 (100.0%) | 0 (0.0%) |
| 19 to 25 Years | 77 (100.0%) | 0 (0.0%) |
| 26 to 34 Years | 188 (82.8%) | 39 (17.2%) |
| 35 to 44 Years | 343 (91.7%) | 31 (8.3%) |
| 45 to 54 Years | 478 (100.0%) | 0 (0.0%) |
| 55 to 64 Years | 661 (99.0%) | 7 (1.1%) |
| 65 to 74 Years | 664 (100.0%) | 0 (0.0%) |
| 75 Years and older | 630 (100.0%) | 0 (0.0%) |
| Total | 3,570 (97.9%) | 77 (2.1%) |
Health Insurance Coverage by Citizenship Status in Hemlock Farms
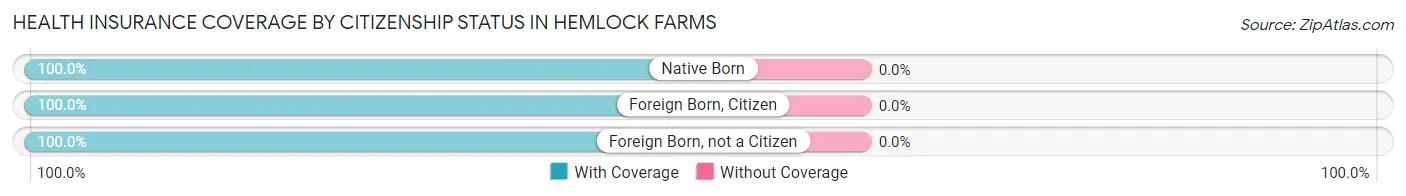
| Citizenship Status | With Coverage | Without Coverage |
| Native Born | 69 (100.0%) | 0 (0.0%) |
| Foreign Born, Citizen | 460 (100.0%) | 0 (0.0%) |
| Foreign Born, not a Citizen | 77 (100.0%) | 0 (0.0%) |
Health Insurance Coverage by Household Income in Hemlock Farms
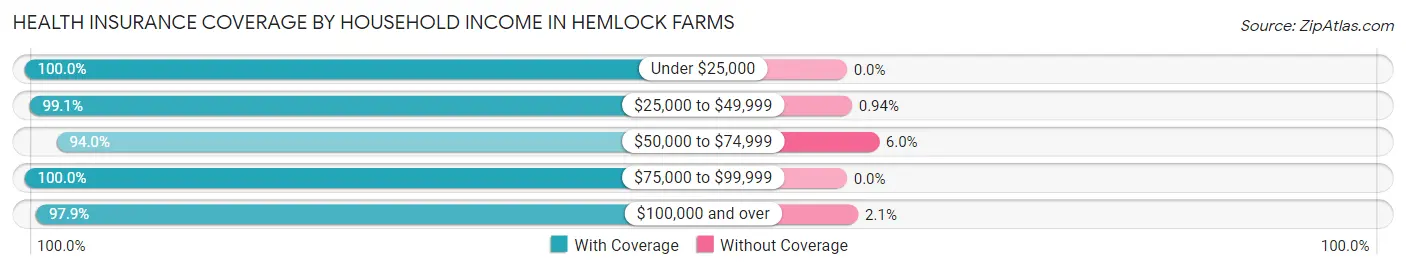
| Household Income | With Coverage | Without Coverage |
| Under $25,000 | 70 (100.0%) | 0 (0.0%) |
| $25,000 to $49,999 | 740 (99.1%) | 7 (0.9%) |
| $50,000 to $74,999 | 486 (94.0%) | 31 (6.0%) |
| $75,000 to $99,999 | 481 (100.0%) | 0 (0.0%) |
| $100,000 and over | 1,793 (97.9%) | 39 (2.1%) |
Public vs Private Health Insurance Coverage by Age in Hemlock Farms
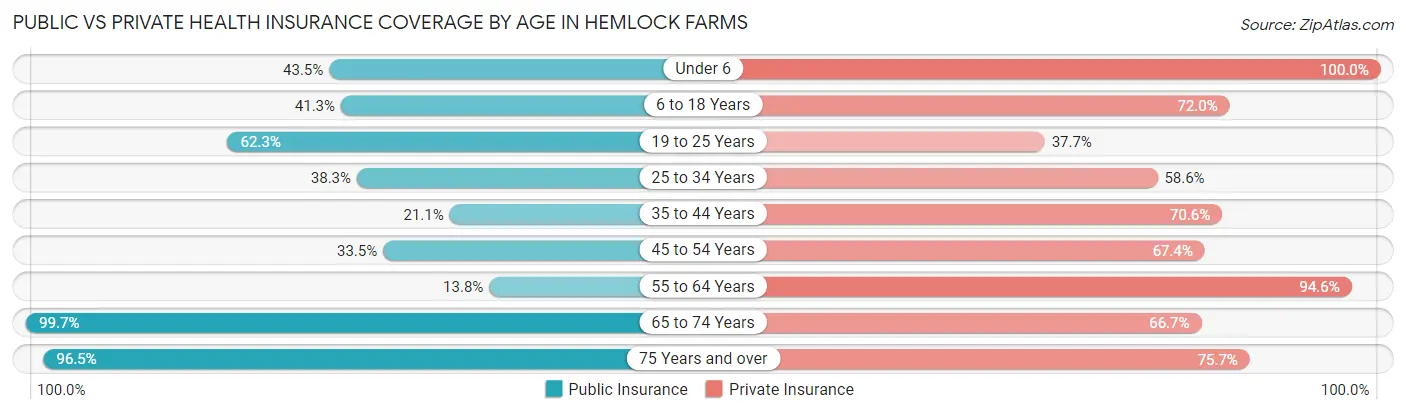
| Age Bracket | Public Insurance | Private Insurance |
| Under 6 | 30 (43.5%) | 69 (100.0%) |
| 6 to 18 Years | 190 (41.3%) | 331 (72.0%) |
| 19 to 25 Years | 48 (62.3%) | 29 (37.7%) |
| 25 to 34 Years | 87 (38.3%) | 133 (58.6%) |
| 35 to 44 Years | 79 (21.1%) | 264 (70.6%) |
| 45 to 54 Years | 160 (33.5%) | 322 (67.4%) |
| 55 to 64 Years | 92 (13.8%) | 632 (94.6%) |
| 65 to 74 Years | 662 (99.7%) | 443 (66.7%) |
| 75 Years and over | 608 (96.5%) | 477 (75.7%) |
| Total | 1,956 (53.6%) | 2,700 (74.0%) |
Disability Status by Sex by Age in Hemlock Farms
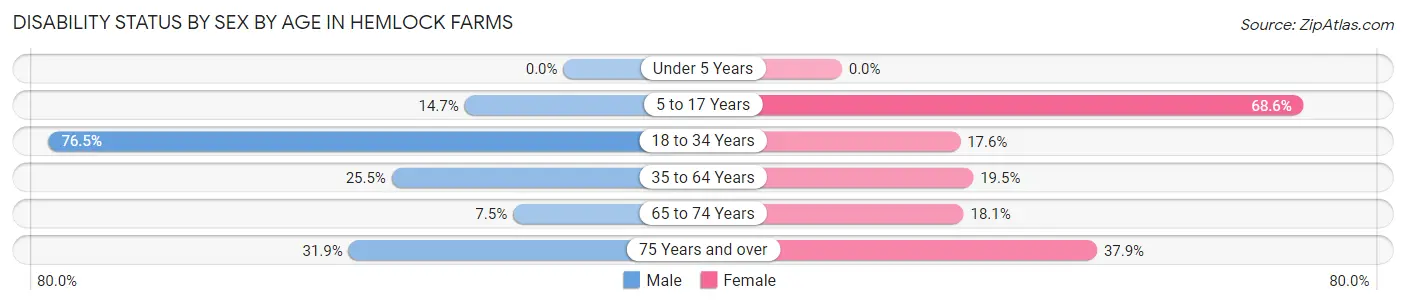
| Age Bracket | Male | Female |
| Under 5 Years | 0 (0.0%) | 0 (0.0%) |
| 5 to 17 Years | 33 (14.7%) | 96 (68.6%) |
| 18 to 34 Years | 185 (76.4%) | 32 (17.6%) |
| 35 to 64 Years | 219 (25.5%) | 129 (19.5%) |
| 65 to 74 Years | 24 (7.5%) | 62 (18.1%) |
| 75 Years and over | 89 (31.9%) | 133 (37.9%) |
Disability Class by Sex by Age in Hemlock Farms
Disability Class: Hearing Difficulty
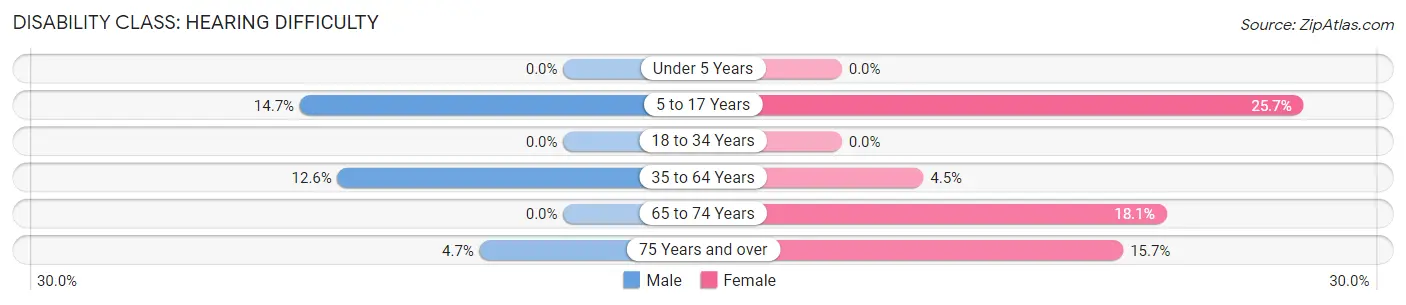
| Age Bracket | Male | Female |
| Under 5 Years | 0 (0.0%) | 0 (0.0%) |
| 5 to 17 Years | 33 (14.7%) | 36 (25.7%) |
| 18 to 34 Years | 0 (0.0%) | 0 (0.0%) |
| 35 to 64 Years | 108 (12.6%) | 30 (4.5%) |
| 65 to 74 Years | 0 (0.0%) | 62 (18.1%) |
| 75 Years and over | 13 (4.7%) | 55 (15.7%) |
Disability Class: Vision Difficulty
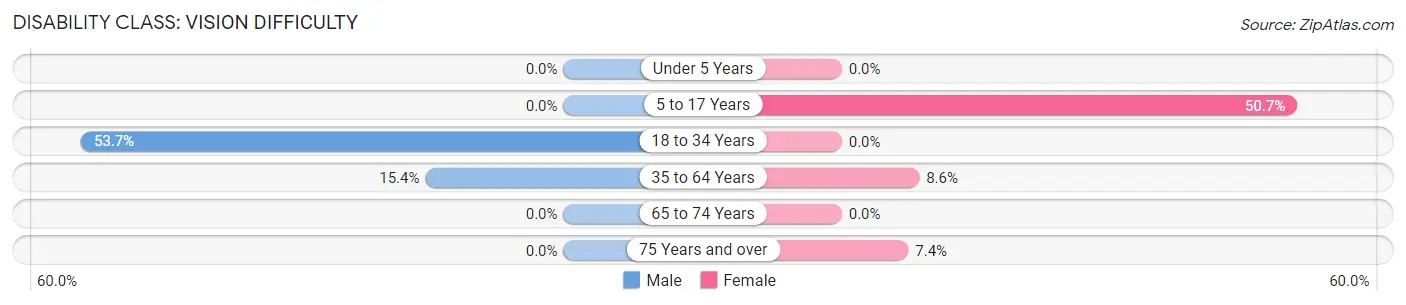
| Age Bracket | Male | Female |
| Under 5 Years | 0 (0.0%) | 0 (0.0%) |
| 5 to 17 Years | 0 (0.0%) | 71 (50.7%) |
| 18 to 34 Years | 130 (53.7%) | 0 (0.0%) |
| 35 to 64 Years | 132 (15.4%) | 57 (8.6%) |
| 65 to 74 Years | 0 (0.0%) | 0 (0.0%) |
| 75 Years and over | 0 (0.0%) | 26 (7.4%) |
Disability Class: Cognitive Difficulty
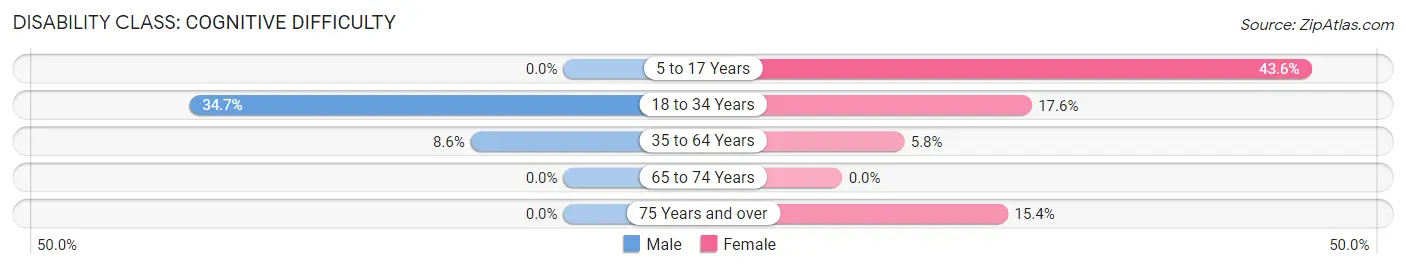
| Age Bracket | Male | Female |
| 5 to 17 Years | 0 (0.0%) | 61 (43.6%) |
| 18 to 34 Years | 84 (34.7%) | 32 (17.6%) |
| 35 to 64 Years | 74 (8.6%) | 38 (5.8%) |
| 65 to 74 Years | 0 (0.0%) | 0 (0.0%) |
| 75 Years and over | 0 (0.0%) | 54 (15.4%) |
Disability Class: Ambulatory Difficulty
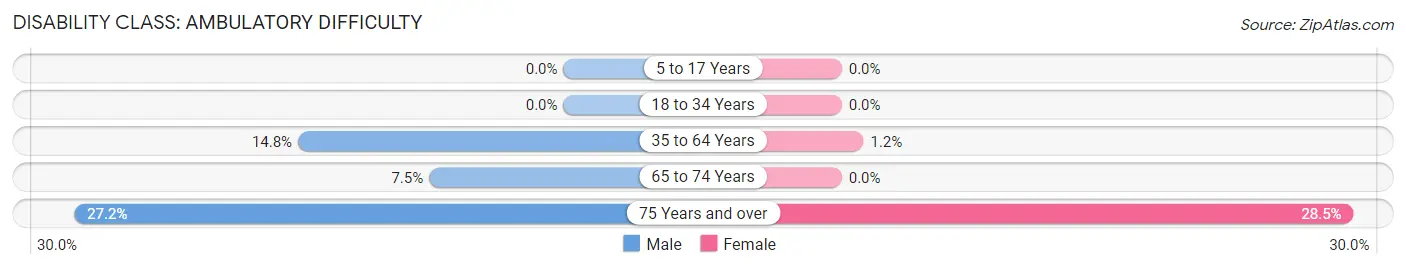
| Age Bracket | Male | Female |
| 5 to 17 Years | 0 (0.0%) | 0 (0.0%) |
| 18 to 34 Years | 0 (0.0%) | 0 (0.0%) |
| 35 to 64 Years | 127 (14.8%) | 8 (1.2%) |
| 65 to 74 Years | 24 (7.5%) | 0 (0.0%) |
| 75 Years and over | 76 (27.2%) | 100 (28.5%) |
Disability Class: Self-Care Difficulty
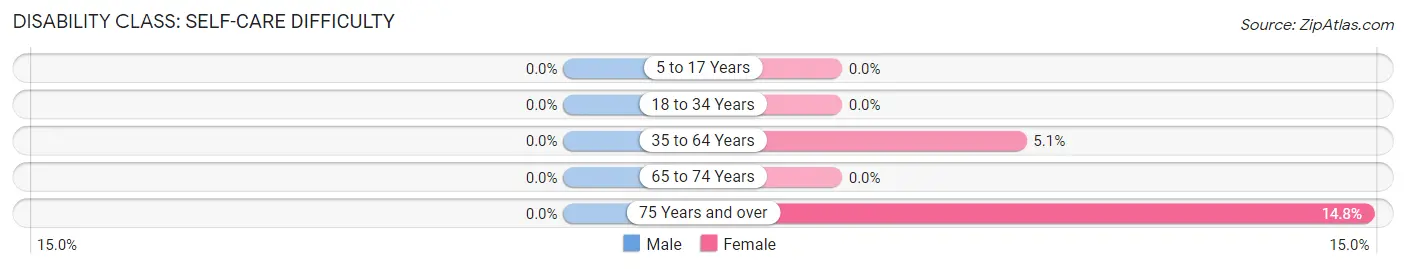
| Age Bracket | Male | Female |
| 5 to 17 Years | 0 (0.0%) | 0 (0.0%) |
| 18 to 34 Years | 0 (0.0%) | 0 (0.0%) |
| 35 to 64 Years | 0 (0.0%) | 34 (5.1%) |
| 65 to 74 Years | 0 (0.0%) | 0 (0.0%) |
| 75 Years and over | 0 (0.0%) | 52 (14.8%) |
Technology Access in Hemlock Farms
Computing Device Access in Hemlock Farms
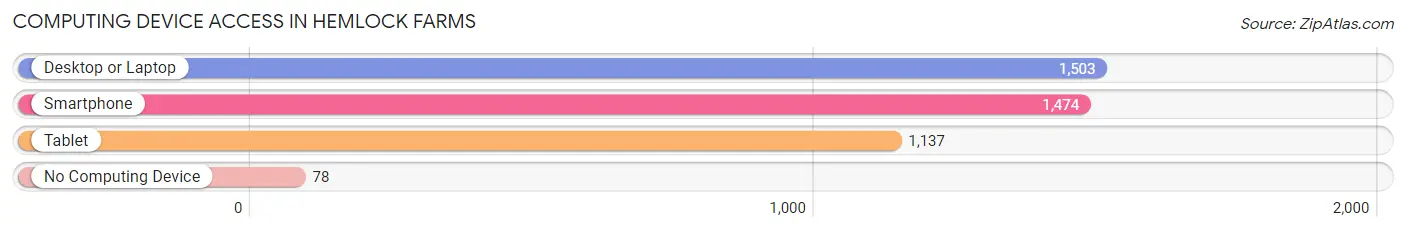
| Device Type | # Households | % Households |
| Desktop or Laptop | 1,503 | 87.7% |
| Smartphone | 1,474 | 86.1% |
| Tablet | 1,137 | 66.4% |
| No Computing Device | 78 | 4.5% |
| Total | 1,713 | 100.0% |
Internet Access in Hemlock Farms
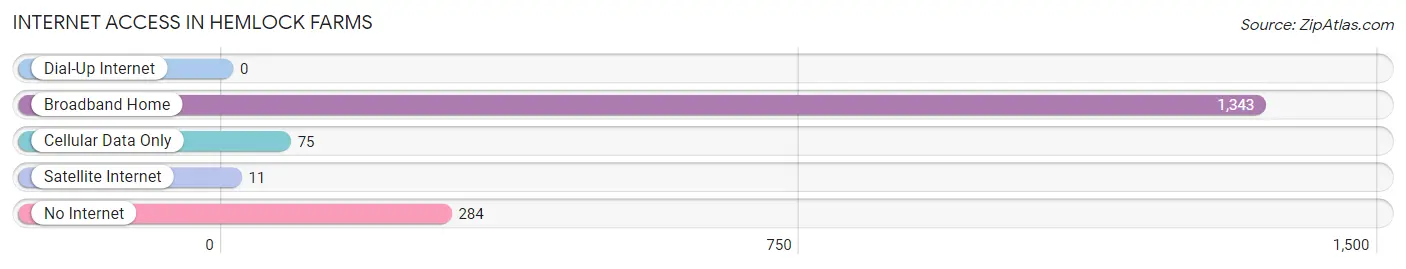
| Internet Type | # Households | % Households |
| Dial-Up Internet | 0 | 0.0% |
| Broadband Home | 1,343 | 78.4% |
| Cellular Data Only | 75 | 4.4% |
| Satellite Internet | 11 | 0.6% |
| No Internet | 284 | 16.6% |
| Total | 1,713 | 100.0% |
Hemlock Farms Summary
Hemlock Farms is a private, gated community located in Pike County, Pennsylvania. It is situated in the foothills of the Pocono Mountains, approximately 90 miles from New York City and Philadelphia. The community was founded in 1965 and is home to over 2,000 families.
History
Hemlock Farms was founded in 1965 by a group of investors led by William J. Kostka. The group purchased a large tract of land in the foothills of the Pocono Mountains and began developing the community. The original plan was to create a resort-style community with a variety of amenities, including a golf course, tennis courts, swimming pools, and a lake. The first homes were built in 1967 and the community quickly grew in popularity.
Geography
Hemlock Farms is located in Pike County, Pennsylvania, in the foothills of the Pocono Mountains. The community is situated on a plateau at an elevation of 1,400 feet. The area is characterized by rolling hills, forests, and streams. The climate is temperate, with cold winters and warm summers.
Economy
Hemlock Farms is a residential community and does not have a commercial or industrial base. The majority of the residents are employed in nearby towns and cities. The community is home to a variety of businesses, including a golf course, a restaurant, a convenience store, and a post office.
Demographics
As of the 2010 census, the population of Hemlock Farms was 2,072. The median age was 48.7 years, and the median household income was $90,000. The racial makeup of the community was 94.3% White, 2.2% African American, 0.7% Asian, and 2.8% other.
Conclusion
Hemlock Farms is a private, gated community located in Pike County, Pennsylvania. It was founded in 1965 and is home to over 2,000 families. The community is situated in the foothills of the Pocono Mountains and is characterized by rolling hills, forests, and streams. The economy is primarily residential, with most of the residents employed in nearby towns and cities. The population of Hemlock Farms is predominantly White, with a median age of 48.7 years and a median household income of $90,000.
Common Questions
What is the Total Population of Hemlock Farms?
Total Population of Hemlock Farms is 3,647.
What is the Total Male Population of Hemlock Farms?
Total Male Population of Hemlock Farms is 1,926.
What is the Total Female Population of Hemlock Farms?
Total Female Population of Hemlock Farms is 1,721.
What is the Ratio of Males per 100 Females in Hemlock Farms?
There are 111.91 Males per 100 Females in Hemlock Farms.
What is the Ratio of Females per 100 Males in Hemlock Farms?
There are 89.36 Females per 100 Males in Hemlock Farms.
What is the Median Population Age in Hemlock Farms?
Median Population Age in Hemlock Farms is 56.1 Years.
What is the Average Family Size in Hemlock Farms
Average Family Size in Hemlock Farms is 2.5 People.
What is the Average Household Size in Hemlock Farms
Average Household Size in Hemlock Farms is 2.1 People.
What is Per Capita Income in Hemlock Farms?
Per Capita income in Hemlock Farms is $46,800.
What is the Median Family Income in Hemlock Farms?
Median Family Income in Hemlock Farms is $92,757.
What is the Median Household income in Hemlock Farms?
Median Household Income in Hemlock Farms is $79,002.
What is Income or Wage Gap in Hemlock Farms?
Income or Wage Gap in Hemlock Farms is 25.3%.
Women in Hemlock Farms earn 74.7 cents for every dollar earned by a man.
What is Inequality or Gini Index in Hemlock Farms?
Inequality or Gini Index in Hemlock Farms is 0.37.
How Large is the Labor Force in Hemlock Farms?
There are 1,839 People in the Labor Forcein in Hemlock Farms.
What is the Percentage of People in the Labor Force in Hemlock Farms?
56.8% of People are in the Labor Force in Hemlock Farms.
What is the Unemployment Rate in Hemlock Farms?
Unemployment Rate in Hemlock Farms is 11.6%.