Grantley, PA
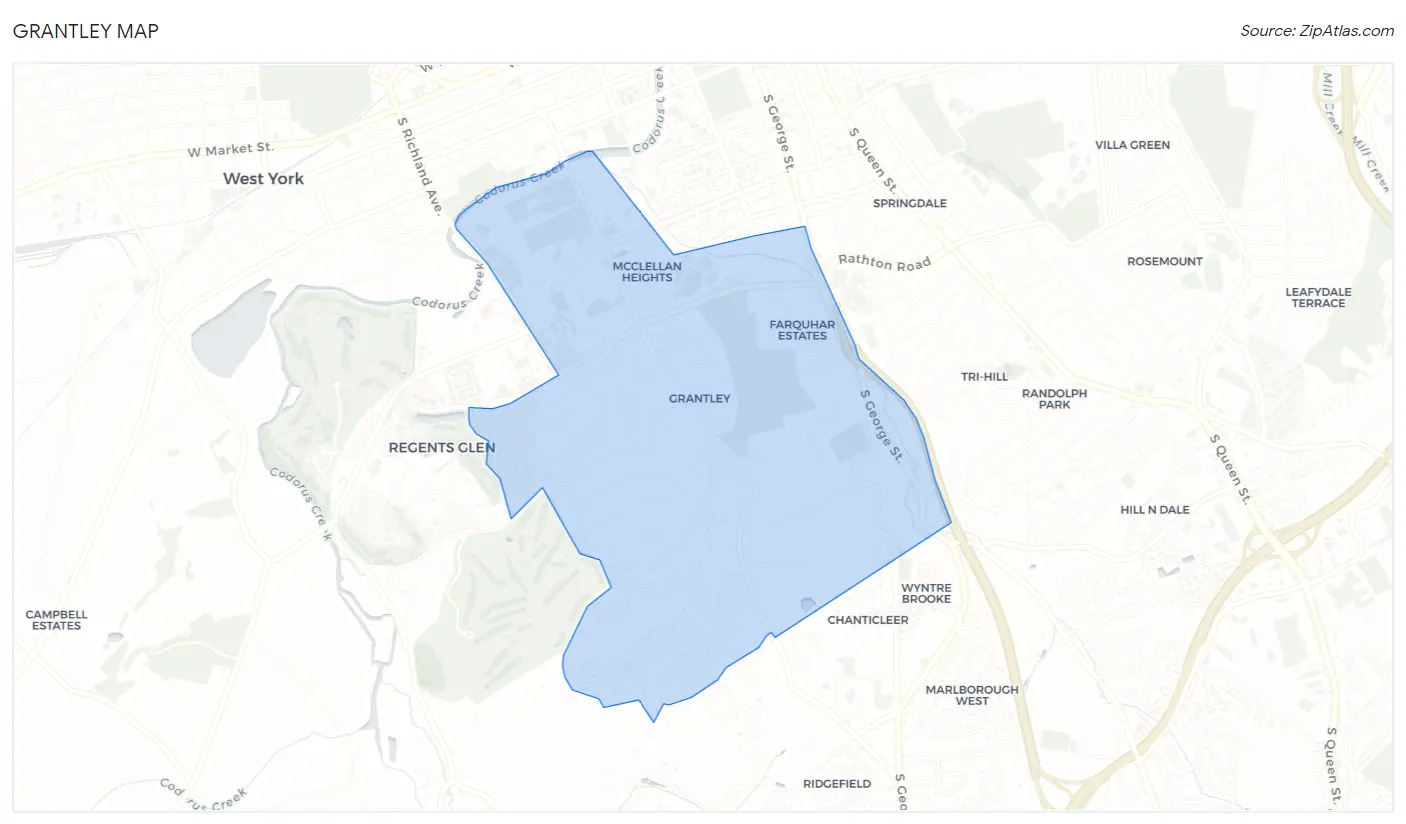
Grantley Map
Grantley Overview
4,665
TOTAL POPULATION
2,328
MALE POPULATION
2,337
FEMALE POPULATION
99.61
MALES / 100 FEMALES
100.39
FEMALES / 100 MALES
21.5
MEDIAN AGE
3.1
AVG FAMILY SIZE
2.7
AVG HOUSEHOLD SIZE
$60,263
PER CAPITA INCOME
$161,250
AVG FAMILY INCOME
$144,740
AVG HOUSEHOLD INCOME
48.0%
WAGE / INCOME GAP [ % ]
52.0¢/ $1
WAGE / INCOME GAP [ $ ]
0.55
INEQUALITY / GINI INDEX
2,391
LABOR FORCE [ PEOPLE ]
60.1%
PERCENT IN LABOR FORCE
5.4%
UNEMPLOYMENT RATE
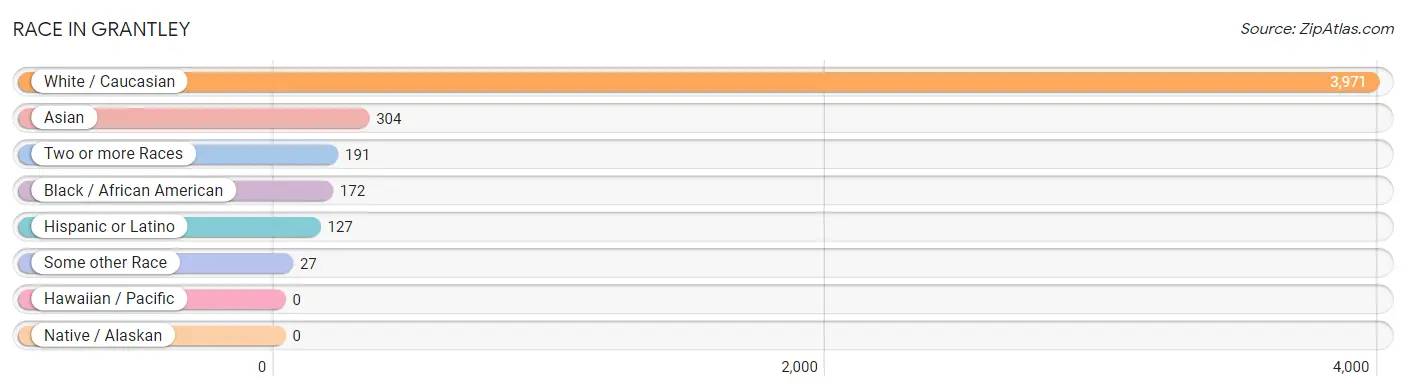
Race in Grantley
The most populous races in Grantley are White / Caucasian (3,971 | 85.1%), Asian (304 | 6.5%), and Two or more Races (191 | 4.1%).
| Race | # Population | % Population |
| Asian | 304 | 6.5% |
| Black / African American | 172 | 3.7% |
| Hawaiian / Pacific | 0 | 0.0% |
| Hispanic or Latino | 127 | 2.7% |
| Native / Alaskan | 0 | 0.0% |
| White / Caucasian | 3,971 | 85.1% |
| Two or more Races | 191 | 4.1% |
| Some other Race | 27 | 0.6% |
| Total | 4,665 | 100.0% |
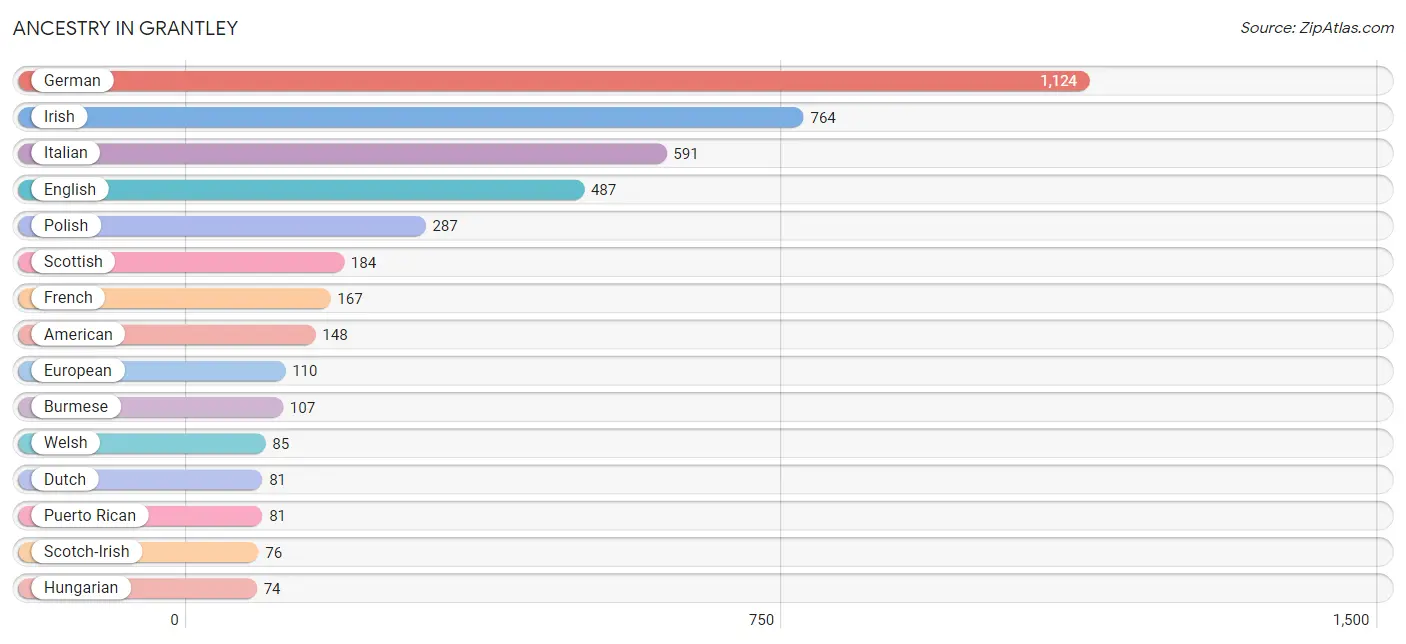
Ancestry in Grantley
The most populous ancestries reported in Grantley are German (1,124 | 24.1%), Irish (764 | 16.4%), Italian (591 | 12.7%), English (487 | 10.4%), and Polish (287 | 6.1%), together accounting for 69.7% of all Grantley residents.
| Ancestry | # Population | % Population |
| African | 26 | 0.6% |
| American | 148 | 3.2% |
| Arab | 69 | 1.5% |
| Austrian | 4 | 0.1% |
| Bhutanese | 33 | 0.7% |
| Blackfeet | 27 | 0.6% |
| Brazilian | 35 | 0.7% |
| British | 17 | 0.4% |
| Burmese | 107 | 2.3% |
| Central American | 8 | 0.2% |
| Cherokee | 2 | 0.0% |
| Colombian | 3 | 0.1% |
| Croatian | 5 | 0.1% |
| Czech | 7 | 0.2% |
| Czechoslovakian | 9 | 0.2% |
| Danish | 28 | 0.6% |
| Dominican | 7 | 0.2% |
| Dutch | 81 | 1.7% |
| Eastern European | 9 | 0.2% |
| English | 487 | 10.4% |
| Estonian | 18 | 0.4% |
| European | 110 | 2.4% |
| Finnish | 5 | 0.1% |
| French | 167 | 3.6% |
| French Canadian | 41 | 0.9% |
| German | 1,124 | 24.1% |
| Greek | 32 | 0.7% |
| Hungarian | 74 | 1.6% |
| Irish | 764 | 16.4% |
| Israeli | 22 | 0.5% |
| Italian | 591 | 12.7% |
| Korean | 6 | 0.1% |
| Lebanese | 66 | 1.4% |
| Lithuanian | 35 | 0.7% |
| Mexican | 18 | 0.4% |
| Native Hawaiian | 13 | 0.3% |
| Norwegian | 52 | 1.1% |
| Pennsylvania German | 7 | 0.2% |
| Polish | 287 | 6.1% |
| Puerto Rican | 81 | 1.7% |
| Romanian | 4 | 0.1% |
| Russian | 16 | 0.3% |
| Salvadoran | 8 | 0.2% |
| Scandinavian | 18 | 0.4% |
| Scotch-Irish | 76 | 1.6% |
| Scottish | 184 | 3.9% |
| Serbian | 5 | 0.1% |
| Sioux | 2 | 0.0% |
| Slavic | 14 | 0.3% |
| Slovak | 35 | 0.7% |
| South American | 3 | 0.1% |
| Spaniard | 4 | 0.1% |
| Sri Lankan | 4 | 0.1% |
| Subsaharan African | 30 | 0.6% |
| Swedish | 20 | 0.4% |
| Swiss | 70 | 1.5% |
| Syrian | 3 | 0.1% |
| Thai | 36 | 0.8% |
| Ukrainian | 23 | 0.5% |
| Welsh | 85 | 1.8% | View All 60 Rows |
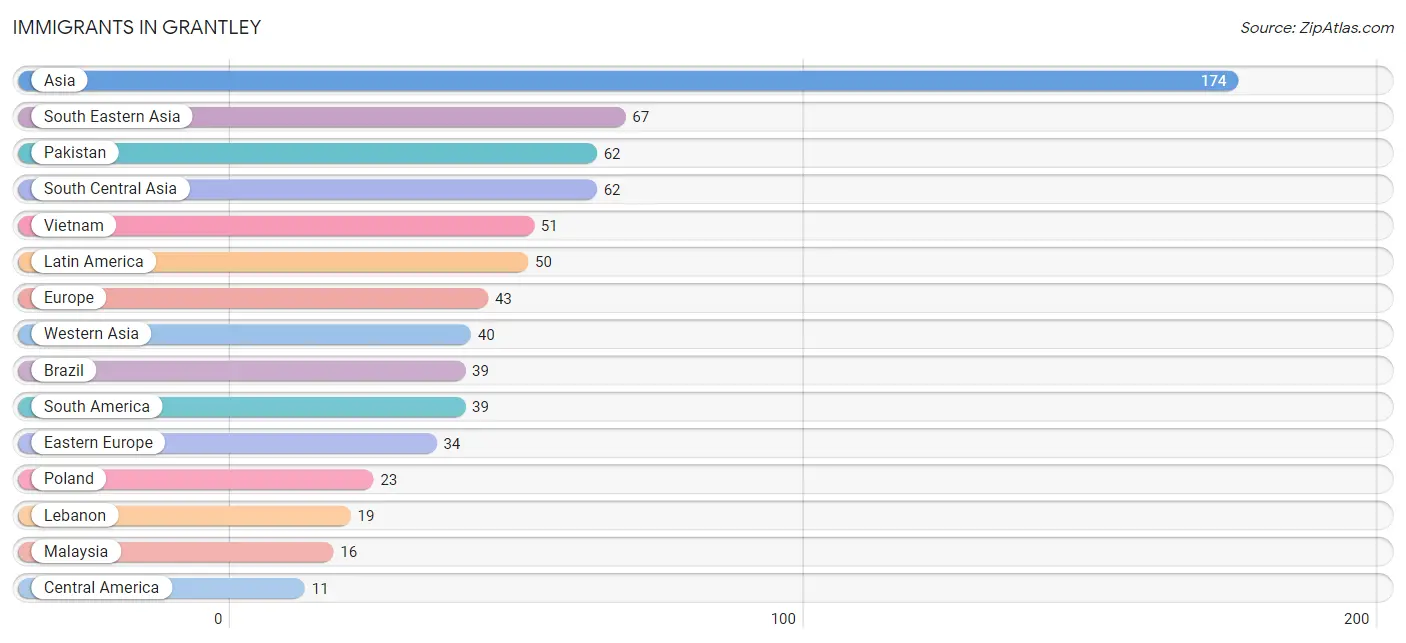
Immigrants in Grantley
The most numerous immigrant groups reported in Grantley came from Asia (174 | 3.7%), South Eastern Asia (67 | 1.4%), Pakistan (62 | 1.3%), South Central Asia (62 | 1.3%), and Vietnam (51 | 1.1%), together accounting for 8.9% of all Grantley residents.
| Immigration Origin | # Population | % Population |
| Asia | 174 | 3.7% |
| Bosnia and Herzegovina | 5 | 0.1% |
| Brazil | 39 | 0.8% |
| Central America | 11 | 0.2% |
| Eastern Asia | 5 | 0.1% |
| Eastern Europe | 34 | 0.7% |
| Europe | 43 | 0.9% |
| Germany | 9 | 0.2% |
| Korea | 5 | 0.1% |
| Latin America | 50 | 1.1% |
| Lebanon | 19 | 0.4% |
| Malaysia | 16 | 0.3% |
| Mexico | 11 | 0.2% |
| Pakistan | 62 | 1.3% |
| Poland | 23 | 0.5% |
| Russia | 6 | 0.1% |
| South America | 39 | 0.8% |
| South Central Asia | 62 | 1.3% |
| South Eastern Asia | 67 | 1.4% |
| Vietnam | 51 | 1.1% |
| Western Asia | 40 | 0.9% |
| Western Europe | 9 | 0.2% | View All 22 Rows |
Sex and Age in Grantley
Sex and Age in Grantley
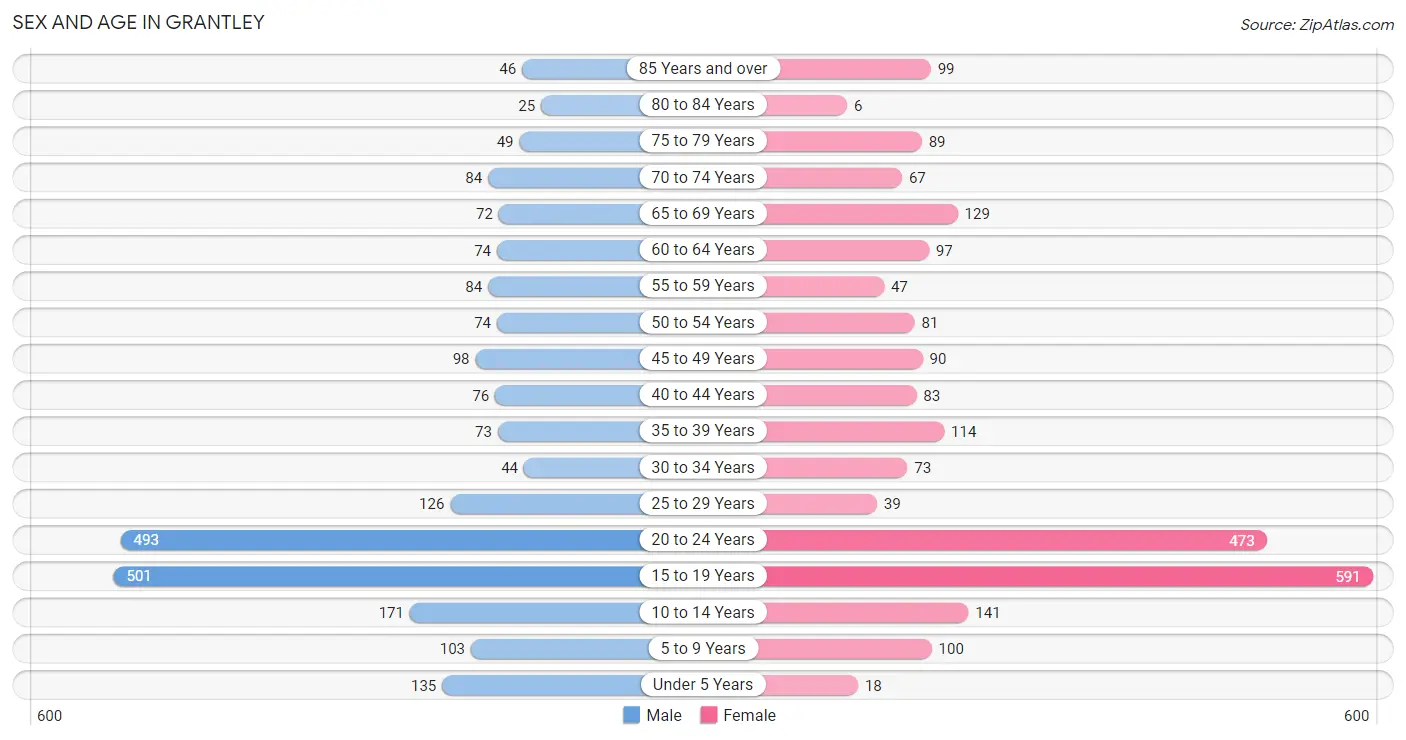
The most populous age groups in Grantley are 15 to 19 Years (501 | 21.5%) for men and 15 to 19 Years (591 | 25.3%) for women.
| Age Bracket | Male | Female |
| Under 5 Years | 135 (5.8%) | 18 (0.8%) |
| 5 to 9 Years | 103 (4.4%) | 100 (4.3%) |
| 10 to 14 Years | 171 (7.3%) | 141 (6.0%) |
| 15 to 19 Years | 501 (21.5%) | 591 (25.3%) |
| 20 to 24 Years | 493 (21.2%) | 473 (20.2%) |
| 25 to 29 Years | 126 (5.4%) | 39 (1.7%) |
| 30 to 34 Years | 44 (1.9%) | 73 (3.1%) |
| 35 to 39 Years | 73 (3.1%) | 114 (4.9%) |
| 40 to 44 Years | 76 (3.3%) | 83 (3.5%) |
| 45 to 49 Years | 98 (4.2%) | 90 (3.8%) |
| 50 to 54 Years | 74 (3.2%) | 81 (3.5%) |
| 55 to 59 Years | 84 (3.6%) | 47 (2.0%) |
| 60 to 64 Years | 74 (3.2%) | 97 (4.2%) |
| 65 to 69 Years | 72 (3.1%) | 129 (5.5%) |
| 70 to 74 Years | 84 (3.6%) | 67 (2.9%) |
| 75 to 79 Years | 49 (2.1%) | 89 (3.8%) |
| 80 to 84 Years | 25 (1.1%) | 6 (0.3%) |
| 85 Years and over | 46 (2.0%) | 99 (4.2%) |
| Total | 2,328 (100.0%) | 2,337 (100.0%) |
Families and Households in Grantley
Median Family Size in Grantley
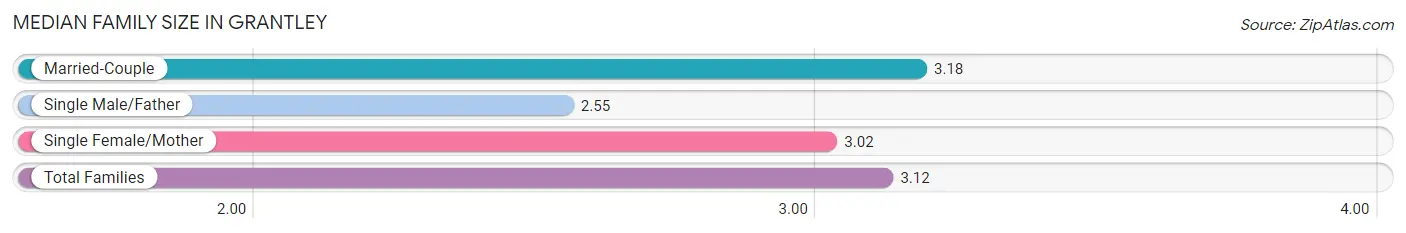
The median family size in Grantley is 3.12 persons per family, with married-couple families (662 | 86.9%) accounting for the largest median family size of 3.18 persons per family. On the other hand, single male/father families (56 | 7.3%) represent the smallest median family size with 2.55 persons per family.
| Family Type | # Families | Family Size |
| Married-Couple | 662 (86.9%) | 3.18 |
| Single Male/Father | 56 (7.3%) | 2.55 |
| Single Female/Mother | 44 (5.8%) | 3.02 |
| Total Families | 762 (100.0%) | 3.12 |
Median Household Size in Grantley
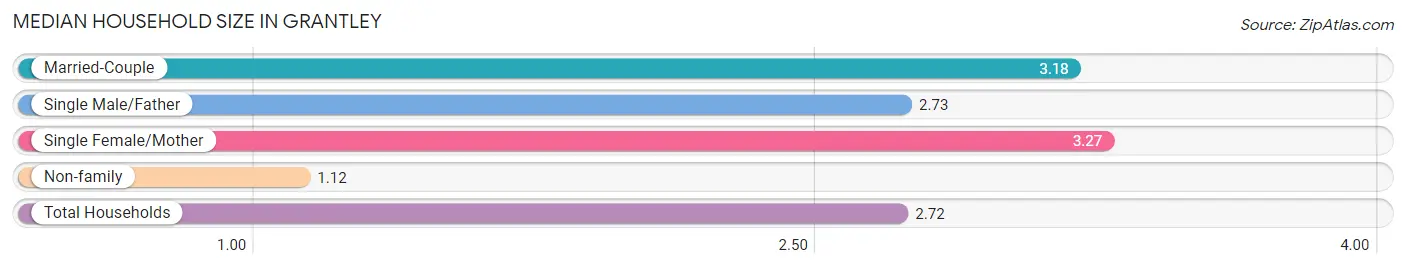
The median household size in Grantley is 2.72 persons per household, with single female/mother households (44 | 4.6%) accounting for the largest median household size of 3.27 persons per household. non-family households (203 | 21.0%) represent the smallest median household size with 1.12 persons per household.
| Household Type | # Households | Household Size |
| Married-Couple | 662 (68.6%) | 3.18 |
| Single Male/Father | 56 (5.8%) | 2.73 |
| Single Female/Mother | 44 (4.6%) | 3.27 |
| Non-family | 203 (21.0%) | 1.12 |
| Total Households | 965 (100.0%) | 2.72 |
Household Size by Marriage Status in Grantley
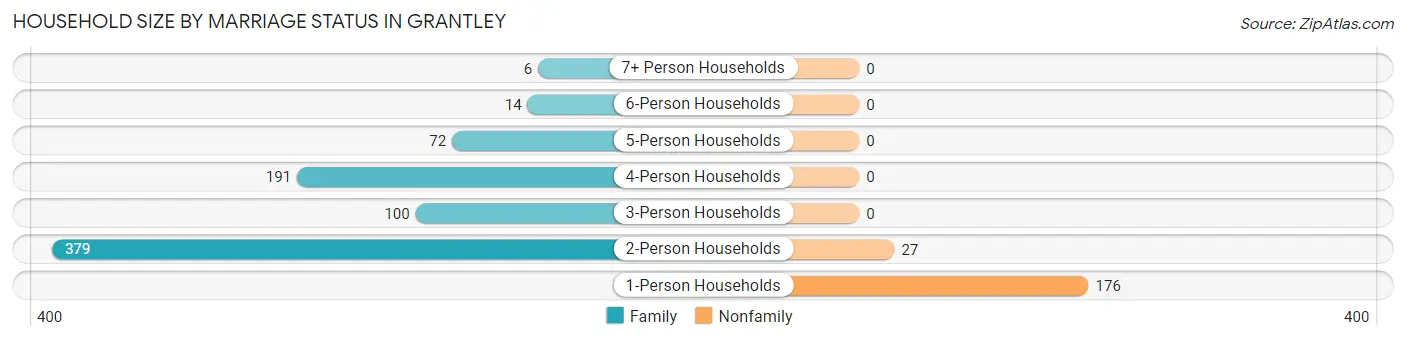
Out of a total of 965 households in Grantley, 762 (79.0%) are family households, while 203 (21.0%) are nonfamily households. The most numerous type of family households are 2-person households, comprising 379, and the most common type of nonfamily households are 1-person households, comprising 176.
| Household Size | Family Households | Nonfamily Households |
| 1-Person Households | - | 176 (18.2%) |
| 2-Person Households | 379 (39.3%) | 27 (2.8%) |
| 3-Person Households | 100 (10.4%) | 0 (0.0%) |
| 4-Person Households | 191 (19.8%) | 0 (0.0%) |
| 5-Person Households | 72 (7.5%) | 0 (0.0%) |
| 6-Person Households | 14 (1.5%) | 0 (0.0%) |
| 7+ Person Households | 6 (0.6%) | 0 (0.0%) |
| Total | 762 (79.0%) | 203 (21.0%) |
Female Fertility in Grantley
Fertility by Age in Grantley
| Age Bracket | Women with Births | Births / 1,000 Women |
| 15 to 19 years | 0 (0.0%) | 0.0 |
| 20 to 34 years | 0 (0.0%) | 0.0 |
| 35 to 50 years | 0 (0.0%) | 0.0 |
| Total | 0 (0.0%) | 0.0 |
Fertility by Age by Marriage Status in Grantley
| Age Bracket | Married | Unmarried |
| 15 to 19 years | 0 (0.0%) | 0 (0.0%) |
| 20 to 34 years | 0 (0.0%) | 0 (0.0%) |
| 35 to 50 years | 0 (0.0%) | 0 (0.0%) |
| Total | 0 (0.0%) | 0 (0.0%) |
Fertility by Education in Grantley
| Educational Attainment | Women with Births | Births / 1,000 Women |
| Less than High School | 0 (0.0%) | 0.0 |
| High School Diploma | 0 (0.0%) | 0.0 |
| College or Associate's Degree | 0 (0.0%) | 0.0 |
| Bachelor's Degree | 0 (0.0%) | 0.0 |
| Graduate Degree | 0 (0.0%) | 0.0 |
| Total | 0 (0.0%) | 0.0 |
Fertility by Education by Marriage Status in Grantley
| Educational Attainment | Married | Unmarried |
| Less than High School | 0 (0.0%) | 0 (0.0%) |
| High School Diploma | 0 (0.0%) | 0 (0.0%) |
| College or Associate's Degree | 0 (0.0%) | 0 (0.0%) |
| Bachelor's Degree | 0 (0.0%) | 0 (0.0%) |
| Graduate Degree | 0 (0.0%) | 0 (0.0%) |
| Total | 0 (0.0%) | 0 (0.0%) |
Income in Grantley
Income Overview in Grantley
Per Capita Income in Grantley is $60,263, while median incomes of families and households are $161,250 and $144,740 respectively.
| Characteristic | Number | Measure |
| Per Capita Income | 4,665 | $60,263 |
| Median Family Income | 762 | $161,250 |
| Mean Family Income | 762 | $266,637 |
| Median Household Income | 965 | $144,740 |
| Mean Household Income | 965 | $259,764 |
| Income Deficit | 762 | $0 |
| Wage / Income Gap (%) | 4,665 | 48.03% |
| Wage / Income Gap ($) | 4,665 | 51.97¢ per $1 |
| Gini / Inequality Index | 4,665 | 0.55 |
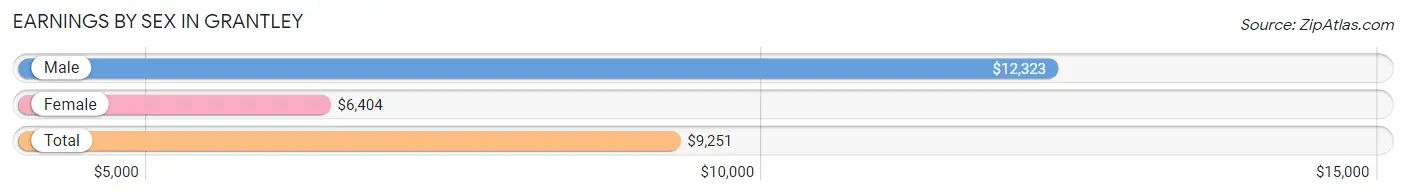
Earnings by Sex in Grantley
Average Earnings in Grantley are $9,251, $12,323 for men and $6,404 for women, a difference of 48.0%.
| Sex | Number | Average Earnings |
| Male | 1,532 (51.5%) | $12,323 |
| Female | 1,442 (48.5%) | $6,404 |
| Total | 2,974 (100.0%) | $9,251 |
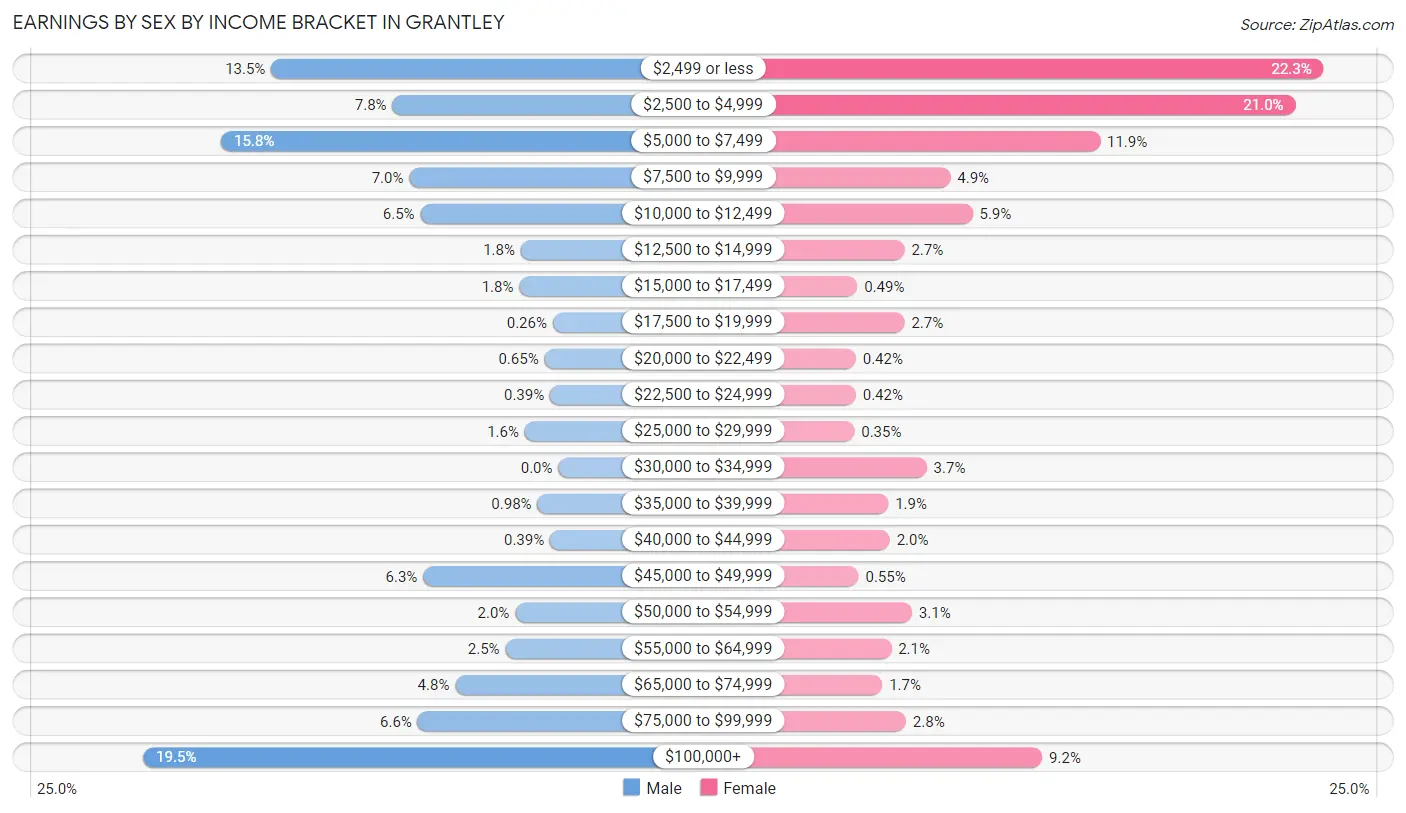
Earnings by Sex by Income Bracket in Grantley
The most common earnings brackets in Grantley are $100,000+ for men (298 | 19.5%) and $2,499 or less for women (322 | 22.3%).
| Income | Male | Female |
| $2,499 or less | 206 (13.5%) | 322 (22.3%) |
| $2,500 to $4,999 | 119 (7.8%) | 303 (21.0%) |
| $5,000 to $7,499 | 242 (15.8%) | 171 (11.9%) |
| $7,500 to $9,999 | 107 (7.0%) | 70 (4.9%) |
| $10,000 to $12,499 | 99 (6.5%) | 85 (5.9%) |
| $12,500 to $14,999 | 27 (1.8%) | 39 (2.7%) |
| $15,000 to $17,499 | 28 (1.8%) | 7 (0.5%) |
| $17,500 to $19,999 | 4 (0.3%) | 39 (2.7%) |
| $20,000 to $22,499 | 10 (0.6%) | 6 (0.4%) |
| $22,500 to $24,999 | 6 (0.4%) | 6 (0.4%) |
| $25,000 to $29,999 | 24 (1.6%) | 5 (0.4%) |
| $30,000 to $34,999 | 0 (0.0%) | 54 (3.7%) |
| $35,000 to $39,999 | 15 (1.0%) | 28 (1.9%) |
| $40,000 to $44,999 | 6 (0.4%) | 29 (2.0%) |
| $45,000 to $49,999 | 97 (6.3%) | 8 (0.5%) |
| $50,000 to $54,999 | 31 (2.0%) | 44 (3.0%) |
| $55,000 to $64,999 | 38 (2.5%) | 30 (2.1%) |
| $65,000 to $74,999 | 74 (4.8%) | 24 (1.7%) |
| $75,000 to $99,999 | 101 (6.6%) | 40 (2.8%) |
| $100,000+ | 298 (19.5%) | 132 (9.1%) |
| Total | 1,532 (100.0%) | 1,442 (100.0%) |
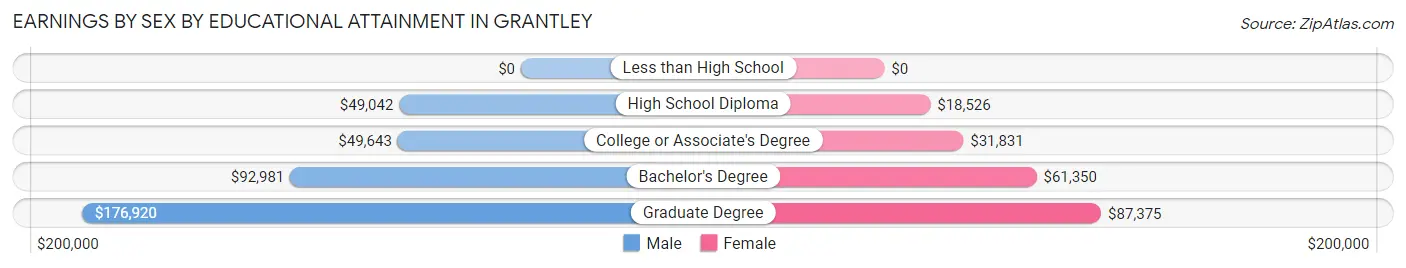
Earnings by Sex by Educational Attainment in Grantley
Average earnings in Grantley are $82,422 for men and $50,464 for women, a difference of 38.8%. Men with an educational attainment of graduate degree enjoy the highest average annual earnings of $176,920, while those with high school diploma education earn the least with $49,042. Women with an educational attainment of graduate degree earn the most with the average annual earnings of $87,375, while those with high school diploma education have the smallest earnings of $18,526.
| Educational Attainment | Male Income | Female Income |
| Less than High School | - | - |
| High School Diploma | $49,042 | $18,526 |
| College or Associate's Degree | $49,643 | $31,831 |
| Bachelor's Degree | $92,981 | $61,350 |
| Graduate Degree | $176,920 | $87,375 |
| Total | $82,422 | $50,464 |
Family Income in Grantley
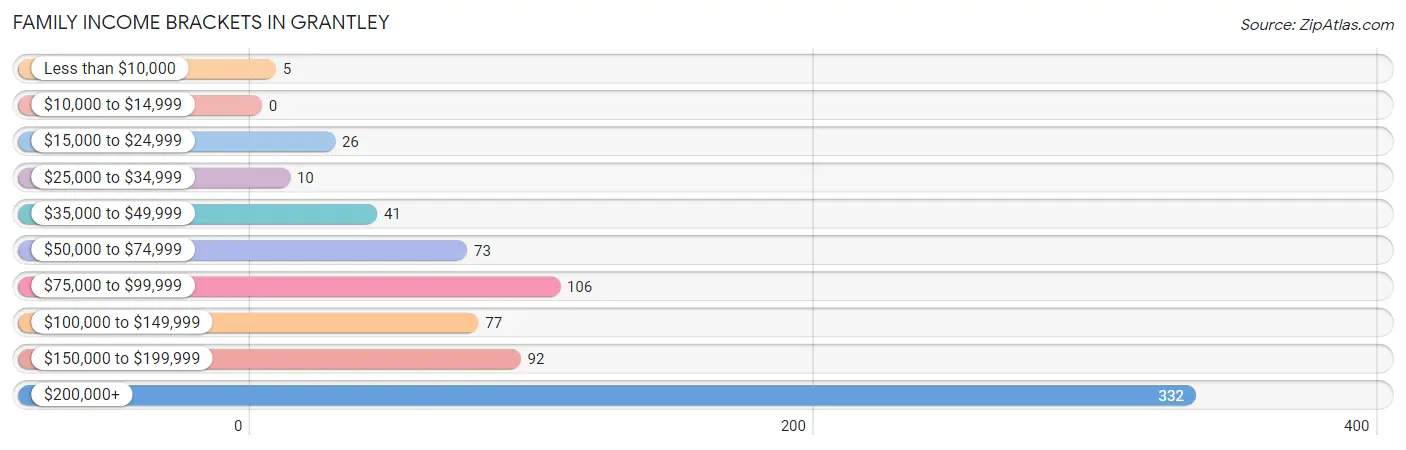
Family Income Brackets in Grantley
According to the Grantley family income data, there are 332 families falling into the $200,000+ income range, which is the most common income bracket and makes up 43.6% of all families.
| Income Bracket | # Families | % Families |
| Less than $10,000 | 5 | 0.7% |
| $10,000 to $14,999 | 0 | 0.0% |
| $15,000 to $24,999 | 26 | 3.4% |
| $25,000 to $34,999 | 10 | 1.3% |
| $35,000 to $49,999 | 41 | 5.4% |
| $50,000 to $74,999 | 73 | 9.6% |
| $75,000 to $99,999 | 106 | 13.9% |
| $100,000 to $149,999 | 77 | 10.1% |
| $150,000 to $199,999 | 92 | 12.1% |
| $200,000+ | 332 | 43.6% |
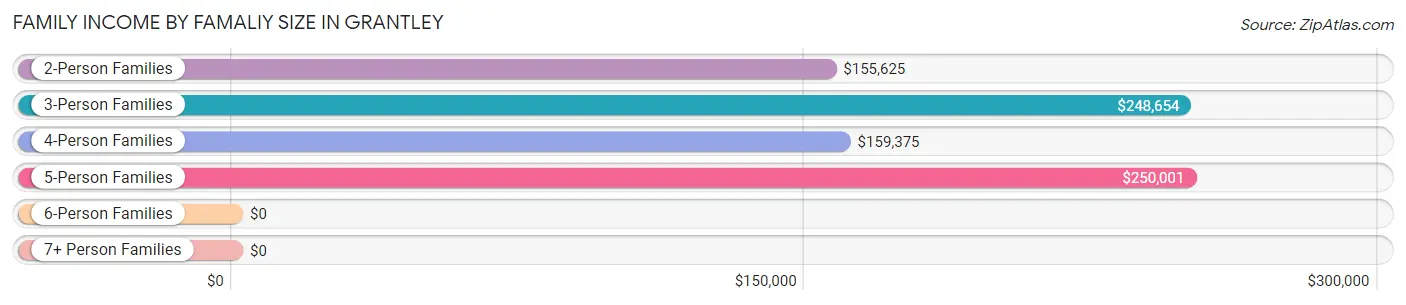
Family Income by Famaliy Size in Grantley
5-person families (62 | 8.1%) account for the highest median family income in Grantley with $250,001 per family, while 3-person families (112 | 14.7%) have the highest median income of $82,885 per family member.
| Income Bracket | # Families | Median Income |
| 2-Person Families | 379 (49.7%) | $155,625 |
| 3-Person Families | 112 (14.7%) | $248,654 |
| 4-Person Families | 189 (24.8%) | $159,375 |
| 5-Person Families | 62 (8.1%) | $250,001 |
| 6-Person Families | 14 (1.8%) | $0 |
| 7+ Person Families | 6 (0.8%) | $0 |
| Total | 762 (100.0%) | $161,250 |
Family Income by Number of Earners in Grantley
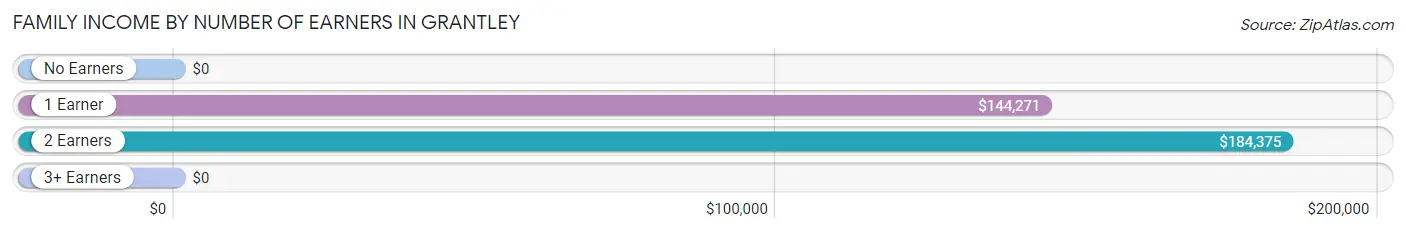
| Number of Earners | # Families | Median Income |
| No Earners | 91 (11.9%) | $0 |
| 1 Earner | 240 (31.5%) | $144,271 |
| 2 Earners | 418 (54.9%) | $184,375 |
| 3+ Earners | 13 (1.7%) | $0 |
| Total | 762 (100.0%) | $161,250 |
Household Income in Grantley
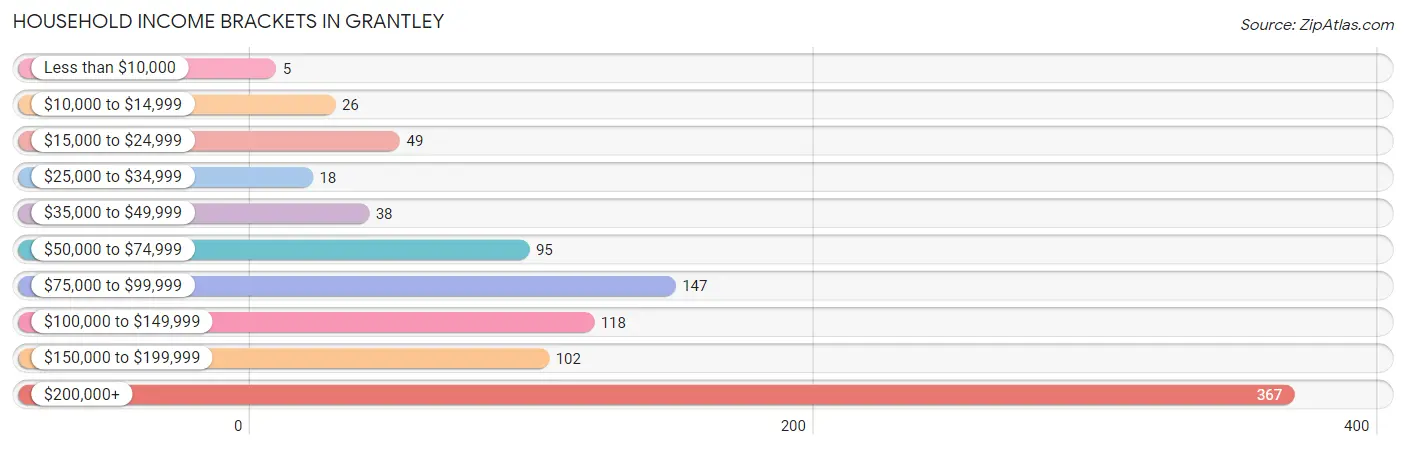
Household Income Brackets in Grantley
With 367 households falling in the category, the $200,000+ income range is the most frequent in Grantley, accounting for 38.0% of all households. In contrast, only 5 households (0.5%) fall into the less than $10,000 income bracket, making it the least populous group.
| Income Bracket | # Households | % Households |
| Less than $10,000 | 5 | 0.5% |
| $10,000 to $14,999 | 26 | 2.7% |
| $15,000 to $24,999 | 49 | 5.1% |
| $25,000 to $34,999 | 18 | 1.9% |
| $35,000 to $49,999 | 38 | 3.9% |
| $50,000 to $74,999 | 95 | 9.8% |
| $75,000 to $99,999 | 147 | 15.2% |
| $100,000 to $149,999 | 118 | 12.2% |
| $150,000 to $199,999 | 102 | 10.6% |
| $200,000+ | 367 | 38.0% |
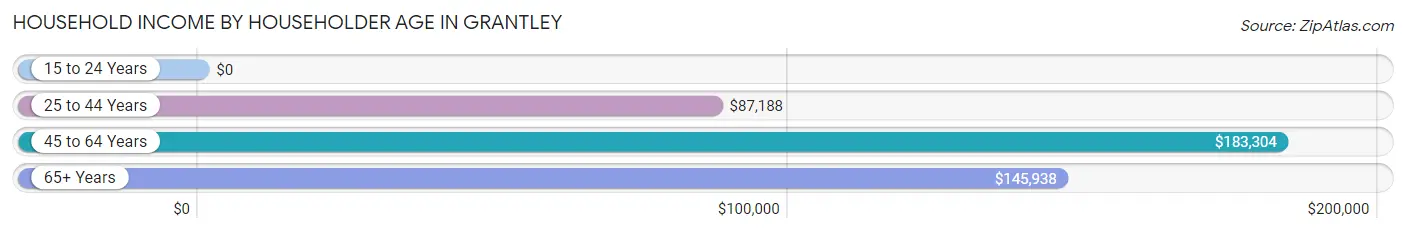
Household Income by Householder Age in Grantley
The median household income in Grantley is $144,740, with the highest median household income of $183,304 found in the 45 to 64 years age bracket for the primary householder. A total of 398 households (41.2%) fall into this category.
| Income Bracket | # Households | Median Income |
| 15 to 24 Years | 0 (0.0%) | $0 |
| 25 to 44 Years | 266 (27.6%) | $87,188 |
| 45 to 64 Years | 398 (41.2%) | $183,304 |
| 65+ Years | 301 (31.2%) | $145,938 |
| Total | 965 (100.0%) | $144,740 |
Poverty in Grantley
Income Below Poverty by Sex and Age in Grantley
With 5.7% poverty level for males and 6.8% for females among the residents of Grantley, under 5 year old males and 75 year old and over females are the most vulnerable to poverty, with 50 males (37.0%) and 26 females (23.4%) in their respective age groups living below the poverty level.
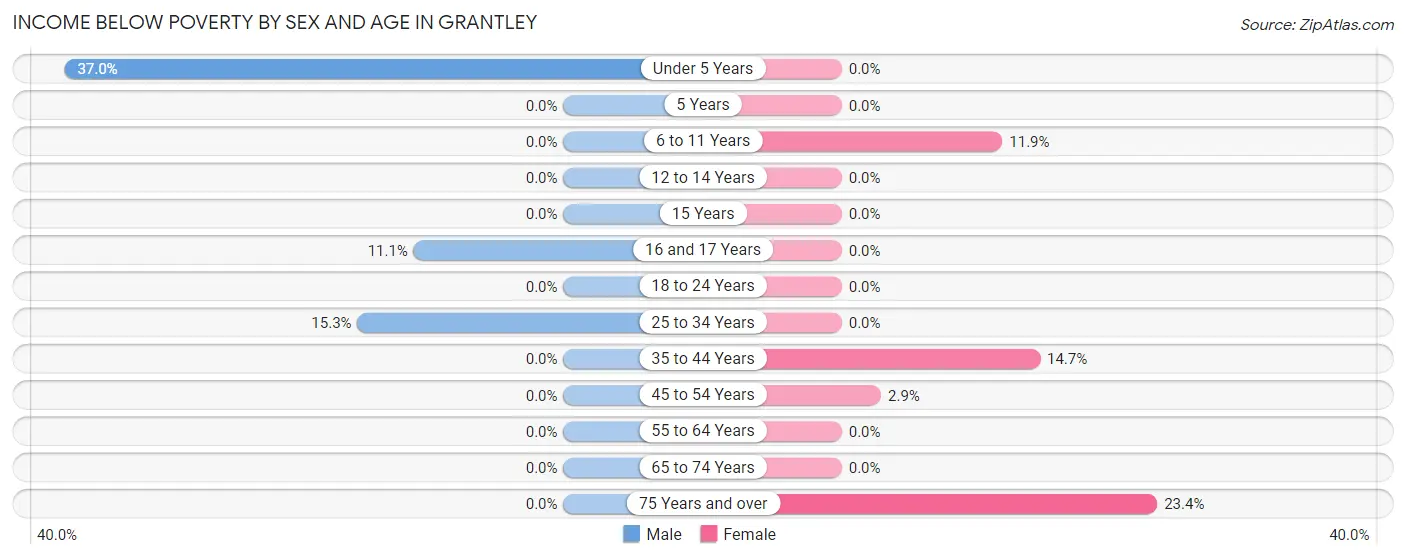
| Age Bracket | Male | Female |
| Under 5 Years | 50 (37.0%) | 0 (0.0%) |
| 5 Years | 0 (0.0%) | 0 (0.0%) |
| 6 to 11 Years | 0 (0.0%) | 23 (11.9%) |
| 12 to 14 Years | 0 (0.0%) | 0 (0.0%) |
| 15 Years | 0 (0.0%) | 0 (0.0%) |
| 16 and 17 Years | 5 (11.1%) | 0 (0.0%) |
| 18 to 24 Years | 0 (0.0%) | 0 (0.0%) |
| 25 to 34 Years | 26 (15.3%) | 0 (0.0%) |
| 35 to 44 Years | 0 (0.0%) | 29 (14.7%) |
| 45 to 54 Years | 0 (0.0%) | 5 (2.9%) |
| 55 to 64 Years | 0 (0.0%) | 0 (0.0%) |
| 65 to 74 Years | 0 (0.0%) | 0 (0.0%) |
| 75 Years and over | 0 (0.0%) | 26 (23.4%) |
| Total | 81 (5.7%) | 83 (6.8%) |
Income Above Poverty by Sex and Age in Grantley
According to the poverty statistics in Grantley, males aged 6 to 11 years and females aged under 5 years are the age groups that are most secure financially, with 100.0% of males and 100.0% of females in these age groups living above the poverty line.
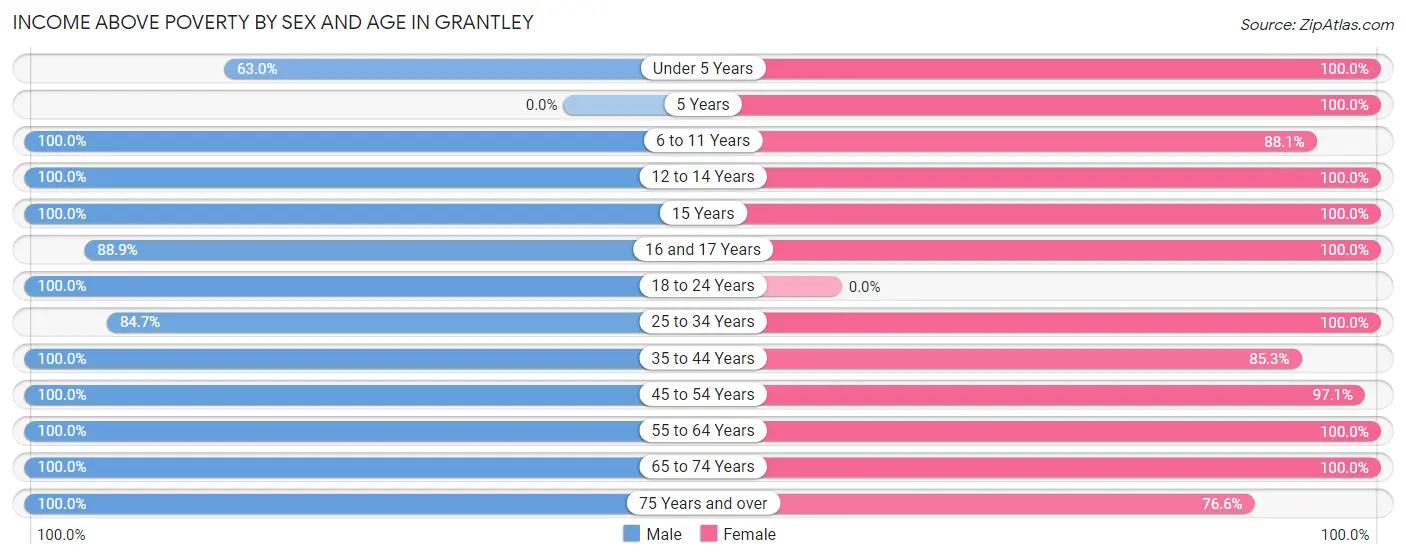
| Age Bracket | Male | Female |
| Under 5 Years | 85 (63.0%) | 18 (100.0%) |
| 5 Years | 0 (0.0%) | 21 (100.0%) |
| 6 to 11 Years | 131 (100.0%) | 170 (88.1%) |
| 12 to 14 Years | 143 (100.0%) | 27 (100.0%) |
| 15 Years | 5 (100.0%) | 14 (100.0%) |
| 16 and 17 Years | 40 (88.9%) | 21 (100.0%) |
| 18 to 24 Years | 72 (100.0%) | 0 (0.0%) |
| 25 to 34 Years | 144 (84.7%) | 112 (100.0%) |
| 35 to 44 Years | 149 (100.0%) | 168 (85.3%) |
| 45 to 54 Years | 172 (100.0%) | 166 (97.1%) |
| 55 to 64 Years | 158 (100.0%) | 144 (100.0%) |
| 65 to 74 Years | 150 (100.0%) | 184 (100.0%) |
| 75 Years and over | 86 (100.0%) | 85 (76.6%) |
| Total | 1,335 (94.3%) | 1,130 (93.2%) |
Income Below Poverty Among Married-Couple Families in Grantley
The poverty statistics for married-couple families in Grantley show that 3.9% or 26 of the total 662 families live below the poverty line. Families with 1 or 2 children have the highest poverty rate of 12.1%, comprising of 26 families. On the other hand, families with no children have the lowest poverty rate of 0.0%, which includes 0 families.
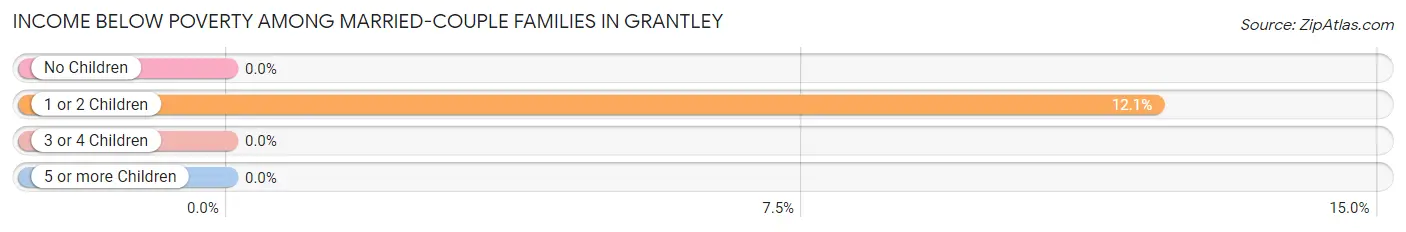
| Children | Above Poverty | Below Poverty |
| No Children | 390 (100.0%) | 0 (0.0%) |
| 1 or 2 Children | 189 (87.9%) | 26 (12.1%) |
| 3 or 4 Children | 57 (100.0%) | 0 (0.0%) |
| 5 or more Children | 0 (0.0%) | 0 (0.0%) |
| Total | 636 (96.1%) | 26 (3.9%) |
Income Below Poverty Among Single-Parent Households in Grantley
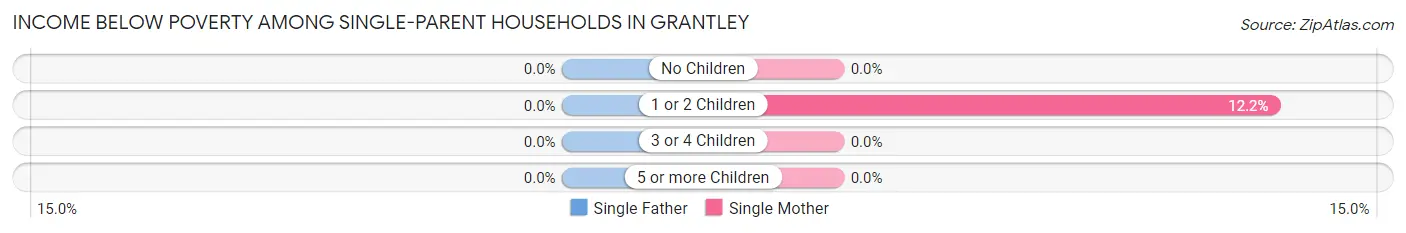
| Children | Single Father | Single Mother |
| No Children | 0 (0.0%) | 0 (0.0%) |
| 1 or 2 Children | 0 (0.0%) | 5 (12.2%) |
| 3 or 4 Children | 0 (0.0%) | 0 (0.0%) |
| 5 or more Children | 0 (0.0%) | 0 (0.0%) |
| Total | 0 (0.0%) | 5 (11.4%) |
Income Below Poverty Among Married-Couple vs Single-Parent Households in Grantley
The poverty data for Grantley shows that 26 of the married-couple family households (3.9%) and 5 of the single-parent households (5.0%) are living below the poverty level. Within the married-couple family households, those with 1 or 2 children have the highest poverty rate, with 26 households (12.1%) falling below the poverty line. Among the single-parent households, those with 1 or 2 children have the highest poverty rate, with 5 household (7.9%) living below poverty.
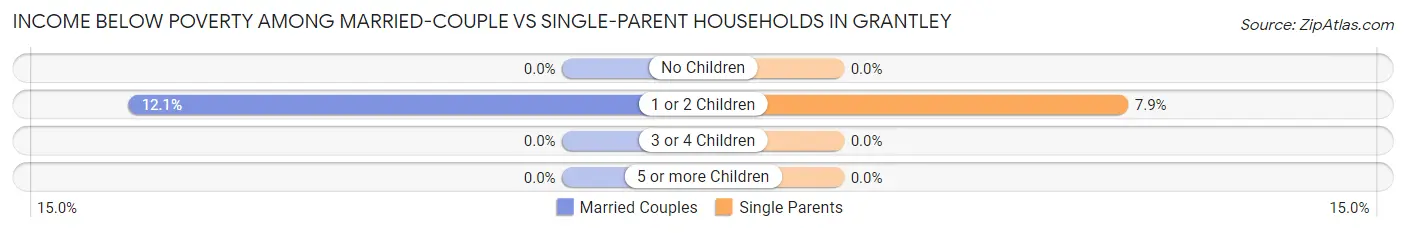
| Children | Married-Couple Families | Single-Parent Households |
| No Children | 0 (0.0%) | 0 (0.0%) |
| 1 or 2 Children | 26 (12.1%) | 5 (7.9%) |
| 3 or 4 Children | 0 (0.0%) | 0 (0.0%) |
| 5 or more Children | 0 (0.0%) | 0 (0.0%) |
| Total | 26 (3.9%) | 5 (5.0%) |
Employment Characteristics in Grantley
Employment by Class of Employer in Grantley
Among the 1,907 employed individuals in Grantley, private company employees (1,384 | 72.6%), not-for-profit organizations (192 | 10.1%), and self-employed (not incorporated) (140 | 7.3%) make up the most common classes of employment.
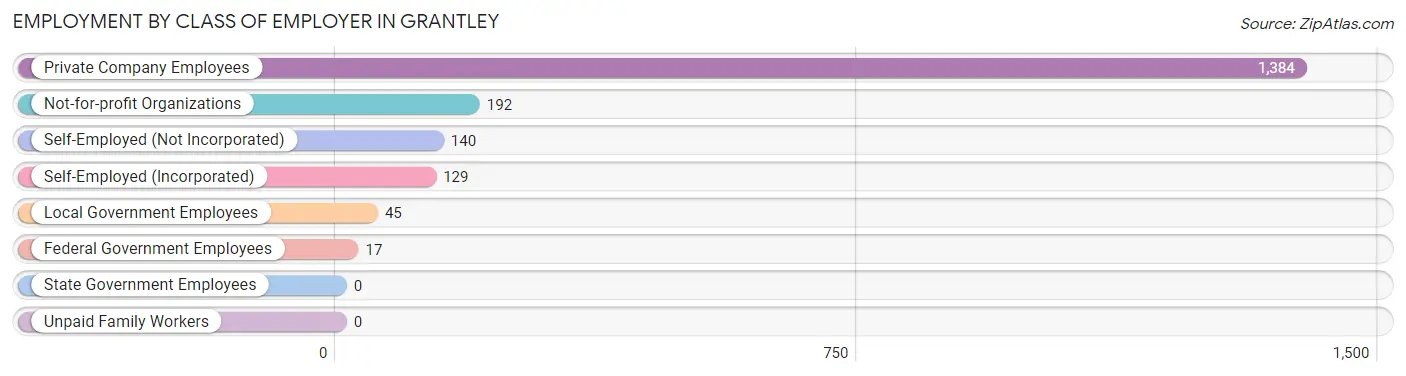
| Employer Class | # Employees | % Employees |
| Private Company Employees | 1,384 | 72.6% |
| Self-Employed (Incorporated) | 129 | 6.8% |
| Self-Employed (Not Incorporated) | 140 | 7.3% |
| Not-for-profit Organizations | 192 | 10.1% |
| Local Government Employees | 45 | 2.4% |
| State Government Employees | 0 | 0.0% |
| Federal Government Employees | 17 | 0.9% |
| Unpaid Family Workers | 0 | 0.0% |
| Total | 1,907 | 100.0% |
Employment Status by Age in Grantley
According to the labor force statistics for Grantley, out of the total population over 16 years of age (3,978), 60.1% or 2,391 individuals are in the labor force, with 5.4% or 129 of them unemployed. The age group with the highest labor force participation rate is 30 to 34 years, with 100.0% or 117 individuals in the labor force. Within the labor force, the 25 to 29 years age range has the highest percentage of unemployed individuals, with 19.4% or 26 of them being unemployed.
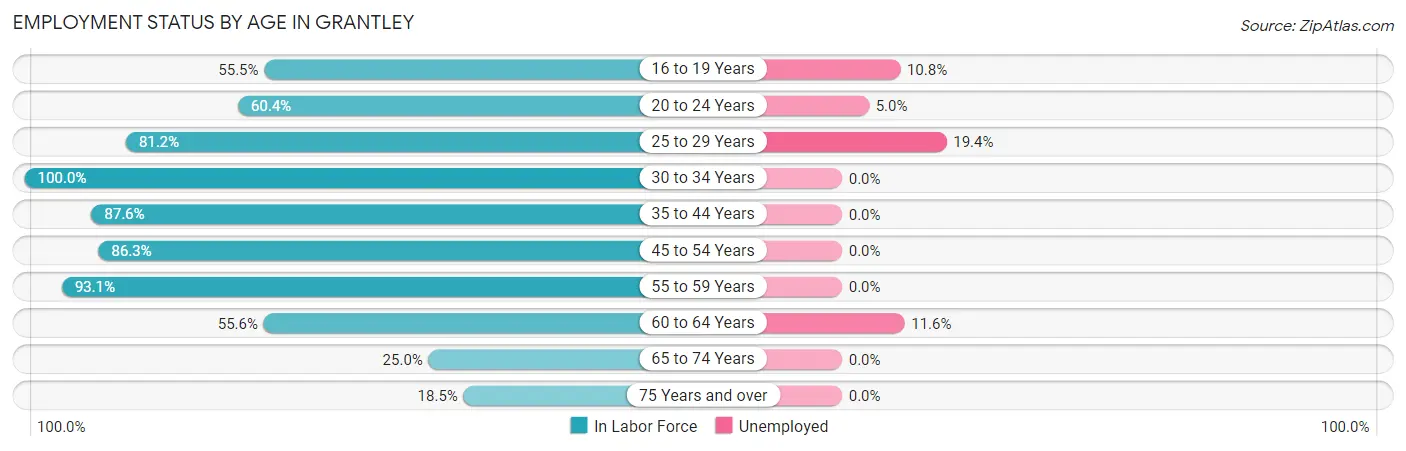
| Age Bracket | In Labor Force | Unemployed |
| 16 to 19 Years | 596 (55.5%) | 64 (10.8%) |
| 20 to 24 Years | 583 (60.4%) | 29 (5.0%) |
| 25 to 29 Years | 134 (81.2%) | 26 (19.4%) |
| 30 to 34 Years | 117 (100.0%) | 0 (0.0%) |
| 35 to 44 Years | 303 (87.6%) | 0 (0.0%) |
| 45 to 54 Years | 296 (86.3%) | 0 (0.0%) |
| 55 to 59 Years | 122 (93.1%) | 0 (0.0%) |
| 60 to 64 Years | 95 (55.6%) | 11 (11.6%) |
| 65 to 74 Years | 88 (25.0%) | 0 (0.0%) |
| 75 Years and over | 58 (18.5%) | 0 (0.0%) |
| Total | 2,391 (60.1%) | 129 (5.4%) |
Employment Status by Educational Attainment in Grantley
According to labor force statistics for Grantley, 83.8% of individuals (1,067) out of the total population between 25 and 64 years of age (1,273) are in the labor force, with 3.5% or 37 of them being unemployed. The group with the highest labor force participation rate are those with the educational attainment of bachelor's degree or higher, with 88.4% or 627 individuals in the labor force. Within the labor force, individuals with college / associate degree education have the highest percentage of unemployment, with 9.8% or 26 of them being unemployed.
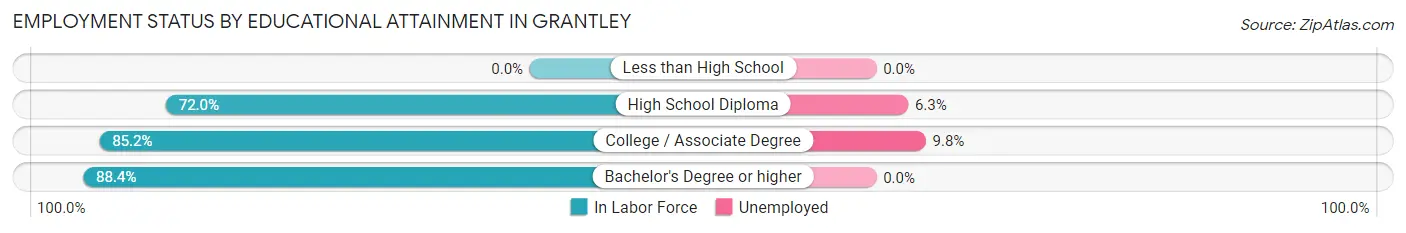
| Educational Attainment | In Labor Force | Unemployed |
| Less than High School | 0 (0.0%) | 0 (0.0%) |
| High School Diploma | 175 (72.0%) | 15 (6.3%) |
| College / Associate Degree | 265 (85.2%) | 30 (9.8%) |
| Bachelor's Degree or higher | 627 (88.4%) | 0 (0.0%) |
| Total | 1,067 (83.8%) | 45 (3.5%) |
Employment Occupations by Sex in Grantley
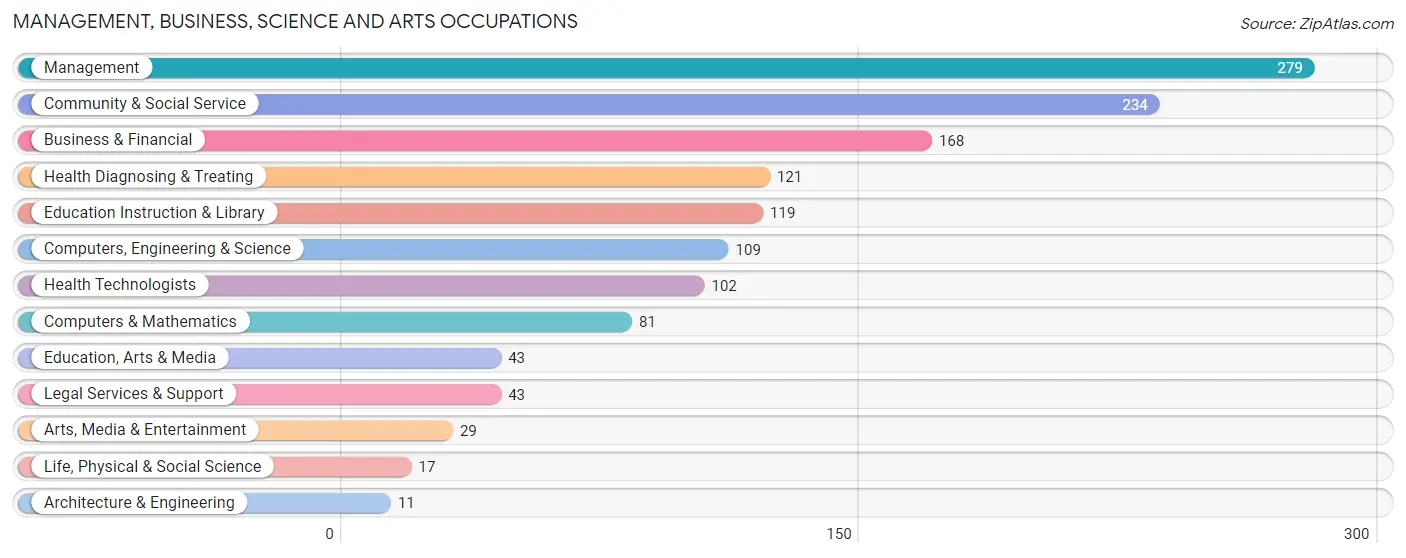
Management, Business, Science and Arts Occupations
The most common Management, Business, Science and Arts occupations in Grantley are Management (279 | 12.3%), Community & Social Service (234 | 10.3%), Business & Financial (168 | 7.4%), Health Diagnosing & Treating (121 | 5.3%), and Education Instruction & Library (119 | 5.3%).
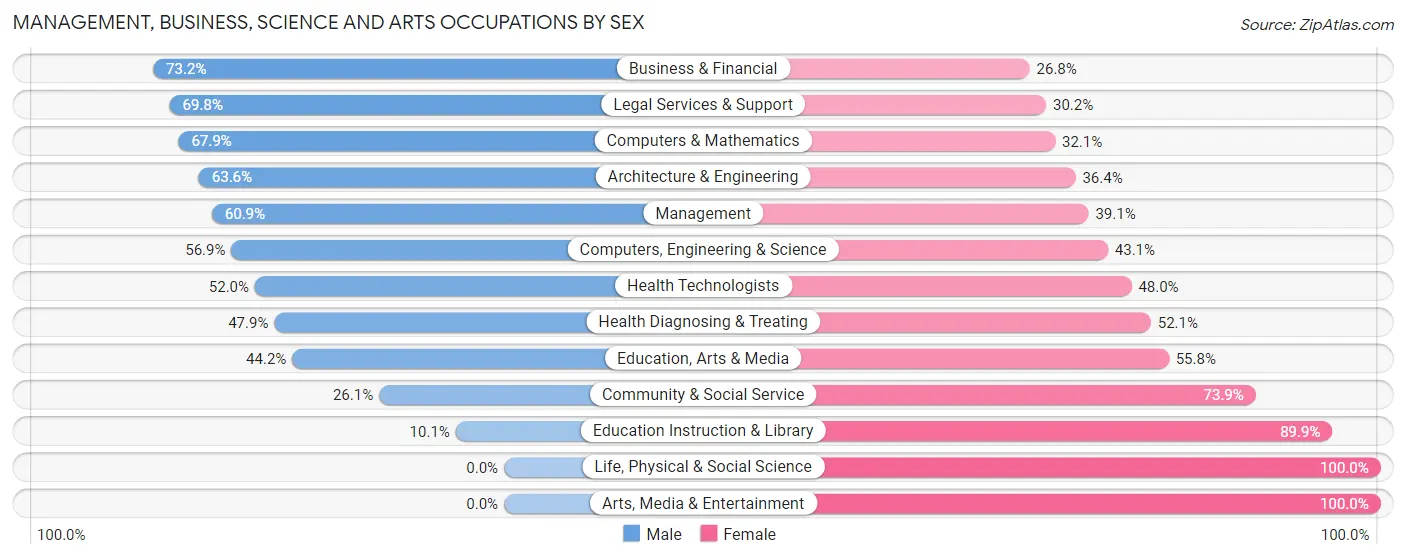
Management, Business, Science and Arts Occupations by Sex
Within the Management, Business, Science and Arts occupations in Grantley, the most male-oriented occupations are Business & Financial (73.2%), Legal Services & Support (69.8%), and Computers & Mathematics (67.9%), while the most female-oriented occupations are Life, Physical & Social Science (100.0%), Arts, Media & Entertainment (100.0%), and Education Instruction & Library (89.9%).
| Occupation | Male | Female |
| Management | 170 (60.9%) | 109 (39.1%) |
| Business & Financial | 123 (73.2%) | 45 (26.8%) |
| Computers, Engineering & Science | 62 (56.9%) | 47 (43.1%) |
| Computers & Mathematics | 55 (67.9%) | 26 (32.1%) |
| Architecture & Engineering | 7 (63.6%) | 4 (36.4%) |
| Life, Physical & Social Science | 0 (0.0%) | 17 (100.0%) |
| Community & Social Service | 61 (26.1%) | 173 (73.9%) |
| Education, Arts & Media | 19 (44.2%) | 24 (55.8%) |
| Legal Services & Support | 30 (69.8%) | 13 (30.2%) |
| Education Instruction & Library | 12 (10.1%) | 107 (89.9%) |
| Arts, Media & Entertainment | 0 (0.0%) | 29 (100.0%) |
| Health Diagnosing & Treating | 58 (47.9%) | 63 (52.1%) |
| Health Technologists | 53 (52.0%) | 49 (48.0%) |
| Total (Category) | 474 (52.0%) | 437 (48.0%) |
| Total (Overall) | 1,129 (49.9%) | 1,132 (50.1%) |
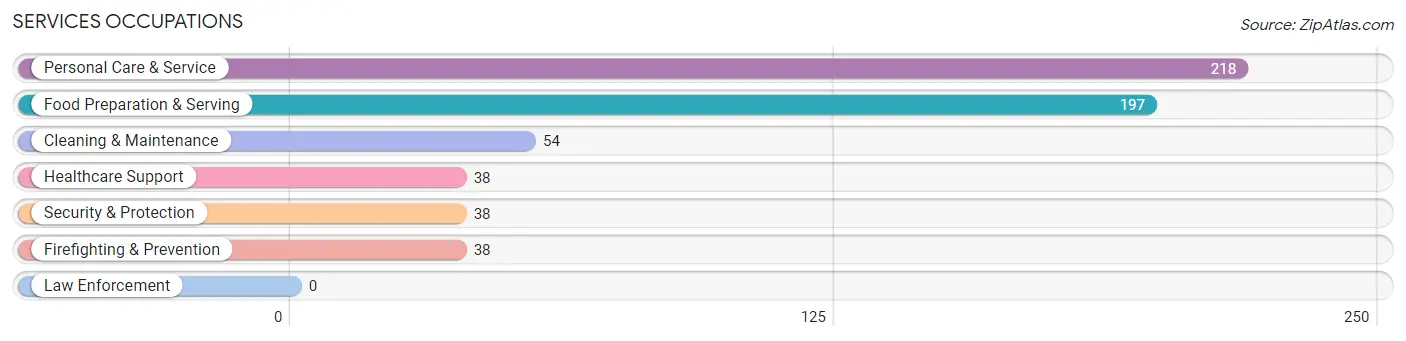
Services Occupations
The most common Services occupations in Grantley are Personal Care & Service (218 | 9.6%), Food Preparation & Serving (197 | 8.7%), Cleaning & Maintenance (54 | 2.4%), Healthcare Support (38 | 1.7%), and Security & Protection (38 | 1.7%).
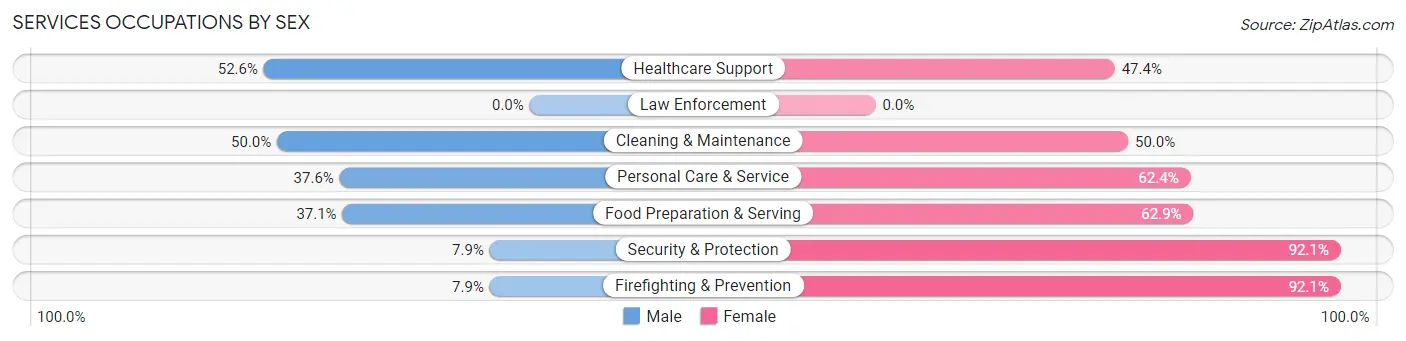
Services Occupations by Sex
Within the Services occupations in Grantley, the most male-oriented occupations are Healthcare Support (52.6%), Cleaning & Maintenance (50.0%), and Personal Care & Service (37.6%), while the most female-oriented occupations are Security & Protection (92.1%), Firefighting & Prevention (92.1%), and Food Preparation & Serving (62.9%).
| Occupation | Male | Female |
| Healthcare Support | 20 (52.6%) | 18 (47.4%) |
| Security & Protection | 3 (7.9%) | 35 (92.1%) |
| Firefighting & Prevention | 3 (7.9%) | 35 (92.1%) |
| Law Enforcement | 0 (0.0%) | 0 (0.0%) |
| Food Preparation & Serving | 73 (37.1%) | 124 (62.9%) |
| Cleaning & Maintenance | 27 (50.0%) | 27 (50.0%) |
| Personal Care & Service | 82 (37.6%) | 136 (62.4%) |
| Total (Category) | 205 (37.6%) | 340 (62.4%) |
| Total (Overall) | 1,129 (49.9%) | 1,132 (50.1%) |
Sales and Office Occupations
The most common Sales and Office occupations in Grantley are Sales & Related (285 | 12.6%), and Office & Administration (217 | 9.6%).
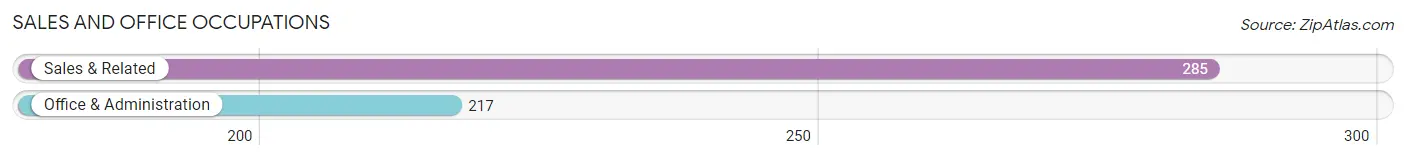
Sales and Office Occupations by Sex
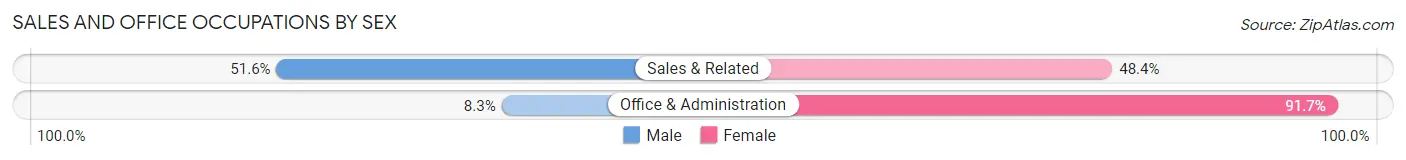
| Occupation | Male | Female |
| Sales & Related | 147 (51.6%) | 138 (48.4%) |
| Office & Administration | 18 (8.3%) | 199 (91.7%) |
| Total (Category) | 165 (32.9%) | 337 (67.1%) |
| Total (Overall) | 1,129 (49.9%) | 1,132 (50.1%) |
Natural Resources, Construction and Maintenance Occupations
The most common Natural Resources, Construction and Maintenance occupations in Grantley are Construction & Extraction (68 | 3.0%), and Farming, Fishing & Forestry (19 | 0.8%).
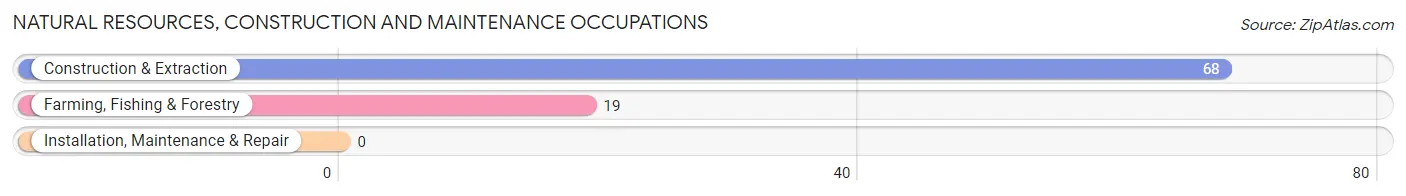
Natural Resources, Construction and Maintenance Occupations by Sex
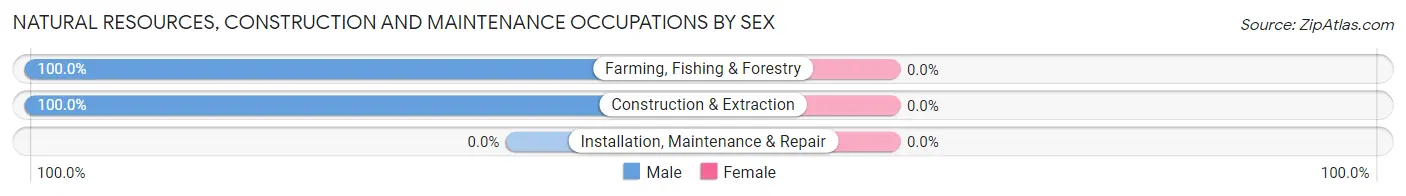
| Occupation | Male | Female |
| Farming, Fishing & Forestry | 19 (100.0%) | 0 (0.0%) |
| Construction & Extraction | 68 (100.0%) | 0 (0.0%) |
| Installation, Maintenance & Repair | 0 (0.0%) | 0 (0.0%) |
| Total (Category) | 87 (100.0%) | 0 (0.0%) |
| Total (Overall) | 1,129 (49.9%) | 1,132 (50.1%) |
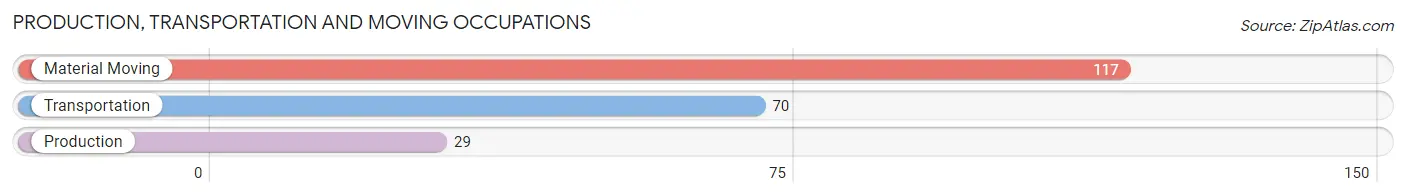
Production, Transportation and Moving Occupations
The most common Production, Transportation and Moving occupations in Grantley are Material Moving (117 | 5.2%), Transportation (70 | 3.1%), and Production (29 | 1.3%).
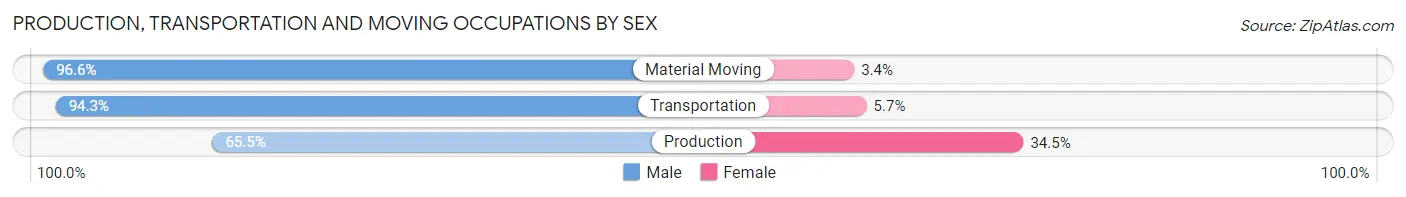
Production, Transportation and Moving Occupations by Sex
| Occupation | Male | Female |
| Production | 19 (65.5%) | 10 (34.5%) |
| Transportation | 66 (94.3%) | 4 (5.7%) |
| Material Moving | 113 (96.6%) | 4 (3.4%) |
| Total (Category) | 198 (91.7%) | 18 (8.3%) |
| Total (Overall) | 1,129 (49.9%) | 1,132 (50.1%) |
Employment Industries by Sex in Grantley
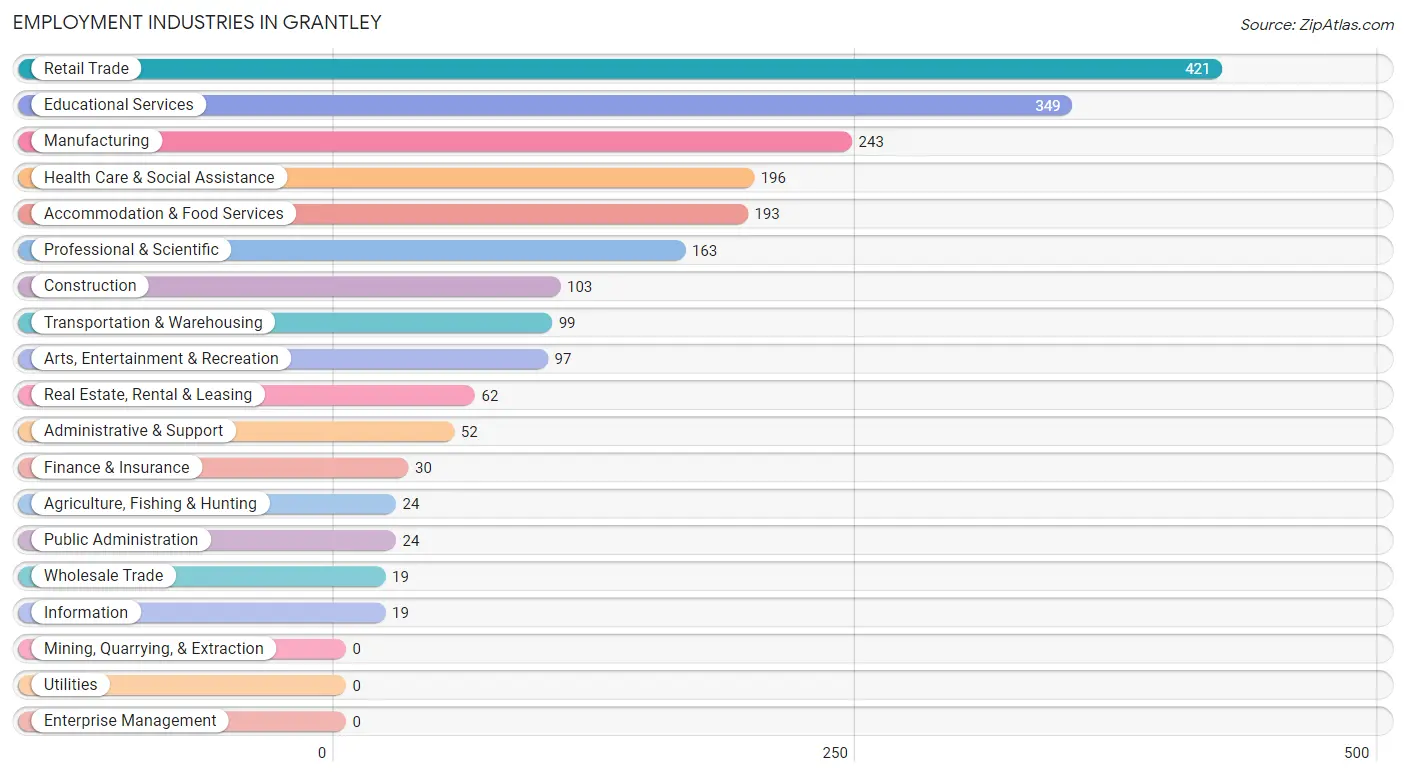
Employment Industries in Grantley
The major employment industries in Grantley include Retail Trade (421 | 18.6%), Educational Services (349 | 15.4%), Manufacturing (243 | 10.7%), Health Care & Social Assistance (196 | 8.7%), and Accommodation & Food Services (193 | 8.5%).
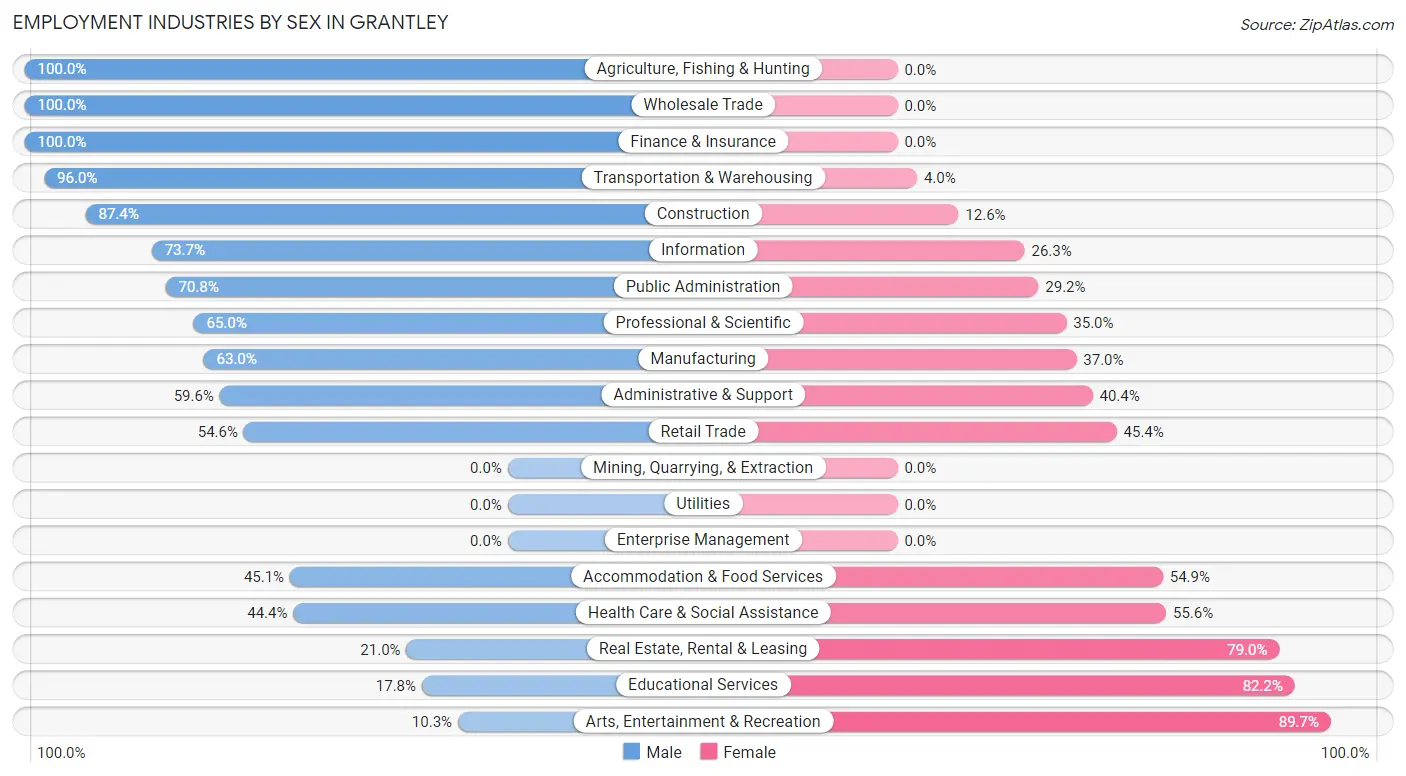
Employment Industries by Sex in Grantley
The Grantley industries that see more men than women are Agriculture, Fishing & Hunting (100.0%), Wholesale Trade (100.0%), and Finance & Insurance (100.0%), whereas the industries that tend to have a higher number of women are Arts, Entertainment & Recreation (89.7%), Educational Services (82.2%), and Real Estate, Rental & Leasing (79.0%).
| Industry | Male | Female |
| Agriculture, Fishing & Hunting | 24 (100.0%) | 0 (0.0%) |
| Mining, Quarrying, & Extraction | 0 (0.0%) | 0 (0.0%) |
| Construction | 90 (87.4%) | 13 (12.6%) |
| Manufacturing | 153 (63.0%) | 90 (37.0%) |
| Wholesale Trade | 19 (100.0%) | 0 (0.0%) |
| Retail Trade | 230 (54.6%) | 191 (45.4%) |
| Transportation & Warehousing | 95 (96.0%) | 4 (4.0%) |
| Utilities | 0 (0.0%) | 0 (0.0%) |
| Information | 14 (73.7%) | 5 (26.3%) |
| Finance & Insurance | 30 (100.0%) | 0 (0.0%) |
| Real Estate, Rental & Leasing | 13 (21.0%) | 49 (79.0%) |
| Professional & Scientific | 106 (65.0%) | 57 (35.0%) |
| Enterprise Management | 0 (0.0%) | 0 (0.0%) |
| Administrative & Support | 31 (59.6%) | 21 (40.4%) |
| Educational Services | 62 (17.8%) | 287 (82.2%) |
| Health Care & Social Assistance | 87 (44.4%) | 109 (55.6%) |
| Arts, Entertainment & Recreation | 10 (10.3%) | 87 (89.7%) |
| Accommodation & Food Services | 87 (45.1%) | 106 (54.9%) |
| Public Administration | 17 (70.8%) | 7 (29.2%) |
| Total | 1,129 (49.9%) | 1,132 (50.1%) |
Education in Grantley
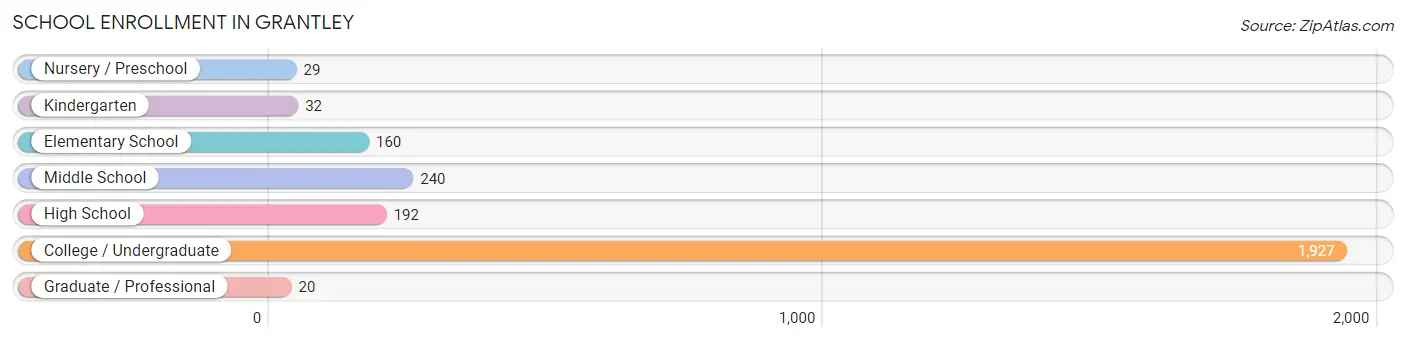
School Enrollment in Grantley
The most common levels of schooling among the 2,600 students in Grantley are college / undergraduate (1,927 | 74.1%), middle school (240 | 9.2%), and high school (192 | 7.4%).
| School Level | # Students | % Students |
| Nursery / Preschool | 29 | 1.1% |
| Kindergarten | 32 | 1.2% |
| Elementary School | 160 | 6.1% |
| Middle School | 240 | 9.2% |
| High School | 192 | 7.4% |
| College / Undergraduate | 1,927 | 74.1% |
| Graduate / Professional | 20 | 0.8% |
| Total | 2,600 | 100.0% |
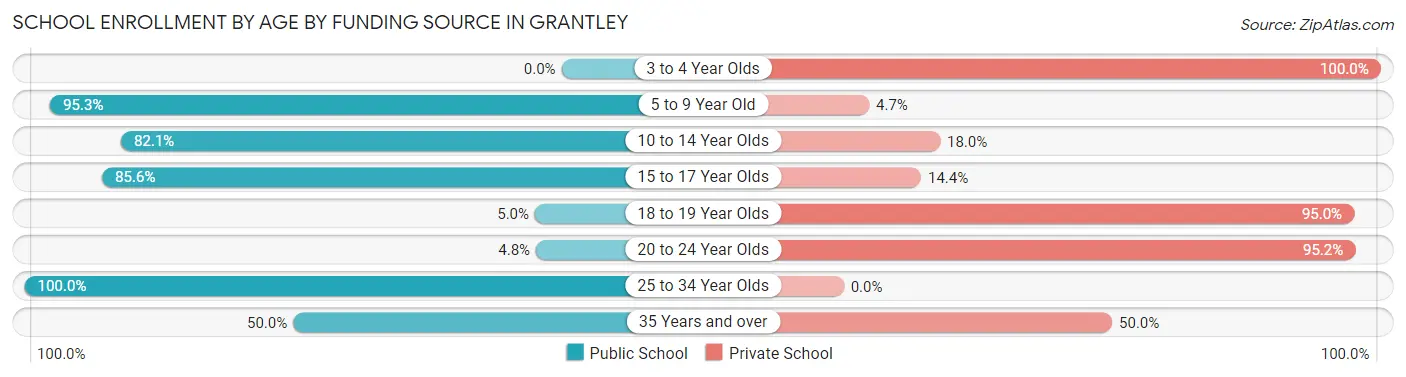
School Enrollment by Age by Funding Source in Grantley
Out of a total of 2,600 students who are enrolled in schools in Grantley, 1,947 (74.9%) attend a private institution, while the remaining 653 (25.1%) are enrolled in public schools. The age group of 3 to 4 year olds has the highest likelihood of being enrolled in private schools, with 21 (100.0% in the age bracket) enrolled. Conversely, the age group of 25 to 34 year olds has the lowest likelihood of being enrolled in a private school, with 26 (100.0% in the age bracket) attending a public institution.
| Age Bracket | Public School | Private School |
| 3 to 4 Year Olds | 0 (0.0%) | 21 (100.0%) |
| 5 to 9 Year Old | 181 (95.3%) | 9 (4.7%) |
| 10 to 14 Year Olds | 256 (82.1%) | 56 (17.9%) |
| 15 to 17 Year Olds | 89 (85.6%) | 15 (14.4%) |
| 18 to 19 Year Olds | 49 (5.0%) | 939 (95.0%) |
| 20 to 24 Year Olds | 45 (4.8%) | 900 (95.2%) |
| 25 to 34 Year Olds | 26 (100.0%) | 0 (0.0%) |
| 35 Years and over | 7 (50.0%) | 7 (50.0%) |
| Total | 653 (25.1%) | 1,947 (74.9%) |
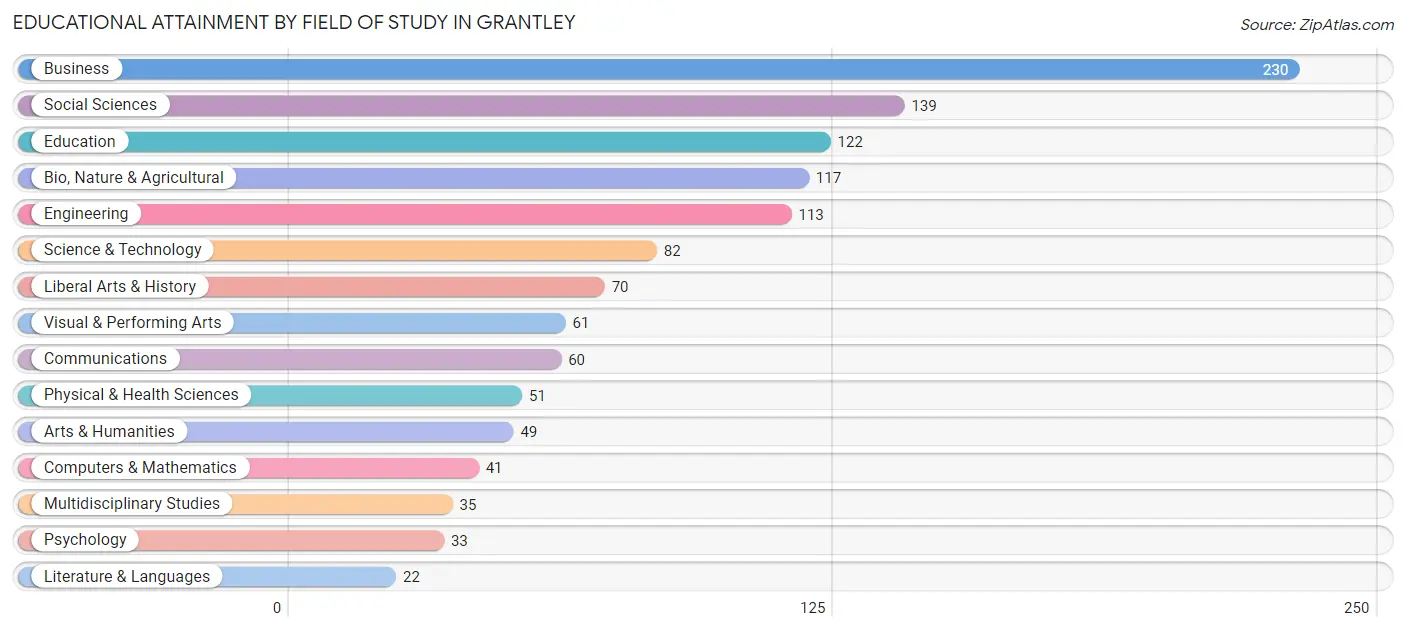
Educational Attainment by Field of Study in Grantley
Business (230 | 18.8%), social sciences (139 | 11.4%), education (122 | 10.0%), bio, nature & agricultural (117 | 9.6%), and engineering (113 | 9.2%) are the most common fields of study among 1,225 individuals in Grantley who have obtained a bachelor's degree or higher.
| Field of Study | # Graduates | % Graduates |
| Computers & Mathematics | 41 | 3.4% |
| Bio, Nature & Agricultural | 117 | 9.6% |
| Physical & Health Sciences | 51 | 4.2% |
| Psychology | 33 | 2.7% |
| Social Sciences | 139 | 11.4% |
| Engineering | 113 | 9.2% |
| Multidisciplinary Studies | 35 | 2.9% |
| Science & Technology | 82 | 6.7% |
| Business | 230 | 18.8% |
| Education | 122 | 10.0% |
| Literature & Languages | 22 | 1.8% |
| Liberal Arts & History | 70 | 5.7% |
| Visual & Performing Arts | 61 | 5.0% |
| Communications | 60 | 4.9% |
| Arts & Humanities | 49 | 4.0% |
| Total | 1,225 | 100.0% |
Transportation & Commute in Grantley
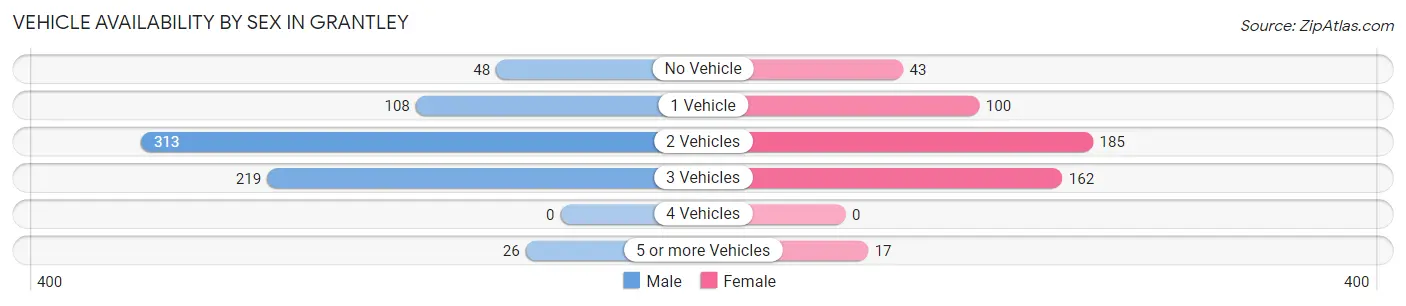
Vehicle Availability by Sex in Grantley
The most prevalent vehicle ownership categories in Grantley are males with 2 vehicles (313, accounting for 43.8%) and females with 2 vehicles (185, making up 61.7%).
| Vehicles Available | Male | Female |
| No Vehicle | 48 (6.7%) | 43 (8.5%) |
| 1 Vehicle | 108 (15.1%) | 100 (19.7%) |
| 2 Vehicles | 313 (43.8%) | 185 (36.5%) |
| 3 Vehicles | 219 (30.7%) | 162 (32.0%) |
| 4 Vehicles | 0 (0.0%) | 0 (0.0%) |
| 5 or more Vehicles | 26 (3.6%) | 17 (3.4%) |
| Total | 714 (100.0%) | 507 (100.0%) |
Commute Time in Grantley
The most frequently occuring commute durations in Grantley are 5 to 9 minutes (409 commuters, 24.3%), 10 to 14 minutes (376 commuters, 22.3%), and 15 to 19 minutes (329 commuters, 19.5%).
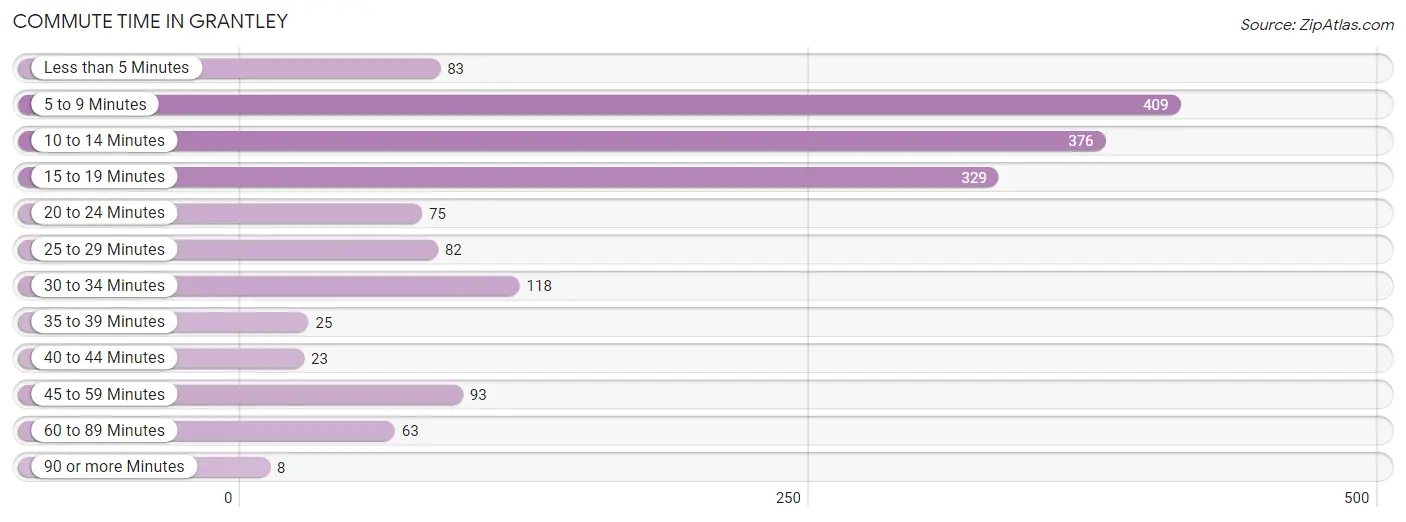
| Commute Time | # Commuters | % Commuters |
| Less than 5 Minutes | 83 | 4.9% |
| 5 to 9 Minutes | 409 | 24.3% |
| 10 to 14 Minutes | 376 | 22.3% |
| 15 to 19 Minutes | 329 | 19.5% |
| 20 to 24 Minutes | 75 | 4.4% |
| 25 to 29 Minutes | 82 | 4.9% |
| 30 to 34 Minutes | 118 | 7.0% |
| 35 to 39 Minutes | 25 | 1.5% |
| 40 to 44 Minutes | 23 | 1.4% |
| 45 to 59 Minutes | 93 | 5.5% |
| 60 to 89 Minutes | 63 | 3.7% |
| 90 or more Minutes | 8 | 0.5% |
Commute Time by Sex in Grantley
The most common commute times in Grantley are 15 to 19 minutes (238 commuters, 29.5%) for males and 5 to 9 minutes (249 commuters, 28.4%) for females.
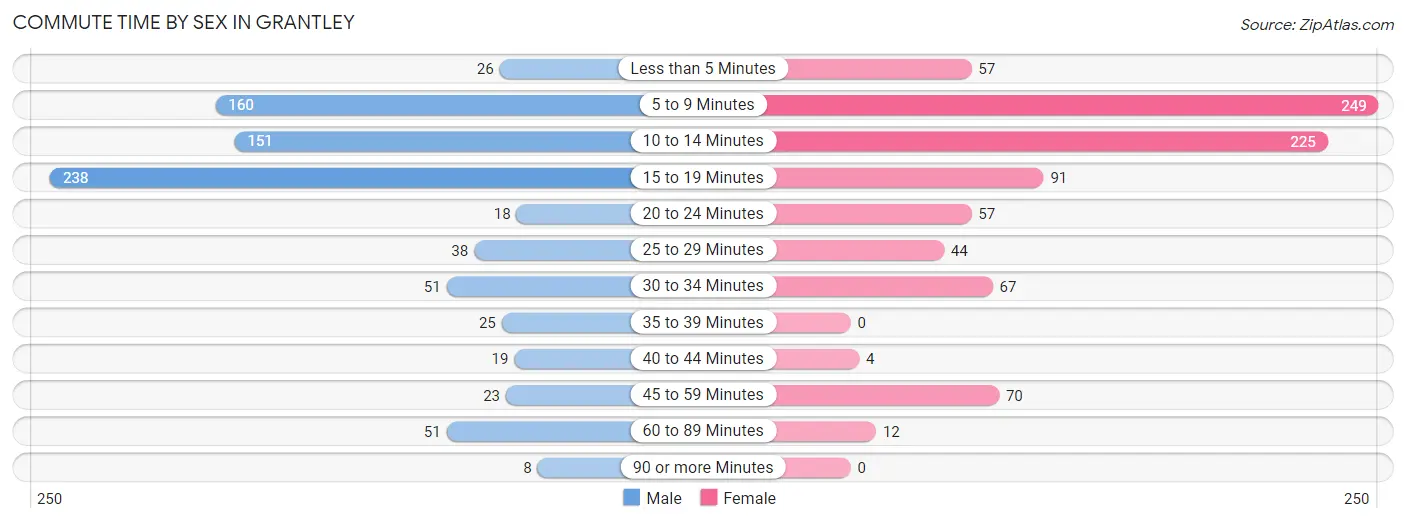
| Commute Time | Male | Female |
| Less than 5 Minutes | 26 (3.2%) | 57 (6.5%) |
| 5 to 9 Minutes | 160 (19.8%) | 249 (28.4%) |
| 10 to 14 Minutes | 151 (18.7%) | 225 (25.7%) |
| 15 to 19 Minutes | 238 (29.5%) | 91 (10.4%) |
| 20 to 24 Minutes | 18 (2.2%) | 57 (6.5%) |
| 25 to 29 Minutes | 38 (4.7%) | 44 (5.0%) |
| 30 to 34 Minutes | 51 (6.3%) | 67 (7.6%) |
| 35 to 39 Minutes | 25 (3.1%) | 0 (0.0%) |
| 40 to 44 Minutes | 19 (2.4%) | 4 (0.5%) |
| 45 to 59 Minutes | 23 (2.9%) | 70 (8.0%) |
| 60 to 89 Minutes | 51 (6.3%) | 12 (1.4%) |
| 90 or more Minutes | 8 (1.0%) | 0 (0.0%) |
Time of Departure to Work by Sex in Grantley
The most frequent times of departure to work in Grantley are 7:30 AM to 7:59 AM (136, 16.8%) for males and 7:00 AM to 7:29 AM (153, 17.5%) for females.
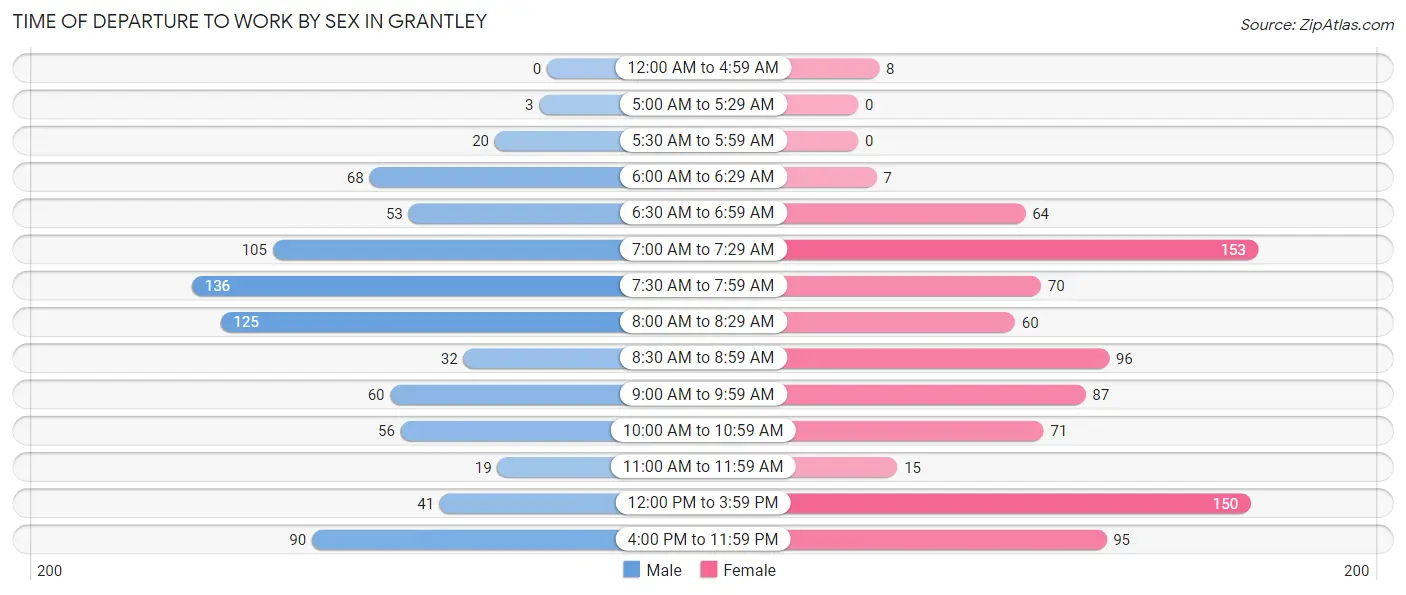
| Time of Departure | Male | Female |
| 12:00 AM to 4:59 AM | 0 (0.0%) | 8 (0.9%) |
| 5:00 AM to 5:29 AM | 3 (0.4%) | 0 (0.0%) |
| 5:30 AM to 5:59 AM | 20 (2.5%) | 0 (0.0%) |
| 6:00 AM to 6:29 AM | 68 (8.4%) | 7 (0.8%) |
| 6:30 AM to 6:59 AM | 53 (6.6%) | 64 (7.3%) |
| 7:00 AM to 7:29 AM | 105 (13.0%) | 153 (17.5%) |
| 7:30 AM to 7:59 AM | 136 (16.8%) | 70 (8.0%) |
| 8:00 AM to 8:29 AM | 125 (15.5%) | 60 (6.9%) |
| 8:30 AM to 8:59 AM | 32 (4.0%) | 96 (11.0%) |
| 9:00 AM to 9:59 AM | 60 (7.4%) | 87 (9.9%) |
| 10:00 AM to 10:59 AM | 56 (6.9%) | 71 (8.1%) |
| 11:00 AM to 11:59 AM | 19 (2.4%) | 15 (1.7%) |
| 12:00 PM to 3:59 PM | 41 (5.1%) | 150 (17.1%) |
| 4:00 PM to 11:59 PM | 90 (11.1%) | 95 (10.8%) |
| Total | 808 (100.0%) | 876 (100.0%) |
Housing Occupancy in Grantley
Occupancy by Ownership in Grantley
Of the total 965 dwellings in Grantley, owner-occupied units account for 913 (94.6%), while renter-occupied units make up 52 (5.4%).
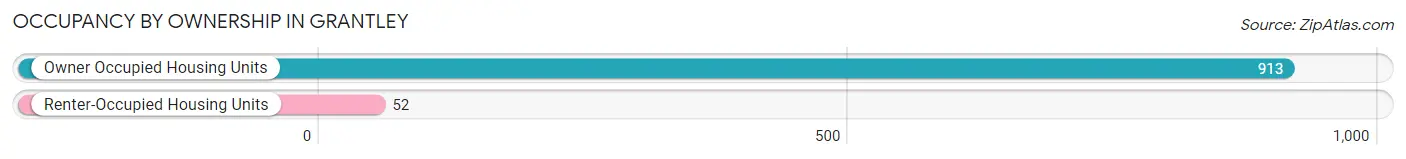
| Occupancy | # Housing Units | % Housing Units |
| Owner Occupied Housing Units | 913 | 94.6% |
| Renter-Occupied Housing Units | 52 | 5.4% |
| Total Occupied Housing Units | 965 | 100.0% |
Occupancy by Household Size in Grantley
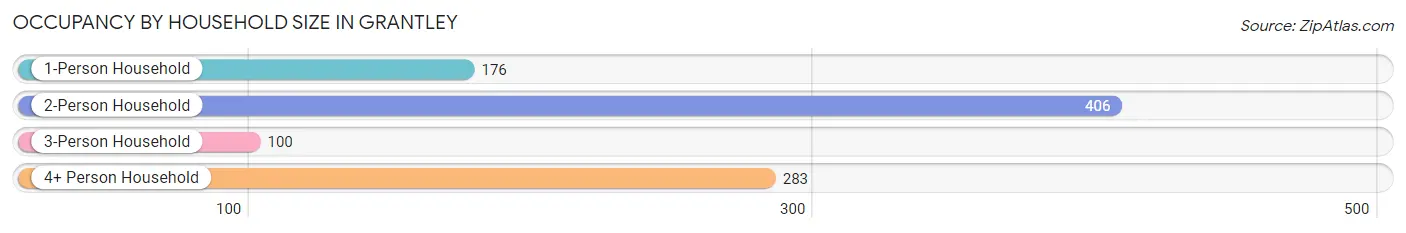
| Household Size | # Housing Units | % Housing Units |
| 1-Person Household | 176 | 18.2% |
| 2-Person Household | 406 | 42.1% |
| 3-Person Household | 100 | 10.4% |
| 4+ Person Household | 283 | 29.3% |
| Total Housing Units | 965 | 100.0% |
Occupancy by Ownership by Household Size in Grantley
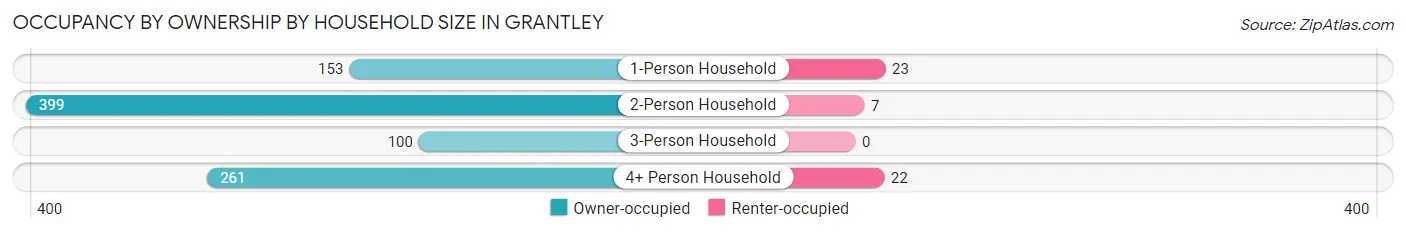
| Household Size | Owner-occupied | Renter-occupied |
| 1-Person Household | 153 (86.9%) | 23 (13.1%) |
| 2-Person Household | 399 (98.3%) | 7 (1.7%) |
| 3-Person Household | 100 (100.0%) | 0 (0.0%) |
| 4+ Person Household | 261 (92.2%) | 22 (7.8%) |
| Total Housing Units | 913 (94.6%) | 52 (5.4%) |
Occupancy by Educational Attainment in Grantley
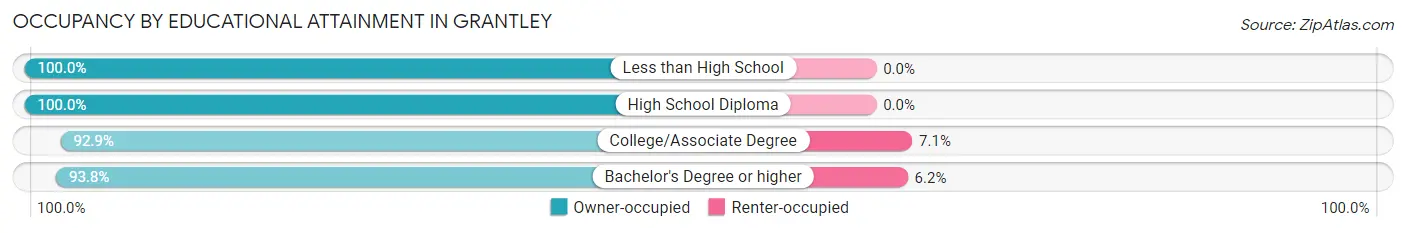
| Household Size | Owner-occupied | Renter-occupied |
| Less than High School | 14 (100.0%) | 0 (0.0%) |
| High School Diploma | 142 (100.0%) | 0 (0.0%) |
| College/Associate Degree | 156 (92.9%) | 12 (7.1%) |
| Bachelor's Degree or higher | 601 (93.8%) | 40 (6.2%) |
Occupancy by Age of Householder in Grantley
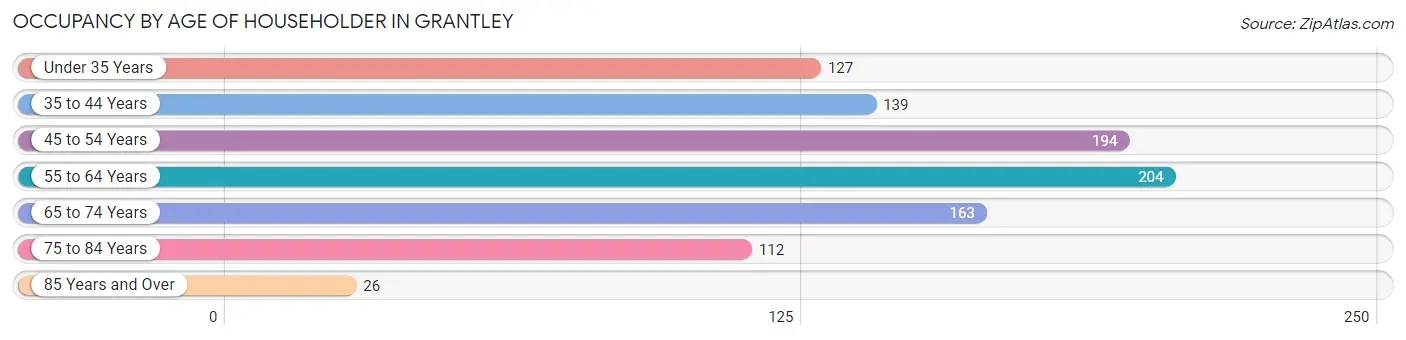
| Age Bracket | # Households | % Households |
| Under 35 Years | 127 | 13.2% |
| 35 to 44 Years | 139 | 14.4% |
| 45 to 54 Years | 194 | 20.1% |
| 55 to 64 Years | 204 | 21.1% |
| 65 to 74 Years | 163 | 16.9% |
| 75 to 84 Years | 112 | 11.6% |
| 85 Years and Over | 26 | 2.7% |
| Total | 965 | 100.0% |
Housing Finances in Grantley
Median Income by Occupancy in Grantley
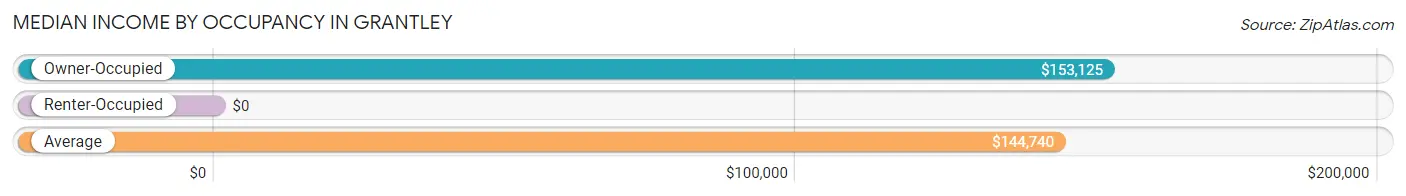
| Occupancy Type | # Households | Median Income |
| Owner-Occupied | 913 (94.6%) | $153,125 |
| Renter-Occupied | 52 (5.4%) | $0 |
| Average | 965 (100.0%) | $144,740 |
Occupancy by Householder Income Bracket in Grantley
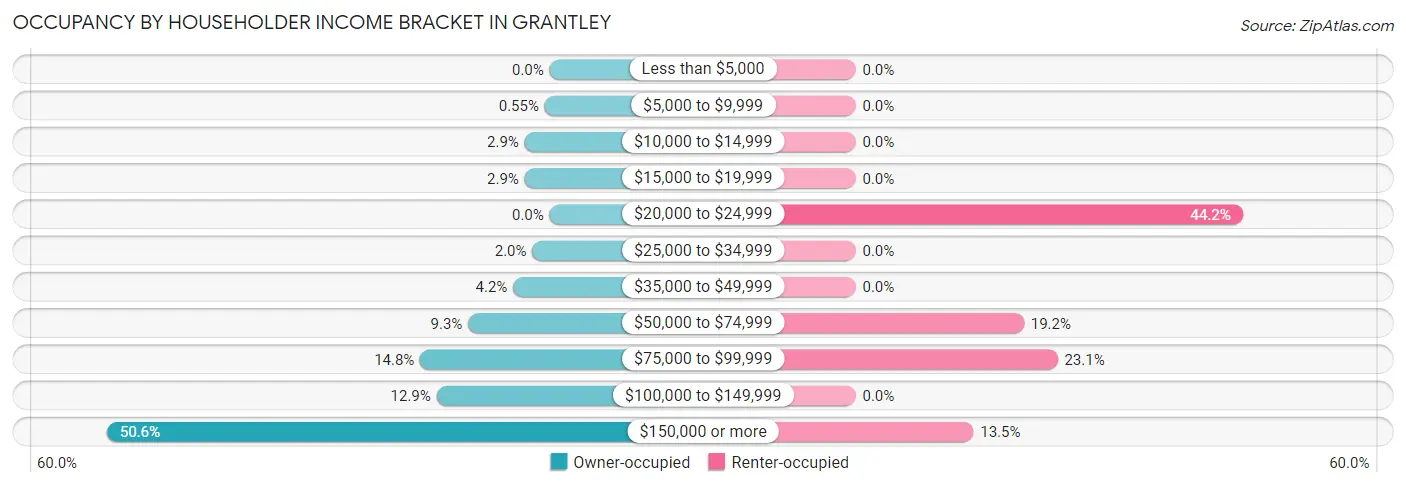
| Income Bracket | Owner-occupied | Renter-occupied |
| Less than $5,000 | 0 (0.0%) | 0 (0.0%) |
| $5,000 to $9,999 | 5 (0.5%) | 0 (0.0%) |
| $10,000 to $14,999 | 26 (2.9%) | 0 (0.0%) |
| $15,000 to $19,999 | 26 (2.9%) | 0 (0.0%) |
| $20,000 to $24,999 | 0 (0.0%) | 23 (44.2%) |
| $25,000 to $34,999 | 18 (2.0%) | 0 (0.0%) |
| $35,000 to $49,999 | 38 (4.2%) | 0 (0.0%) |
| $50,000 to $74,999 | 85 (9.3%) | 10 (19.2%) |
| $75,000 to $99,999 | 135 (14.8%) | 12 (23.1%) |
| $100,000 to $149,999 | 118 (12.9%) | 0 (0.0%) |
| $150,000 or more | 462 (50.6%) | 7 (13.5%) |
| Total | 913 (100.0%) | 52 (100.0%) |
Monthly Housing Cost Tiers in Grantley
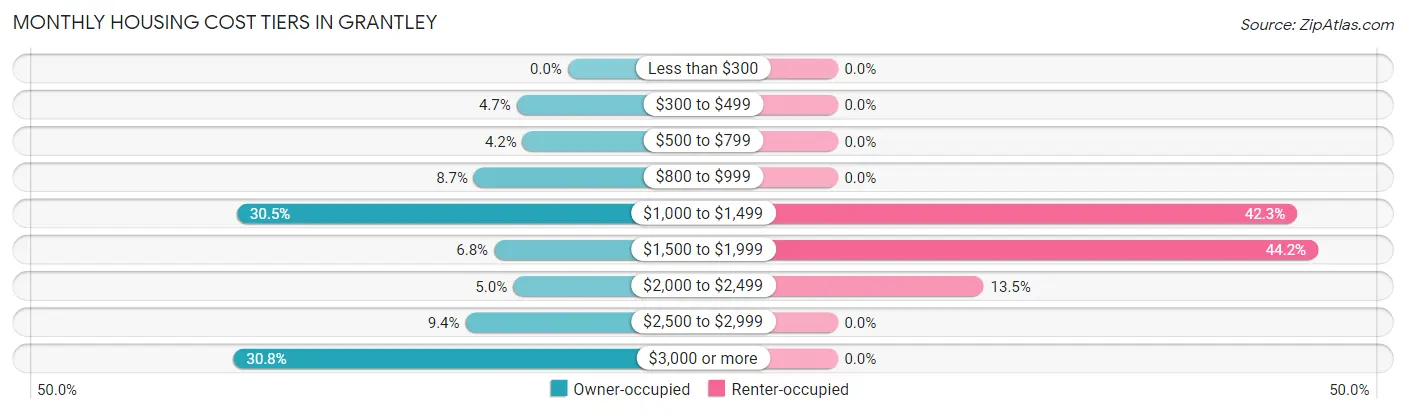
| Monthly Cost | Owner-occupied | Renter-occupied |
| Less than $300 | 0 (0.0%) | 0 (0.0%) |
| $300 to $499 | 43 (4.7%) | 0 (0.0%) |
| $500 to $799 | 38 (4.2%) | 0 (0.0%) |
| $800 to $999 | 79 (8.6%) | 0 (0.0%) |
| $1,000 to $1,499 | 278 (30.4%) | 22 (42.3%) |
| $1,500 to $1,999 | 62 (6.8%) | 23 (44.2%) |
| $2,000 to $2,499 | 46 (5.0%) | 7 (13.5%) |
| $2,500 to $2,999 | 86 (9.4%) | 0 (0.0%) |
| $3,000 or more | 281 (30.8%) | 0 (0.0%) |
| Total | 913 (100.0%) | 52 (100.0%) |
Physical Housing Characteristics in Grantley
Housing Structures in Grantley
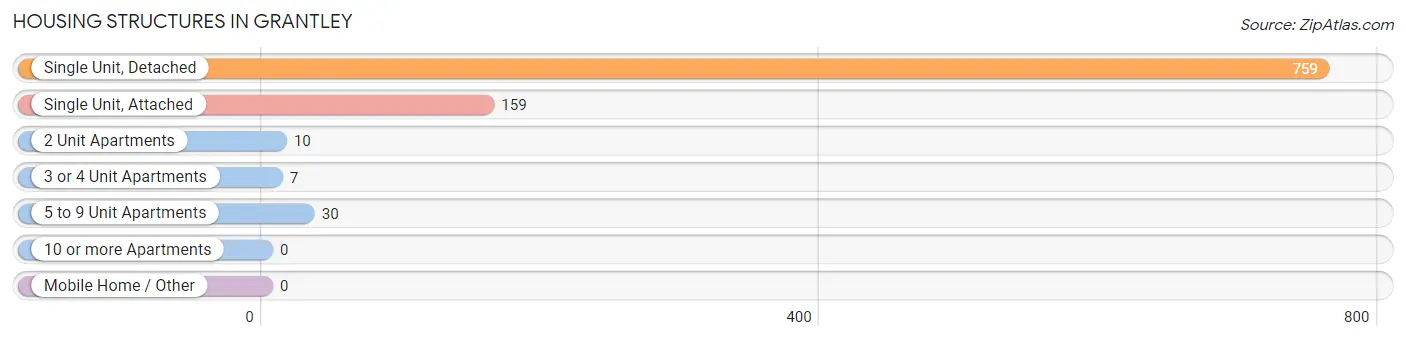
| Structure Type | # Housing Units | % Housing Units |
| Single Unit, Detached | 759 | 78.6% |
| Single Unit, Attached | 159 | 16.5% |
| 2 Unit Apartments | 10 | 1.0% |
| 3 or 4 Unit Apartments | 7 | 0.7% |
| 5 to 9 Unit Apartments | 30 | 3.1% |
| 10 or more Apartments | 0 | 0.0% |
| Mobile Home / Other | 0 | 0.0% |
| Total | 965 | 100.0% |
Housing Structures by Occupancy in Grantley
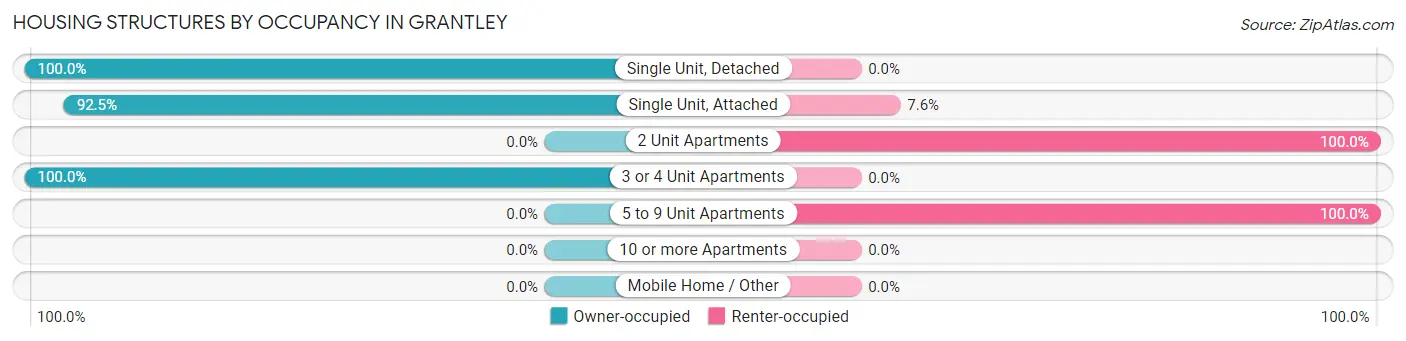
| Structure Type | Owner-occupied | Renter-occupied |
| Single Unit, Detached | 759 (100.0%) | 0 (0.0%) |
| Single Unit, Attached | 147 (92.4%) | 12 (7.5%) |
| 2 Unit Apartments | 0 (0.0%) | 10 (100.0%) |
| 3 or 4 Unit Apartments | 7 (100.0%) | 0 (0.0%) |
| 5 to 9 Unit Apartments | 0 (0.0%) | 30 (100.0%) |
| 10 or more Apartments | 0 (0.0%) | 0 (0.0%) |
| Mobile Home / Other | 0 (0.0%) | 0 (0.0%) |
| Total | 913 (94.6%) | 52 (5.4%) |
Housing Structures by Number of Rooms in Grantley
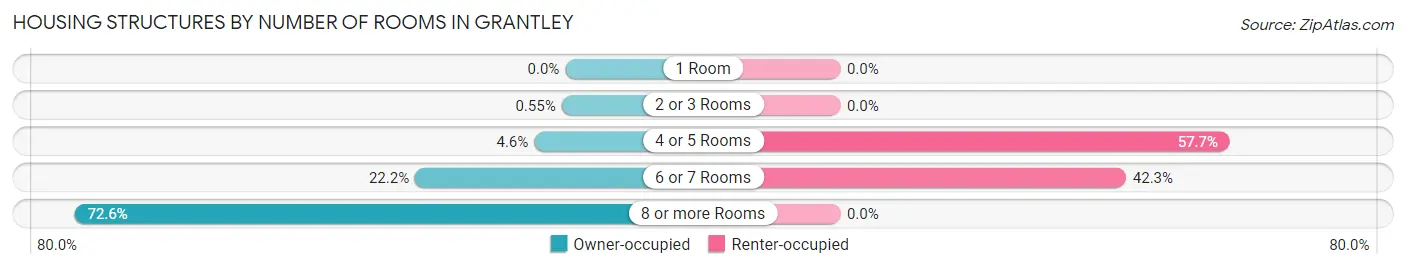
| Number of Rooms | Owner-occupied | Renter-occupied |
| 1 Room | 0 (0.0%) | 0 (0.0%) |
| 2 or 3 Rooms | 5 (0.5%) | 0 (0.0%) |
| 4 or 5 Rooms | 42 (4.6%) | 30 (57.7%) |
| 6 or 7 Rooms | 203 (22.2%) | 22 (42.3%) |
| 8 or more Rooms | 663 (72.6%) | 0 (0.0%) |
| Total | 913 (100.0%) | 52 (100.0%) |
Housing Structure by Heating Type in Grantley
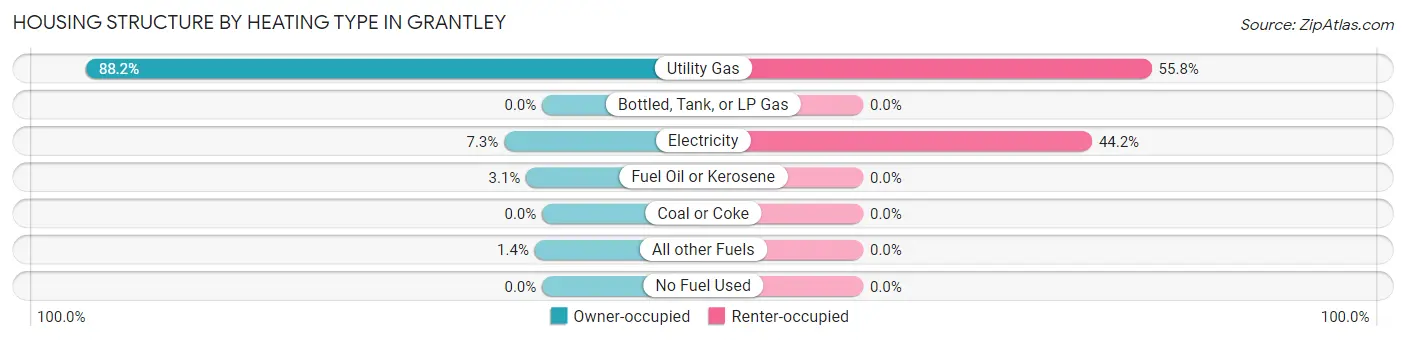
| Heating Type | Owner-occupied | Renter-occupied |
| Utility Gas | 805 (88.2%) | 29 (55.8%) |
| Bottled, Tank, or LP Gas | 0 (0.0%) | 0 (0.0%) |
| Electricity | 67 (7.3%) | 23 (44.2%) |
| Fuel Oil or Kerosene | 28 (3.1%) | 0 (0.0%) |
| Coal or Coke | 0 (0.0%) | 0 (0.0%) |
| All other Fuels | 13 (1.4%) | 0 (0.0%) |
| No Fuel Used | 0 (0.0%) | 0 (0.0%) |
| Total | 913 (100.0%) | 52 (100.0%) |
Household Vehicle Usage in Grantley
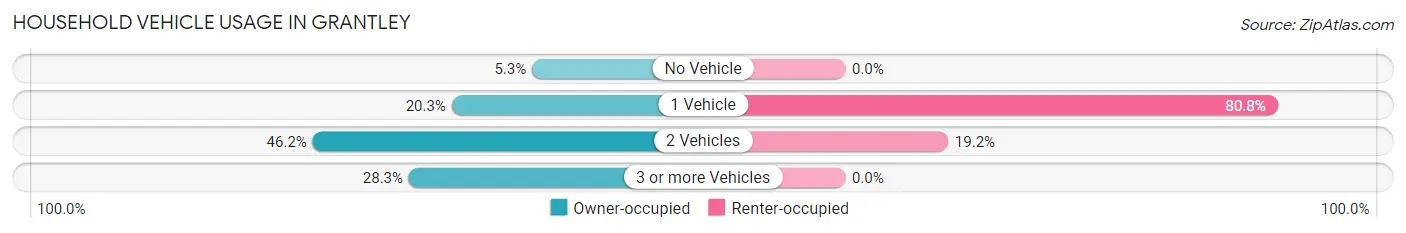
| Vehicles per Household | Owner-occupied | Renter-occupied |
| No Vehicle | 48 (5.3%) | 0 (0.0%) |
| 1 Vehicle | 185 (20.3%) | 42 (80.8%) |
| 2 Vehicles | 422 (46.2%) | 10 (19.2%) |
| 3 or more Vehicles | 258 (28.3%) | 0 (0.0%) |
| Total | 913 (100.0%) | 52 (100.0%) |
Real Estate & Mortgages in Grantley
Real Estate and Mortgage Overview in Grantley
| Characteristic | Without Mortgage | With Mortgage |
| Housing Units | 313 | 600 |
| Median Property Value | $390,300 | $412,500 |
| Median Household Income | $156,625 | $289 |
| Monthly Housing Costs | $1,207 | $250 |
| Real Estate Taxes | $7,083 | $0 |
Property Value by Mortgage Status in Grantley
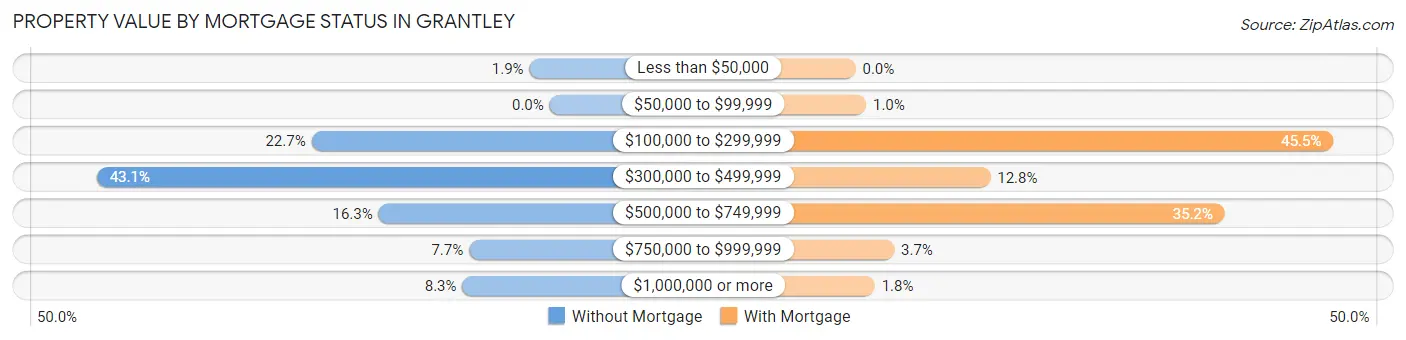
| Property Value | Without Mortgage | With Mortgage |
| Less than $50,000 | 6 (1.9%) | 0 (0.0%) |
| $50,000 to $99,999 | 0 (0.0%) | 6 (1.0%) |
| $100,000 to $299,999 | 71 (22.7%) | 273 (45.5%) |
| $300,000 to $499,999 | 135 (43.1%) | 77 (12.8%) |
| $500,000 to $749,999 | 51 (16.3%) | 211 (35.2%) |
| $750,000 to $999,999 | 24 (7.7%) | 22 (3.7%) |
| $1,000,000 or more | 26 (8.3%) | 11 (1.8%) |
| Total | 313 (100.0%) | 600 (100.0%) |
Household Income by Mortgage Status in Grantley
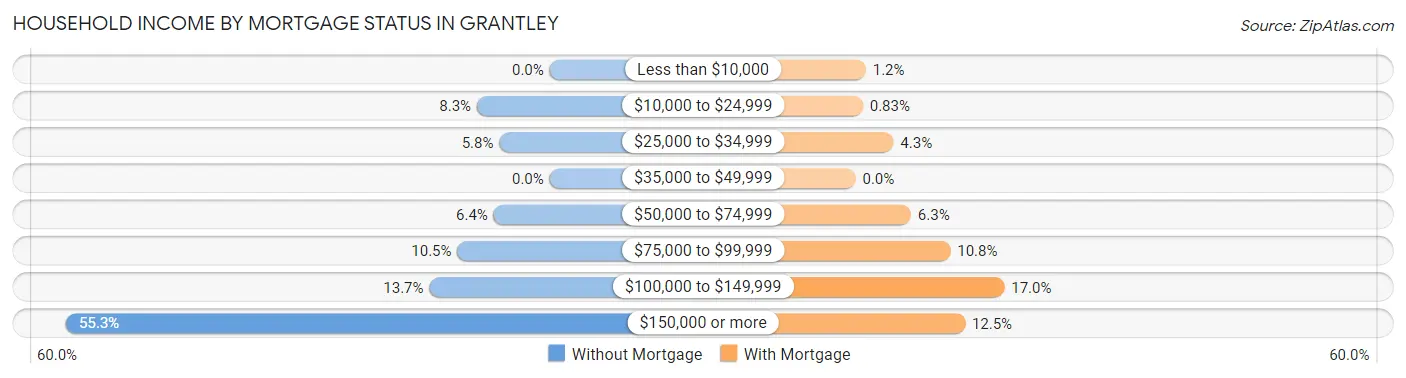
| Household Income | Without Mortgage | With Mortgage |
| Less than $10,000 | 0 (0.0%) | 7 (1.2%) |
| $10,000 to $24,999 | 26 (8.3%) | 5 (0.8%) |
| $25,000 to $34,999 | 18 (5.8%) | 26 (4.3%) |
| $35,000 to $49,999 | 0 (0.0%) | 0 (0.0%) |
| $50,000 to $74,999 | 20 (6.4%) | 38 (6.3%) |
| $75,000 to $99,999 | 33 (10.5%) | 65 (10.8%) |
| $100,000 to $149,999 | 43 (13.7%) | 102 (17.0%) |
| $150,000 or more | 173 (55.3%) | 75 (12.5%) |
| Total | 313 (100.0%) | 600 (100.0%) |
Property Value to Household Income Ratio in Grantley
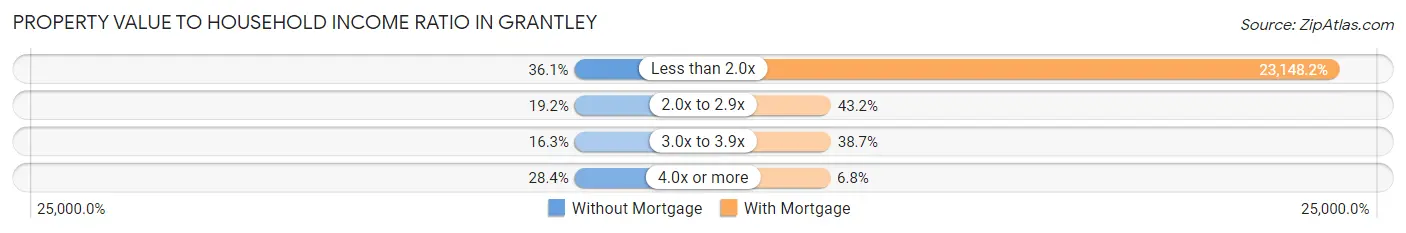
| Value-to-Income Ratio | Without Mortgage | With Mortgage |
| Less than 2.0x | 113 (36.1%) | 138,889 (23,148.2%) |
| 2.0x to 2.9x | 60 (19.2%) | 259 (43.2%) |
| 3.0x to 3.9x | 51 (16.3%) | 232 (38.7%) |
| 4.0x or more | 89 (28.4%) | 41 (6.8%) |
| Total | 313 (100.0%) | 600 (100.0%) |
Real Estate Taxes by Mortgage Status in Grantley
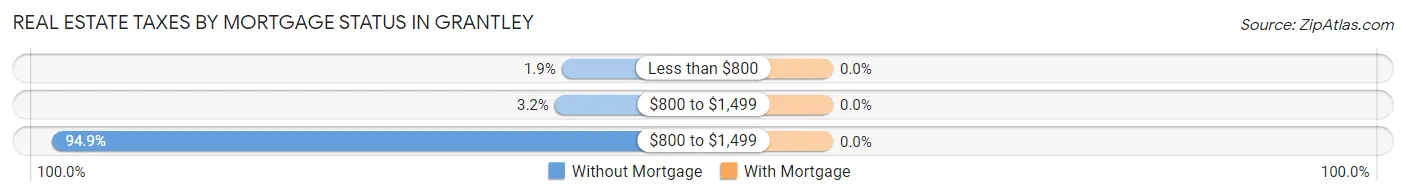
| Property Taxes | Without Mortgage | With Mortgage |
| Less than $800 | 6 (1.9%) | 0 (0.0%) |
| $800 to $1,499 | 10 (3.2%) | 0 (0.0%) |
| $800 to $1,499 | 297 (94.9%) | 0 (0.0%) |
| Total | 313 (100.0%) | 600 (100.0%) |
Health & Disability in Grantley
Health Insurance Coverage by Age in Grantley
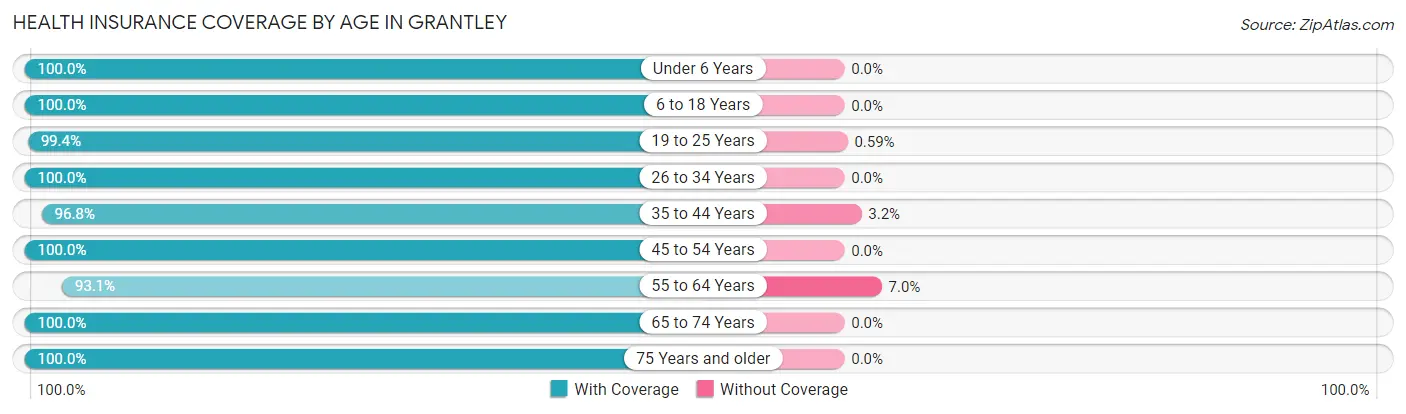
| Age Bracket | With Coverage | Without Coverage |
| Under 6 Years | 174 (100.0%) | 0 (0.0%) |
| 6 to 18 Years | 896 (100.0%) | 0 (0.0%) |
| 19 to 25 Years | 1,697 (99.4%) | 10 (0.6%) |
| 26 to 34 Years | 231 (100.0%) | 0 (0.0%) |
| 35 to 44 Years | 335 (96.8%) | 11 (3.2%) |
| 45 to 54 Years | 343 (100.0%) | 0 (0.0%) |
| 55 to 64 Years | 281 (93.0%) | 21 (7.0%) |
| 65 to 74 Years | 334 (100.0%) | 0 (0.0%) |
| 75 Years and older | 197 (100.0%) | 0 (0.0%) |
| Total | 4,488 (99.1%) | 42 (0.9%) |
Health Insurance Coverage by Citizenship Status in Grantley
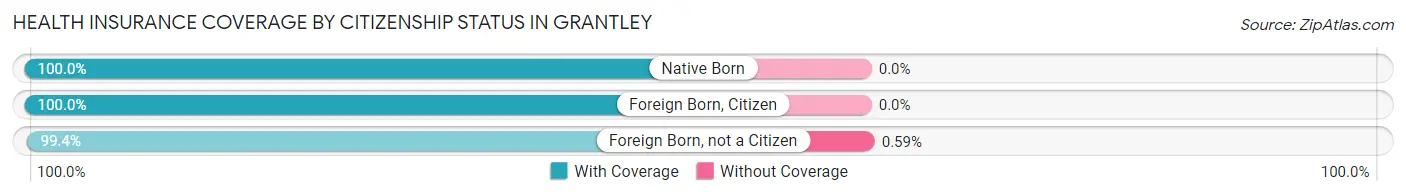
| Citizenship Status | With Coverage | Without Coverage |
| Native Born | 174 (100.0%) | 0 (0.0%) |
| Foreign Born, Citizen | 896 (100.0%) | 0 (0.0%) |
| Foreign Born, not a Citizen | 1,697 (99.4%) | 10 (0.6%) |
Health Insurance Coverage by Household Income in Grantley
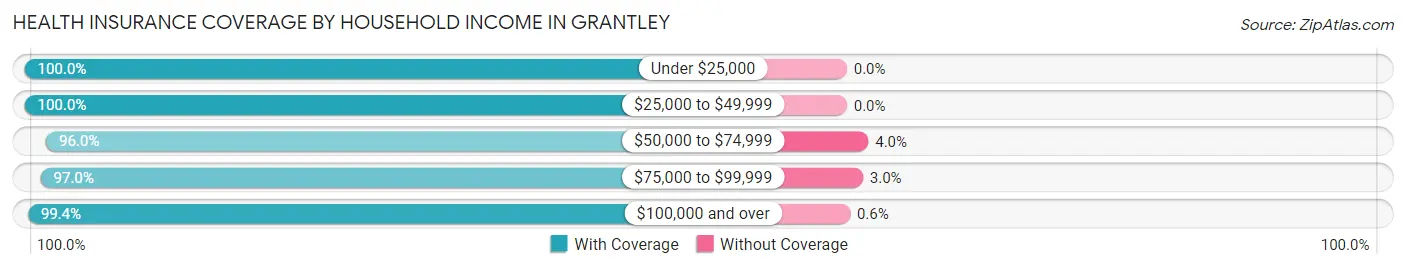
| Household Income | With Coverage | Without Coverage |
| Under $25,000 | 187 (100.0%) | 0 (0.0%) |
| $25,000 to $49,999 | 145 (100.0%) | 0 (0.0%) |
| $50,000 to $74,999 | 262 (96.0%) | 11 (4.0%) |
| $75,000 to $99,999 | 355 (97.0%) | 11 (3.0%) |
| $100,000 and over | 1,648 (99.4%) | 10 (0.6%) |
Public vs Private Health Insurance Coverage by Age in Grantley
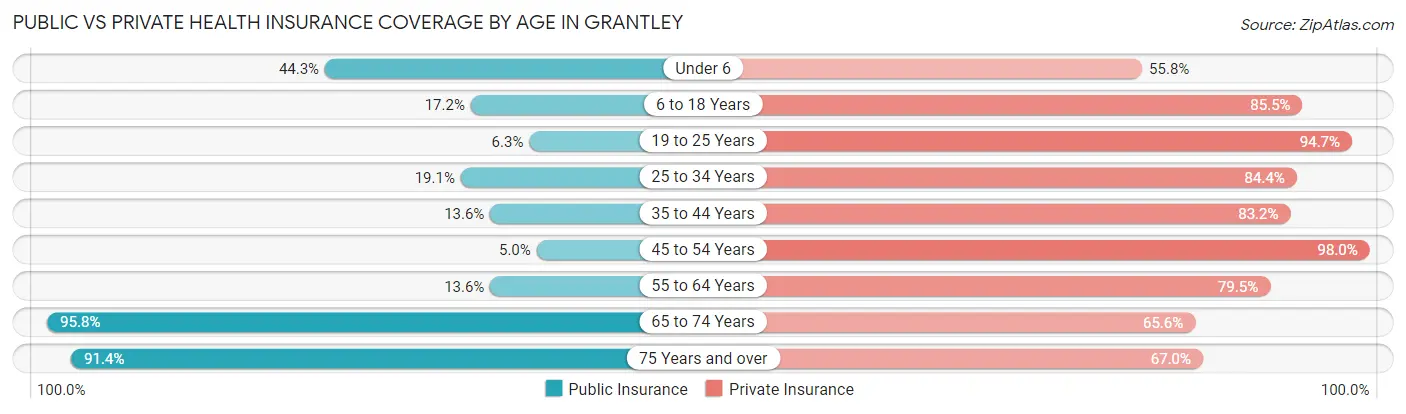
| Age Bracket | Public Insurance | Private Insurance |
| Under 6 | 77 (44.3%) | 97 (55.7%) |
| 6 to 18 Years | 154 (17.2%) | 766 (85.5%) |
| 19 to 25 Years | 108 (6.3%) | 1,616 (94.7%) |
| 25 to 34 Years | 44 (19.1%) | 195 (84.4%) |
| 35 to 44 Years | 47 (13.6%) | 288 (83.2%) |
| 45 to 54 Years | 17 (5.0%) | 336 (98.0%) |
| 55 to 64 Years | 41 (13.6%) | 240 (79.5%) |
| 65 to 74 Years | 320 (95.8%) | 219 (65.6%) |
| 75 Years and over | 180 (91.4%) | 132 (67.0%) |
| Total | 988 (21.8%) | 3,889 (85.9%) |
Disability Status by Sex by Age in Grantley
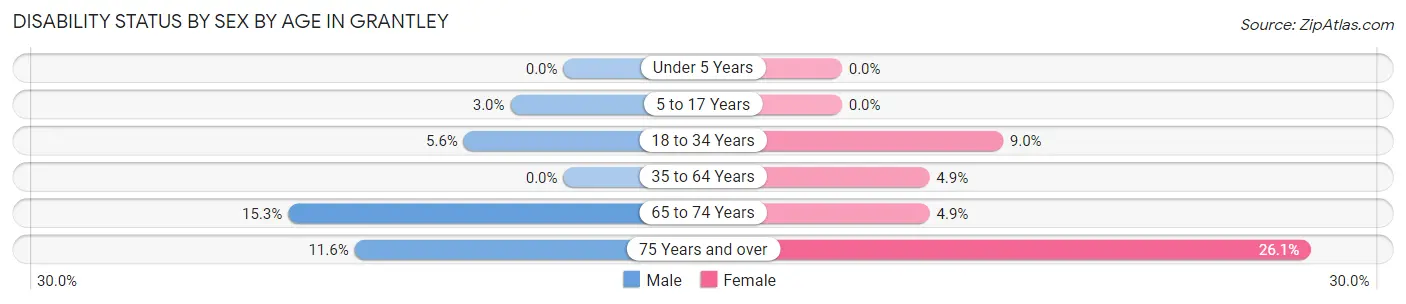
| Age Bracket | Male | Female |
| Under 5 Years | 0 (0.0%) | 0 (0.0%) |
| 5 to 17 Years | 10 (2.9%) | 0 (0.0%) |
| 18 to 34 Years | 61 (5.6%) | 102 (9.0%) |
| 35 to 64 Years | 0 (0.0%) | 25 (4.9%) |
| 65 to 74 Years | 23 (15.3%) | 9 (4.9%) |
| 75 Years and over | 10 (11.6%) | 29 (26.1%) |
Disability Class by Sex by Age in Grantley
Disability Class: Hearing Difficulty
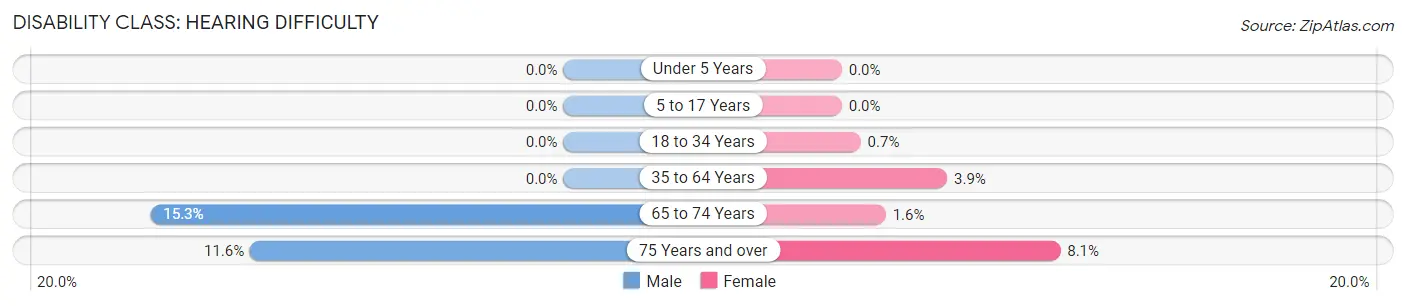
| Age Bracket | Male | Female |
| Under 5 Years | 0 (0.0%) | 0 (0.0%) |
| 5 to 17 Years | 0 (0.0%) | 0 (0.0%) |
| 18 to 34 Years | 0 (0.0%) | 8 (0.7%) |
| 35 to 64 Years | 0 (0.0%) | 20 (3.9%) |
| 65 to 74 Years | 23 (15.3%) | 3 (1.6%) |
| 75 Years and over | 10 (11.6%) | 9 (8.1%) |
Disability Class: Vision Difficulty
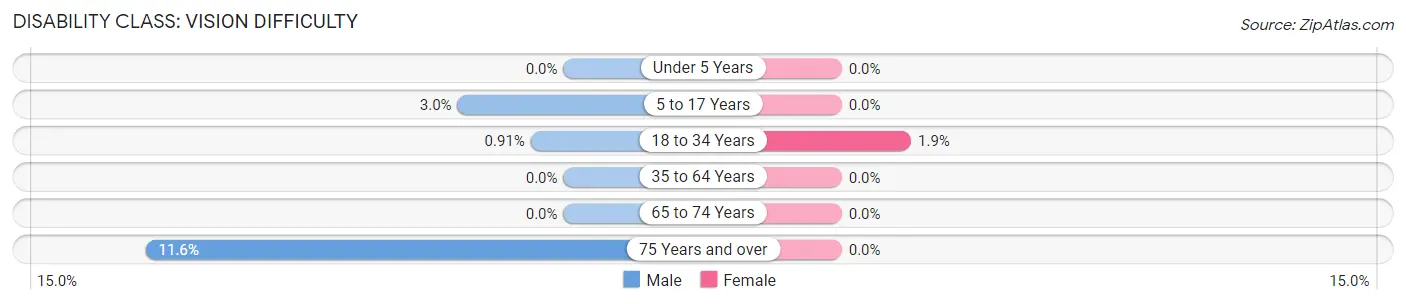
| Age Bracket | Male | Female |
| Under 5 Years | 0 (0.0%) | 0 (0.0%) |
| 5 to 17 Years | 10 (2.9%) | 0 (0.0%) |
| 18 to 34 Years | 10 (0.9%) | 22 (1.9%) |
| 35 to 64 Years | 0 (0.0%) | 0 (0.0%) |
| 65 to 74 Years | 0 (0.0%) | 0 (0.0%) |
| 75 Years and over | 10 (11.6%) | 0 (0.0%) |
Disability Class: Cognitive Difficulty
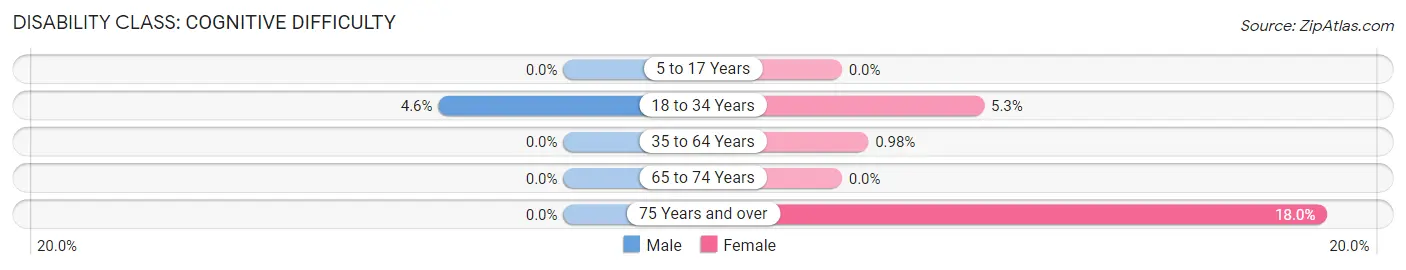
| Age Bracket | Male | Female |
| 5 to 17 Years | 0 (0.0%) | 0 (0.0%) |
| 18 to 34 Years | 51 (4.6%) | 60 (5.3%) |
| 35 to 64 Years | 0 (0.0%) | 5 (1.0%) |
| 65 to 74 Years | 0 (0.0%) | 0 (0.0%) |
| 75 Years and over | 0 (0.0%) | 20 (18.0%) |
Disability Class: Ambulatory Difficulty
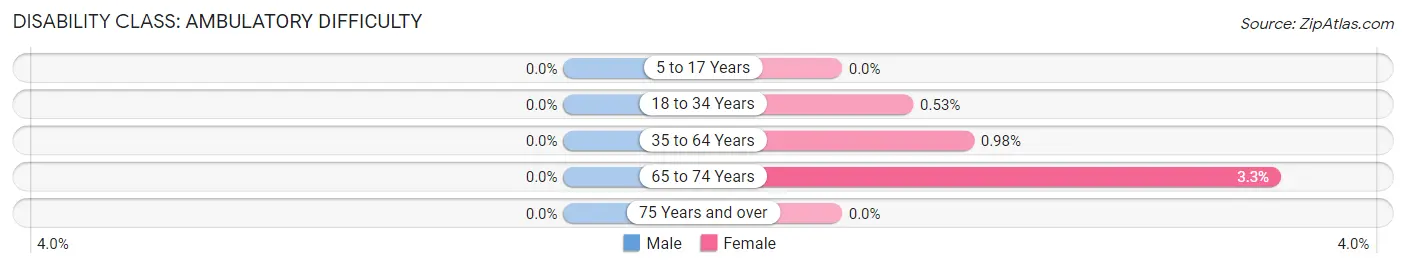
| Age Bracket | Male | Female |
| 5 to 17 Years | 0 (0.0%) | 0 (0.0%) |
| 18 to 34 Years | 0 (0.0%) | 6 (0.5%) |
| 35 to 64 Years | 0 (0.0%) | 5 (1.0%) |
| 65 to 74 Years | 0 (0.0%) | 6 (3.3%) |
| 75 Years and over | 0 (0.0%) | 0 (0.0%) |
Disability Class: Self-Care Difficulty
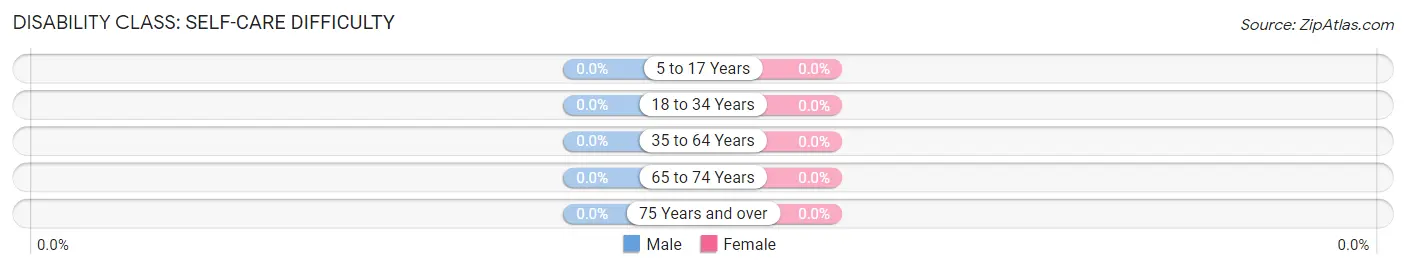
| Age Bracket | Male | Female |
| 5 to 17 Years | 0 (0.0%) | 0 (0.0%) |
| 18 to 34 Years | 0 (0.0%) | 0 (0.0%) |
| 35 to 64 Years | 0 (0.0%) | 0 (0.0%) |
| 65 to 74 Years | 0 (0.0%) | 0 (0.0%) |
| 75 Years and over | 0 (0.0%) | 0 (0.0%) |
Technology Access in Grantley
Computing Device Access in Grantley
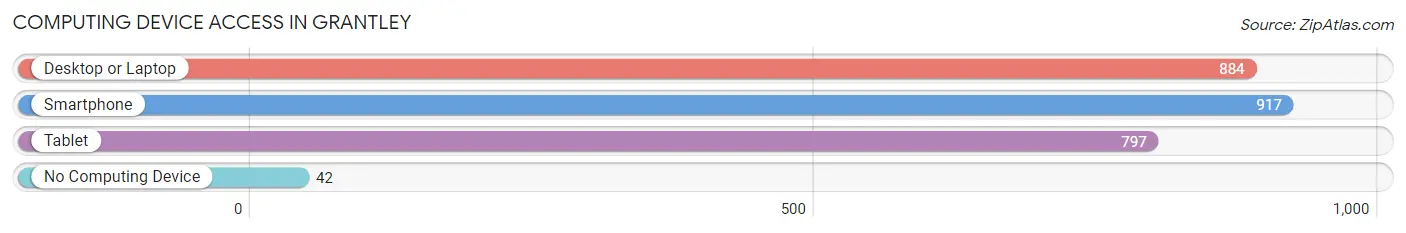
| Device Type | # Households | % Households |
| Desktop or Laptop | 884 | 91.6% |
| Smartphone | 917 | 95.0% |
| Tablet | 797 | 82.6% |
| No Computing Device | 42 | 4.3% |
| Total | 965 | 100.0% |
Internet Access in Grantley
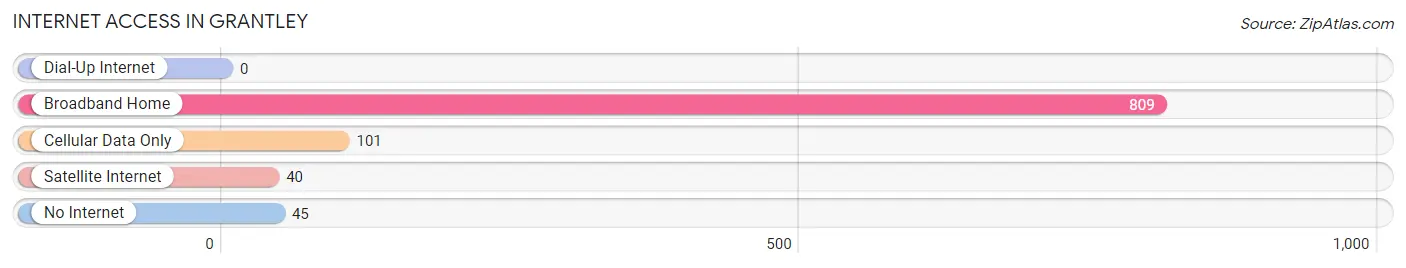
| Internet Type | # Households | % Households |
| Dial-Up Internet | 0 | 0.0% |
| Broadband Home | 809 | 83.8% |
| Cellular Data Only | 101 | 10.5% |
| Satellite Internet | 40 | 4.2% |
| No Internet | 45 | 4.7% |
| Total | 965 | 100.0% |
Grantley Summary
History
Grantley, Pennsylvania is a small borough located in York County, Pennsylvania. It was founded in 1872 by a group of settlers from the nearby town of York. The town was named after the Grantley family, who were among the first settlers.
The town was originally a farming community, with the main crops being wheat, corn, and oats. The town also had a few small businesses, such as a general store, a blacksmith, and a post office.
In the late 19th century, the town began to grow and develop. The railroad came to town in 1887, and the town began to attract more businesses and residents. The town also began to attract more industry, such as a brickyard, a sawmill, and a flour mill.
The town continued to grow and develop throughout the 20th century. In the 1950s, the town began to attract more industry, such as a paper mill and a plastics factory. The town also began to attract more residents, and the population grew from 1,000 in 1950 to over 3,000 in 2000.
Geography
Grantley is located in York County, Pennsylvania. It is situated in the southeastern part of the state, about 25 miles south of Harrisburg. The town is located in a rural area, with rolling hills and farmland. The town is bordered by the Susquehanna River to the east and the Codorus Creek to the west.
The town has a total area of 1.2 square miles, all of which is land. The town is located at an elevation of 545 feet above sea level.
Economy
The economy of Grantley is largely based on agriculture and manufacturing. The town is home to several farms, which produce a variety of crops, including wheat, corn, and oats. The town also has several small businesses, such as a general store, a blacksmith, and a post office.
The town is also home to several manufacturing companies, such as a paper mill and a plastics factory. These companies provide jobs for many of the town’s residents.
Demographics
As of the 2010 census, the population of Grantley was 3,093. The population is largely white (94.3%), with small percentages of African American (2.2%), Hispanic (1.7%), and Asian (1.2%) residents.
The median household income in Grantley is $45,938, and the median home value is $133,400. The town has a poverty rate of 11.2%, which is slightly higher than the national average.
The town is served by the South Eastern York School District, which has three elementary schools, one middle school, and one high school. The town also has several churches, including the First United Methodist Church, the Church of the Brethren, and the Church of the Nazarene.
Common Questions
What is the Total Population of Grantley?
Total Population of Grantley is 4,665.
What is the Total Male Population of Grantley?
Total Male Population of Grantley is 2,328.
What is the Total Female Population of Grantley?
Total Female Population of Grantley is 2,337.
What is the Ratio of Males per 100 Females in Grantley?
There are 99.61 Males per 100 Females in Grantley.
What is the Ratio of Females per 100 Males in Grantley?
There are 100.39 Females per 100 Males in Grantley.
What is the Median Population Age in Grantley?
Median Population Age in Grantley is 21.5 Years.
What is the Average Family Size in Grantley
Average Family Size in Grantley is 3.1 People.
What is the Average Household Size in Grantley
Average Household Size in Grantley is 2.7 People.
What is Per Capita Income in Grantley?
Per Capita income in Grantley is $60,263.
What is the Median Family Income in Grantley?
Median Family Income in Grantley is $161,250.
What is the Median Household income in Grantley?
Median Household Income in Grantley is $144,740.
What is Income or Wage Gap in Grantley?
Income or Wage Gap in Grantley is 48.0%.
Women in Grantley earn 52.0 cents for every dollar earned by a man.
What is Inequality or Gini Index in Grantley?
Inequality or Gini Index in Grantley is 0.55.
How Large is the Labor Force in Grantley?
There are 2,391 People in the Labor Forcein in Grantley.
What is the Percentage of People in the Labor Force in Grantley?
60.1% of People are in the Labor Force in Grantley.
What is the Unemployment Rate in Grantley?
Unemployment Rate in Grantley is 5.4%.