West Pittston borough, PA
West Pittston borough Overview
4,664
TOTAL POPULATION
2,360
MALE POPULATION
2,304
FEMALE POPULATION
102.43
MALES / 100 FEMALES
97.63
FEMALES / 100 MALES
42.0
MEDIAN AGE
2.8
AVG FAMILY SIZE
2.2
AVG HOUSEHOLD SIZE
$34,768
PER CAPITA INCOME
$69,951
AVG FAMILY INCOME
$59,498
AVG HOUSEHOLD INCOME
19.6%
WAGE / INCOME GAP [ % ]
80.4¢/ $1
WAGE / INCOME GAP [ $ ]
0.41
INEQUALITY / GINI INDEX
2,638
LABOR FORCE [ PEOPLE ]
68.9%
PERCENT IN LABOR FORCE
2.0%
UNEMPLOYMENT RATE
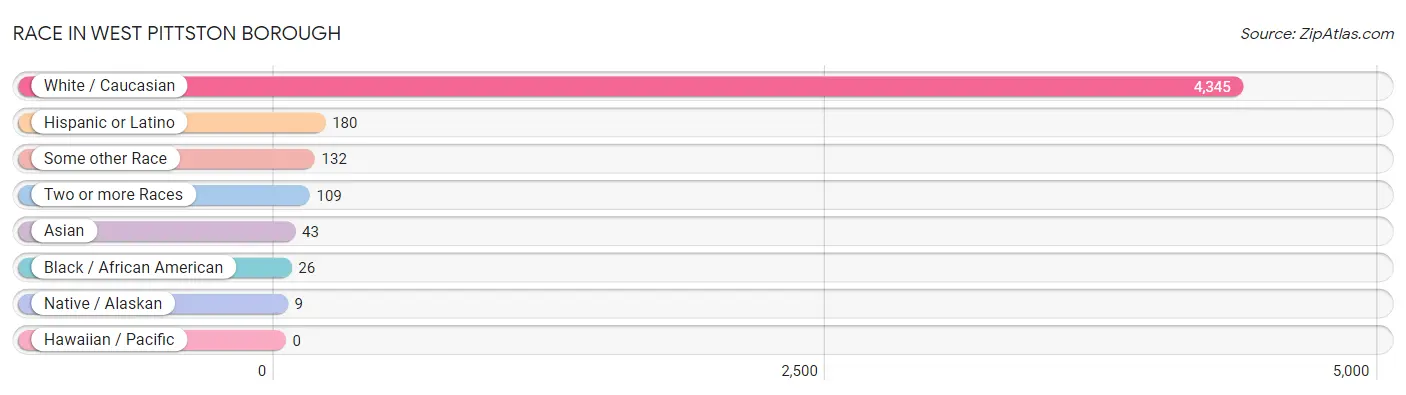
Race in West Pittston borough
The most populous races in West Pittston borough are White / Caucasian (4,345 | 93.2%), Hispanic or Latino (180 | 3.9%), and Some other Race (132 | 2.8%).
| Race | # Population | % Population |
| Asian | 43 | 0.9% |
| Black / African American | 26 | 0.6% |
| Hawaiian / Pacific | 0 | 0.0% |
| Hispanic or Latino | 180 | 3.9% |
| Native / Alaskan | 9 | 0.2% |
| White / Caucasian | 4,345 | 93.2% |
| Two or more Races | 109 | 2.3% |
| Some other Race | 132 | 2.8% |
| Total | 4,664 | 100.0% |
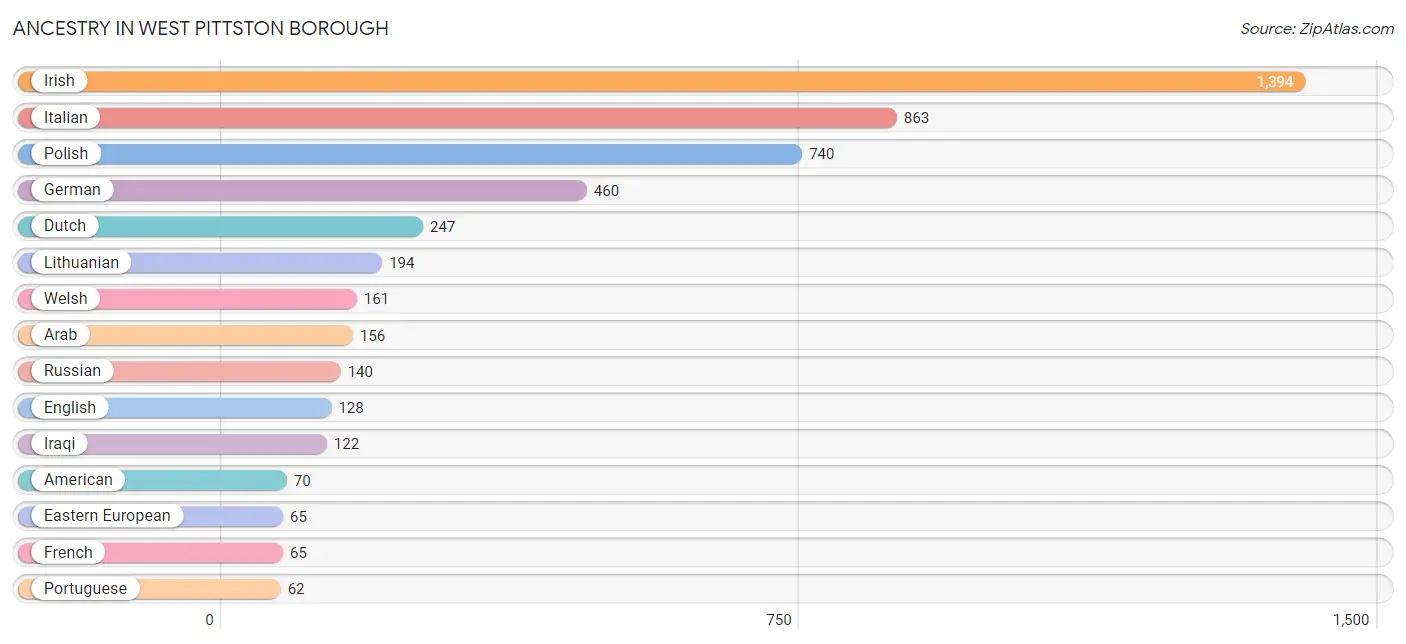
Ancestry in West Pittston borough
The most populous ancestries reported in West Pittston borough are Irish (1,394 | 29.9%), Italian (863 | 18.5%), Polish (740 | 15.9%), German (460 | 9.9%), and Dutch (247 | 5.3%), together accounting for 79.4% of all West Pittston borough residents.
| Ancestry | # Population | % Population |
| American | 70 | 1.5% |
| Arab | 156 | 3.3% |
| Austrian | 21 | 0.4% |
| Burmese | 11 | 0.2% |
| Cherokee | 11 | 0.2% |
| Colombian | 20 | 0.4% |
| Creek | 9 | 0.2% |
| Dominican | 31 | 0.7% |
| Dutch | 247 | 5.3% |
| Eastern European | 65 | 1.4% |
| English | 128 | 2.7% |
| French | 65 | 1.4% |
| German | 460 | 9.9% |
| Iraqi | 122 | 2.6% |
| Irish | 1,394 | 29.9% |
| Italian | 863 | 18.5% |
| Korean | 45 | 1.0% |
| Lithuanian | 194 | 4.2% |
| Mexican | 58 | 1.2% |
| Pennsylvania German | 43 | 0.9% |
| Polish | 740 | 15.9% |
| Portuguese | 62 | 1.3% |
| Puerto Rican | 43 | 0.9% |
| Russian | 140 | 3.0% |
| Scandinavian | 15 | 0.3% |
| Scottish | 41 | 0.9% |
| Slovak | 31 | 0.7% |
| South American | 20 | 0.4% |
| Spaniard | 14 | 0.3% |
| Swedish | 33 | 0.7% |
| Syrian | 34 | 0.7% |
| Ukrainian | 55 | 1.2% |
| Welsh | 161 | 3.5% | View All 33 Rows |
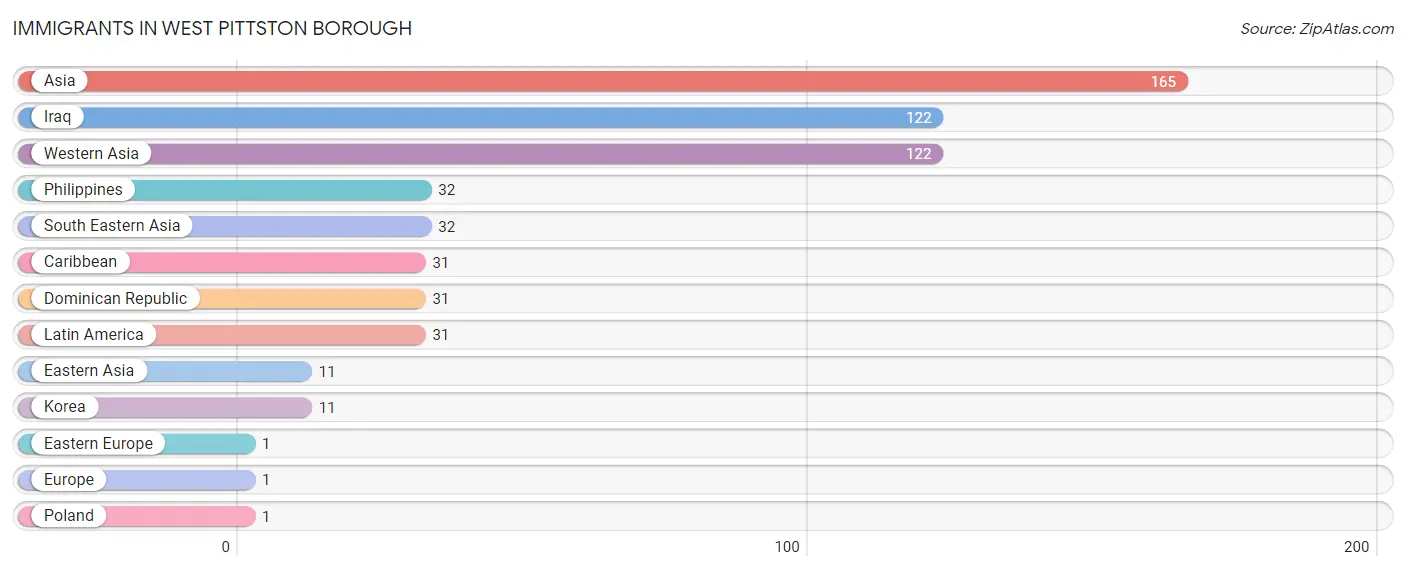
Immigrants in West Pittston borough
The most numerous immigrant groups reported in West Pittston borough came from Asia (165 | 3.5%), Iraq (122 | 2.6%), Western Asia (122 | 2.6%), Philippines (32 | 0.7%), and South Eastern Asia (32 | 0.7%), together accounting for 10.2% of all West Pittston borough residents.
| Immigration Origin | # Population | % Population |
| Asia | 165 | 3.5% |
| Caribbean | 31 | 0.7% |
| Dominican Republic | 31 | 0.7% |
| Eastern Asia | 11 | 0.2% |
| Eastern Europe | 1 | 0.0% |
| Europe | 1 | 0.0% |
| Iraq | 122 | 2.6% |
| Korea | 11 | 0.2% |
| Latin America | 31 | 0.7% |
| Philippines | 32 | 0.7% |
| Poland | 1 | 0.0% |
| South Eastern Asia | 32 | 0.7% |
| Western Asia | 122 | 2.6% | View All 13 Rows |
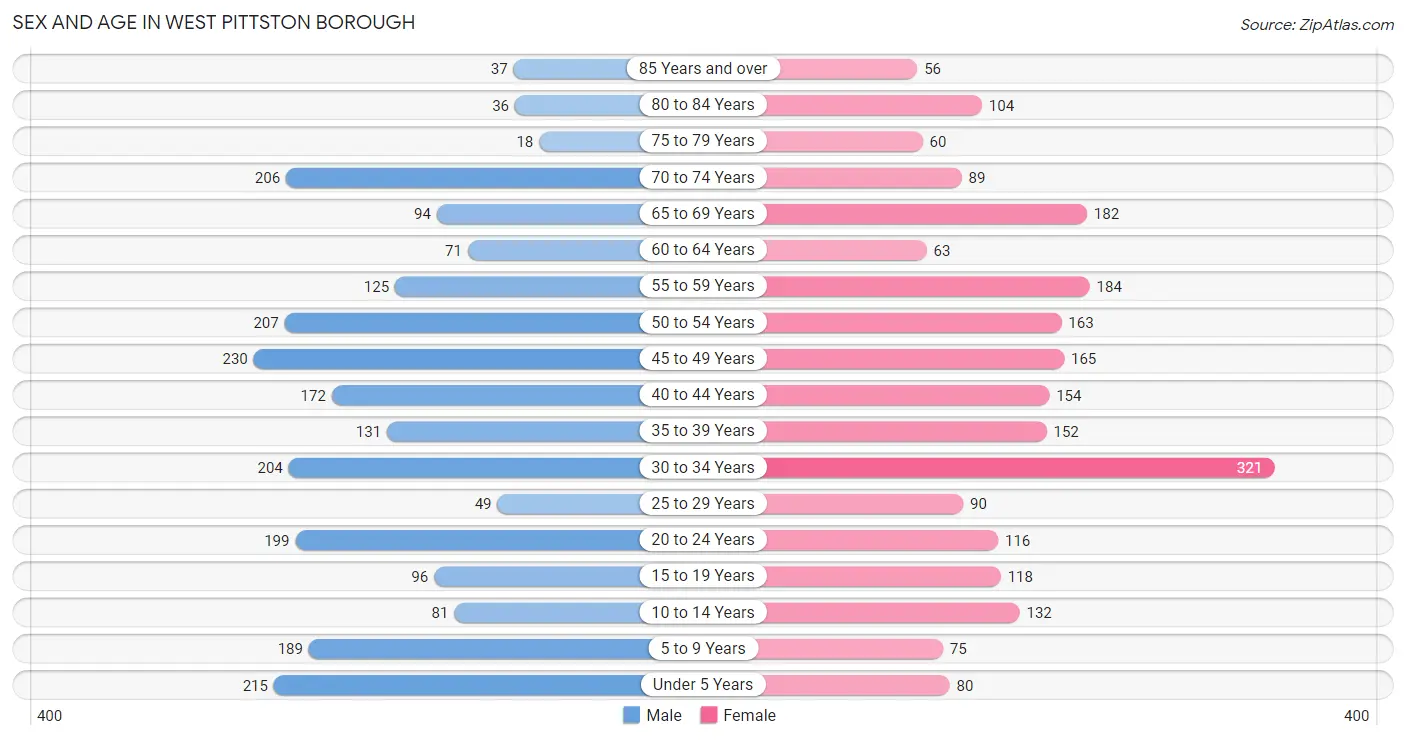
Sex and Age in West Pittston borough
Sex and Age in West Pittston borough
The most populous age groups in West Pittston borough are 45 to 49 Years (230 | 9.8%) for men and 30 to 34 Years (321 | 13.9%) for women.
| Age Bracket | Male | Female |
| Under 5 Years | 215 (9.1%) | 80 (3.5%) |
| 5 to 9 Years | 189 (8.0%) | 75 (3.3%) |
| 10 to 14 Years | 81 (3.4%) | 132 (5.7%) |
| 15 to 19 Years | 96 (4.1%) | 118 (5.1%) |
| 20 to 24 Years | 199 (8.4%) | 116 (5.0%) |
| 25 to 29 Years | 49 (2.1%) | 90 (3.9%) |
| 30 to 34 Years | 204 (8.6%) | 321 (13.9%) |
| 35 to 39 Years | 131 (5.6%) | 152 (6.6%) |
| 40 to 44 Years | 172 (7.3%) | 154 (6.7%) |
| 45 to 49 Years | 230 (9.8%) | 165 (7.2%) |
| 50 to 54 Years | 207 (8.8%) | 163 (7.1%) |
| 55 to 59 Years | 125 (5.3%) | 184 (8.0%) |
| 60 to 64 Years | 71 (3.0%) | 63 (2.7%) |
| 65 to 69 Years | 94 (4.0%) | 182 (7.9%) |
| 70 to 74 Years | 206 (8.7%) | 89 (3.9%) |
| 75 to 79 Years | 18 (0.8%) | 60 (2.6%) |
| 80 to 84 Years | 36 (1.5%) | 104 (4.5%) |
| 85 Years and over | 37 (1.6%) | 56 (2.4%) |
| Total | 2,360 (100.0%) | 2,304 (100.0%) |
Families and Households in West Pittston borough
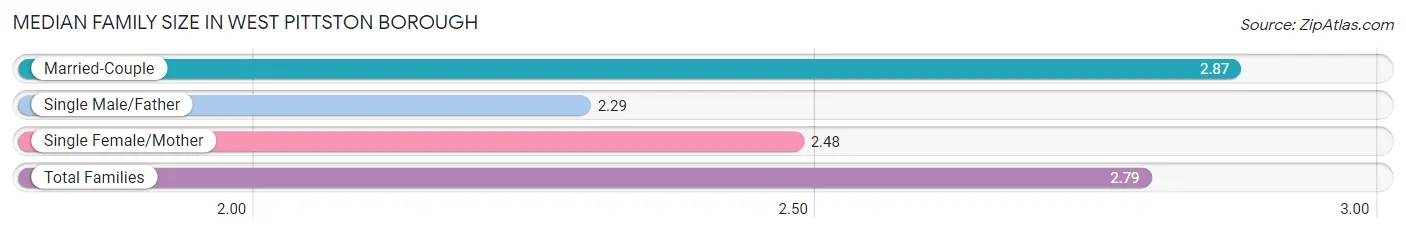
Median Family Size in West Pittston borough
The median family size in West Pittston borough is 2.79 persons per family, with married-couple families (1,029 | 80.8%) accounting for the largest median family size of 2.87 persons per family. On the other hand, single male/father families (48 | 3.8%) represent the smallest median family size with 2.29 persons per family.
| Family Type | # Families | Family Size |
| Married-Couple | 1,029 (80.8%) | 2.87 |
| Single Male/Father | 48 (3.8%) | 2.29 |
| Single Female/Mother | 197 (15.5%) | 2.48 |
| Total Families | 1,274 (100.0%) | 2.79 |
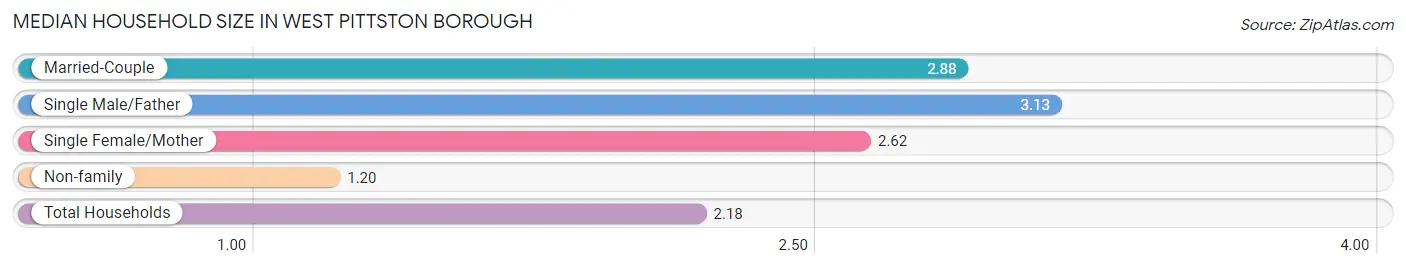
Median Household Size in West Pittston borough
The median household size in West Pittston borough is 2.18 persons per household, with single male/father households (48 | 2.2%) accounting for the largest median household size of 3.13 persons per household. non-family households (859 | 40.3%) represent the smallest median household size with 1.20 persons per household.
| Household Type | # Households | Household Size |
| Married-Couple | 1,029 (48.2%) | 2.88 |
| Single Male/Father | 48 (2.2%) | 3.13 |
| Single Female/Mother | 197 (9.2%) | 2.62 |
| Non-family | 859 (40.3%) | 1.20 |
| Total Households | 2,133 (100.0%) | 2.18 |
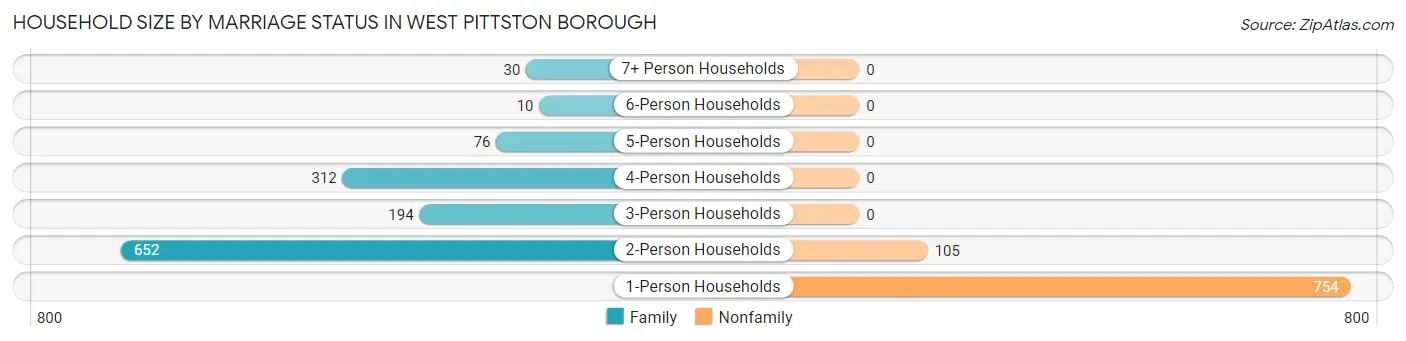
Household Size by Marriage Status in West Pittston borough
Out of a total of 2,133 households in West Pittston borough, 1,274 (59.7%) are family households, while 859 (40.3%) are nonfamily households. The most numerous type of family households are 2-person households, comprising 652, and the most common type of nonfamily households are 1-person households, comprising 754.
| Household Size | Family Households | Nonfamily Households |
| 1-Person Households | - | 754 (35.3%) |
| 2-Person Households | 652 (30.6%) | 105 (4.9%) |
| 3-Person Households | 194 (9.1%) | 0 (0.0%) |
| 4-Person Households | 312 (14.6%) | 0 (0.0%) |
| 5-Person Households | 76 (3.6%) | 0 (0.0%) |
| 6-Person Households | 10 (0.5%) | 0 (0.0%) |
| 7+ Person Households | 30 (1.4%) | 0 (0.0%) |
| Total | 1,274 (59.7%) | 859 (40.3%) |
Female Fertility in West Pittston borough
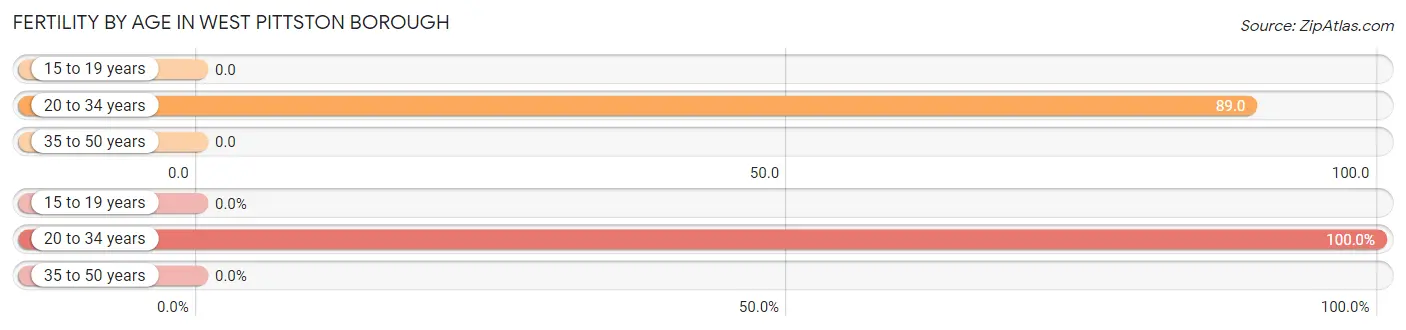
Fertility by Age in West Pittston borough
Average fertility rate in West Pittston borough is 41.0 births per 1,000 women. Women in the age bracket of 20 to 34 years have the highest fertility rate with 89.0 births per 1,000 women. Women in the age bracket of 20 to 34 years acount for 100.0% of all women with births.
| Age Bracket | Women with Births | Births / 1,000 Women |
| 15 to 19 years | 0 (0.0%) | 0.0 |
| 20 to 34 years | 47 (100.0%) | 89.0 |
| 35 to 50 years | 0 (0.0%) | 0.0 |
| Total | 47 (100.0%) | 41.0 |
Fertility by Age by Marriage Status in West Pittston borough
36.2% of women with births (47) in West Pittston borough are married. The highest percentage of unmarried women with births falls into 20 to 34 years age bracket with 63.8% of them unmarried at the time of birth, while the lowest percentage of unmarried women with births belong to 20 to 34 years age bracket with 63.8% of them unmarried.
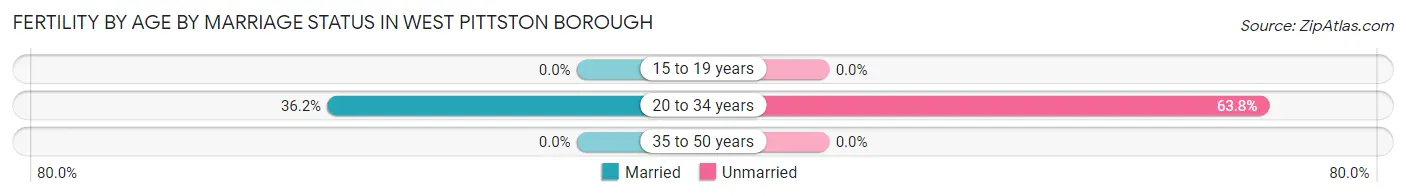
| Age Bracket | Married | Unmarried |
| 15 to 19 years | 0 (0.0%) | 0 (0.0%) |
| 20 to 34 years | 17 (36.2%) | 30 (63.8%) |
| 35 to 50 years | 0 (0.0%) | 0 (0.0%) |
| Total | 17 (36.2%) | 30 (63.8%) |
Fertility by Education in West Pittston borough
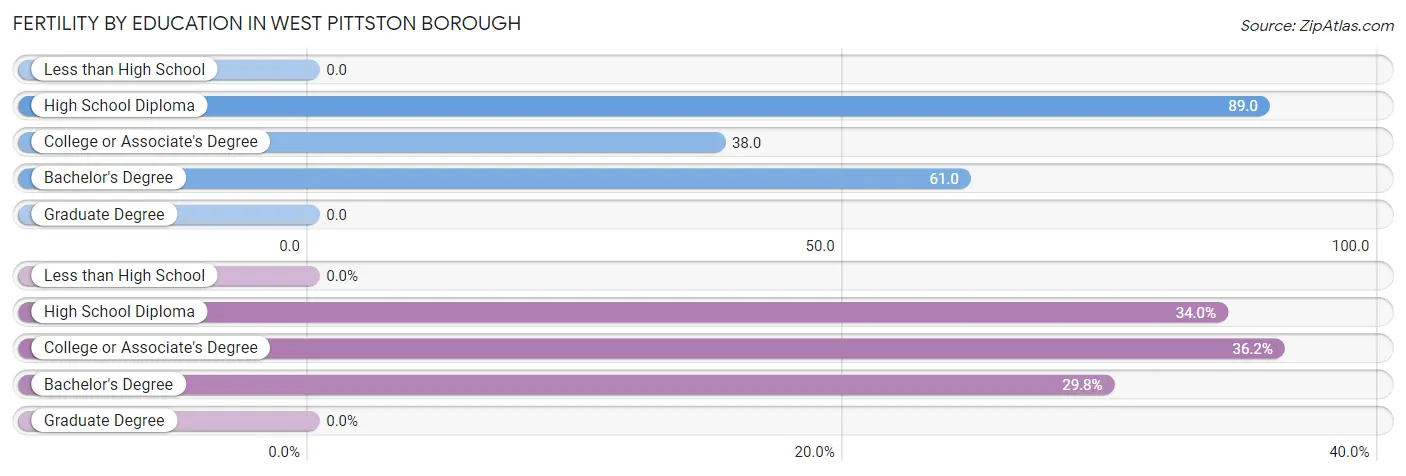
| Educational Attainment | Women with Births | Births / 1,000 Women |
| Less than High School | 0 (0.0%) | 0.0 |
| High School Diploma | 16 (34.0%) | 89.0 |
| College or Associate's Degree | 17 (36.2%) | 38.0 |
| Bachelor's Degree | 14 (29.8%) | 61.0 |
| Graduate Degree | 0 (0.0%) | 0.0 |
| Total | 47 (100.0%) | 41.0 |
Fertility by Education by Marriage Status in West Pittston borough
63.8% of women with births in West Pittston borough are unmarried. Women with the educational attainment of college or associate's degree are most likely to be married with 100.0% of them married at childbirth, while women with the educational attainment of high school diploma are least likely to be married with 100.0% of them unmarried at childbirth.
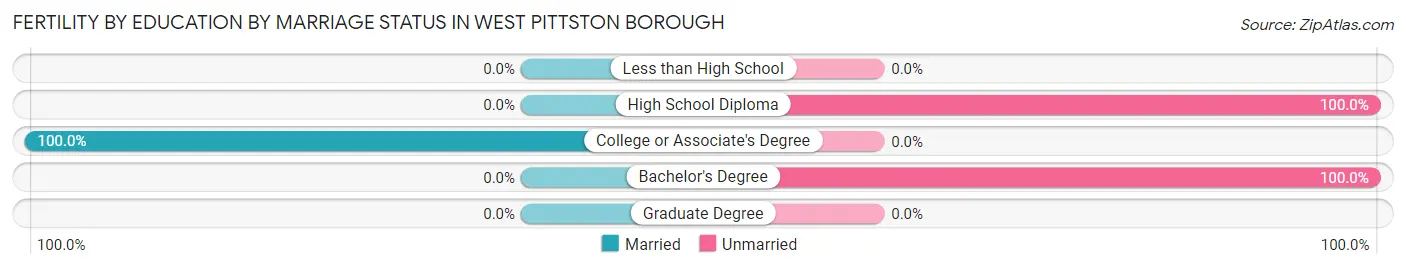
| Educational Attainment | Married | Unmarried |
| Less than High School | 0 (0.0%) | 0 (0.0%) |
| High School Diploma | 0 (0.0%) | 16 (100.0%) |
| College or Associate's Degree | 17 (100.0%) | 0 (0.0%) |
| Bachelor's Degree | 0 (0.0%) | 14 (100.0%) |
| Graduate Degree | 0 (0.0%) | 0 (0.0%) |
| Total | 17 (36.2%) | 30 (63.8%) |
Income in West Pittston borough
Income Overview in West Pittston borough
Per Capita Income in West Pittston borough is $34,768, while median incomes of families and households are $69,951 and $59,498 respectively.
| Characteristic | Number | Measure |
| Per Capita Income | 4,664 | $34,768 |
| Median Family Income | 1,274 | $69,951 |
| Mean Family Income | 1,274 | $88,430 |
| Median Household Income | 2,133 | $59,498 |
| Mean Household Income | 2,133 | $73,694 |
| Income Deficit | 1,274 | $0 |
| Wage / Income Gap (%) | 4,664 | 19.59% |
| Wage / Income Gap ($) | 4,664 | 80.41¢ per $1 |
| Gini / Inequality Index | 4,664 | 0.41 |
Earnings by Sex in West Pittston borough
Average Earnings in West Pittston borough are $42,024, $46,324 for men and $37,250 for women, a difference of 19.6%.
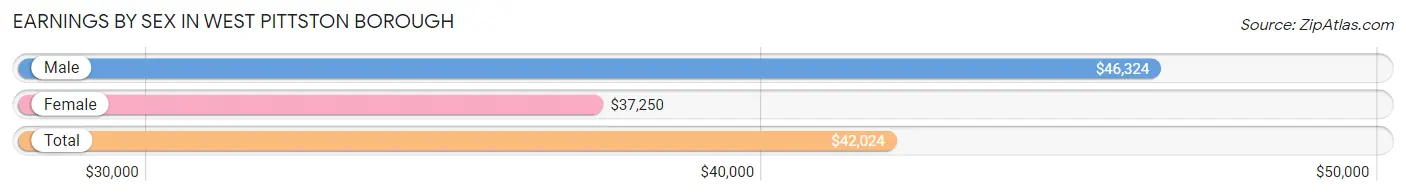
| Sex | Number | Average Earnings |
| Male | 1,278 (48.1%) | $46,324 |
| Female | 1,381 (51.9%) | $37,250 |
| Total | 2,659 (100.0%) | $42,024 |
Earnings by Sex by Income Bracket in West Pittston borough
The most common earnings brackets in West Pittston borough are $75,000 to $99,999 for men (262 | 20.5%) and $45,000 to $49,999 for women (225 | 16.3%).
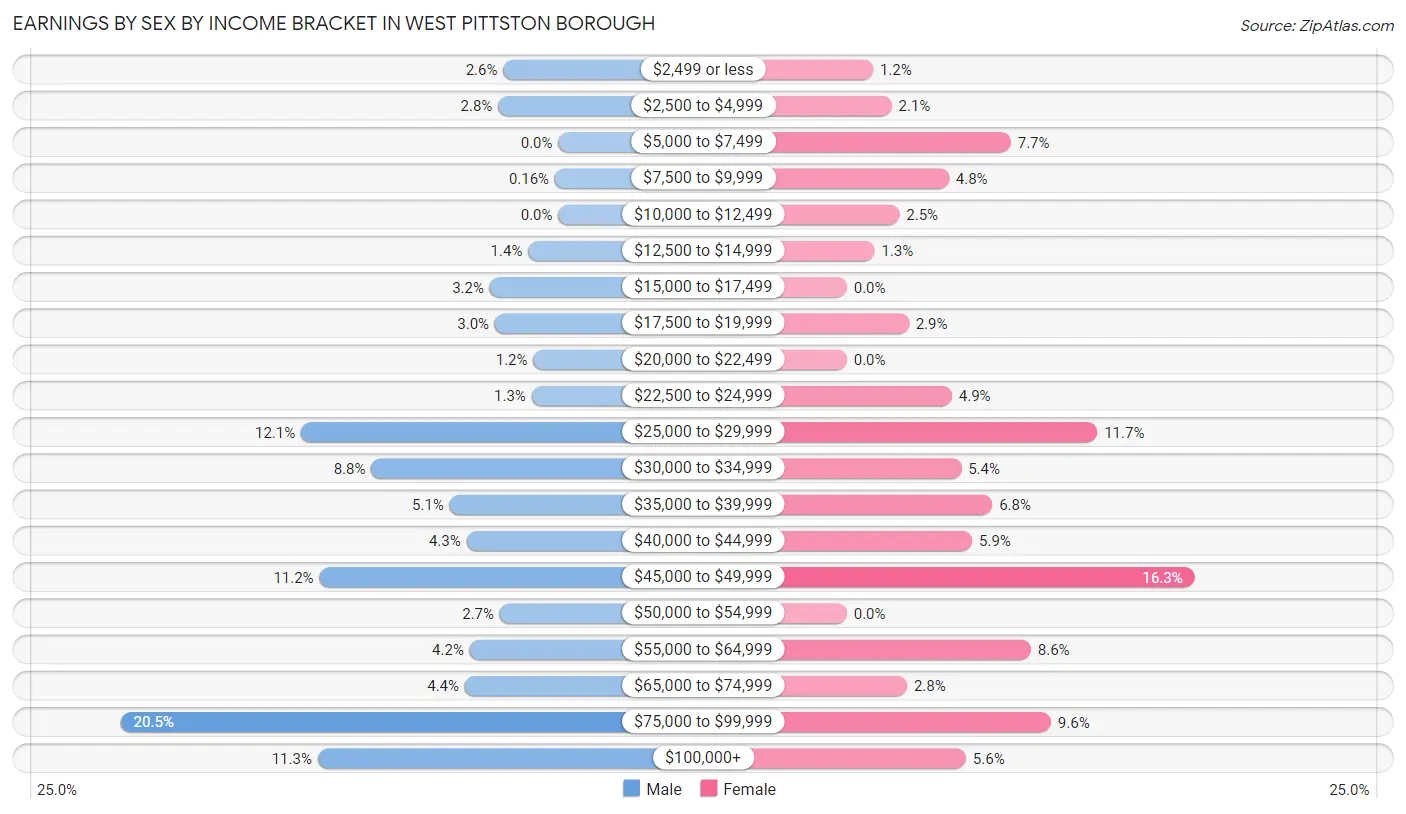
| Income | Male | Female |
| $2,499 or less | 33 (2.6%) | 17 (1.2%) |
| $2,500 to $4,999 | 36 (2.8%) | 29 (2.1%) |
| $5,000 to $7,499 | 0 (0.0%) | 106 (7.7%) |
| $7,500 to $9,999 | 2 (0.2%) | 66 (4.8%) |
| $10,000 to $12,499 | 0 (0.0%) | 34 (2.5%) |
| $12,500 to $14,999 | 18 (1.4%) | 18 (1.3%) |
| $15,000 to $17,499 | 41 (3.2%) | 0 (0.0%) |
| $17,500 to $19,999 | 38 (3.0%) | 40 (2.9%) |
| $20,000 to $22,499 | 15 (1.2%) | 0 (0.0%) |
| $22,500 to $24,999 | 16 (1.3%) | 68 (4.9%) |
| $25,000 to $29,999 | 154 (12.0%) | 162 (11.7%) |
| $30,000 to $34,999 | 112 (8.8%) | 74 (5.4%) |
| $35,000 to $39,999 | 65 (5.1%) | 94 (6.8%) |
| $40,000 to $44,999 | 55 (4.3%) | 81 (5.9%) |
| $45,000 to $49,999 | 143 (11.2%) | 225 (16.3%) |
| $50,000 to $54,999 | 35 (2.7%) | 0 (0.0%) |
| $55,000 to $64,999 | 53 (4.2%) | 119 (8.6%) |
| $65,000 to $74,999 | 56 (4.4%) | 39 (2.8%) |
| $75,000 to $99,999 | 262 (20.5%) | 132 (9.6%) |
| $100,000+ | 144 (11.3%) | 77 (5.6%) |
| Total | 1,278 (100.0%) | 1,381 (100.0%) |
Earnings by Sex by Educational Attainment in West Pittston borough
Average earnings in West Pittston borough are $50,929 for men and $41,574 for women, a difference of 18.4%. Men with an educational attainment of graduate degree enjoy the highest average annual earnings of $86,489, while those with high school diploma education earn the least with $41,953. Women with an educational attainment of bachelor's degree earn the most with the average annual earnings of $49,583, while those with high school diploma education have the smallest earnings of $31,371.
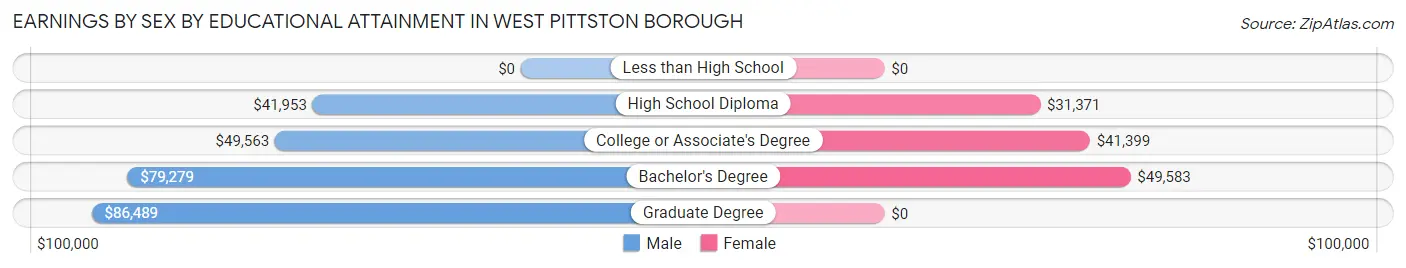
| Educational Attainment | Male Income | Female Income |
| Less than High School | - | - |
| High School Diploma | $41,953 | $31,371 |
| College or Associate's Degree | $49,563 | $41,399 |
| Bachelor's Degree | $79,279 | $49,583 |
| Graduate Degree | $86,489 | $0 |
| Total | $50,929 | $41,574 |
Family Income in West Pittston borough
Family Income Brackets in West Pittston borough
According to the West Pittston borough family income data, there are 372 families falling into the $50,000 to $74,999 income range, which is the most common income bracket and makes up 29.2% of all families.
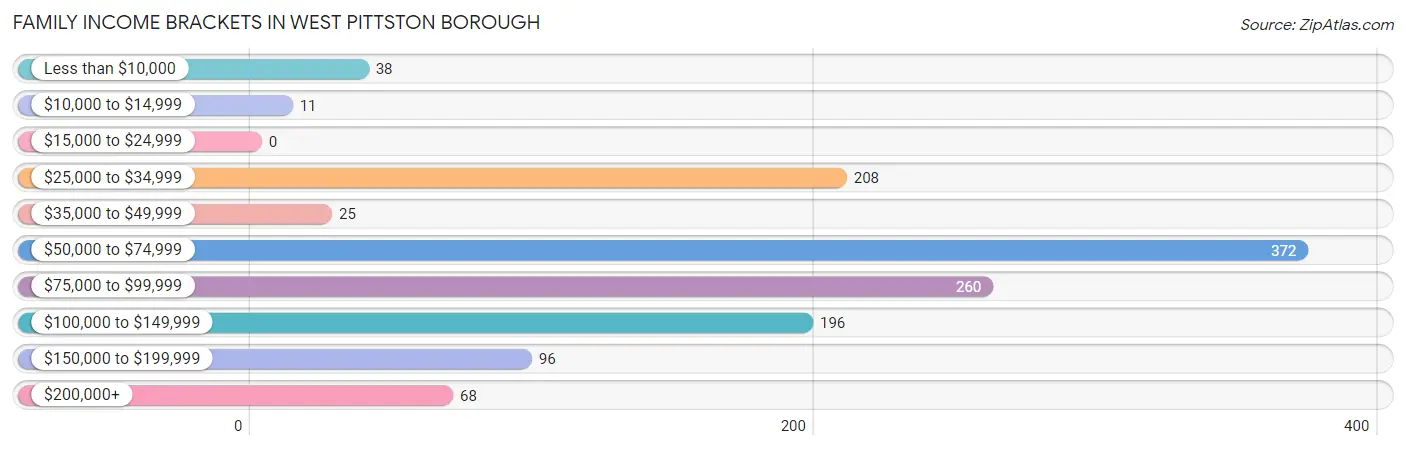
| Income Bracket | # Families | % Families |
| Less than $10,000 | 38 | 3.0% |
| $10,000 to $14,999 | 11 | 0.9% |
| $15,000 to $24,999 | 0 | 0.0% |
| $25,000 to $34,999 | 208 | 16.3% |
| $35,000 to $49,999 | 25 | 2.0% |
| $50,000 to $74,999 | 372 | 29.2% |
| $75,000 to $99,999 | 260 | 20.4% |
| $100,000 to $149,999 | 196 | 15.4% |
| $150,000 to $199,999 | 96 | 7.5% |
| $200,000+ | 68 | 5.3% |
Family Income by Famaliy Size in West Pittston borough
5-person families (32 | 2.5%) account for the highest median family income in West Pittston borough with $171,500 per family, while 5-person families (32 | 2.5%) have the highest median income of $34,300 per family member.
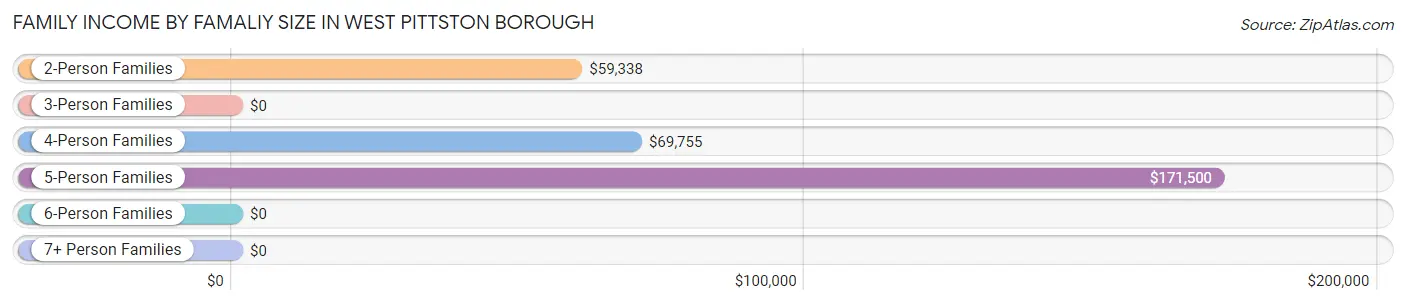
| Income Bracket | # Families | Median Income |
| 2-Person Families | 652 (51.2%) | $59,338 |
| 3-Person Families | 230 (18.0%) | $0 |
| 4-Person Families | 320 (25.1%) | $69,755 |
| 5-Person Families | 32 (2.5%) | $171,500 |
| 6-Person Families | 10 (0.8%) | $0 |
| 7+ Person Families | 30 (2.4%) | $0 |
| Total | 1,274 (100.0%) | $69,951 |
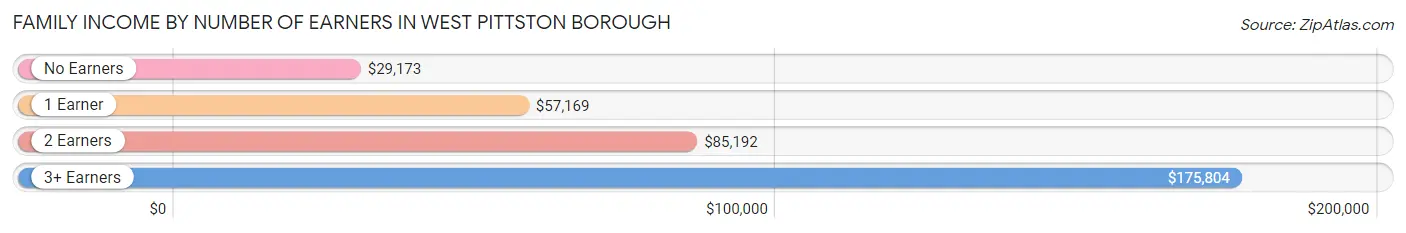
Family Income by Number of Earners in West Pittston borough
The median family income in West Pittston borough is $69,951, with families comprising 3+ earners (135) having the highest median family income of $175,804, while families with no earners (183) have the lowest median family income of $29,173, accounting for 10.6% and 14.4% of families, respectively.
| Number of Earners | # Families | Median Income |
| No Earners | 183 (14.4%) | $29,173 |
| 1 Earner | 402 (31.6%) | $57,169 |
| 2 Earners | 554 (43.5%) | $85,192 |
| 3+ Earners | 135 (10.6%) | $175,804 |
| Total | 1,274 (100.0%) | $69,951 |
Household Income in West Pittston borough
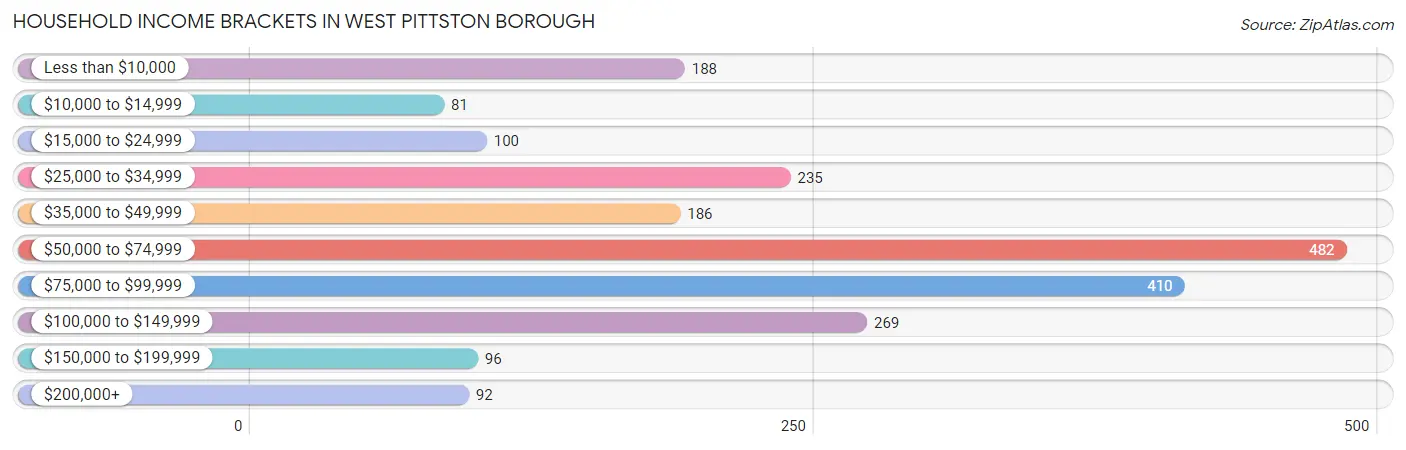
Household Income Brackets in West Pittston borough
With 482 households falling in the category, the $50,000 to $74,999 income range is the most frequent in West Pittston borough, accounting for 22.6% of all households. In contrast, only 81 households (3.8%) fall into the $10,000 to $14,999 income bracket, making it the least populous group.
| Income Bracket | # Households | % Households |
| Less than $10,000 | 188 | 8.8% |
| $10,000 to $14,999 | 81 | 3.8% |
| $15,000 to $24,999 | 100 | 4.7% |
| $25,000 to $34,999 | 235 | 11.0% |
| $35,000 to $49,999 | 186 | 8.7% |
| $50,000 to $74,999 | 482 | 22.6% |
| $75,000 to $99,999 | 410 | 19.2% |
| $100,000 to $149,999 | 269 | 12.6% |
| $150,000 to $199,999 | 96 | 4.5% |
| $200,000+ | 92 | 4.3% |
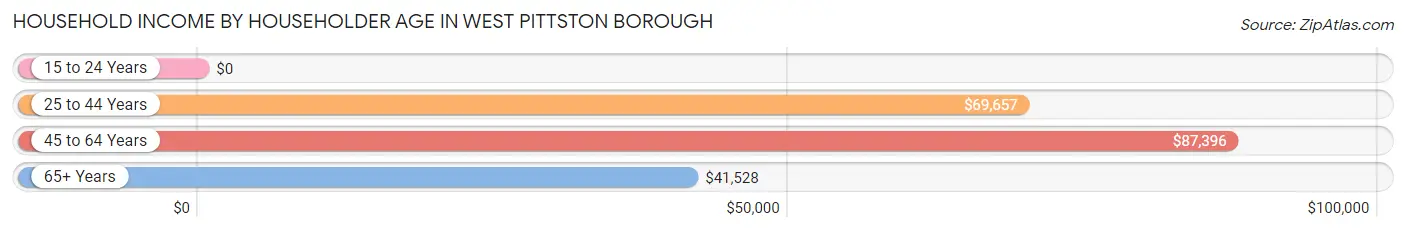
Household Income by Householder Age in West Pittston borough
The median household income in West Pittston borough is $59,498, with the highest median household income of $87,396 found in the 45 to 64 years age bracket for the primary householder. A total of 772 households (36.2%) fall into this category. Meanwhile, the 15 to 24 years age bracket for the primary householder has the lowest median household income of $0, with 134 households (6.3%) in this group.
| Income Bracket | # Households | Median Income |
| 15 to 24 Years | 134 (6.3%) | $0 |
| 25 to 44 Years | 644 (30.2%) | $69,657 |
| 45 to 64 Years | 772 (36.2%) | $87,396 |
| 65+ Years | 583 (27.3%) | $41,528 |
| Total | 2,133 (100.0%) | $59,498 |
Poverty in West Pittston borough
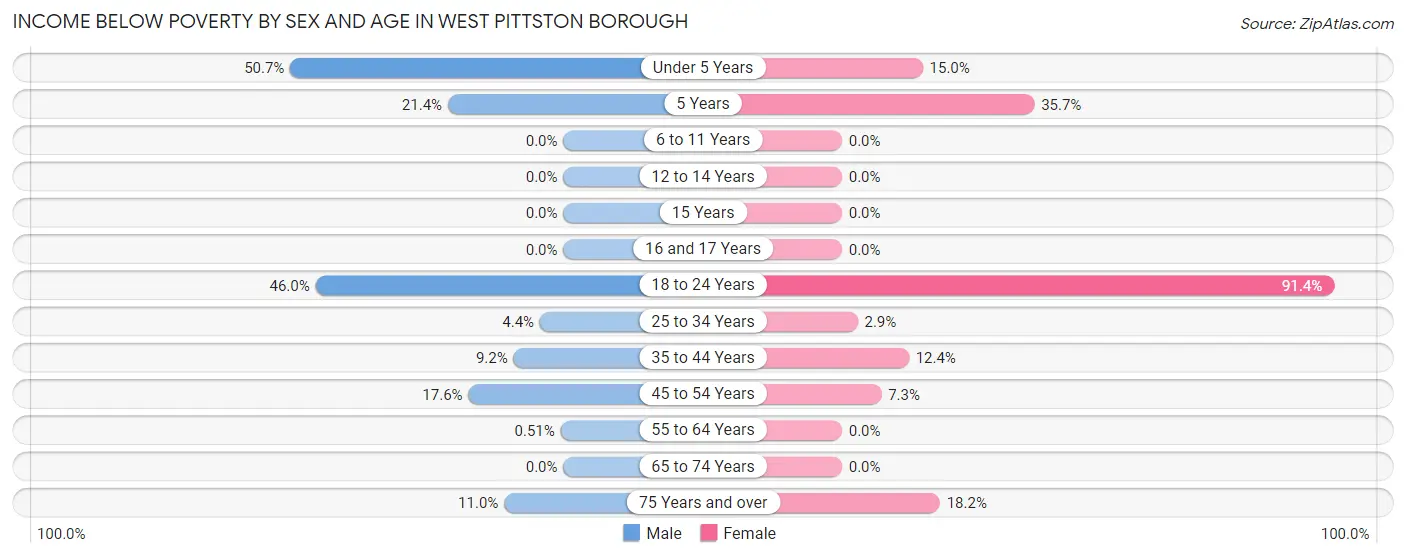
Income Below Poverty by Sex and Age in West Pittston borough
With 14.7% poverty level for males and 12.8% for females among the residents of West Pittston borough, under 5 year old males and 18 to 24 year old females are the most vulnerable to poverty, with 109 males (50.7%) and 159 females (91.4%) in their respective age groups living below the poverty level.
| Age Bracket | Male | Female |
| Under 5 Years | 109 (50.7%) | 12 (15.0%) |
| 5 Years | 15 (21.4%) | 10 (35.7%) |
| 6 to 11 Years | 0 (0.0%) | 0 (0.0%) |
| 12 to 14 Years | 0 (0.0%) | 0 (0.0%) |
| 15 Years | 0 (0.0%) | 0 (0.0%) |
| 16 and 17 Years | 0 (0.0%) | 0 (0.0%) |
| 18 to 24 Years | 92 (46.0%) | 159 (91.4%) |
| 25 to 34 Years | 11 (4.3%) | 12 (2.9%) |
| 35 to 44 Years | 28 (9.2%) | 38 (12.4%) |
| 45 to 54 Years | 77 (17.6%) | 24 (7.3%) |
| 55 to 64 Years | 1 (0.5%) | 0 (0.0%) |
| 65 to 74 Years | 0 (0.0%) | 0 (0.0%) |
| 75 Years and over | 10 (11.0%) | 40 (18.2%) |
| Total | 343 (14.7%) | 295 (12.8%) |
Income Above Poverty by Sex and Age in West Pittston borough
According to the poverty statistics in West Pittston borough, males aged 6 to 11 years and females aged 6 to 11 years are the age groups that are most secure financially, with 100.0% of males and 100.0% of females in these age groups living above the poverty line.
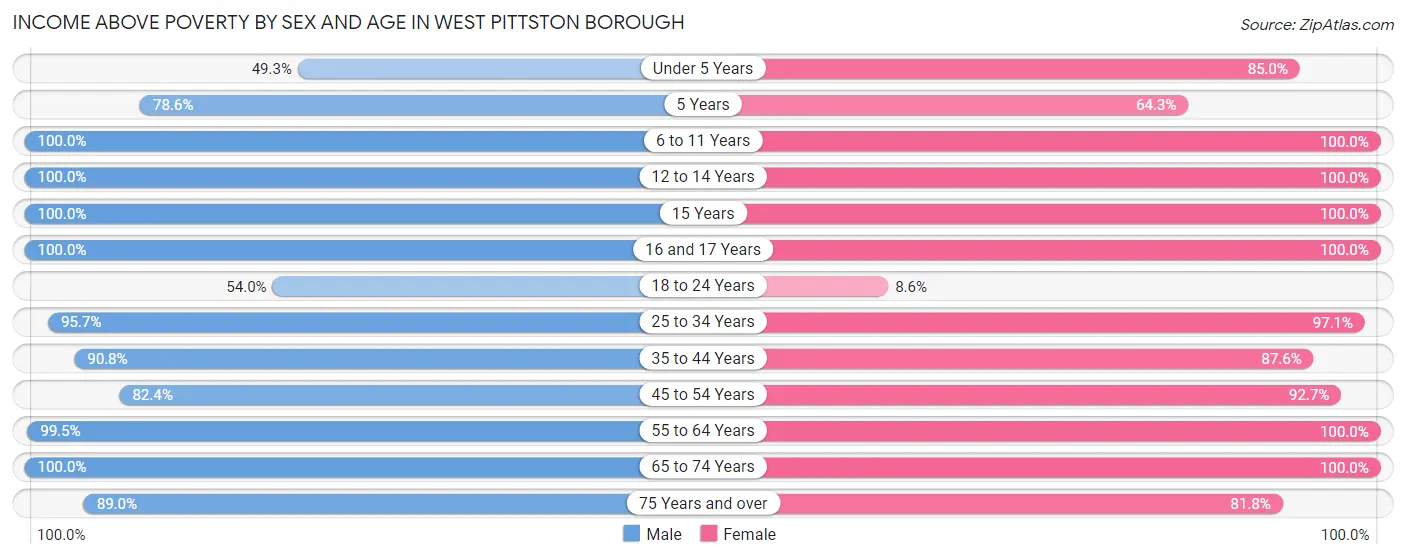
| Age Bracket | Male | Female |
| Under 5 Years | 106 (49.3%) | 68 (85.0%) |
| 5 Years | 55 (78.6%) | 18 (64.3%) |
| 6 to 11 Years | 130 (100.0%) | 105 (100.0%) |
| 12 to 14 Years | 50 (100.0%) | 74 (100.0%) |
| 15 Years | 39 (100.0%) | 24 (100.0%) |
| 16 and 17 Years | 56 (100.0%) | 36 (100.0%) |
| 18 to 24 Years | 108 (54.0%) | 15 (8.6%) |
| 25 to 34 Years | 242 (95.7%) | 399 (97.1%) |
| 35 to 44 Years | 275 (90.8%) | 268 (87.6%) |
| 45 to 54 Years | 360 (82.4%) | 304 (92.7%) |
| 55 to 64 Years | 195 (99.5%) | 247 (100.0%) |
| 65 to 74 Years | 300 (100.0%) | 271 (100.0%) |
| 75 Years and over | 81 (89.0%) | 180 (81.8%) |
| Total | 1,997 (85.3%) | 2,009 (87.2%) |
Income Below Poverty Among Married-Couple Families in West Pittston borough
The poverty statistics for married-couple families in West Pittston borough show that 10.0% or 103 of the total 1,029 families live below the poverty line. Families with 1 or 2 children have the highest poverty rate of 26.6%, comprising of 103 families. On the other hand, families with no children have the lowest poverty rate of 0.0%, which includes 0 families.
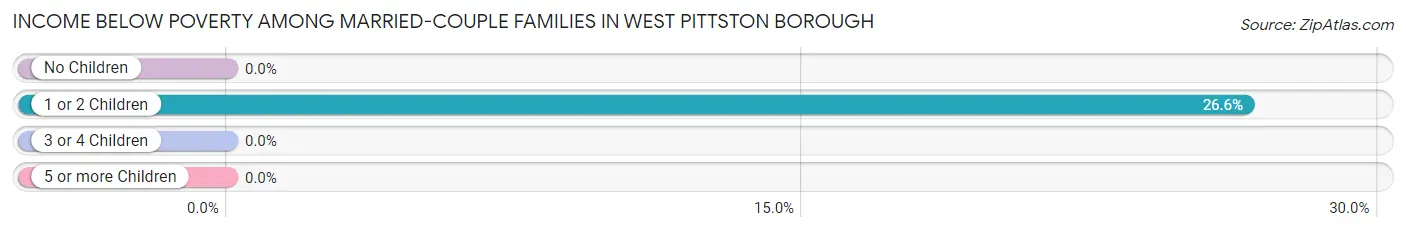
| Children | Above Poverty | Below Poverty |
| No Children | 601 (100.0%) | 0 (0.0%) |
| 1 or 2 Children | 285 (73.5%) | 103 (26.6%) |
| 3 or 4 Children | 29 (100.0%) | 0 (0.0%) |
| 5 or more Children | 11 (100.0%) | 0 (0.0%) |
| Total | 926 (90.0%) | 103 (10.0%) |
Income Below Poverty Among Single-Parent Households in West Pittston borough
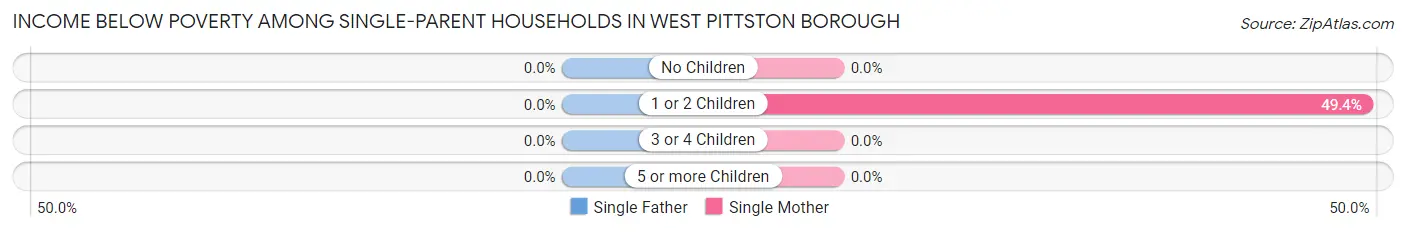
| Children | Single Father | Single Mother |
| No Children | 0 (0.0%) | 0 (0.0%) |
| 1 or 2 Children | 0 (0.0%) | 38 (49.3%) |
| 3 or 4 Children | 0 (0.0%) | 0 (0.0%) |
| 5 or more Children | 0 (0.0%) | 0 (0.0%) |
| Total | 0 (0.0%) | 38 (19.3%) |
Income Below Poverty Among Married-Couple vs Single-Parent Households in West Pittston borough
The poverty data for West Pittston borough shows that 103 of the married-couple family households (10.0%) and 38 of the single-parent households (15.5%) are living below the poverty level. Within the married-couple family households, those with 1 or 2 children have the highest poverty rate, with 103 households (26.6%) falling below the poverty line. Among the single-parent households, those with 1 or 2 children have the highest poverty rate, with 38 household (30.4%) living below poverty.
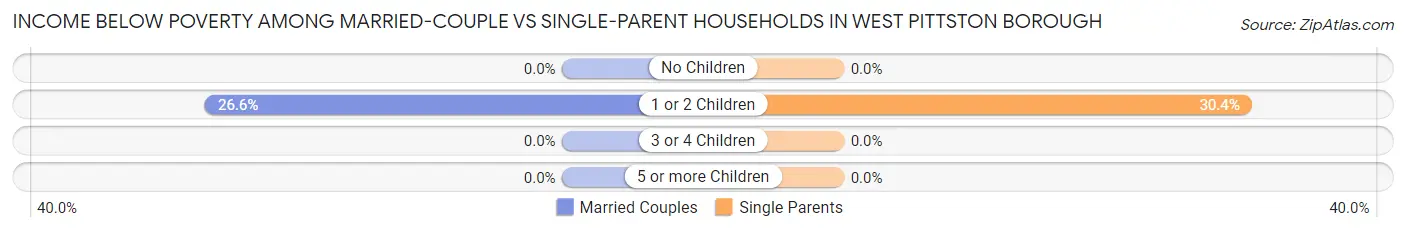
| Children | Married-Couple Families | Single-Parent Households |
| No Children | 0 (0.0%) | 0 (0.0%) |
| 1 or 2 Children | 103 (26.6%) | 38 (30.4%) |
| 3 or 4 Children | 0 (0.0%) | 0 (0.0%) |
| 5 or more Children | 0 (0.0%) | 0 (0.0%) |
| Total | 103 (10.0%) | 38 (15.5%) |
Employment Characteristics in West Pittston borough
Employment by Class of Employer in West Pittston borough
Among the 2,575 employed individuals in West Pittston borough, private company employees (1,889 | 73.4%), local government employees (191 | 7.4%), and self-employed (not incorporated) (164 | 6.4%) make up the most common classes of employment.
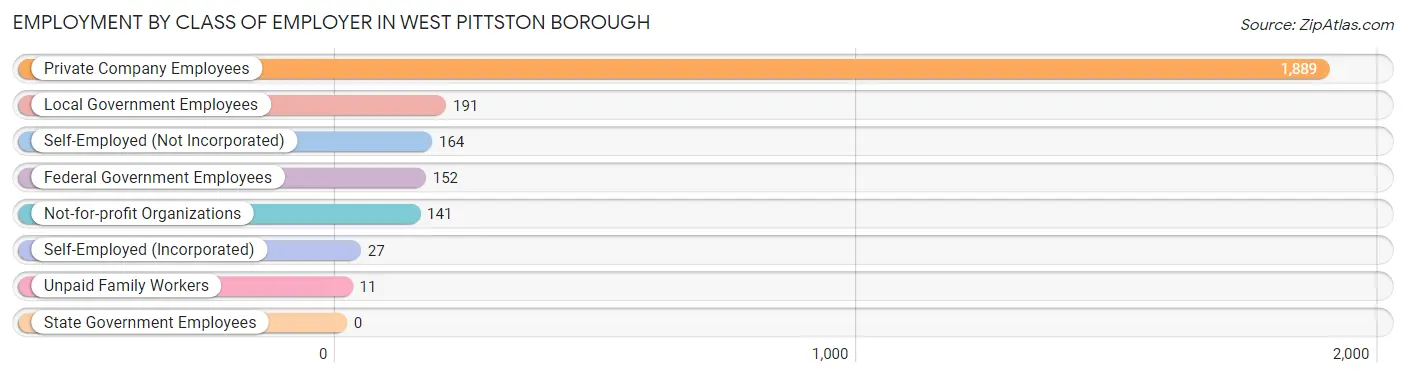
| Employer Class | # Employees | % Employees |
| Private Company Employees | 1,889 | 73.4% |
| Self-Employed (Incorporated) | 27 | 1.1% |
| Self-Employed (Not Incorporated) | 164 | 6.4% |
| Not-for-profit Organizations | 141 | 5.5% |
| Local Government Employees | 191 | 7.4% |
| State Government Employees | 0 | 0.0% |
| Federal Government Employees | 152 | 5.9% |
| Unpaid Family Workers | 11 | 0.4% |
| Total | 2,575 | 100.0% |
Employment Status by Age in West Pittston borough
According to the labor force statistics for West Pittston borough, out of the total population over 16 years of age (3,829), 68.9% or 2,638 individuals are in the labor force, with 2.0% or 53 of them unemployed. The age group with the highest labor force participation rate is 16 to 19 years, with 100.0% or 151 individuals in the labor force. Within the labor force, the 25 to 29 years age range has the highest percentage of unemployed individuals, with 22.2% or 28 of them being unemployed.
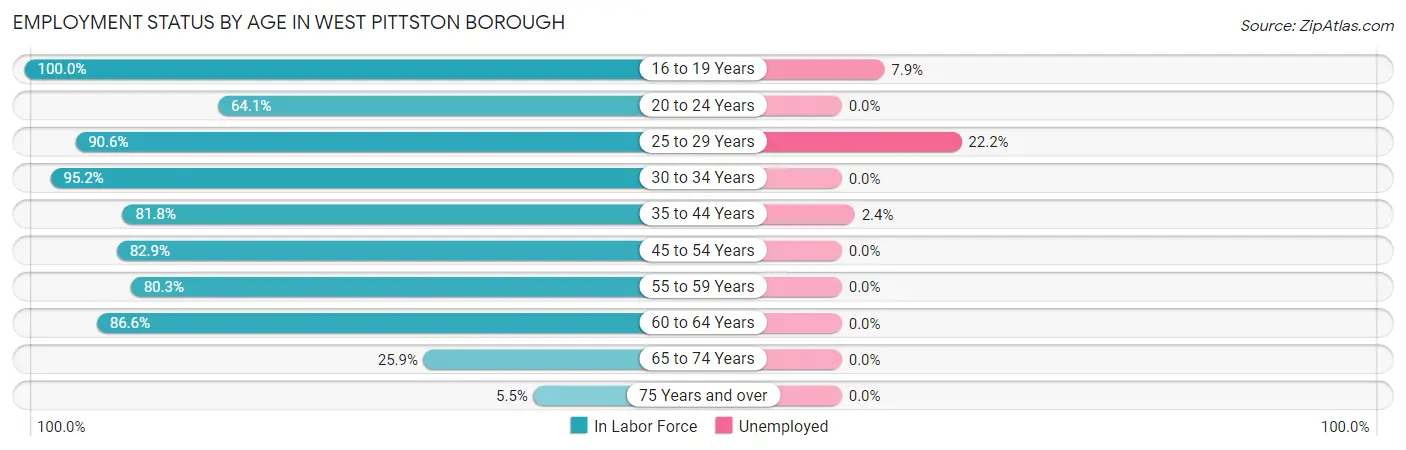
| Age Bracket | In Labor Force | Unemployed |
| 16 to 19 Years | 151 (100.0%) | 12 (7.9%) |
| 20 to 24 Years | 202 (64.1%) | 0 (0.0%) |
| 25 to 29 Years | 126 (90.6%) | 28 (22.2%) |
| 30 to 34 Years | 500 (95.2%) | 0 (0.0%) |
| 35 to 44 Years | 498 (81.8%) | 12 (2.4%) |
| 45 to 54 Years | 634 (82.9%) | 0 (0.0%) |
| 55 to 59 Years | 248 (80.3%) | 0 (0.0%) |
| 60 to 64 Years | 116 (86.6%) | 0 (0.0%) |
| 65 to 74 Years | 148 (25.9%) | 0 (0.0%) |
| 75 Years and over | 17 (5.5%) | 0 (0.0%) |
| Total | 2,638 (68.9%) | 53 (2.0%) |
Employment Status by Educational Attainment in West Pittston borough
According to labor force statistics for West Pittston borough, 85.5% of individuals (2,121) out of the total population between 25 and 64 years of age (2,481) are in the labor force, with 1.9% or 40 of them being unemployed. The group with the highest labor force participation rate are those with the educational attainment of college / associate degree, with 92.5% or 800 individuals in the labor force. Within the labor force, individuals with less than high school education have the highest percentage of unemployment, with 100.0% or 12 of them being unemployed.
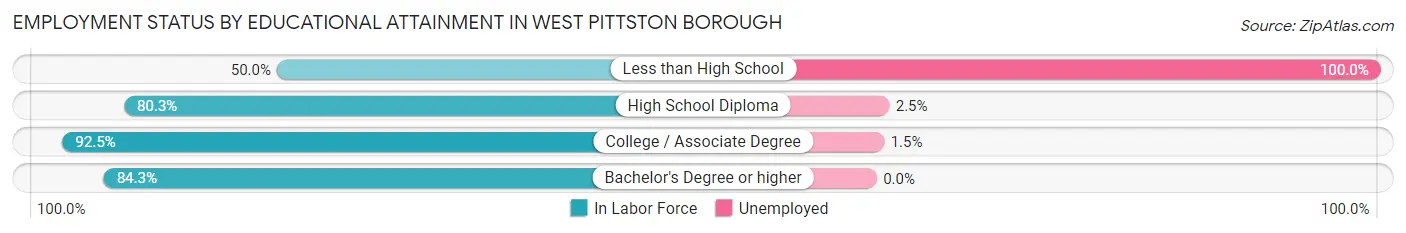
| Educational Attainment | In Labor Force | Unemployed |
| Less than High School | 12 (50.0%) | 24 (100.0%) |
| High School Diploma | 630 (80.3%) | 20 (2.5%) |
| College / Associate Degree | 800 (92.5%) | 13 (1.5%) |
| Bachelor's Degree or higher | 680 (84.3%) | 0 (0.0%) |
| Total | 2,121 (85.5%) | 47 (1.9%) |
Employment Occupations by Sex in West Pittston borough
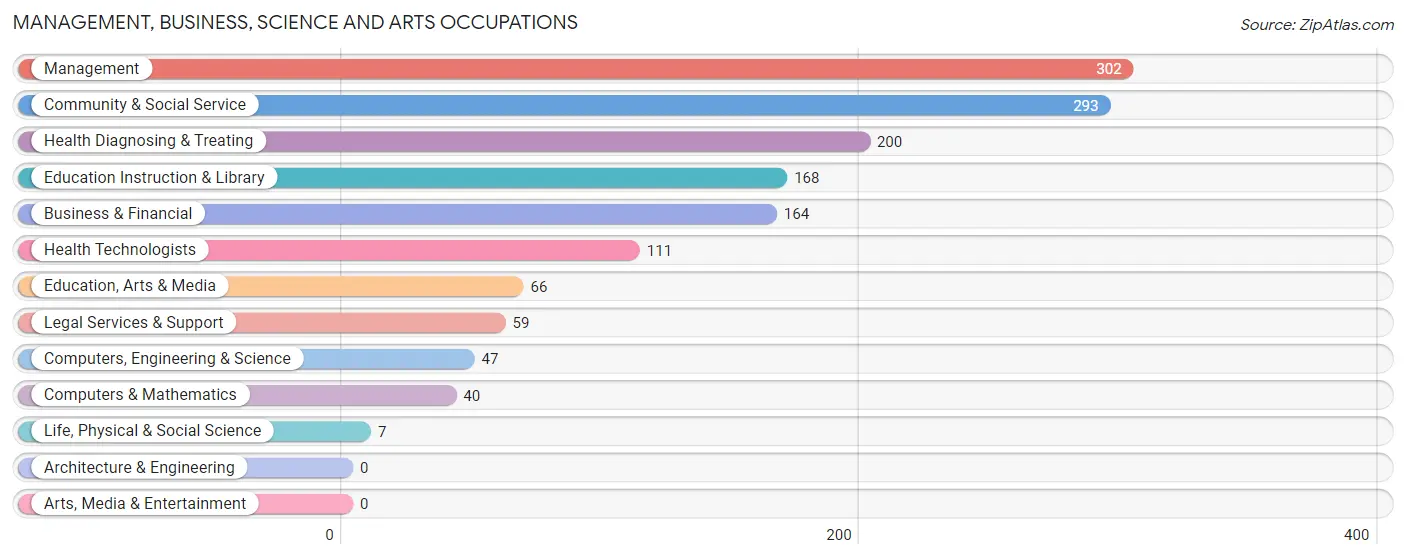
Management, Business, Science and Arts Occupations
The most common Management, Business, Science and Arts occupations in West Pittston borough are Management (302 | 11.7%), Community & Social Service (293 | 11.3%), Health Diagnosing & Treating (200 | 7.7%), Education Instruction & Library (168 | 6.5%), and Business & Financial (164 | 6.3%).
Management, Business, Science and Arts Occupations by Sex
Within the Management, Business, Science and Arts occupations in West Pittston borough, the most male-oriented occupations are Life, Physical & Social Science (100.0%), Legal Services & Support (100.0%), and Education, Arts & Media (86.4%), while the most female-oriented occupations are Health Technologists (89.2%), Education Instruction & Library (86.3%), and Health Diagnosing & Treating (76.5%).
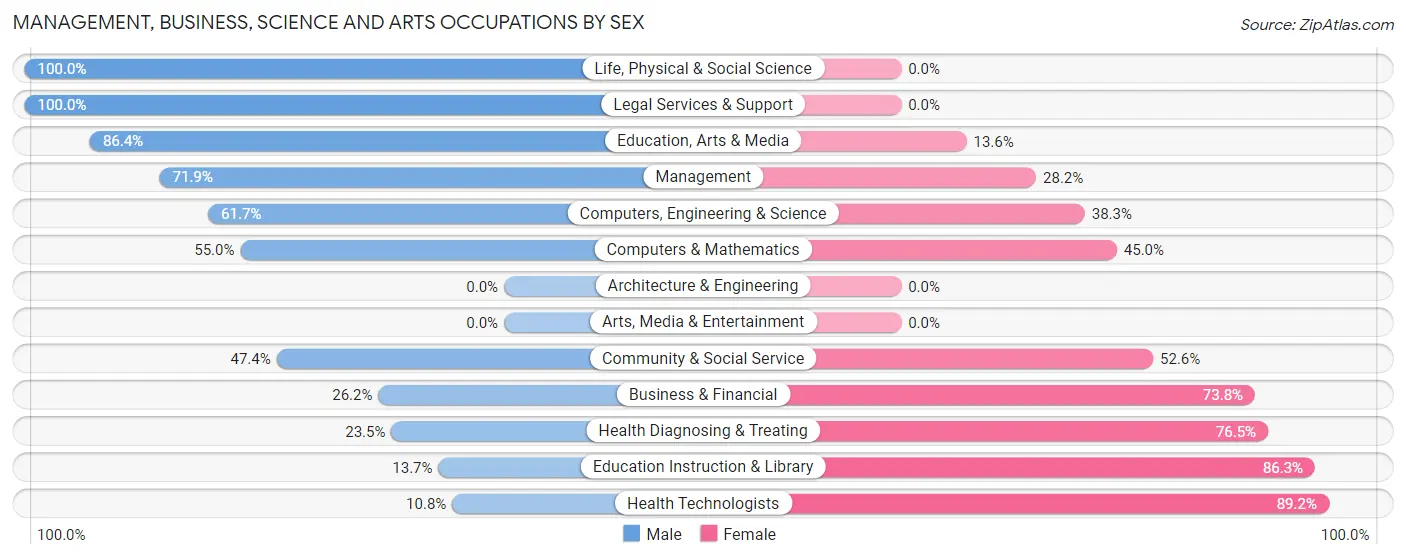
| Occupation | Male | Female |
| Management | 217 (71.9%) | 85 (28.1%) |
| Business & Financial | 43 (26.2%) | 121 (73.8%) |
| Computers, Engineering & Science | 29 (61.7%) | 18 (38.3%) |
| Computers & Mathematics | 22 (55.0%) | 18 (45.0%) |
| Architecture & Engineering | 0 (0.0%) | 0 (0.0%) |
| Life, Physical & Social Science | 7 (100.0%) | 0 (0.0%) |
| Community & Social Service | 139 (47.4%) | 154 (52.6%) |
| Education, Arts & Media | 57 (86.4%) | 9 (13.6%) |
| Legal Services & Support | 59 (100.0%) | 0 (0.0%) |
| Education Instruction & Library | 23 (13.7%) | 145 (86.3%) |
| Arts, Media & Entertainment | 0 (0.0%) | 0 (0.0%) |
| Health Diagnosing & Treating | 47 (23.5%) | 153 (76.5%) |
| Health Technologists | 12 (10.8%) | 99 (89.2%) |
| Total (Category) | 475 (47.2%) | 531 (52.8%) |
| Total (Overall) | 1,240 (47.9%) | 1,348 (52.1%) |
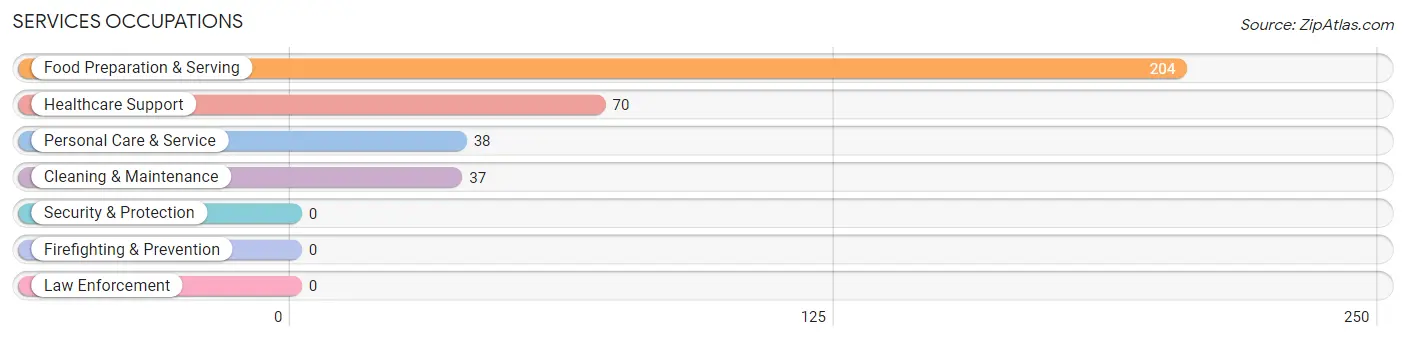
Services Occupations
The most common Services occupations in West Pittston borough are Food Preparation & Serving (204 | 7.9%), Healthcare Support (70 | 2.7%), Personal Care & Service (38 | 1.5%), and Cleaning & Maintenance (37 | 1.4%).
Services Occupations by Sex
Within the Services occupations in West Pittston borough, the most male-oriented occupations are Cleaning & Maintenance (54.0%), Personal Care & Service (39.5%), and Food Preparation & Serving (22.1%), while the most female-oriented occupations are Healthcare Support (100.0%), Food Preparation & Serving (77.9%), and Personal Care & Service (60.5%).
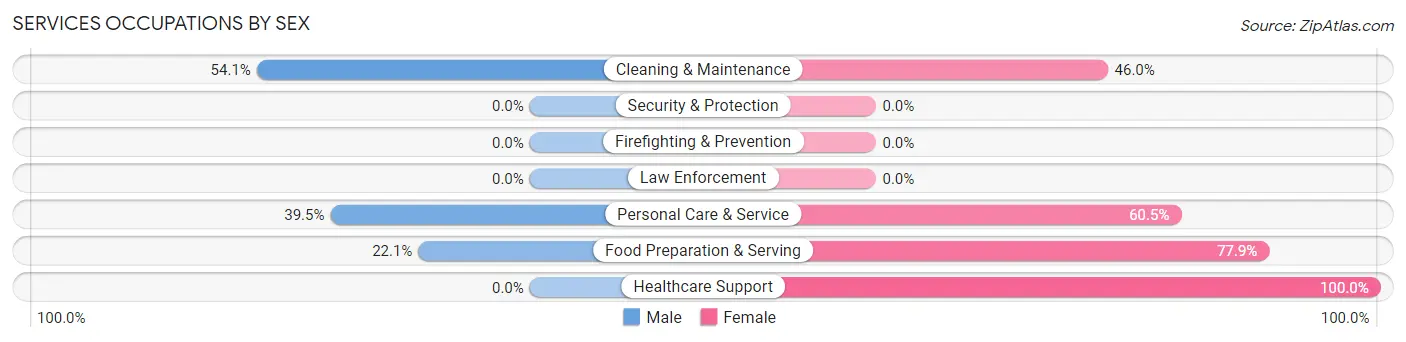
| Occupation | Male | Female |
| Healthcare Support | 0 (0.0%) | 70 (100.0%) |
| Security & Protection | 0 (0.0%) | 0 (0.0%) |
| Firefighting & Prevention | 0 (0.0%) | 0 (0.0%) |
| Law Enforcement | 0 (0.0%) | 0 (0.0%) |
| Food Preparation & Serving | 45 (22.1%) | 159 (77.9%) |
| Cleaning & Maintenance | 20 (54.0%) | 17 (46.0%) |
| Personal Care & Service | 15 (39.5%) | 23 (60.5%) |
| Total (Category) | 80 (22.9%) | 269 (77.1%) |
| Total (Overall) | 1,240 (47.9%) | 1,348 (52.1%) |
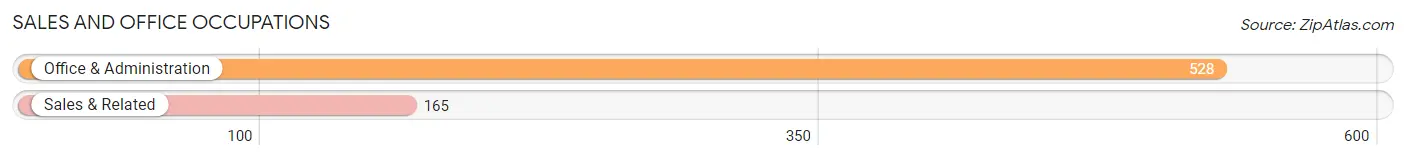
Sales and Office Occupations
The most common Sales and Office occupations in West Pittston borough are Office & Administration (528 | 20.4%), and Sales & Related (165 | 6.4%).
Sales and Office Occupations by Sex
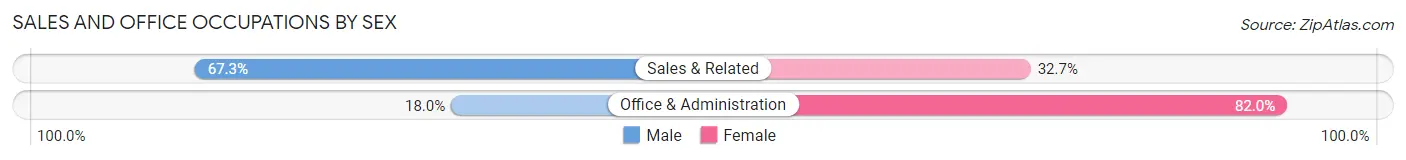
| Occupation | Male | Female |
| Sales & Related | 111 (67.3%) | 54 (32.7%) |
| Office & Administration | 95 (18.0%) | 433 (82.0%) |
| Total (Category) | 206 (29.7%) | 487 (70.3%) |
| Total (Overall) | 1,240 (47.9%) | 1,348 (52.1%) |
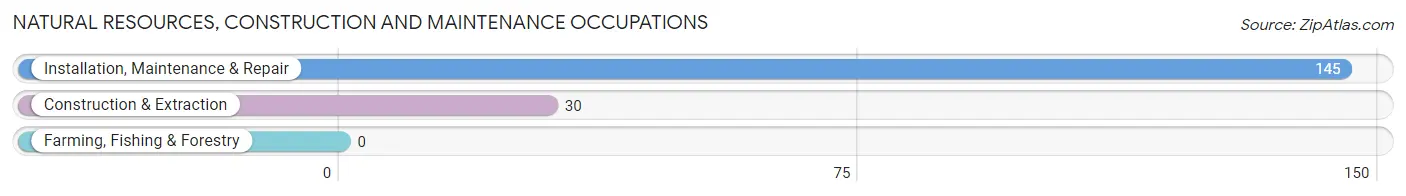
Natural Resources, Construction and Maintenance Occupations
The most common Natural Resources, Construction and Maintenance occupations in West Pittston borough are Installation, Maintenance & Repair (145 | 5.6%), and Construction & Extraction (30 | 1.2%).
Natural Resources, Construction and Maintenance Occupations by Sex
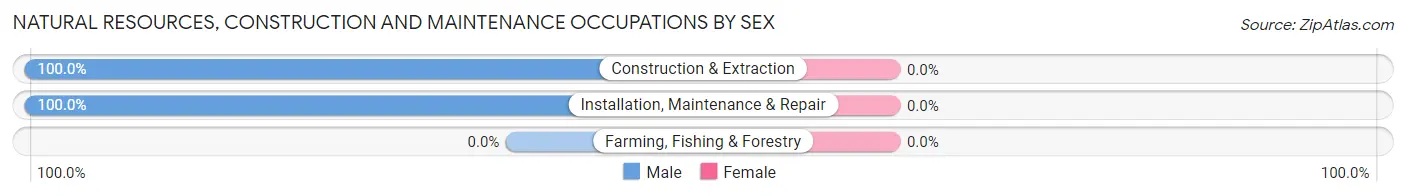
| Occupation | Male | Female |
| Farming, Fishing & Forestry | 0 (0.0%) | 0 (0.0%) |
| Construction & Extraction | 30 (100.0%) | 0 (0.0%) |
| Installation, Maintenance & Repair | 145 (100.0%) | 0 (0.0%) |
| Total (Category) | 175 (100.0%) | 0 (0.0%) |
| Total (Overall) | 1,240 (47.9%) | 1,348 (52.1%) |
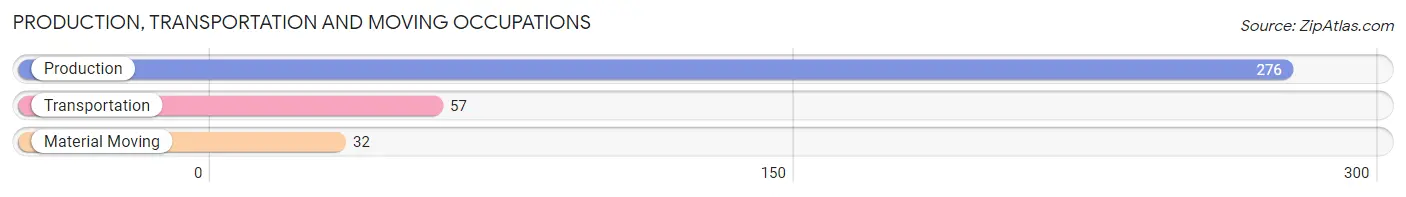
Production, Transportation and Moving Occupations
The most common Production, Transportation and Moving occupations in West Pittston borough are Production (276 | 10.7%), Transportation (57 | 2.2%), and Material Moving (32 | 1.2%).
Production, Transportation and Moving Occupations by Sex
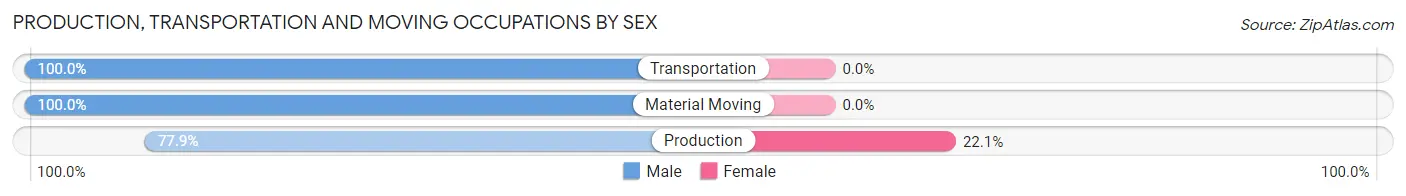
| Occupation | Male | Female |
| Production | 215 (77.9%) | 61 (22.1%) |
| Transportation | 57 (100.0%) | 0 (0.0%) |
| Material Moving | 32 (100.0%) | 0 (0.0%) |
| Total (Category) | 304 (83.3%) | 61 (16.7%) |
| Total (Overall) | 1,240 (47.9%) | 1,348 (52.1%) |
Employment Industries by Sex in West Pittston borough
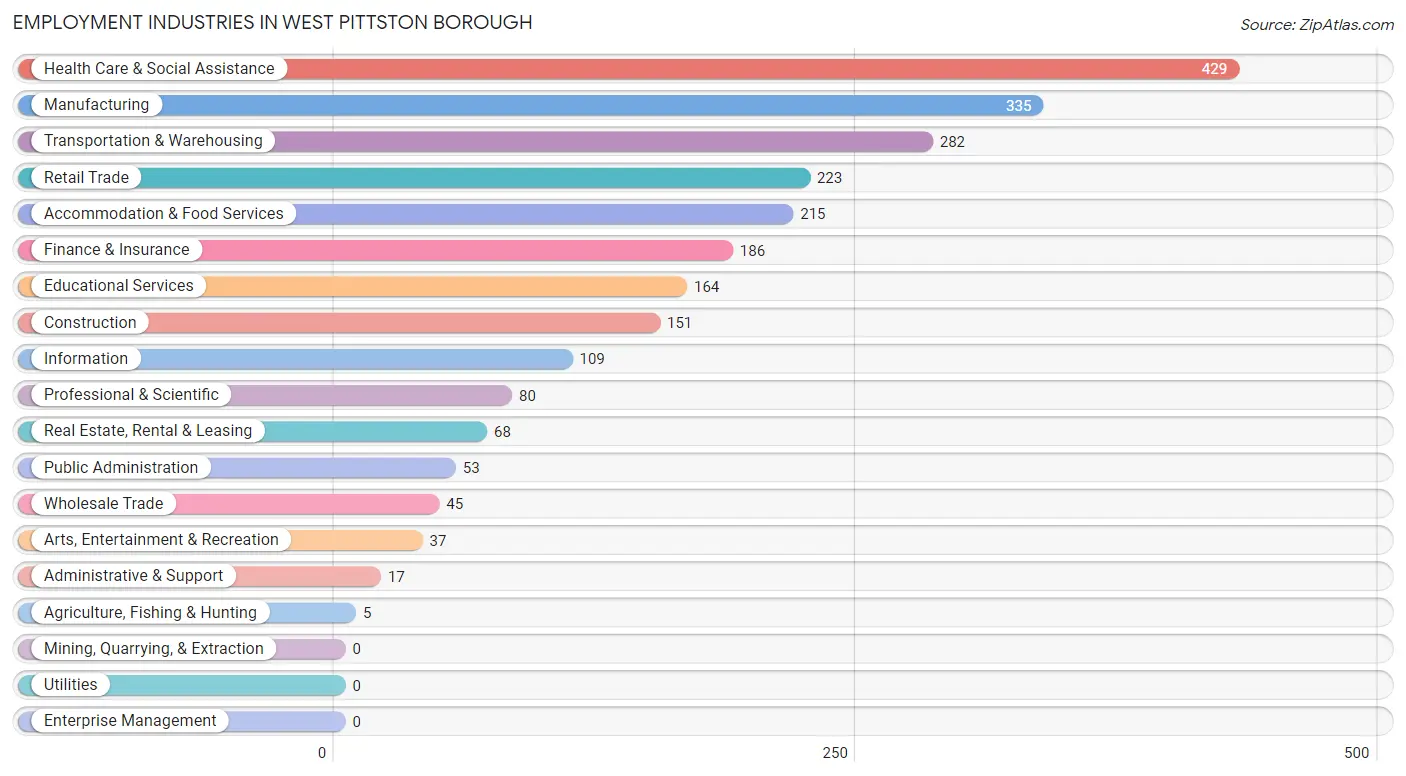
Employment Industries in West Pittston borough
The major employment industries in West Pittston borough include Health Care & Social Assistance (429 | 16.6%), Manufacturing (335 | 12.9%), Transportation & Warehousing (282 | 10.9%), Retail Trade (223 | 8.6%), and Accommodation & Food Services (215 | 8.3%).
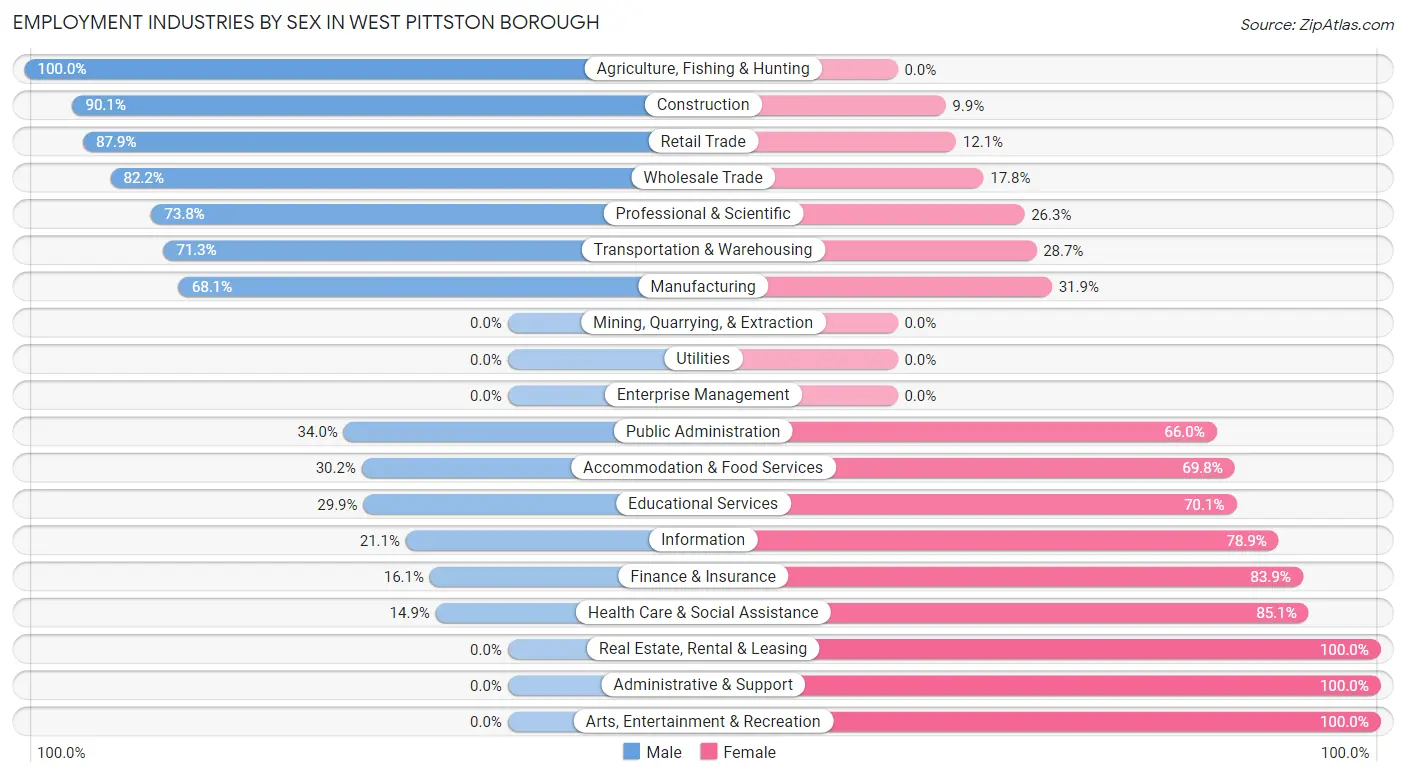
Employment Industries by Sex in West Pittston borough
The West Pittston borough industries that see more men than women are Agriculture, Fishing & Hunting (100.0%), Construction (90.1%), and Retail Trade (87.9%), whereas the industries that tend to have a higher number of women are Real Estate, Rental & Leasing (100.0%), Administrative & Support (100.0%), and Arts, Entertainment & Recreation (100.0%).
| Industry | Male | Female |
| Agriculture, Fishing & Hunting | 5 (100.0%) | 0 (0.0%) |
| Mining, Quarrying, & Extraction | 0 (0.0%) | 0 (0.0%) |
| Construction | 136 (90.1%) | 15 (9.9%) |
| Manufacturing | 228 (68.1%) | 107 (31.9%) |
| Wholesale Trade | 37 (82.2%) | 8 (17.8%) |
| Retail Trade | 196 (87.9%) | 27 (12.1%) |
| Transportation & Warehousing | 201 (71.3%) | 81 (28.7%) |
| Utilities | 0 (0.0%) | 0 (0.0%) |
| Information | 23 (21.1%) | 86 (78.9%) |
| Finance & Insurance | 30 (16.1%) | 156 (83.9%) |
| Real Estate, Rental & Leasing | 0 (0.0%) | 68 (100.0%) |
| Professional & Scientific | 59 (73.8%) | 21 (26.3%) |
| Enterprise Management | 0 (0.0%) | 0 (0.0%) |
| Administrative & Support | 0 (0.0%) | 17 (100.0%) |
| Educational Services | 49 (29.9%) | 115 (70.1%) |
| Health Care & Social Assistance | 64 (14.9%) | 365 (85.1%) |
| Arts, Entertainment & Recreation | 0 (0.0%) | 37 (100.0%) |
| Accommodation & Food Services | 65 (30.2%) | 150 (69.8%) |
| Public Administration | 18 (34.0%) | 35 (66.0%) |
| Total | 1,240 (47.9%) | 1,348 (52.1%) |
Education in West Pittston borough
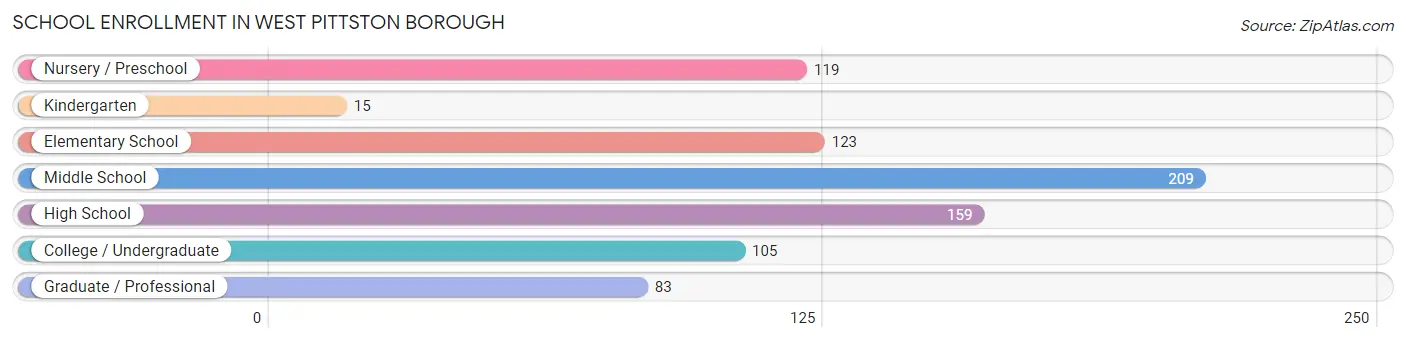
School Enrollment in West Pittston borough
The most common levels of schooling among the 813 students in West Pittston borough are middle school (209 | 25.7%), high school (159 | 19.6%), and elementary school (123 | 15.1%).
| School Level | # Students | % Students |
| Nursery / Preschool | 119 | 14.6% |
| Kindergarten | 15 | 1.8% |
| Elementary School | 123 | 15.1% |
| Middle School | 209 | 25.7% |
| High School | 159 | 19.6% |
| College / Undergraduate | 105 | 12.9% |
| Graduate / Professional | 83 | 10.2% |
| Total | 813 | 100.0% |
School Enrollment by Age by Funding Source in West Pittston borough
Out of a total of 813 students who are enrolled in schools in West Pittston borough, 276 (33.9%) attend a private institution, while the remaining 537 (66.1%) are enrolled in public schools. The age group of 18 to 19 year olds has the highest likelihood of being enrolled in private schools, with 1 (100.0% in the age bracket) enrolled. Conversely, the age group of 20 to 24 year olds has the lowest likelihood of being enrolled in a private school, with 60 (100.0% in the age bracket) attending a public institution.
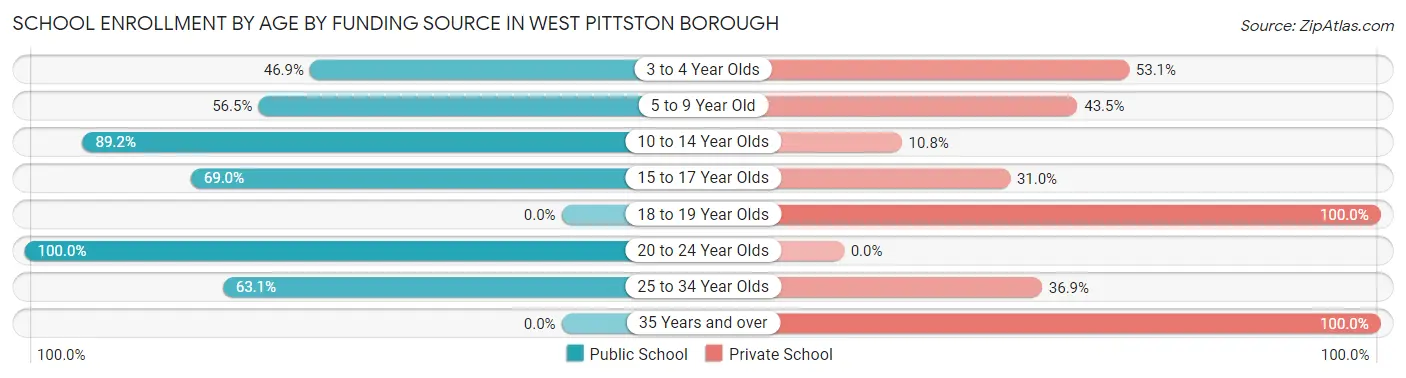
| Age Bracket | Public School | Private School |
| 3 to 4 Year Olds | 30 (46.9%) | 34 (53.1%) |
| 5 to 9 Year Old | 109 (56.5%) | 84 (43.5%) |
| 10 to 14 Year Olds | 190 (89.2%) | 23 (10.8%) |
| 15 to 17 Year Olds | 107 (69.0%) | 48 (31.0%) |
| 18 to 19 Year Olds | 0 (0.0%) | 1 (100.0%) |
| 20 to 24 Year Olds | 60 (100.0%) | 0 (0.0%) |
| 25 to 34 Year Olds | 41 (63.1%) | 24 (36.9%) |
| 35 Years and over | 0 (0.0%) | 62 (100.0%) |
| Total | 537 (66.1%) | 276 (33.9%) |
Educational Attainment by Field of Study in West Pittston borough
Science & technology (308 | 27.1%), education (216 | 19.0%), arts & humanities (141 | 12.4%), social sciences (106 | 9.3%), and business (102 | 9.0%) are the most common fields of study among 1,136 individuals in West Pittston borough who have obtained a bachelor's degree or higher.
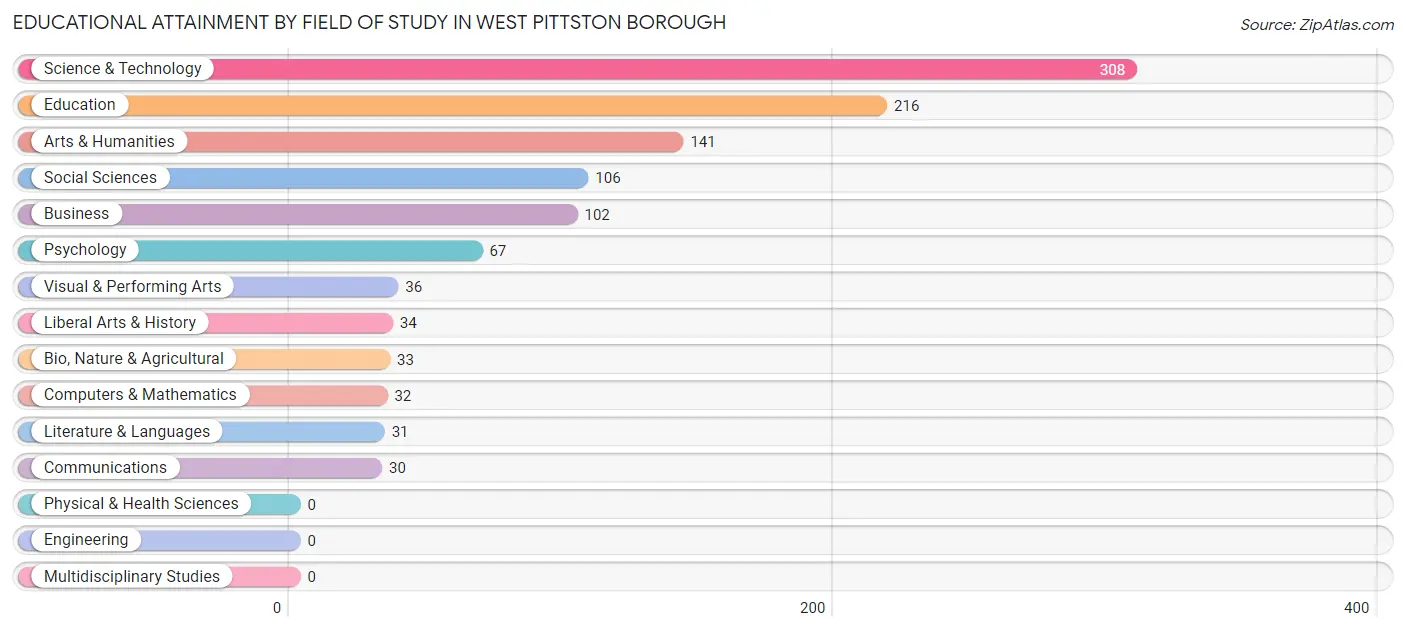
| Field of Study | # Graduates | % Graduates |
| Computers & Mathematics | 32 | 2.8% |
| Bio, Nature & Agricultural | 33 | 2.9% |
| Physical & Health Sciences | 0 | 0.0% |
| Psychology | 67 | 5.9% |
| Social Sciences | 106 | 9.3% |
| Engineering | 0 | 0.0% |
| Multidisciplinary Studies | 0 | 0.0% |
| Science & Technology | 308 | 27.1% |
| Business | 102 | 9.0% |
| Education | 216 | 19.0% |
| Literature & Languages | 31 | 2.7% |
| Liberal Arts & History | 34 | 3.0% |
| Visual & Performing Arts | 36 | 3.2% |
| Communications | 30 | 2.6% |
| Arts & Humanities | 141 | 12.4% |
| Total | 1,136 | 100.0% |
Transportation & Commute in West Pittston borough
Vehicle Availability by Sex in West Pittston borough
The most prevalent vehicle ownership categories in West Pittston borough are males with 2 vehicles (677, accounting for 55.2%) and females with 2 vehicles (586, making up 50.2%).
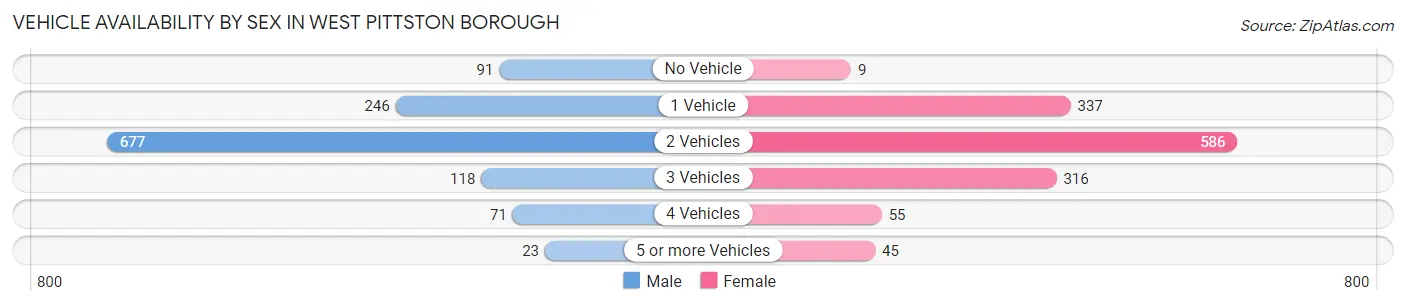
| Vehicles Available | Male | Female |
| No Vehicle | 91 (7.4%) | 9 (0.7%) |
| 1 Vehicle | 246 (20.1%) | 337 (25.0%) |
| 2 Vehicles | 677 (55.2%) | 586 (43.5%) |
| 3 Vehicles | 118 (9.6%) | 316 (23.4%) |
| 4 Vehicles | 71 (5.8%) | 55 (4.1%) |
| 5 or more Vehicles | 23 (1.9%) | 45 (3.3%) |
| Total | 1,226 (100.0%) | 1,348 (100.0%) |
Commute Time in West Pittston borough
The most frequently occuring commute durations in West Pittston borough are 15 to 19 minutes (506 commuters, 21.3%), 10 to 14 minutes (434 commuters, 18.3%), and 20 to 24 minutes (397 commuters, 16.7%).
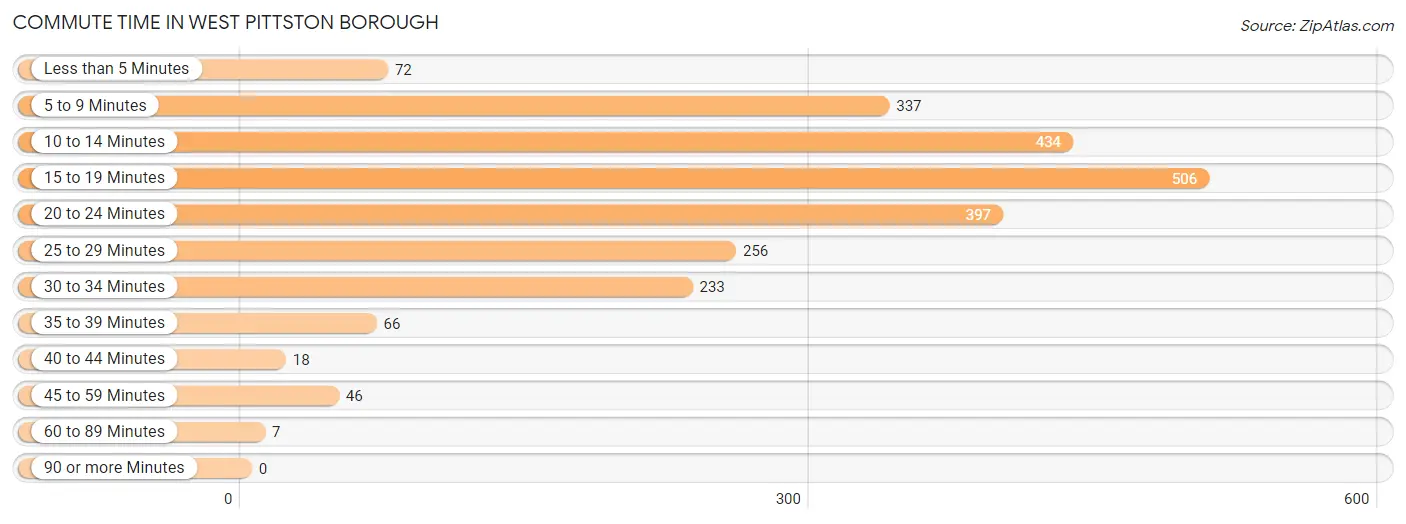
| Commute Time | # Commuters | % Commuters |
| Less than 5 Minutes | 72 | 3.0% |
| 5 to 9 Minutes | 337 | 14.2% |
| 10 to 14 Minutes | 434 | 18.3% |
| 15 to 19 Minutes | 506 | 21.3% |
| 20 to 24 Minutes | 397 | 16.7% |
| 25 to 29 Minutes | 256 | 10.8% |
| 30 to 34 Minutes | 233 | 9.8% |
| 35 to 39 Minutes | 66 | 2.8% |
| 40 to 44 Minutes | 18 | 0.8% |
| 45 to 59 Minutes | 46 | 1.9% |
| 60 to 89 Minutes | 7 | 0.3% |
| 90 or more Minutes | 0 | 0.0% |
Commute Time by Sex in West Pittston borough
The most common commute times in West Pittston borough are 15 to 19 minutes (317 commuters, 28.4%) for males and 20 to 24 minutes (320 commuters, 25.5%) for females.
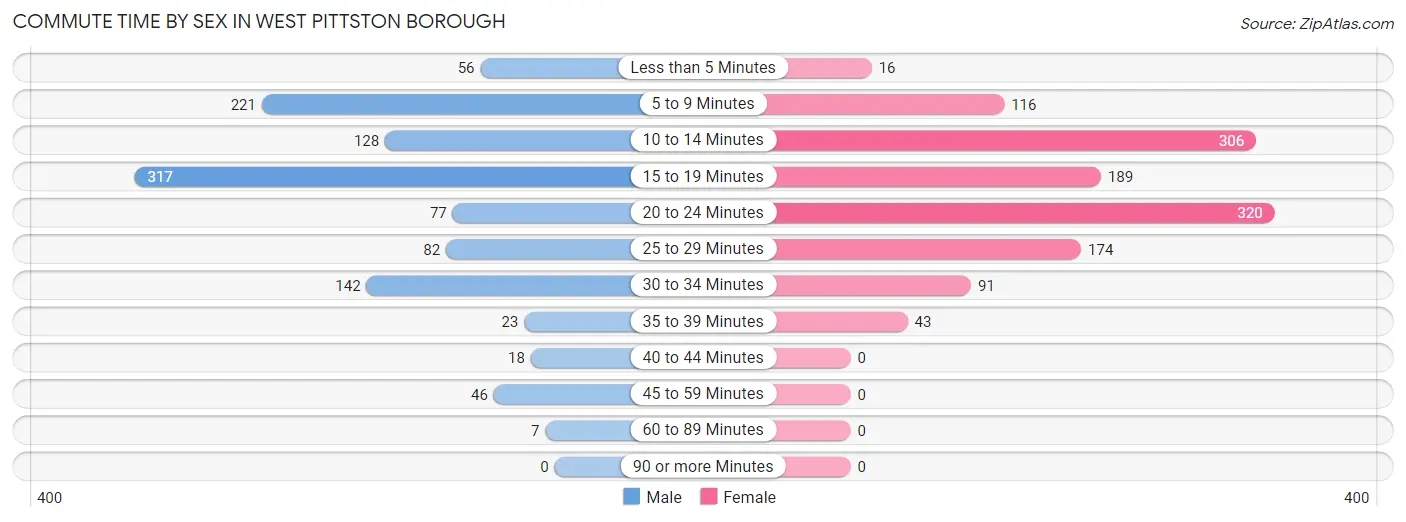
| Commute Time | Male | Female |
| Less than 5 Minutes | 56 (5.0%) | 16 (1.3%) |
| 5 to 9 Minutes | 221 (19.8%) | 116 (9.2%) |
| 10 to 14 Minutes | 128 (11.5%) | 306 (24.4%) |
| 15 to 19 Minutes | 317 (28.4%) | 189 (15.1%) |
| 20 to 24 Minutes | 77 (6.9%) | 320 (25.5%) |
| 25 to 29 Minutes | 82 (7.3%) | 174 (13.9%) |
| 30 to 34 Minutes | 142 (12.7%) | 91 (7.2%) |
| 35 to 39 Minutes | 23 (2.1%) | 43 (3.4%) |
| 40 to 44 Minutes | 18 (1.6%) | 0 (0.0%) |
| 45 to 59 Minutes | 46 (4.1%) | 0 (0.0%) |
| 60 to 89 Minutes | 7 (0.6%) | 0 (0.0%) |
| 90 or more Minutes | 0 (0.0%) | 0 (0.0%) |
Time of Departure to Work by Sex in West Pittston borough
The most frequent times of departure to work in West Pittston borough are 8:00 AM to 8:29 AM (257, 23.0%) for males and 8:00 AM to 8:29 AM (305, 24.3%) for females.
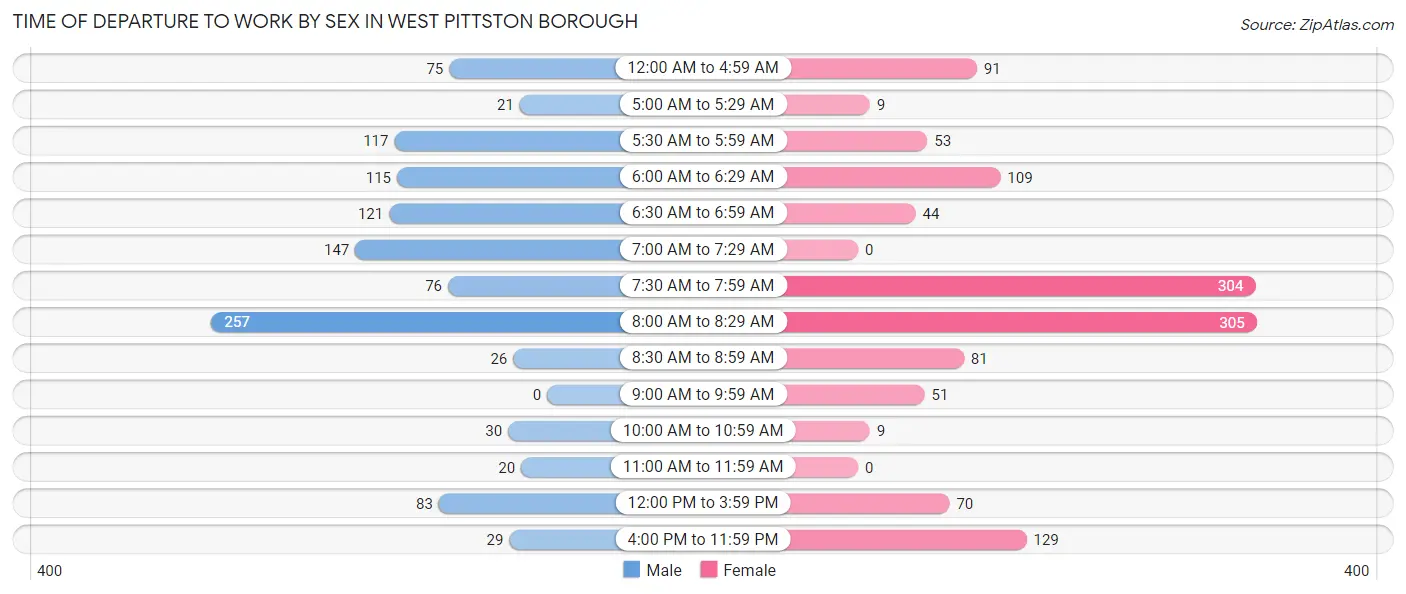
| Time of Departure | Male | Female |
| 12:00 AM to 4:59 AM | 75 (6.7%) | 91 (7.2%) |
| 5:00 AM to 5:29 AM | 21 (1.9%) | 9 (0.7%) |
| 5:30 AM to 5:59 AM | 117 (10.5%) | 53 (4.2%) |
| 6:00 AM to 6:29 AM | 115 (10.3%) | 109 (8.7%) |
| 6:30 AM to 6:59 AM | 121 (10.8%) | 44 (3.5%) |
| 7:00 AM to 7:29 AM | 147 (13.2%) | 0 (0.0%) |
| 7:30 AM to 7:59 AM | 76 (6.8%) | 304 (24.2%) |
| 8:00 AM to 8:29 AM | 257 (23.0%) | 305 (24.3%) |
| 8:30 AM to 8:59 AM | 26 (2.3%) | 81 (6.5%) |
| 9:00 AM to 9:59 AM | 0 (0.0%) | 51 (4.1%) |
| 10:00 AM to 10:59 AM | 30 (2.7%) | 9 (0.7%) |
| 11:00 AM to 11:59 AM | 20 (1.8%) | 0 (0.0%) |
| 12:00 PM to 3:59 PM | 83 (7.4%) | 70 (5.6%) |
| 4:00 PM to 11:59 PM | 29 (2.6%) | 129 (10.3%) |
| Total | 1,117 (100.0%) | 1,255 (100.0%) |
Housing Occupancy in West Pittston borough
Occupancy by Ownership in West Pittston borough
Of the total 2,133 dwellings in West Pittston borough, owner-occupied units account for 1,215 (57.0%), while renter-occupied units make up 918 (43.0%).
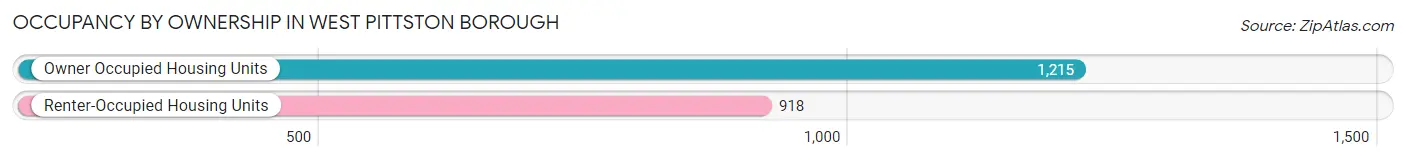
| Occupancy | # Housing Units | % Housing Units |
| Owner Occupied Housing Units | 1,215 | 57.0% |
| Renter-Occupied Housing Units | 918 | 43.0% |
| Total Occupied Housing Units | 2,133 | 100.0% |
Occupancy by Household Size in West Pittston borough
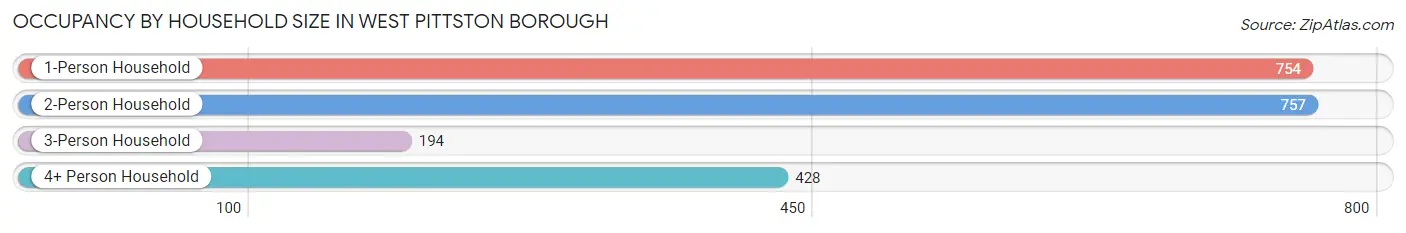
| Household Size | # Housing Units | % Housing Units |
| 1-Person Household | 754 | 35.3% |
| 2-Person Household | 757 | 35.5% |
| 3-Person Household | 194 | 9.1% |
| 4+ Person Household | 428 | 20.1% |
| Total Housing Units | 2,133 | 100.0% |
Occupancy by Ownership by Household Size in West Pittston borough
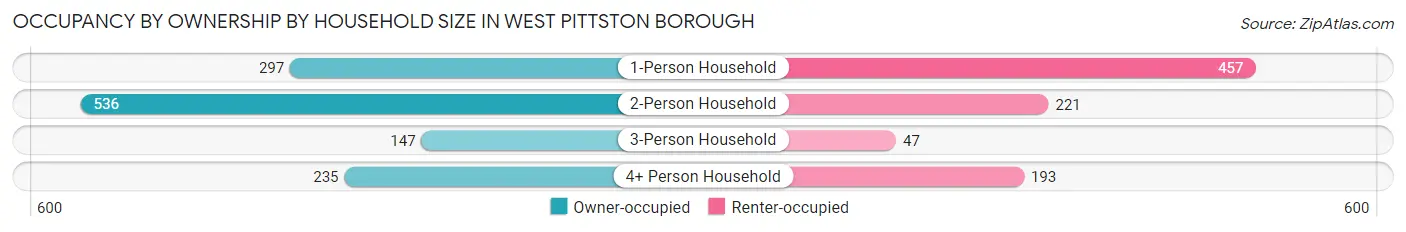
| Household Size | Owner-occupied | Renter-occupied |
| 1-Person Household | 297 (39.4%) | 457 (60.6%) |
| 2-Person Household | 536 (70.8%) | 221 (29.2%) |
| 3-Person Household | 147 (75.8%) | 47 (24.2%) |
| 4+ Person Household | 235 (54.9%) | 193 (45.1%) |
| Total Housing Units | 1,215 (57.0%) | 918 (43.0%) |
Occupancy by Educational Attainment in West Pittston borough
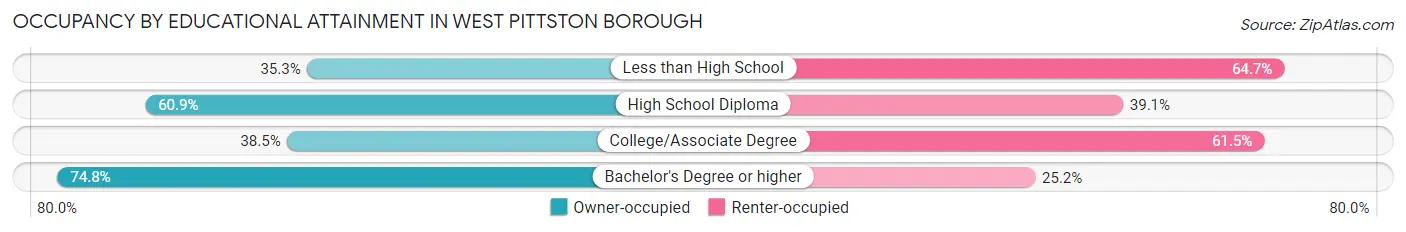
| Household Size | Owner-occupied | Renter-occupied |
| Less than High School | 60 (35.3%) | 110 (64.7%) |
| High School Diploma | 378 (60.9%) | 243 (39.1%) |
| College/Associate Degree | 240 (38.5%) | 384 (61.5%) |
| Bachelor's Degree or higher | 537 (74.8%) | 181 (25.2%) |
Occupancy by Age of Householder in West Pittston borough
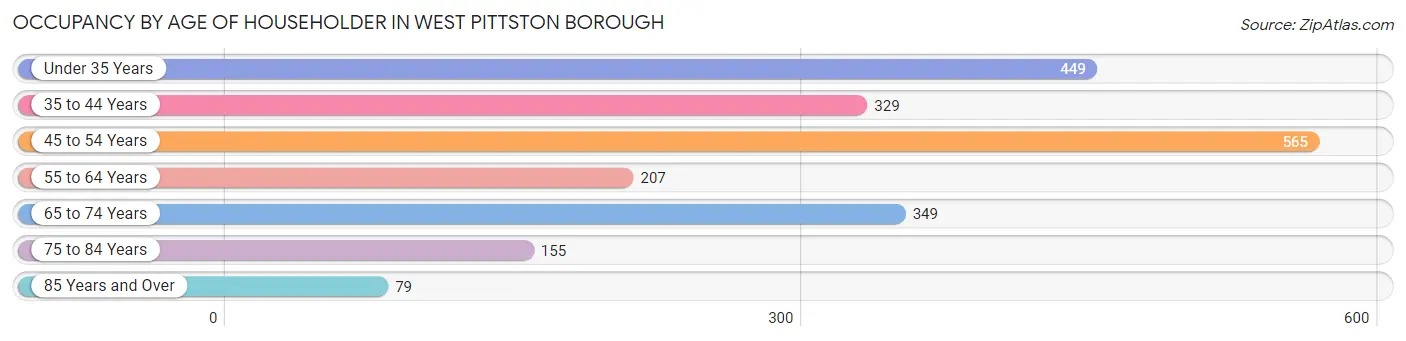
| Age Bracket | # Households | % Households |
| Under 35 Years | 449 | 21.0% |
| 35 to 44 Years | 329 | 15.4% |
| 45 to 54 Years | 565 | 26.5% |
| 55 to 64 Years | 207 | 9.7% |
| 65 to 74 Years | 349 | 16.4% |
| 75 to 84 Years | 155 | 7.3% |
| 85 Years and Over | 79 | 3.7% |
| Total | 2,133 | 100.0% |
Housing Finances in West Pittston borough
Median Income by Occupancy in West Pittston borough
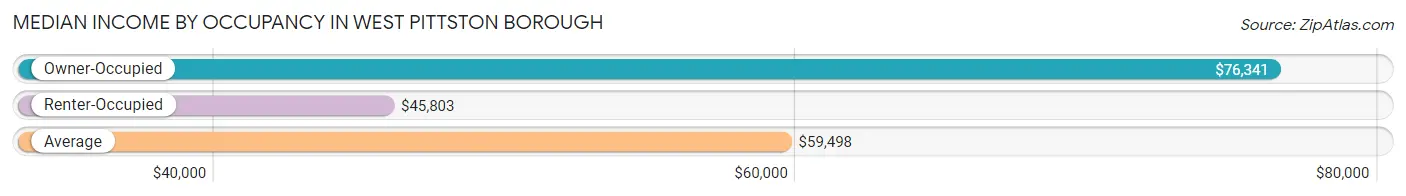
| Occupancy Type | # Households | Median Income |
| Owner-Occupied | 1,215 (57.0%) | $76,341 |
| Renter-Occupied | 918 (43.0%) | $45,803 |
| Average | 2,133 (100.0%) | $59,498 |
Occupancy by Householder Income Bracket in West Pittston borough
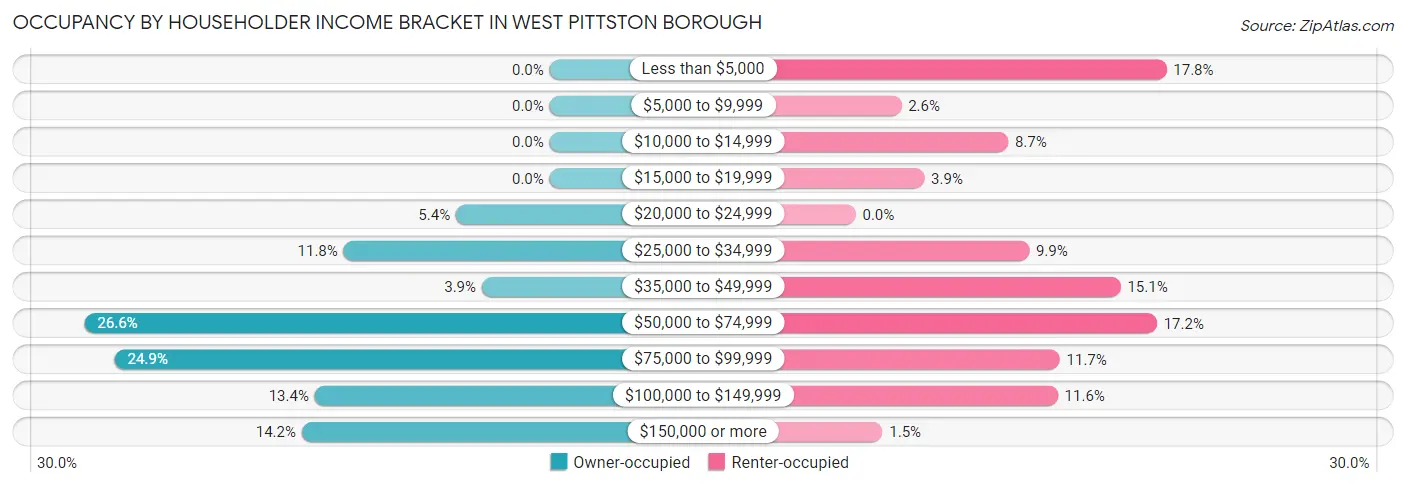
| Income Bracket | Owner-occupied | Renter-occupied |
| Less than $5,000 | 0 (0.0%) | 163 (17.8%) |
| $5,000 to $9,999 | 0 (0.0%) | 24 (2.6%) |
| $10,000 to $14,999 | 0 (0.0%) | 80 (8.7%) |
| $15,000 to $19,999 | 0 (0.0%) | 36 (3.9%) |
| $20,000 to $24,999 | 65 (5.3%) | 0 (0.0%) |
| $25,000 to $34,999 | 143 (11.8%) | 91 (9.9%) |
| $35,000 to $49,999 | 47 (3.9%) | 139 (15.1%) |
| $50,000 to $74,999 | 323 (26.6%) | 158 (17.2%) |
| $75,000 to $99,999 | 302 (24.9%) | 107 (11.7%) |
| $100,000 to $149,999 | 163 (13.4%) | 106 (11.6%) |
| $150,000 or more | 172 (14.2%) | 14 (1.5%) |
| Total | 1,215 (100.0%) | 918 (100.0%) |
Monthly Housing Cost Tiers in West Pittston borough
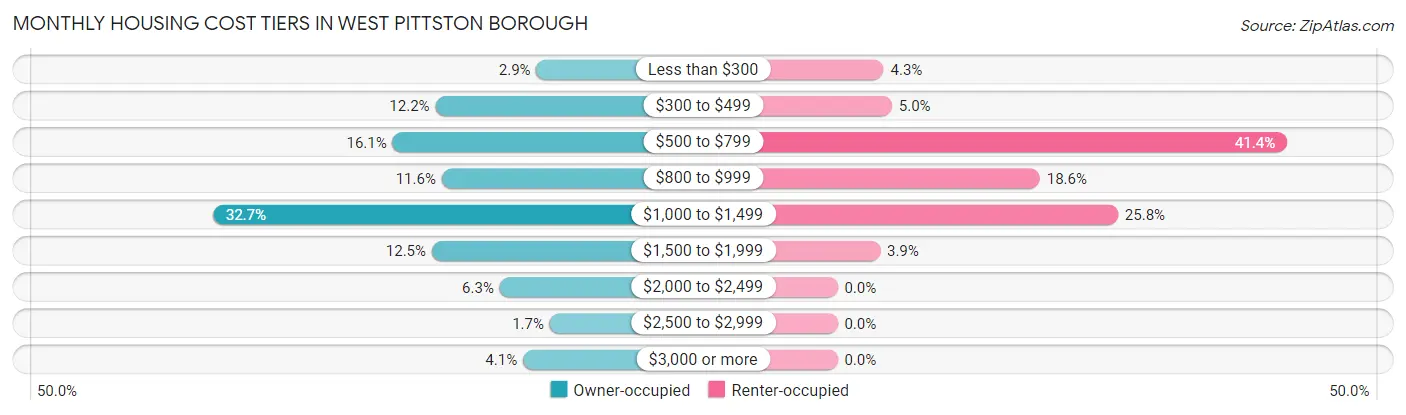
| Monthly Cost | Owner-occupied | Renter-occupied |
| Less than $300 | 35 (2.9%) | 39 (4.3%) |
| $300 to $499 | 148 (12.2%) | 46 (5.0%) |
| $500 to $799 | 196 (16.1%) | 380 (41.4%) |
| $800 to $999 | 141 (11.6%) | 171 (18.6%) |
| $1,000 to $1,499 | 397 (32.7%) | 237 (25.8%) |
| $1,500 to $1,999 | 152 (12.5%) | 36 (3.9%) |
| $2,000 to $2,499 | 76 (6.3%) | 0 (0.0%) |
| $2,500 to $2,999 | 20 (1.7%) | 0 (0.0%) |
| $3,000 or more | 50 (4.1%) | 0 (0.0%) |
| Total | 1,215 (100.0%) | 918 (100.0%) |
Physical Housing Characteristics in West Pittston borough
Housing Structures in West Pittston borough
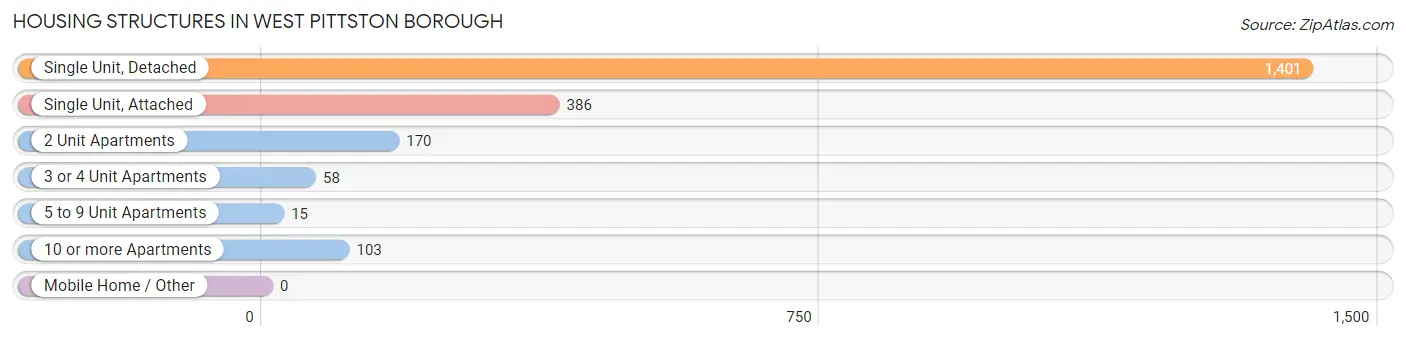
| Structure Type | # Housing Units | % Housing Units |
| Single Unit, Detached | 1,401 | 65.7% |
| Single Unit, Attached | 386 | 18.1% |
| 2 Unit Apartments | 170 | 8.0% |
| 3 or 4 Unit Apartments | 58 | 2.7% |
| 5 to 9 Unit Apartments | 15 | 0.7% |
| 10 or more Apartments | 103 | 4.8% |
| Mobile Home / Other | 0 | 0.0% |
| Total | 2,133 | 100.0% |
Housing Structures by Occupancy in West Pittston borough
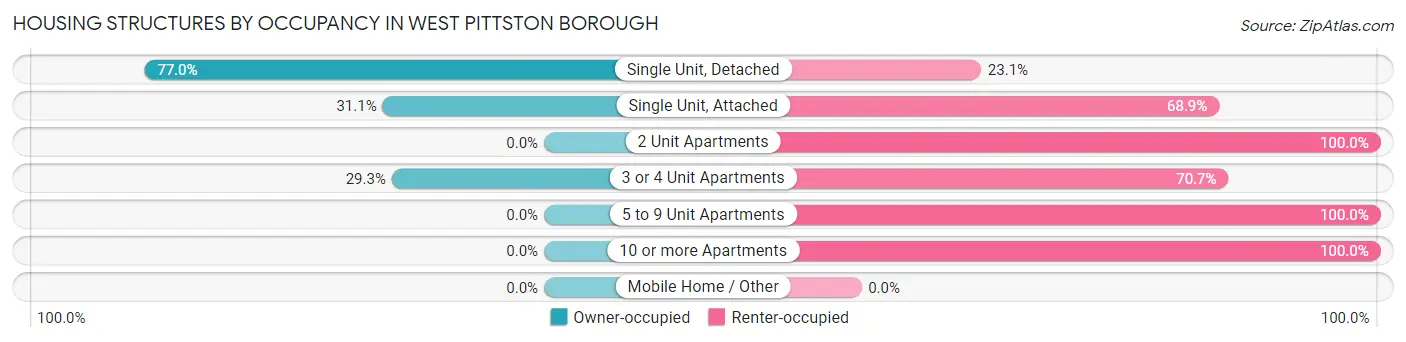
| Structure Type | Owner-occupied | Renter-occupied |
| Single Unit, Detached | 1,078 (76.9%) | 323 (23.1%) |
| Single Unit, Attached | 120 (31.1%) | 266 (68.9%) |
| 2 Unit Apartments | 0 (0.0%) | 170 (100.0%) |
| 3 or 4 Unit Apartments | 17 (29.3%) | 41 (70.7%) |
| 5 to 9 Unit Apartments | 0 (0.0%) | 15 (100.0%) |
| 10 or more Apartments | 0 (0.0%) | 103 (100.0%) |
| Mobile Home / Other | 0 (0.0%) | 0 (0.0%) |
| Total | 1,215 (57.0%) | 918 (43.0%) |
Housing Structures by Number of Rooms in West Pittston borough
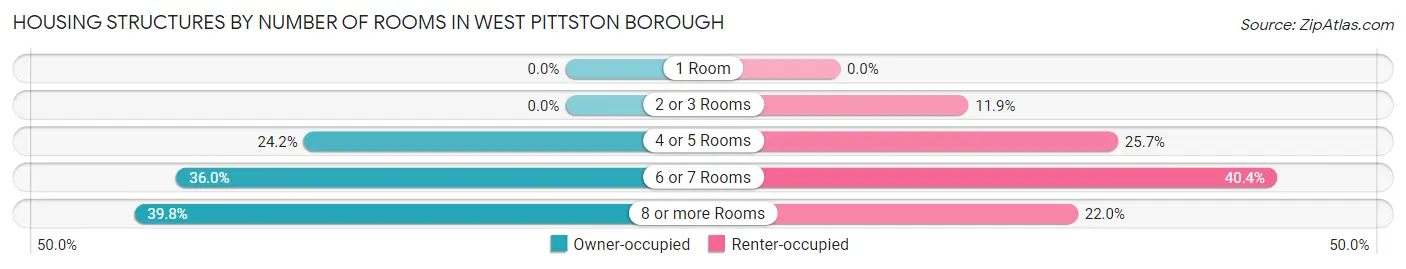
| Number of Rooms | Owner-occupied | Renter-occupied |
| 1 Room | 0 (0.0%) | 0 (0.0%) |
| 2 or 3 Rooms | 0 (0.0%) | 109 (11.9%) |
| 4 or 5 Rooms | 294 (24.2%) | 236 (25.7%) |
| 6 or 7 Rooms | 437 (36.0%) | 371 (40.4%) |
| 8 or more Rooms | 484 (39.8%) | 202 (22.0%) |
| Total | 1,215 (100.0%) | 918 (100.0%) |
Housing Structure by Heating Type in West Pittston borough
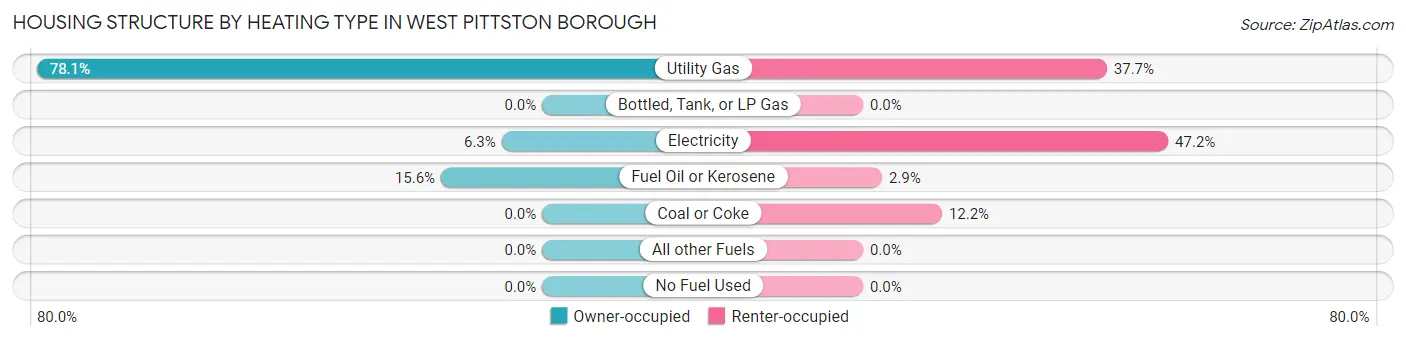
| Heating Type | Owner-occupied | Renter-occupied |
| Utility Gas | 949 (78.1%) | 346 (37.7%) |
| Bottled, Tank, or LP Gas | 0 (0.0%) | 0 (0.0%) |
| Electricity | 76 (6.3%) | 433 (47.2%) |
| Fuel Oil or Kerosene | 190 (15.6%) | 27 (2.9%) |
| Coal or Coke | 0 (0.0%) | 112 (12.2%) |
| All other Fuels | 0 (0.0%) | 0 (0.0%) |
| No Fuel Used | 0 (0.0%) | 0 (0.0%) |
| Total | 1,215 (100.0%) | 918 (100.0%) |
Household Vehicle Usage in West Pittston borough
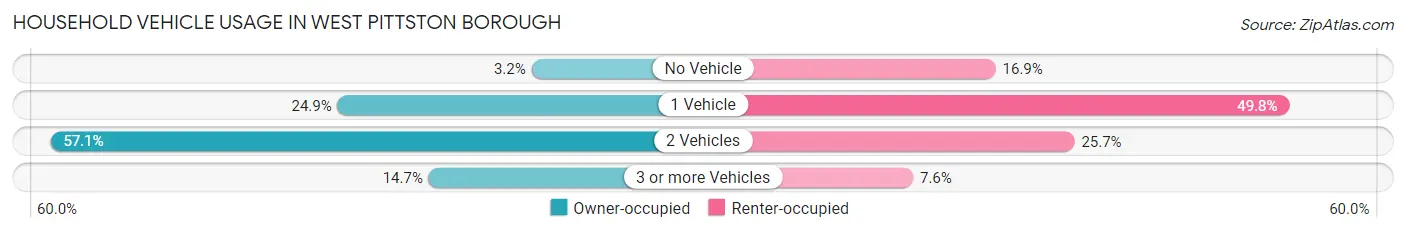
| Vehicles per Household | Owner-occupied | Renter-occupied |
| No Vehicle | 39 (3.2%) | 155 (16.9%) |
| 1 Vehicle | 303 (24.9%) | 457 (49.8%) |
| 2 Vehicles | 694 (57.1%) | 236 (25.7%) |
| 3 or more Vehicles | 179 (14.7%) | 70 (7.6%) |
| Total | 1,215 (100.0%) | 918 (100.0%) |
Real Estate & Mortgages in West Pittston borough
Real Estate and Mortgage Overview in West Pittston borough
| Characteristic | Without Mortgage | With Mortgage |
| Housing Units | 570 | 645 |
| Median Property Value | $145,600 | $156,300 |
| Median Household Income | $74,754 | $102 |
| Monthly Housing Costs | $739 | $50 |
| Real Estate Taxes | $2,026 | $37 |
Property Value by Mortgage Status in West Pittston borough
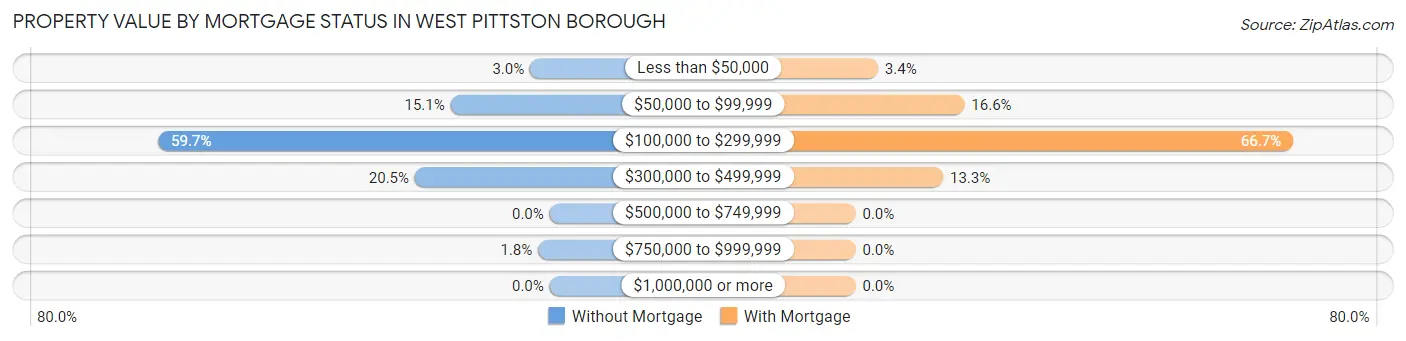
| Property Value | Without Mortgage | With Mortgage |
| Less than $50,000 | 17 (3.0%) | 22 (3.4%) |
| $50,000 to $99,999 | 86 (15.1%) | 107 (16.6%) |
| $100,000 to $299,999 | 340 (59.7%) | 430 (66.7%) |
| $300,000 to $499,999 | 117 (20.5%) | 86 (13.3%) |
| $500,000 to $749,999 | 0 (0.0%) | 0 (0.0%) |
| $750,000 to $999,999 | 10 (1.8%) | 0 (0.0%) |
| $1,000,000 or more | 0 (0.0%) | 0 (0.0%) |
| Total | 570 (100.0%) | 645 (100.0%) |
Household Income by Mortgage Status in West Pittston borough
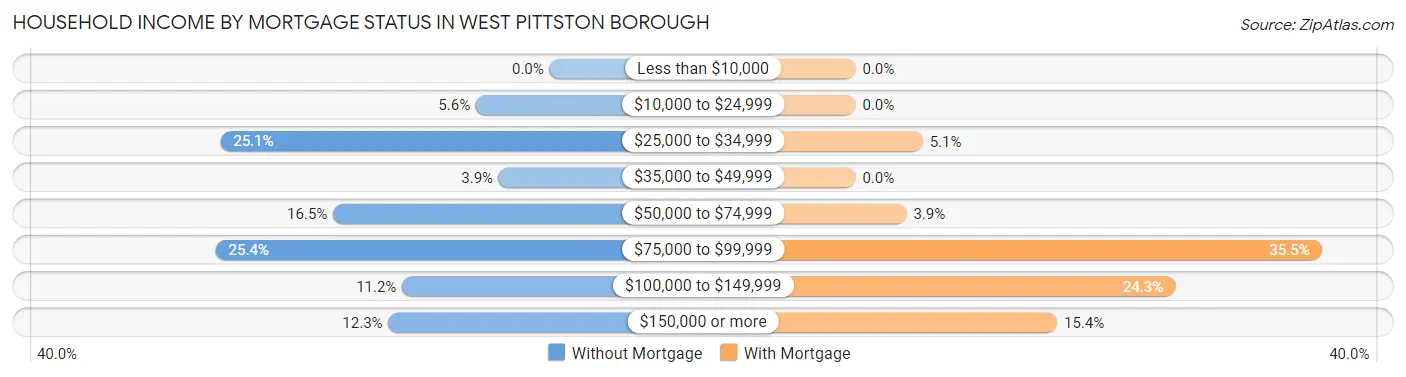
| Household Income | Without Mortgage | With Mortgage |
| Less than $10,000 | 0 (0.0%) | 0 (0.0%) |
| $10,000 to $24,999 | 32 (5.6%) | 0 (0.0%) |
| $25,000 to $34,999 | 143 (25.1%) | 33 (5.1%) |
| $35,000 to $49,999 | 22 (3.9%) | 0 (0.0%) |
| $50,000 to $74,999 | 94 (16.5%) | 25 (3.9%) |
| $75,000 to $99,999 | 145 (25.4%) | 229 (35.5%) |
| $100,000 to $149,999 | 64 (11.2%) | 157 (24.3%) |
| $150,000 or more | 70 (12.3%) | 99 (15.3%) |
| Total | 570 (100.0%) | 645 (100.0%) |
Property Value to Household Income Ratio in West Pittston borough
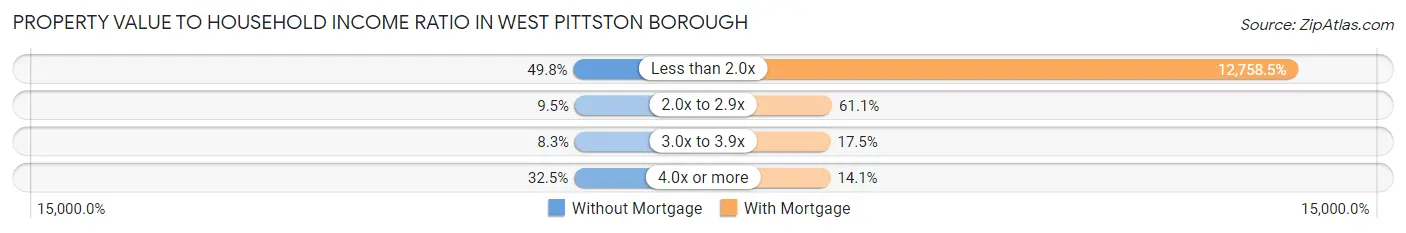
| Value-to-Income Ratio | Without Mortgage | With Mortgage |
| Less than 2.0x | 284 (49.8%) | 82,292 (12,758.5%) |
| 2.0x to 2.9x | 54 (9.5%) | 394 (61.1%) |
| 3.0x to 3.9x | 47 (8.3%) | 113 (17.5%) |
| 4.0x or more | 185 (32.5%) | 91 (14.1%) |
| Total | 570 (100.0%) | 645 (100.0%) |
Real Estate Taxes by Mortgage Status in West Pittston borough
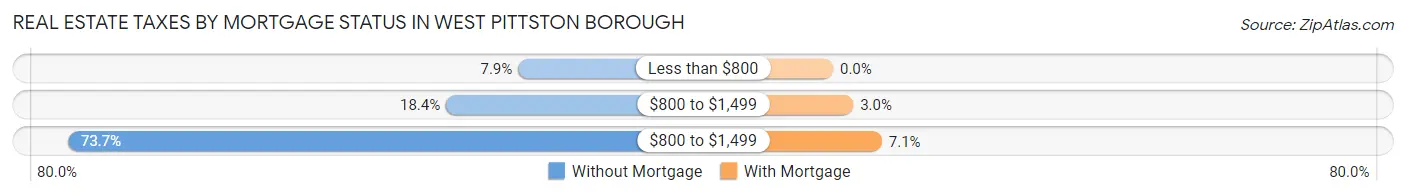
| Property Taxes | Without Mortgage | With Mortgage |
| Less than $800 | 45 (7.9%) | 0 (0.0%) |
| $800 to $1,499 | 105 (18.4%) | 19 (2.9%) |
| $800 to $1,499 | 420 (73.7%) | 46 (7.1%) |
| Total | 570 (100.0%) | 645 (100.0%) |
Health & Disability in West Pittston borough
Health Insurance Coverage by Age in West Pittston borough
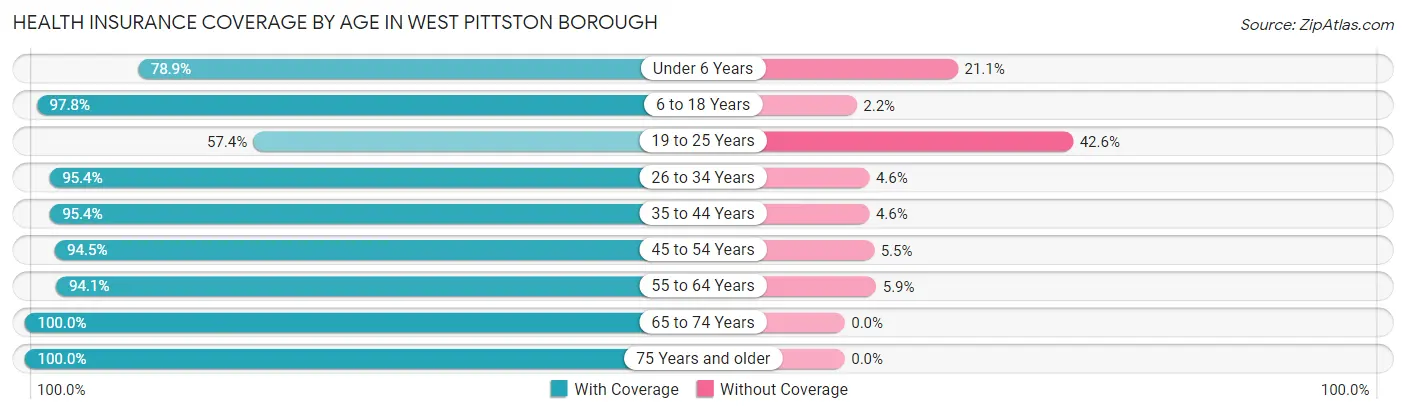
| Age Bracket | With Coverage | Without Coverage |
| Under 6 Years | 310 (78.9%) | 83 (21.1%) |
| 6 to 18 Years | 523 (97.8%) | 12 (2.2%) |
| 19 to 25 Years | 221 (57.4%) | 164 (42.6%) |
| 26 to 34 Years | 622 (95.4%) | 30 (4.6%) |
| 35 to 44 Years | 581 (95.4%) | 28 (4.6%) |
| 45 to 54 Years | 723 (94.5%) | 42 (5.5%) |
| 55 to 64 Years | 417 (94.1%) | 26 (5.9%) |
| 65 to 74 Years | 571 (100.0%) | 0 (0.0%) |
| 75 Years and older | 311 (100.0%) | 0 (0.0%) |
| Total | 4,279 (91.7%) | 385 (8.3%) |
Health Insurance Coverage by Citizenship Status in West Pittston borough
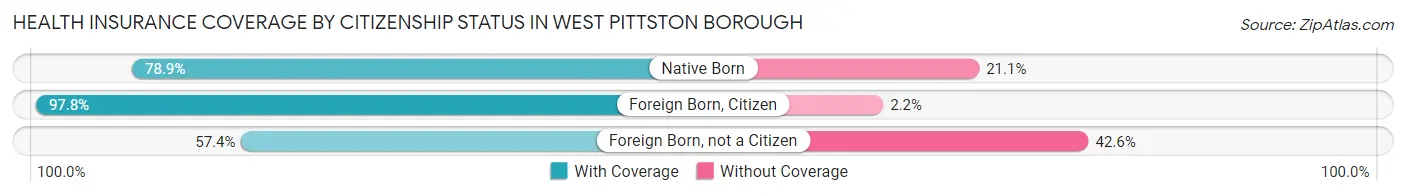
| Citizenship Status | With Coverage | Without Coverage |
| Native Born | 310 (78.9%) | 83 (21.1%) |
| Foreign Born, Citizen | 523 (97.8%) | 12 (2.2%) |
| Foreign Born, not a Citizen | 221 (57.4%) | 164 (42.6%) |
Health Insurance Coverage by Household Income in West Pittston borough
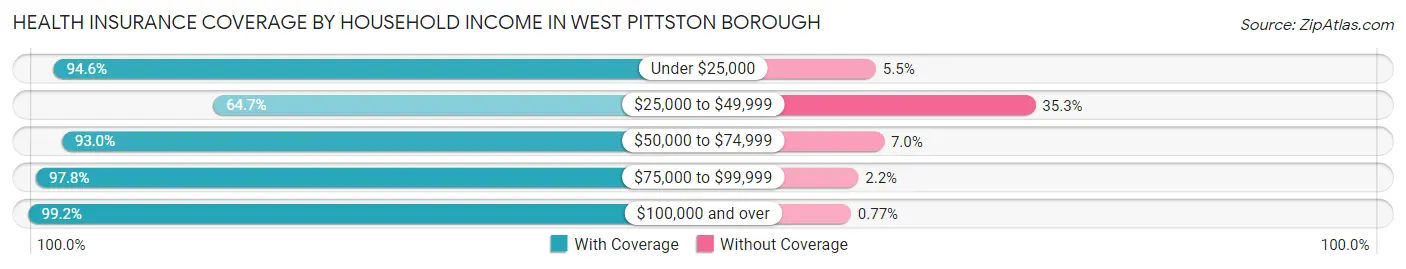
| Household Income | With Coverage | Without Coverage |
| Under $25,000 | 468 (94.6%) | 27 (5.4%) |
| $25,000 to $49,999 | 452 (64.7%) | 247 (35.3%) |
| $50,000 to $74,999 | 1,027 (93.0%) | 77 (7.0%) |
| $75,000 to $99,999 | 1,042 (97.8%) | 23 (2.2%) |
| $100,000 and over | 1,286 (99.2%) | 10 (0.8%) |
Public vs Private Health Insurance Coverage by Age in West Pittston borough
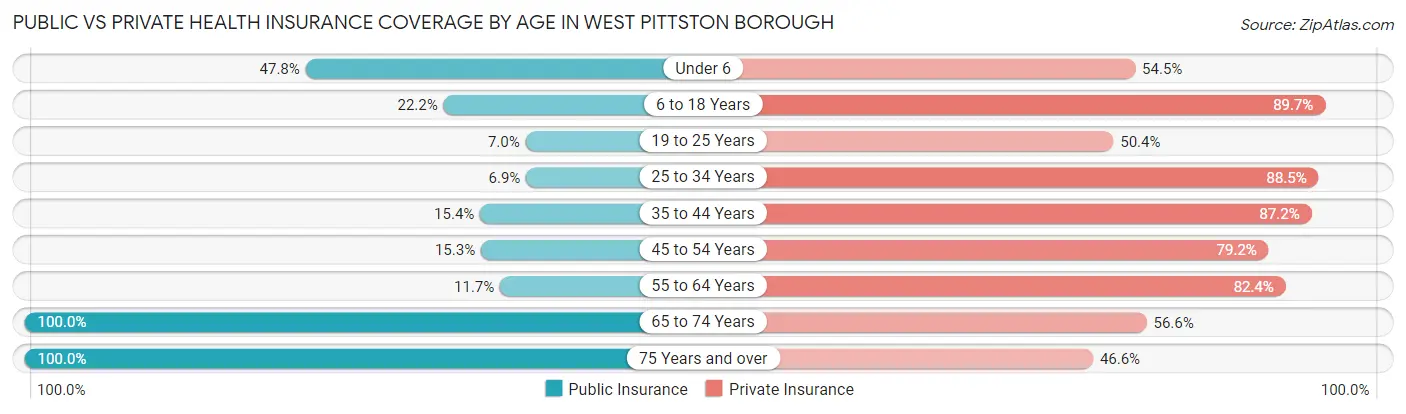
| Age Bracket | Public Insurance | Private Insurance |
| Under 6 | 188 (47.8%) | 214 (54.4%) |
| 6 to 18 Years | 119 (22.2%) | 480 (89.7%) |
| 19 to 25 Years | 27 (7.0%) | 194 (50.4%) |
| 25 to 34 Years | 45 (6.9%) | 577 (88.5%) |
| 35 to 44 Years | 94 (15.4%) | 531 (87.2%) |
| 45 to 54 Years | 117 (15.3%) | 606 (79.2%) |
| 55 to 64 Years | 52 (11.7%) | 365 (82.4%) |
| 65 to 74 Years | 571 (100.0%) | 323 (56.6%) |
| 75 Years and over | 311 (100.0%) | 145 (46.6%) |
| Total | 1,524 (32.7%) | 3,435 (73.7%) |
Disability Status by Sex by Age in West Pittston borough
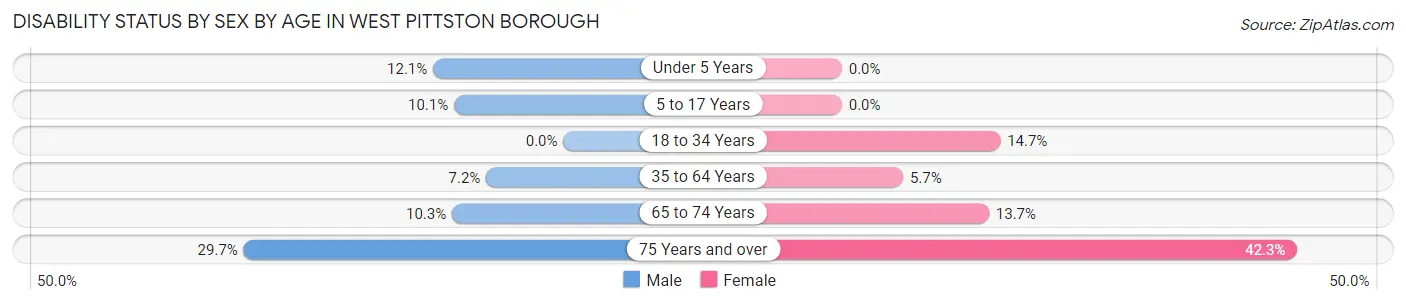
| Age Bracket | Male | Female |
| Under 5 Years | 26 (12.1%) | 0 (0.0%) |
| 5 to 17 Years | 37 (10.1%) | 0 (0.0%) |
| 18 to 34 Years | 0 (0.0%) | 86 (14.7%) |
| 35 to 64 Years | 67 (7.2%) | 50 (5.7%) |
| 65 to 74 Years | 31 (10.3%) | 37 (13.7%) |
| 75 Years and over | 27 (29.7%) | 93 (42.3%) |
Disability Class by Sex by Age in West Pittston borough
Disability Class: Hearing Difficulty
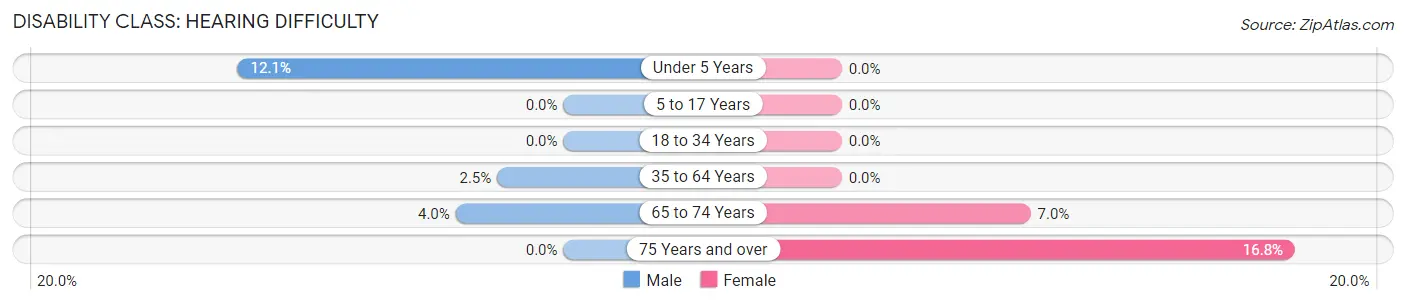
| Age Bracket | Male | Female |
| Under 5 Years | 26 (12.1%) | 0 (0.0%) |
| 5 to 17 Years | 0 (0.0%) | 0 (0.0%) |
| 18 to 34 Years | 0 (0.0%) | 0 (0.0%) |
| 35 to 64 Years | 23 (2.5%) | 0 (0.0%) |
| 65 to 74 Years | 12 (4.0%) | 19 (7.0%) |
| 75 Years and over | 0 (0.0%) | 37 (16.8%) |
Disability Class: Vision Difficulty
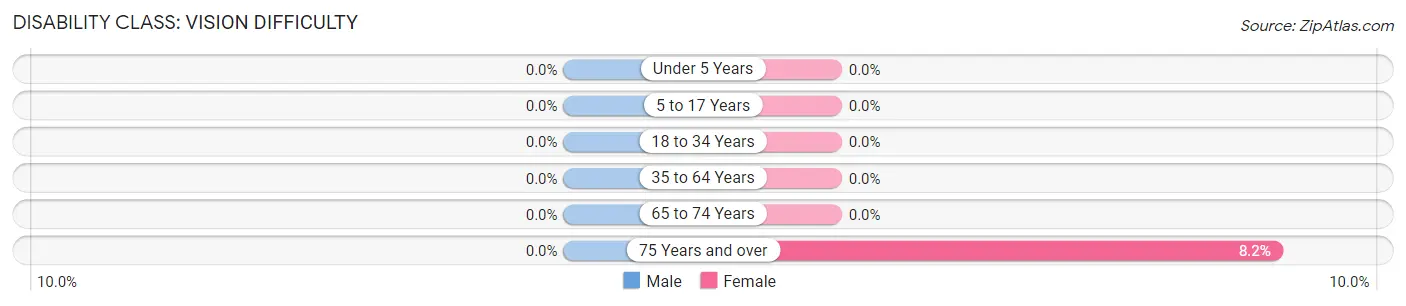
| Age Bracket | Male | Female |
| Under 5 Years | 0 (0.0%) | 0 (0.0%) |
| 5 to 17 Years | 0 (0.0%) | 0 (0.0%) |
| 18 to 34 Years | 0 (0.0%) | 0 (0.0%) |
| 35 to 64 Years | 0 (0.0%) | 0 (0.0%) |
| 65 to 74 Years | 0 (0.0%) | 0 (0.0%) |
| 75 Years and over | 0 (0.0%) | 18 (8.2%) |
Disability Class: Cognitive Difficulty
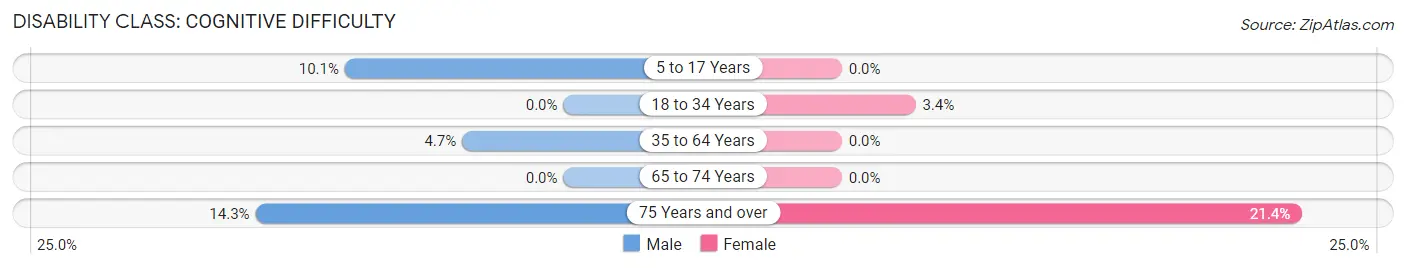
| Age Bracket | Male | Female |
| 5 to 17 Years | 37 (10.1%) | 0 (0.0%) |
| 18 to 34 Years | 0 (0.0%) | 20 (3.4%) |
| 35 to 64 Years | 44 (4.7%) | 0 (0.0%) |
| 65 to 74 Years | 0 (0.0%) | 0 (0.0%) |
| 75 Years and over | 13 (14.3%) | 47 (21.4%) |
Disability Class: Ambulatory Difficulty
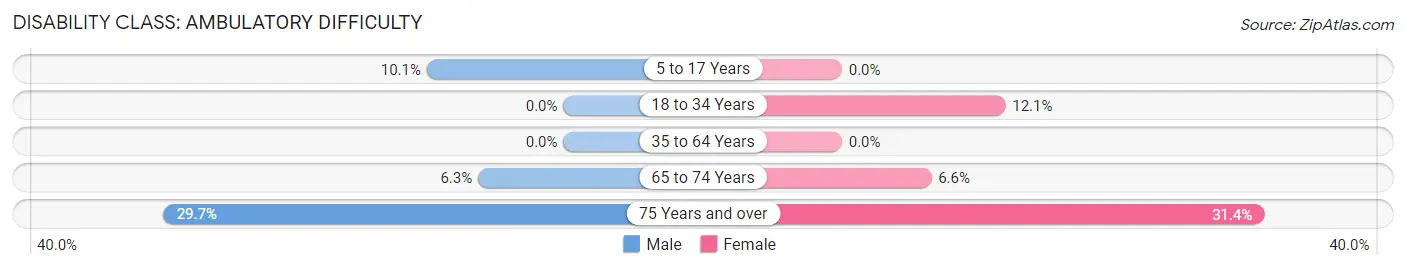
| Age Bracket | Male | Female |
| 5 to 17 Years | 37 (10.1%) | 0 (0.0%) |
| 18 to 34 Years | 0 (0.0%) | 71 (12.1%) |
| 35 to 64 Years | 0 (0.0%) | 0 (0.0%) |
| 65 to 74 Years | 19 (6.3%) | 18 (6.6%) |
| 75 Years and over | 27 (29.7%) | 69 (31.4%) |
Disability Class: Self-Care Difficulty
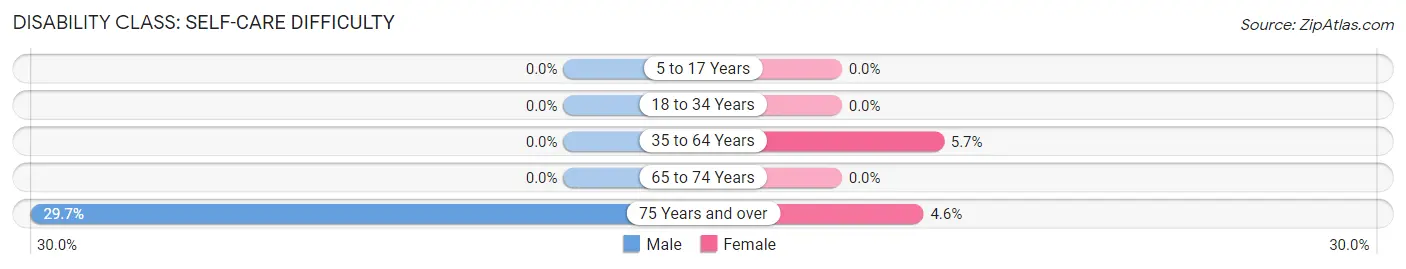
| Age Bracket | Male | Female |
| 5 to 17 Years | 0 (0.0%) | 0 (0.0%) |
| 18 to 34 Years | 0 (0.0%) | 0 (0.0%) |
| 35 to 64 Years | 0 (0.0%) | 50 (5.7%) |
| 65 to 74 Years | 0 (0.0%) | 0 (0.0%) |
| 75 Years and over | 27 (29.7%) | 10 (4.5%) |
Technology Access in West Pittston borough
Computing Device Access in West Pittston borough
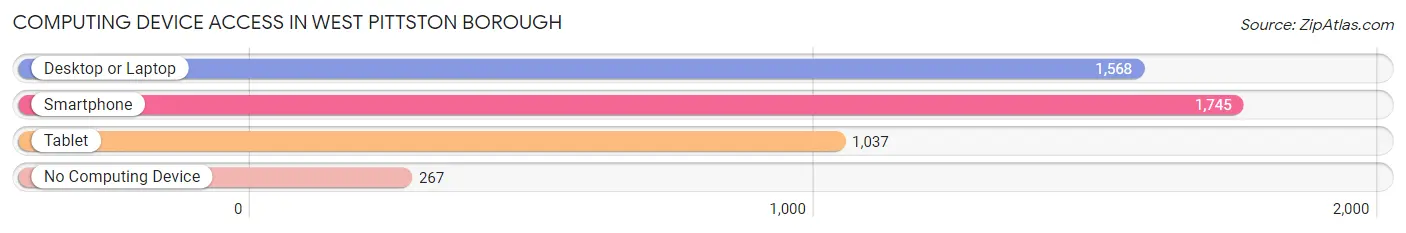
| Device Type | # Households | % Households |
| Desktop or Laptop | 1,568 | 73.5% |
| Smartphone | 1,745 | 81.8% |
| Tablet | 1,037 | 48.6% |
| No Computing Device | 267 | 12.5% |
| Total | 2,133 | 100.0% |
Internet Access in West Pittston borough
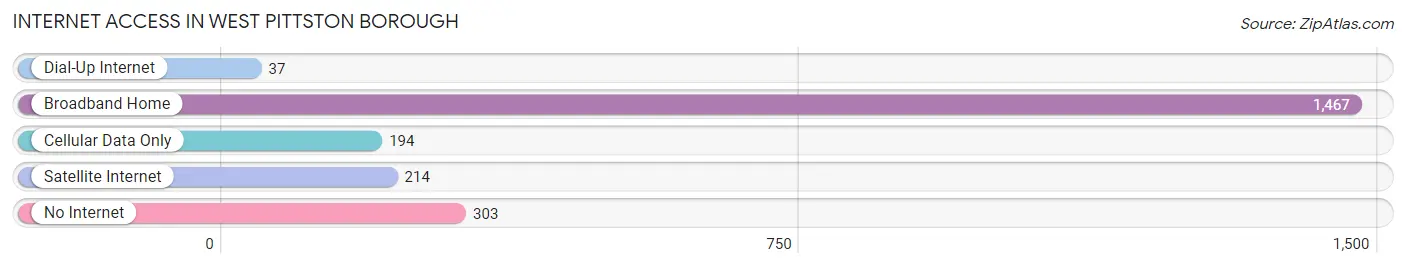
| Internet Type | # Households | % Households |
| Dial-Up Internet | 37 | 1.7% |
| Broadband Home | 1,467 | 68.8% |
| Cellular Data Only | 194 | 9.1% |
| Satellite Internet | 214 | 10.0% |
| No Internet | 303 | 14.2% |
| Total | 2,133 | 100.0% |
West Pittston borough Summary
Pittston Borough is a small borough located in Luzerne County, Pennsylvania. It is situated in the Wyoming Valley, a region of the Northeastern United States. The borough is bordered by the Susquehanna River to the north, the city of Pittston to the east, and the boroughs of Exeter and West Wyoming to the south and west, respectively. The population of Pittston Borough was 2,845 at the 2010 census.
History
Pittston Borough was first settled in 1770 by a group of Welsh immigrants led by John Jenkins. The borough was incorporated in 1848 and was named after the city of Pittston, which was founded in 1790. The borough was originally part of Pittston Township, which was divided into two separate municipalities in 1848.
The borough was an important center of the coal mining industry in the late 19th and early 20th centuries. The coal mines in the area provided employment for many of the borough's residents. The coal industry declined in the mid-20th century, and the borough's economy shifted to other industries, such as manufacturing and retail.
Geography
Pittston Borough is located at 41°19'45"N 75°50'45"W (41.329167, -75.845833). It has a total area of 0.7 square miles, all of which is land. The borough is located in the Wyoming Valley, a region of the Northeastern United States. The Susquehanna River forms the northern boundary of the borough.
Demographics
As of the 2010 census, there were 2,845 people, 1,213 households, and 745 families residing in the borough. The population density was 4,072.9 people per square mile. There were 1,313 housing units at an average density of 1,867.1 per square mile. The racial makeup of the borough was 97.2% White, 0.7% African American, 0.2% Native American, 0.4% Asian, 0.1% Pacific Islander, 0.4% from other races, and 1.0% from two or more races. Hispanic or Latino of any race were 1.7% of the population.
Economy
Pittston Borough's economy is largely based on retail and services. The borough is home to several small businesses, including restaurants, convenience stores, and other retail establishments. The borough also has a number of manufacturing and industrial businesses, including a plastics factory and a metal fabrication plant.
The borough is also home to a number of educational institutions, including a community college and a technical school. The borough is served by the Pittston Area School District, which includes two elementary schools, a middle school, and a high school.
Conclusion
Pittston Borough is a small borough located in Luzerne County, Pennsylvania. It is situated in the Wyoming Valley, a region of the Northeastern United States. The borough was first settled in 1770 and was incorporated in 1848. The borough was an important center of the coal mining industry in the late 19th and early 20th centuries, but the industry declined in the mid-20th century and the borough's economy shifted to other industries, such as manufacturing and retail. The population of Pittston Borough was 2,845 at the 2010 census. The borough's economy is largely based on retail and services, and it is home to several small businesses, manufacturing and industrial businesses, and educational institutions.
Common Questions
What is the Total Population of West Pittston borough?
Total Population of West Pittston borough is 4,664.
What is the Total Male Population of West Pittston borough?
Total Male Population of West Pittston borough is 2,360.
What is the Total Female Population of West Pittston borough?
Total Female Population of West Pittston borough is 2,304.
What is the Ratio of Males per 100 Females in West Pittston borough?
There are 102.43 Males per 100 Females in West Pittston borough.
What is the Ratio of Females per 100 Males in West Pittston borough?
There are 97.63 Females per 100 Males in West Pittston borough.
What is the Median Population Age in West Pittston borough?
Median Population Age in West Pittston borough is 42.0 Years.
What is the Average Family Size in West Pittston borough
Average Family Size in West Pittston borough is 2.8 People.
What is the Average Household Size in West Pittston borough
Average Household Size in West Pittston borough is 2.2 People.
What is Per Capita Income in West Pittston borough?
Per Capita income in West Pittston borough is $34,768.
What is the Median Family Income in West Pittston borough?
Median Family Income in West Pittston borough is $69,951.
What is the Median Household income in West Pittston borough?
Median Household Income in West Pittston borough is $59,498.
What is Income or Wage Gap in West Pittston borough?
Income or Wage Gap in West Pittston borough is 19.6%.
Women in West Pittston borough earn 80.4 cents for every dollar earned by a man.
What is Inequality or Gini Index in West Pittston borough?
Inequality or Gini Index in West Pittston borough is 0.41.
How Large is the Labor Force in West Pittston borough?
There are 2,638 People in the Labor Forcein in West Pittston borough.
What is the Percentage of People in the Labor Force in West Pittston borough?
68.9% of People are in the Labor Force in West Pittston borough.
What is the Unemployment Rate in West Pittston borough?
Unemployment Rate in West Pittston borough is 2.0%.