Unionville borough, PA
Unionville borough Overview
256
TOTAL POPULATION
121
MALE POPULATION
135
FEMALE POPULATION
89.63
MALES / 100 FEMALES
111.57
FEMALES / 100 MALES
43.7
MEDIAN AGE
3.1
AVG FAMILY SIZE
2.6
AVG HOUSEHOLD SIZE
$31,789
PER CAPITA INCOME
$63,571
AVG FAMILY INCOME
$58,250
AVG HOUSEHOLD INCOME
26.3%
WAGE / INCOME GAP [ % ]
73.7¢/ $1
WAGE / INCOME GAP [ $ ]
0.41
INEQUALITY / GINI INDEX
147
LABOR FORCE [ PEOPLE ]
66.2%
PERCENT IN LABOR FORCE
0.7%
UNEMPLOYMENT RATE
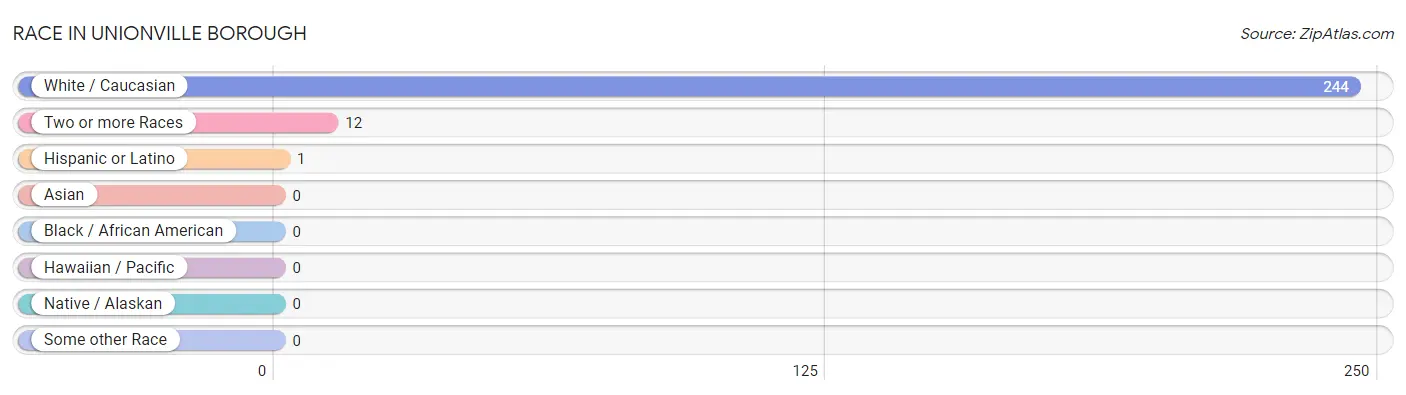
Race in Unionville borough
The most populous races in Unionville borough are White / Caucasian (244 | 95.3%), Two or more Races (12 | 4.7%), and Hispanic or Latino (1 | 0.4%).
| Race | # Population | % Population |
| Asian | 0 | 0.0% |
| Black / African American | 0 | 0.0% |
| Hawaiian / Pacific | 0 | 0.0% |
| Hispanic or Latino | 1 | 0.4% |
| Native / Alaskan | 0 | 0.0% |
| White / Caucasian | 244 | 95.3% |
| Two or more Races | 12 | 4.7% |
| Some other Race | 0 | 0.0% |
| Total | 256 | 100.0% |
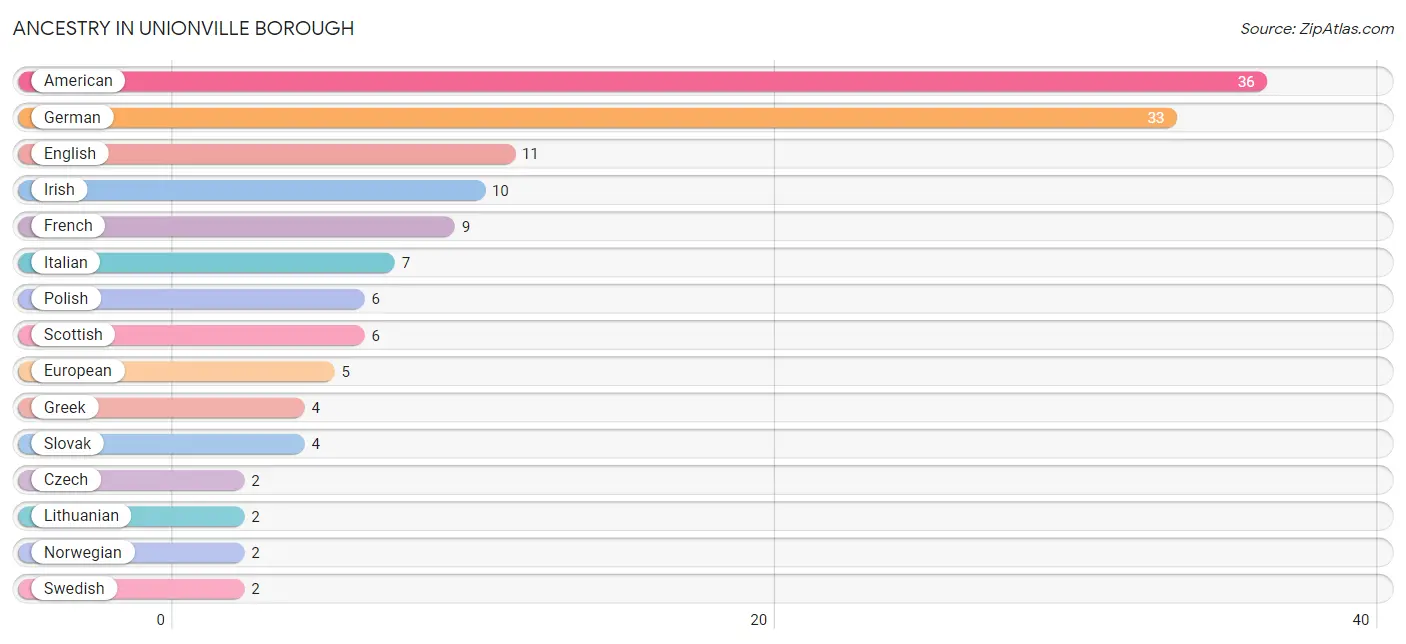
Ancestry in Unionville borough
The most populous ancestries reported in Unionville borough are American (36 | 14.1%), German (33 | 12.9%), English (11 | 4.3%), Irish (10 | 3.9%), and French (9 | 3.5%), together accounting for 38.7% of all Unionville borough residents.
| Ancestry | # Population | % Population |
| American | 36 | 14.1% |
| Czech | 2 | 0.8% |
| Dutch | 1 | 0.4% |
| English | 11 | 4.3% |
| European | 5 | 1.9% |
| French | 9 | 3.5% |
| German | 33 | 12.9% |
| Greek | 4 | 1.6% |
| Irish | 10 | 3.9% |
| Italian | 7 | 2.7% |
| Lithuanian | 2 | 0.8% |
| Norwegian | 2 | 0.8% |
| Pennsylvania German | 1 | 0.4% |
| Polish | 6 | 2.3% |
| Puerto Rican | 1 | 0.4% |
| Scottish | 6 | 2.3% |
| Slovak | 4 | 1.6% |
| Swedish | 2 | 0.8% | View All 18 Rows |
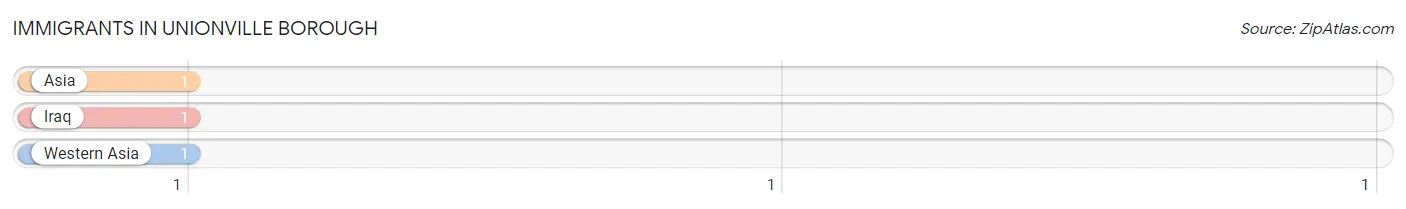
Immigrants in Unionville borough
The most numerous immigrant groups reported in Unionville borough came from Asia (1 | 0.4%), Iraq (1 | 0.4%), and Western Asia (1 | 0.4%), together accounting for 1.2% of all Unionville borough residents.
| Immigration Origin | # Population | % Population |
| Asia | 1 | 0.4% |
| Iraq | 1 | 0.4% |
| Western Asia | 1 | 0.4% | View All 3 Rows |
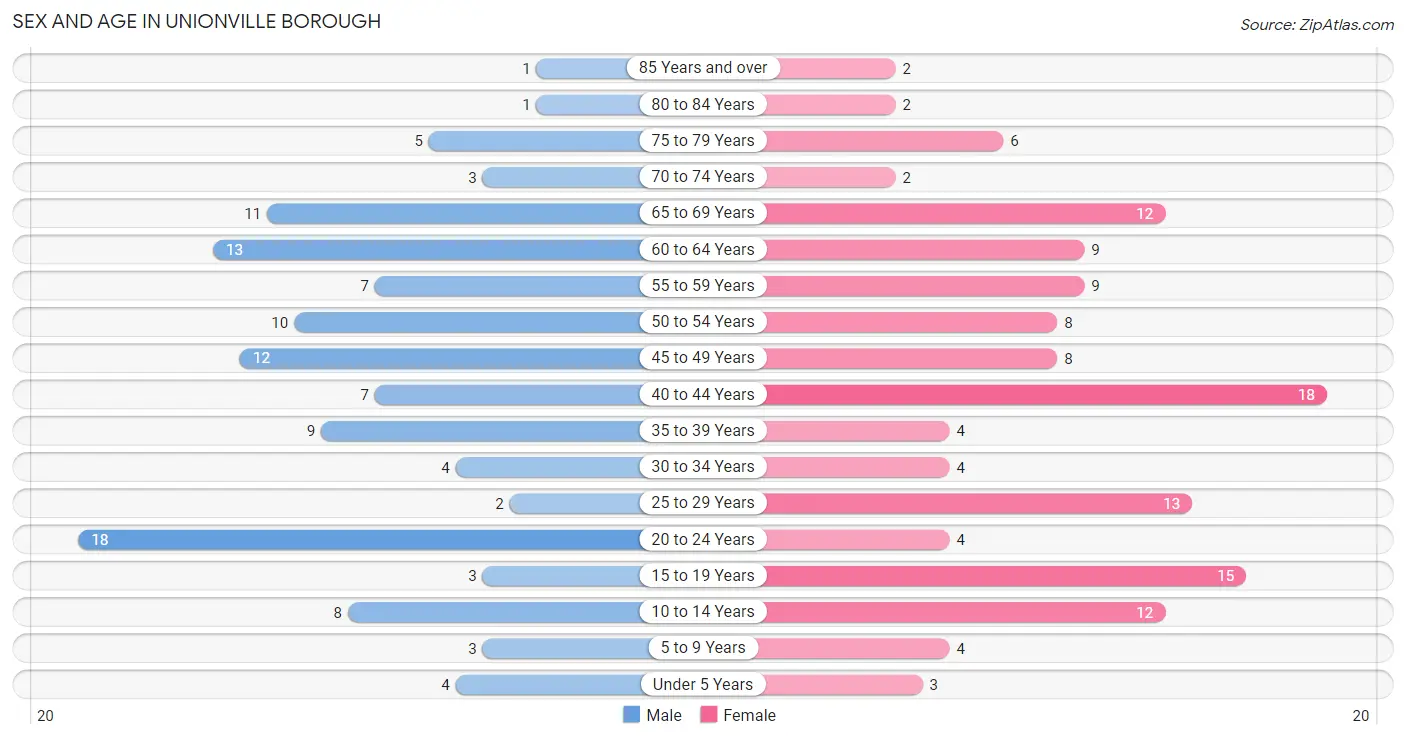
Sex and Age in Unionville borough
Sex and Age in Unionville borough
The most populous age groups in Unionville borough are 20 to 24 Years (18 | 14.9%) for men and 40 to 44 Years (18 | 13.3%) for women.
| Age Bracket | Male | Female |
| Under 5 Years | 4 (3.3%) | 3 (2.2%) |
| 5 to 9 Years | 3 (2.5%) | 4 (3.0%) |
| 10 to 14 Years | 8 (6.6%) | 12 (8.9%) |
| 15 to 19 Years | 3 (2.5%) | 15 (11.1%) |
| 20 to 24 Years | 18 (14.9%) | 4 (3.0%) |
| 25 to 29 Years | 2 (1.7%) | 13 (9.6%) |
| 30 to 34 Years | 4 (3.3%) | 4 (3.0%) |
| 35 to 39 Years | 9 (7.4%) | 4 (3.0%) |
| 40 to 44 Years | 7 (5.8%) | 18 (13.3%) |
| 45 to 49 Years | 12 (9.9%) | 8 (5.9%) |
| 50 to 54 Years | 10 (8.3%) | 8 (5.9%) |
| 55 to 59 Years | 7 (5.8%) | 9 (6.7%) |
| 60 to 64 Years | 13 (10.7%) | 9 (6.7%) |
| 65 to 69 Years | 11 (9.1%) | 12 (8.9%) |
| 70 to 74 Years | 3 (2.5%) | 2 (1.5%) |
| 75 to 79 Years | 5 (4.1%) | 6 (4.4%) |
| 80 to 84 Years | 1 (0.8%) | 2 (1.5%) |
| 85 Years and over | 1 (0.8%) | 2 (1.5%) |
| Total | 121 (100.0%) | 135 (100.0%) |
Families and Households in Unionville borough
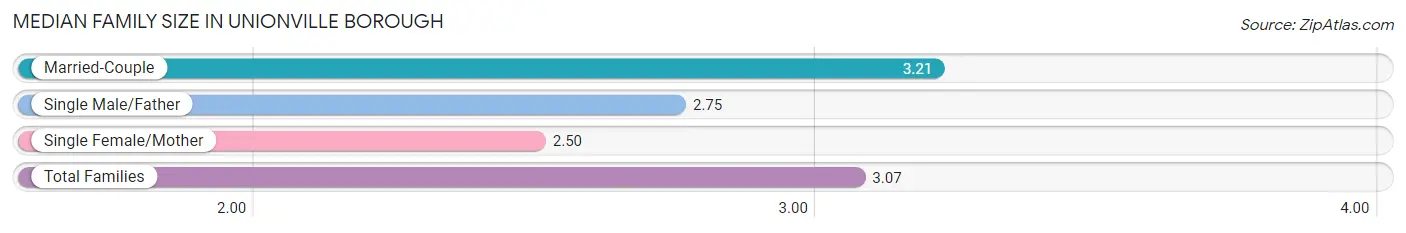
Median Family Size in Unionville borough
The median family size in Unionville borough is 3.07 persons per family, with married-couple families (58 | 78.4%) accounting for the largest median family size of 3.21 persons per family. On the other hand, single female/mother families (12 | 16.2%) represent the smallest median family size with 2.50 persons per family.
| Family Type | # Families | Family Size |
| Married-Couple | 58 (78.4%) | 3.21 |
| Single Male/Father | 4 (5.4%) | 2.75 |
| Single Female/Mother | 12 (16.2%) | 2.50 |
| Total Families | 74 (100.0%) | 3.07 |
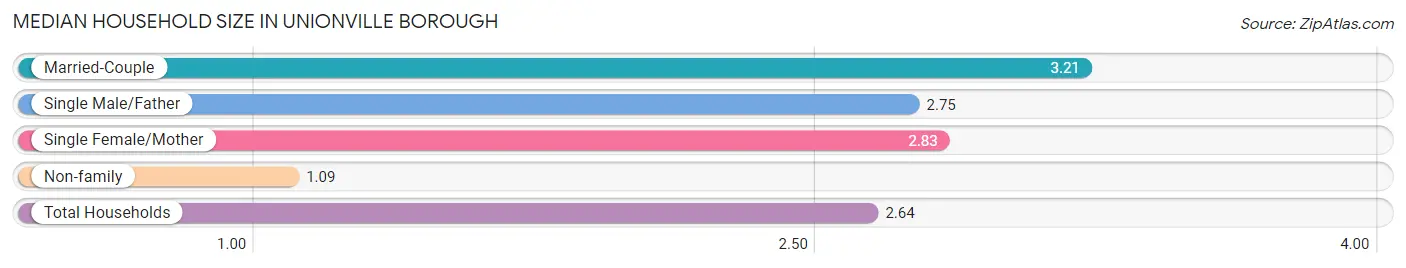
Median Household Size in Unionville borough
The median household size in Unionville borough is 2.64 persons per household, with married-couple households (58 | 59.8%) accounting for the largest median household size of 3.21 persons per household. non-family households (23 | 23.7%) represent the smallest median household size with 1.09 persons per household.
| Household Type | # Households | Household Size |
| Married-Couple | 58 (59.8%) | 3.21 |
| Single Male/Father | 4 (4.1%) | 2.75 |
| Single Female/Mother | 12 (12.4%) | 2.83 |
| Non-family | 23 (23.7%) | 1.09 |
| Total Households | 97 (100.0%) | 2.64 |
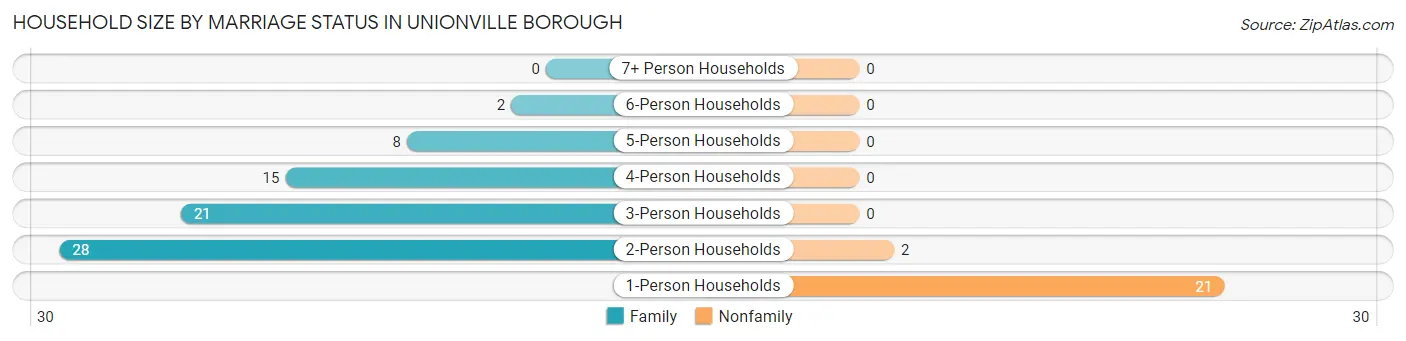
Household Size by Marriage Status in Unionville borough
Out of a total of 97 households in Unionville borough, 74 (76.3%) are family households, while 23 (23.7%) are nonfamily households. The most numerous type of family households are 2-person households, comprising 28, and the most common type of nonfamily households are 1-person households, comprising 21.
| Household Size | Family Households | Nonfamily Households |
| 1-Person Households | - | 21 (21.6%) |
| 2-Person Households | 28 (28.9%) | 2 (2.1%) |
| 3-Person Households | 21 (21.6%) | 0 (0.0%) |
| 4-Person Households | 15 (15.5%) | 0 (0.0%) |
| 5-Person Households | 8 (8.3%) | 0 (0.0%) |
| 6-Person Households | 2 (2.1%) | 0 (0.0%) |
| 7+ Person Households | 0 (0.0%) | 0 (0.0%) |
| Total | 74 (76.3%) | 23 (23.7%) |
Female Fertility in Unionville borough
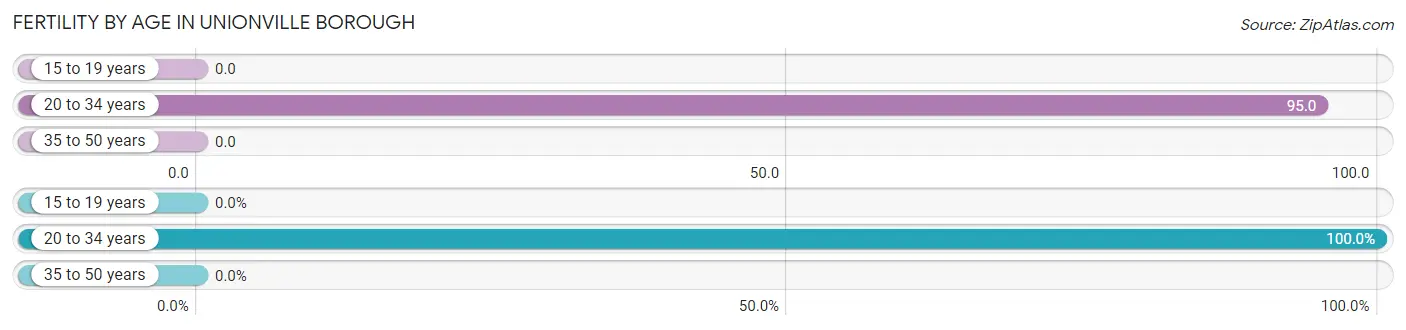
Fertility by Age in Unionville borough
Average fertility rate in Unionville borough is 29.0 births per 1,000 women. Women in the age bracket of 20 to 34 years have the highest fertility rate with 95.0 births per 1,000 women. Women in the age bracket of 20 to 34 years acount for 100.0% of all women with births.
| Age Bracket | Women with Births | Births / 1,000 Women |
| 15 to 19 years | 0 (0.0%) | 0.0 |
| 20 to 34 years | 2 (100.0%) | 95.0 |
| 35 to 50 years | 0 (0.0%) | 0.0 |
| Total | 2 (100.0%) | 29.0 |
Fertility by Age by Marriage Status in Unionville borough
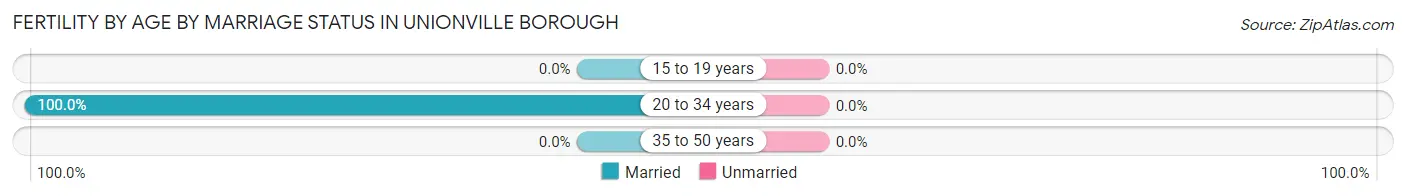
| Age Bracket | Married | Unmarried |
| 15 to 19 years | 0 (0.0%) | 0 (0.0%) |
| 20 to 34 years | 2 (100.0%) | 0 (0.0%) |
| 35 to 50 years | 0 (0.0%) | 0 (0.0%) |
| Total | 2 (100.0%) | 0 (0.0%) |
Fertility by Education in Unionville borough
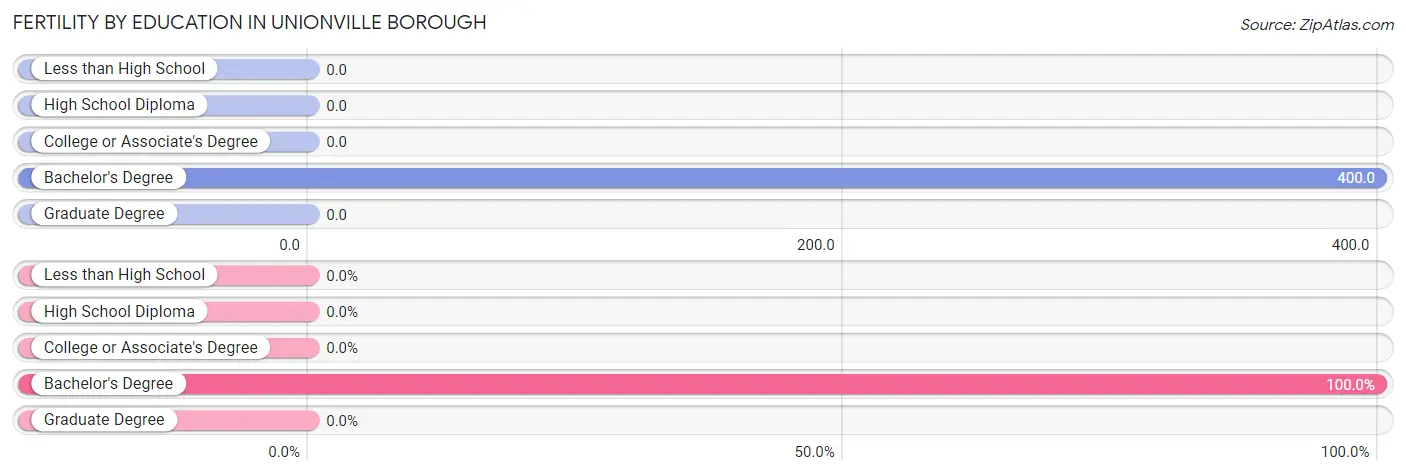
| Educational Attainment | Women with Births | Births / 1,000 Women |
| Less than High School | 0 (0.0%) | 0.0 |
| High School Diploma | 0 (0.0%) | 0.0 |
| College or Associate's Degree | 0 (0.0%) | 0.0 |
| Bachelor's Degree | 2 (100.0%) | 400.0 |
| Graduate Degree | 0 (0.0%) | 0.0 |
| Total | 2 (100.0%) | 29.0 |
Fertility by Education by Marriage Status in Unionville borough
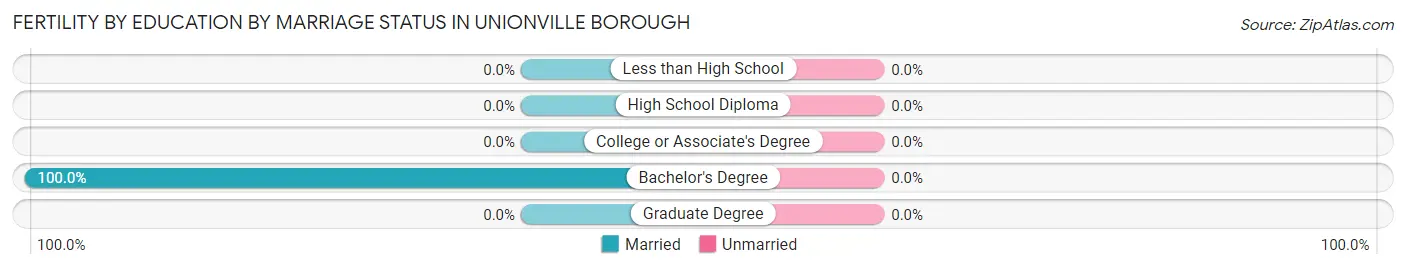
| Educational Attainment | Married | Unmarried |
| Less than High School | 0 (0.0%) | 0 (0.0%) |
| High School Diploma | 0 (0.0%) | 0 (0.0%) |
| College or Associate's Degree | 0 (0.0%) | 0 (0.0%) |
| Bachelor's Degree | 2 (100.0%) | 0 (0.0%) |
| Graduate Degree | 0 (0.0%) | 0 (0.0%) |
| Total | 2 (100.0%) | 0 (0.0%) |
Income in Unionville borough
Income Overview in Unionville borough
Per Capita Income in Unionville borough is $31,789, while median incomes of families and households are $63,571 and $58,250 respectively.
| Characteristic | Number | Measure |
| Per Capita Income | 256 | $31,789 |
| Median Family Income | 74 | $63,571 |
| Mean Family Income | 74 | $95,943 |
| Median Household Income | 97 | $58,250 |
| Mean Household Income | 97 | $82,284 |
| Income Deficit | 74 | $0 |
| Wage / Income Gap (%) | 256 | 26.26% |
| Wage / Income Gap ($) | 256 | 73.74¢ per $1 |
| Gini / Inequality Index | 256 | 0.41 |
Earnings by Sex in Unionville borough
Average Earnings in Unionville borough are $34,063, $41,250 for men and $30,417 for women, a difference of 26.3%.
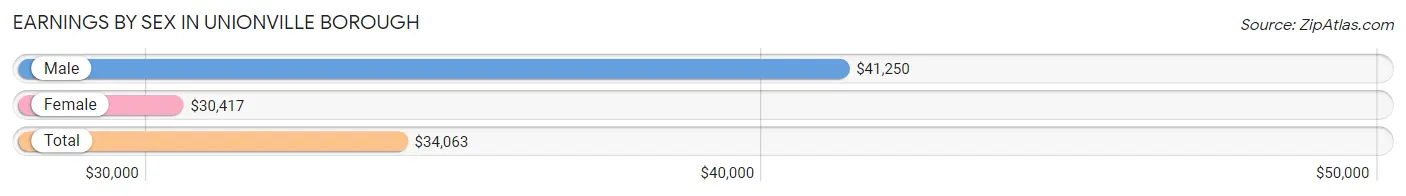
| Sex | Number | Average Earnings |
| Male | 81 (53.3%) | $41,250 |
| Female | 71 (46.7%) | $30,417 |
| Total | 152 (100.0%) | $34,063 |
Earnings by Sex by Income Bracket in Unionville borough
The most common earnings brackets in Unionville borough are $75,000 to $99,999 for men (9 | 11.1%) and $2,499 or less for women (14 | 19.7%).
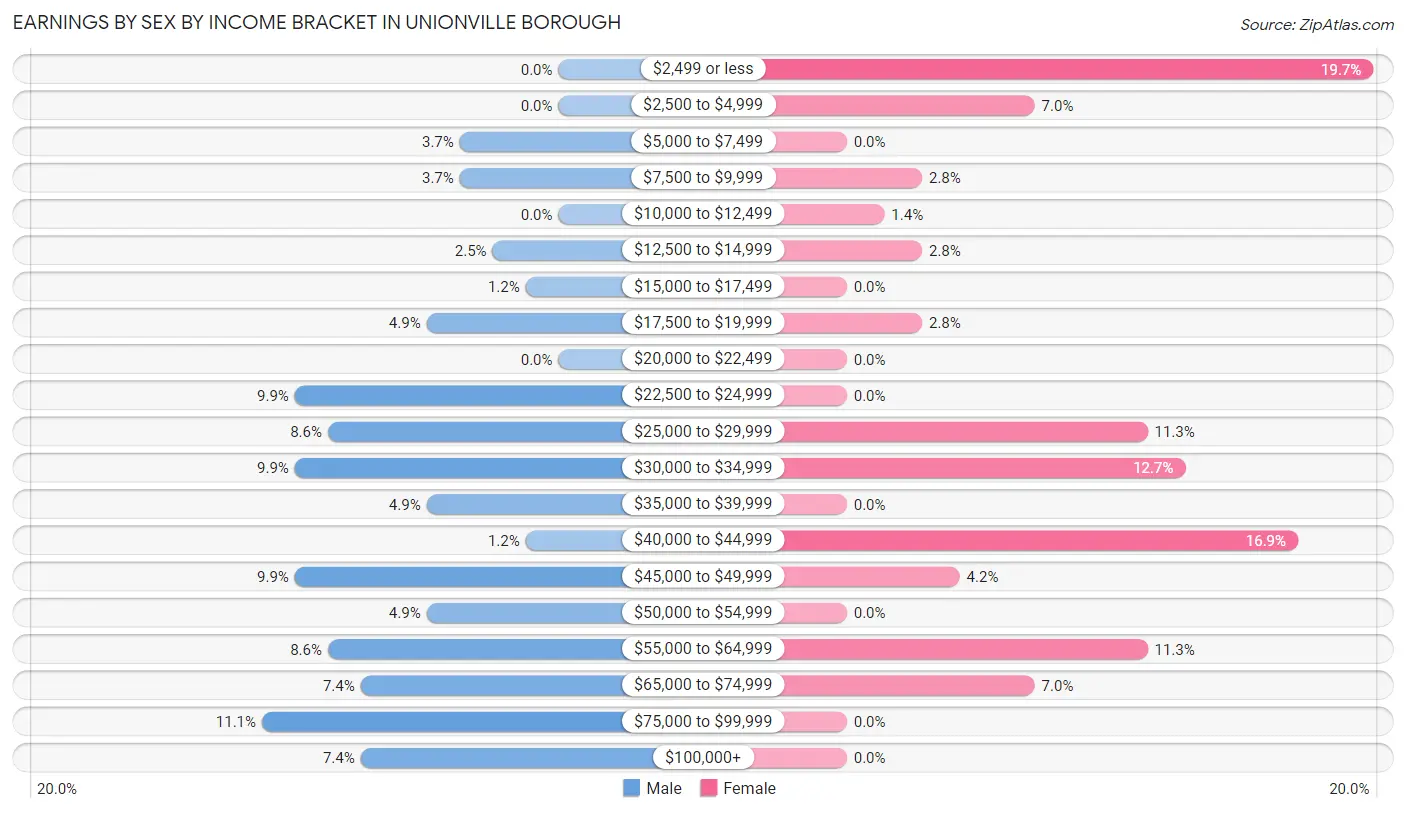
| Income | Male | Female |
| $2,499 or less | 0 (0.0%) | 14 (19.7%) |
| $2,500 to $4,999 | 0 (0.0%) | 5 (7.0%) |
| $5,000 to $7,499 | 3 (3.7%) | 0 (0.0%) |
| $7,500 to $9,999 | 3 (3.7%) | 2 (2.8%) |
| $10,000 to $12,499 | 0 (0.0%) | 1 (1.4%) |
| $12,500 to $14,999 | 2 (2.5%) | 2 (2.8%) |
| $15,000 to $17,499 | 1 (1.2%) | 0 (0.0%) |
| $17,500 to $19,999 | 4 (4.9%) | 2 (2.8%) |
| $20,000 to $22,499 | 0 (0.0%) | 0 (0.0%) |
| $22,500 to $24,999 | 8 (9.9%) | 0 (0.0%) |
| $25,000 to $29,999 | 7 (8.6%) | 8 (11.3%) |
| $30,000 to $34,999 | 8 (9.9%) | 9 (12.7%) |
| $35,000 to $39,999 | 4 (4.9%) | 0 (0.0%) |
| $40,000 to $44,999 | 1 (1.2%) | 12 (16.9%) |
| $45,000 to $49,999 | 8 (9.9%) | 3 (4.2%) |
| $50,000 to $54,999 | 4 (4.9%) | 0 (0.0%) |
| $55,000 to $64,999 | 7 (8.6%) | 8 (11.3%) |
| $65,000 to $74,999 | 6 (7.4%) | 5 (7.0%) |
| $75,000 to $99,999 | 9 (11.1%) | 0 (0.0%) |
| $100,000+ | 6 (7.4%) | 0 (0.0%) |
| Total | 81 (100.0%) | 71 (100.0%) |
Earnings by Sex by Educational Attainment in Unionville borough
Average earnings in Unionville borough are $50,833 for men and $31,667 for women, a difference of 37.7%. Men with an educational attainment of bachelor's degree enjoy the highest average annual earnings of $99,375, while those with high school diploma education earn the least with $51,667. Women with an educational attainment of high school diploma earn the most with the average annual earnings of $42,500, while those with high school diploma education have the smallest earnings of $42,500.
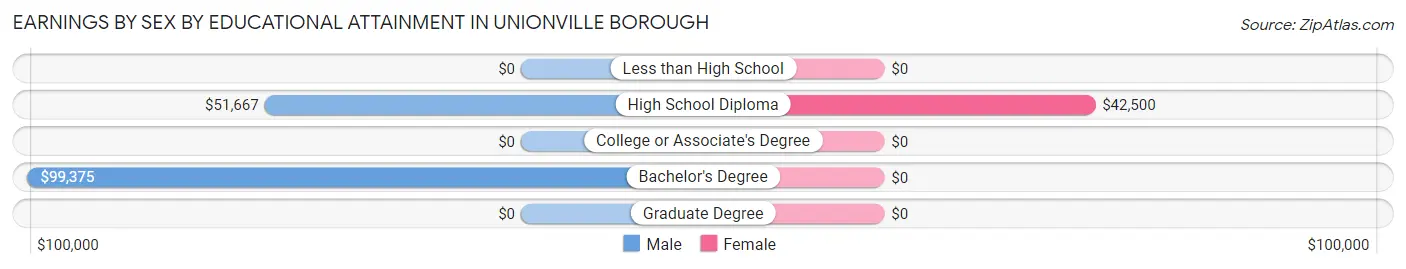
| Educational Attainment | Male Income | Female Income |
| Less than High School | - | - |
| High School Diploma | $51,667 | $42,500 |
| College or Associate's Degree | - | - |
| Bachelor's Degree | $99,375 | $0 |
| Graduate Degree | - | - |
| Total | $50,833 | $31,667 |
Family Income in Unionville borough
Family Income Brackets in Unionville borough
According to the Unionville borough family income data, there are 28 families falling into the $50,000 to $74,999 income range, which is the most common income bracket and makes up 37.8% of all families.
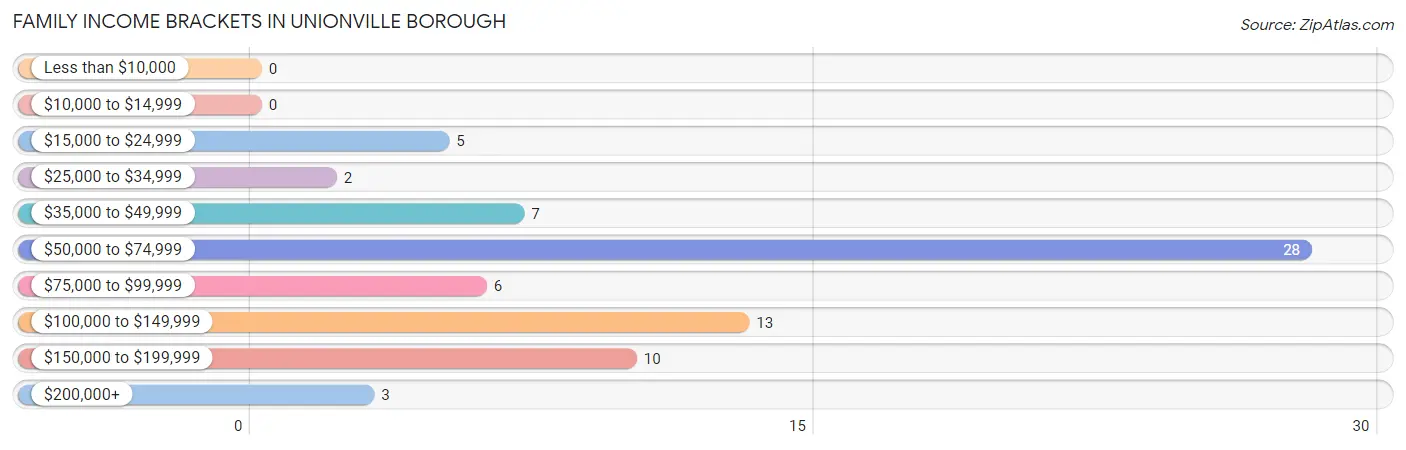
| Income Bracket | # Families | % Families |
| Less than $10,000 | 0 | 0.0% |
| $10,000 to $14,999 | 0 | 0.0% |
| $15,000 to $24,999 | 5 | 6.8% |
| $25,000 to $34,999 | 2 | 2.7% |
| $35,000 to $49,999 | 7 | 9.5% |
| $50,000 to $74,999 | 28 | 37.8% |
| $75,000 to $99,999 | 6 | 8.1% |
| $100,000 to $149,999 | 13 | 17.6% |
| $150,000 to $199,999 | 10 | 13.5% |
| $200,000+ | 3 | 4.1% |
Family Income by Famaliy Size in Unionville borough
5-person families (8 | 10.8%) account for the highest median family income in Unionville borough with $170,833 per family, while 4-person families (14 | 18.9%) have the highest median income of $35,250 per family member.
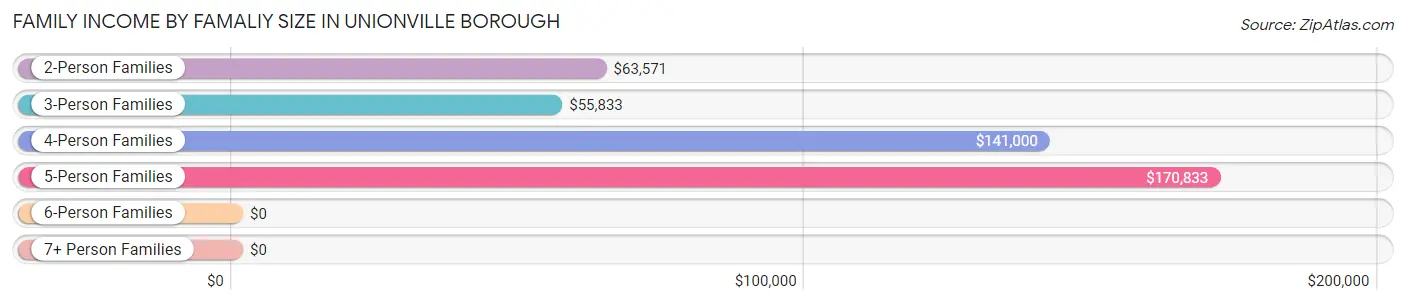
| Income Bracket | # Families | Median Income |
| 2-Person Families | 30 (40.5%) | $63,571 |
| 3-Person Families | 20 (27.0%) | $55,833 |
| 4-Person Families | 14 (18.9%) | $141,000 |
| 5-Person Families | 8 (10.8%) | $170,833 |
| 6-Person Families | 2 (2.7%) | $0 |
| 7+ Person Families | 0 (0.0%) | $0 |
| Total | 74 (100.0%) | $63,571 |
Family Income by Number of Earners in Unionville borough
The median family income in Unionville borough is $63,571, with families comprising 3+ earners (15) having the highest median family income of $170,208, while families with no earners (8) have the lowest median family income of $57,500, accounting for 20.3% and 10.8% of families, respectively.
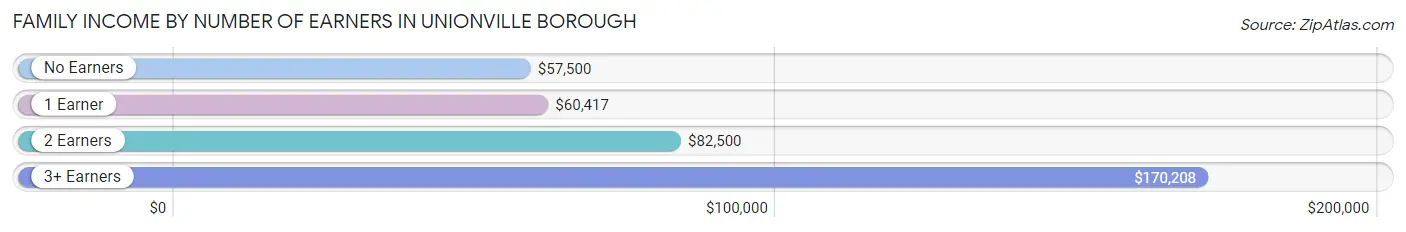
| Number of Earners | # Families | Median Income |
| No Earners | 8 (10.8%) | $57,500 |
| 1 Earner | 21 (28.4%) | $60,417 |
| 2 Earners | 30 (40.5%) | $82,500 |
| 3+ Earners | 15 (20.3%) | $170,208 |
| Total | 74 (100.0%) | $63,571 |
Household Income in Unionville borough
Household Income Brackets in Unionville borough
With 26 households falling in the category, the $50,000 to $74,999 income range is the most frequent in Unionville borough, accounting for 26.8% of all households.
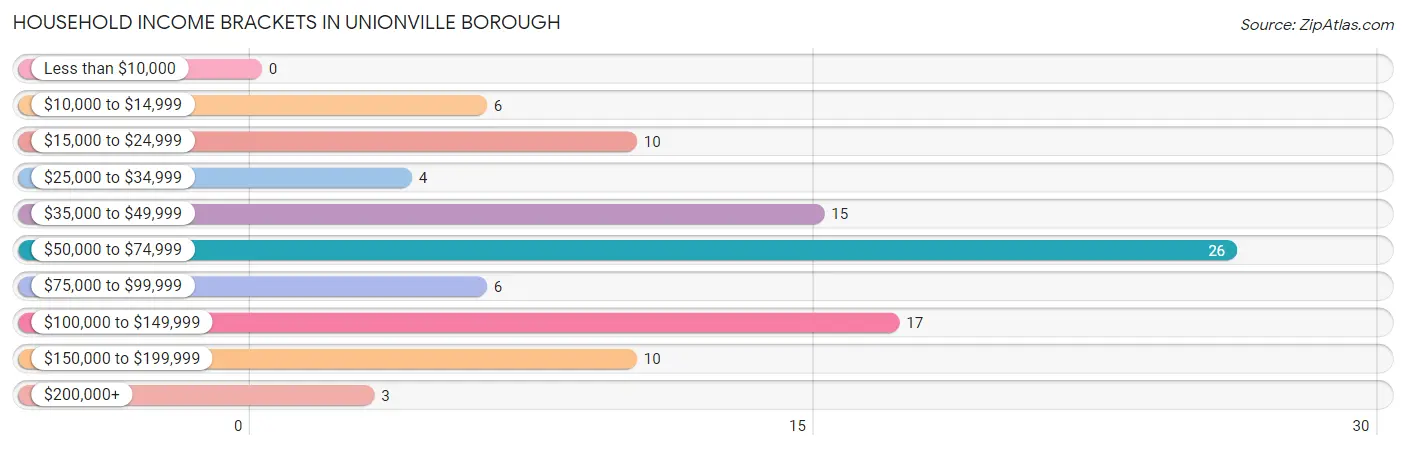
| Income Bracket | # Households | % Households |
| Less than $10,000 | 0 | 0.0% |
| $10,000 to $14,999 | 6 | 6.2% |
| $15,000 to $24,999 | 10 | 10.3% |
| $25,000 to $34,999 | 4 | 4.1% |
| $35,000 to $49,999 | 15 | 15.5% |
| $50,000 to $74,999 | 26 | 26.8% |
| $75,000 to $99,999 | 6 | 6.2% |
| $100,000 to $149,999 | 17 | 17.5% |
| $150,000 to $199,999 | 10 | 10.3% |
| $200,000+ | 3 | 3.1% |
Household Income by Householder Age in Unionville borough
The median household income in Unionville borough is $58,250, with the highest median household income of $87,500 found in the 45 to 64 years age bracket for the primary householder. A total of 34 households (35.0%) fall into this category.
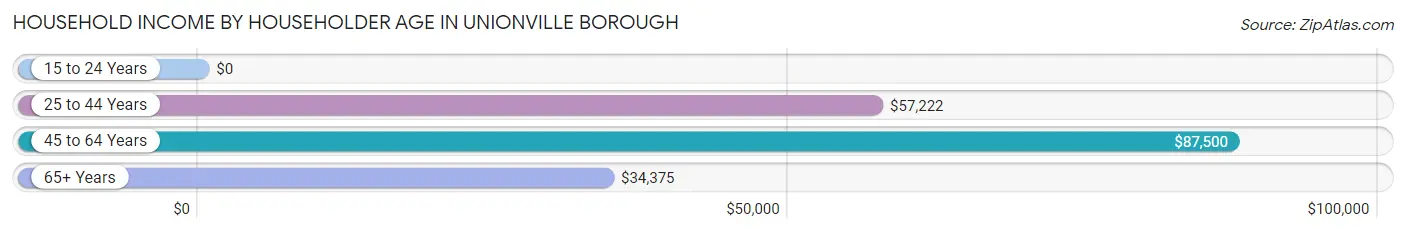
| Income Bracket | # Households | Median Income |
| 15 to 24 Years | 0 (0.0%) | $0 |
| 25 to 44 Years | 38 (39.2%) | $57,222 |
| 45 to 64 Years | 34 (35.0%) | $87,500 |
| 65+ Years | 25 (25.8%) | $34,375 |
| Total | 97 (100.0%) | $58,250 |
Poverty in Unionville borough
Income Below Poverty by Sex and Age in Unionville borough
With 8.3% poverty level for males and 7.4% for females among the residents of Unionville borough, 55 to 64 year old males and 65 to 74 year old females are the most vulnerable to poverty, with 6 males (30.0%) and 5 females (35.7%) in their respective age groups living below the poverty level.
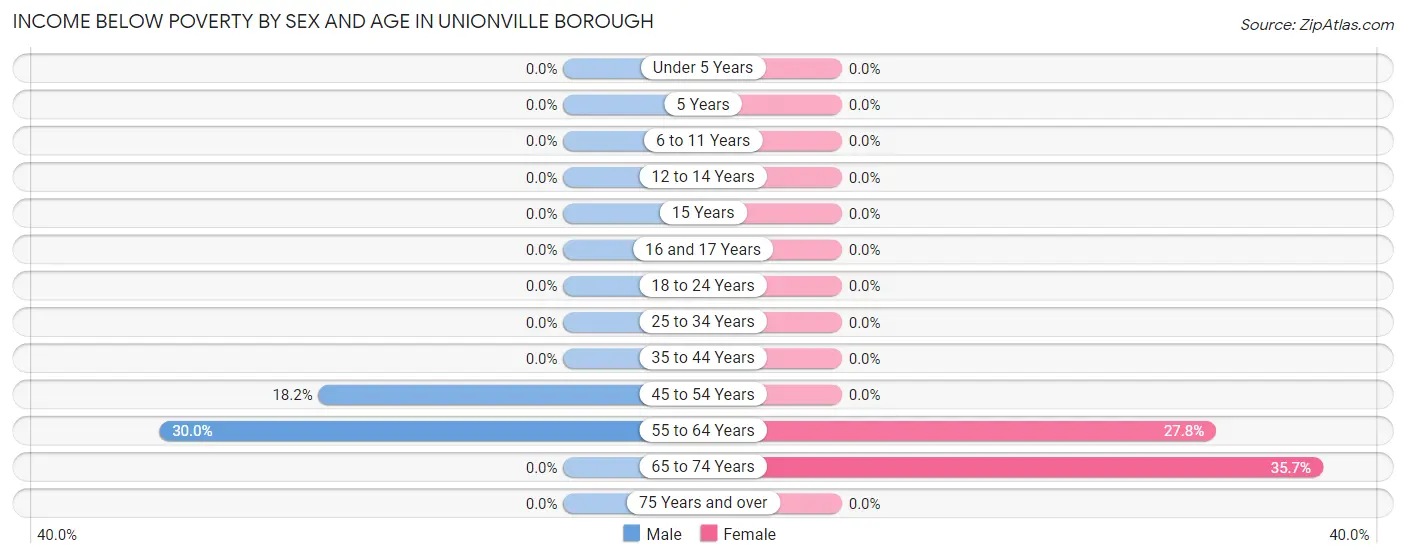
| Age Bracket | Male | Female |
| Under 5 Years | 0 (0.0%) | 0 (0.0%) |
| 5 Years | 0 (0.0%) | 0 (0.0%) |
| 6 to 11 Years | 0 (0.0%) | 0 (0.0%) |
| 12 to 14 Years | 0 (0.0%) | 0 (0.0%) |
| 15 Years | 0 (0.0%) | 0 (0.0%) |
| 16 and 17 Years | 0 (0.0%) | 0 (0.0%) |
| 18 to 24 Years | 0 (0.0%) | 0 (0.0%) |
| 25 to 34 Years | 0 (0.0%) | 0 (0.0%) |
| 35 to 44 Years | 0 (0.0%) | 0 (0.0%) |
| 45 to 54 Years | 4 (18.2%) | 0 (0.0%) |
| 55 to 64 Years | 6 (30.0%) | 5 (27.8%) |
| 65 to 74 Years | 0 (0.0%) | 5 (35.7%) |
| 75 Years and over | 0 (0.0%) | 0 (0.0%) |
| Total | 10 (8.3%) | 10 (7.4%) |
Income Above Poverty by Sex and Age in Unionville borough
According to the poverty statistics in Unionville borough, males aged under 5 years and females aged under 5 years are the age groups that are most secure financially, with 100.0% of males and 100.0% of females in these age groups living above the poverty line.
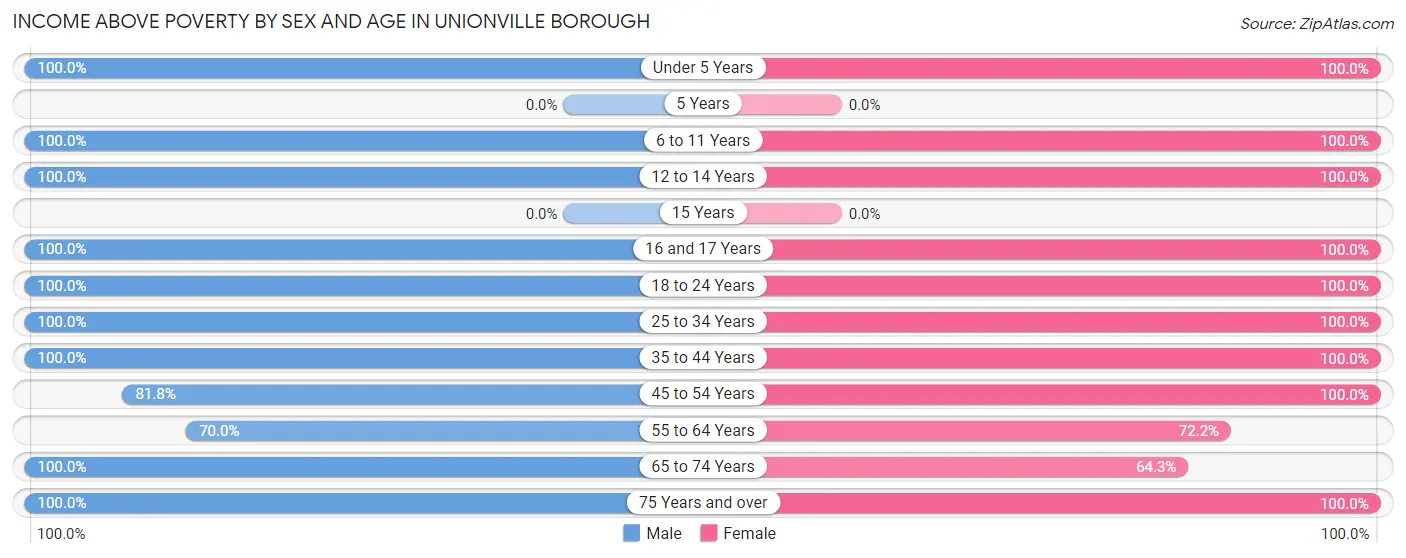
| Age Bracket | Male | Female |
| Under 5 Years | 4 (100.0%) | 3 (100.0%) |
| 5 Years | 0 (0.0%) | 0 (0.0%) |
| 6 to 11 Years | 7 (100.0%) | 9 (100.0%) |
| 12 to 14 Years | 4 (100.0%) | 7 (100.0%) |
| 15 Years | 0 (0.0%) | 0 (0.0%) |
| 16 and 17 Years | 1 (100.0%) | 15 (100.0%) |
| 18 to 24 Years | 20 (100.0%) | 4 (100.0%) |
| 25 to 34 Years | 6 (100.0%) | 17 (100.0%) |
| 35 to 44 Years | 16 (100.0%) | 22 (100.0%) |
| 45 to 54 Years | 18 (81.8%) | 16 (100.0%) |
| 55 to 64 Years | 14 (70.0%) | 13 (72.2%) |
| 65 to 74 Years | 14 (100.0%) | 9 (64.3%) |
| 75 Years and over | 7 (100.0%) | 10 (100.0%) |
| Total | 111 (91.7%) | 125 (92.6%) |
Income Below Poverty Among Married-Couple Families in Unionville borough
The poverty statistics for married-couple families in Unionville borough show that 8.6% or 5 of the total 58 families live below the poverty line. Families with no children have the highest poverty rate of 14.7%, comprising of 5 families. On the other hand, families with 1 or 2 children have the lowest poverty rate of 0.0%, which includes 0 families.
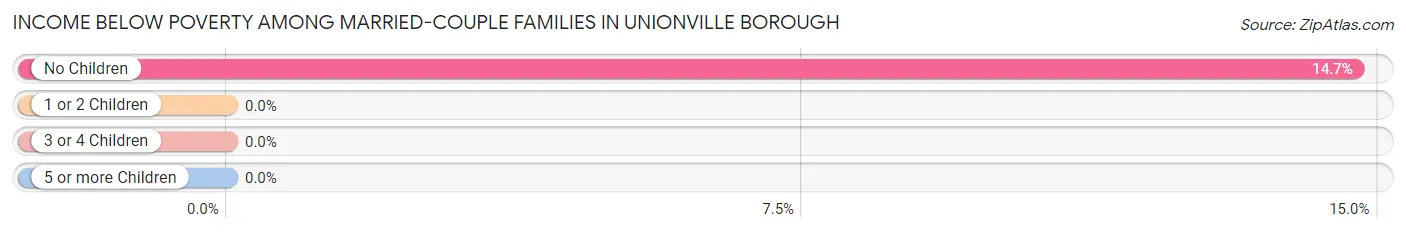
| Children | Above Poverty | Below Poverty |
| No Children | 29 (85.3%) | 5 (14.7%) |
| 1 or 2 Children | 22 (100.0%) | 0 (0.0%) |
| 3 or 4 Children | 2 (100.0%) | 0 (0.0%) |
| 5 or more Children | 0 (0.0%) | 0 (0.0%) |
| Total | 53 (91.4%) | 5 (8.6%) |
Income Below Poverty Among Single-Parent Households in Unionville borough
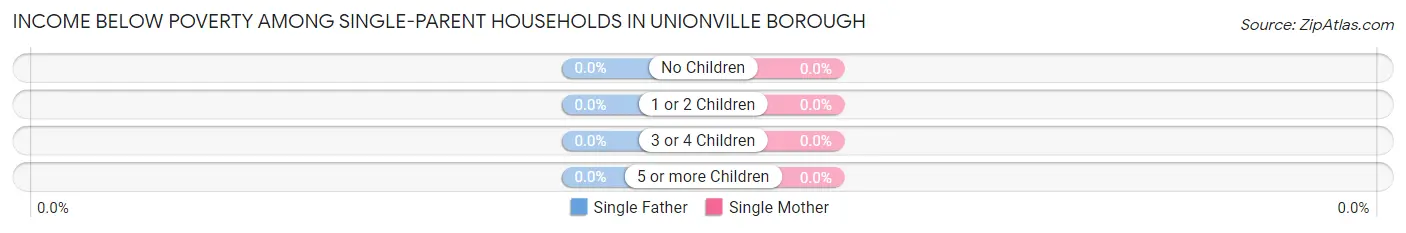
| Children | Single Father | Single Mother |
| No Children | 0 (0.0%) | 0 (0.0%) |
| 1 or 2 Children | 0 (0.0%) | 0 (0.0%) |
| 3 or 4 Children | 0 (0.0%) | 0 (0.0%) |
| 5 or more Children | 0 (0.0%) | 0 (0.0%) |
| Total | 0 (0.0%) | 0 (0.0%) |
Income Below Poverty Among Married-Couple vs Single-Parent Households in Unionville borough
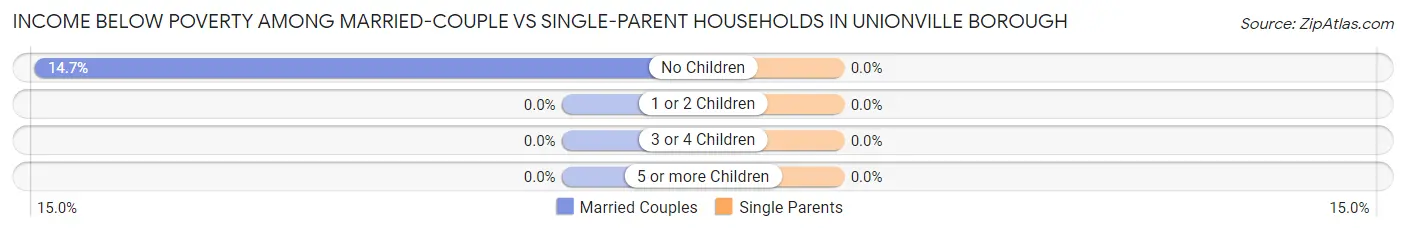
| Children | Married-Couple Families | Single-Parent Households |
| No Children | 5 (14.7%) | 0 (0.0%) |
| 1 or 2 Children | 0 (0.0%) | 0 (0.0%) |
| 3 or 4 Children | 0 (0.0%) | 0 (0.0%) |
| 5 or more Children | 0 (0.0%) | 0 (0.0%) |
| Total | 5 (8.6%) | 0 (0.0%) |
Employment Characteristics in Unionville borough
Employment by Class of Employer in Unionville borough
Among the 144 employed individuals in Unionville borough, private company employees (117 | 81.2%), not-for-profit organizations (11 | 7.6%), and state government employees (9 | 6.2%) make up the most common classes of employment.
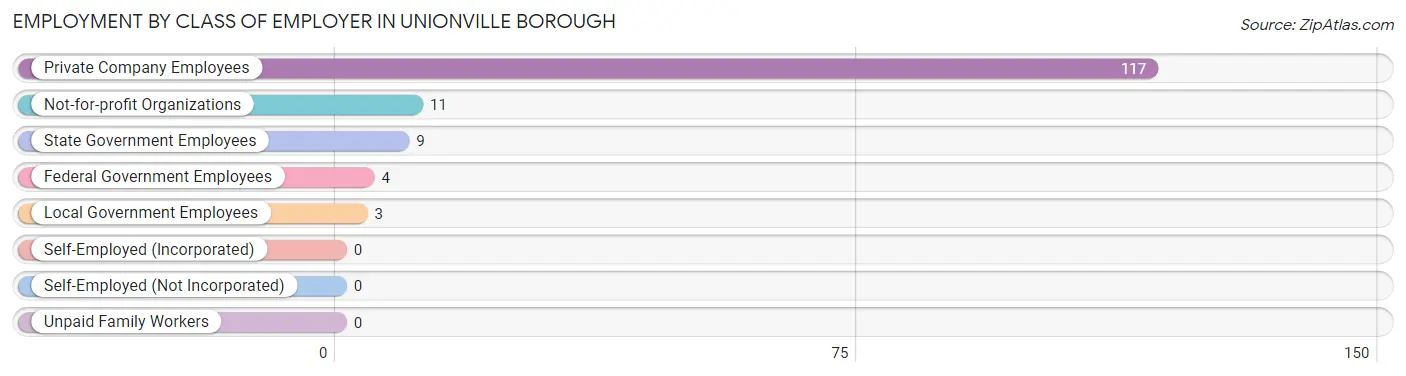
| Employer Class | # Employees | % Employees |
| Private Company Employees | 117 | 81.2% |
| Self-Employed (Incorporated) | 0 | 0.0% |
| Self-Employed (Not Incorporated) | 0 | 0.0% |
| Not-for-profit Organizations | 11 | 7.6% |
| Local Government Employees | 3 | 2.1% |
| State Government Employees | 9 | 6.2% |
| Federal Government Employees | 4 | 2.8% |
| Unpaid Family Workers | 0 | 0.0% |
| Total | 144 | 100.0% |
Employment Status by Age in Unionville borough
According to the labor force statistics for Unionville borough, out of the total population over 16 years of age (222), 66.2% or 147 individuals are in the labor force, with 0.7% or 1 of them unemployed. The age group with the highest labor force participation rate is 25 to 29 years, with 100.0% or 15 individuals in the labor force. Within the labor force, the 16 to 19 years age range has the highest percentage of unemployed individuals, with 14.3% or 1 of them being unemployed.
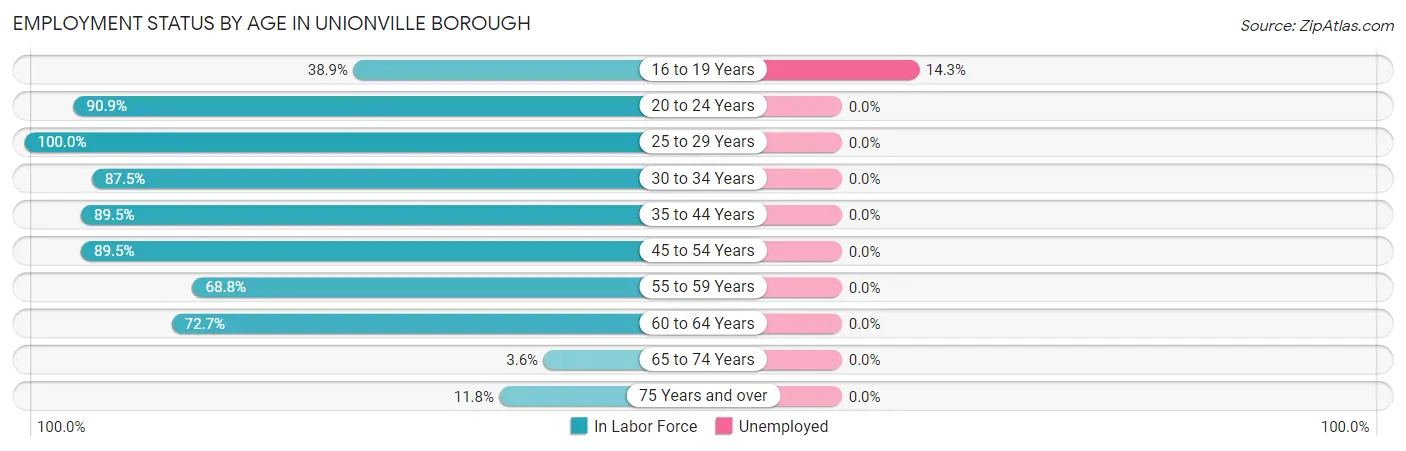
| Age Bracket | In Labor Force | Unemployed |
| 16 to 19 Years | 7 (38.9%) | 1 (14.3%) |
| 20 to 24 Years | 20 (90.9%) | 0 (0.0%) |
| 25 to 29 Years | 15 (100.0%) | 0 (0.0%) |
| 30 to 34 Years | 7 (87.5%) | 0 (0.0%) |
| 35 to 44 Years | 34 (89.5%) | 0 (0.0%) |
| 45 to 54 Years | 34 (89.5%) | 0 (0.0%) |
| 55 to 59 Years | 11 (68.8%) | 0 (0.0%) |
| 60 to 64 Years | 16 (72.7%) | 0 (0.0%) |
| 65 to 74 Years | 1 (3.6%) | 0 (0.0%) |
| 75 Years and over | 2 (11.8%) | 0 (0.0%) |
| Total | 147 (66.2%) | 1 (0.7%) |
Employment Status by Educational Attainment in Unionville borough
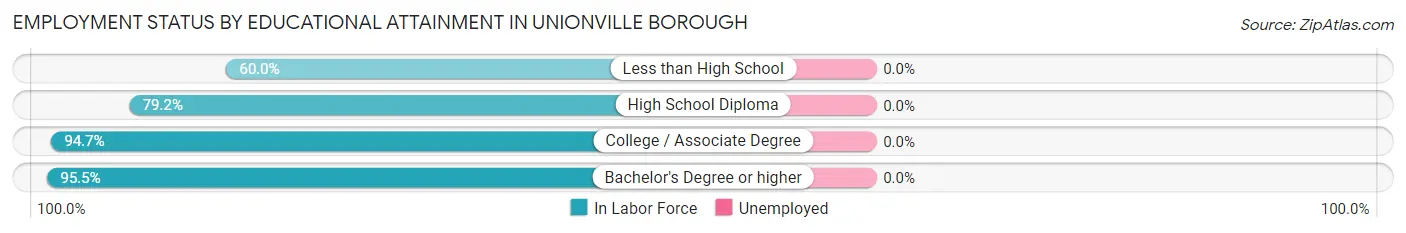
| Educational Attainment | In Labor Force | Unemployed |
| Less than High School | 3 (60.0%) | 0 (0.0%) |
| High School Diploma | 57 (79.2%) | 0 (0.0%) |
| College / Associate Degree | 36 (94.7%) | 0 (0.0%) |
| Bachelor's Degree or higher | 21 (95.5%) | 0 (0.0%) |
| Total | 117 (85.4%) | 0 (0.0%) |
Employment Occupations by Sex in Unionville borough
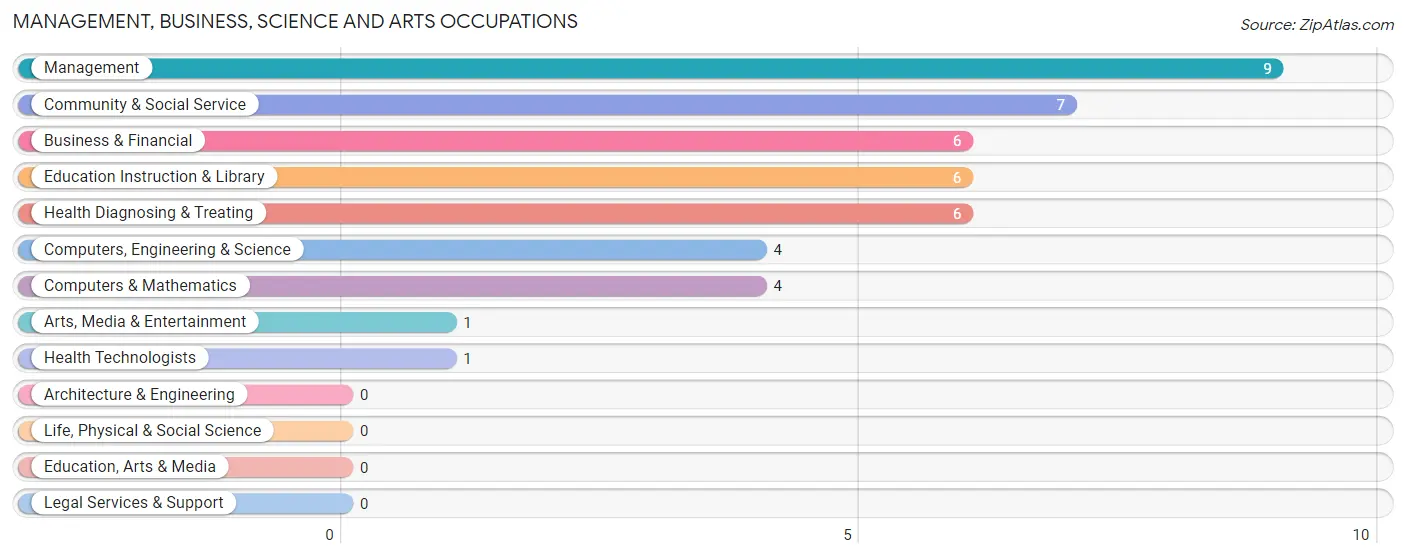
Management, Business, Science and Arts Occupations
The most common Management, Business, Science and Arts occupations in Unionville borough are Management (9 | 6.2%), Community & Social Service (7 | 4.8%), Business & Financial (6 | 4.1%), Education Instruction & Library (6 | 4.1%), and Health Diagnosing & Treating (6 | 4.1%).
Management, Business, Science and Arts Occupations by Sex
Within the Management, Business, Science and Arts occupations in Unionville borough, the most male-oriented occupations are Business & Financial (100.0%), Computers, Engineering & Science (100.0%), and Computers & Mathematics (100.0%), while the most female-oriented occupations are Education Instruction & Library (100.0%), Health Technologists (100.0%), and Community & Social Service (85.7%).
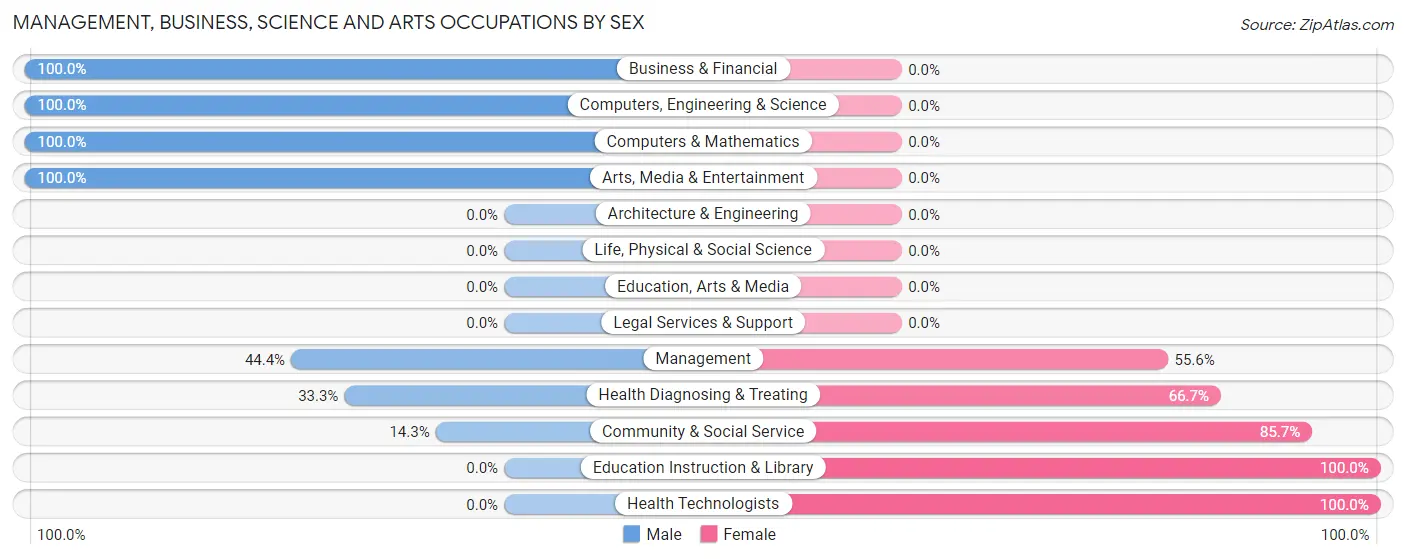
| Occupation | Male | Female |
| Management | 4 (44.4%) | 5 (55.6%) |
| Business & Financial | 6 (100.0%) | 0 (0.0%) |
| Computers, Engineering & Science | 4 (100.0%) | 0 (0.0%) |
| Computers & Mathematics | 4 (100.0%) | 0 (0.0%) |
| Architecture & Engineering | 0 (0.0%) | 0 (0.0%) |
| Life, Physical & Social Science | 0 (0.0%) | 0 (0.0%) |
| Community & Social Service | 1 (14.3%) | 6 (85.7%) |
| Education, Arts & Media | 0 (0.0%) | 0 (0.0%) |
| Legal Services & Support | 0 (0.0%) | 0 (0.0%) |
| Education Instruction & Library | 0 (0.0%) | 6 (100.0%) |
| Arts, Media & Entertainment | 1 (100.0%) | 0 (0.0%) |
| Health Diagnosing & Treating | 2 (33.3%) | 4 (66.7%) |
| Health Technologists | 0 (0.0%) | 1 (100.0%) |
| Total (Category) | 17 (53.1%) | 15 (46.9%) |
| Total (Overall) | 79 (54.1%) | 67 (45.9%) |
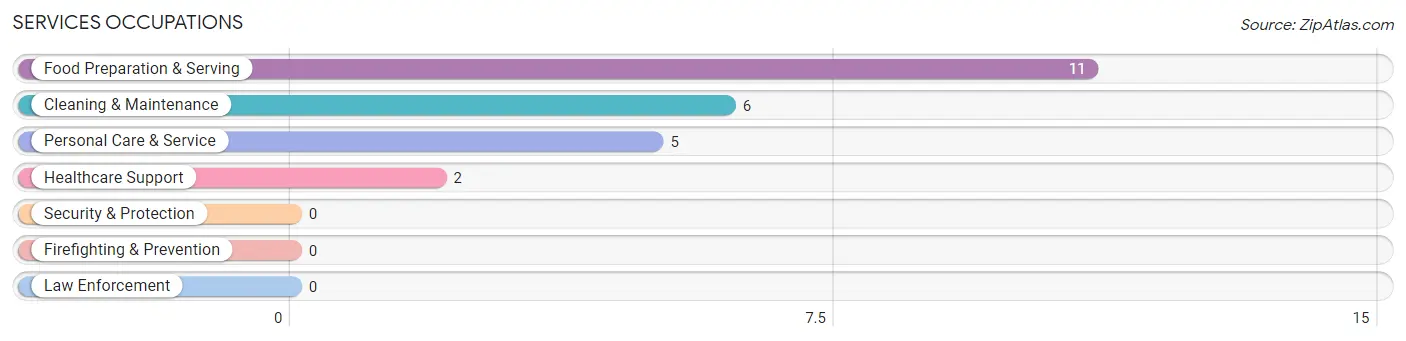
Services Occupations
The most common Services occupations in Unionville borough are Food Preparation & Serving (11 | 7.5%), Cleaning & Maintenance (6 | 4.1%), Personal Care & Service (5 | 3.4%), and Healthcare Support (2 | 1.4%).
Services Occupations by Sex
Within the Services occupations in Unionville borough, the most male-oriented occupations are Healthcare Support (100.0%), and Food Preparation & Serving (54.5%), while the most female-oriented occupations are Cleaning & Maintenance (100.0%), Personal Care & Service (100.0%), and Food Preparation & Serving (45.5%).
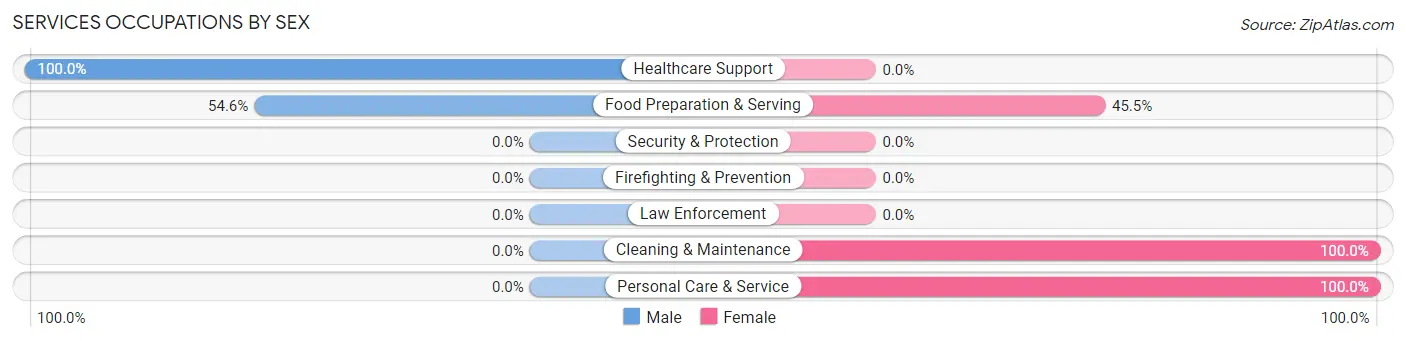
| Occupation | Male | Female |
| Healthcare Support | 2 (100.0%) | 0 (0.0%) |
| Security & Protection | 0 (0.0%) | 0 (0.0%) |
| Firefighting & Prevention | 0 (0.0%) | 0 (0.0%) |
| Law Enforcement | 0 (0.0%) | 0 (0.0%) |
| Food Preparation & Serving | 6 (54.5%) | 5 (45.5%) |
| Cleaning & Maintenance | 0 (0.0%) | 6 (100.0%) |
| Personal Care & Service | 0 (0.0%) | 5 (100.0%) |
| Total (Category) | 8 (33.3%) | 16 (66.7%) |
| Total (Overall) | 79 (54.1%) | 67 (45.9%) |
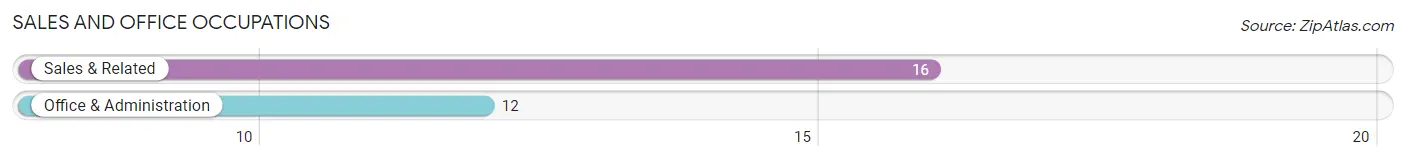
Sales and Office Occupations
The most common Sales and Office occupations in Unionville borough are Sales & Related (16 | 11.0%), and Office & Administration (12 | 8.2%).
Sales and Office Occupations by Sex
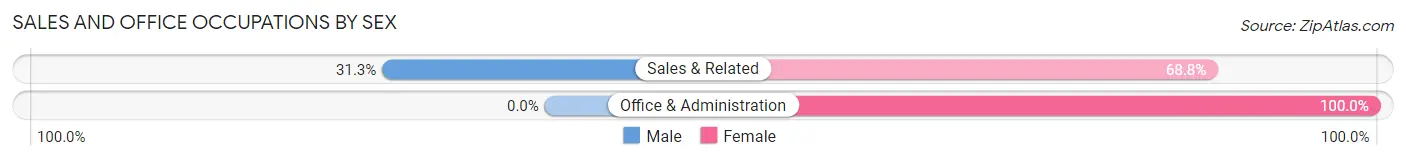
| Occupation | Male | Female |
| Sales & Related | 5 (31.2%) | 11 (68.8%) |
| Office & Administration | 0 (0.0%) | 12 (100.0%) |
| Total (Category) | 5 (17.9%) | 23 (82.1%) |
| Total (Overall) | 79 (54.1%) | 67 (45.9%) |
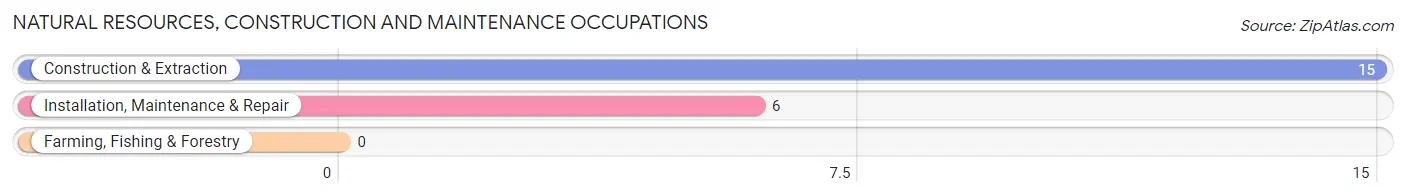
Natural Resources, Construction and Maintenance Occupations
The most common Natural Resources, Construction and Maintenance occupations in Unionville borough are Construction & Extraction (15 | 10.3%), and Installation, Maintenance & Repair (6 | 4.1%).
Natural Resources, Construction and Maintenance Occupations by Sex
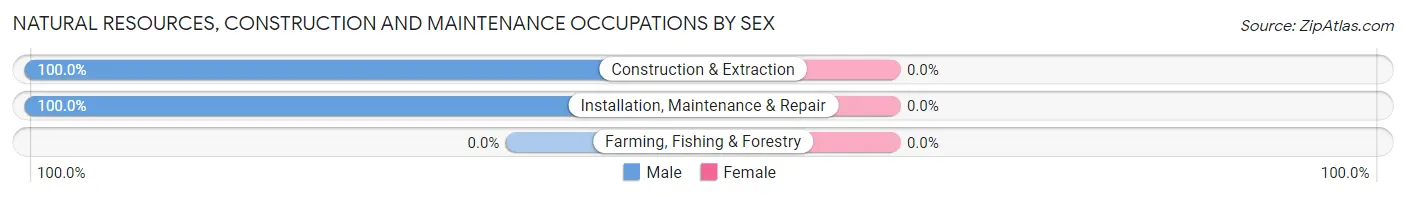
| Occupation | Male | Female |
| Farming, Fishing & Forestry | 0 (0.0%) | 0 (0.0%) |
| Construction & Extraction | 15 (100.0%) | 0 (0.0%) |
| Installation, Maintenance & Repair | 6 (100.0%) | 0 (0.0%) |
| Total (Category) | 21 (100.0%) | 0 (0.0%) |
| Total (Overall) | 79 (54.1%) | 67 (45.9%) |
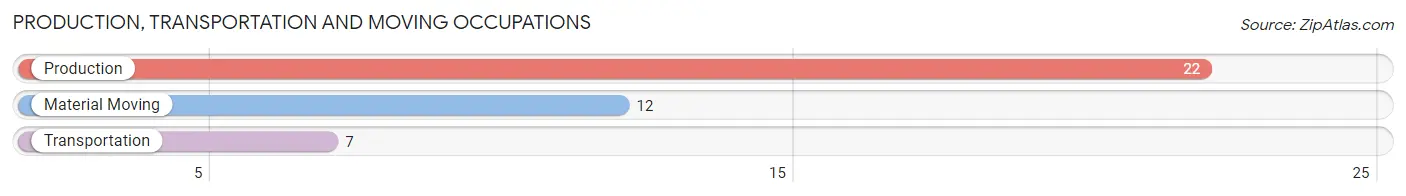
Production, Transportation and Moving Occupations
The most common Production, Transportation and Moving occupations in Unionville borough are Production (22 | 15.1%), Material Moving (12 | 8.2%), and Transportation (7 | 4.8%).
Production, Transportation and Moving Occupations by Sex
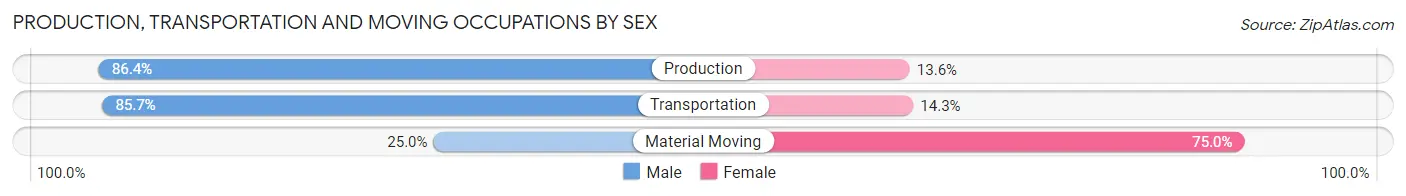
| Occupation | Male | Female |
| Production | 19 (86.4%) | 3 (13.6%) |
| Transportation | 6 (85.7%) | 1 (14.3%) |
| Material Moving | 3 (25.0%) | 9 (75.0%) |
| Total (Category) | 28 (68.3%) | 13 (31.7%) |
| Total (Overall) | 79 (54.1%) | 67 (45.9%) |
Employment Industries by Sex in Unionville borough
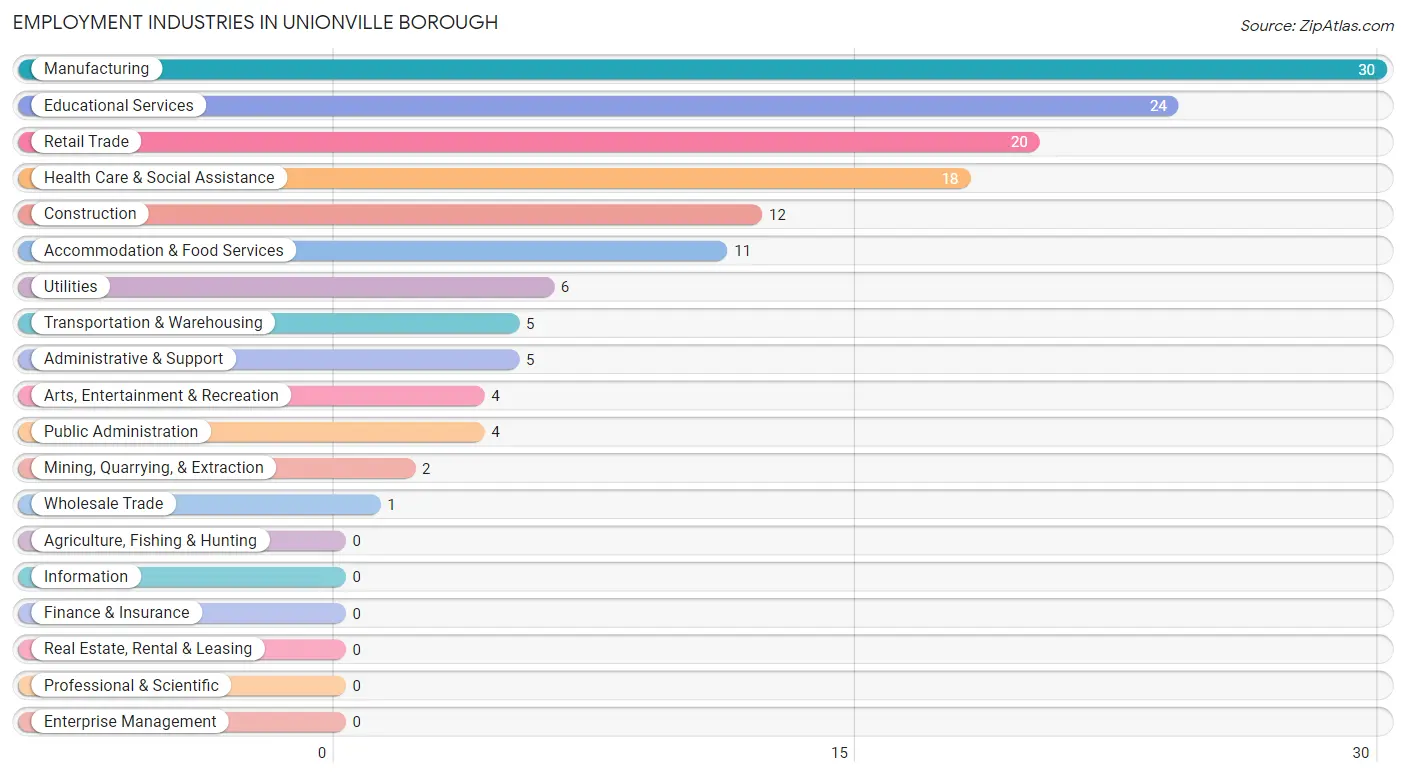
Employment Industries in Unionville borough
The major employment industries in Unionville borough include Manufacturing (30 | 20.5%), Educational Services (24 | 16.4%), Retail Trade (20 | 13.7%), Health Care & Social Assistance (18 | 12.3%), and Construction (12 | 8.2%).
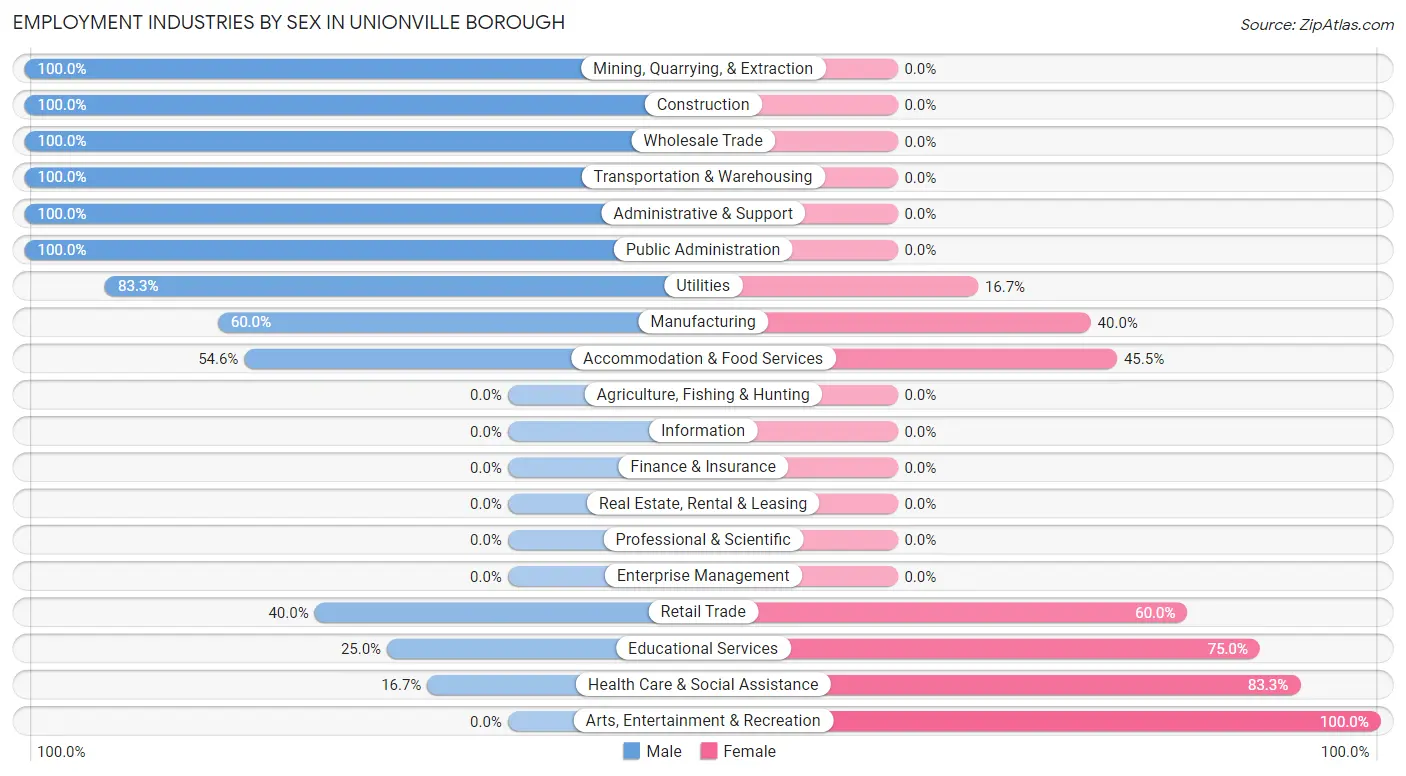
Employment Industries by Sex in Unionville borough
The Unionville borough industries that see more men than women are Mining, Quarrying, & Extraction (100.0%), Construction (100.0%), and Wholesale Trade (100.0%), whereas the industries that tend to have a higher number of women are Arts, Entertainment & Recreation (100.0%), Health Care & Social Assistance (83.3%), and Educational Services (75.0%).
| Industry | Male | Female |
| Agriculture, Fishing & Hunting | 0 (0.0%) | 0 (0.0%) |
| Mining, Quarrying, & Extraction | 2 (100.0%) | 0 (0.0%) |
| Construction | 12 (100.0%) | 0 (0.0%) |
| Manufacturing | 18 (60.0%) | 12 (40.0%) |
| Wholesale Trade | 1 (100.0%) | 0 (0.0%) |
| Retail Trade | 8 (40.0%) | 12 (60.0%) |
| Transportation & Warehousing | 5 (100.0%) | 0 (0.0%) |
| Utilities | 5 (83.3%) | 1 (16.7%) |
| Information | 0 (0.0%) | 0 (0.0%) |
| Finance & Insurance | 0 (0.0%) | 0 (0.0%) |
| Real Estate, Rental & Leasing | 0 (0.0%) | 0 (0.0%) |
| Professional & Scientific | 0 (0.0%) | 0 (0.0%) |
| Enterprise Management | 0 (0.0%) | 0 (0.0%) |
| Administrative & Support | 5 (100.0%) | 0 (0.0%) |
| Educational Services | 6 (25.0%) | 18 (75.0%) |
| Health Care & Social Assistance | 3 (16.7%) | 15 (83.3%) |
| Arts, Entertainment & Recreation | 0 (0.0%) | 4 (100.0%) |
| Accommodation & Food Services | 6 (54.5%) | 5 (45.5%) |
| Public Administration | 4 (100.0%) | 0 (0.0%) |
| Total | 79 (54.1%) | 67 (45.9%) |
Education in Unionville borough
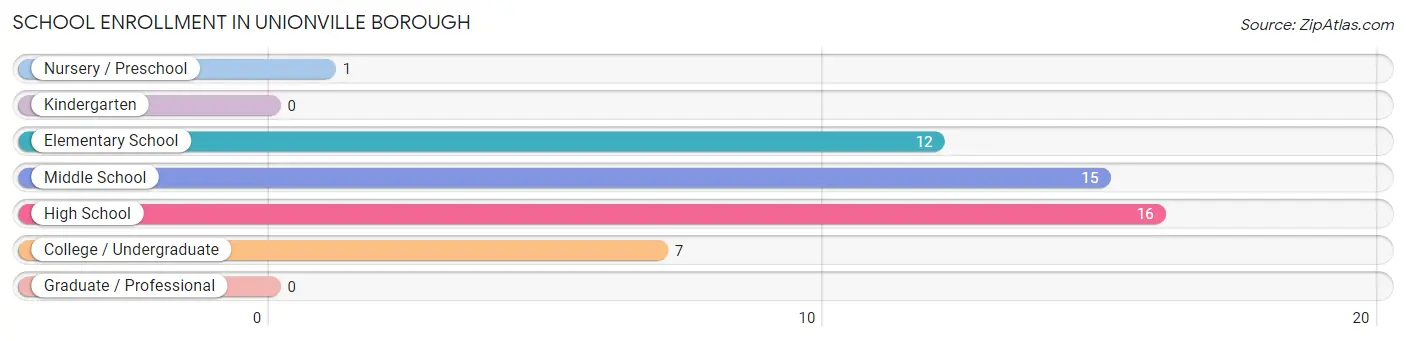
School Enrollment in Unionville borough
The most common levels of schooling among the 51 students in Unionville borough are high school (16 | 31.4%), middle school (15 | 29.4%), and elementary school (12 | 23.5%).
| School Level | # Students | % Students |
| Nursery / Preschool | 1 | 2.0% |
| Kindergarten | 0 | 0.0% |
| Elementary School | 12 | 23.5% |
| Middle School | 15 | 29.4% |
| High School | 16 | 31.4% |
| College / Undergraduate | 7 | 13.7% |
| Graduate / Professional | 0 | 0.0% |
| Total | 51 | 100.0% |
School Enrollment by Age by Funding Source in Unionville borough
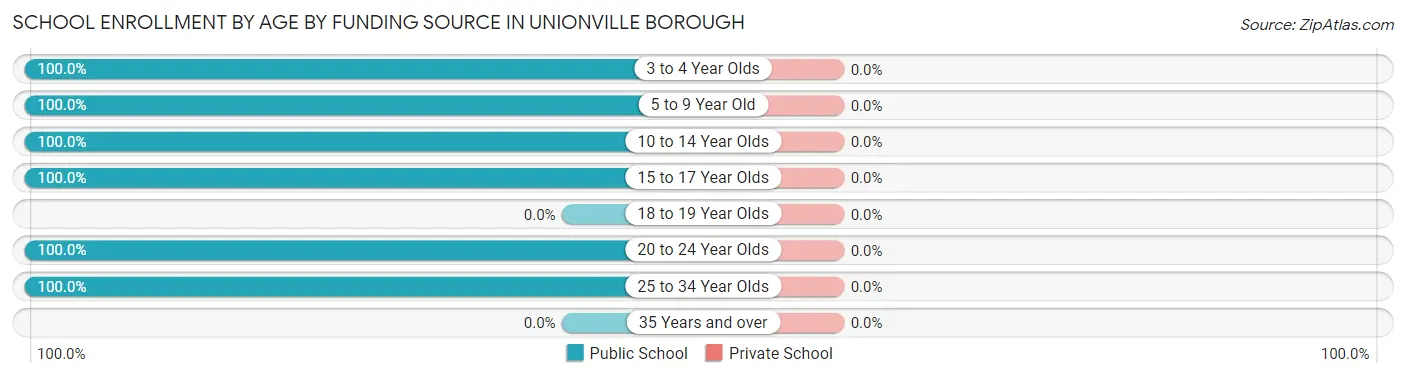
| Age Bracket | Public School | Private School |
| 3 to 4 Year Olds | 1 (100.0%) | 0 (0.0%) |
| 5 to 9 Year Old | 7 (100.0%) | 0 (0.0%) |
| 10 to 14 Year Olds | 20 (100.0%) | 0 (0.0%) |
| 15 to 17 Year Olds | 16 (100.0%) | 0 (0.0%) |
| 18 to 19 Year Olds | 0 (0.0%) | 0 (0.0%) |
| 20 to 24 Year Olds | 4 (100.0%) | 0 (0.0%) |
| 25 to 34 Year Olds | 3 (100.0%) | 0 (0.0%) |
| 35 Years and over | 0 (0.0%) | 0 (0.0%) |
| Total | 51 (100.0%) | 0 (0.0%) |
Educational Attainment by Field of Study in Unionville borough
Education (9 | 20.4%), business (6 | 13.6%), engineering (5 | 11.4%), multidisciplinary studies (5 | 11.4%), and liberal arts & history (5 | 11.4%) are the most common fields of study among 44 individuals in Unionville borough who have obtained a bachelor's degree or higher.
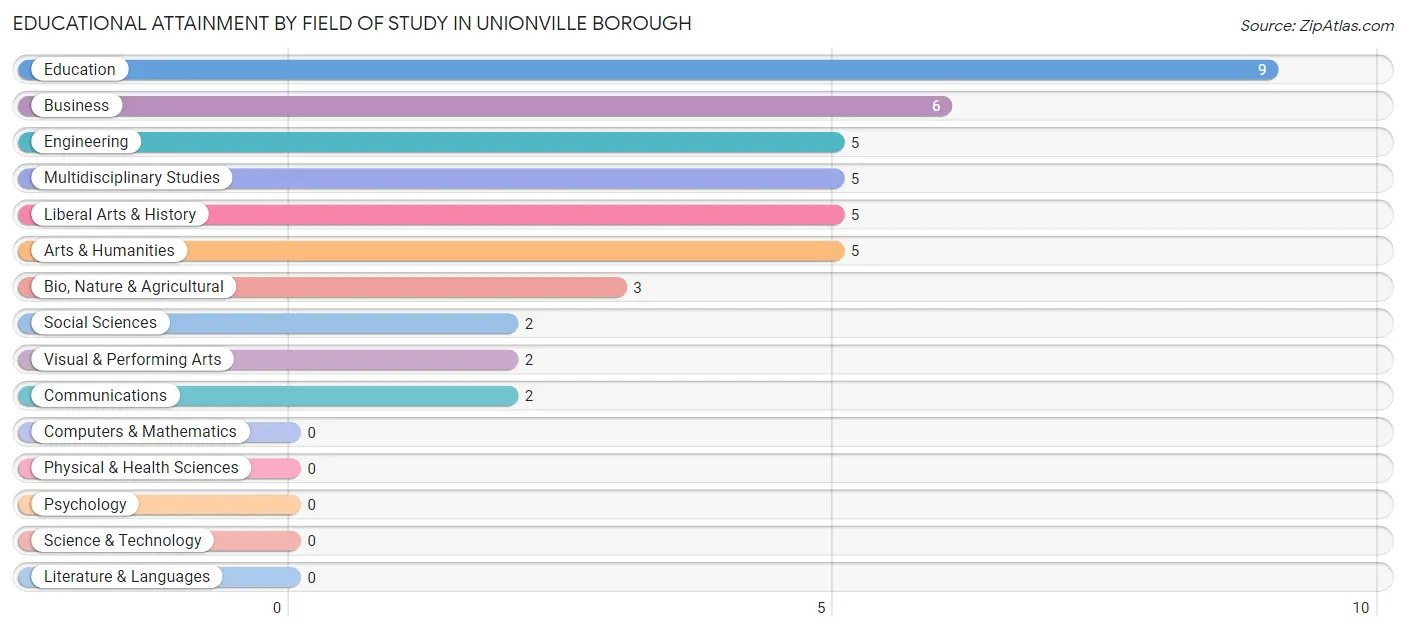
| Field of Study | # Graduates | % Graduates |
| Computers & Mathematics | 0 | 0.0% |
| Bio, Nature & Agricultural | 3 | 6.8% |
| Physical & Health Sciences | 0 | 0.0% |
| Psychology | 0 | 0.0% |
| Social Sciences | 2 | 4.5% |
| Engineering | 5 | 11.4% |
| Multidisciplinary Studies | 5 | 11.4% |
| Science & Technology | 0 | 0.0% |
| Business | 6 | 13.6% |
| Education | 9 | 20.4% |
| Literature & Languages | 0 | 0.0% |
| Liberal Arts & History | 5 | 11.4% |
| Visual & Performing Arts | 2 | 4.5% |
| Communications | 2 | 4.5% |
| Arts & Humanities | 5 | 11.4% |
| Total | 44 | 100.0% |
Transportation & Commute in Unionville borough
Vehicle Availability by Sex in Unionville borough
The most prevalent vehicle ownership categories in Unionville borough are males with 2 vehicles (36, accounting for 45.6%) and females with 2 vehicles (17, making up 55.4%).
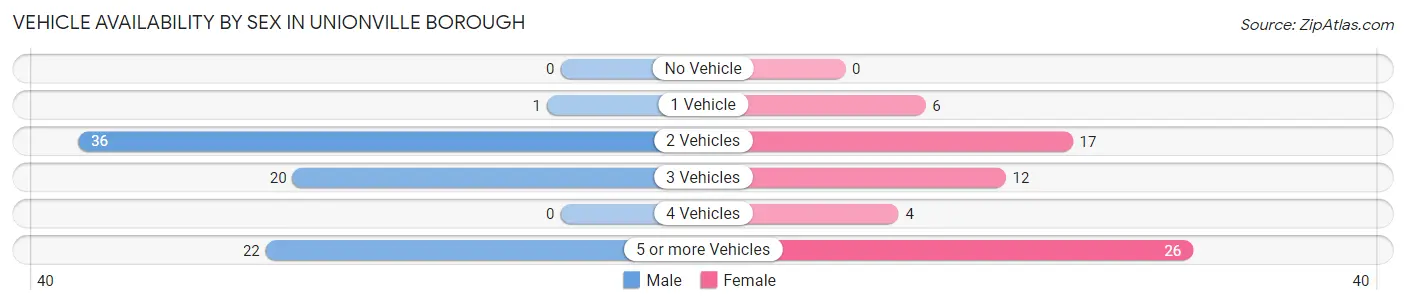
| Vehicles Available | Male | Female |
| No Vehicle | 0 (0.0%) | 0 (0.0%) |
| 1 Vehicle | 1 (1.3%) | 6 (9.2%) |
| 2 Vehicles | 36 (45.6%) | 17 (26.2%) |
| 3 Vehicles | 20 (25.3%) | 12 (18.5%) |
| 4 Vehicles | 0 (0.0%) | 4 (6.1%) |
| 5 or more Vehicles | 22 (27.9%) | 26 (40.0%) |
| Total | 79 (100.0%) | 65 (100.0%) |
Commute Time in Unionville borough
The most frequently occuring commute durations in Unionville borough are 20 to 24 minutes (37 commuters, 26.8%), 30 to 34 minutes (36 commuters, 26.1%), and 25 to 29 minutes (34 commuters, 24.6%).
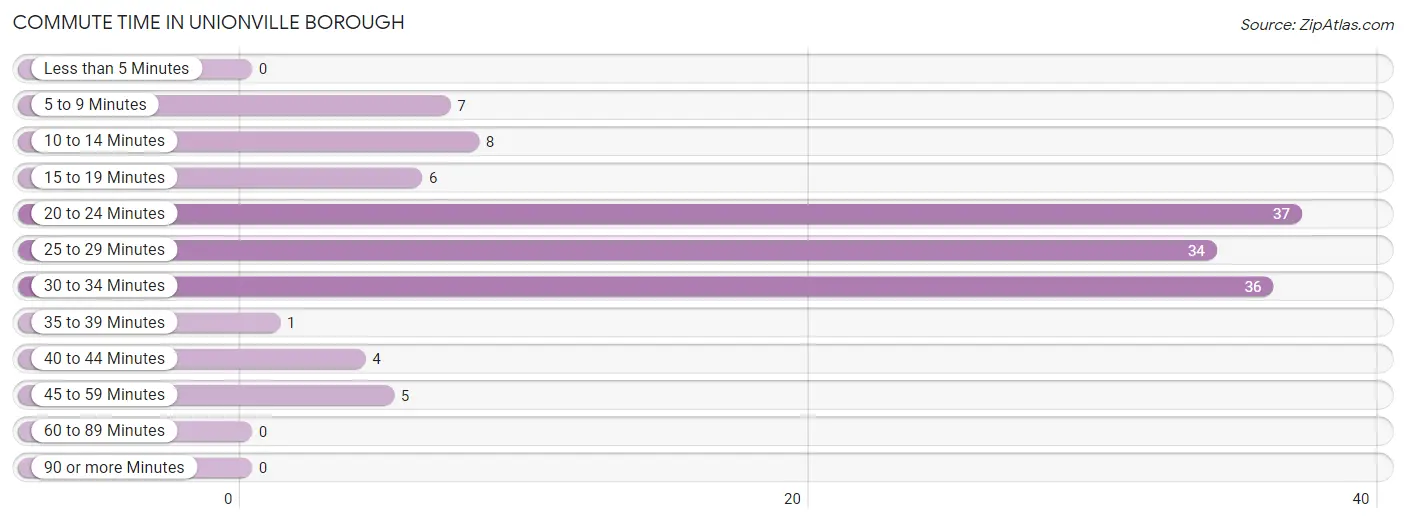
| Commute Time | # Commuters | % Commuters |
| Less than 5 Minutes | 0 | 0.0% |
| 5 to 9 Minutes | 7 | 5.1% |
| 10 to 14 Minutes | 8 | 5.8% |
| 15 to 19 Minutes | 6 | 4.3% |
| 20 to 24 Minutes | 37 | 26.8% |
| 25 to 29 Minutes | 34 | 24.6% |
| 30 to 34 Minutes | 36 | 26.1% |
| 35 to 39 Minutes | 1 | 0.7% |
| 40 to 44 Minutes | 4 | 2.9% |
| 45 to 59 Minutes | 5 | 3.6% |
| 60 to 89 Minutes | 0 | 0.0% |
| 90 or more Minutes | 0 | 0.0% |
Commute Time by Sex in Unionville borough
The most common commute times in Unionville borough are 20 to 24 minutes (23 commuters, 31.5%) for males and 25 to 29 minutes (23 commuters, 35.4%) for females.
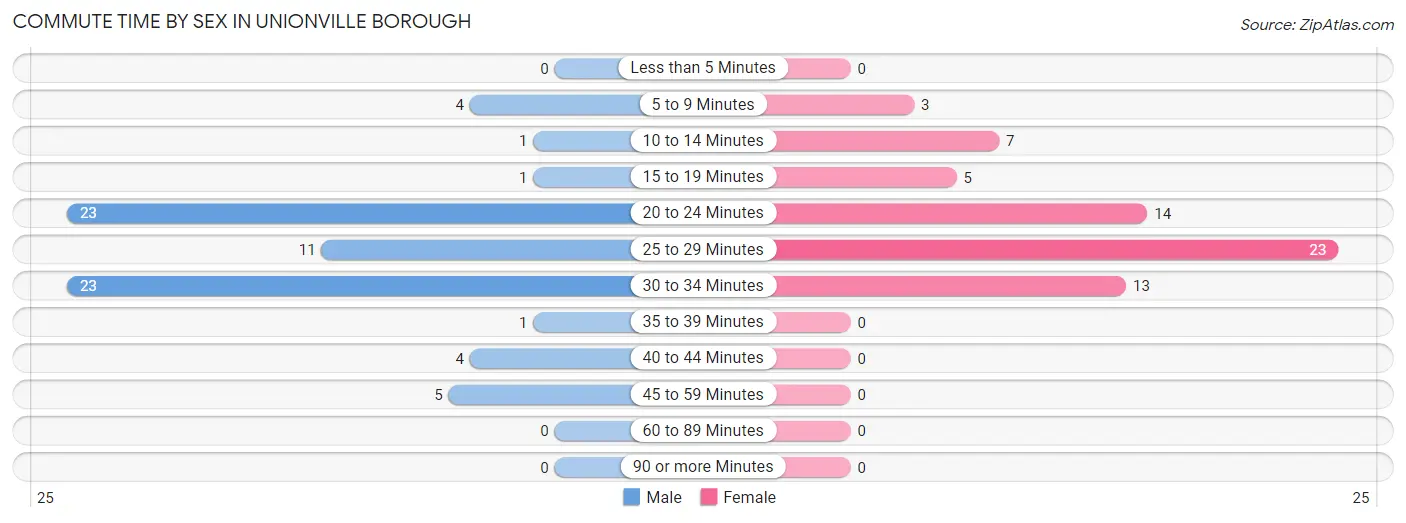
| Commute Time | Male | Female |
| Less than 5 Minutes | 0 (0.0%) | 0 (0.0%) |
| 5 to 9 Minutes | 4 (5.5%) | 3 (4.6%) |
| 10 to 14 Minutes | 1 (1.4%) | 7 (10.8%) |
| 15 to 19 Minutes | 1 (1.4%) | 5 (7.7%) |
| 20 to 24 Minutes | 23 (31.5%) | 14 (21.5%) |
| 25 to 29 Minutes | 11 (15.1%) | 23 (35.4%) |
| 30 to 34 Minutes | 23 (31.5%) | 13 (20.0%) |
| 35 to 39 Minutes | 1 (1.4%) | 0 (0.0%) |
| 40 to 44 Minutes | 4 (5.5%) | 0 (0.0%) |
| 45 to 59 Minutes | 5 (6.9%) | 0 (0.0%) |
| 60 to 89 Minutes | 0 (0.0%) | 0 (0.0%) |
| 90 or more Minutes | 0 (0.0%) | 0 (0.0%) |
Time of Departure to Work by Sex in Unionville borough
The most frequent times of departure to work in Unionville borough are 6:00 AM to 6:29 AM (14, 19.2%) for males and 4:00 PM to 11:59 PM (19, 29.2%) for females.
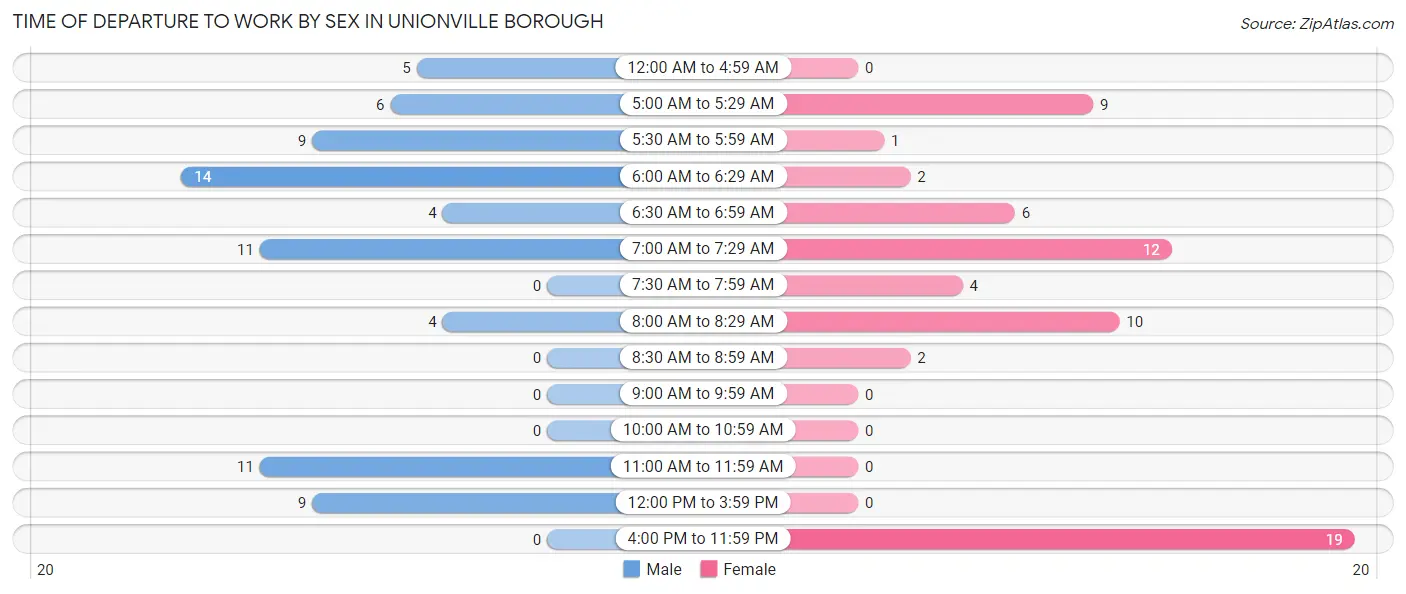
| Time of Departure | Male | Female |
| 12:00 AM to 4:59 AM | 5 (6.9%) | 0 (0.0%) |
| 5:00 AM to 5:29 AM | 6 (8.2%) | 9 (13.9%) |
| 5:30 AM to 5:59 AM | 9 (12.3%) | 1 (1.5%) |
| 6:00 AM to 6:29 AM | 14 (19.2%) | 2 (3.1%) |
| 6:30 AM to 6:59 AM | 4 (5.5%) | 6 (9.2%) |
| 7:00 AM to 7:29 AM | 11 (15.1%) | 12 (18.5%) |
| 7:30 AM to 7:59 AM | 0 (0.0%) | 4 (6.1%) |
| 8:00 AM to 8:29 AM | 4 (5.5%) | 10 (15.4%) |
| 8:30 AM to 8:59 AM | 0 (0.0%) | 2 (3.1%) |
| 9:00 AM to 9:59 AM | 0 (0.0%) | 0 (0.0%) |
| 10:00 AM to 10:59 AM | 0 (0.0%) | 0 (0.0%) |
| 11:00 AM to 11:59 AM | 11 (15.1%) | 0 (0.0%) |
| 12:00 PM to 3:59 PM | 9 (12.3%) | 0 (0.0%) |
| 4:00 PM to 11:59 PM | 0 (0.0%) | 19 (29.2%) |
| Total | 73 (100.0%) | 65 (100.0%) |
Housing Occupancy in Unionville borough
Occupancy by Ownership in Unionville borough
Of the total 97 dwellings in Unionville borough, owner-occupied units account for 80 (82.5%), while renter-occupied units make up 17 (17.5%).
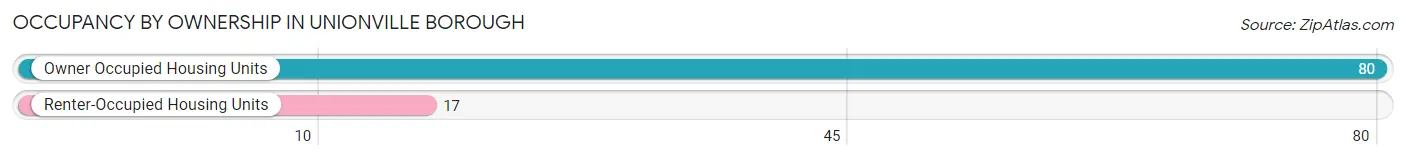
| Occupancy | # Housing Units | % Housing Units |
| Owner Occupied Housing Units | 80 | 82.5% |
| Renter-Occupied Housing Units | 17 | 17.5% |
| Total Occupied Housing Units | 97 | 100.0% |
Occupancy by Household Size in Unionville borough
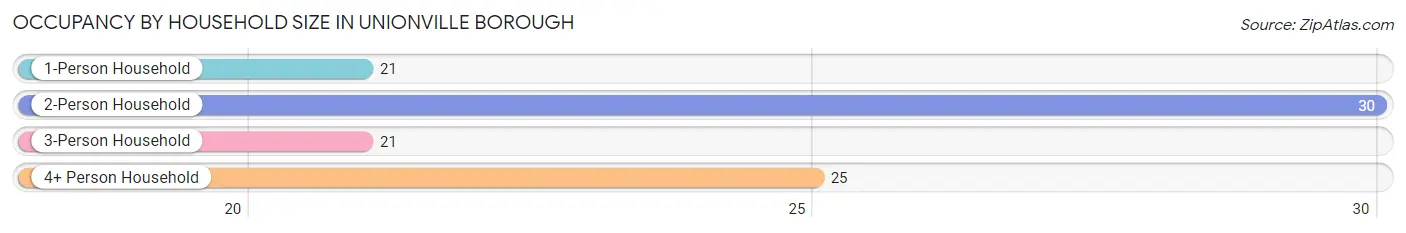
| Household Size | # Housing Units | % Housing Units |
| 1-Person Household | 21 | 21.6% |
| 2-Person Household | 30 | 30.9% |
| 3-Person Household | 21 | 21.6% |
| 4+ Person Household | 25 | 25.8% |
| Total Housing Units | 97 | 100.0% |
Occupancy by Ownership by Household Size in Unionville borough
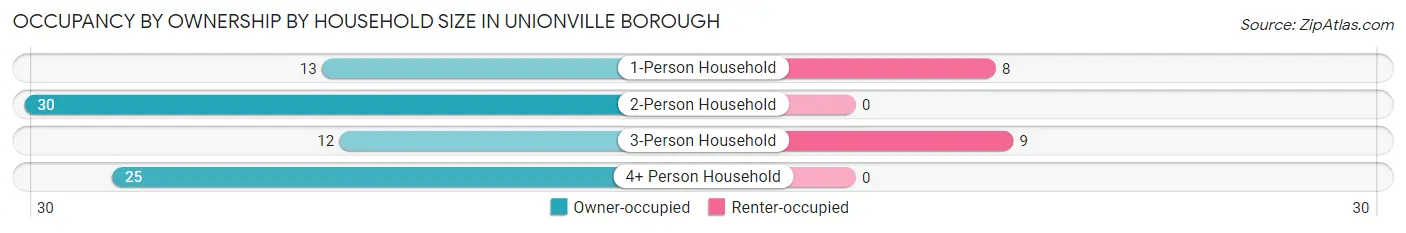
| Household Size | Owner-occupied | Renter-occupied |
| 1-Person Household | 13 (61.9%) | 8 (38.1%) |
| 2-Person Household | 30 (100.0%) | 0 (0.0%) |
| 3-Person Household | 12 (57.1%) | 9 (42.9%) |
| 4+ Person Household | 25 (100.0%) | 0 (0.0%) |
| Total Housing Units | 80 (82.5%) | 17 (17.5%) |
Occupancy by Educational Attainment in Unionville borough
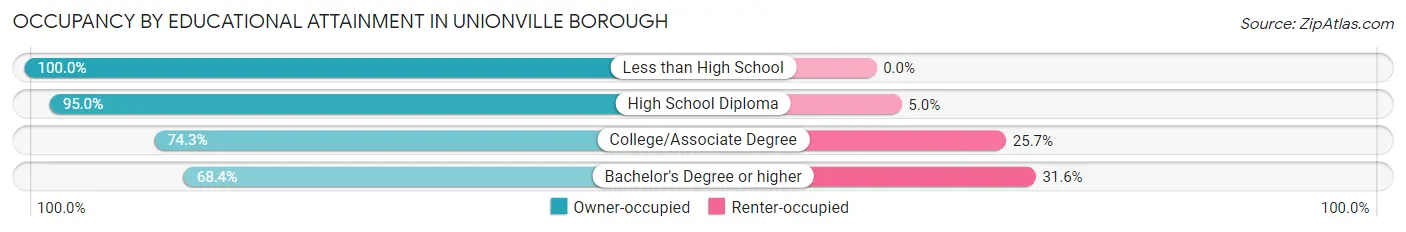
| Household Size | Owner-occupied | Renter-occupied |
| Less than High School | 3 (100.0%) | 0 (0.0%) |
| High School Diploma | 38 (95.0%) | 2 (5.0%) |
| College/Associate Degree | 26 (74.3%) | 9 (25.7%) |
| Bachelor's Degree or higher | 13 (68.4%) | 6 (31.6%) |
Occupancy by Age of Householder in Unionville borough
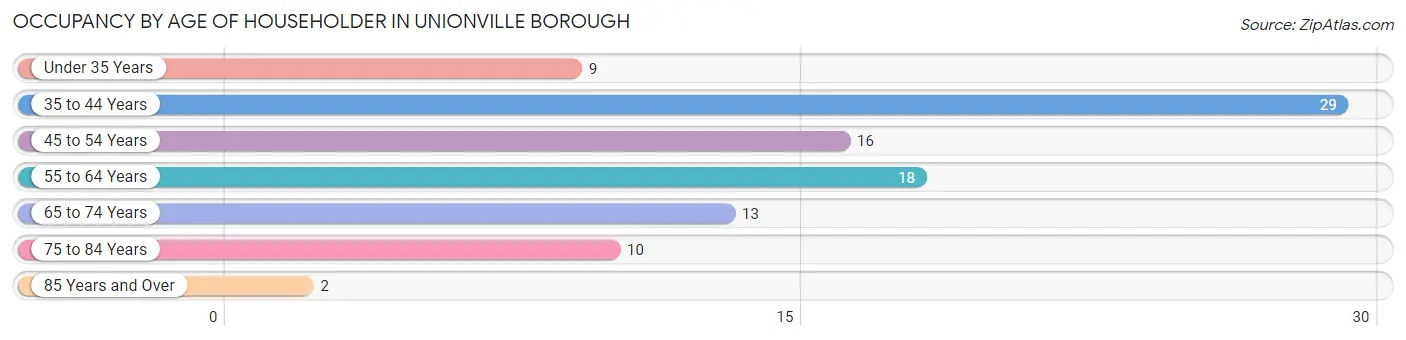
| Age Bracket | # Households | % Households |
| Under 35 Years | 9 | 9.3% |
| 35 to 44 Years | 29 | 29.9% |
| 45 to 54 Years | 16 | 16.5% |
| 55 to 64 Years | 18 | 18.6% |
| 65 to 74 Years | 13 | 13.4% |
| 75 to 84 Years | 10 | 10.3% |
| 85 Years and Over | 2 | 2.1% |
| Total | 97 | 100.0% |
Housing Finances in Unionville borough
Median Income by Occupancy in Unionville borough
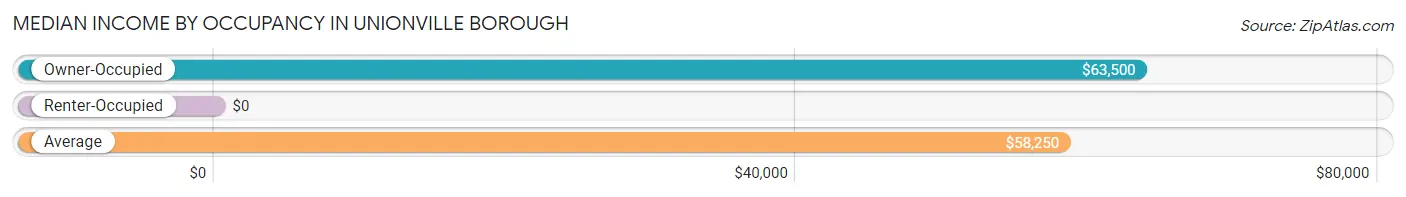
| Occupancy Type | # Households | Median Income |
| Owner-Occupied | 80 (82.5%) | $63,500 |
| Renter-Occupied | 17 (17.5%) | $0 |
| Average | 97 (100.0%) | $58,250 |
Occupancy by Householder Income Bracket in Unionville borough
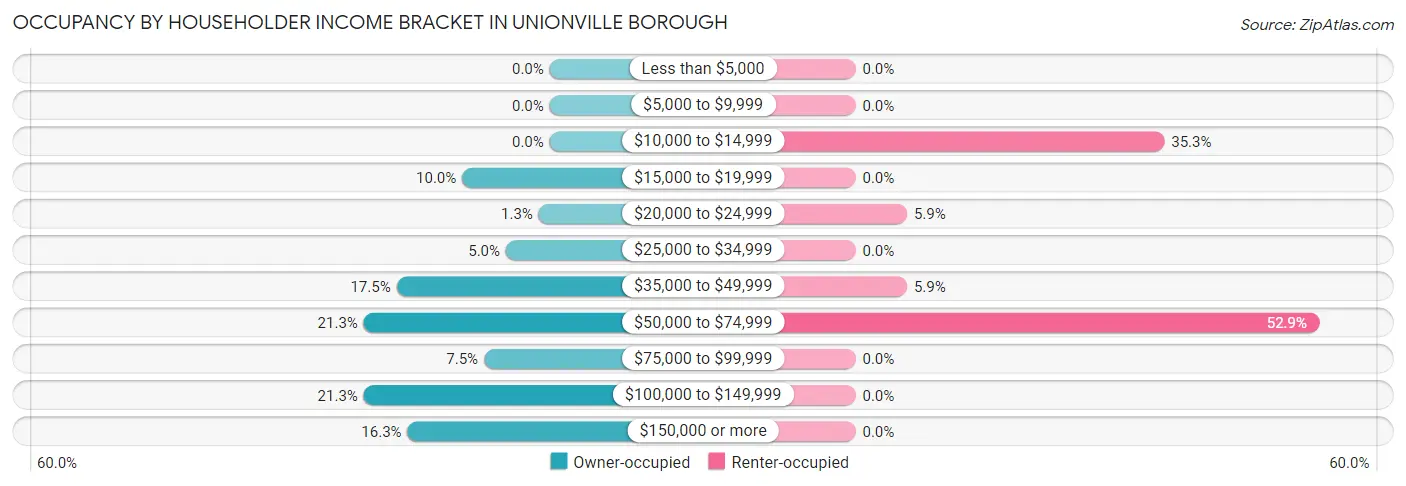
| Income Bracket | Owner-occupied | Renter-occupied |
| Less than $5,000 | 0 (0.0%) | 0 (0.0%) |
| $5,000 to $9,999 | 0 (0.0%) | 0 (0.0%) |
| $10,000 to $14,999 | 0 (0.0%) | 6 (35.3%) |
| $15,000 to $19,999 | 8 (10.0%) | 0 (0.0%) |
| $20,000 to $24,999 | 1 (1.3%) | 1 (5.9%) |
| $25,000 to $34,999 | 4 (5.0%) | 0 (0.0%) |
| $35,000 to $49,999 | 14 (17.5%) | 1 (5.9%) |
| $50,000 to $74,999 | 17 (21.2%) | 9 (52.9%) |
| $75,000 to $99,999 | 6 (7.5%) | 0 (0.0%) |
| $100,000 to $149,999 | 17 (21.2%) | 0 (0.0%) |
| $150,000 or more | 13 (16.3%) | 0 (0.0%) |
| Total | 80 (100.0%) | 17 (100.0%) |
Monthly Housing Cost Tiers in Unionville borough
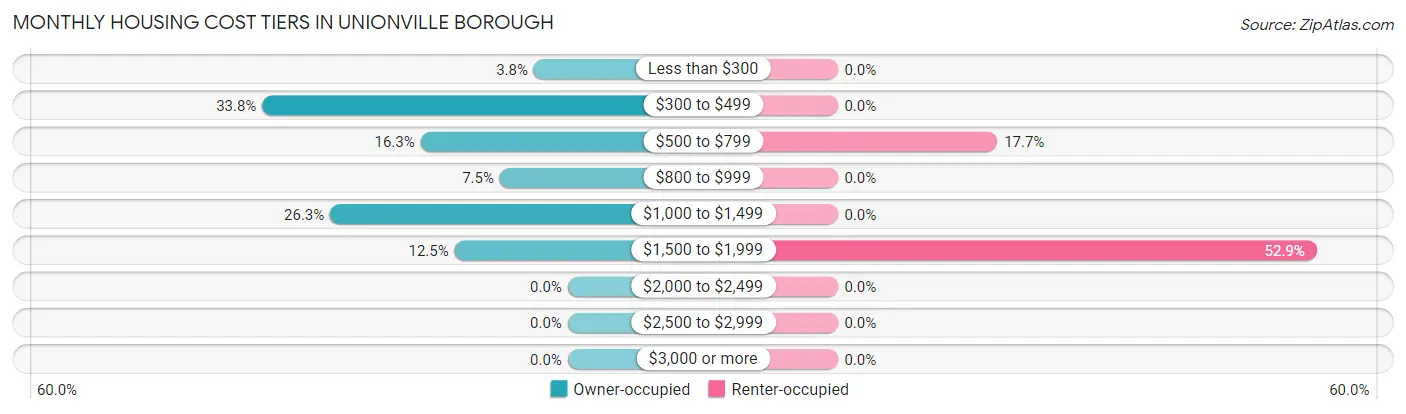
| Monthly Cost | Owner-occupied | Renter-occupied |
| Less than $300 | 3 (3.7%) | 0 (0.0%) |
| $300 to $499 | 27 (33.8%) | 0 (0.0%) |
| $500 to $799 | 13 (16.3%) | 3 (17.6%) |
| $800 to $999 | 6 (7.5%) | 0 (0.0%) |
| $1,000 to $1,499 | 21 (26.3%) | 0 (0.0%) |
| $1,500 to $1,999 | 10 (12.5%) | 9 (52.9%) |
| $2,000 to $2,499 | 0 (0.0%) | 0 (0.0%) |
| $2,500 to $2,999 | 0 (0.0%) | 0 (0.0%) |
| $3,000 or more | 0 (0.0%) | 0 (0.0%) |
| Total | 80 (100.0%) | 17 (100.0%) |
Physical Housing Characteristics in Unionville borough
Housing Structures in Unionville borough
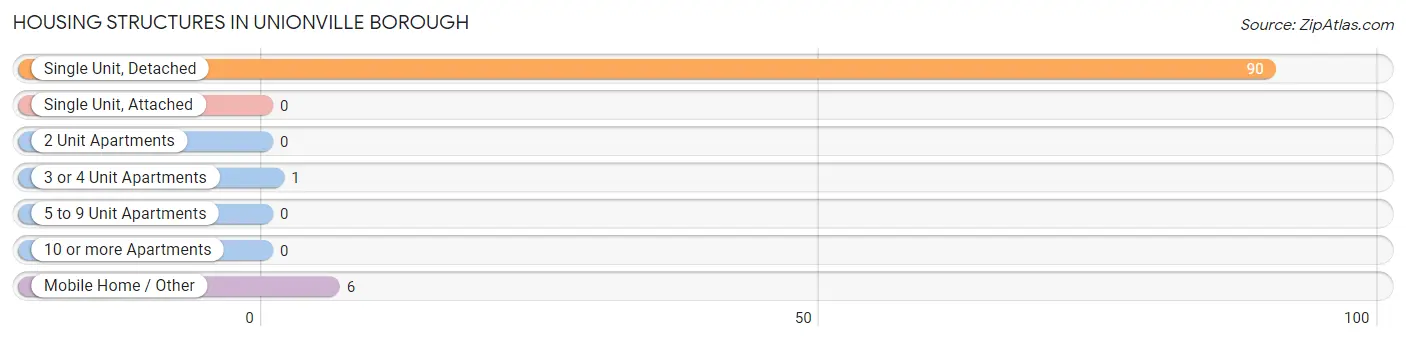
| Structure Type | # Housing Units | % Housing Units |
| Single Unit, Detached | 90 | 92.8% |
| Single Unit, Attached | 0 | 0.0% |
| 2 Unit Apartments | 0 | 0.0% |
| 3 or 4 Unit Apartments | 1 | 1.0% |
| 5 to 9 Unit Apartments | 0 | 0.0% |
| 10 or more Apartments | 0 | 0.0% |
| Mobile Home / Other | 6 | 6.2% |
| Total | 97 | 100.0% |
Housing Structures by Occupancy in Unionville borough
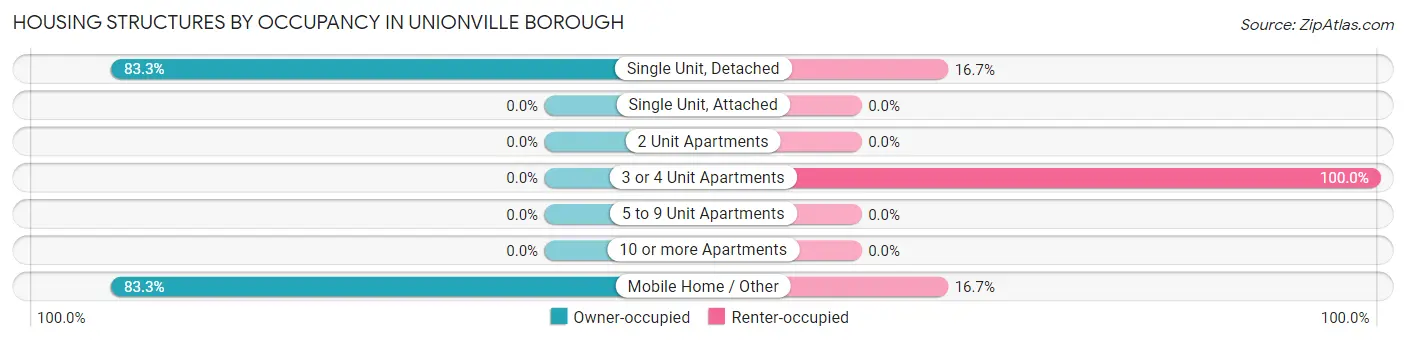
| Structure Type | Owner-occupied | Renter-occupied |
| Single Unit, Detached | 75 (83.3%) | 15 (16.7%) |
| Single Unit, Attached | 0 (0.0%) | 0 (0.0%) |
| 2 Unit Apartments | 0 (0.0%) | 0 (0.0%) |
| 3 or 4 Unit Apartments | 0 (0.0%) | 1 (100.0%) |
| 5 to 9 Unit Apartments | 0 (0.0%) | 0 (0.0%) |
| 10 or more Apartments | 0 (0.0%) | 0 (0.0%) |
| Mobile Home / Other | 5 (83.3%) | 1 (16.7%) |
| Total | 80 (82.5%) | 17 (17.5%) |
Housing Structures by Number of Rooms in Unionville borough
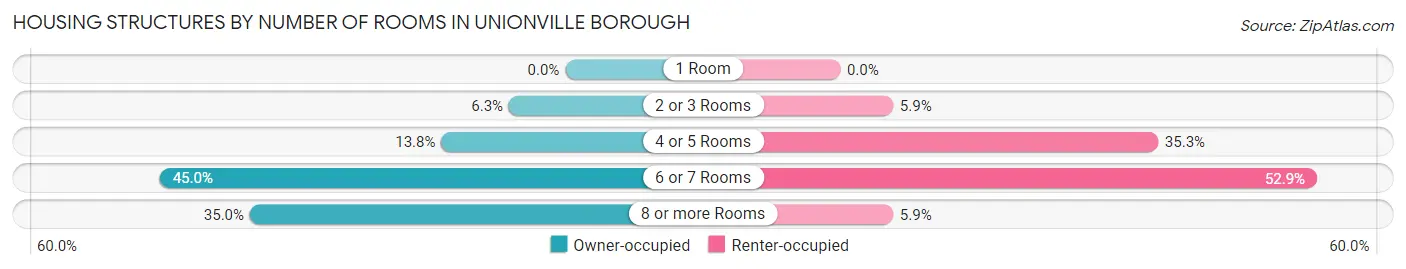
| Number of Rooms | Owner-occupied | Renter-occupied |
| 1 Room | 0 (0.0%) | 0 (0.0%) |
| 2 or 3 Rooms | 5 (6.2%) | 1 (5.9%) |
| 4 or 5 Rooms | 11 (13.8%) | 6 (35.3%) |
| 6 or 7 Rooms | 36 (45.0%) | 9 (52.9%) |
| 8 or more Rooms | 28 (35.0%) | 1 (5.9%) |
| Total | 80 (100.0%) | 17 (100.0%) |
Housing Structure by Heating Type in Unionville borough
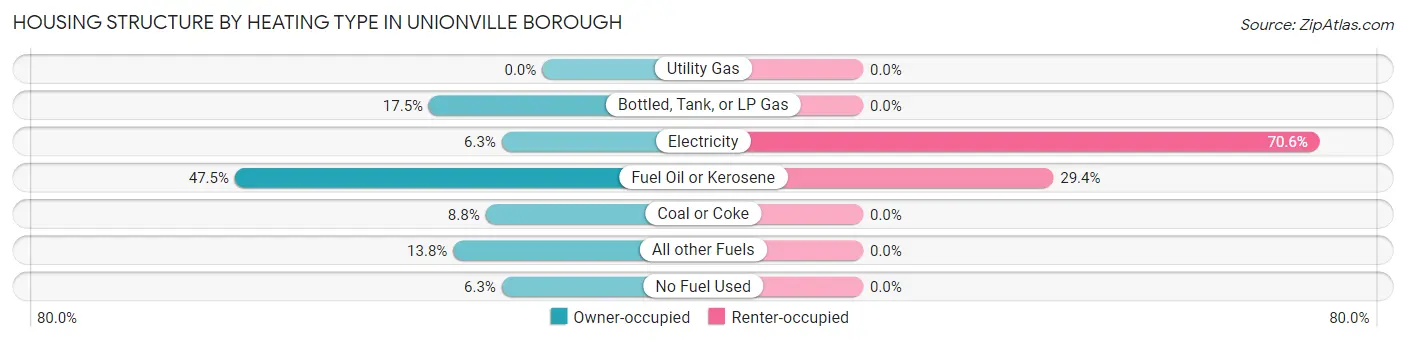
| Heating Type | Owner-occupied | Renter-occupied |
| Utility Gas | 0 (0.0%) | 0 (0.0%) |
| Bottled, Tank, or LP Gas | 14 (17.5%) | 0 (0.0%) |
| Electricity | 5 (6.2%) | 12 (70.6%) |
| Fuel Oil or Kerosene | 38 (47.5%) | 5 (29.4%) |
| Coal or Coke | 7 (8.7%) | 0 (0.0%) |
| All other Fuels | 11 (13.8%) | 0 (0.0%) |
| No Fuel Used | 5 (6.2%) | 0 (0.0%) |
| Total | 80 (100.0%) | 17 (100.0%) |
Household Vehicle Usage in Unionville borough
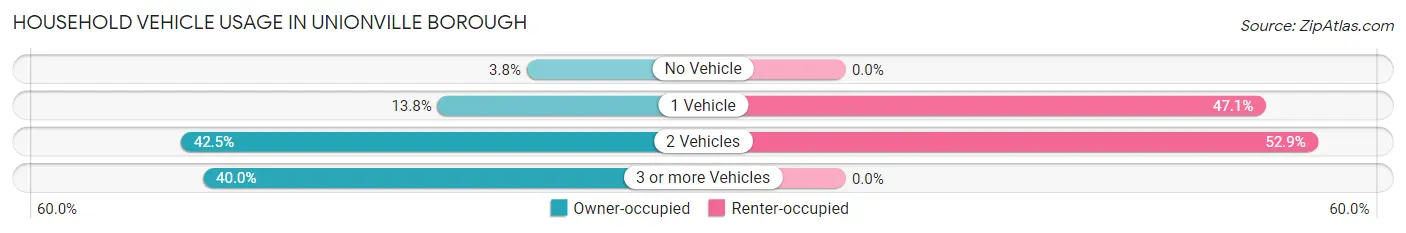
| Vehicles per Household | Owner-occupied | Renter-occupied |
| No Vehicle | 3 (3.7%) | 0 (0.0%) |
| 1 Vehicle | 11 (13.8%) | 8 (47.1%) |
| 2 Vehicles | 34 (42.5%) | 9 (52.9%) |
| 3 or more Vehicles | 32 (40.0%) | 0 (0.0%) |
| Total | 80 (100.0%) | 17 (100.0%) |
Real Estate & Mortgages in Unionville borough
Real Estate and Mortgage Overview in Unionville borough
| Characteristic | Without Mortgage | With Mortgage |
| Housing Units | 41 | 39 |
| Median Property Value | $120,500 | $178,700 |
| Median Household Income | $64,250 | $12 |
| Monthly Housing Costs | $453 | $0 |
| Real Estate Taxes | $1,477 | $2 |
Property Value by Mortgage Status in Unionville borough
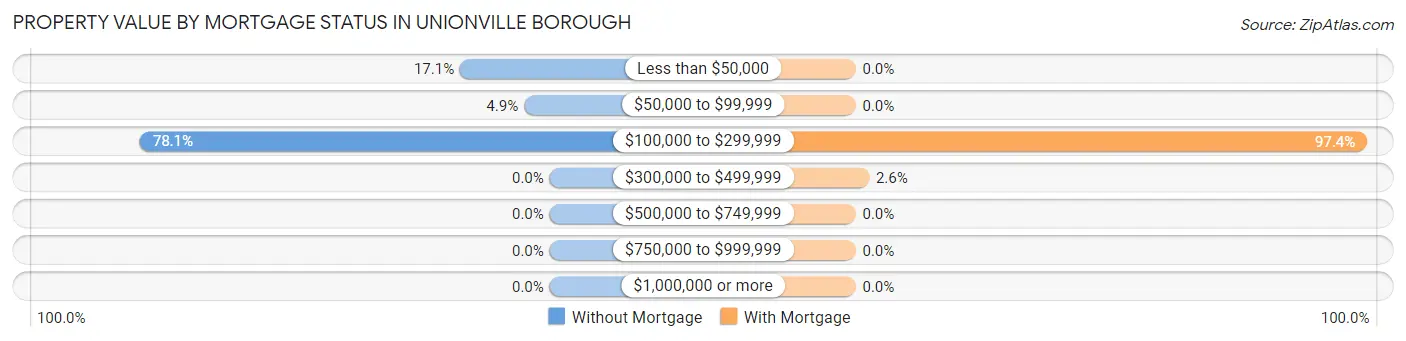
| Property Value | Without Mortgage | With Mortgage |
| Less than $50,000 | 7 (17.1%) | 0 (0.0%) |
| $50,000 to $99,999 | 2 (4.9%) | 0 (0.0%) |
| $100,000 to $299,999 | 32 (78.0%) | 38 (97.4%) |
| $300,000 to $499,999 | 0 (0.0%) | 1 (2.6%) |
| $500,000 to $749,999 | 0 (0.0%) | 0 (0.0%) |
| $750,000 to $999,999 | 0 (0.0%) | 0 (0.0%) |
| $1,000,000 or more | 0 (0.0%) | 0 (0.0%) |
| Total | 41 (100.0%) | 39 (100.0%) |
Household Income by Mortgage Status in Unionville borough
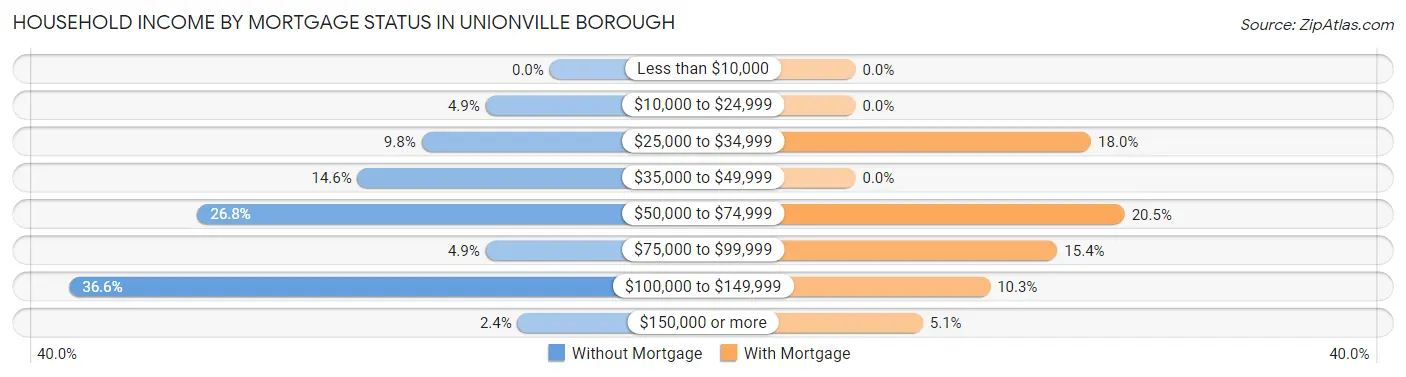
| Household Income | Without Mortgage | With Mortgage |
| Less than $10,000 | 0 (0.0%) | 0 (0.0%) |
| $10,000 to $24,999 | 2 (4.9%) | 0 (0.0%) |
| $25,000 to $34,999 | 4 (9.8%) | 7 (17.9%) |
| $35,000 to $49,999 | 6 (14.6%) | 0 (0.0%) |
| $50,000 to $74,999 | 11 (26.8%) | 8 (20.5%) |
| $75,000 to $99,999 | 2 (4.9%) | 6 (15.4%) |
| $100,000 to $149,999 | 15 (36.6%) | 4 (10.3%) |
| $150,000 or more | 1 (2.4%) | 2 (5.1%) |
| Total | 41 (100.0%) | 39 (100.0%) |
Property Value to Household Income Ratio in Unionville borough
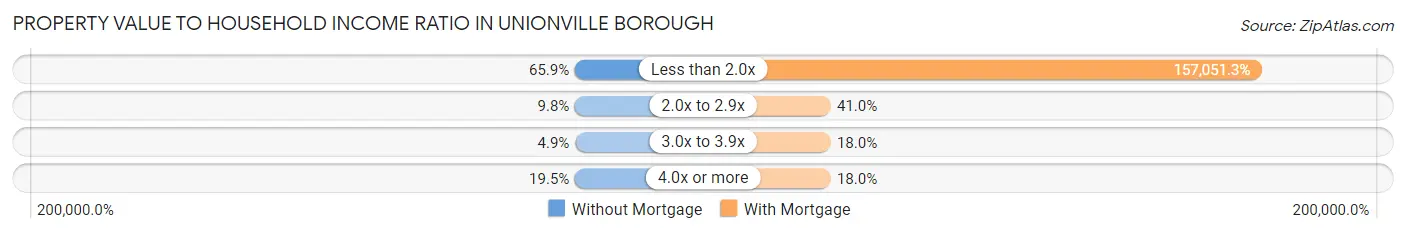
| Value-to-Income Ratio | Without Mortgage | With Mortgage |
| Less than 2.0x | 27 (65.8%) | 61,250 (157,051.3%) |
| 2.0x to 2.9x | 4 (9.8%) | 16 (41.0%) |
| 3.0x to 3.9x | 2 (4.9%) | 7 (17.9%) |
| 4.0x or more | 8 (19.5%) | 7 (17.9%) |
| Total | 41 (100.0%) | 39 (100.0%) |
Real Estate Taxes by Mortgage Status in Unionville borough
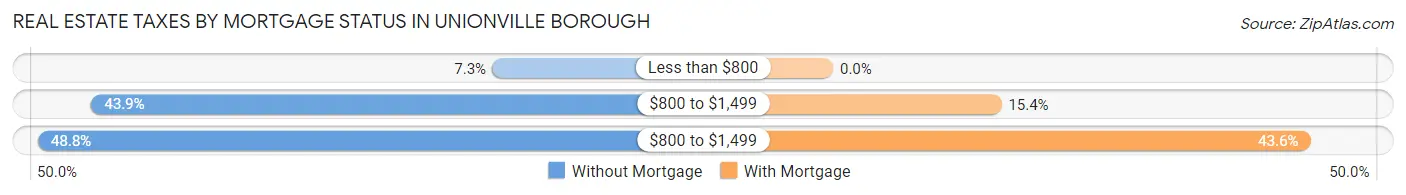
| Property Taxes | Without Mortgage | With Mortgage |
| Less than $800 | 3 (7.3%) | 0 (0.0%) |
| $800 to $1,499 | 18 (43.9%) | 6 (15.4%) |
| $800 to $1,499 | 20 (48.8%) | 17 (43.6%) |
| Total | 41 (100.0%) | 39 (100.0%) |
Health & Disability in Unionville borough
Health Insurance Coverage by Age in Unionville borough
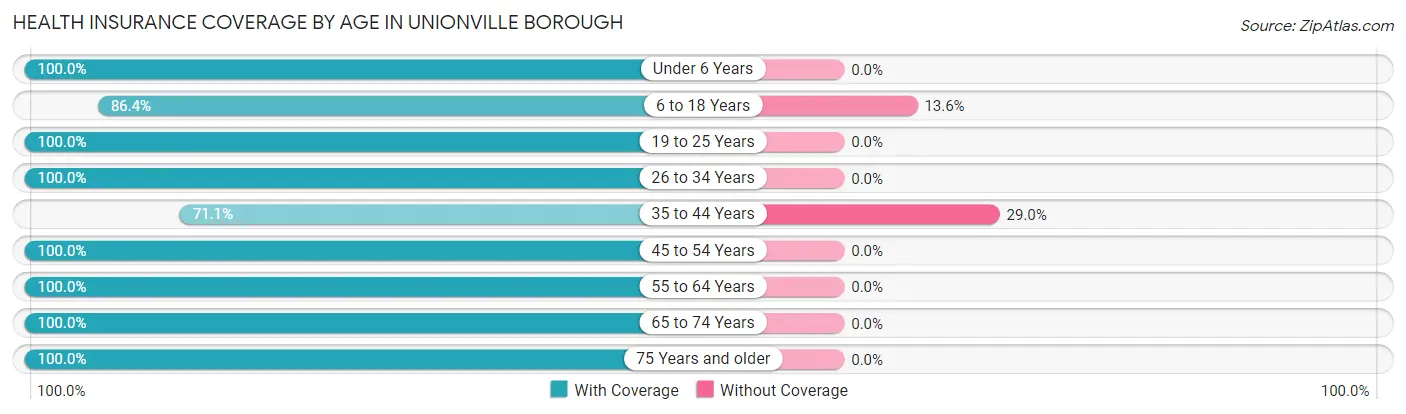
| Age Bracket | With Coverage | Without Coverage |
| Under 6 Years | 7 (100.0%) | 0 (0.0%) |
| 6 to 18 Years | 38 (86.4%) | 6 (13.6%) |
| 19 to 25 Years | 32 (100.0%) | 0 (0.0%) |
| 26 to 34 Years | 14 (100.0%) | 0 (0.0%) |
| 35 to 44 Years | 27 (71.1%) | 11 (28.9%) |
| 45 to 54 Years | 38 (100.0%) | 0 (0.0%) |
| 55 to 64 Years | 38 (100.0%) | 0 (0.0%) |
| 65 to 74 Years | 28 (100.0%) | 0 (0.0%) |
| 75 Years and older | 17 (100.0%) | 0 (0.0%) |
| Total | 239 (93.4%) | 17 (6.6%) |
Health Insurance Coverage by Citizenship Status in Unionville borough
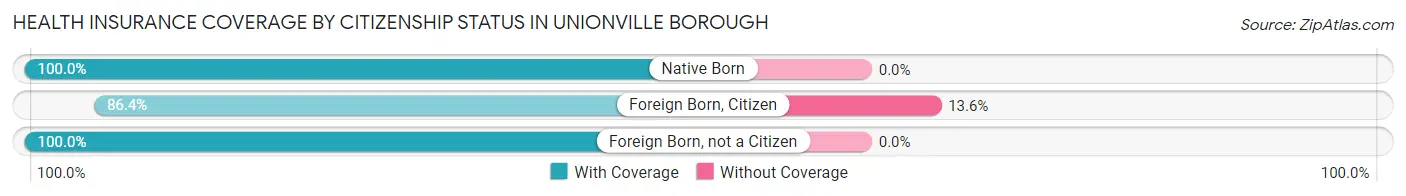
| Citizenship Status | With Coverage | Without Coverage |
| Native Born | 7 (100.0%) | 0 (0.0%) |
| Foreign Born, Citizen | 38 (86.4%) | 6 (13.6%) |
| Foreign Born, not a Citizen | 32 (100.0%) | 0 (0.0%) |
Health Insurance Coverage by Household Income in Unionville borough
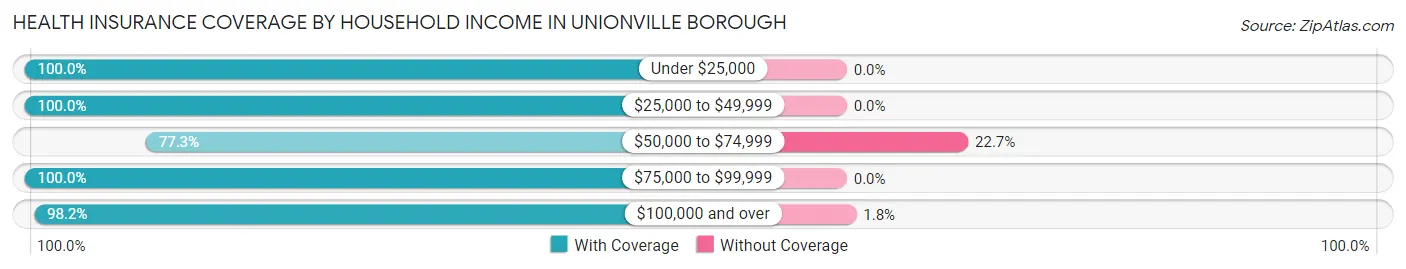
| Household Income | With Coverage | Without Coverage |
| Under $25,000 | 22 (100.0%) | 0 (0.0%) |
| $25,000 to $49,999 | 35 (100.0%) | 0 (0.0%) |
| $50,000 to $74,999 | 51 (77.3%) | 15 (22.7%) |
| $75,000 to $99,999 | 21 (100.0%) | 0 (0.0%) |
| $100,000 and over | 110 (98.2%) | 2 (1.8%) |
Public vs Private Health Insurance Coverage by Age in Unionville borough
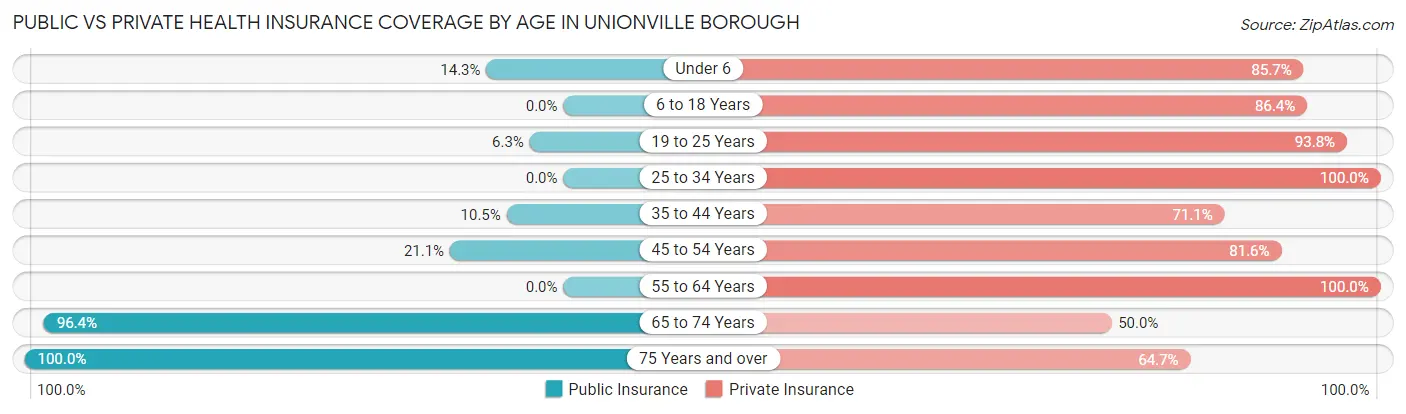
| Age Bracket | Public Insurance | Private Insurance |
| Under 6 | 1 (14.3%) | 6 (85.7%) |
| 6 to 18 Years | 0 (0.0%) | 38 (86.4%) |
| 19 to 25 Years | 2 (6.2%) | 30 (93.8%) |
| 25 to 34 Years | 0 (0.0%) | 14 (100.0%) |
| 35 to 44 Years | 4 (10.5%) | 27 (71.1%) |
| 45 to 54 Years | 8 (21.0%) | 31 (81.6%) |
| 55 to 64 Years | 0 (0.0%) | 38 (100.0%) |
| 65 to 74 Years | 27 (96.4%) | 14 (50.0%) |
| 75 Years and over | 17 (100.0%) | 11 (64.7%) |
| Total | 59 (23.1%) | 209 (81.6%) |
Disability Status by Sex by Age in Unionville borough
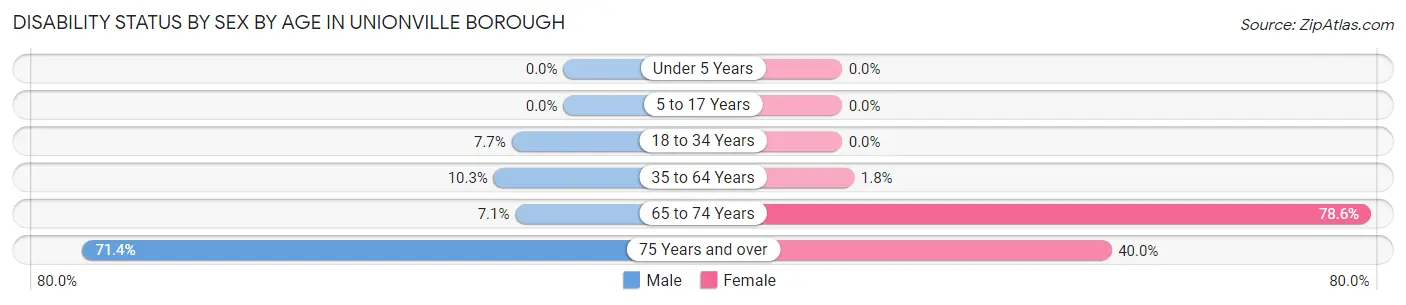
| Age Bracket | Male | Female |
| Under 5 Years | 0 (0.0%) | 0 (0.0%) |
| 5 to 17 Years | 0 (0.0%) | 0 (0.0%) |
| 18 to 34 Years | 2 (7.7%) | 0 (0.0%) |
| 35 to 64 Years | 6 (10.3%) | 1 (1.8%) |
| 65 to 74 Years | 1 (7.1%) | 11 (78.6%) |
| 75 Years and over | 5 (71.4%) | 4 (40.0%) |
Disability Class by Sex by Age in Unionville borough
Disability Class: Hearing Difficulty
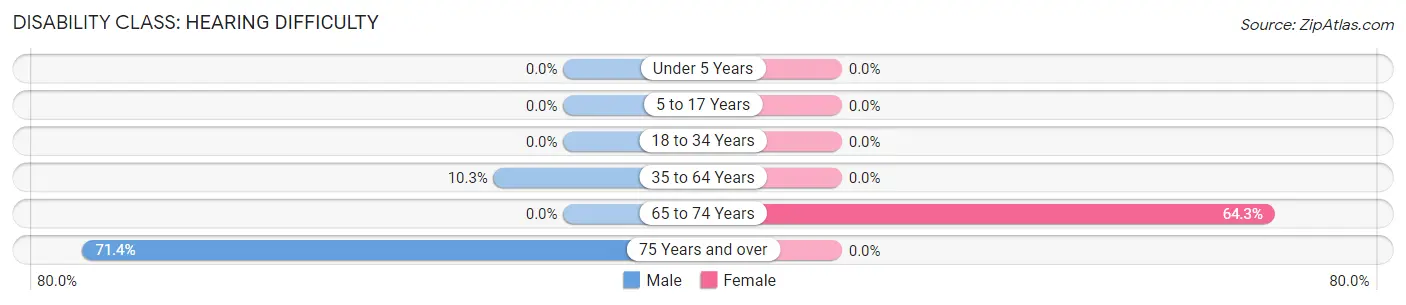
| Age Bracket | Male | Female |
| Under 5 Years | 0 (0.0%) | 0 (0.0%) |
| 5 to 17 Years | 0 (0.0%) | 0 (0.0%) |
| 18 to 34 Years | 0 (0.0%) | 0 (0.0%) |
| 35 to 64 Years | 6 (10.3%) | 0 (0.0%) |
| 65 to 74 Years | 0 (0.0%) | 9 (64.3%) |
| 75 Years and over | 5 (71.4%) | 0 (0.0%) |
Disability Class: Vision Difficulty
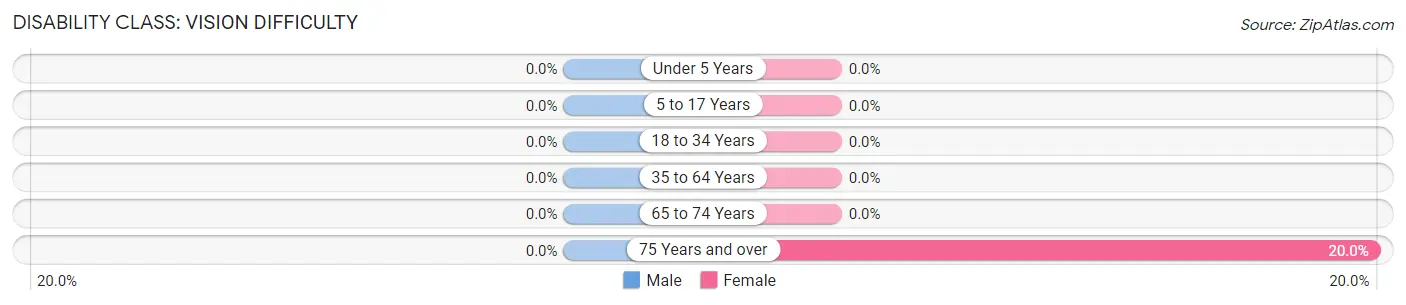
| Age Bracket | Male | Female |
| Under 5 Years | 0 (0.0%) | 0 (0.0%) |
| 5 to 17 Years | 0 (0.0%) | 0 (0.0%) |
| 18 to 34 Years | 0 (0.0%) | 0 (0.0%) |
| 35 to 64 Years | 0 (0.0%) | 0 (0.0%) |
| 65 to 74 Years | 0 (0.0%) | 0 (0.0%) |
| 75 Years and over | 0 (0.0%) | 2 (20.0%) |
Disability Class: Cognitive Difficulty
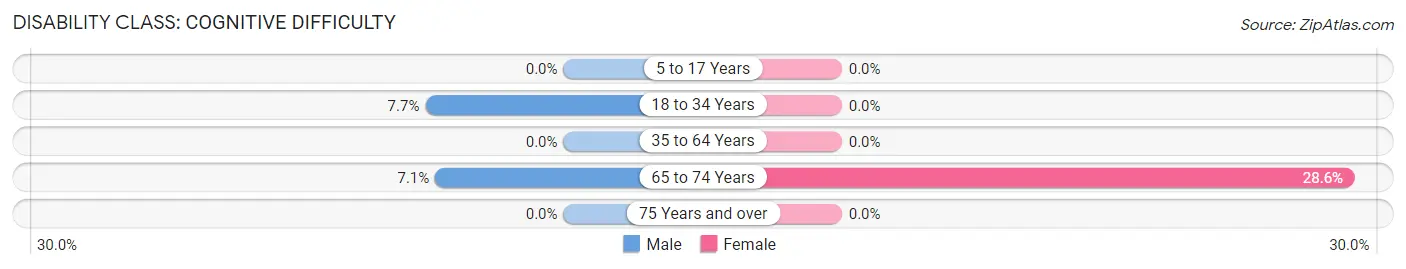
| Age Bracket | Male | Female |
| 5 to 17 Years | 0 (0.0%) | 0 (0.0%) |
| 18 to 34 Years | 2 (7.7%) | 0 (0.0%) |
| 35 to 64 Years | 0 (0.0%) | 0 (0.0%) |
| 65 to 74 Years | 1 (7.1%) | 4 (28.6%) |
| 75 Years and over | 0 (0.0%) | 0 (0.0%) |
Disability Class: Ambulatory Difficulty
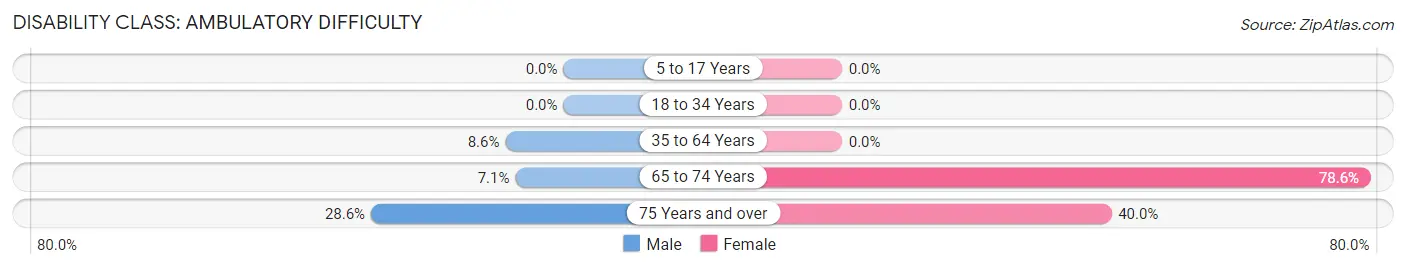
| Age Bracket | Male | Female |
| 5 to 17 Years | 0 (0.0%) | 0 (0.0%) |
| 18 to 34 Years | 0 (0.0%) | 0 (0.0%) |
| 35 to 64 Years | 5 (8.6%) | 0 (0.0%) |
| 65 to 74 Years | 1 (7.1%) | 11 (78.6%) |
| 75 Years and over | 2 (28.6%) | 4 (40.0%) |
Disability Class: Self-Care Difficulty
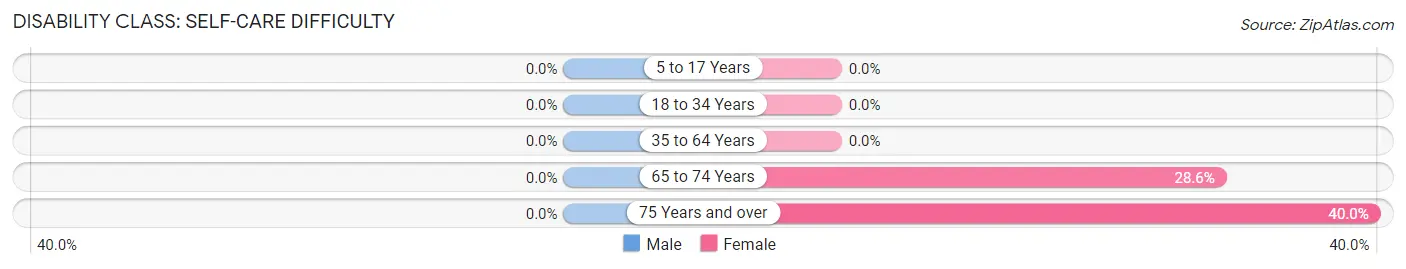
| Age Bracket | Male | Female |
| 5 to 17 Years | 0 (0.0%) | 0 (0.0%) |
| 18 to 34 Years | 0 (0.0%) | 0 (0.0%) |
| 35 to 64 Years | 0 (0.0%) | 0 (0.0%) |
| 65 to 74 Years | 0 (0.0%) | 4 (28.6%) |
| 75 Years and over | 0 (0.0%) | 4 (40.0%) |
Technology Access in Unionville borough
Computing Device Access in Unionville borough
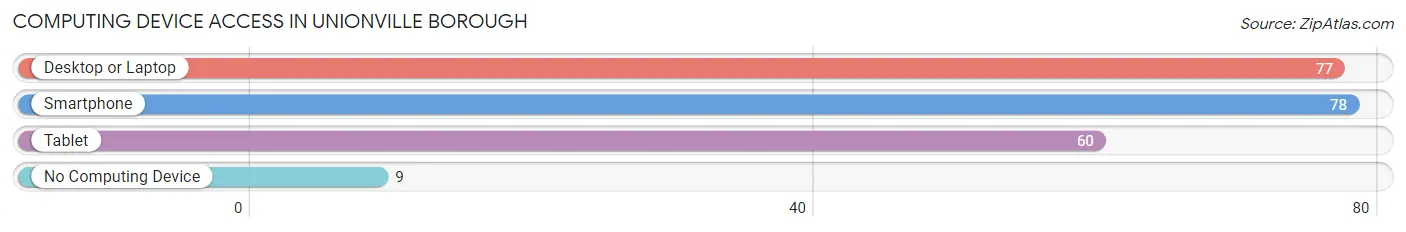
| Device Type | # Households | % Households |
| Desktop or Laptop | 77 | 79.4% |
| Smartphone | 78 | 80.4% |
| Tablet | 60 | 61.9% |
| No Computing Device | 9 | 9.3% |
| Total | 97 | 100.0% |
Internet Access in Unionville borough
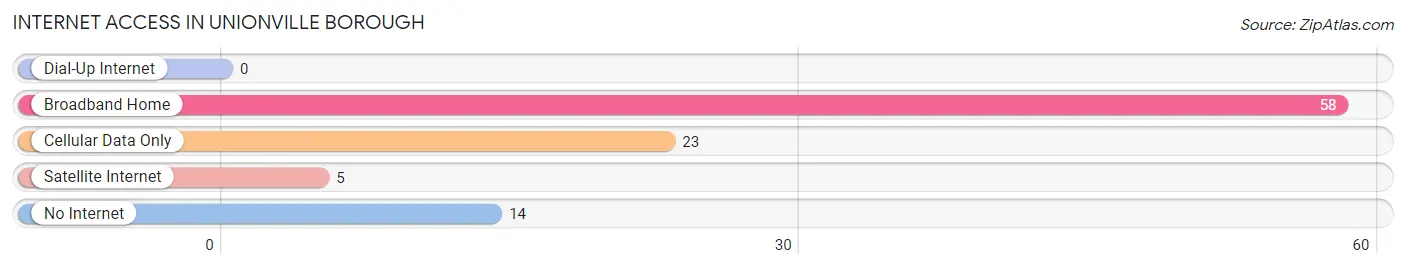
| Internet Type | # Households | % Households |
| Dial-Up Internet | 0 | 0.0% |
| Broadband Home | 58 | 59.8% |
| Cellular Data Only | 23 | 23.7% |
| Satellite Internet | 5 | 5.1% |
| No Internet | 14 | 14.4% |
| Total | 97 | 100.0% |
Unionville borough Summary
Introduction
Unionville Borough is a small borough located in Chester County, Pennsylvania. It is situated in the southeastern corner of the county, just north of the city of West Chester. The borough is home to a population of just over 1,000 people, making it one of the smallest boroughs in the state. The borough is known for its historic buildings, quaint downtown area, and its close proximity to the city of West Chester.
History
Unionville Borough was founded in 1851 by a group of Quakers who had recently moved to the area from New Jersey. The borough was named after the Unionville Meeting House, which was built in 1848 and is still standing today. The borough was originally part of West Whiteland Township, but was incorporated as its own borough in 1851.
The borough was a small farming community for much of its history, but in the late 19th century, it began to grow and develop. The borough was home to several small businesses, including a blacksmith shop, a general store, and a post office. The borough also had a train station, which was used to transport goods and passengers to and from Philadelphia.
In the early 20th century, the borough began to experience a period of growth and development. Several new businesses opened in the borough, including a bank, a movie theater, and a hotel. The borough also saw the construction of several new homes and buildings, including a library and a fire station.
Geography
Unionville Borough is located in southeastern Chester County, Pennsylvania. It is situated just north of the city of West Chester and is bordered by West Whiteland Township to the north, East Bradford Township to the east, West Goshen Township to the south, and Westtown Township to the west. The borough covers an area of 0.7 square miles and is home to a population of just over 1,000 people.
The borough is situated in a rural area and is surrounded by rolling hills and farmland. The borough is home to several small parks, including Unionville Park and the Unionville Nature Preserve. The borough is also home to several historic buildings, including the Unionville Meeting House, which was built in 1848.
Economy
Unionville Borough is a small, rural community with a limited economy. The borough is home to several small businesses, including a bank, a general store, and a post office. The borough also has a few restaurants and bars, as well as a few small retail stores.
The borough is home to several small manufacturing companies, including a furniture manufacturer and a printing company. The borough also has a few small farms, which produce a variety of crops, including corn, soybeans, and hay.
Demographics
As of the 2010 census, the population of Unionville Borough was 1,072. The racial makeup of the borough was 94.3% White, 2.3% African American, 0.3% Native American, 0.7% Asian, 0.1% Pacific Islander, and 2.3% from other races. Hispanic or Latino of any race were 2.3% of the population.
The median household income in the borough was $60,938, and the median family income was $68,750. The per capita income in the borough was $27,945. About 4.3% of families and 5.7% of the population were below the poverty line, including 8.3% of those under age 18 and none of those age 65 or over.
Conclusion
Unionville Borough is a small borough located in Chester County, Pennsylvania. It is home to a population of just over 1,000 people and is known for its historic buildings, quaint downtown area, and its close proximity to the city of West Chester. The borough has a limited economy, with several small businesses, manufacturing companies, and farms. The population of the borough is predominantly white, with a small percentage of African Americans, Native Americans, Asians, and other races. The median household income in the borough is slightly above the national average, and the poverty rate is below the national average.
Common Questions
What is the Total Population of Unionville borough?
Total Population of Unionville borough is 256.
What is the Total Male Population of Unionville borough?
Total Male Population of Unionville borough is 121.
What is the Total Female Population of Unionville borough?
Total Female Population of Unionville borough is 135.
What is the Ratio of Males per 100 Females in Unionville borough?
There are 89.63 Males per 100 Females in Unionville borough.
What is the Ratio of Females per 100 Males in Unionville borough?
There are 111.57 Females per 100 Males in Unionville borough.
What is the Median Population Age in Unionville borough?
Median Population Age in Unionville borough is 43.7 Years.
What is the Average Family Size in Unionville borough
Average Family Size in Unionville borough is 3.1 People.
What is the Average Household Size in Unionville borough
Average Household Size in Unionville borough is 2.6 People.
What is Per Capita Income in Unionville borough?
Per Capita income in Unionville borough is $31,789.
What is the Median Family Income in Unionville borough?
Median Family Income in Unionville borough is $63,571.
What is the Median Household income in Unionville borough?
Median Household Income in Unionville borough is $58,250.
What is Income or Wage Gap in Unionville borough?
Income or Wage Gap in Unionville borough is 26.3%.
Women in Unionville borough earn 73.7 cents for every dollar earned by a man.
What is Inequality or Gini Index in Unionville borough?
Inequality or Gini Index in Unionville borough is 0.41.
How Large is the Labor Force in Unionville borough?
There are 147 People in the Labor Forcein in Unionville borough.
What is the Percentage of People in the Labor Force in Unionville borough?
66.2% of People are in the Labor Force in Unionville borough.
What is the Unemployment Rate in Unionville borough?
Unemployment Rate in Unionville borough is 0.7%.