Linglestown, PA
Linglestown Map
Linglestown Overview
6,786
TOTAL POPULATION
3,352
MALE POPULATION
3,434
FEMALE POPULATION
97.61
MALES / 100 FEMALES
102.45
FEMALES / 100 MALES
42.9
MEDIAN AGE
3.0
AVG FAMILY SIZE
2.5
AVG HOUSEHOLD SIZE
$41,726
PER CAPITA INCOME
$105,328
AVG FAMILY INCOME
$86,142
AVG HOUSEHOLD INCOME
14.0%
WAGE / INCOME GAP [ % ]
86.0¢/ $1
WAGE / INCOME GAP [ $ ]
0.37
INEQUALITY / GINI INDEX
3,783
LABOR FORCE [ PEOPLE ]
65.1%
PERCENT IN LABOR FORCE
3.3%
UNEMPLOYMENT RATE
Linglestown Area Codes
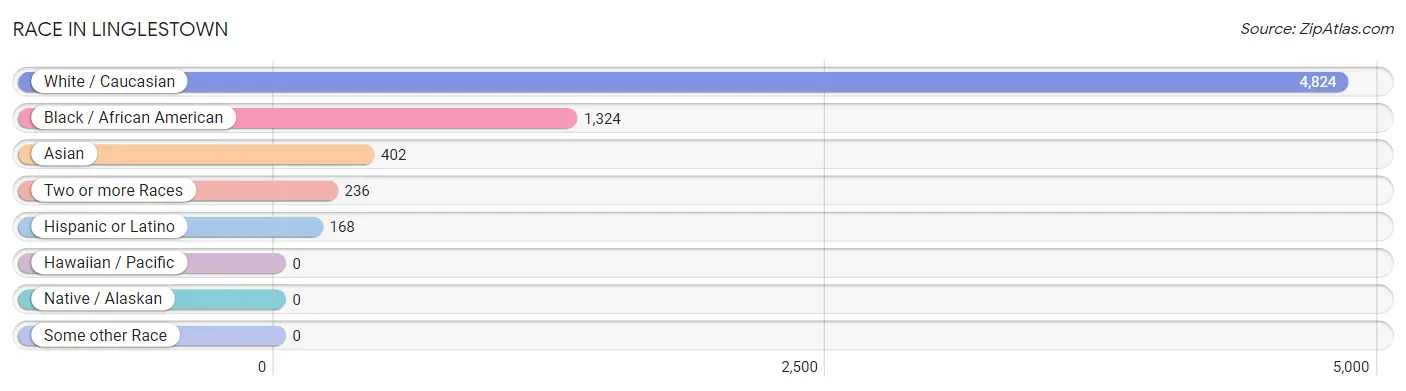
Race in Linglestown
The most populous races in Linglestown are White / Caucasian (4,824 | 71.1%), Black / African American (1,324 | 19.5%), and Asian (402 | 5.9%).
| Race | # Population | % Population |
| Asian | 402 | 5.9% |
| Black / African American | 1,324 | 19.5% |
| Hawaiian / Pacific | 0 | 0.0% |
| Hispanic or Latino | 168 | 2.5% |
| Native / Alaskan | 0 | 0.0% |
| White / Caucasian | 4,824 | 71.1% |
| Two or more Races | 236 | 3.5% |
| Some other Race | 0 | 0.0% |
| Total | 6,786 | 100.0% |
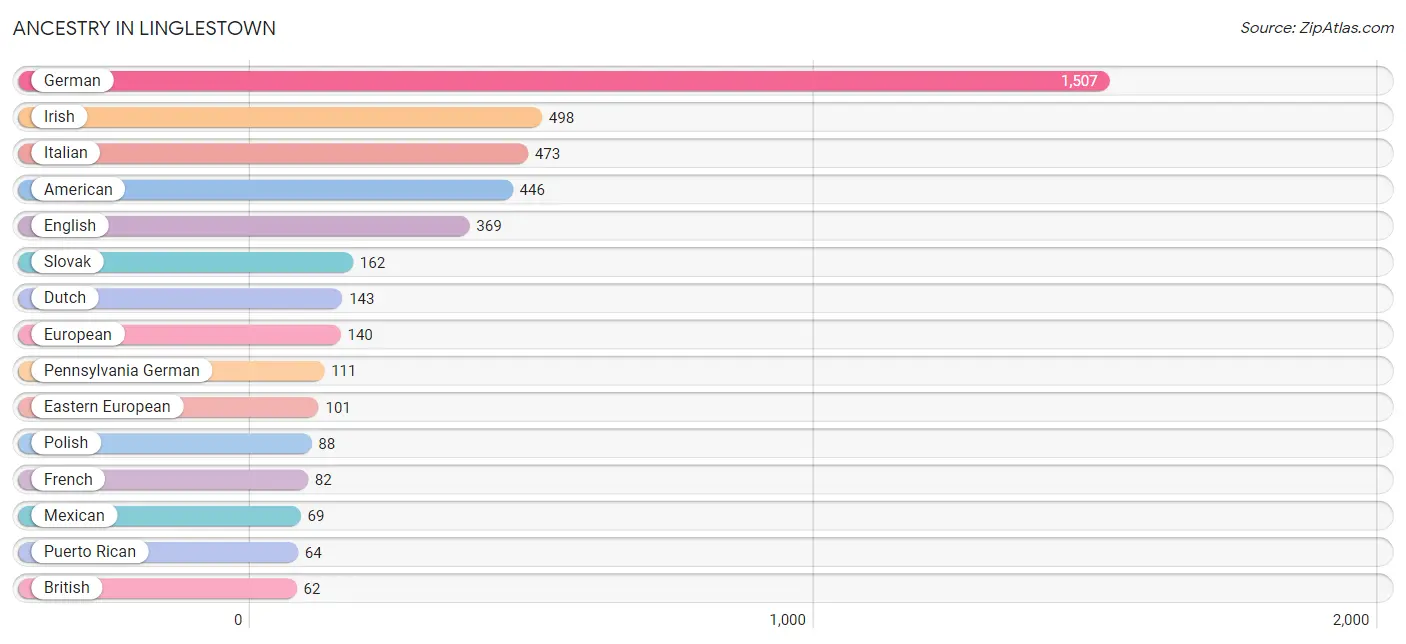
Ancestry in Linglestown
The most populous ancestries reported in Linglestown are German (1,507 | 22.2%), Irish (498 | 7.3%), Italian (473 | 7.0%), American (446 | 6.6%), and English (369 | 5.4%), together accounting for 48.5% of all Linglestown residents.
| Ancestry | # Population | % Population |
| American | 446 | 6.6% |
| Bhutanese | 18 | 0.3% |
| British | 62 | 0.9% |
| Croatian | 38 | 0.6% |
| Dominican | 35 | 0.5% |
| Dutch | 143 | 2.1% |
| Eastern European | 101 | 1.5% |
| English | 369 | 5.4% |
| European | 140 | 2.1% |
| French | 82 | 1.2% |
| German | 1,507 | 22.2% |
| Hungarian | 8 | 0.1% |
| Indian (Asian) | 22 | 0.3% |
| Irish | 498 | 7.3% |
| Italian | 473 | 7.0% |
| Jamaican | 1 | 0.0% |
| Laotian | 62 | 0.9% |
| Mexican | 69 | 1.0% |
| Pennsylvania German | 111 | 1.6% |
| Polish | 88 | 1.3% |
| Puerto Rican | 64 | 0.9% |
| Romanian | 13 | 0.2% |
| Russian | 16 | 0.2% |
| Scandinavian | 11 | 0.2% |
| Scotch-Irish | 52 | 0.8% |
| Scottish | 4 | 0.1% |
| Slovak | 162 | 2.4% |
| Sri Lankan | 43 | 0.6% |
| Ukrainian | 36 | 0.5% |
| Welsh | 25 | 0.4% |
| Yugoslavian | 6 | 0.1% | View All 31 Rows |
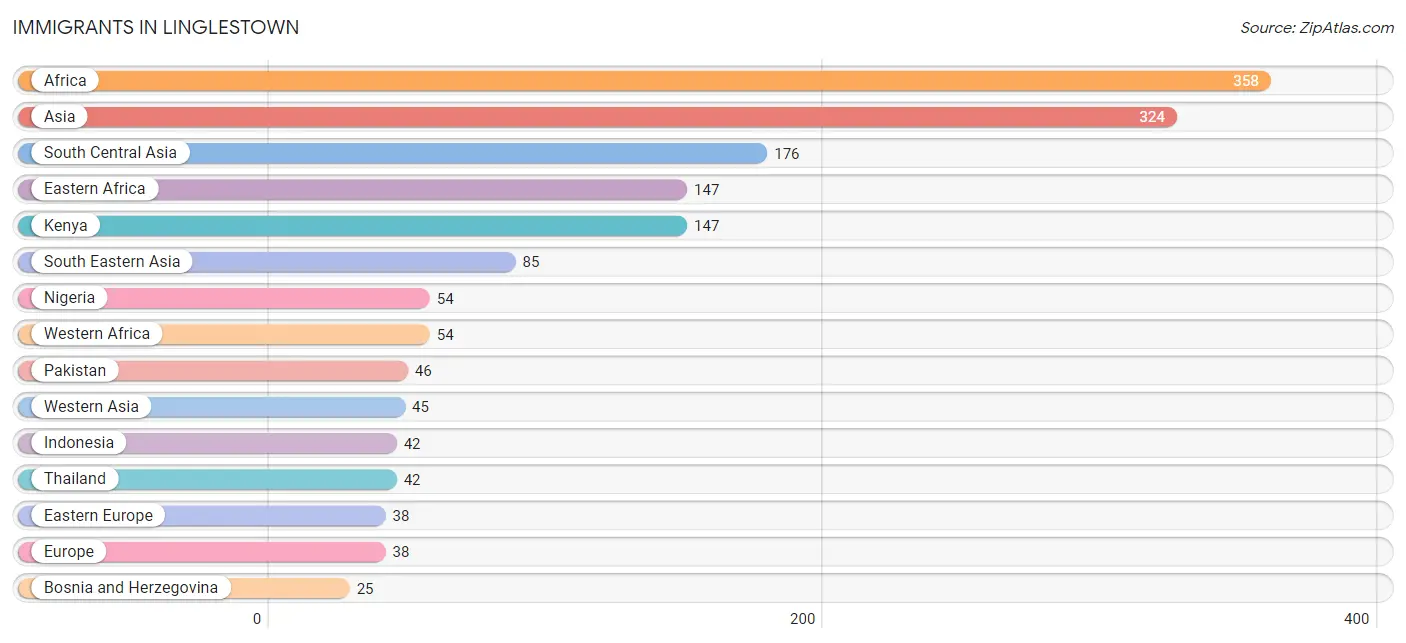
Immigrants in Linglestown
The most numerous immigrant groups reported in Linglestown came from Africa (358 | 5.3%), Asia (324 | 4.8%), South Central Asia (176 | 2.6%), Eastern Africa (147 | 2.2%), and Kenya (147 | 2.2%), together accounting for 17.0% of all Linglestown residents.
| Immigration Origin | # Population | % Population |
| Africa | 358 | 5.3% |
| Asia | 324 | 4.8% |
| Bangladesh | 12 | 0.2% |
| Bosnia and Herzegovina | 25 | 0.4% |
| Central America | 22 | 0.3% |
| Eastern Africa | 147 | 2.2% |
| Eastern Asia | 18 | 0.3% |
| Eastern Europe | 38 | 0.6% |
| Europe | 38 | 0.6% |
| India | 10 | 0.2% |
| Indonesia | 42 | 0.6% |
| Japan | 18 | 0.3% |
| Kenya | 147 | 2.2% |
| Kuwait | 17 | 0.3% |
| Latin America | 22 | 0.3% |
| Mexico | 22 | 0.3% |
| Nepal | 16 | 0.2% |
| Nigeria | 54 | 0.8% |
| Pakistan | 46 | 0.7% |
| Romania | 13 | 0.2% |
| South Central Asia | 176 | 2.6% |
| South Eastern Asia | 85 | 1.3% |
| Thailand | 42 | 0.6% |
| Vietnam | 1 | 0.0% |
| Western Africa | 54 | 0.8% |
| Western Asia | 45 | 0.7% | View All 26 Rows |
Sex and Age in Linglestown
Sex and Age in Linglestown
The most populous age groups in Linglestown are 35 to 39 Years (370 | 11.0%) for men and 60 to 64 Years (406 | 11.8%) for women.
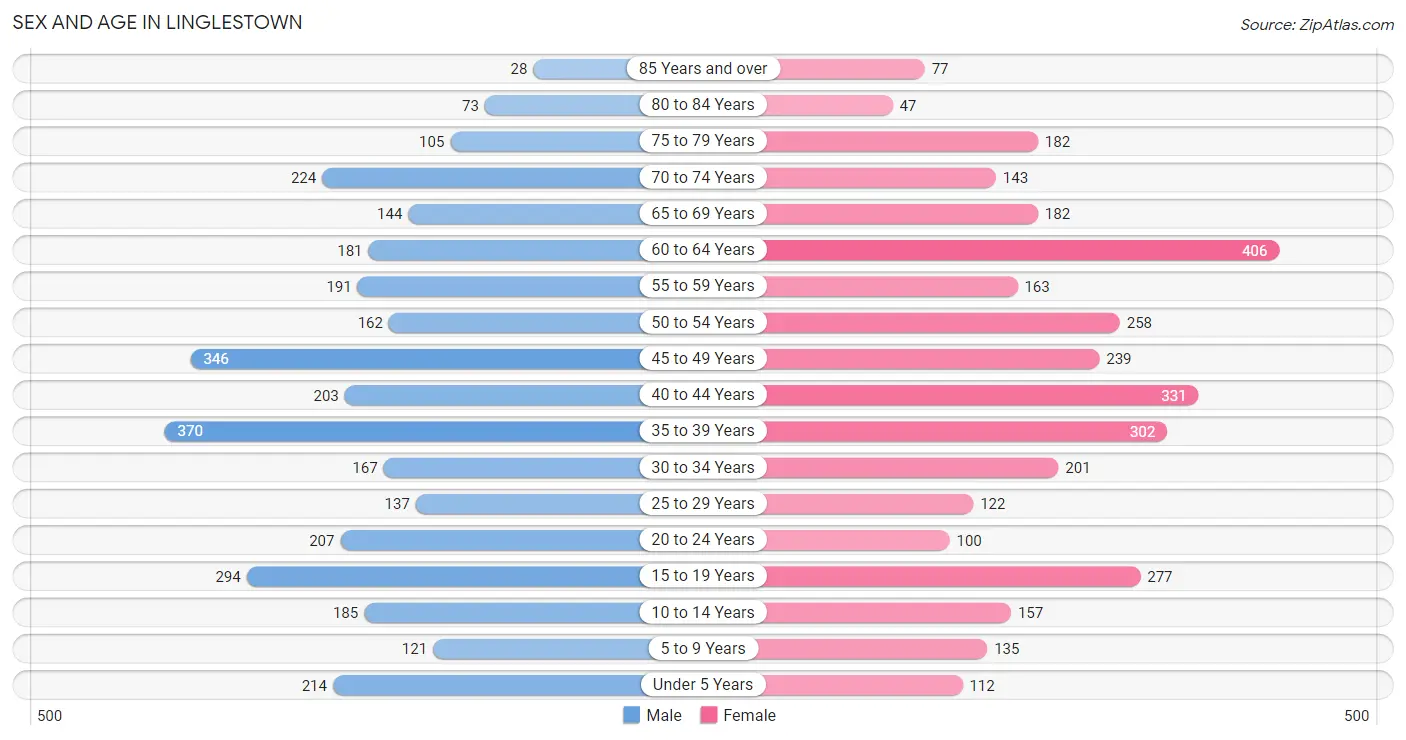
| Age Bracket | Male | Female |
| Under 5 Years | 214 (6.4%) | 112 (3.3%) |
| 5 to 9 Years | 121 (3.6%) | 135 (3.9%) |
| 10 to 14 Years | 185 (5.5%) | 157 (4.6%) |
| 15 to 19 Years | 294 (8.8%) | 277 (8.1%) |
| 20 to 24 Years | 207 (6.2%) | 100 (2.9%) |
| 25 to 29 Years | 137 (4.1%) | 122 (3.5%) |
| 30 to 34 Years | 167 (5.0%) | 201 (5.9%) |
| 35 to 39 Years | 370 (11.0%) | 302 (8.8%) |
| 40 to 44 Years | 203 (6.1%) | 331 (9.6%) |
| 45 to 49 Years | 346 (10.3%) | 239 (7.0%) |
| 50 to 54 Years | 162 (4.8%) | 258 (7.5%) |
| 55 to 59 Years | 191 (5.7%) | 163 (4.8%) |
| 60 to 64 Years | 181 (5.4%) | 406 (11.8%) |
| 65 to 69 Years | 144 (4.3%) | 182 (5.3%) |
| 70 to 74 Years | 224 (6.7%) | 143 (4.2%) |
| 75 to 79 Years | 105 (3.1%) | 182 (5.3%) |
| 80 to 84 Years | 73 (2.2%) | 47 (1.4%) |
| 85 Years and over | 28 (0.8%) | 77 (2.2%) |
| Total | 3,352 (100.0%) | 3,434 (100.0%) |
Families and Households in Linglestown
Median Family Size in Linglestown
The median family size in Linglestown is 3.00 persons per family, with married-couple families (1,564 | 82.5%) accounting for the largest median family size of 3.23 persons per family. On the other hand, single female/mother families (207 | 10.9%) represent the smallest median family size with 1.91 persons per family.
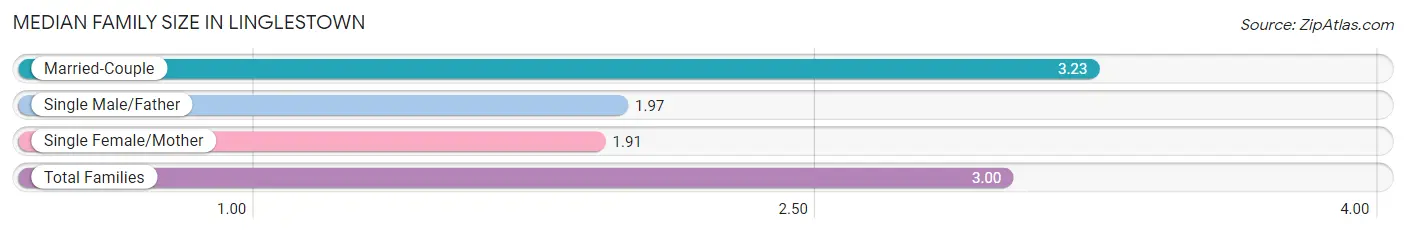
| Family Type | # Families | Family Size |
| Married-Couple | 1,564 (82.5%) | 3.23 |
| Single Male/Father | 124 (6.5%) | 1.97 |
| Single Female/Mother | 207 (10.9%) | 1.91 |
| Total Families | 1,895 (100.0%) | 3.00 |
Median Household Size in Linglestown
The median household size in Linglestown is 2.55 persons per household, with married-couple households (1,564 | 58.8%) accounting for the largest median household size of 3.25 persons per household. non-family households (767 | 28.8%) represent the smallest median household size with 1.26 persons per household.
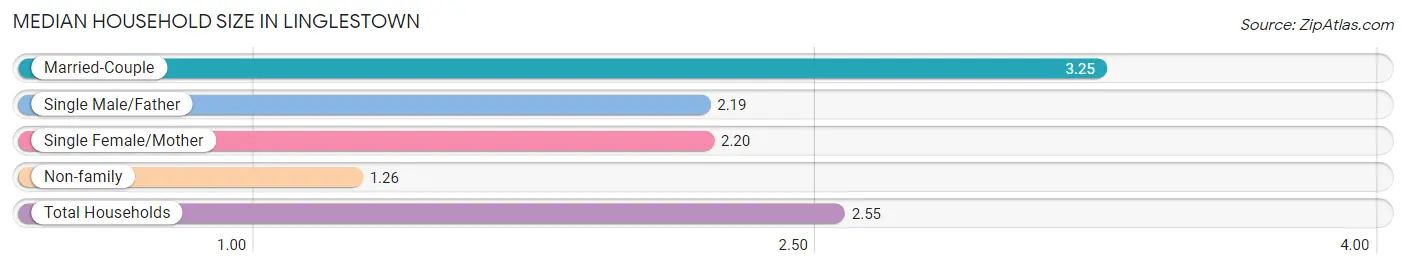
| Household Type | # Households | Household Size |
| Married-Couple | 1,564 (58.8%) | 3.25 |
| Single Male/Father | 124 (4.7%) | 2.19 |
| Single Female/Mother | 207 (7.8%) | 2.20 |
| Non-family | 767 (28.8%) | 1.26 |
| Total Households | 2,662 (100.0%) | 2.55 |
Household Size by Marriage Status in Linglestown
Out of a total of 2,662 households in Linglestown, 1,895 (71.2%) are family households, while 767 (28.8%) are nonfamily households. The most numerous type of family households are 2-person households, comprising 855, and the most common type of nonfamily households are 1-person households, comprising 608.
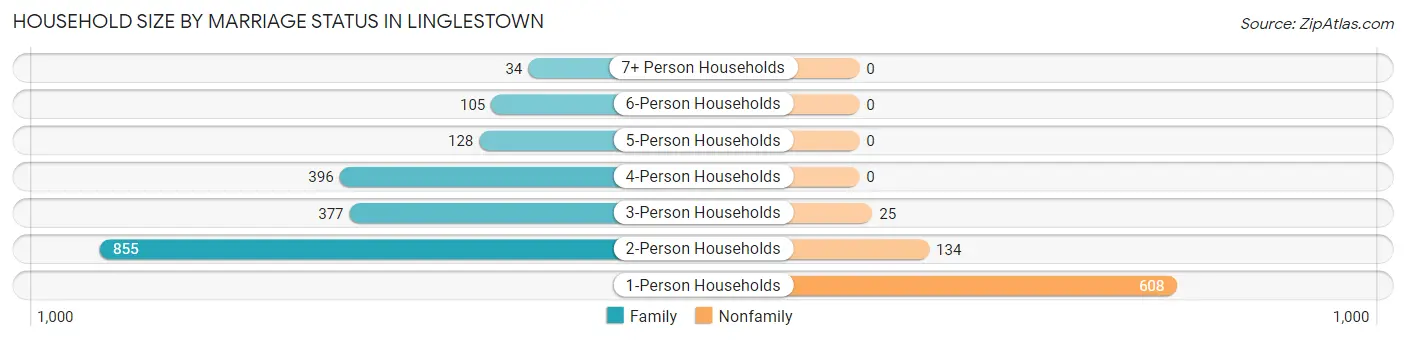
| Household Size | Family Households | Nonfamily Households |
| 1-Person Households | - | 608 (22.8%) |
| 2-Person Households | 855 (32.1%) | 134 (5.0%) |
| 3-Person Households | 377 (14.2%) | 25 (0.9%) |
| 4-Person Households | 396 (14.9%) | 0 (0.0%) |
| 5-Person Households | 128 (4.8%) | 0 (0.0%) |
| 6-Person Households | 105 (3.9%) | 0 (0.0%) |
| 7+ Person Households | 34 (1.3%) | 0 (0.0%) |
| Total | 1,895 (71.2%) | 767 (28.8%) |
Female Fertility in Linglestown
Fertility by Age in Linglestown
Average fertility rate in Linglestown is 47.0 births per 1,000 women. Women in the age bracket of 20 to 34 years have the highest fertility rate with 64.0 births per 1,000 women. Women in the age bracket of 35 to 50 years acount for 63.5% of all women with births.
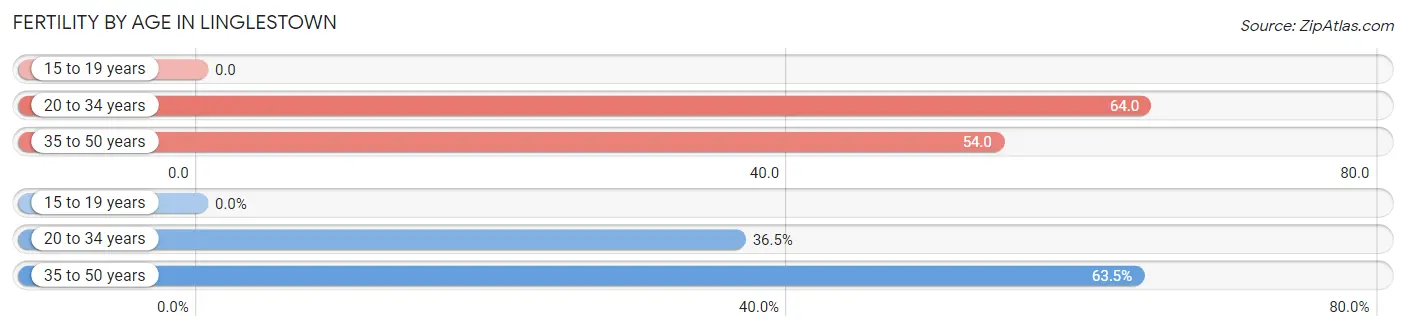
| Age Bracket | Women with Births | Births / 1,000 Women |
| 15 to 19 years | 0 (0.0%) | 0.0 |
| 20 to 34 years | 27 (36.5%) | 64.0 |
| 35 to 50 years | 47 (63.5%) | 54.0 |
| Total | 74 (100.0%) | 47.0 |
Fertility by Age by Marriage Status in Linglestown
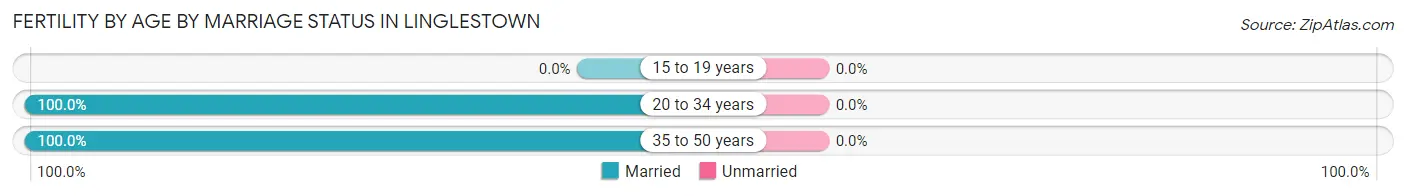
| Age Bracket | Married | Unmarried |
| 15 to 19 years | 0 (0.0%) | 0 (0.0%) |
| 20 to 34 years | 27 (100.0%) | 0 (0.0%) |
| 35 to 50 years | 47 (100.0%) | 0 (0.0%) |
| Total | 74 (100.0%) | 0 (0.0%) |
Fertility by Education in Linglestown
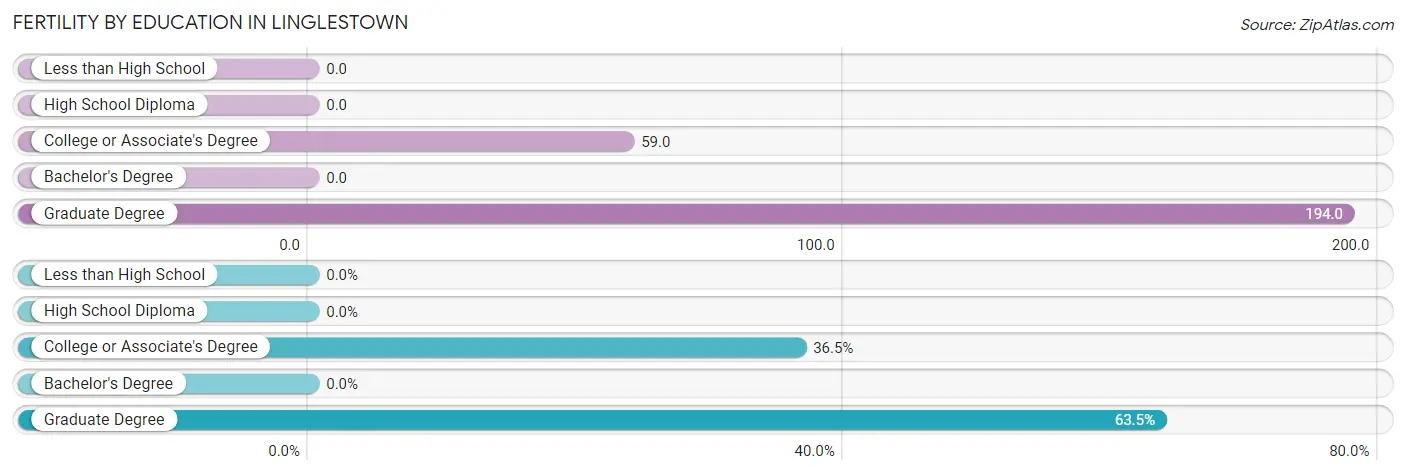
| Educational Attainment | Women with Births | Births / 1,000 Women |
| Less than High School | 0 (0.0%) | 0.0 |
| High School Diploma | 0 (0.0%) | 0.0 |
| College or Associate's Degree | 27 (36.5%) | 59.0 |
| Bachelor's Degree | 0 (0.0%) | 0.0 |
| Graduate Degree | 47 (63.5%) | 194.0 |
| Total | 74 (100.0%) | 47.0 |
Fertility by Education by Marriage Status in Linglestown
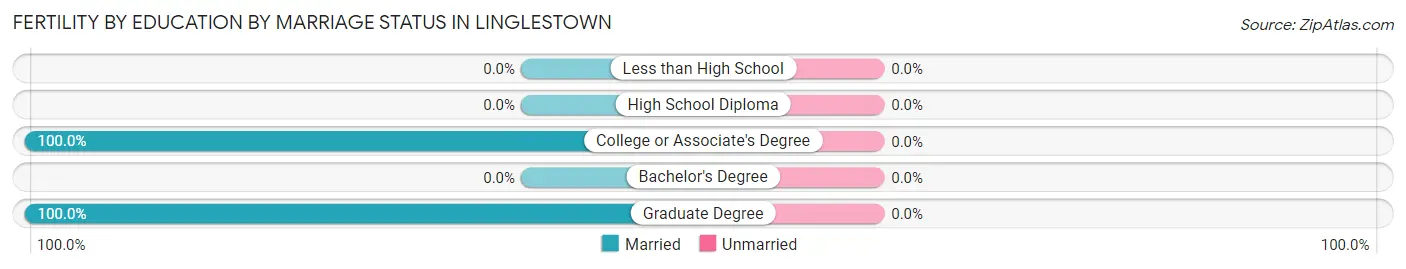
| Educational Attainment | Married | Unmarried |
| Less than High School | 0 (0.0%) | 0 (0.0%) |
| High School Diploma | 0 (0.0%) | 0 (0.0%) |
| College or Associate's Degree | 27 (100.0%) | 0 (0.0%) |
| Bachelor's Degree | 0 (0.0%) | 0 (0.0%) |
| Graduate Degree | 47 (100.0%) | 0 (0.0%) |
| Total | 74 (100.0%) | 0 (0.0%) |
Income in Linglestown
Income Overview in Linglestown
Per Capita Income in Linglestown is $41,726, while median incomes of families and households are $105,328 and $86,142 respectively.
| Characteristic | Number | Measure |
| Per Capita Income | 6,786 | $41,726 |
| Median Family Income | 1,895 | $105,328 |
| Mean Family Income | 1,895 | $123,397 |
| Median Household Income | 2,662 | $86,142 |
| Mean Household Income | 2,662 | $106,881 |
| Income Deficit | 1,895 | $0 |
| Wage / Income Gap (%) | 6,786 | 13.96% |
| Wage / Income Gap ($) | 6,786 | 86.04¢ per $1 |
| Gini / Inequality Index | 6,786 | 0.37 |
Earnings by Sex in Linglestown
Average Earnings in Linglestown are $48,708, $54,338 for men and $46,754 for women, a difference of 14.0%.
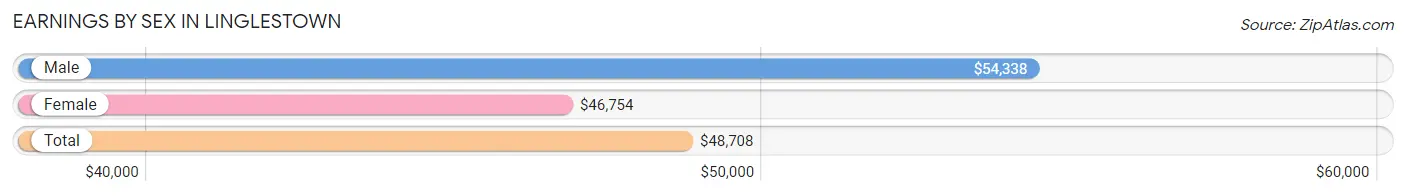
| Sex | Number | Average Earnings |
| Male | 1,956 (49.4%) | $54,338 |
| Female | 2,001 (50.6%) | $46,754 |
| Total | 3,957 (100.0%) | $48,708 |
Earnings by Sex by Income Bracket in Linglestown
The most common earnings brackets in Linglestown are $100,000+ for men (369 | 18.9%) and $45,000 to $49,999 for women (350 | 17.5%).
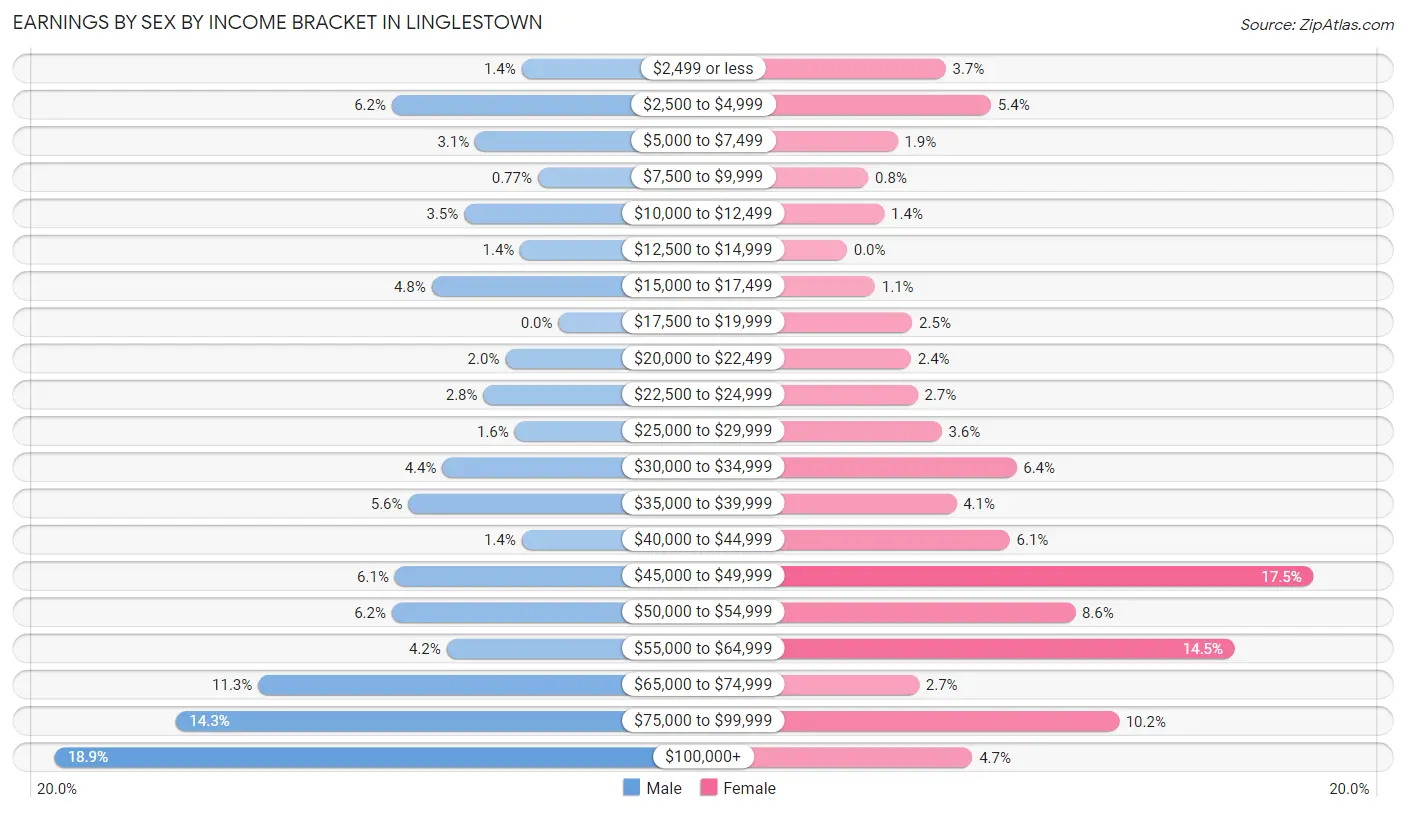
| Income | Male | Female |
| $2,499 or less | 27 (1.4%) | 74 (3.7%) |
| $2,500 to $4,999 | 122 (6.2%) | 108 (5.4%) |
| $5,000 to $7,499 | 61 (3.1%) | 38 (1.9%) |
| $7,500 to $9,999 | 15 (0.8%) | 16 (0.8%) |
| $10,000 to $12,499 | 69 (3.5%) | 28 (1.4%) |
| $12,500 to $14,999 | 28 (1.4%) | 0 (0.0%) |
| $15,000 to $17,499 | 93 (4.8%) | 21 (1.1%) |
| $17,500 to $19,999 | 0 (0.0%) | 49 (2.5%) |
| $20,000 to $22,499 | 39 (2.0%) | 48 (2.4%) |
| $22,500 to $24,999 | 55 (2.8%) | 53 (2.6%) |
| $25,000 to $29,999 | 32 (1.6%) | 71 (3.5%) |
| $30,000 to $34,999 | 85 (4.3%) | 127 (6.4%) |
| $35,000 to $39,999 | 110 (5.6%) | 82 (4.1%) |
| $40,000 to $44,999 | 27 (1.4%) | 122 (6.1%) |
| $45,000 to $49,999 | 120 (6.1%) | 350 (17.5%) |
| $50,000 to $54,999 | 122 (6.2%) | 171 (8.6%) |
| $55,000 to $64,999 | 82 (4.2%) | 291 (14.5%) |
| $65,000 to $74,999 | 220 (11.3%) | 54 (2.7%) |
| $75,000 to $99,999 | 280 (14.3%) | 204 (10.2%) |
| $100,000+ | 369 (18.9%) | 94 (4.7%) |
| Total | 1,956 (100.0%) | 2,001 (100.0%) |
Earnings by Sex by Educational Attainment in Linglestown
Average earnings in Linglestown are $57,353 for men and $48,034 for women, a difference of 16.3%. Men with an educational attainment of bachelor's degree enjoy the highest average annual earnings of $78,229, while those with high school diploma education earn the least with $22,878. Women with an educational attainment of bachelor's degree earn the most with the average annual earnings of $52,339, while those with high school diploma education have the smallest earnings of $38,889.
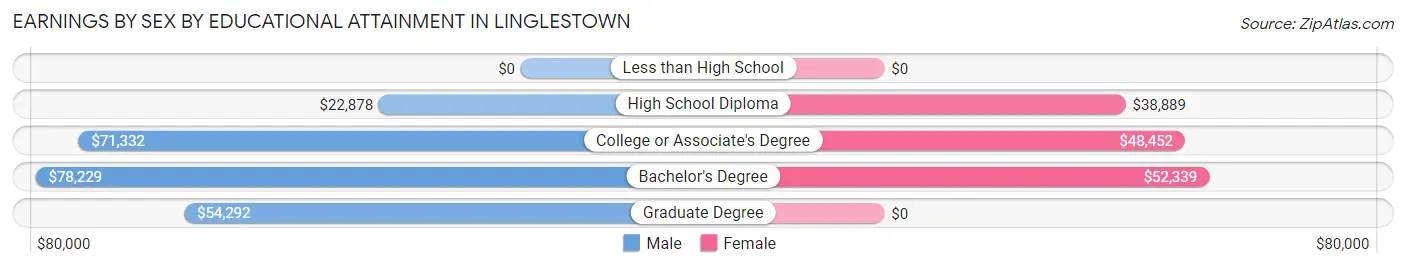
| Educational Attainment | Male Income | Female Income |
| Less than High School | - | - |
| High School Diploma | $22,878 | $38,889 |
| College or Associate's Degree | $71,332 | $48,452 |
| Bachelor's Degree | $78,229 | $52,339 |
| Graduate Degree | $54,292 | $0 |
| Total | $57,353 | $48,034 |
Family Income in Linglestown
Family Income Brackets in Linglestown
According to the Linglestown family income data, there are 449 families falling into the $100,000 to $149,999 income range, which is the most common income bracket and makes up 23.7% of all families.
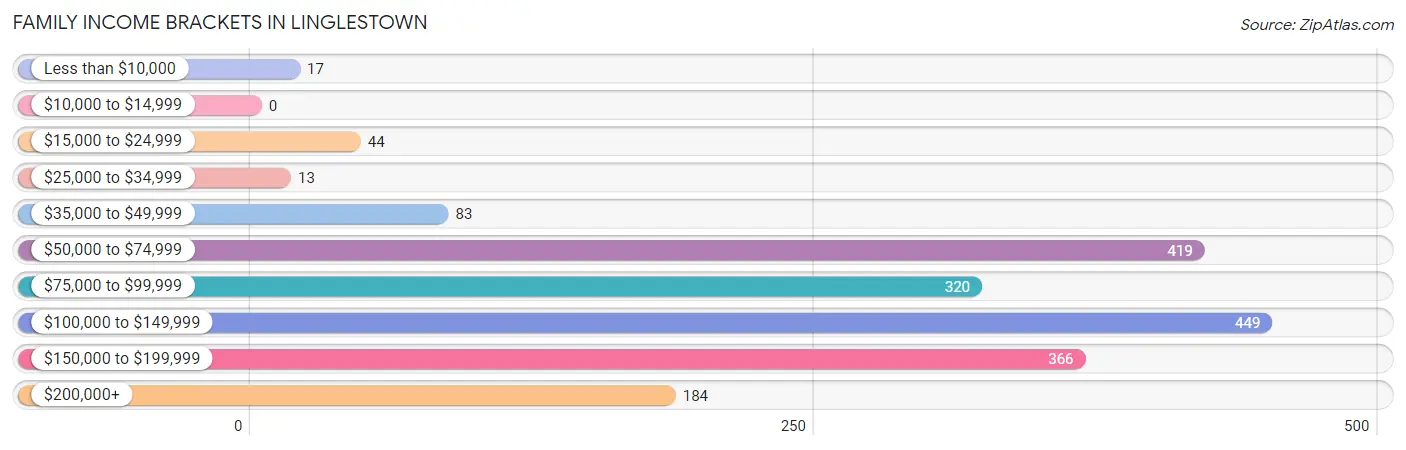
| Income Bracket | # Families | % Families |
| Less than $10,000 | 17 | 0.9% |
| $10,000 to $14,999 | 0 | 0.0% |
| $15,000 to $24,999 | 44 | 2.3% |
| $25,000 to $34,999 | 13 | 0.7% |
| $35,000 to $49,999 | 83 | 4.4% |
| $50,000 to $74,999 | 419 | 22.1% |
| $75,000 to $99,999 | 320 | 16.9% |
| $100,000 to $149,999 | 449 | 23.7% |
| $150,000 to $199,999 | 366 | 19.3% |
| $200,000+ | 184 | 9.7% |
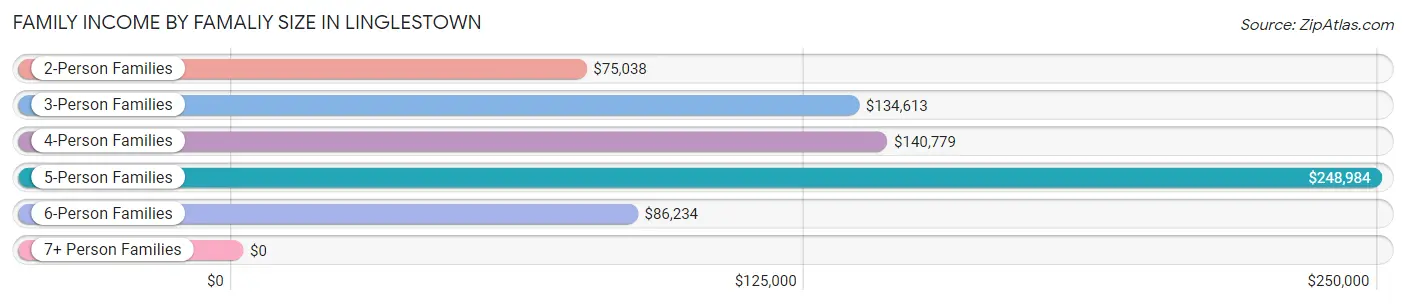
Family Income by Famaliy Size in Linglestown
5-person families (107 | 5.7%) account for the highest median family income in Linglestown with $248,984 per family, while 5-person families (107 | 5.7%) have the highest median income of $49,797 per family member.
| Income Bracket | # Families | Median Income |
| 2-Person Families | 911 (48.1%) | $75,038 |
| 3-Person Families | 467 (24.6%) | $134,613 |
| 4-Person Families | 271 (14.3%) | $140,779 |
| 5-Person Families | 107 (5.7%) | $248,984 |
| 6-Person Families | 105 (5.5%) | $86,234 |
| 7+ Person Families | 34 (1.8%) | $0 |
| Total | 1,895 (100.0%) | $105,328 |
Family Income by Number of Earners in Linglestown
The median family income in Linglestown is $105,328, with families comprising 3+ earners (274) having the highest median family income of $160,313, while families with no earners (238) have the lowest median family income of $63,566, accounting for 14.5% and 12.6% of families, respectively.

| Number of Earners | # Families | Median Income |
| No Earners | 238 (12.6%) | $63,566 |
| 1 Earner | 515 (27.2%) | $74,732 |
| 2 Earners | 868 (45.8%) | $128,750 |
| 3+ Earners | 274 (14.5%) | $160,313 |
| Total | 1,895 (100.0%) | $105,328 |
Household Income in Linglestown
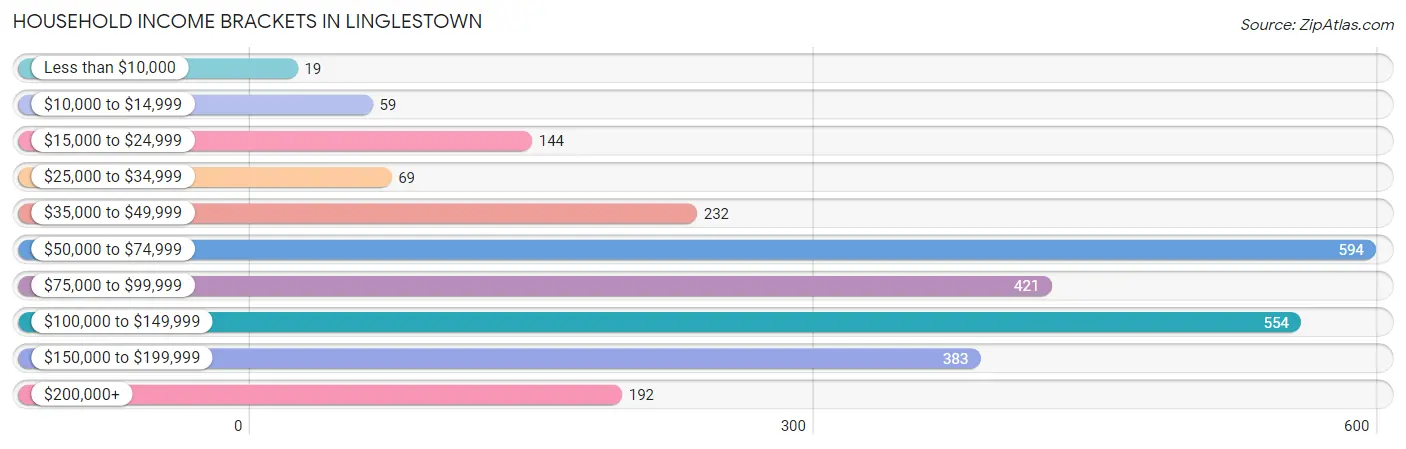
Household Income Brackets in Linglestown
With 594 households falling in the category, the $50,000 to $74,999 income range is the most frequent in Linglestown, accounting for 22.3% of all households. In contrast, only 19 households (0.7%) fall into the less than $10,000 income bracket, making it the least populous group.
| Income Bracket | # Households | % Households |
| Less than $10,000 | 19 | 0.7% |
| $10,000 to $14,999 | 59 | 2.2% |
| $15,000 to $24,999 | 144 | 5.4% |
| $25,000 to $34,999 | 69 | 2.6% |
| $35,000 to $49,999 | 232 | 8.7% |
| $50,000 to $74,999 | 594 | 22.3% |
| $75,000 to $99,999 | 421 | 15.8% |
| $100,000 to $149,999 | 554 | 20.8% |
| $150,000 to $199,999 | 383 | 14.4% |
| $200,000+ | 192 | 7.2% |
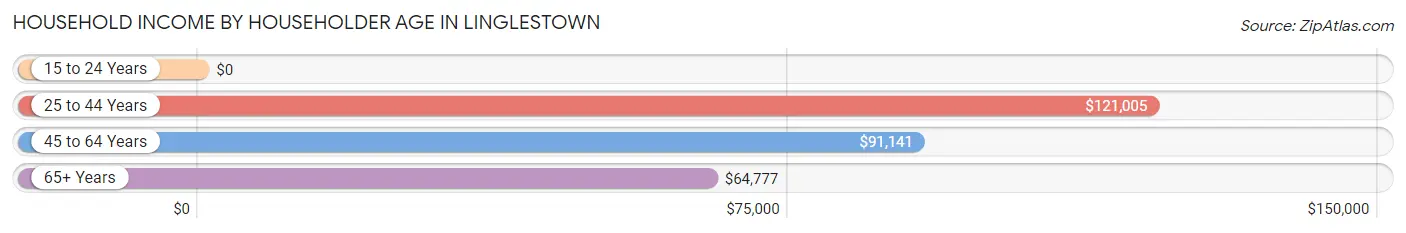
Household Income by Householder Age in Linglestown
The median household income in Linglestown is $86,142, with the highest median household income of $121,005 found in the 25 to 44 years age bracket for the primary householder. A total of 879 households (33.0%) fall into this category.
| Income Bracket | # Households | Median Income |
| 15 to 24 Years | 0 (0.0%) | $0 |
| 25 to 44 Years | 879 (33.0%) | $121,005 |
| 45 to 64 Years | 1,022 (38.4%) | $91,141 |
| 65+ Years | 761 (28.6%) | $64,777 |
| Total | 2,662 (100.0%) | $86,142 |
Poverty in Linglestown
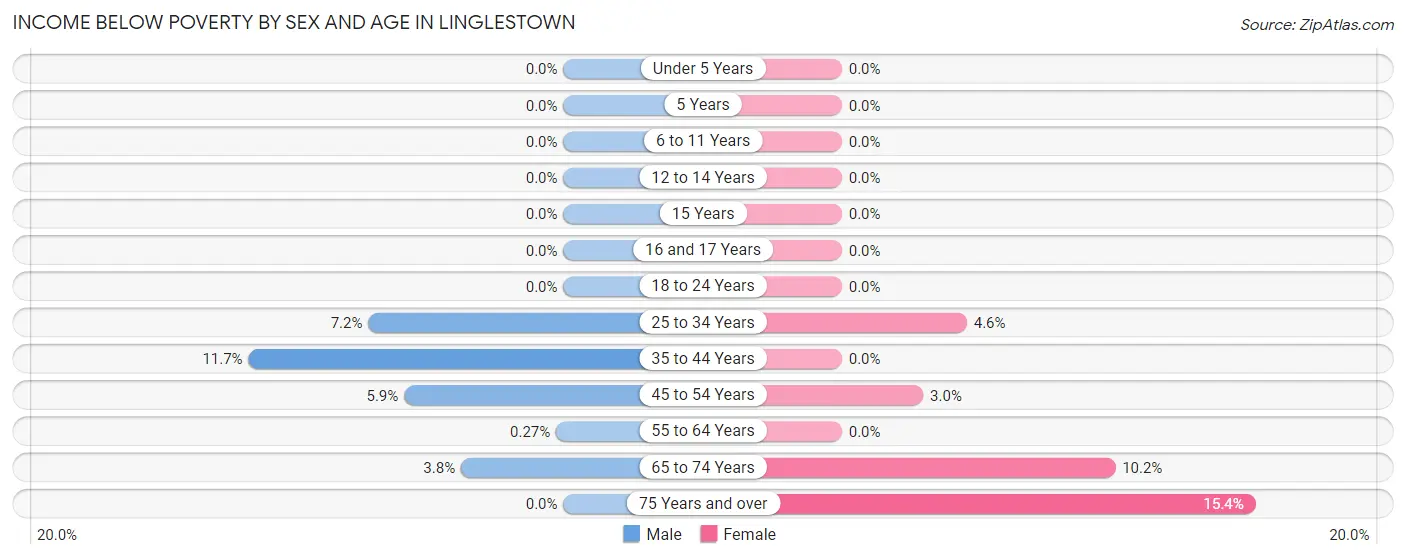
Income Below Poverty by Sex and Age in Linglestown
With 4.0% poverty level for males and 3.2% for females among the residents of Linglestown, 35 to 44 year old males and 75 year old and over females are the most vulnerable to poverty, with 67 males (11.7%) and 47 females (15.4%) in their respective age groups living below the poverty level.
| Age Bracket | Male | Female |
| Under 5 Years | 0 (0.0%) | 0 (0.0%) |
| 5 Years | 0 (0.0%) | 0 (0.0%) |
| 6 to 11 Years | 0 (0.0%) | 0 (0.0%) |
| 12 to 14 Years | 0 (0.0%) | 0 (0.0%) |
| 15 Years | 0 (0.0%) | 0 (0.0%) |
| 16 and 17 Years | 0 (0.0%) | 0 (0.0%) |
| 18 to 24 Years | 0 (0.0%) | 0 (0.0%) |
| 25 to 34 Years | 22 (7.2%) | 15 (4.6%) |
| 35 to 44 Years | 67 (11.7%) | 0 (0.0%) |
| 45 to 54 Years | 30 (5.9%) | 15 (3.0%) |
| 55 to 64 Years | 1 (0.3%) | 0 (0.0%) |
| 65 to 74 Years | 14 (3.8%) | 33 (10.2%) |
| 75 Years and over | 0 (0.0%) | 47 (15.4%) |
| Total | 134 (4.0%) | 110 (3.2%) |
Income Above Poverty by Sex and Age in Linglestown
According to the poverty statistics in Linglestown, males aged under 5 years and females aged under 5 years are the age groups that are most secure financially, with 100.0% of males and 100.0% of females in these age groups living above the poverty line.
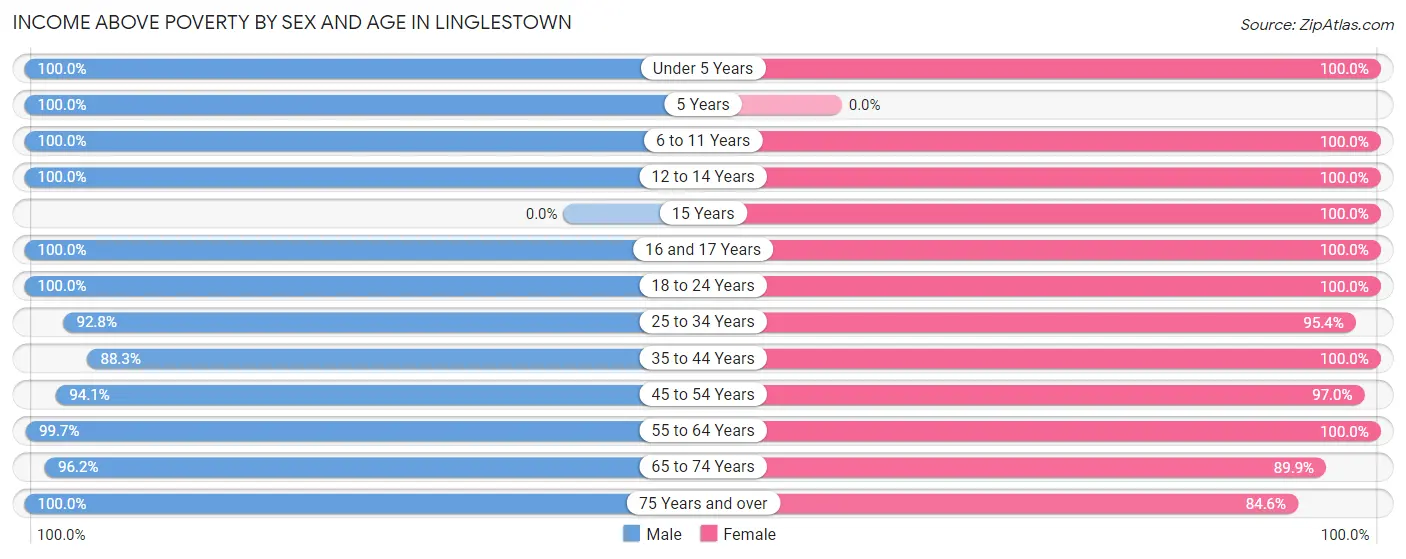
| Age Bracket | Male | Female |
| Under 5 Years | 214 (100.0%) | 112 (100.0%) |
| 5 Years | 49 (100.0%) | 0 (0.0%) |
| 6 to 11 Years | 75 (100.0%) | 210 (100.0%) |
| 12 to 14 Years | 182 (100.0%) | 82 (100.0%) |
| 15 Years | 0 (0.0%) | 51 (100.0%) |
| 16 and 17 Years | 262 (100.0%) | 158 (100.0%) |
| 18 to 24 Years | 239 (100.0%) | 168 (100.0%) |
| 25 to 34 Years | 282 (92.8%) | 308 (95.4%) |
| 35 to 44 Years | 506 (88.3%) | 633 (100.0%) |
| 45 to 54 Years | 478 (94.1%) | 482 (97.0%) |
| 55 to 64 Years | 371 (99.7%) | 569 (100.0%) |
| 65 to 74 Years | 354 (96.2%) | 292 (89.8%) |
| 75 Years and over | 206 (100.0%) | 259 (84.6%) |
| Total | 3,218 (96.0%) | 3,324 (96.8%) |
Income Below Poverty Among Married-Couple Families in Linglestown
The poverty statistics for married-couple families in Linglestown show that 1.1% or 17 of the total 1,564 families live below the poverty line. Families with no children have the highest poverty rate of 1.9%, comprising of 17 families. On the other hand, families with 1 or 2 children have the lowest poverty rate of 0.0%, which includes 0 families.
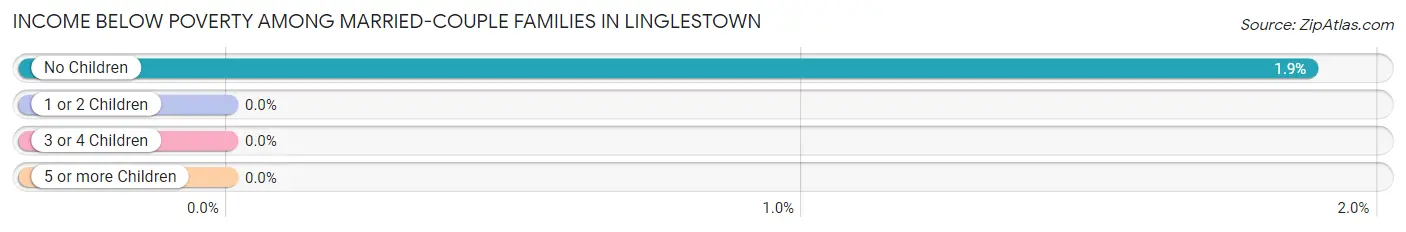
| Children | Above Poverty | Below Poverty |
| No Children | 885 (98.1%) | 17 (1.9%) |
| 1 or 2 Children | 473 (100.0%) | 0 (0.0%) |
| 3 or 4 Children | 189 (100.0%) | 0 (0.0%) |
| 5 or more Children | 0 (0.0%) | 0 (0.0%) |
| Total | 1,547 (98.9%) | 17 (1.1%) |
Income Below Poverty Among Single-Parent Households in Linglestown
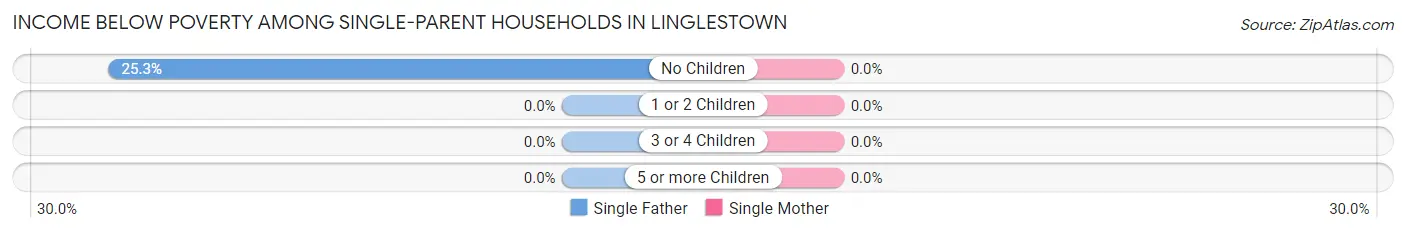
| Children | Single Father | Single Mother |
| No Children | 21 (25.3%) | 0 (0.0%) |
| 1 or 2 Children | 0 (0.0%) | 0 (0.0%) |
| 3 or 4 Children | 0 (0.0%) | 0 (0.0%) |
| 5 or more Children | 0 (0.0%) | 0 (0.0%) |
| Total | 21 (16.9%) | 0 (0.0%) |
Income Below Poverty Among Married-Couple vs Single-Parent Households in Linglestown
The poverty data for Linglestown shows that 17 of the married-couple family households (1.1%) and 21 of the single-parent households (6.3%) are living below the poverty level. Within the married-couple family households, those with no children have the highest poverty rate, with 17 households (1.9%) falling below the poverty line. Among the single-parent households, those with no children have the highest poverty rate, with 21 household (15.1%) living below poverty.
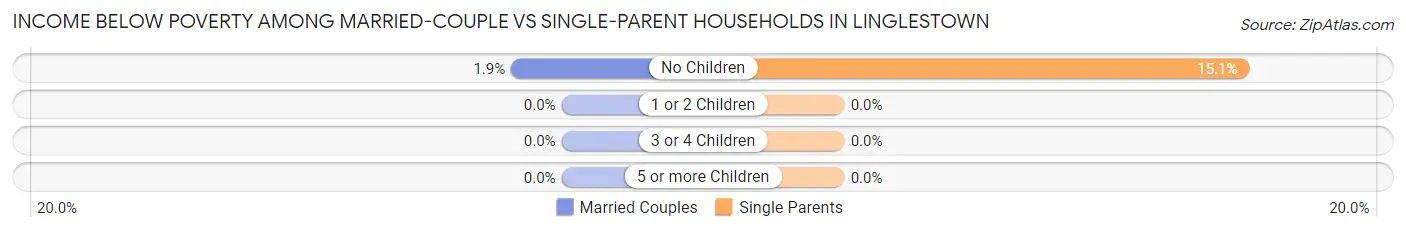
| Children | Married-Couple Families | Single-Parent Households |
| No Children | 17 (1.9%) | 21 (15.1%) |
| 1 or 2 Children | 0 (0.0%) | 0 (0.0%) |
| 3 or 4 Children | 0 (0.0%) | 0 (0.0%) |
| 5 or more Children | 0 (0.0%) | 0 (0.0%) |
| Total | 17 (1.1%) | 21 (6.3%) |
Employment Characteristics in Linglestown
Employment by Class of Employer in Linglestown
Among the 3,611 employed individuals in Linglestown, private company employees (2,332 | 64.6%), not-for-profit organizations (656 | 18.2%), and state government employees (260 | 7.2%) make up the most common classes of employment.
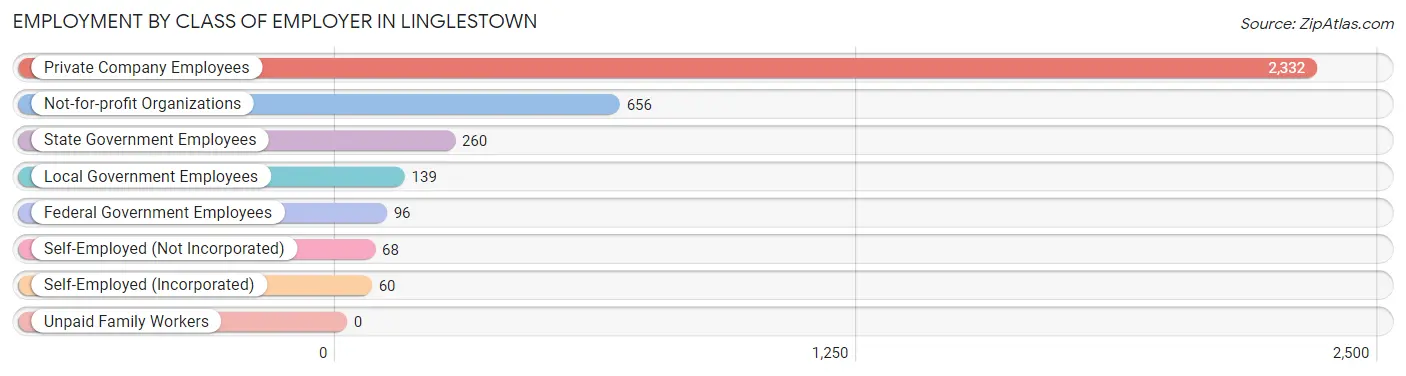
| Employer Class | # Employees | % Employees |
| Private Company Employees | 2,332 | 64.6% |
| Self-Employed (Incorporated) | 60 | 1.7% |
| Self-Employed (Not Incorporated) | 68 | 1.9% |
| Not-for-profit Organizations | 656 | 18.2% |
| Local Government Employees | 139 | 3.8% |
| State Government Employees | 260 | 7.2% |
| Federal Government Employees | 96 | 2.7% |
| Unpaid Family Workers | 0 | 0.0% |
| Total | 3,611 | 100.0% |
Employment Status by Age in Linglestown
According to the labor force statistics for Linglestown, out of the total population over 16 years of age (5,811), 65.1% or 3,783 individuals are in the labor force, with 3.3% or 125 of them unemployed. The age group with the highest labor force participation rate is 30 to 34 years, with 100.0% or 368 individuals in the labor force. Within the labor force, the 20 to 24 years age range has the highest percentage of unemployed individuals, with 51.9% or 81 of them being unemployed.
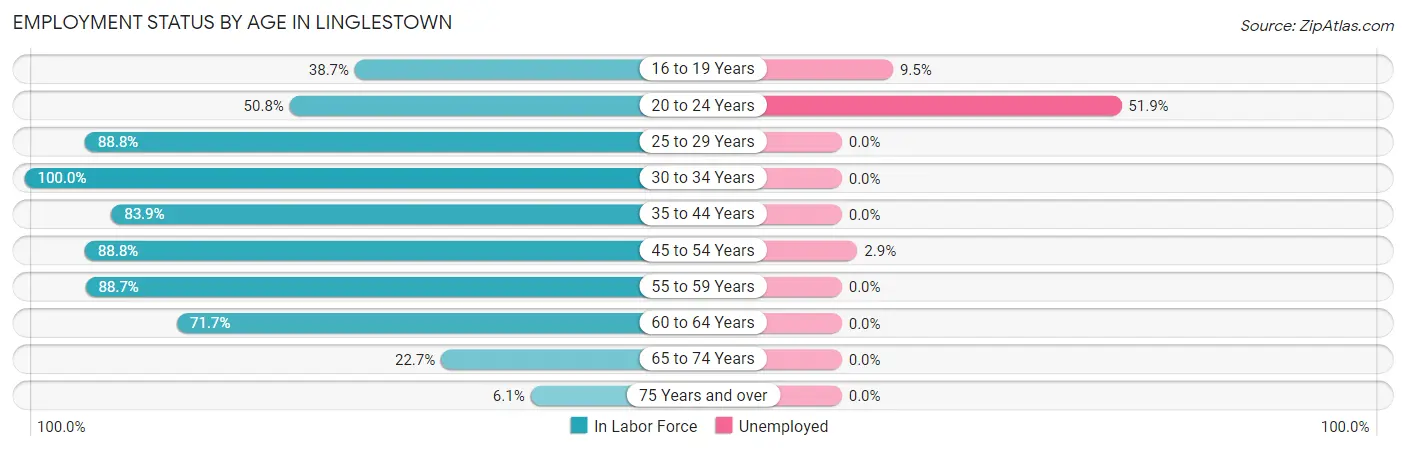
| Age Bracket | In Labor Force | Unemployed |
| 16 to 19 Years | 201 (38.7%) | 19 (9.5%) |
| 20 to 24 Years | 156 (50.8%) | 81 (51.9%) |
| 25 to 29 Years | 230 (88.8%) | 0 (0.0%) |
| 30 to 34 Years | 368 (100.0%) | 0 (0.0%) |
| 35 to 44 Years | 1,012 (83.9%) | 0 (0.0%) |
| 45 to 54 Years | 892 (88.8%) | 26 (2.9%) |
| 55 to 59 Years | 314 (88.7%) | 0 (0.0%) |
| 60 to 64 Years | 421 (71.7%) | 0 (0.0%) |
| 65 to 74 Years | 157 (22.7%) | 0 (0.0%) |
| 75 Years and over | 31 (6.1%) | 0 (0.0%) |
| Total | 3,783 (65.1%) | 125 (3.3%) |
Employment Status by Educational Attainment in Linglestown
According to labor force statistics for Linglestown, 85.7% of individuals (3,239) out of the total population between 25 and 64 years of age (3,779) are in the labor force, with 0.8% or 26 of them being unemployed. The group with the highest labor force participation rate are those with the educational attainment of college / associate degree, with 91.5% or 955 individuals in the labor force. Within the labor force, individuals with high school diploma education have the highest percentage of unemployment, with 2.2% or 18 of them being unemployed.
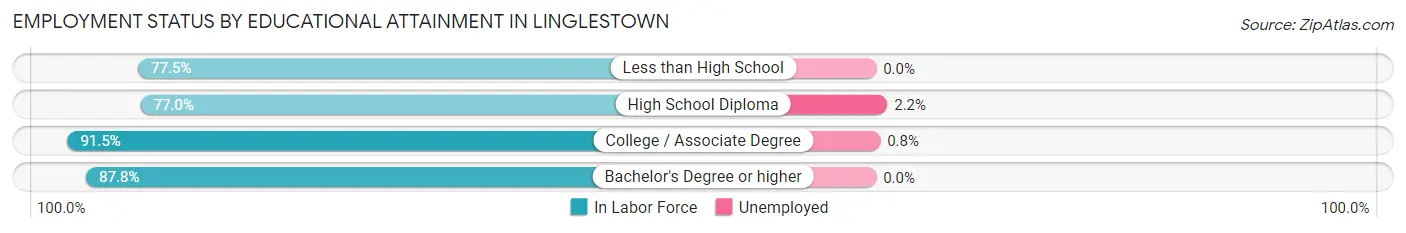
| Educational Attainment | In Labor Force | Unemployed |
| Less than High School | 55 (77.5%) | 0 (0.0%) |
| High School Diploma | 802 (77.0%) | 23 (2.2%) |
| College / Associate Degree | 955 (91.5%) | 8 (0.8%) |
| Bachelor's Degree or higher | 1,425 (87.8%) | 0 (0.0%) |
| Total | 3,239 (85.7%) | 30 (0.8%) |
Employment Occupations by Sex in Linglestown
Management, Business, Science and Arts Occupations
The most common Management, Business, Science and Arts occupations in Linglestown are Community & Social Service (341 | 9.3%), Health Diagnosing & Treating (341 | 9.3%), Computers, Engineering & Science (315 | 8.6%), Management (308 | 8.4%), and Business & Financial (255 | 7.0%).
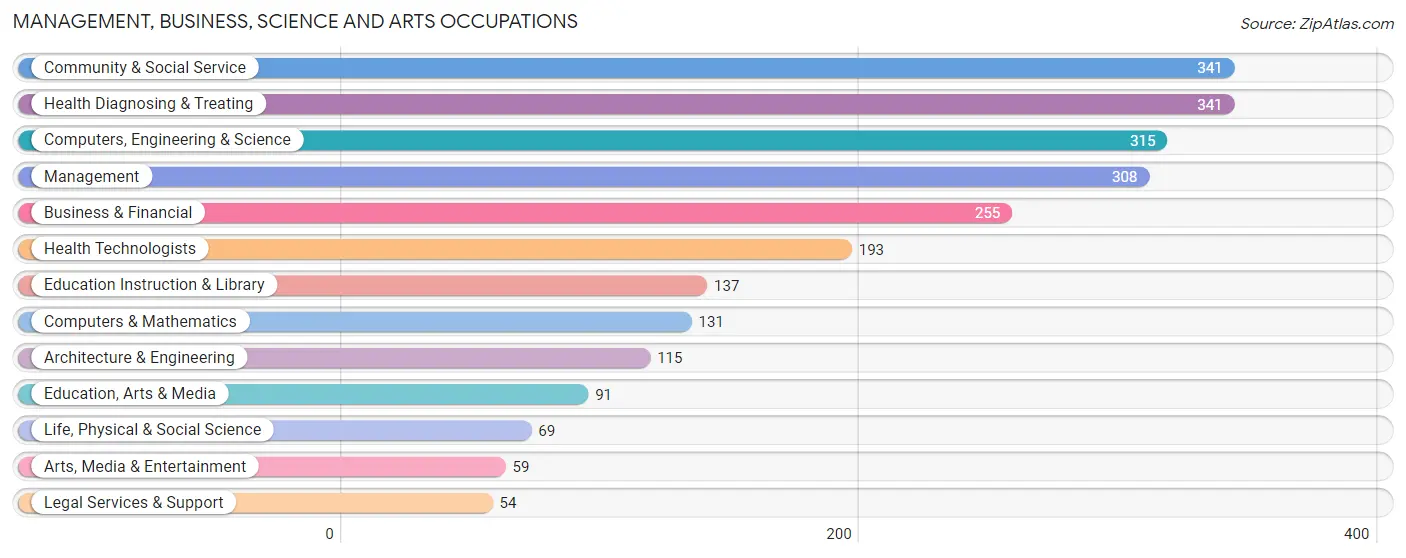
Management, Business, Science and Arts Occupations by Sex
Within the Management, Business, Science and Arts occupations in Linglestown, the most male-oriented occupations are Life, Physical & Social Science (100.0%), Education, Arts & Media (91.2%), and Computers, Engineering & Science (85.4%), while the most female-oriented occupations are Legal Services & Support (100.0%), Health Diagnosing & Treating (100.0%), and Health Technologists (100.0%).
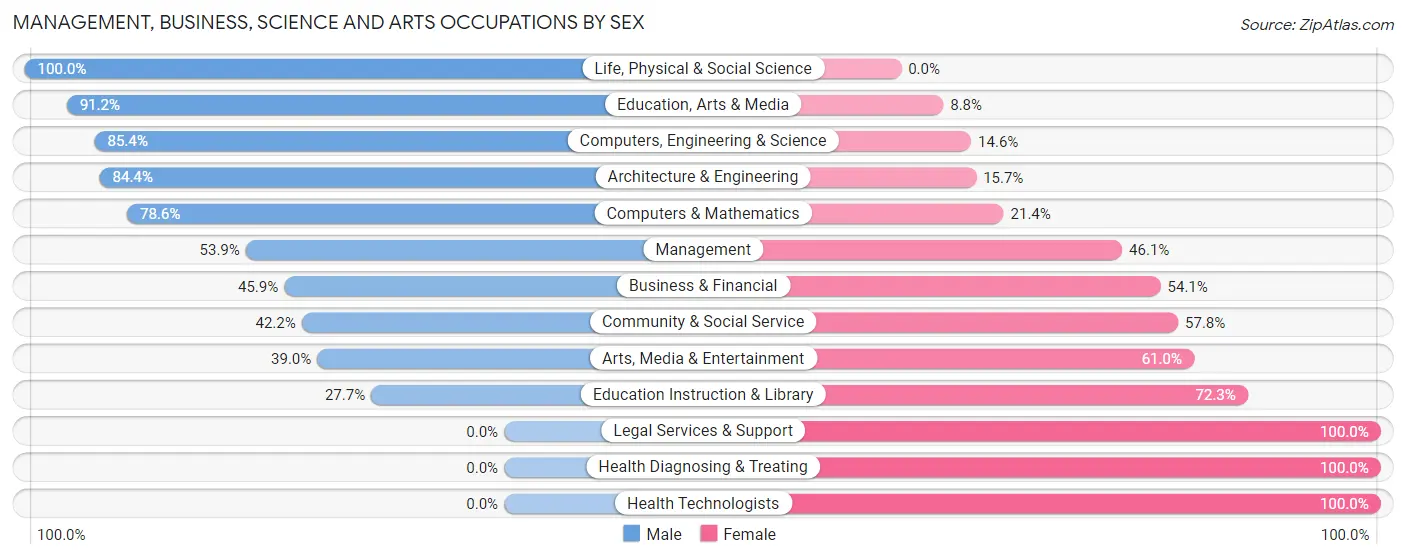
| Occupation | Male | Female |
| Management | 166 (53.9%) | 142 (46.1%) |
| Business & Financial | 117 (45.9%) | 138 (54.1%) |
| Computers, Engineering & Science | 269 (85.4%) | 46 (14.6%) |
| Computers & Mathematics | 103 (78.6%) | 28 (21.4%) |
| Architecture & Engineering | 97 (84.4%) | 18 (15.7%) |
| Life, Physical & Social Science | 69 (100.0%) | 0 (0.0%) |
| Community & Social Service | 144 (42.2%) | 197 (57.8%) |
| Education, Arts & Media | 83 (91.2%) | 8 (8.8%) |
| Legal Services & Support | 0 (0.0%) | 54 (100.0%) |
| Education Instruction & Library | 38 (27.7%) | 99 (72.3%) |
| Arts, Media & Entertainment | 23 (39.0%) | 36 (61.0%) |
| Health Diagnosing & Treating | 0 (0.0%) | 341 (100.0%) |
| Health Technologists | 0 (0.0%) | 193 (100.0%) |
| Total (Category) | 696 (44.6%) | 864 (55.4%) |
| Total (Overall) | 1,727 (47.2%) | 1,929 (52.8%) |
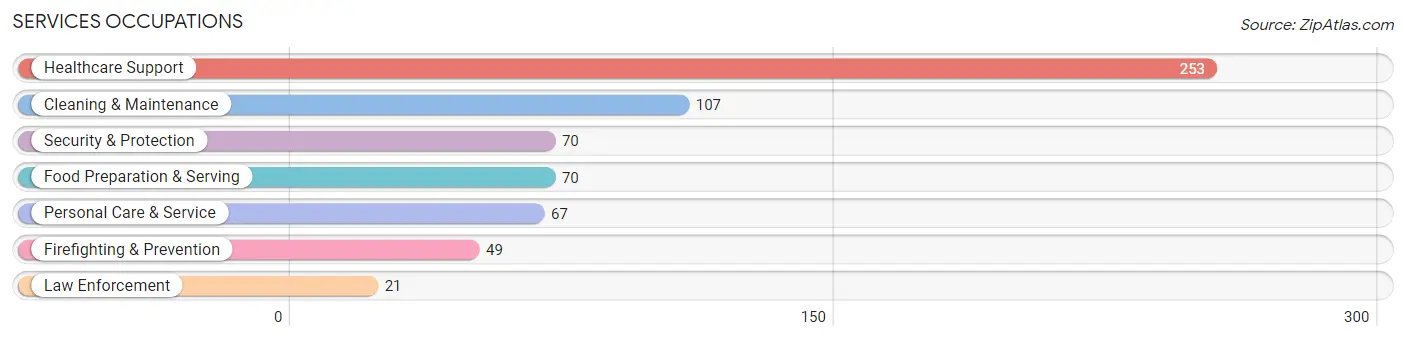
Services Occupations
The most common Services occupations in Linglestown are Healthcare Support (253 | 6.9%), Cleaning & Maintenance (107 | 2.9%), Security & Protection (70 | 1.9%), Food Preparation & Serving (70 | 1.9%), and Personal Care & Service (67 | 1.8%).
Services Occupations by Sex
Within the Services occupations in Linglestown, the most male-oriented occupations are Firefighting & Prevention (57.1%), Food Preparation & Serving (48.6%), and Security & Protection (40.0%), while the most female-oriented occupations are Law Enforcement (100.0%), Personal Care & Service (100.0%), and Healthcare Support (68.4%).
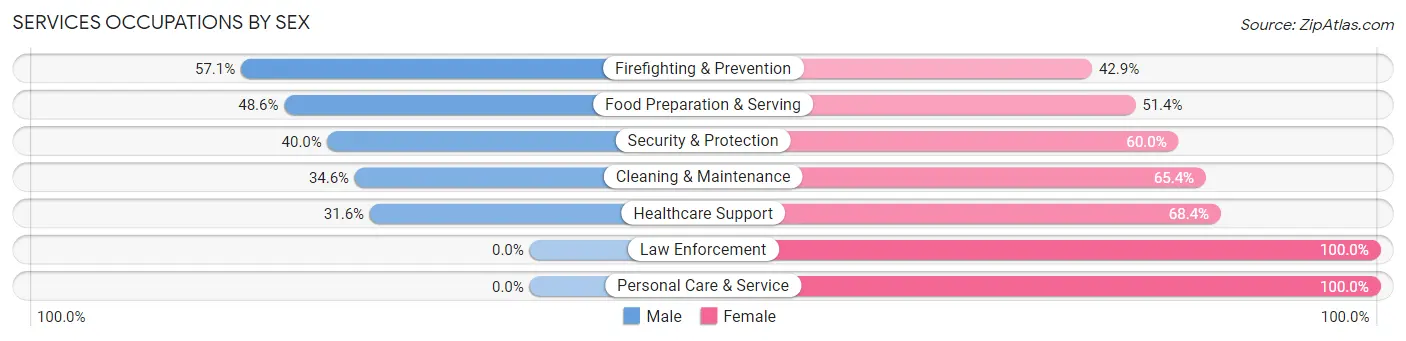
| Occupation | Male | Female |
| Healthcare Support | 80 (31.6%) | 173 (68.4%) |
| Security & Protection | 28 (40.0%) | 42 (60.0%) |
| Firefighting & Prevention | 28 (57.1%) | 21 (42.9%) |
| Law Enforcement | 0 (0.0%) | 21 (100.0%) |
| Food Preparation & Serving | 34 (48.6%) | 36 (51.4%) |
| Cleaning & Maintenance | 37 (34.6%) | 70 (65.4%) |
| Personal Care & Service | 0 (0.0%) | 67 (100.0%) |
| Total (Category) | 179 (31.6%) | 388 (68.4%) |
| Total (Overall) | 1,727 (47.2%) | 1,929 (52.8%) |
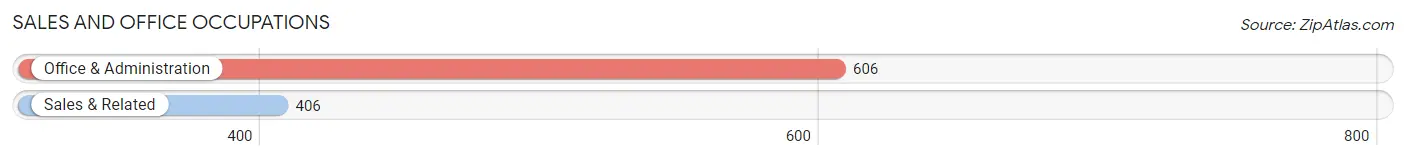
Sales and Office Occupations
The most common Sales and Office occupations in Linglestown are Office & Administration (606 | 16.6%), and Sales & Related (406 | 11.1%).
Sales and Office Occupations by Sex
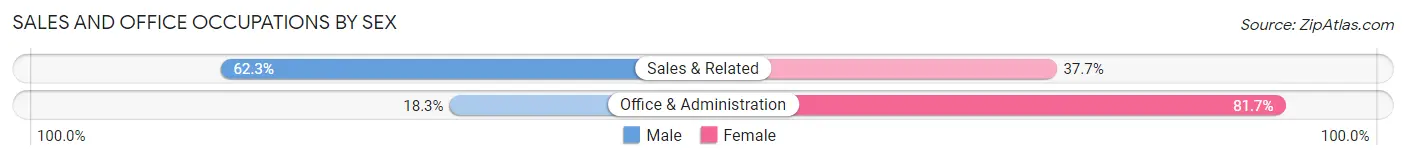
| Occupation | Male | Female |
| Sales & Related | 253 (62.3%) | 153 (37.7%) |
| Office & Administration | 111 (18.3%) | 495 (81.7%) |
| Total (Category) | 364 (36.0%) | 648 (64.0%) |
| Total (Overall) | 1,727 (47.2%) | 1,929 (52.8%) |
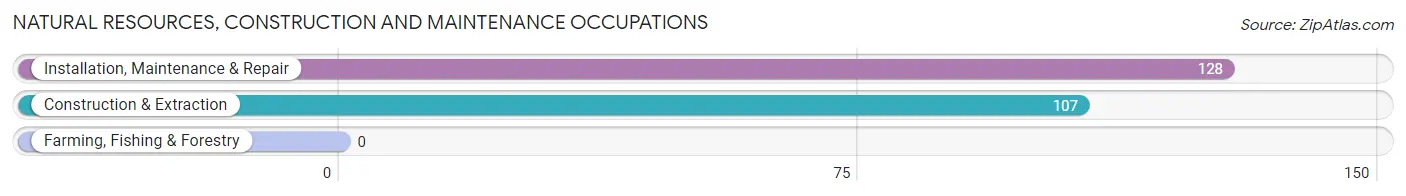
Natural Resources, Construction and Maintenance Occupations
The most common Natural Resources, Construction and Maintenance occupations in Linglestown are Installation, Maintenance & Repair (128 | 3.5%), and Construction & Extraction (107 | 2.9%).
Natural Resources, Construction and Maintenance Occupations by Sex
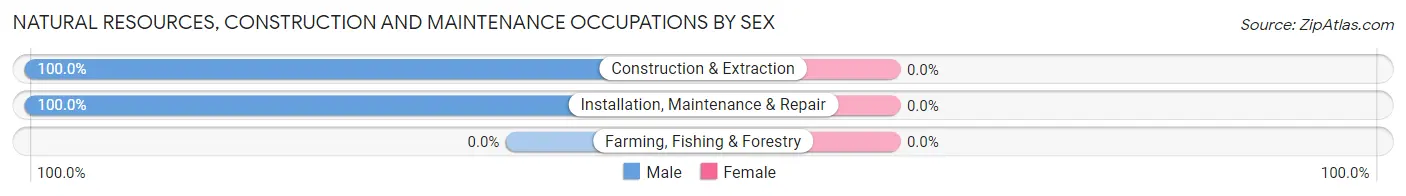
| Occupation | Male | Female |
| Farming, Fishing & Forestry | 0 (0.0%) | 0 (0.0%) |
| Construction & Extraction | 107 (100.0%) | 0 (0.0%) |
| Installation, Maintenance & Repair | 128 (100.0%) | 0 (0.0%) |
| Total (Category) | 235 (100.0%) | 0 (0.0%) |
| Total (Overall) | 1,727 (47.2%) | 1,929 (52.8%) |
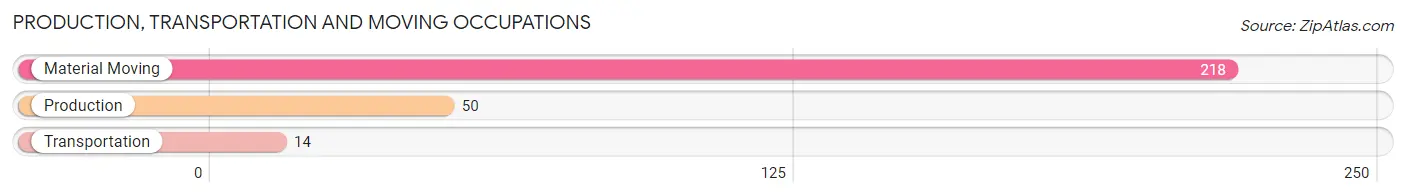
Production, Transportation and Moving Occupations
The most common Production, Transportation and Moving occupations in Linglestown are Material Moving (218 | 6.0%), Production (50 | 1.4%), and Transportation (14 | 0.4%).
Production, Transportation and Moving Occupations by Sex
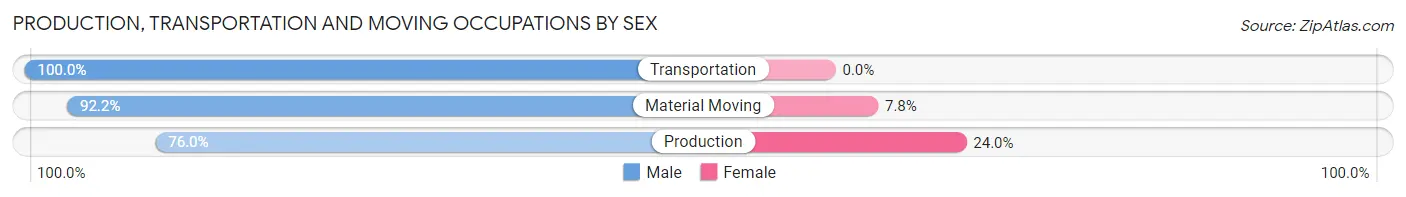
| Occupation | Male | Female |
| Production | 38 (76.0%) | 12 (24.0%) |
| Transportation | 14 (100.0%) | 0 (0.0%) |
| Material Moving | 201 (92.2%) | 17 (7.8%) |
| Total (Category) | 253 (89.7%) | 29 (10.3%) |
| Total (Overall) | 1,727 (47.2%) | 1,929 (52.8%) |
Employment Industries by Sex in Linglestown
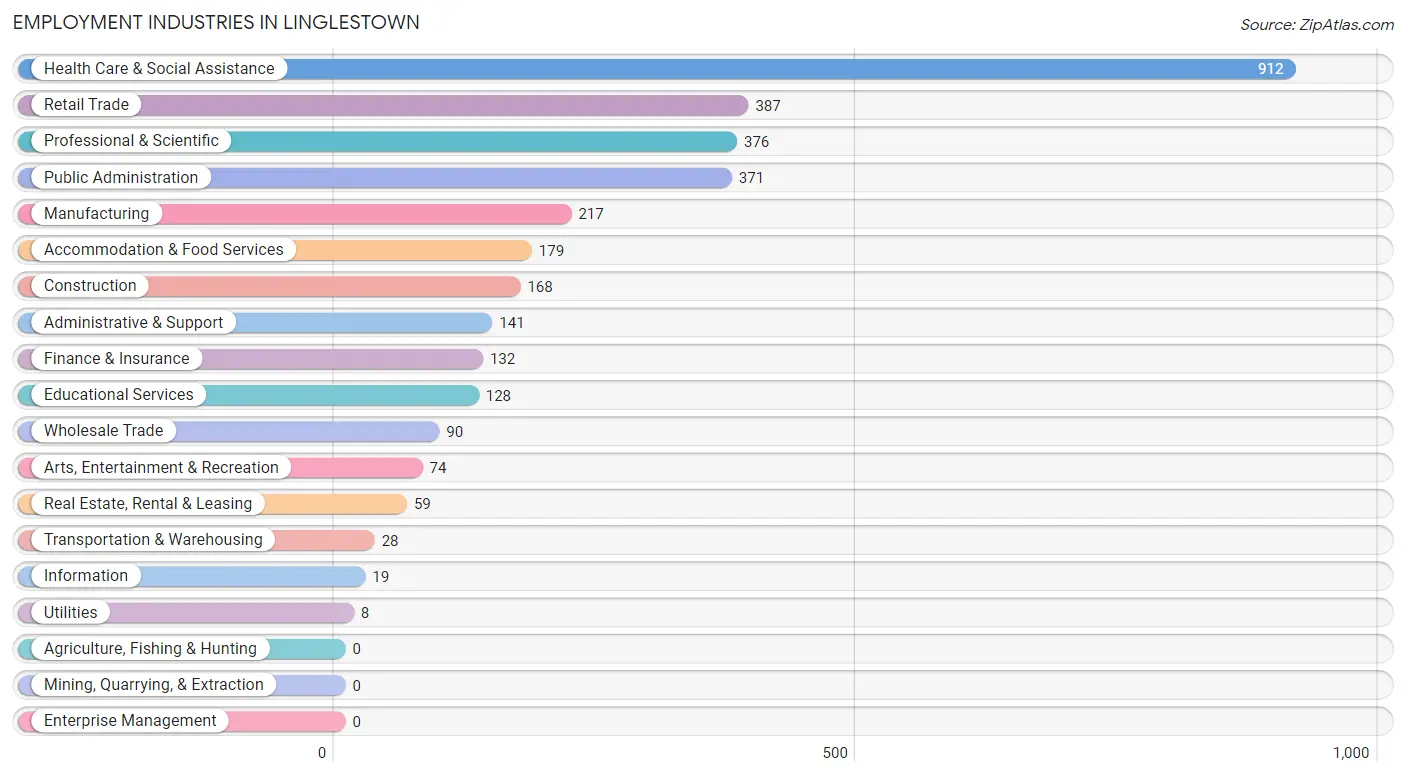
Employment Industries in Linglestown
The major employment industries in Linglestown include Health Care & Social Assistance (912 | 24.9%), Retail Trade (387 | 10.6%), Professional & Scientific (376 | 10.3%), Public Administration (371 | 10.2%), and Manufacturing (217 | 5.9%).
Employment Industries by Sex in Linglestown
The Linglestown industries that see more men than women are Utilities (100.0%), Manufacturing (84.3%), and Real Estate, Rental & Leasing (79.7%), whereas the industries that tend to have a higher number of women are Information (100.0%), Educational Services (85.2%), and Health Care & Social Assistance (79.6%).
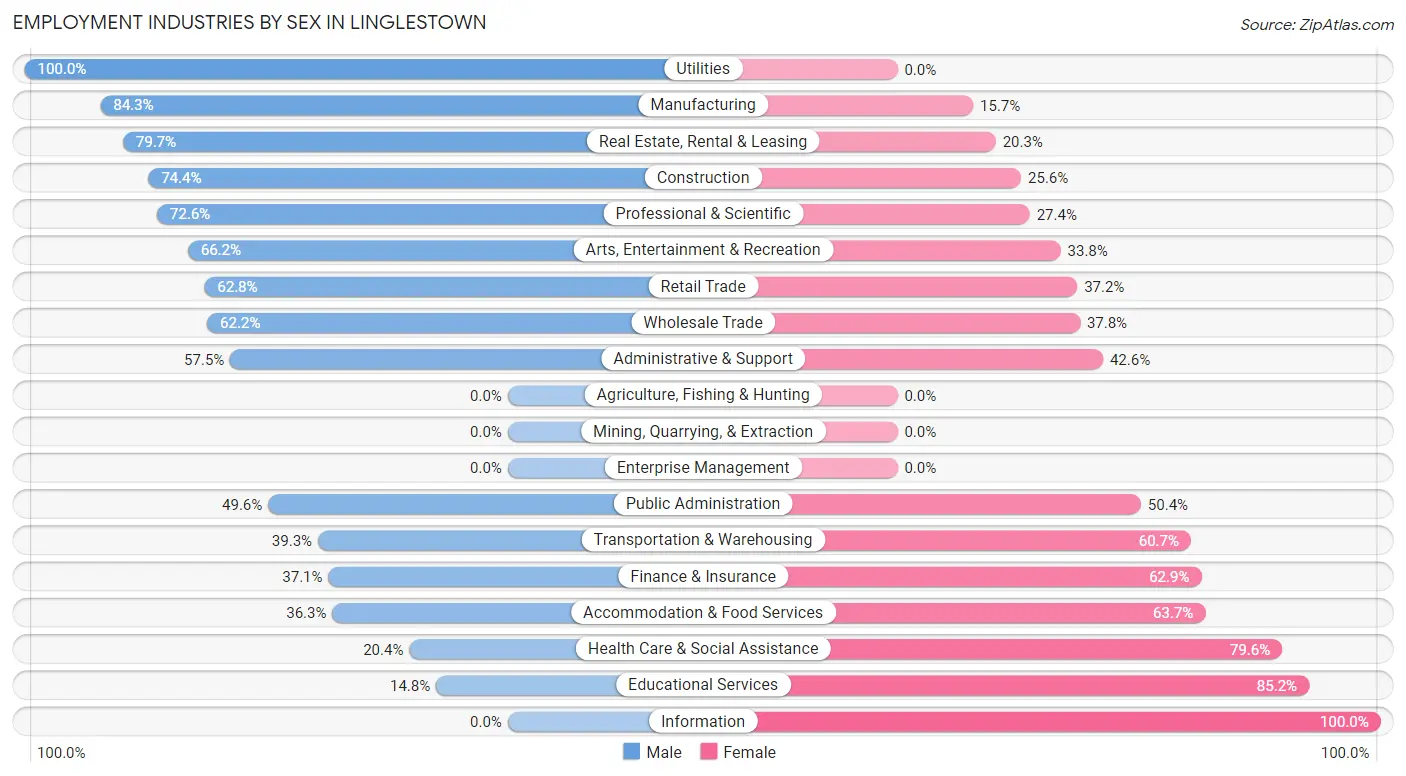
| Industry | Male | Female |
| Agriculture, Fishing & Hunting | 0 (0.0%) | 0 (0.0%) |
| Mining, Quarrying, & Extraction | 0 (0.0%) | 0 (0.0%) |
| Construction | 125 (74.4%) | 43 (25.6%) |
| Manufacturing | 183 (84.3%) | 34 (15.7%) |
| Wholesale Trade | 56 (62.2%) | 34 (37.8%) |
| Retail Trade | 243 (62.8%) | 144 (37.2%) |
| Transportation & Warehousing | 11 (39.3%) | 17 (60.7%) |
| Utilities | 8 (100.0%) | 0 (0.0%) |
| Information | 0 (0.0%) | 19 (100.0%) |
| Finance & Insurance | 49 (37.1%) | 83 (62.9%) |
| Real Estate, Rental & Leasing | 47 (79.7%) | 12 (20.3%) |
| Professional & Scientific | 273 (72.6%) | 103 (27.4%) |
| Enterprise Management | 0 (0.0%) | 0 (0.0%) |
| Administrative & Support | 81 (57.5%) | 60 (42.5%) |
| Educational Services | 19 (14.8%) | 109 (85.2%) |
| Health Care & Social Assistance | 186 (20.4%) | 726 (79.6%) |
| Arts, Entertainment & Recreation | 49 (66.2%) | 25 (33.8%) |
| Accommodation & Food Services | 65 (36.3%) | 114 (63.7%) |
| Public Administration | 184 (49.6%) | 187 (50.4%) |
| Total | 1,727 (47.2%) | 1,929 (52.8%) |
Education in Linglestown
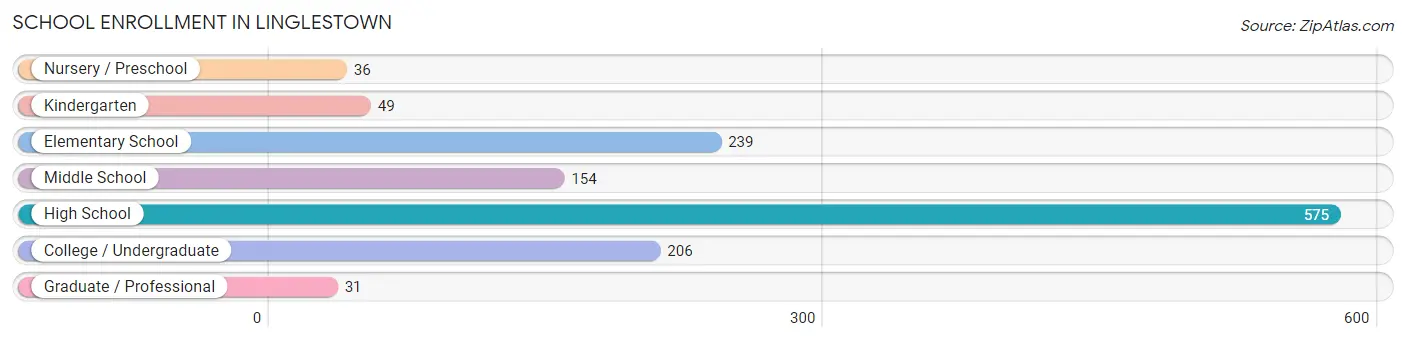
School Enrollment in Linglestown
The most common levels of schooling among the 1,290 students in Linglestown are high school (575 | 44.6%), elementary school (239 | 18.5%), and college / undergraduate (206 | 16.0%).
| School Level | # Students | % Students |
| Nursery / Preschool | 36 | 2.8% |
| Kindergarten | 49 | 3.8% |
| Elementary School | 239 | 18.5% |
| Middle School | 154 | 11.9% |
| High School | 575 | 44.6% |
| College / Undergraduate | 206 | 16.0% |
| Graduate / Professional | 31 | 2.4% |
| Total | 1,290 | 100.0% |
School Enrollment by Age by Funding Source in Linglestown
Out of a total of 1,290 students who are enrolled in schools in Linglestown, 230 (17.8%) attend a private institution, while the remaining 1,060 (82.2%) are enrolled in public schools. The age group of 3 to 4 year olds has the highest likelihood of being enrolled in private schools, with 36 (100.0% in the age bracket) enrolled. Conversely, the age group of 5 to 9 year old has the lowest likelihood of being enrolled in a private school, with 256 (100.0% in the age bracket) attending a public institution.
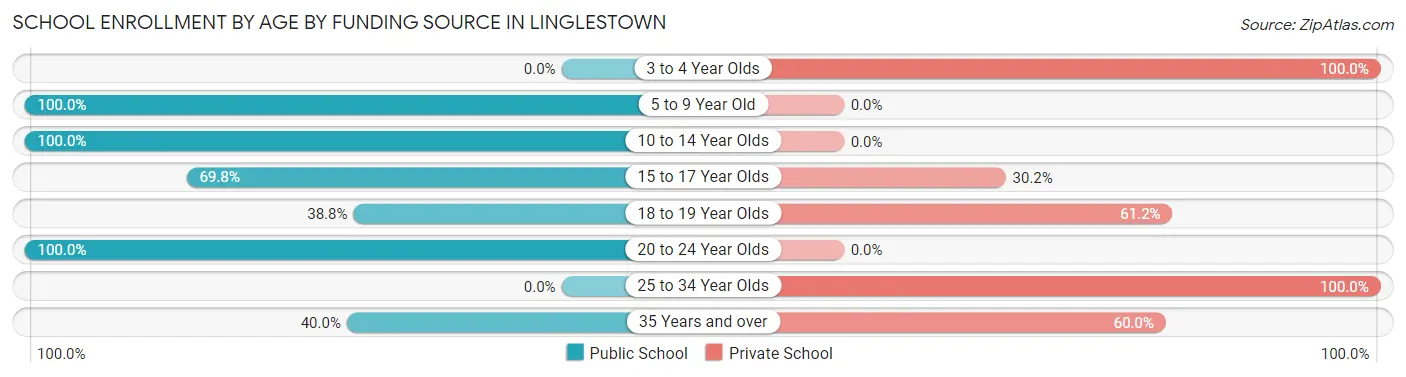
| Age Bracket | Public School | Private School |
| 3 to 4 Year Olds | 0 (0.0%) | 36 (100.0%) |
| 5 to 9 Year Old | 256 (100.0%) | 0 (0.0%) |
| 10 to 14 Year Olds | 301 (100.0%) | 0 (0.0%) |
| 15 to 17 Year Olds | 308 (69.8%) | 133 (30.2%) |
| 18 to 19 Year Olds | 19 (38.8%) | 30 (61.2%) |
| 20 to 24 Year Olds | 168 (100.0%) | 0 (0.0%) |
| 25 to 34 Year Olds | 0 (0.0%) | 19 (100.0%) |
| 35 Years and over | 8 (40.0%) | 12 (60.0%) |
| Total | 1,060 (82.2%) | 230 (17.8%) |
Educational Attainment by Field of Study in Linglestown
Business (458 | 24.0%), science & technology (275 | 14.4%), engineering (198 | 10.4%), education (191 | 10.0%), and psychology (178 | 9.3%) are the most common fields of study among 1,908 individuals in Linglestown who have obtained a bachelor's degree or higher.
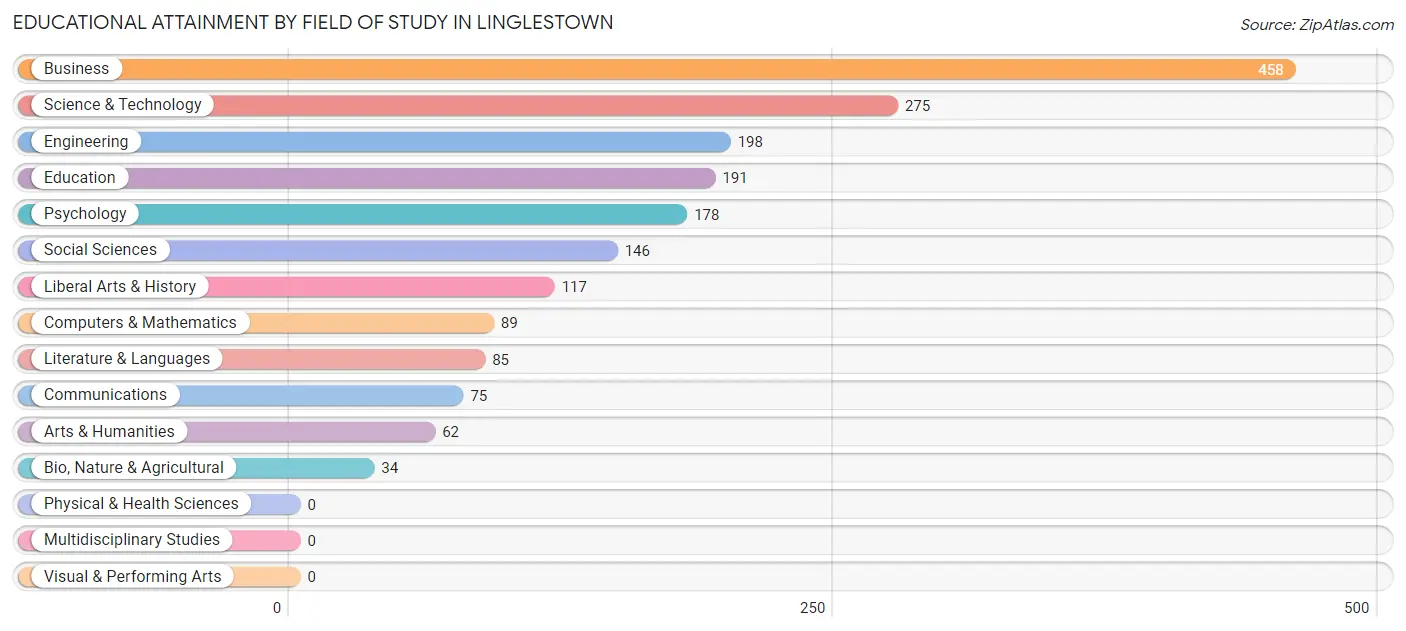
| Field of Study | # Graduates | % Graduates |
| Computers & Mathematics | 89 | 4.7% |
| Bio, Nature & Agricultural | 34 | 1.8% |
| Physical & Health Sciences | 0 | 0.0% |
| Psychology | 178 | 9.3% |
| Social Sciences | 146 | 7.6% |
| Engineering | 198 | 10.4% |
| Multidisciplinary Studies | 0 | 0.0% |
| Science & Technology | 275 | 14.4% |
| Business | 458 | 24.0% |
| Education | 191 | 10.0% |
| Literature & Languages | 85 | 4.4% |
| Liberal Arts & History | 117 | 6.1% |
| Visual & Performing Arts | 0 | 0.0% |
| Communications | 75 | 3.9% |
| Arts & Humanities | 62 | 3.3% |
| Total | 1,908 | 100.0% |
Transportation & Commute in Linglestown
Vehicle Availability by Sex in Linglestown
The most prevalent vehicle ownership categories in Linglestown are males with 2 vehicles (764, accounting for 45.5%) and females with 2 vehicles (935, making up 39.6%).
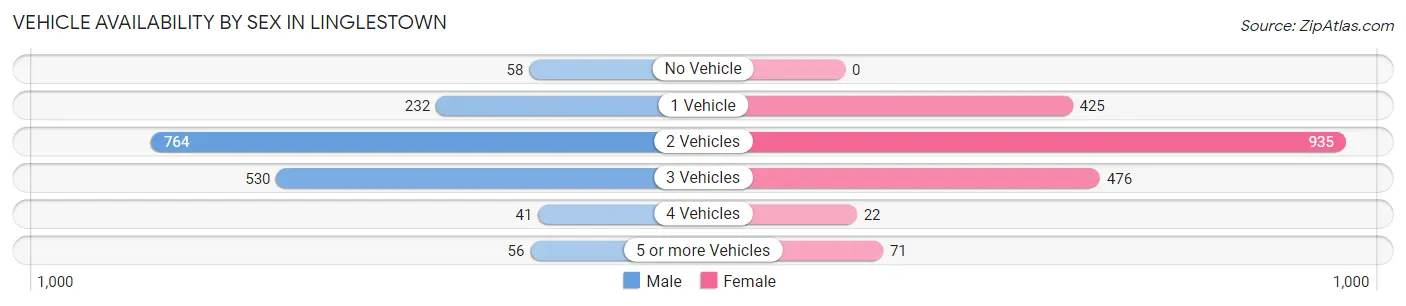
| Vehicles Available | Male | Female |
| No Vehicle | 58 (3.5%) | 0 (0.0%) |
| 1 Vehicle | 232 (13.8%) | 425 (22.0%) |
| 2 Vehicles | 764 (45.5%) | 935 (48.5%) |
| 3 Vehicles | 530 (31.5%) | 476 (24.7%) |
| 4 Vehicles | 41 (2.4%) | 22 (1.1%) |
| 5 or more Vehicles | 56 (3.3%) | 71 (3.7%) |
| Total | 1,681 (100.0%) | 1,929 (100.0%) |
Commute Time in Linglestown
The most frequently occuring commute durations in Linglestown are 20 to 24 minutes (717 commuters, 22.1%), 15 to 19 minutes (689 commuters, 21.2%), and 30 to 34 minutes (539 commuters, 16.6%).
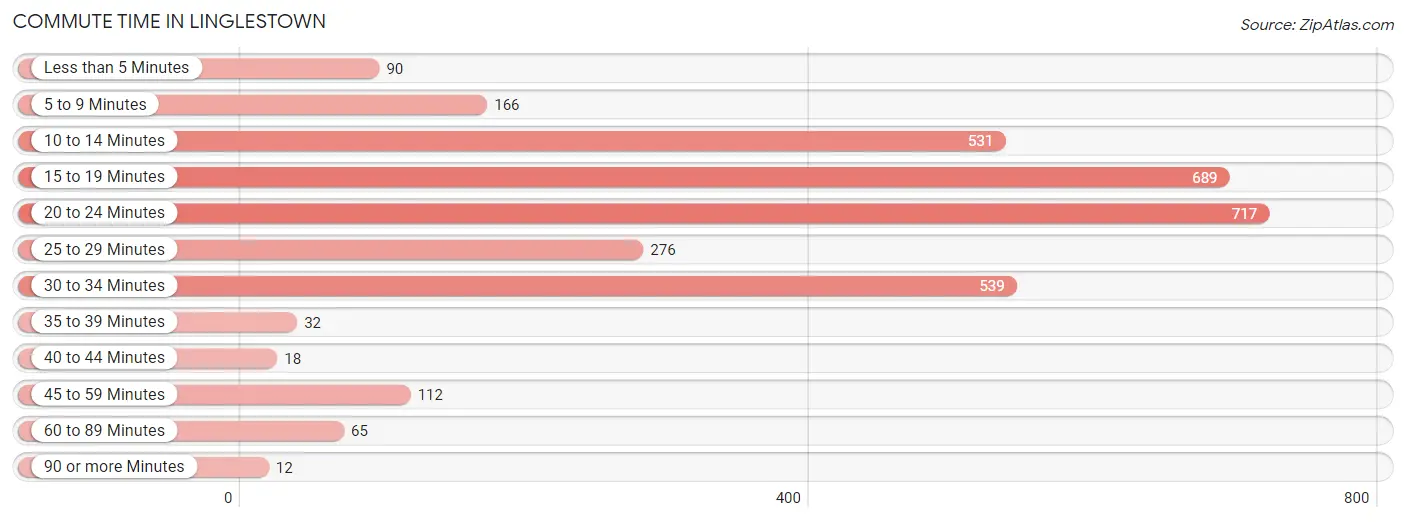
| Commute Time | # Commuters | % Commuters |
| Less than 5 Minutes | 90 | 2.8% |
| 5 to 9 Minutes | 166 | 5.1% |
| 10 to 14 Minutes | 531 | 16.4% |
| 15 to 19 Minutes | 689 | 21.2% |
| 20 to 24 Minutes | 717 | 22.1% |
| 25 to 29 Minutes | 276 | 8.5% |
| 30 to 34 Minutes | 539 | 16.6% |
| 35 to 39 Minutes | 32 | 1.0% |
| 40 to 44 Minutes | 18 | 0.5% |
| 45 to 59 Minutes | 112 | 3.5% |
| 60 to 89 Minutes | 65 | 2.0% |
| 90 or more Minutes | 12 | 0.4% |
Commute Time by Sex in Linglestown
The most common commute times in Linglestown are 20 to 24 minutes (378 commuters, 25.3%) for males and 15 to 19 minutes (476 commuters, 27.2%) for females.
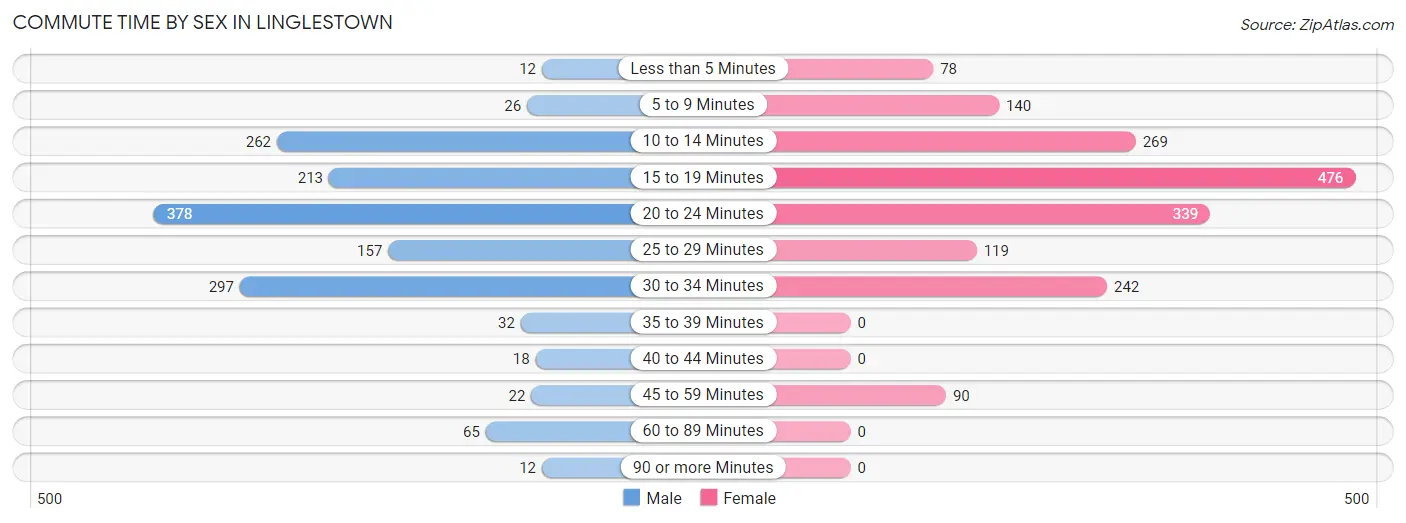
| Commute Time | Male | Female |
| Less than 5 Minutes | 12 (0.8%) | 78 (4.4%) |
| 5 to 9 Minutes | 26 (1.7%) | 140 (8.0%) |
| 10 to 14 Minutes | 262 (17.5%) | 269 (15.3%) |
| 15 to 19 Minutes | 213 (14.3%) | 476 (27.2%) |
| 20 to 24 Minutes | 378 (25.3%) | 339 (19.3%) |
| 25 to 29 Minutes | 157 (10.5%) | 119 (6.8%) |
| 30 to 34 Minutes | 297 (19.9%) | 242 (13.8%) |
| 35 to 39 Minutes | 32 (2.1%) | 0 (0.0%) |
| 40 to 44 Minutes | 18 (1.2%) | 0 (0.0%) |
| 45 to 59 Minutes | 22 (1.5%) | 90 (5.1%) |
| 60 to 89 Minutes | 65 (4.3%) | 0 (0.0%) |
| 90 or more Minutes | 12 (0.8%) | 0 (0.0%) |
Time of Departure to Work by Sex in Linglestown
The most frequent times of departure to work in Linglestown are 7:00 AM to 7:29 AM (432, 28.9%) for males and 7:30 AM to 7:59 AM (288, 16.4%) for females.
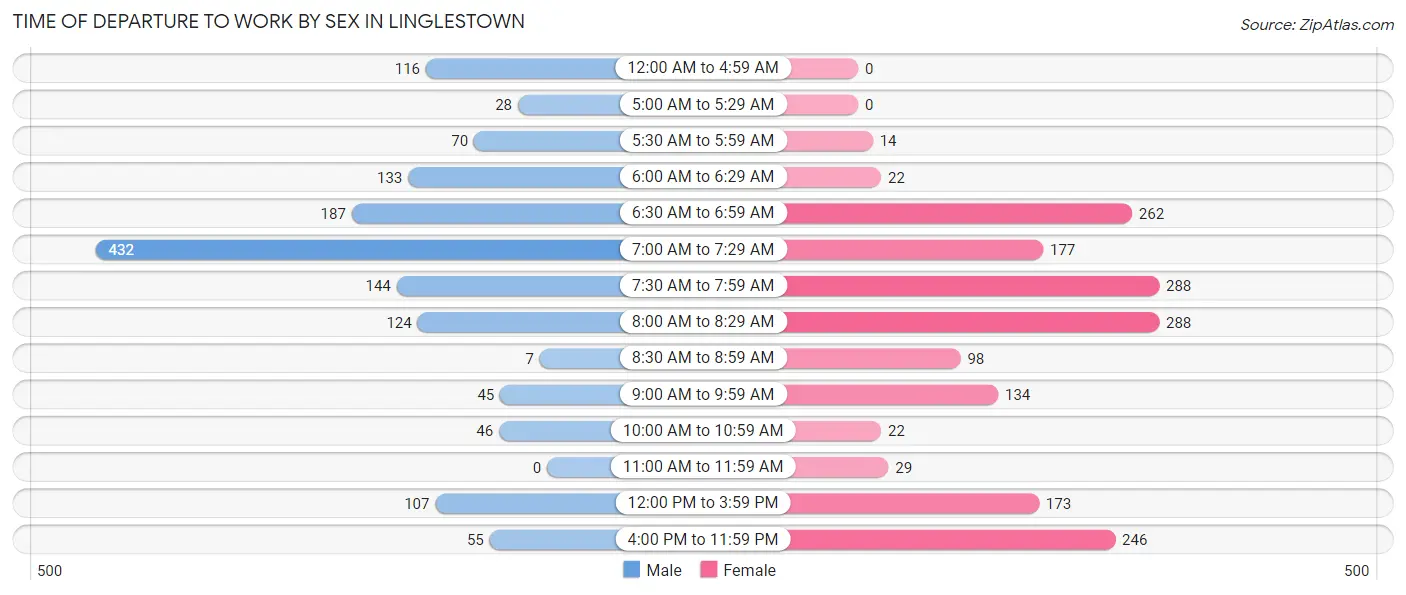
| Time of Departure | Male | Female |
| 12:00 AM to 4:59 AM | 116 (7.8%) | 0 (0.0%) |
| 5:00 AM to 5:29 AM | 28 (1.9%) | 0 (0.0%) |
| 5:30 AM to 5:59 AM | 70 (4.7%) | 14 (0.8%) |
| 6:00 AM to 6:29 AM | 133 (8.9%) | 22 (1.3%) |
| 6:30 AM to 6:59 AM | 187 (12.5%) | 262 (14.9%) |
| 7:00 AM to 7:29 AM | 432 (28.9%) | 177 (10.1%) |
| 7:30 AM to 7:59 AM | 144 (9.6%) | 288 (16.4%) |
| 8:00 AM to 8:29 AM | 124 (8.3%) | 288 (16.4%) |
| 8:30 AM to 8:59 AM | 7 (0.5%) | 98 (5.6%) |
| 9:00 AM to 9:59 AM | 45 (3.0%) | 134 (7.6%) |
| 10:00 AM to 10:59 AM | 46 (3.1%) | 22 (1.3%) |
| 11:00 AM to 11:59 AM | 0 (0.0%) | 29 (1.7%) |
| 12:00 PM to 3:59 PM | 107 (7.2%) | 173 (9.9%) |
| 4:00 PM to 11:59 PM | 55 (3.7%) | 246 (14.0%) |
| Total | 1,494 (100.0%) | 1,753 (100.0%) |
Housing Occupancy in Linglestown
Occupancy by Ownership in Linglestown
Of the total 2,662 dwellings in Linglestown, owner-occupied units account for 2,298 (86.3%), while renter-occupied units make up 364 (13.7%).
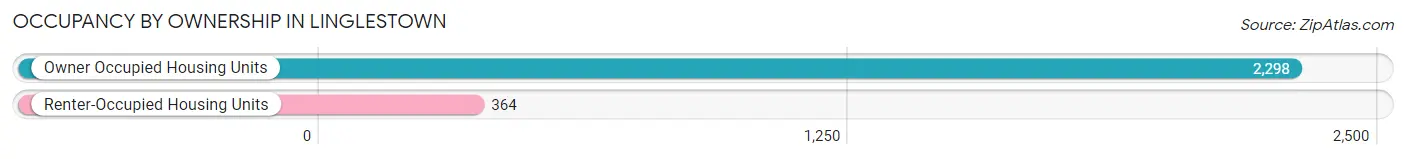
| Occupancy | # Housing Units | % Housing Units |
| Owner Occupied Housing Units | 2,298 | 86.3% |
| Renter-Occupied Housing Units | 364 | 13.7% |
| Total Occupied Housing Units | 2,662 | 100.0% |
Occupancy by Household Size in Linglestown
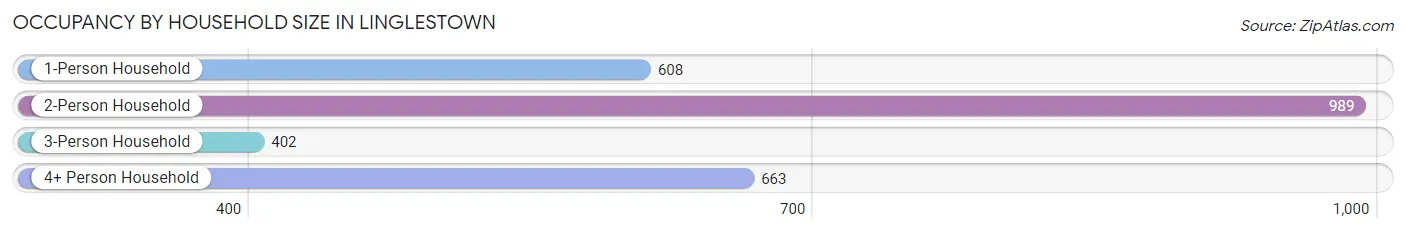
| Household Size | # Housing Units | % Housing Units |
| 1-Person Household | 608 | 22.8% |
| 2-Person Household | 989 | 37.1% |
| 3-Person Household | 402 | 15.1% |
| 4+ Person Household | 663 | 24.9% |
| Total Housing Units | 2,662 | 100.0% |
Occupancy by Ownership by Household Size in Linglestown
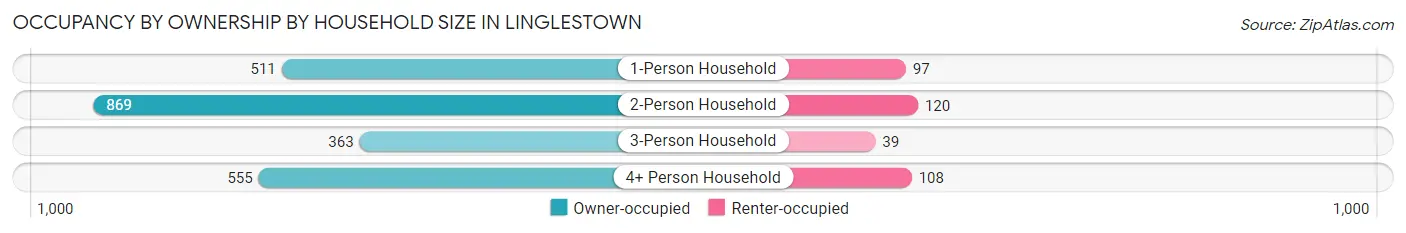
| Household Size | Owner-occupied | Renter-occupied |
| 1-Person Household | 511 (84.1%) | 97 (16.0%) |
| 2-Person Household | 869 (87.9%) | 120 (12.1%) |
| 3-Person Household | 363 (90.3%) | 39 (9.7%) |
| 4+ Person Household | 555 (83.7%) | 108 (16.3%) |
| Total Housing Units | 2,298 (86.3%) | 364 (13.7%) |
Occupancy by Educational Attainment in Linglestown
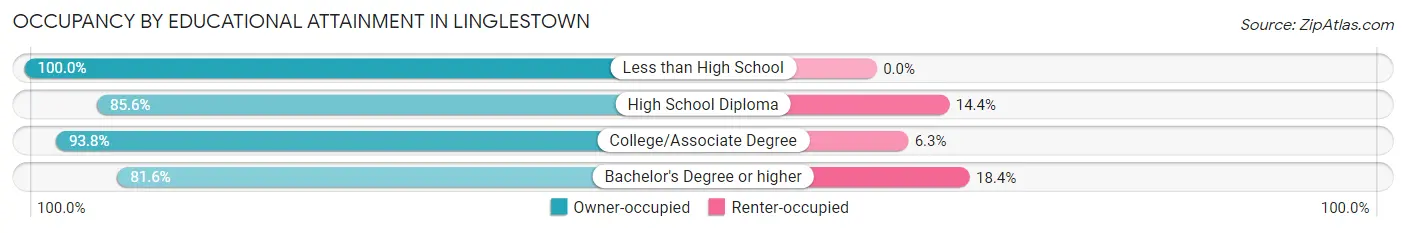
| Household Size | Owner-occupied | Renter-occupied |
| Less than High School | 95 (100.0%) | 0 (0.0%) |
| High School Diploma | 696 (85.6%) | 117 (14.4%) |
| College/Associate Degree | 585 (93.8%) | 39 (6.2%) |
| Bachelor's Degree or higher | 922 (81.6%) | 208 (18.4%) |
Occupancy by Age of Householder in Linglestown
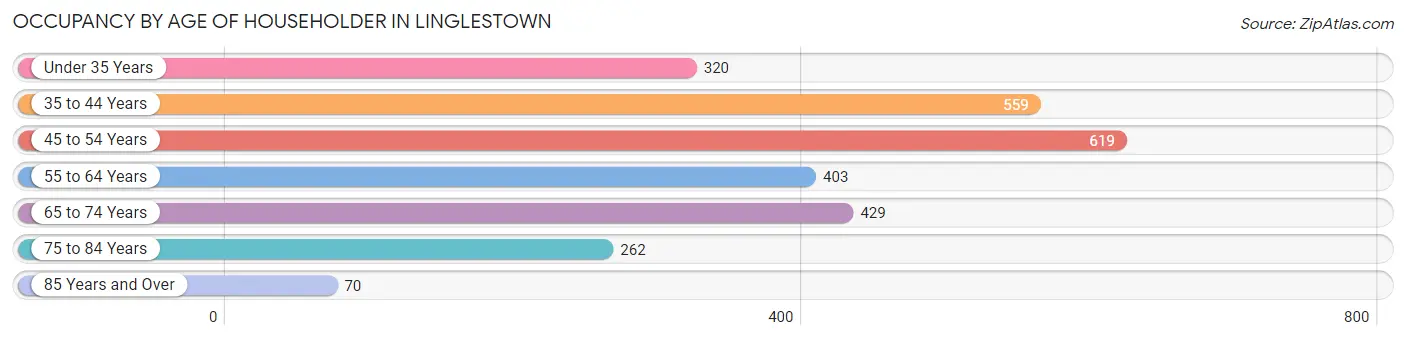
| Age Bracket | # Households | % Households |
| Under 35 Years | 320 | 12.0% |
| 35 to 44 Years | 559 | 21.0% |
| 45 to 54 Years | 619 | 23.3% |
| 55 to 64 Years | 403 | 15.1% |
| 65 to 74 Years | 429 | 16.1% |
| 75 to 84 Years | 262 | 9.8% |
| 85 Years and Over | 70 | 2.6% |
| Total | 2,662 | 100.0% |
Housing Finances in Linglestown
Median Income by Occupancy in Linglestown
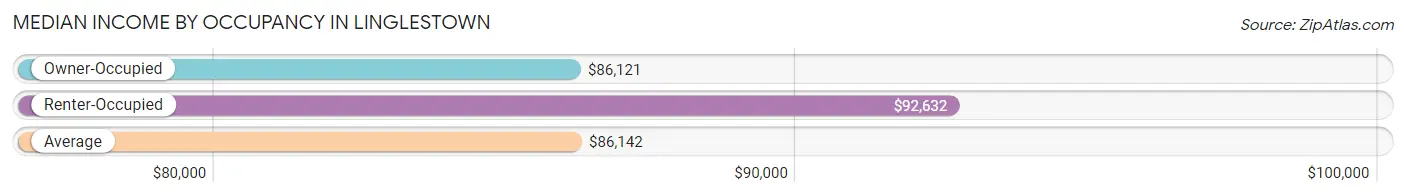
| Occupancy Type | # Households | Median Income |
| Owner-Occupied | 2,298 (86.3%) | $86,121 |
| Renter-Occupied | 364 (13.7%) | $92,632 |
| Average | 2,662 (100.0%) | $86,142 |
Occupancy by Householder Income Bracket in Linglestown
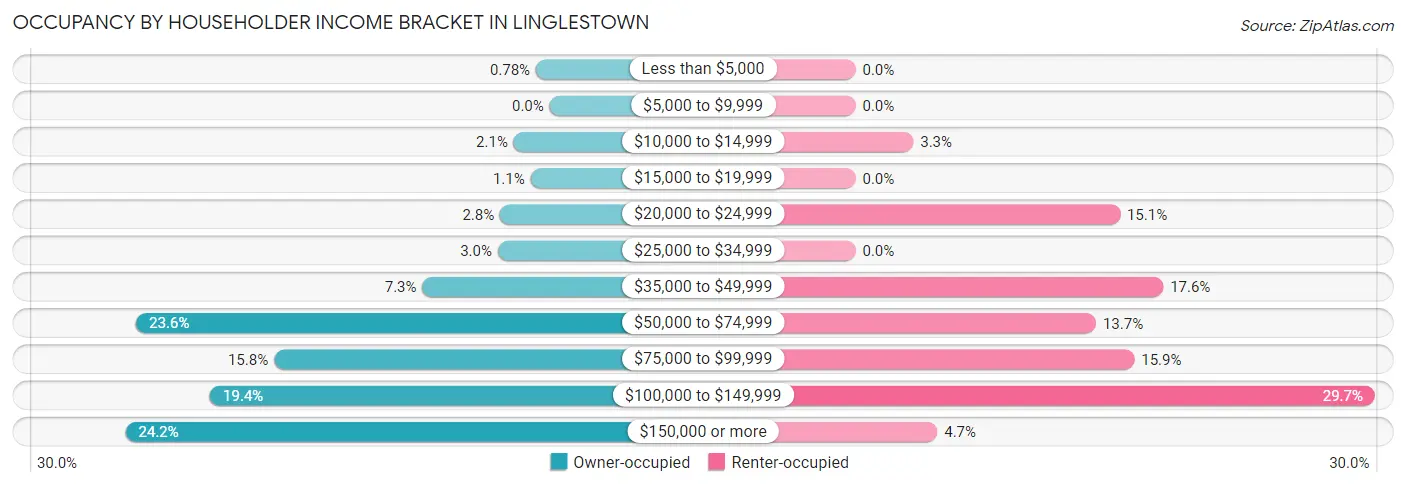
| Income Bracket | Owner-occupied | Renter-occupied |
| Less than $5,000 | 18 (0.8%) | 0 (0.0%) |
| $5,000 to $9,999 | 0 (0.0%) | 0 (0.0%) |
| $10,000 to $14,999 | 47 (2.1%) | 12 (3.3%) |
| $15,000 to $19,999 | 25 (1.1%) | 0 (0.0%) |
| $20,000 to $24,999 | 65 (2.8%) | 55 (15.1%) |
| $25,000 to $34,999 | 68 (3.0%) | 0 (0.0%) |
| $35,000 to $49,999 | 167 (7.3%) | 64 (17.6%) |
| $50,000 to $74,999 | 543 (23.6%) | 50 (13.7%) |
| $75,000 to $99,999 | 362 (15.8%) | 58 (15.9%) |
| $100,000 to $149,999 | 446 (19.4%) | 108 (29.7%) |
| $150,000 or more | 557 (24.2%) | 17 (4.7%) |
| Total | 2,298 (100.0%) | 364 (100.0%) |
Monthly Housing Cost Tiers in Linglestown
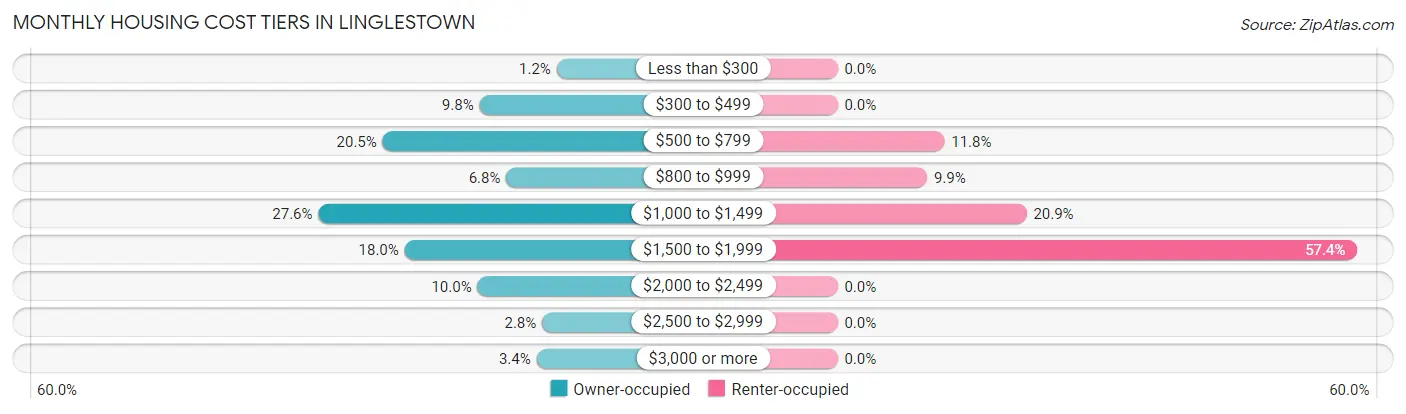
| Monthly Cost | Owner-occupied | Renter-occupied |
| Less than $300 | 28 (1.2%) | 0 (0.0%) |
| $300 to $499 | 224 (9.8%) | 0 (0.0%) |
| $500 to $799 | 470 (20.4%) | 43 (11.8%) |
| $800 to $999 | 156 (6.8%) | 36 (9.9%) |
| $1,000 to $1,499 | 633 (27.6%) | 76 (20.9%) |
| $1,500 to $1,999 | 414 (18.0%) | 209 (57.4%) |
| $2,000 to $2,499 | 229 (10.0%) | 0 (0.0%) |
| $2,500 to $2,999 | 65 (2.8%) | 0 (0.0%) |
| $3,000 or more | 79 (3.4%) | 0 (0.0%) |
| Total | 2,298 (100.0%) | 364 (100.0%) |
Physical Housing Characteristics in Linglestown
Housing Structures in Linglestown
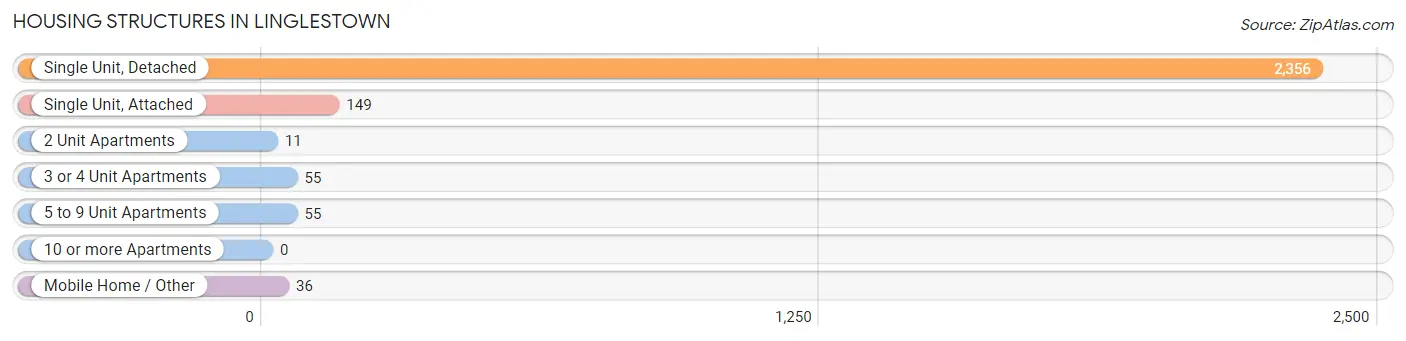
| Structure Type | # Housing Units | % Housing Units |
| Single Unit, Detached | 2,356 | 88.5% |
| Single Unit, Attached | 149 | 5.6% |
| 2 Unit Apartments | 11 | 0.4% |
| 3 or 4 Unit Apartments | 55 | 2.1% |
| 5 to 9 Unit Apartments | 55 | 2.1% |
| 10 or more Apartments | 0 | 0.0% |
| Mobile Home / Other | 36 | 1.3% |
| Total | 2,662 | 100.0% |
Housing Structures by Occupancy in Linglestown
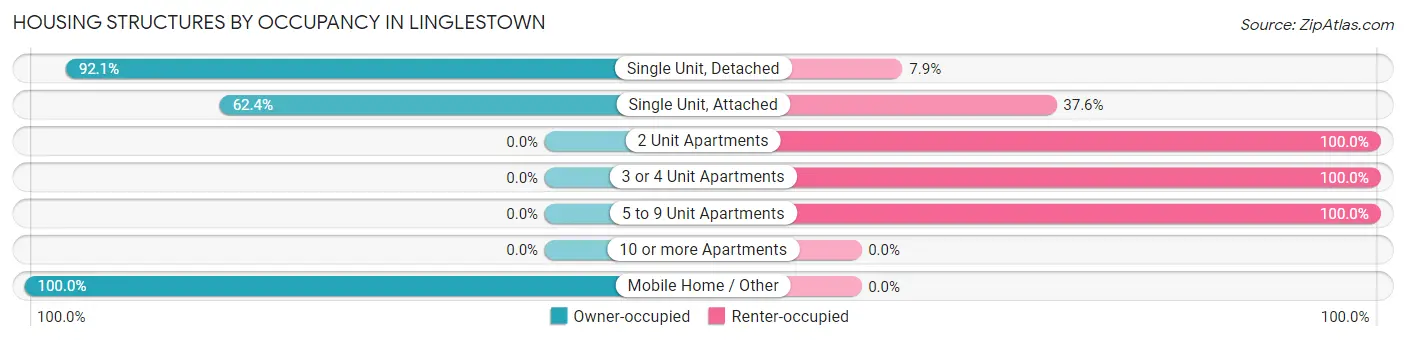
| Structure Type | Owner-occupied | Renter-occupied |
| Single Unit, Detached | 2,169 (92.1%) | 187 (7.9%) |
| Single Unit, Attached | 93 (62.4%) | 56 (37.6%) |
| 2 Unit Apartments | 0 (0.0%) | 11 (100.0%) |
| 3 or 4 Unit Apartments | 0 (0.0%) | 55 (100.0%) |
| 5 to 9 Unit Apartments | 0 (0.0%) | 55 (100.0%) |
| 10 or more Apartments | 0 (0.0%) | 0 (0.0%) |
| Mobile Home / Other | 36 (100.0%) | 0 (0.0%) |
| Total | 2,298 (86.3%) | 364 (13.7%) |
Housing Structures by Number of Rooms in Linglestown
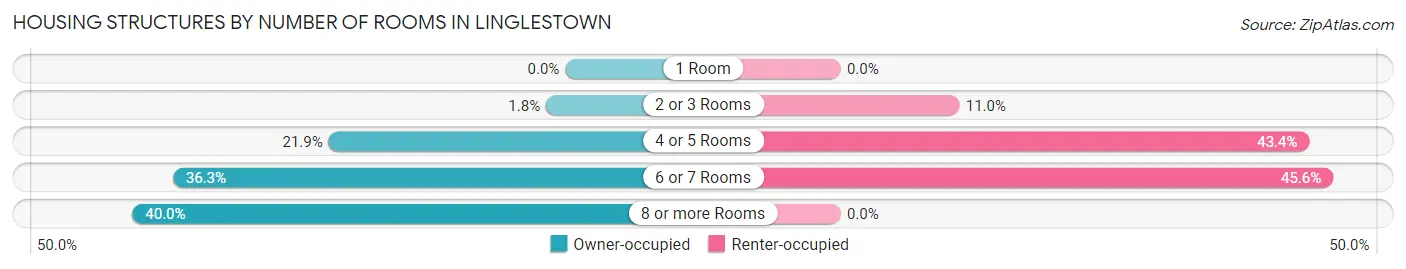
| Number of Rooms | Owner-occupied | Renter-occupied |
| 1 Room | 0 (0.0%) | 0 (0.0%) |
| 2 or 3 Rooms | 41 (1.8%) | 40 (11.0%) |
| 4 or 5 Rooms | 503 (21.9%) | 158 (43.4%) |
| 6 or 7 Rooms | 834 (36.3%) | 166 (45.6%) |
| 8 or more Rooms | 920 (40.0%) | 0 (0.0%) |
| Total | 2,298 (100.0%) | 364 (100.0%) |
Housing Structure by Heating Type in Linglestown
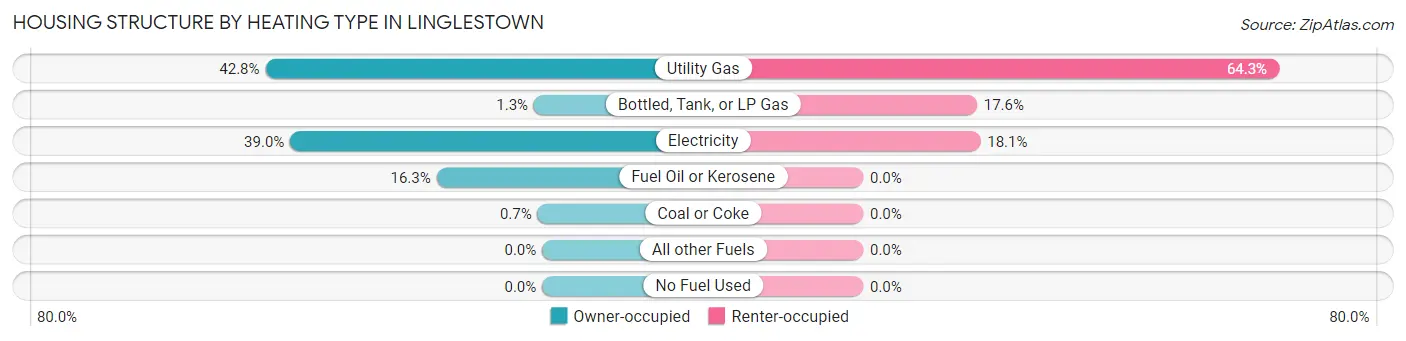
| Heating Type | Owner-occupied | Renter-occupied |
| Utility Gas | 983 (42.8%) | 234 (64.3%) |
| Bottled, Tank, or LP Gas | 29 (1.3%) | 64 (17.6%) |
| Electricity | 895 (39.0%) | 66 (18.1%) |
| Fuel Oil or Kerosene | 375 (16.3%) | 0 (0.0%) |
| Coal or Coke | 16 (0.7%) | 0 (0.0%) |
| All other Fuels | 0 (0.0%) | 0 (0.0%) |
| No Fuel Used | 0 (0.0%) | 0 (0.0%) |
| Total | 2,298 (100.0%) | 364 (100.0%) |
Household Vehicle Usage in Linglestown
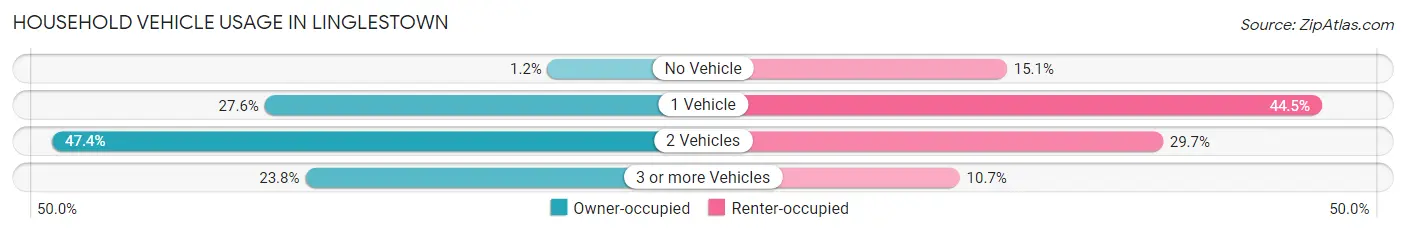
| Vehicles per Household | Owner-occupied | Renter-occupied |
| No Vehicle | 27 (1.2%) | 55 (15.1%) |
| 1 Vehicle | 634 (27.6%) | 162 (44.5%) |
| 2 Vehicles | 1,090 (47.4%) | 108 (29.7%) |
| 3 or more Vehicles | 547 (23.8%) | 39 (10.7%) |
| Total | 2,298 (100.0%) | 364 (100.0%) |
Real Estate & Mortgages in Linglestown
Real Estate and Mortgage Overview in Linglestown
| Characteristic | Without Mortgage | With Mortgage |
| Housing Units | 689 | 1,609 |
| Median Property Value | $231,000 | $233,300 |
| Median Household Income | $64,421 | $415 |
| Monthly Housing Costs | $545 | $79 |
| Real Estate Taxes | $2,463 | $35 |
Property Value by Mortgage Status in Linglestown
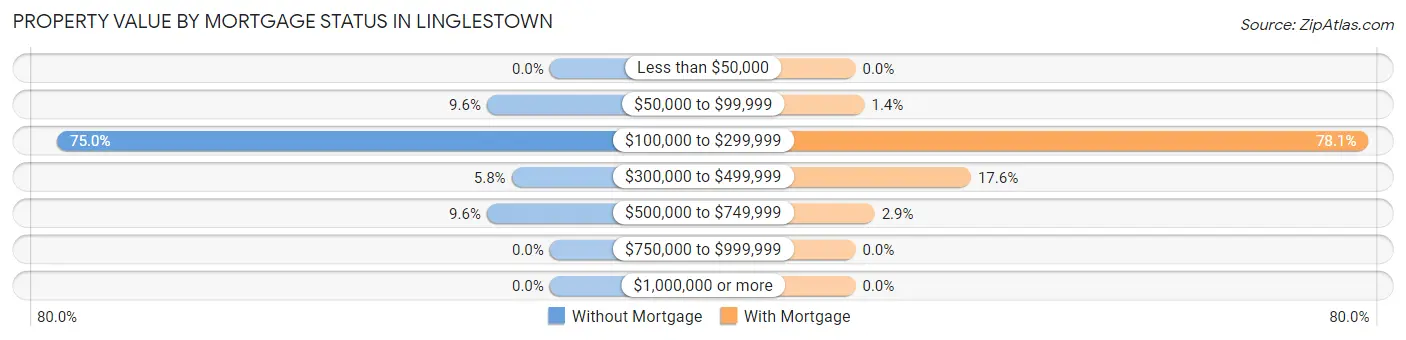
| Property Value | Without Mortgage | With Mortgage |
| Less than $50,000 | 0 (0.0%) | 0 (0.0%) |
| $50,000 to $99,999 | 66 (9.6%) | 22 (1.4%) |
| $100,000 to $299,999 | 517 (75.0%) | 1,257 (78.1%) |
| $300,000 to $499,999 | 40 (5.8%) | 283 (17.6%) |
| $500,000 to $749,999 | 66 (9.6%) | 47 (2.9%) |
| $750,000 to $999,999 | 0 (0.0%) | 0 (0.0%) |
| $1,000,000 or more | 0 (0.0%) | 0 (0.0%) |
| Total | 689 (100.0%) | 1,609 (100.0%) |
Household Income by Mortgage Status in Linglestown
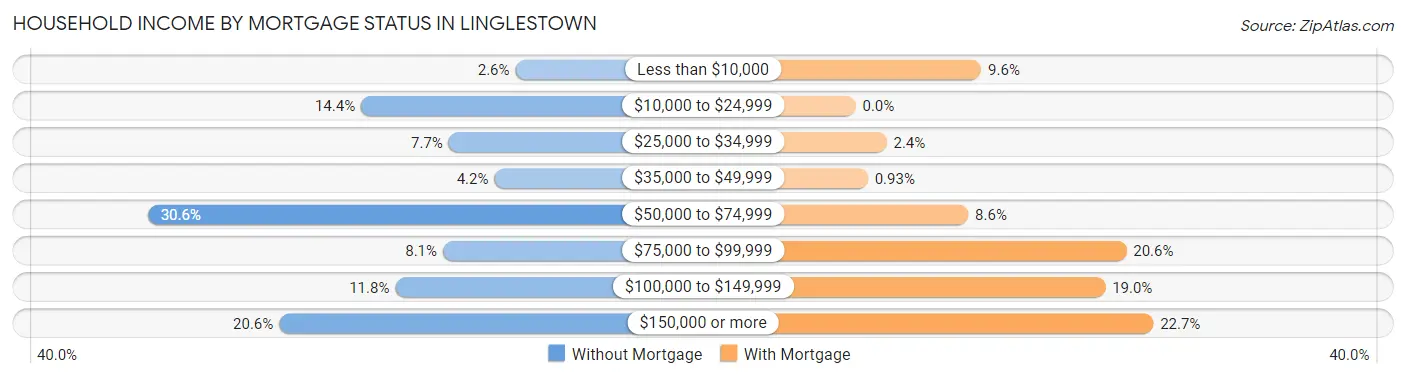
| Household Income | Without Mortgage | With Mortgage |
| Less than $10,000 | 18 (2.6%) | 154 (9.6%) |
| $10,000 to $24,999 | 99 (14.4%) | 0 (0.0%) |
| $25,000 to $34,999 | 53 (7.7%) | 38 (2.4%) |
| $35,000 to $49,999 | 29 (4.2%) | 15 (0.9%) |
| $50,000 to $74,999 | 211 (30.6%) | 138 (8.6%) |
| $75,000 to $99,999 | 56 (8.1%) | 332 (20.6%) |
| $100,000 to $149,999 | 81 (11.8%) | 306 (19.0%) |
| $150,000 or more | 142 (20.6%) | 365 (22.7%) |
| Total | 689 (100.0%) | 1,609 (100.0%) |
Property Value to Household Income Ratio in Linglestown
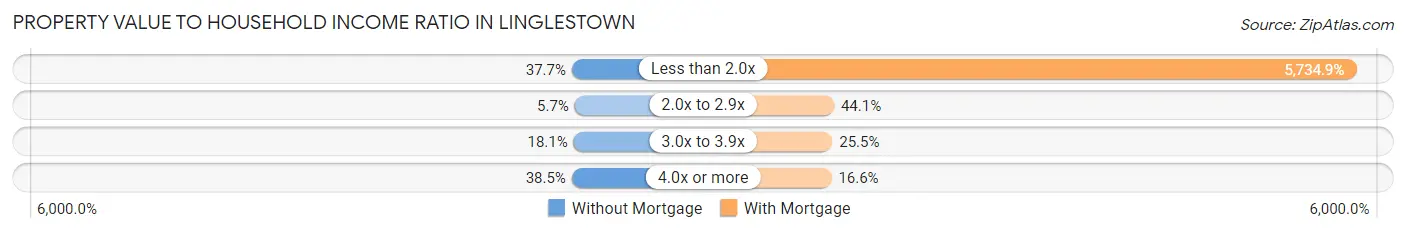
| Value-to-Income Ratio | Without Mortgage | With Mortgage |
| Less than 2.0x | 260 (37.7%) | 92,275 (5,734.9%) |
| 2.0x to 2.9x | 39 (5.7%) | 710 (44.1%) |
| 3.0x to 3.9x | 125 (18.1%) | 411 (25.5%) |
| 4.0x or more | 265 (38.5%) | 267 (16.6%) |
| Total | 689 (100.0%) | 1,609 (100.0%) |
Real Estate Taxes by Mortgage Status in Linglestown
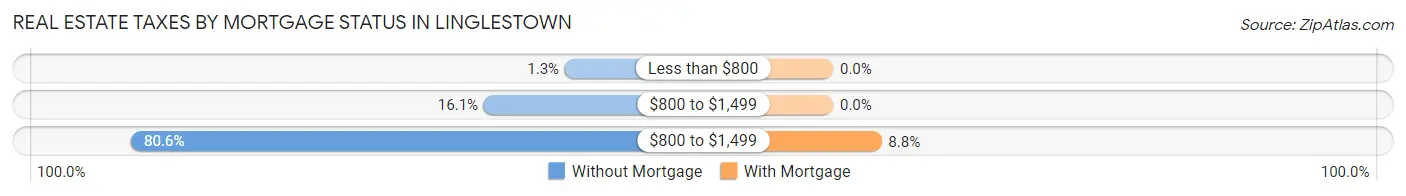
| Property Taxes | Without Mortgage | With Mortgage |
| Less than $800 | 9 (1.3%) | 0 (0.0%) |
| $800 to $1,499 | 111 (16.1%) | 0 (0.0%) |
| $800 to $1,499 | 555 (80.5%) | 142 (8.8%) |
| Total | 689 (100.0%) | 1,609 (100.0%) |
Health & Disability in Linglestown
Health Insurance Coverage by Age in Linglestown
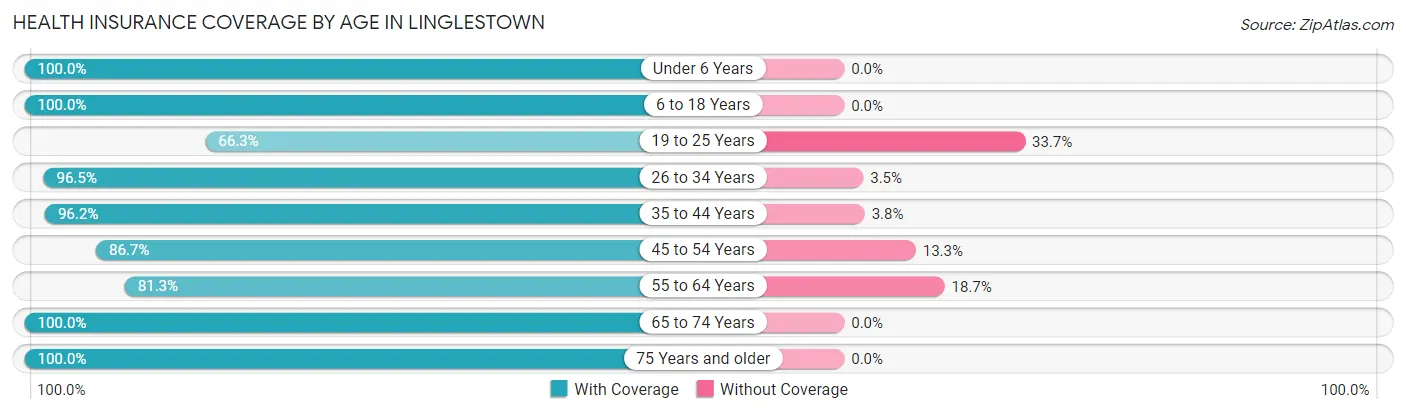
| Age Bracket | With Coverage | Without Coverage |
| Under 6 Years | 375 (100.0%) | 0 (0.0%) |
| 6 to 18 Years | 1,107 (100.0%) | 0 (0.0%) |
| 19 to 25 Years | 234 (66.3%) | 119 (33.7%) |
| 26 to 34 Years | 573 (96.5%) | 21 (3.5%) |
| 35 to 44 Years | 1,160 (96.2%) | 46 (3.8%) |
| 45 to 54 Years | 871 (86.7%) | 134 (13.3%) |
| 55 to 64 Years | 765 (81.3%) | 176 (18.7%) |
| 65 to 74 Years | 693 (100.0%) | 0 (0.0%) |
| 75 Years and older | 512 (100.0%) | 0 (0.0%) |
| Total | 6,290 (92.7%) | 496 (7.3%) |
Health Insurance Coverage by Citizenship Status in Linglestown
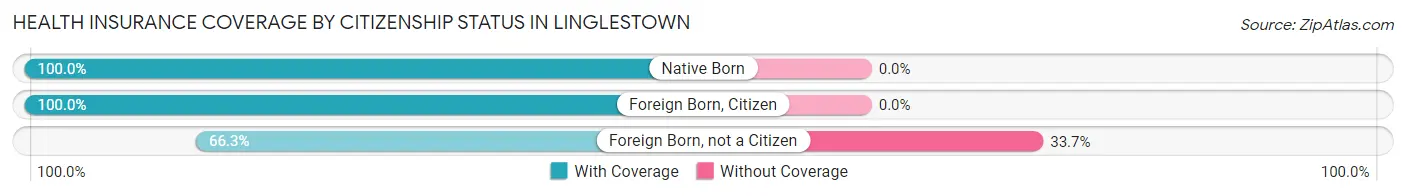
| Citizenship Status | With Coverage | Without Coverage |
| Native Born | 375 (100.0%) | 0 (0.0%) |
| Foreign Born, Citizen | 1,107 (100.0%) | 0 (0.0%) |
| Foreign Born, not a Citizen | 234 (66.3%) | 119 (33.7%) |
Health Insurance Coverage by Household Income in Linglestown
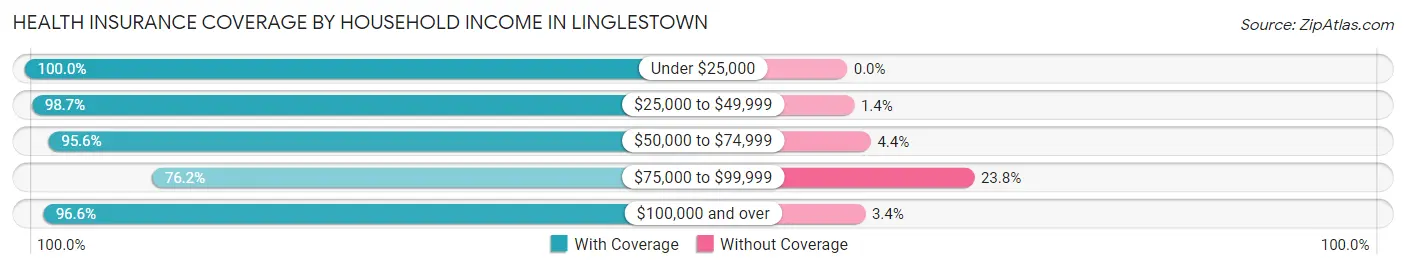
| Household Income | With Coverage | Without Coverage |
| Under $25,000 | 237 (100.0%) | 0 (0.0%) |
| $25,000 to $49,999 | 438 (98.7%) | 6 (1.3%) |
| $50,000 to $74,999 | 1,161 (95.6%) | 54 (4.4%) |
| $75,000 to $99,999 | 1,007 (76.2%) | 315 (23.8%) |
| $100,000 and over | 3,442 (96.6%) | 121 (3.4%) |
Public vs Private Health Insurance Coverage by Age in Linglestown
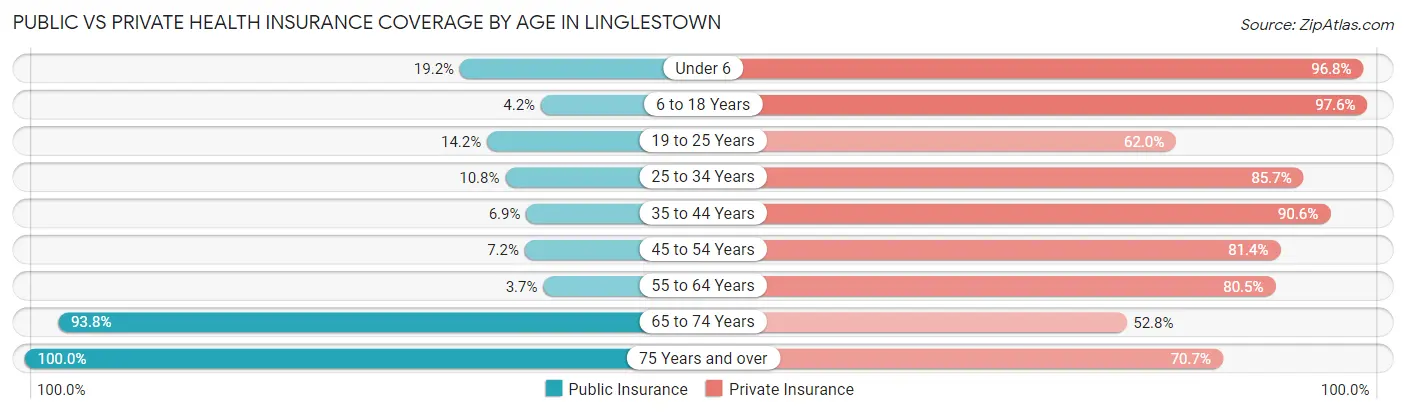
| Age Bracket | Public Insurance | Private Insurance |
| Under 6 | 72 (19.2%) | 363 (96.8%) |
| 6 to 18 Years | 46 (4.2%) | 1,080 (97.6%) |
| 19 to 25 Years | 50 (14.2%) | 219 (62.0%) |
| 25 to 34 Years | 64 (10.8%) | 509 (85.7%) |
| 35 to 44 Years | 83 (6.9%) | 1,093 (90.6%) |
| 45 to 54 Years | 72 (7.2%) | 818 (81.4%) |
| 55 to 64 Years | 35 (3.7%) | 757 (80.4%) |
| 65 to 74 Years | 650 (93.8%) | 366 (52.8%) |
| 75 Years and over | 512 (100.0%) | 362 (70.7%) |
| Total | 1,584 (23.3%) | 5,567 (82.0%) |
Disability Status by Sex by Age in Linglestown
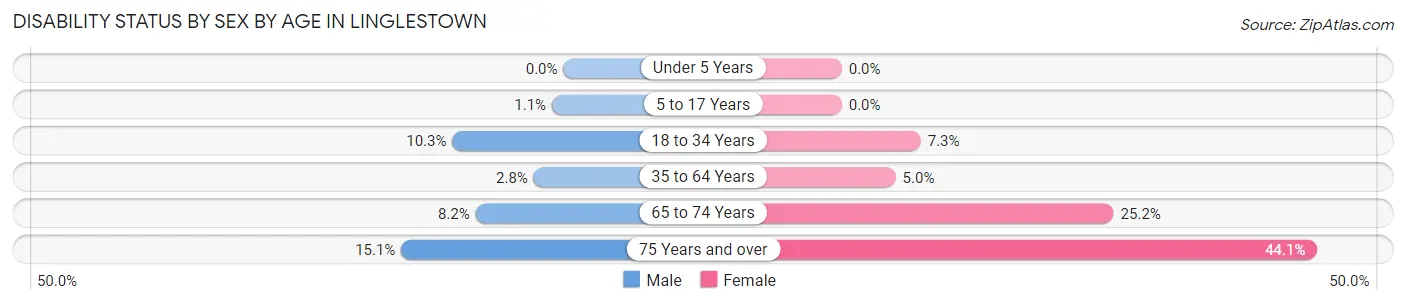
| Age Bracket | Male | Female |
| Under 5 Years | 0 (0.0%) | 0 (0.0%) |
| 5 to 17 Years | 6 (1.1%) | 0 (0.0%) |
| 18 to 34 Years | 56 (10.3%) | 36 (7.3%) |
| 35 to 64 Years | 40 (2.8%) | 85 (5.0%) |
| 65 to 74 Years | 30 (8.2%) | 82 (25.2%) |
| 75 Years and over | 31 (15.0%) | 135 (44.1%) |
Disability Class by Sex by Age in Linglestown
Disability Class: Hearing Difficulty
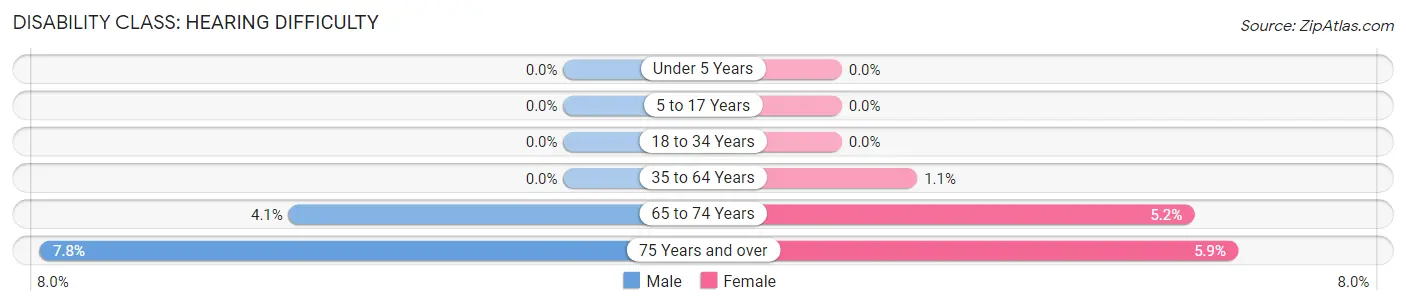
| Age Bracket | Male | Female |
| Under 5 Years | 0 (0.0%) | 0 (0.0%) |
| 5 to 17 Years | 0 (0.0%) | 0 (0.0%) |
| 18 to 34 Years | 0 (0.0%) | 0 (0.0%) |
| 35 to 64 Years | 0 (0.0%) | 19 (1.1%) |
| 65 to 74 Years | 15 (4.1%) | 17 (5.2%) |
| 75 Years and over | 16 (7.8%) | 18 (5.9%) |
Disability Class: Vision Difficulty
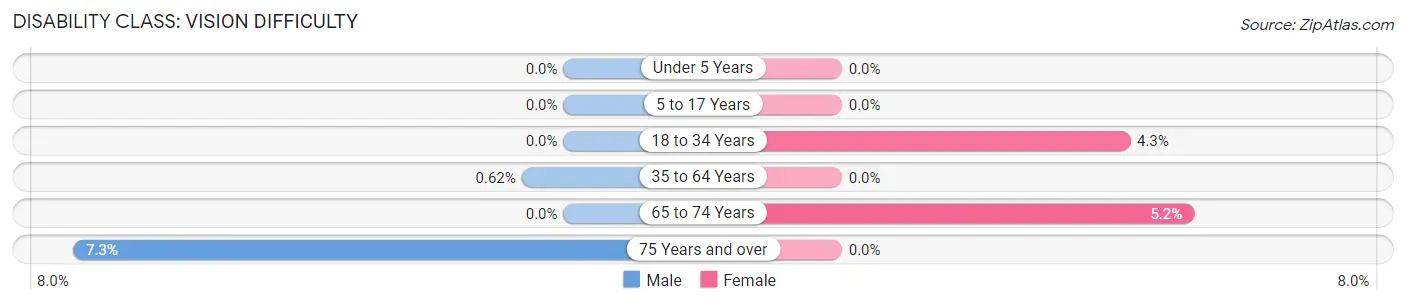
| Age Bracket | Male | Female |
| Under 5 Years | 0 (0.0%) | 0 (0.0%) |
| 5 to 17 Years | 0 (0.0%) | 0 (0.0%) |
| 18 to 34 Years | 0 (0.0%) | 21 (4.3%) |
| 35 to 64 Years | 9 (0.6%) | 0 (0.0%) |
| 65 to 74 Years | 0 (0.0%) | 17 (5.2%) |
| 75 Years and over | 15 (7.3%) | 0 (0.0%) |
Disability Class: Cognitive Difficulty
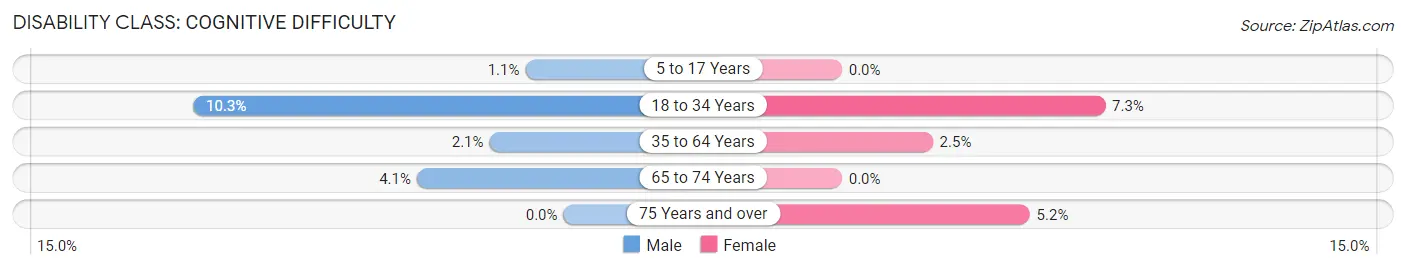
| Age Bracket | Male | Female |
| 5 to 17 Years | 6 (1.1%) | 0 (0.0%) |
| 18 to 34 Years | 56 (10.3%) | 36 (7.3%) |
| 35 to 64 Years | 30 (2.1%) | 43 (2.5%) |
| 65 to 74 Years | 15 (4.1%) | 0 (0.0%) |
| 75 Years and over | 0 (0.0%) | 16 (5.2%) |
Disability Class: Ambulatory Difficulty
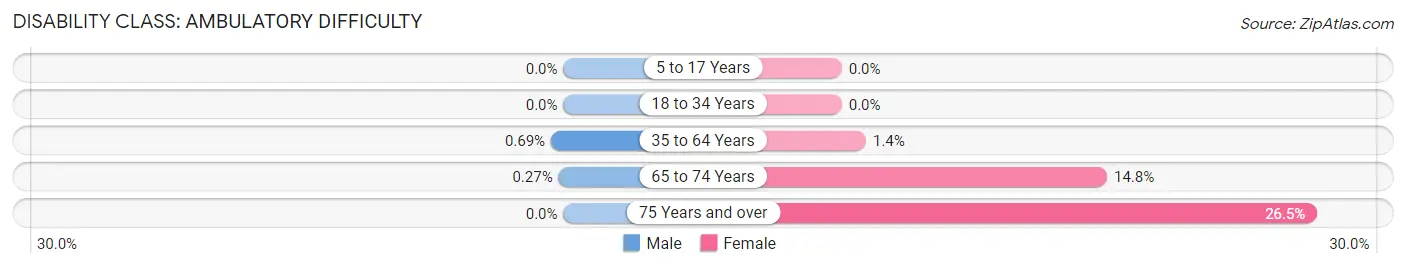
| Age Bracket | Male | Female |
| 5 to 17 Years | 0 (0.0%) | 0 (0.0%) |
| 18 to 34 Years | 0 (0.0%) | 0 (0.0%) |
| 35 to 64 Years | 10 (0.7%) | 23 (1.3%) |
| 65 to 74 Years | 1 (0.3%) | 48 (14.8%) |
| 75 Years and over | 0 (0.0%) | 81 (26.5%) |
Disability Class: Self-Care Difficulty
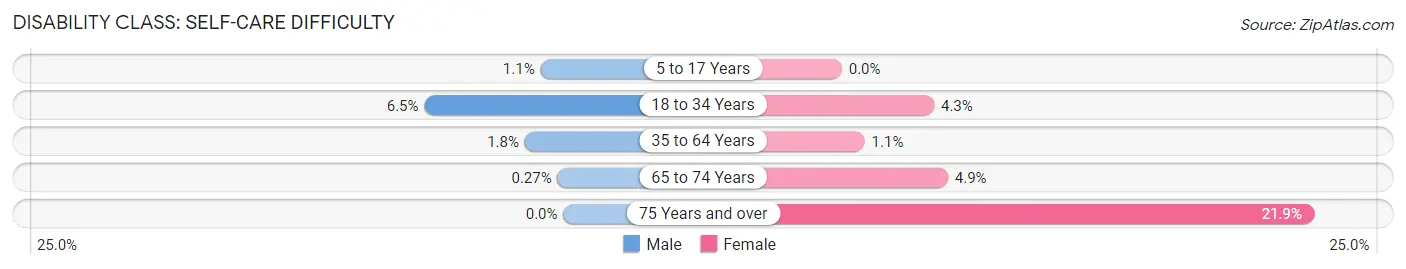
| Age Bracket | Male | Female |
| 5 to 17 Years | 6 (1.1%) | 0 (0.0%) |
| 18 to 34 Years | 35 (6.5%) | 21 (4.3%) |
| 35 to 64 Years | 26 (1.8%) | 18 (1.1%) |
| 65 to 74 Years | 1 (0.3%) | 16 (4.9%) |
| 75 Years and over | 0 (0.0%) | 67 (21.9%) |
Technology Access in Linglestown
Computing Device Access in Linglestown
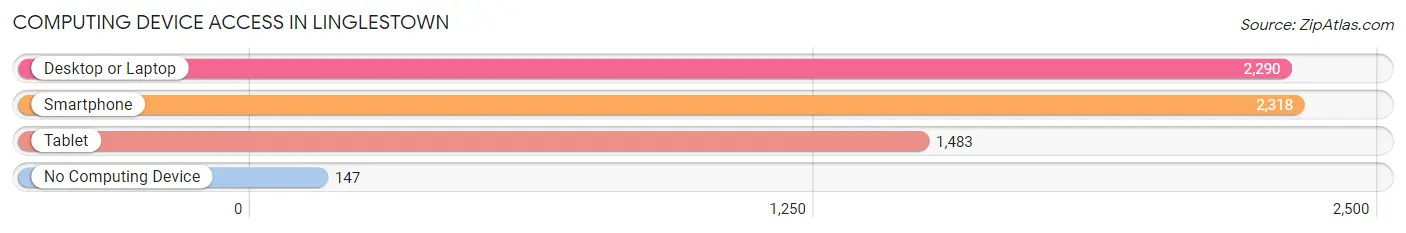
| Device Type | # Households | % Households |
| Desktop or Laptop | 2,290 | 86.0% |
| Smartphone | 2,318 | 87.1% |
| Tablet | 1,483 | 55.7% |
| No Computing Device | 147 | 5.5% |
| Total | 2,662 | 100.0% |
Internet Access in Linglestown
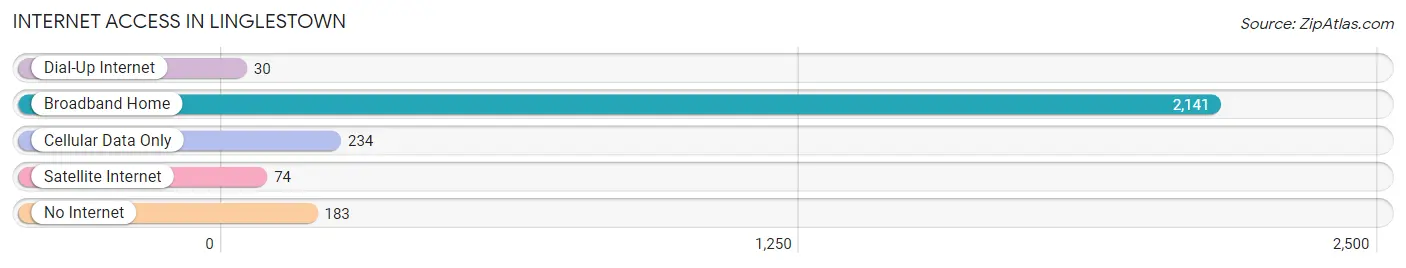
| Internet Type | # Households | % Households |
| Dial-Up Internet | 30 | 1.1% |
| Broadband Home | 2,141 | 80.4% |
| Cellular Data Only | 234 | 8.8% |
| Satellite Internet | 74 | 2.8% |
| No Internet | 183 | 6.9% |
| Total | 2,662 | 100.0% |
Linglestown Summary
Linglestown is a small unincorporated community located in Lower Paxton Township, Dauphin County, Pennsylvania. It is situated approximately five miles northeast of the state capital, Harrisburg. The community is named after the Linglestown family, who were among the first settlers in the area.
History
The Linglestown area was first settled in the late 1700s by the Linglestown family, who were of German descent. The family had emigrated from Germany in 1750 and settled in the area, which was then part of Lancaster County. The family built a log cabin and began farming the land. The area was known as Linglestown until 1845, when it was incorporated as a borough.
The Linglestown area was a rural farming community until the mid-1900s, when it began to experience rapid growth due to its proximity to Harrisburg. The population of the borough increased from 1,000 in 1950 to over 5,000 by the year 2000.
Geography
Linglestown is located in Lower Paxton Township, Dauphin County, Pennsylvania. It is situated approximately five miles northeast of the state capital, Harrisburg. The community is situated in a valley between two ridges, which are part of the Appalachian Mountains. The area is characterized by rolling hills and valleys, with the Susquehanna River running through the center of the community.
The climate in Linglestown is humid continental, with hot summers and cold winters. The average annual temperature is around 50 degrees Fahrenheit, with an average annual precipitation of around 40 inches.
Economy
Linglestown is primarily a residential community, with most of its residents commuting to nearby Harrisburg for work. The community is home to several small businesses, including a grocery store, a hardware store, and a few restaurants. The community is also home to a number of churches, as well as a post office.
Demographics
As of the 2010 census, the population of Linglestown was 5,717. The racial makeup of the community was 94.3% White, 1.7% African American, 0.3% Native American, 1.2% Asian, and 2.5% from other races. The median household income was $50,945, and the median family income was $60,945. The per capita income was $25,945.
Conclusion
Linglestown is a small unincorporated community located in Lower Paxton Township, Dauphin County, Pennsylvania. It is situated approximately five miles northeast of the state capital, Harrisburg. The community is named after the Linglestown family, who were among the first settlers in the area. Linglestown is primarily a residential community, with most of its residents commuting to nearby Harrisburg for work. As of the 2010 census, the population of Linglestown was 5,717. The racial makeup of the community was 94.3% White, 1.7% African American, 0.3% Native American, 1.2% Asian, and 2.5% from other races. The median household income was $50,945, and the median family income was $60,945. The per capita income was $25,945.
Common Questions
What is the Total Population of Linglestown?
Total Population of Linglestown is 6,786.
What is the Total Male Population of Linglestown?
Total Male Population of Linglestown is 3,352.
What is the Total Female Population of Linglestown?
Total Female Population of Linglestown is 3,434.
What is the Ratio of Males per 100 Females in Linglestown?
There are 97.61 Males per 100 Females in Linglestown.
What is the Ratio of Females per 100 Males in Linglestown?
There are 102.45 Females per 100 Males in Linglestown.
What is the Median Population Age in Linglestown?
Median Population Age in Linglestown is 42.9 Years.
What is the Average Family Size in Linglestown
Average Family Size in Linglestown is 3.0 People.
What is the Average Household Size in Linglestown
Average Household Size in Linglestown is 2.5 People.
What is Per Capita Income in Linglestown?
Per Capita income in Linglestown is $41,726.
What is the Median Family Income in Linglestown?
Median Family Income in Linglestown is $105,328.
What is the Median Household income in Linglestown?
Median Household Income in Linglestown is $86,142.
What is Income or Wage Gap in Linglestown?
Income or Wage Gap in Linglestown is 14.0%.
Women in Linglestown earn 86.0 cents for every dollar earned by a man.
What is Inequality or Gini Index in Linglestown?
Inequality or Gini Index in Linglestown is 0.37.
How Large is the Labor Force in Linglestown?
There are 3,783 People in the Labor Forcein in Linglestown.
What is the Percentage of People in the Labor Force in Linglestown?
65.1% of People are in the Labor Force in Linglestown.
What is the Unemployment Rate in Linglestown?
Unemployment Rate in Linglestown is 3.3%.