Clairton, PA
Clairton Map
Clairton Overview
6,182
TOTAL POPULATION
2,996
MALE POPULATION
3,186
FEMALE POPULATION
94.04
MALES / 100 FEMALES
106.34
FEMALES / 100 MALES
41.8
MEDIAN AGE
3.1
AVG FAMILY SIZE
2.2
AVG HOUSEHOLD SIZE
$25,125
PER CAPITA INCOME
$60,500
AVG FAMILY INCOME
$41,301
AVG HOUSEHOLD INCOME
9.4%
WAGE / INCOME GAP [ % ]
90.6¢/ $1
WAGE / INCOME GAP [ $ ]
$13,774
FAMILY INCOME DEFICIT
0.47
INEQUALITY / GINI INDEX
2,705
LABOR FORCE [ PEOPLE ]
52.7%
PERCENT IN LABOR FORCE
10.6%
UNEMPLOYMENT RATE
Clairton Zip Codes
Clairton Area Codes
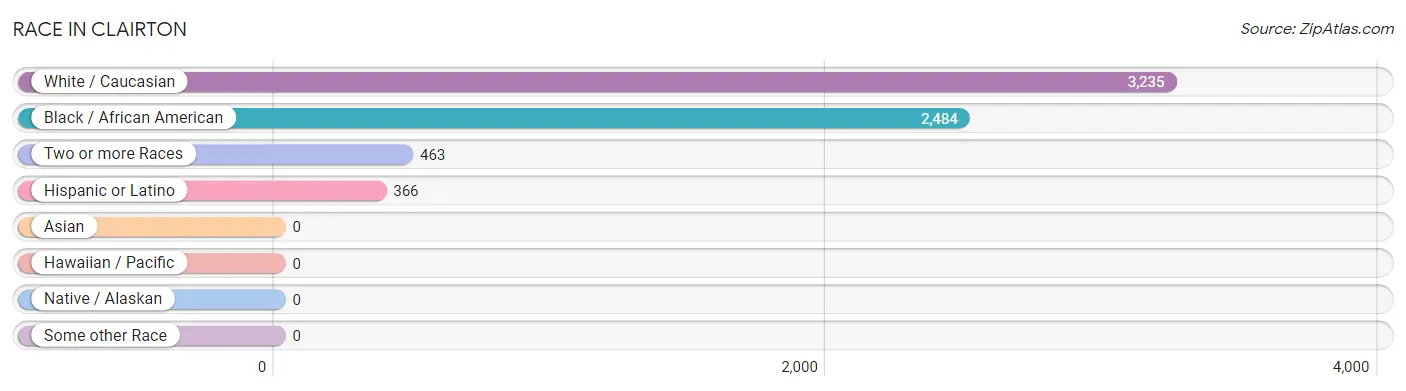
Race in Clairton
The most populous races in Clairton are White / Caucasian (3,235 | 52.3%), Black / African American (2,484 | 40.2%), and Two or more Races (463 | 7.5%).
| Race | # Population | % Population |
| Asian | 0 | 0.0% |
| Black / African American | 2,484 | 40.2% |
| Hawaiian / Pacific | 0 | 0.0% |
| Hispanic or Latino | 366 | 5.9% |
| Native / Alaskan | 0 | 0.0% |
| White / Caucasian | 3,235 | 52.3% |
| Two or more Races | 463 | 7.5% |
| Some other Race | 0 | 0.0% |
| Total | 6,182 | 100.0% |
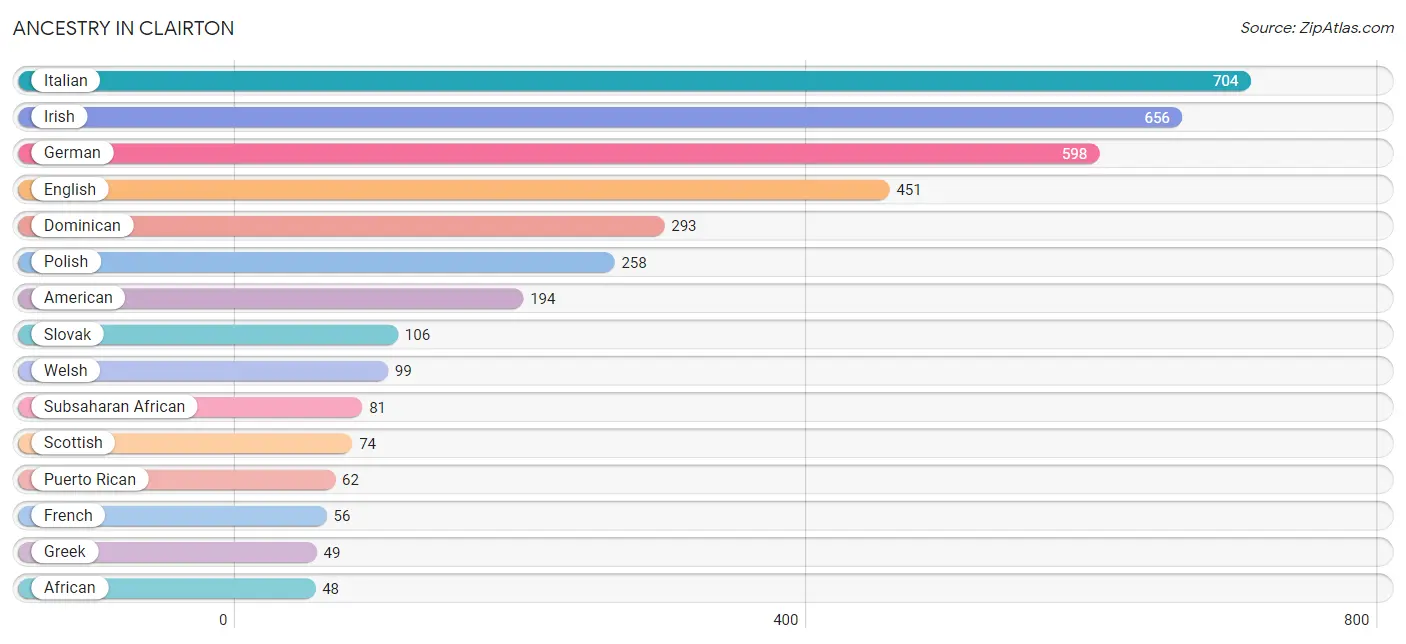
Ancestry in Clairton
The most populous ancestries reported in Clairton are Italian (704 | 11.4%), Irish (656 | 10.6%), German (598 | 9.7%), English (451 | 7.3%), and Dominican (293 | 4.7%), together accounting for 43.7% of all Clairton residents.
| Ancestry | # Population | % Population |
| African | 48 | 0.8% |
| American | 194 | 3.1% |
| Arab | 47 | 0.8% |
| Austrian | 7 | 0.1% |
| British | 7 | 0.1% |
| Colombian | 6 | 0.1% |
| Croatian | 37 | 0.6% |
| Dominican | 293 | 4.7% |
| Dutch | 38 | 0.6% |
| Eastern European | 4 | 0.1% |
| English | 451 | 7.3% |
| European | 41 | 0.7% |
| French | 56 | 0.9% |
| French American Indian | 1 | 0.0% |
| French Canadian | 15 | 0.2% |
| German | 598 | 9.7% |
| Greek | 49 | 0.8% |
| Hungarian | 32 | 0.5% |
| Irish | 656 | 10.6% |
| Iroquois | 5 | 0.1% |
| Italian | 704 | 11.4% |
| Lebanese | 7 | 0.1% |
| Mexican | 5 | 0.1% |
| Nigerian | 33 | 0.5% |
| Norwegian | 9 | 0.2% |
| Pennsylvania German | 4 | 0.1% |
| Polish | 258 | 4.2% |
| Puerto Rican | 62 | 1.0% |
| Russian | 18 | 0.3% |
| Scotch-Irish | 41 | 0.7% |
| Scottish | 74 | 1.2% |
| Serbian | 4 | 0.1% |
| Slavic | 14 | 0.2% |
| Slovak | 106 | 1.7% |
| Slovene | 27 | 0.4% |
| South American | 6 | 0.1% |
| Subsaharan African | 81 | 1.3% |
| Swedish | 14 | 0.2% |
| Swiss | 8 | 0.1% |
| Syrian | 15 | 0.2% |
| Ukrainian | 4 | 0.1% |
| Welsh | 99 | 1.6% | View All 42 Rows |
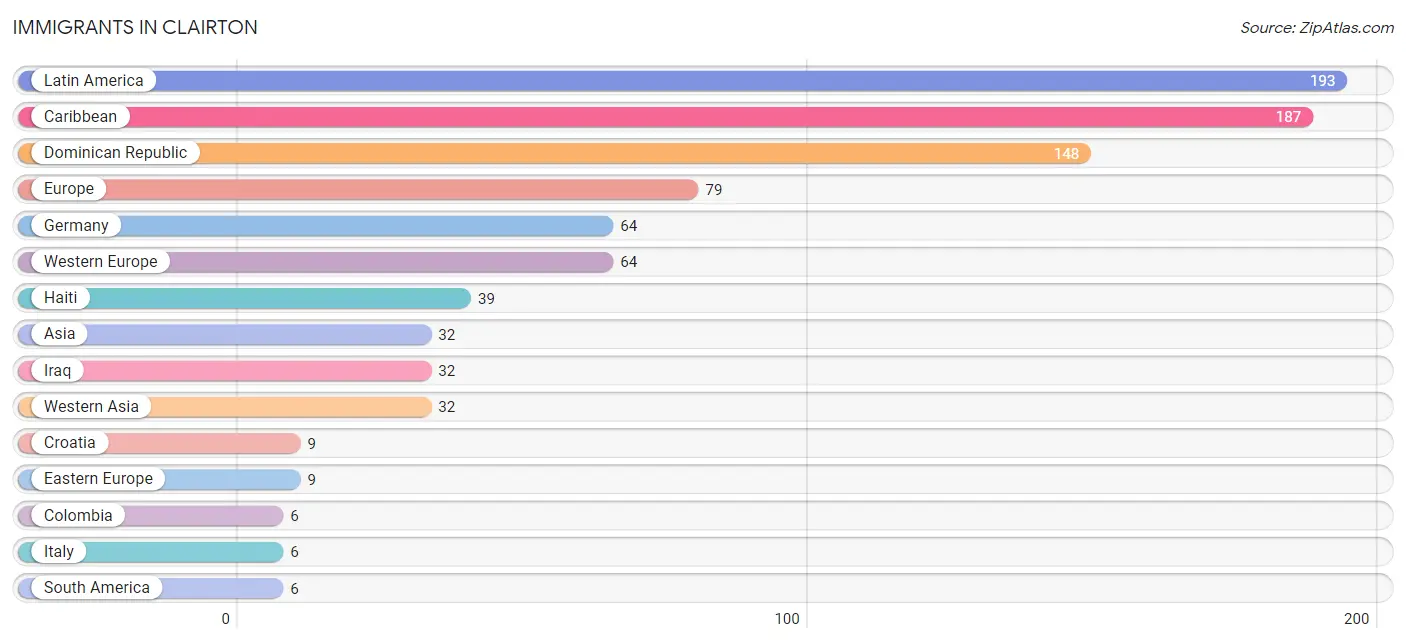
Immigrants in Clairton
The most numerous immigrant groups reported in Clairton came from Latin America (193 | 3.1%), Caribbean (187 | 3.0%), Dominican Republic (148 | 2.4%), Europe (79 | 1.3%), and Germany (64 | 1.0%), together accounting for 10.9% of all Clairton residents.
| Immigration Origin | # Population | % Population |
| Asia | 32 | 0.5% |
| Caribbean | 187 | 3.0% |
| Colombia | 6 | 0.1% |
| Croatia | 9 | 0.2% |
| Dominican Republic | 148 | 2.4% |
| Eastern Europe | 9 | 0.2% |
| Europe | 79 | 1.3% |
| Germany | 64 | 1.0% |
| Haiti | 39 | 0.6% |
| Iraq | 32 | 0.5% |
| Italy | 6 | 0.1% |
| Latin America | 193 | 3.1% |
| South America | 6 | 0.1% |
| Southern Europe | 6 | 0.1% |
| Western Asia | 32 | 0.5% |
| Western Europe | 64 | 1.0% | View All 16 Rows |
Sex and Age in Clairton
Sex and Age in Clairton
The most populous age groups in Clairton are 40 to 44 Years (330 | 11.0%) for men and 60 to 64 Years (330 | 10.4%) for women.
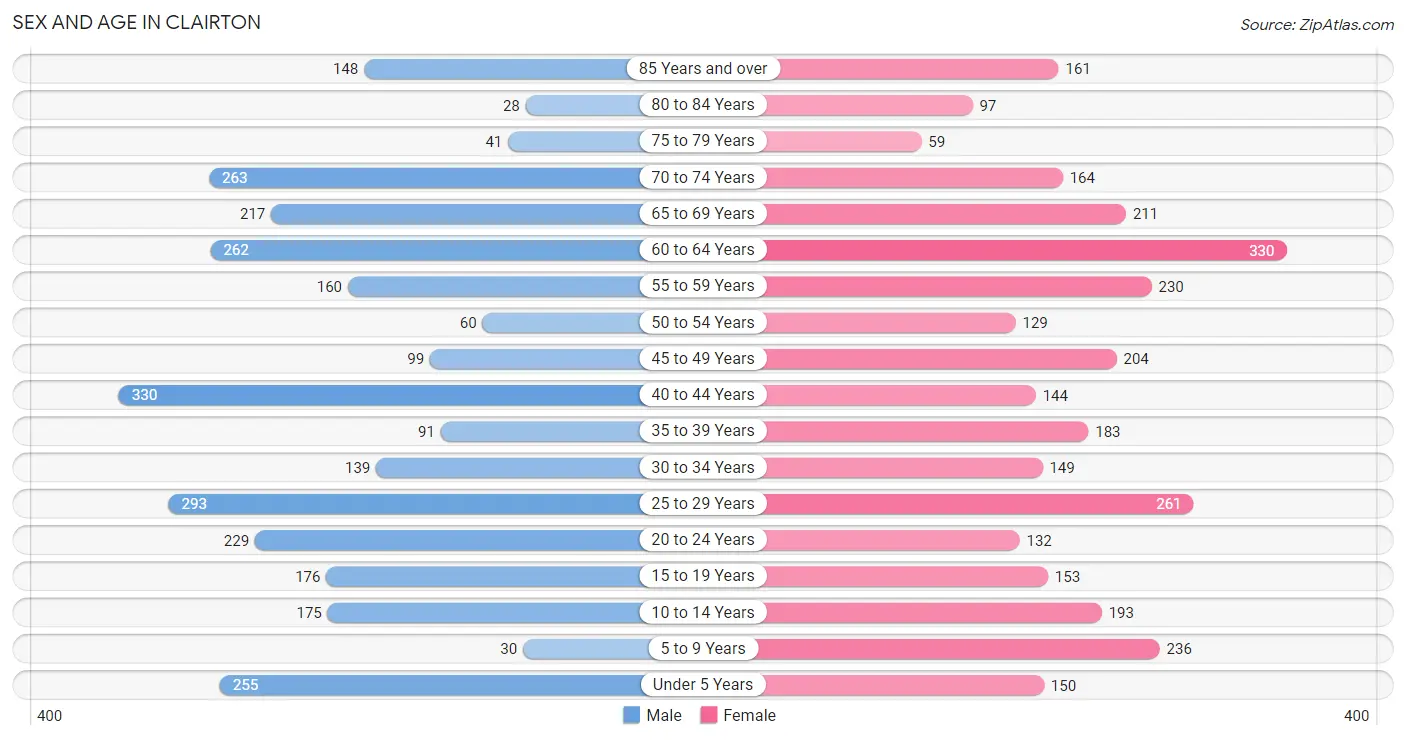
| Age Bracket | Male | Female |
| Under 5 Years | 255 (8.5%) | 150 (4.7%) |
| 5 to 9 Years | 30 (1.0%) | 236 (7.4%) |
| 10 to 14 Years | 175 (5.8%) | 193 (6.1%) |
| 15 to 19 Years | 176 (5.9%) | 153 (4.8%) |
| 20 to 24 Years | 229 (7.6%) | 132 (4.1%) |
| 25 to 29 Years | 293 (9.8%) | 261 (8.2%) |
| 30 to 34 Years | 139 (4.6%) | 149 (4.7%) |
| 35 to 39 Years | 91 (3.0%) | 183 (5.7%) |
| 40 to 44 Years | 330 (11.0%) | 144 (4.5%) |
| 45 to 49 Years | 99 (3.3%) | 204 (6.4%) |
| 50 to 54 Years | 60 (2.0%) | 129 (4.1%) |
| 55 to 59 Years | 160 (5.3%) | 230 (7.2%) |
| 60 to 64 Years | 262 (8.7%) | 330 (10.4%) |
| 65 to 69 Years | 217 (7.2%) | 211 (6.6%) |
| 70 to 74 Years | 263 (8.8%) | 164 (5.1%) |
| 75 to 79 Years | 41 (1.4%) | 59 (1.8%) |
| 80 to 84 Years | 28 (0.9%) | 97 (3.0%) |
| 85 Years and over | 148 (4.9%) | 161 (5.1%) |
| Total | 2,996 (100.0%) | 3,186 (100.0%) |
Families and Households in Clairton
Median Family Size in Clairton
The median family size in Clairton is 3.07 persons per family, with single female/mother families (438 | 30.2%) accounting for the largest median family size of 3.75 persons per family. On the other hand, single male/father families (127 | 8.7%) represent the smallest median family size with 2.28 persons per family.
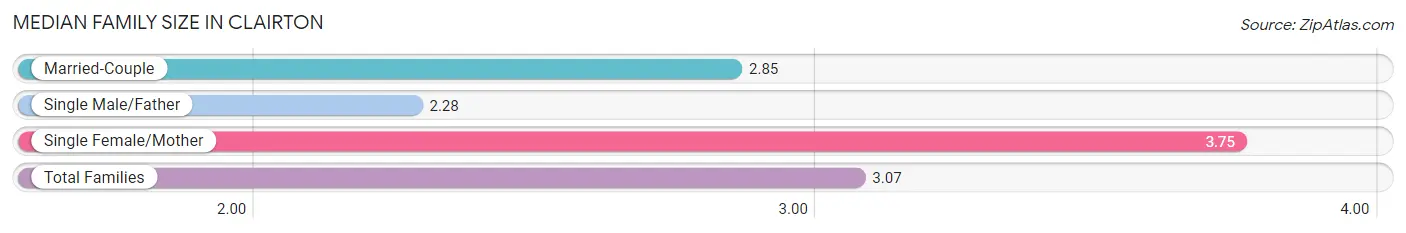
| Family Type | # Families | Family Size |
| Married-Couple | 887 (61.1%) | 2.85 |
| Single Male/Father | 127 (8.7%) | 2.28 |
| Single Female/Mother | 438 (30.2%) | 3.75 |
| Total Families | 1,452 (100.0%) | 3.07 |
Median Household Size in Clairton
The median household size in Clairton is 2.23 persons per household, with single female/mother households (438 | 15.9%) accounting for the largest median household size of 4 persons per household. non-family households (1,295 | 47.1%) represent the smallest median household size with 1.14 persons per household.
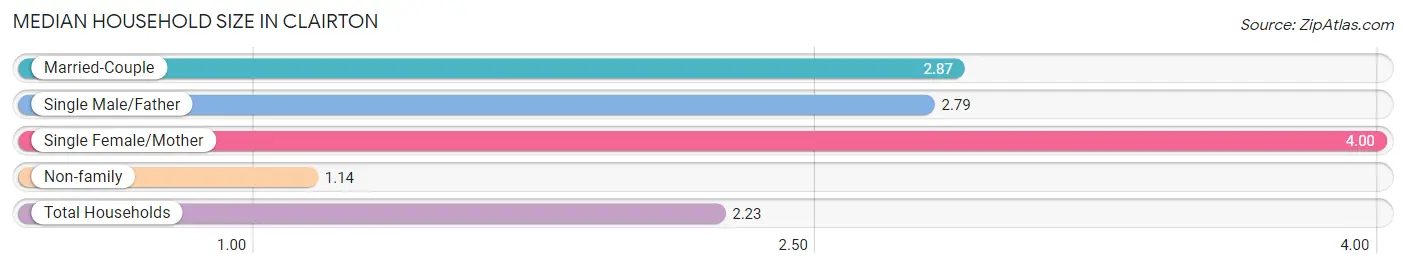
| Household Type | # Households | Household Size |
| Married-Couple | 887 (32.3%) | 2.87 |
| Single Male/Father | 127 (4.6%) | 2.79 |
| Single Female/Mother | 438 (15.9%) | 4.00 |
| Non-family | 1,295 (47.1%) | 1.14 |
| Total Households | 2,747 (100.0%) | 2.23 |
Household Size by Marriage Status in Clairton
Out of a total of 2,747 households in Clairton, 1,452 (52.9%) are family households, while 1,295 (47.1%) are nonfamily households. The most numerous type of family households are 2-person households, comprising 656, and the most common type of nonfamily households are 1-person households, comprising 1,153.
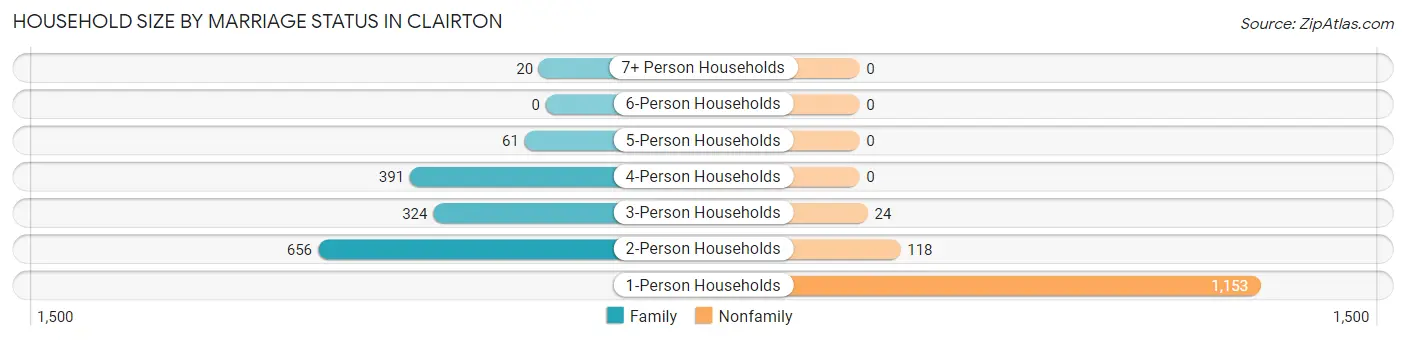
| Household Size | Family Households | Nonfamily Households |
| 1-Person Households | - | 1,153 (42.0%) |
| 2-Person Households | 656 (23.9%) | 118 (4.3%) |
| 3-Person Households | 324 (11.8%) | 24 (0.9%) |
| 4-Person Households | 391 (14.2%) | 0 (0.0%) |
| 5-Person Households | 61 (2.2%) | 0 (0.0%) |
| 6-Person Households | 0 (0.0%) | 0 (0.0%) |
| 7+ Person Households | 20 (0.7%) | 0 (0.0%) |
| Total | 1,452 (52.9%) | 1,295 (47.1%) |
Female Fertility in Clairton
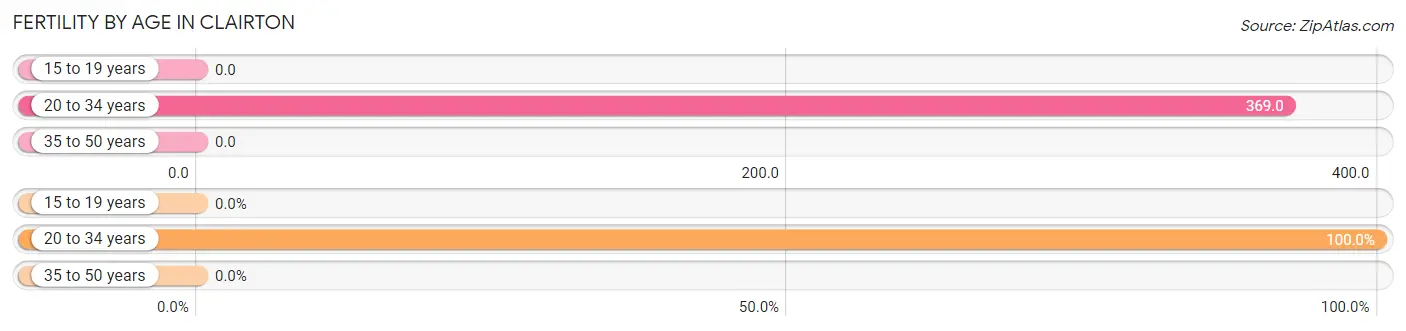
Fertility by Age in Clairton
Average fertility rate in Clairton is 162.0 births per 1,000 women. Women in the age bracket of 20 to 34 years have the highest fertility rate with 369.0 births per 1,000 women. Women in the age bracket of 20 to 34 years acount for 100.0% of all women with births.
| Age Bracket | Women with Births | Births / 1,000 Women |
| 15 to 19 years | 0 (0.0%) | 0.0 |
| 20 to 34 years | 200 (100.0%) | 369.0 |
| 35 to 50 years | 0 (0.0%) | 0.0 |
| Total | 200 (100.0%) | 162.0 |
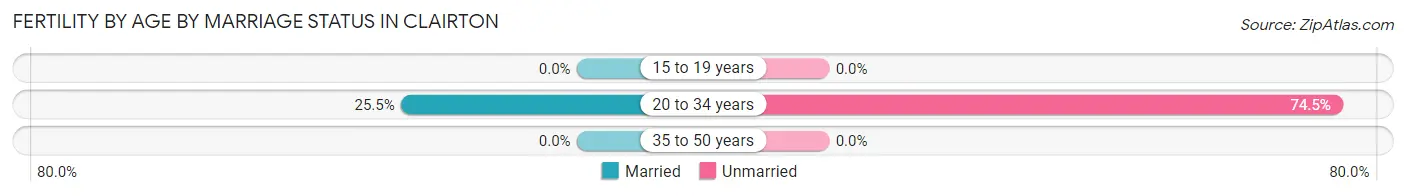
Fertility by Age by Marriage Status in Clairton
25.5% of women with births (200) in Clairton are married. The highest percentage of unmarried women with births falls into 20 to 34 years age bracket with 74.5% of them unmarried at the time of birth, while the lowest percentage of unmarried women with births belong to 20 to 34 years age bracket with 74.5% of them unmarried.
| Age Bracket | Married | Unmarried |
| 15 to 19 years | 0 (0.0%) | 0 (0.0%) |
| 20 to 34 years | 51 (25.5%) | 149 (74.5%) |
| 35 to 50 years | 0 (0.0%) | 0 (0.0%) |
| Total | 51 (25.5%) | 149 (74.5%) |
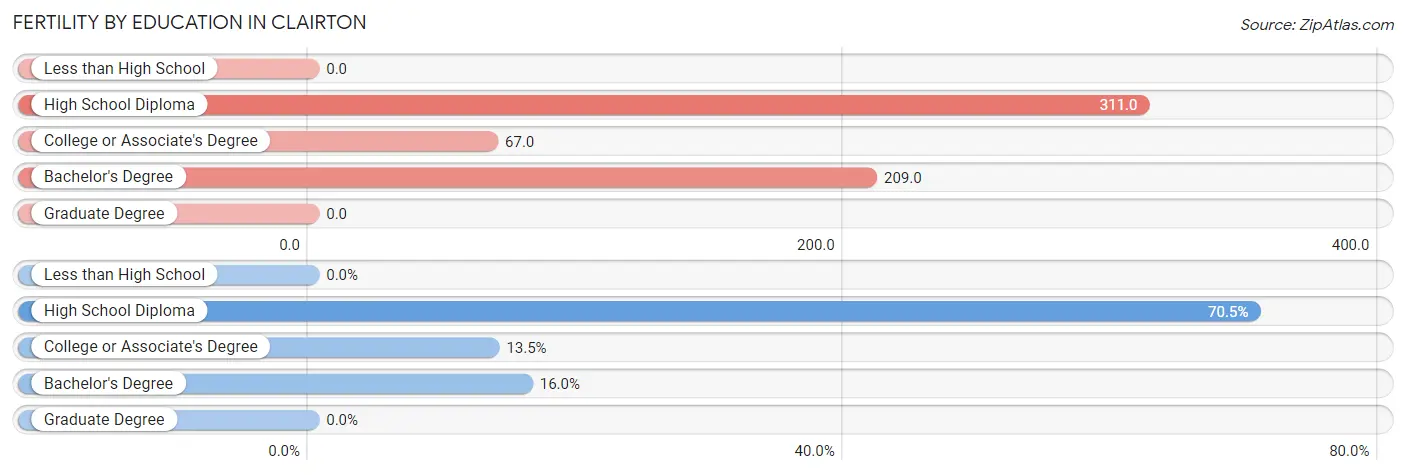
Fertility by Education in Clairton
| Educational Attainment | Women with Births | Births / 1,000 Women |
| Less than High School | 0 (0.0%) | 0.0 |
| High School Diploma | 141 (70.5%) | 311.0 |
| College or Associate's Degree | 27 (13.5%) | 67.0 |
| Bachelor's Degree | 32 (16.0%) | 209.0 |
| Graduate Degree | 0 (0.0%) | 0.0 |
| Total | 200 (100.0%) | 162.0 |
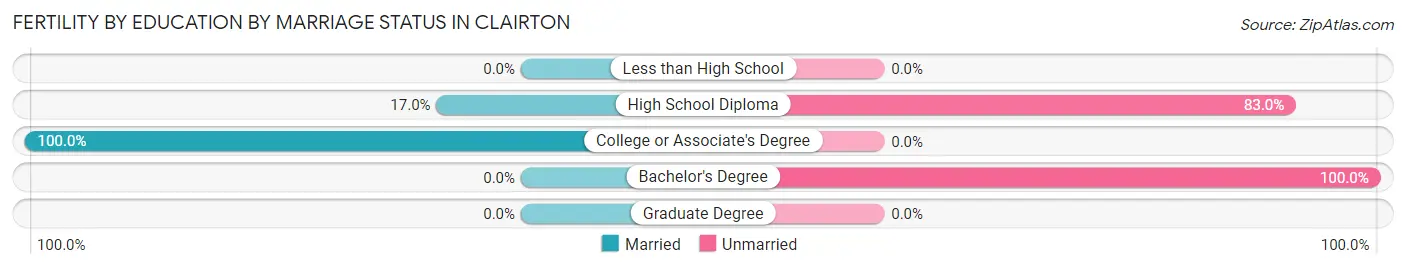
Fertility by Education by Marriage Status in Clairton
74.5% of women with births in Clairton are unmarried. Women with the educational attainment of college or associate's degree are most likely to be married with 100.0% of them married at childbirth, while women with the educational attainment of bachelor's degree are least likely to be married with 100.0% of them unmarried at childbirth.
| Educational Attainment | Married | Unmarried |
| Less than High School | 0 (0.0%) | 0 (0.0%) |
| High School Diploma | 24 (17.0%) | 117 (83.0%) |
| College or Associate's Degree | 27 (100.0%) | 0 (0.0%) |
| Bachelor's Degree | 0 (0.0%) | 32 (100.0%) |
| Graduate Degree | 0 (0.0%) | 0 (0.0%) |
| Total | 51 (25.5%) | 149 (74.5%) |
Income in Clairton
Income Overview in Clairton
Per Capita Income in Clairton is $25,125, while median incomes of families and households are $60,500 and $41,301 respectively.
| Characteristic | Number | Measure |
| Per Capita Income | 6,182 | $25,125 |
| Median Family Income | 1,452 | $60,500 |
| Mean Family Income | 1,452 | $71,507 |
| Median Household Income | 2,747 | $41,301 |
| Mean Household Income | 2,747 | $55,239 |
| Income Deficit | 1,452 | $13,774 |
| Wage / Income Gap (%) | 6,182 | 9.38% |
| Wage / Income Gap ($) | 6,182 | 90.62¢ per $1 |
| Gini / Inequality Index | 6,182 | 0.47 |
Earnings by Sex in Clairton
Average Earnings in Clairton are $32,773, $29,926 for men and $33,024 for women, a difference of 9.4%.
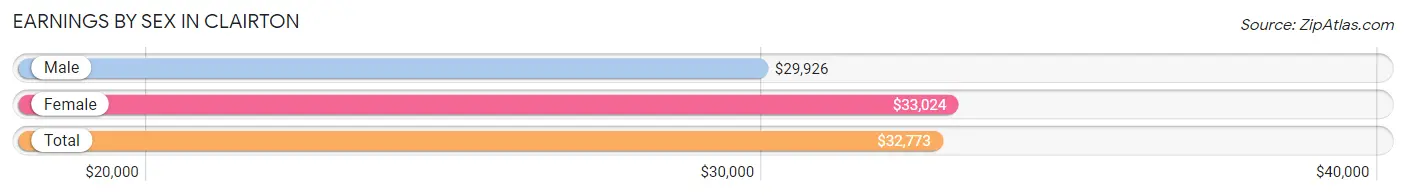
| Sex | Number | Average Earnings |
| Male | 1,544 (54.5%) | $29,926 |
| Female | 1,289 (45.5%) | $33,024 |
| Total | 2,833 (100.0%) | $32,773 |
Earnings by Sex by Income Bracket in Clairton
The most common earnings brackets in Clairton are $25,000 to $29,999 for men (228 | 14.8%) and $2,499 or less for women (180 | 14.0%).
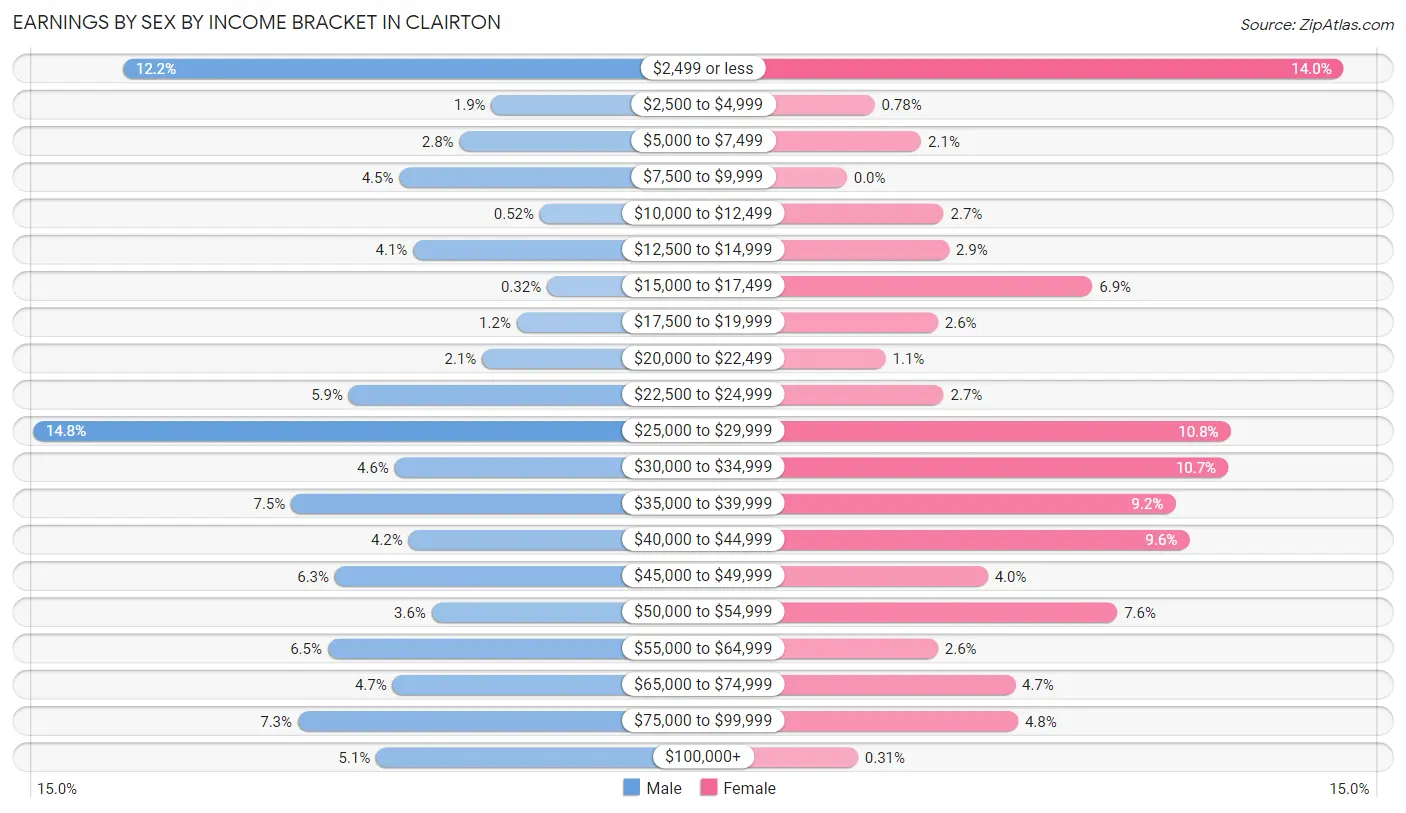
| Income | Male | Female |
| $2,499 or less | 189 (12.2%) | 180 (14.0%) |
| $2,500 to $4,999 | 29 (1.9%) | 10 (0.8%) |
| $5,000 to $7,499 | 43 (2.8%) | 27 (2.1%) |
| $7,500 to $9,999 | 69 (4.5%) | 0 (0.0%) |
| $10,000 to $12,499 | 8 (0.5%) | 35 (2.7%) |
| $12,500 to $14,999 | 63 (4.1%) | 37 (2.9%) |
| $15,000 to $17,499 | 5 (0.3%) | 89 (6.9%) |
| $17,500 to $19,999 | 18 (1.2%) | 33 (2.6%) |
| $20,000 to $22,499 | 33 (2.1%) | 14 (1.1%) |
| $22,500 to $24,999 | 91 (5.9%) | 35 (2.7%) |
| $25,000 to $29,999 | 228 (14.8%) | 139 (10.8%) |
| $30,000 to $34,999 | 71 (4.6%) | 138 (10.7%) |
| $35,000 to $39,999 | 116 (7.5%) | 119 (9.2%) |
| $40,000 to $44,999 | 65 (4.2%) | 124 (9.6%) |
| $45,000 to $49,999 | 97 (6.3%) | 51 (4.0%) |
| $50,000 to $54,999 | 55 (3.6%) | 98 (7.6%) |
| $55,000 to $64,999 | 100 (6.5%) | 33 (2.6%) |
| $65,000 to $74,999 | 72 (4.7%) | 61 (4.7%) |
| $75,000 to $99,999 | 113 (7.3%) | 62 (4.8%) |
| $100,000+ | 79 (5.1%) | 4 (0.3%) |
| Total | 1,544 (100.0%) | 1,289 (100.0%) |
Earnings by Sex by Educational Attainment in Clairton
Average earnings in Clairton are $34,560 for men and $35,239 for women, a difference of 1.9%. Men with an educational attainment of college or associate's degree enjoy the highest average annual earnings of $49,861, while those with high school diploma education earn the least with $26,711. Women with an educational attainment of bachelor's degree earn the most with the average annual earnings of $49,583, while those with high school diploma education have the smallest earnings of $18,050.
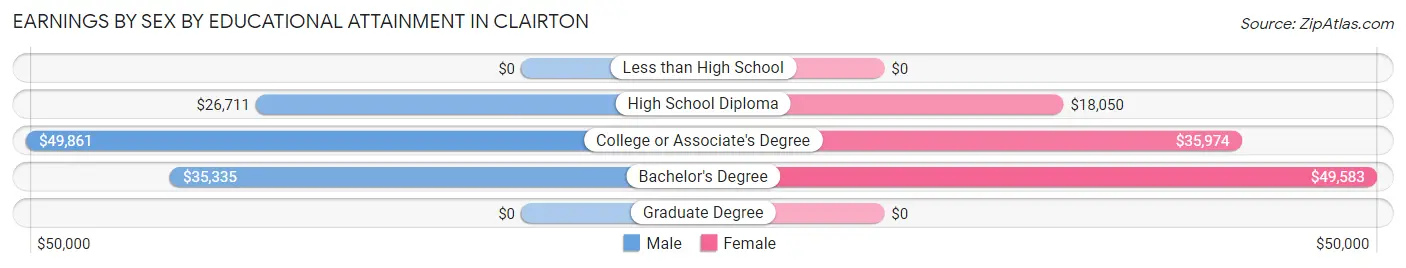
| Educational Attainment | Male Income | Female Income |
| Less than High School | - | - |
| High School Diploma | $26,711 | $18,050 |
| College or Associate's Degree | $49,861 | $35,974 |
| Bachelor's Degree | $35,335 | $49,583 |
| Graduate Degree | - | - |
| Total | $34,560 | $35,239 |
Family Income in Clairton
Family Income Brackets in Clairton
According to the Clairton family income data, there are 301 families falling into the $75,000 to $99,999 income range, which is the most common income bracket and makes up 20.7% of all families. Conversely, the $150,000 to $199,999 income bracket is the least frequent group with only 46 families (3.2%) belonging to this category.
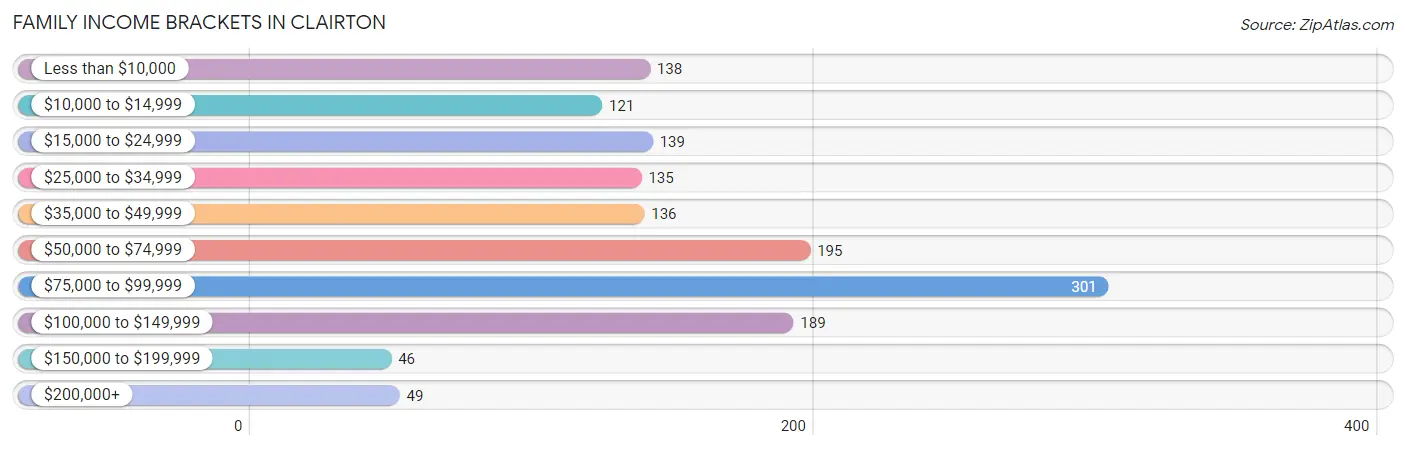
| Income Bracket | # Families | % Families |
| Less than $10,000 | 138 | 9.5% |
| $10,000 to $14,999 | 121 | 8.3% |
| $15,000 to $24,999 | 139 | 9.6% |
| $25,000 to $34,999 | 135 | 9.3% |
| $35,000 to $49,999 | 136 | 9.4% |
| $50,000 to $74,999 | 195 | 13.4% |
| $75,000 to $99,999 | 301 | 20.7% |
| $100,000 to $149,999 | 189 | 13.0% |
| $150,000 to $199,999 | 46 | 3.2% |
| $200,000+ | 49 | 3.4% |
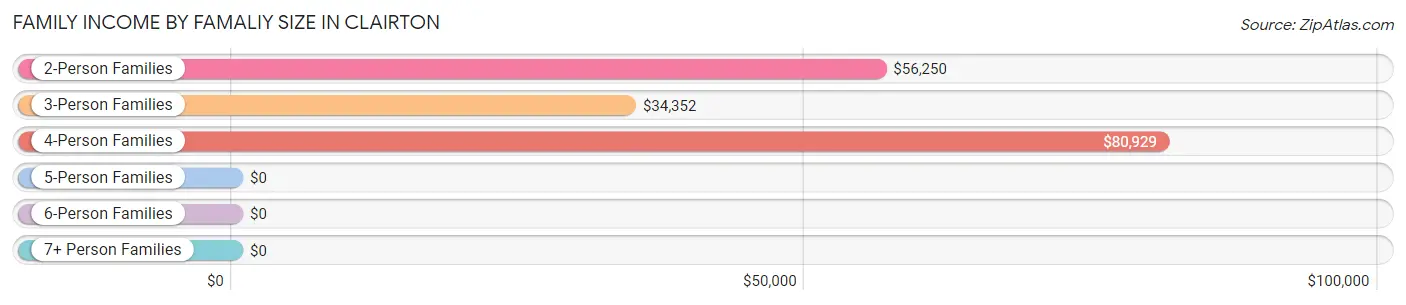
Family Income by Famaliy Size in Clairton
4-person families (293 | 20.2%) account for the highest median family income in Clairton with $80,929 per family, while 2-person families (710 | 48.9%) have the highest median income of $28,125 per family member.
| Income Bracket | # Families | Median Income |
| 2-Person Families | 710 (48.9%) | $56,250 |
| 3-Person Families | 368 (25.3%) | $34,352 |
| 4-Person Families | 293 (20.2%) | $80,929 |
| 5-Person Families | 61 (4.2%) | $0 |
| 6-Person Families | 0 (0.0%) | $0 |
| 7+ Person Families | 20 (1.4%) | $0 |
| Total | 1,452 (100.0%) | $60,500 |
Family Income by Number of Earners in Clairton
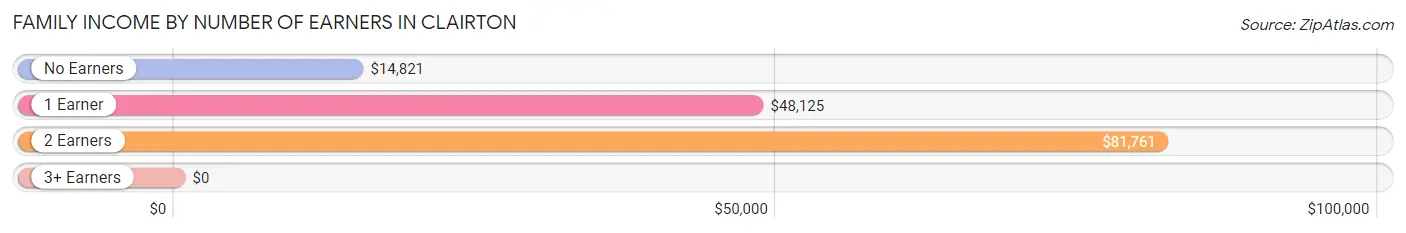
| Number of Earners | # Families | Median Income |
| No Earners | 409 (28.2%) | $14,821 |
| 1 Earner | 534 (36.8%) | $48,125 |
| 2 Earners | 396 (27.3%) | $81,761 |
| 3+ Earners | 113 (7.8%) | $0 |
| Total | 1,452 (100.0%) | $60,500 |
Household Income in Clairton
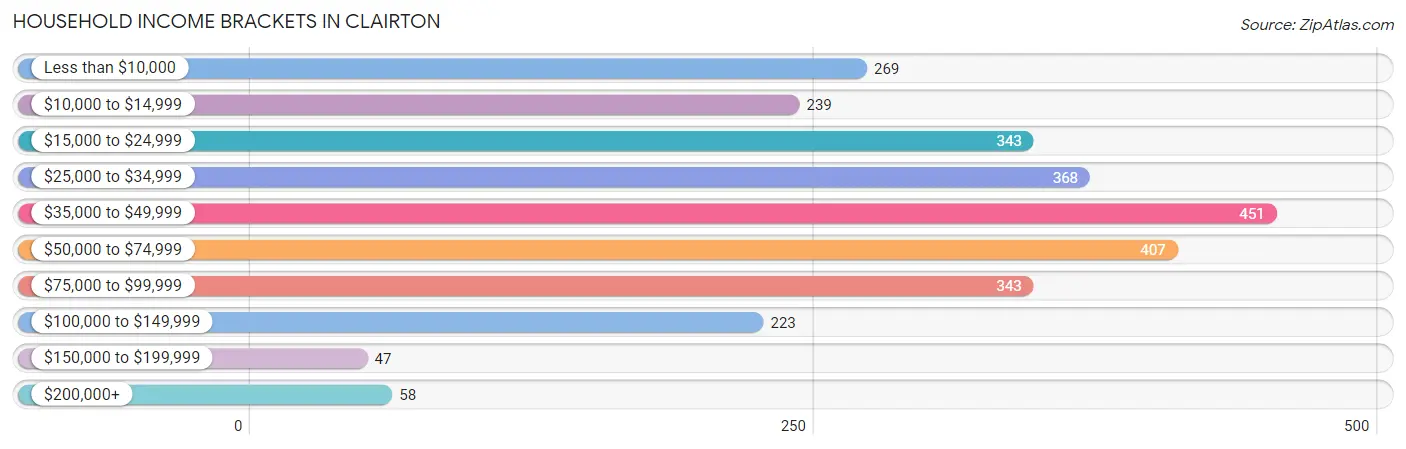
Household Income Brackets in Clairton
With 451 households falling in the category, the $35,000 to $49,999 income range is the most frequent in Clairton, accounting for 16.4% of all households. In contrast, only 47 households (1.7%) fall into the $150,000 to $199,999 income bracket, making it the least populous group.
| Income Bracket | # Households | % Households |
| Less than $10,000 | 269 | 9.8% |
| $10,000 to $14,999 | 239 | 8.7% |
| $15,000 to $24,999 | 343 | 12.5% |
| $25,000 to $34,999 | 368 | 13.4% |
| $35,000 to $49,999 | 451 | 16.4% |
| $50,000 to $74,999 | 407 | 14.8% |
| $75,000 to $99,999 | 343 | 12.5% |
| $100,000 to $149,999 | 223 | 8.1% |
| $150,000 to $199,999 | 47 | 1.7% |
| $200,000+ | 58 | 2.1% |
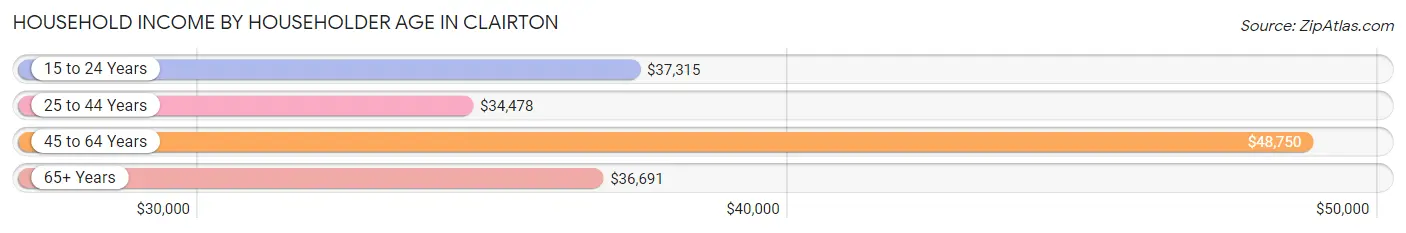
Household Income by Householder Age in Clairton
The median household income in Clairton is $41,301, with the highest median household income of $48,750 found in the 45 to 64 years age bracket for the primary householder. A total of 933 households (34.0%) fall into this category. Meanwhile, the 25 to 44 years age bracket for the primary householder has the lowest median household income of $34,478, with 699 households (25.5%) in this group.
| Income Bracket | # Households | Median Income |
| 15 to 24 Years | 118 (4.3%) | $37,315 |
| 25 to 44 Years | 699 (25.5%) | $34,478 |
| 45 to 64 Years | 933 (34.0%) | $48,750 |
| 65+ Years | 997 (36.3%) | $36,691 |
| Total | 2,747 (100.0%) | $41,301 |
Poverty in Clairton
Income Below Poverty by Sex and Age in Clairton
With 21.6% poverty level for males and 24.4% for females among the residents of Clairton, 5 year old males and 15 year old females are the most vulnerable to poverty, with 8 males (100.0%) and 10 females (100.0%) in their respective age groups living below the poverty level.
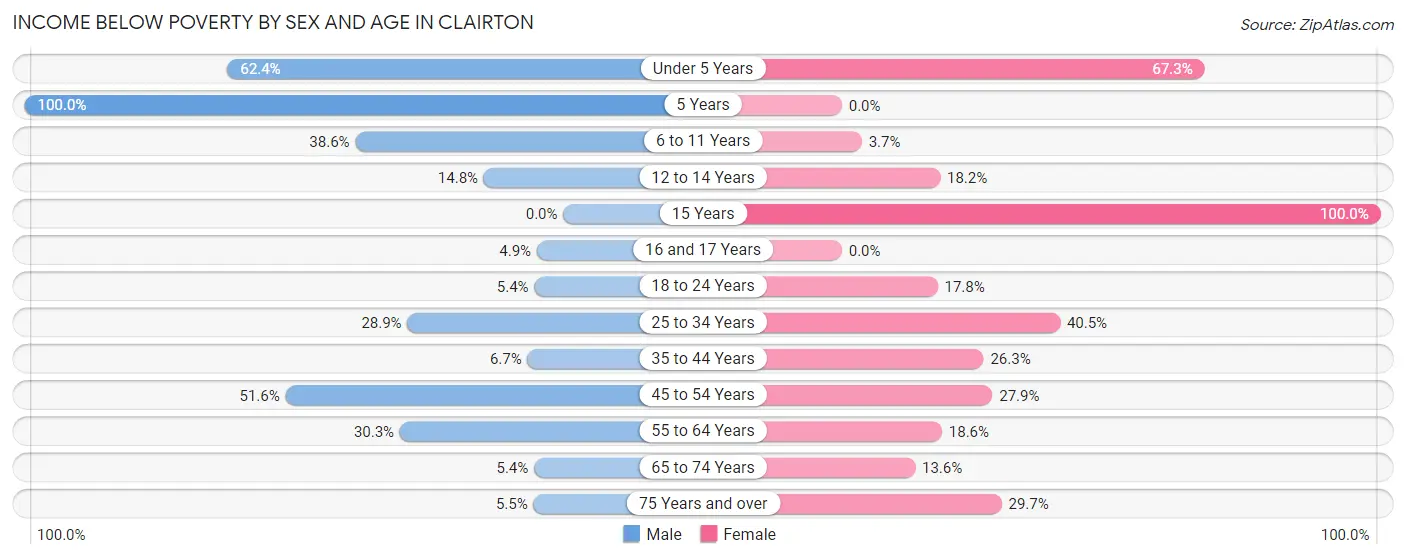
| Age Bracket | Male | Female |
| Under 5 Years | 159 (62.4%) | 101 (67.3%) |
| 5 Years | 8 (100.0%) | 0 (0.0%) |
| 6 to 11 Years | 44 (38.6%) | 9 (3.7%) |
| 12 to 14 Years | 9 (14.7%) | 29 (18.2%) |
| 15 Years | 0 (0.0%) | 10 (100.0%) |
| 16 and 17 Years | 8 (4.9%) | 0 (0.0%) |
| 18 to 24 Years | 13 (5.4%) | 35 (17.8%) |
| 25 to 34 Years | 125 (28.9%) | 166 (40.5%) |
| 35 to 44 Years | 28 (6.7%) | 86 (26.3%) |
| 45 to 54 Years | 82 (51.6%) | 93 (27.9%) |
| 55 to 64 Years | 128 (30.3%) | 104 (18.6%) |
| 65 to 74 Years | 26 (5.4%) | 51 (13.6%) |
| 75 Years and over | 12 (5.5%) | 94 (29.6%) |
| Total | 642 (21.6%) | 778 (24.4%) |
Income Above Poverty by Sex and Age in Clairton
According to the poverty statistics in Clairton, males aged 16 and 17 years and females aged 5 years are the age groups that are most secure financially, with 95.1% of males and 100.0% of females in these age groups living above the poverty line.
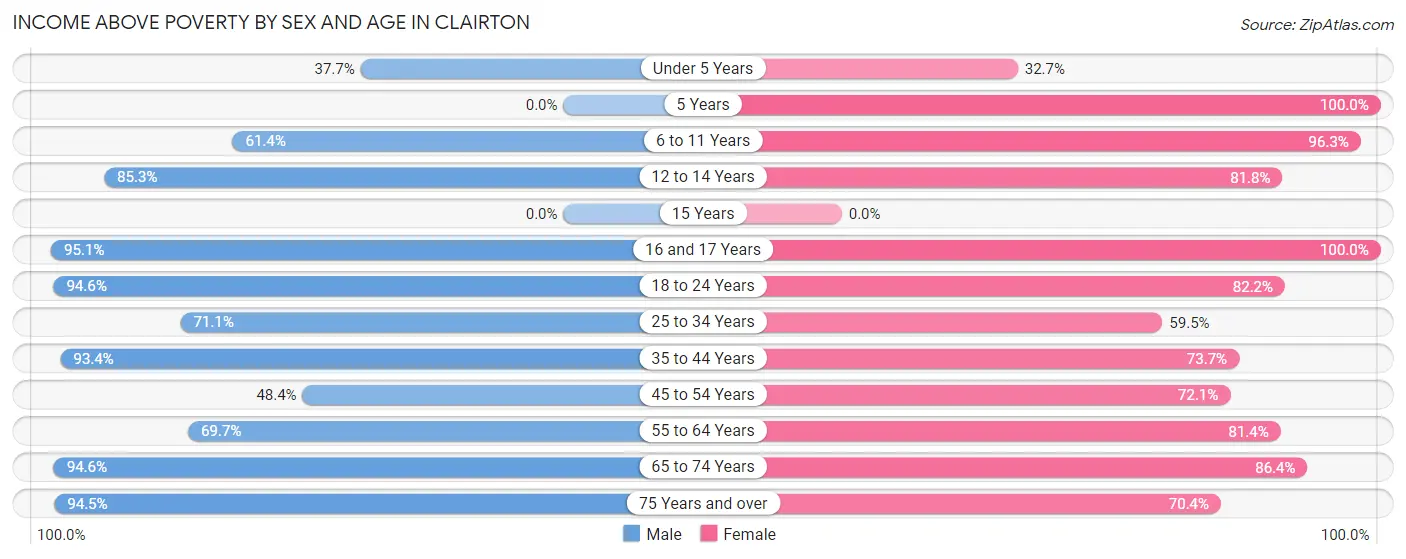
| Age Bracket | Male | Female |
| Under 5 Years | 96 (37.7%) | 49 (32.7%) |
| 5 Years | 0 (0.0%) | 27 (100.0%) |
| 6 to 11 Years | 70 (61.4%) | 234 (96.3%) |
| 12 to 14 Years | 52 (85.3%) | 130 (81.8%) |
| 15 Years | 0 (0.0%) | 0 (0.0%) |
| 16 and 17 Years | 155 (95.1%) | 78 (100.0%) |
| 18 to 24 Years | 229 (94.6%) | 162 (82.2%) |
| 25 to 34 Years | 307 (71.1%) | 244 (59.5%) |
| 35 to 44 Years | 393 (93.3%) | 241 (73.7%) |
| 45 to 54 Years | 77 (48.4%) | 240 (72.1%) |
| 55 to 64 Years | 294 (69.7%) | 456 (81.4%) |
| 65 to 74 Years | 454 (94.6%) | 324 (86.4%) |
| 75 Years and over | 205 (94.5%) | 223 (70.4%) |
| Total | 2,332 (78.4%) | 2,408 (75.6%) |
Income Below Poverty Among Married-Couple Families in Clairton
The poverty statistics for married-couple families in Clairton show that 15.1% or 134 of the total 887 families live below the poverty line. Families with 1 or 2 children have the highest poverty rate of 17.9%, comprising of 34 families. On the other hand, families with 3 or 4 children have the lowest poverty rate of 0.0%, which includes 0 families.
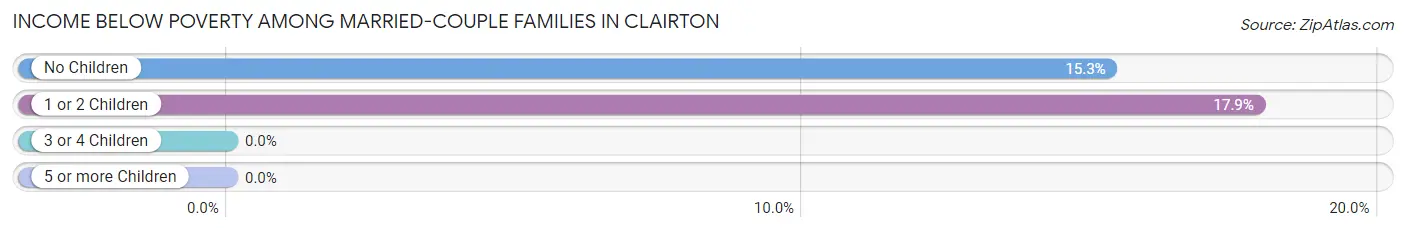
| Children | Above Poverty | Below Poverty |
| No Children | 553 (84.7%) | 100 (15.3%) |
| 1 or 2 Children | 156 (82.1%) | 34 (17.9%) |
| 3 or 4 Children | 44 (100.0%) | 0 (0.0%) |
| 5 or more Children | 0 (0.0%) | 0 (0.0%) |
| Total | 753 (84.9%) | 134 (15.1%) |
Income Below Poverty Among Single-Parent Households in Clairton
According to the poverty data in Clairton, 24.4% or 31 single-father households and 28.5% or 125 single-mother households are living below the poverty line. Among single-father households, those with 1 or 2 children have the highest poverty rate, with 16 households (100.0%) experiencing poverty. Likewise, among single-mother households, those with 1 or 2 children have the highest poverty rate, with 98 households (37.1%) falling below the poverty line.
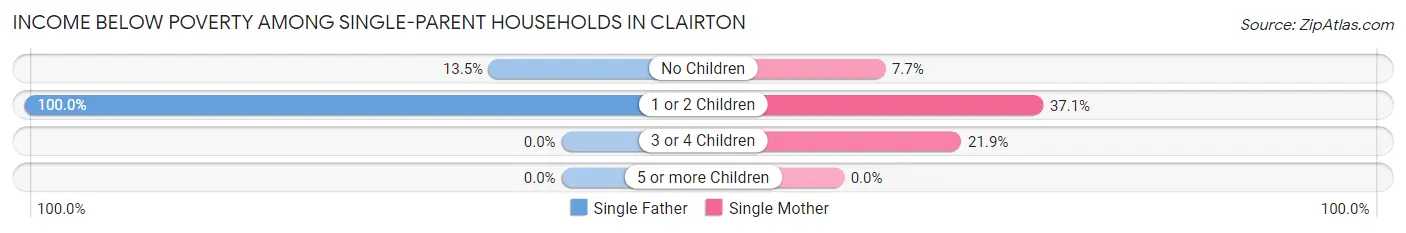
| Children | Single Father | Single Mother |
| No Children | 15 (13.5%) | 6 (7.7%) |
| 1 or 2 Children | 16 (100.0%) | 98 (37.1%) |
| 3 or 4 Children | 0 (0.0%) | 21 (21.9%) |
| 5 or more Children | 0 (0.0%) | 0 (0.0%) |
| Total | 31 (24.4%) | 125 (28.5%) |
Income Below Poverty Among Married-Couple vs Single-Parent Households in Clairton
The poverty data for Clairton shows that 134 of the married-couple family households (15.1%) and 156 of the single-parent households (27.6%) are living below the poverty level. Within the married-couple family households, those with 1 or 2 children have the highest poverty rate, with 34 households (17.9%) falling below the poverty line. Among the single-parent households, those with 1 or 2 children have the highest poverty rate, with 114 household (40.7%) living below poverty.
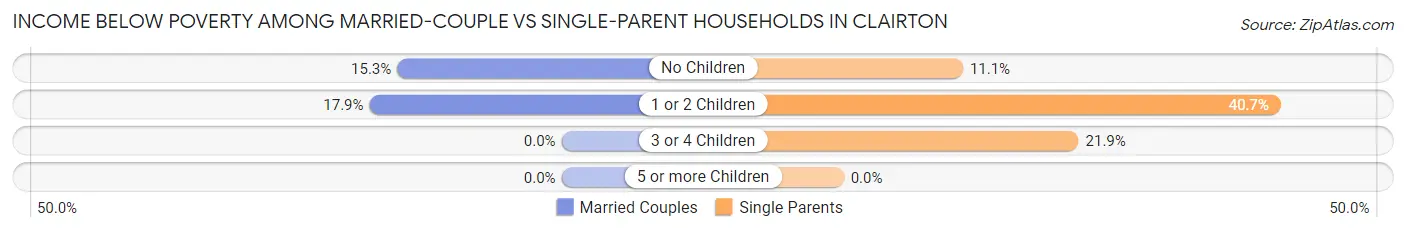
| Children | Married-Couple Families | Single-Parent Households |
| No Children | 100 (15.3%) | 21 (11.1%) |
| 1 or 2 Children | 34 (17.9%) | 114 (40.7%) |
| 3 or 4 Children | 0 (0.0%) | 21 (21.9%) |
| 5 or more Children | 0 (0.0%) | 0 (0.0%) |
| Total | 134 (15.1%) | 156 (27.6%) |
Employment Characteristics in Clairton
Employment by Class of Employer in Clairton
Among the 2,326 employed individuals in Clairton, private company employees (1,638 | 70.4%), not-for-profit organizations (340 | 14.6%), and local government employees (119 | 5.1%) make up the most common classes of employment.
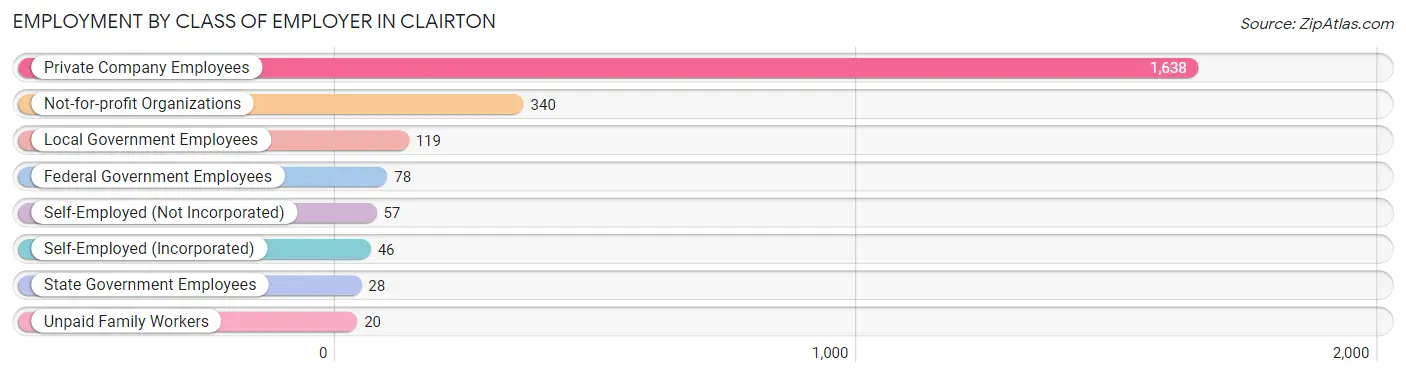
| Employer Class | # Employees | % Employees |
| Private Company Employees | 1,638 | 70.4% |
| Self-Employed (Incorporated) | 46 | 2.0% |
| Self-Employed (Not Incorporated) | 57 | 2.5% |
| Not-for-profit Organizations | 340 | 14.6% |
| Local Government Employees | 119 | 5.1% |
| State Government Employees | 28 | 1.2% |
| Federal Government Employees | 78 | 3.4% |
| Unpaid Family Workers | 20 | 0.9% |
| Total | 2,326 | 100.0% |
Employment Status by Age in Clairton
According to the labor force statistics for Clairton, out of the total population over 16 years of age (5,133), 52.7% or 2,705 individuals are in the labor force, with 10.6% or 287 of them unemployed. The age group with the highest labor force participation rate is 20 to 24 years, with 94.5% or 341 individuals in the labor force. Within the labor force, the 25 to 29 years age range has the highest percentage of unemployed individuals, with 34.6% or 137 of them being unemployed.
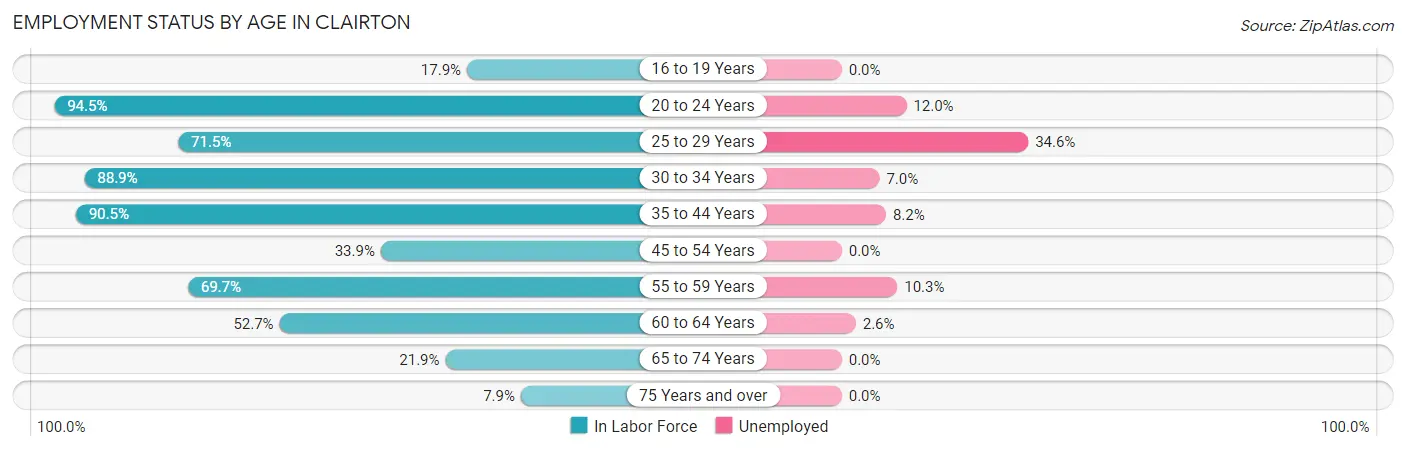
| Age Bracket | In Labor Force | Unemployed |
| 16 to 19 Years | 57 (17.9%) | 0 (0.0%) |
| 20 to 24 Years | 341 (94.5%) | 41 (12.0%) |
| 25 to 29 Years | 396 (71.5%) | 137 (34.6%) |
| 30 to 34 Years | 256 (88.9%) | 18 (7.0%) |
| 35 to 44 Years | 677 (90.5%) | 56 (8.2%) |
| 45 to 54 Years | 167 (33.9%) | 0 (0.0%) |
| 55 to 59 Years | 272 (69.7%) | 28 (10.3%) |
| 60 to 64 Years | 312 (52.7%) | 8 (2.6%) |
| 65 to 74 Years | 187 (21.9%) | 0 (0.0%) |
| 75 Years and over | 42 (7.9%) | 0 (0.0%) |
| Total | 2,705 (52.7%) | 287 (10.6%) |
Employment Status by Educational Attainment in Clairton
According to labor force statistics for Clairton, 67.9% of individuals (2,080) out of the total population between 25 and 64 years of age (3,064) are in the labor force, with 11.9% or 248 of them being unemployed. The group with the highest labor force participation rate are those with the educational attainment of bachelor's degree or higher, with 80.2% or 401 individuals in the labor force. Within the labor force, individuals with college / associate degree education have the highest percentage of unemployment, with 16.8% or 151 of them being unemployed.
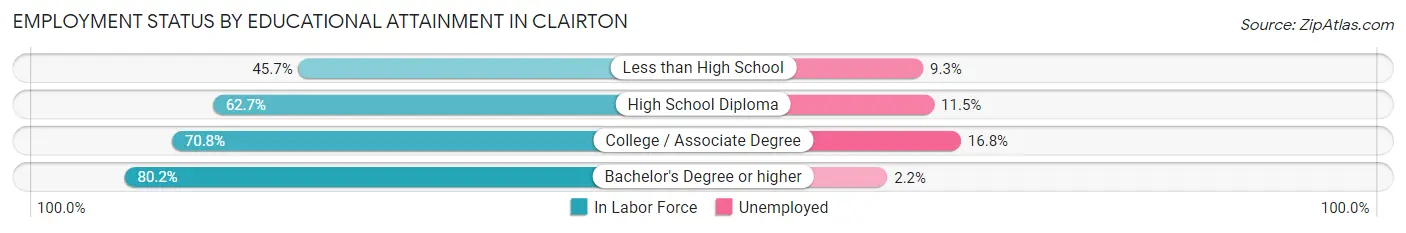
| Educational Attainment | In Labor Force | Unemployed |
| Less than High School | 86 (45.7%) | 17 (9.3%) |
| High School Diploma | 694 (62.7%) | 127 (11.5%) |
| College / Associate Degree | 898 (70.8%) | 213 (16.8%) |
| Bachelor's Degree or higher | 401 (80.2%) | 11 (2.2%) |
| Total | 2,080 (67.9%) | 365 (11.9%) |
Employment Occupations by Sex in Clairton
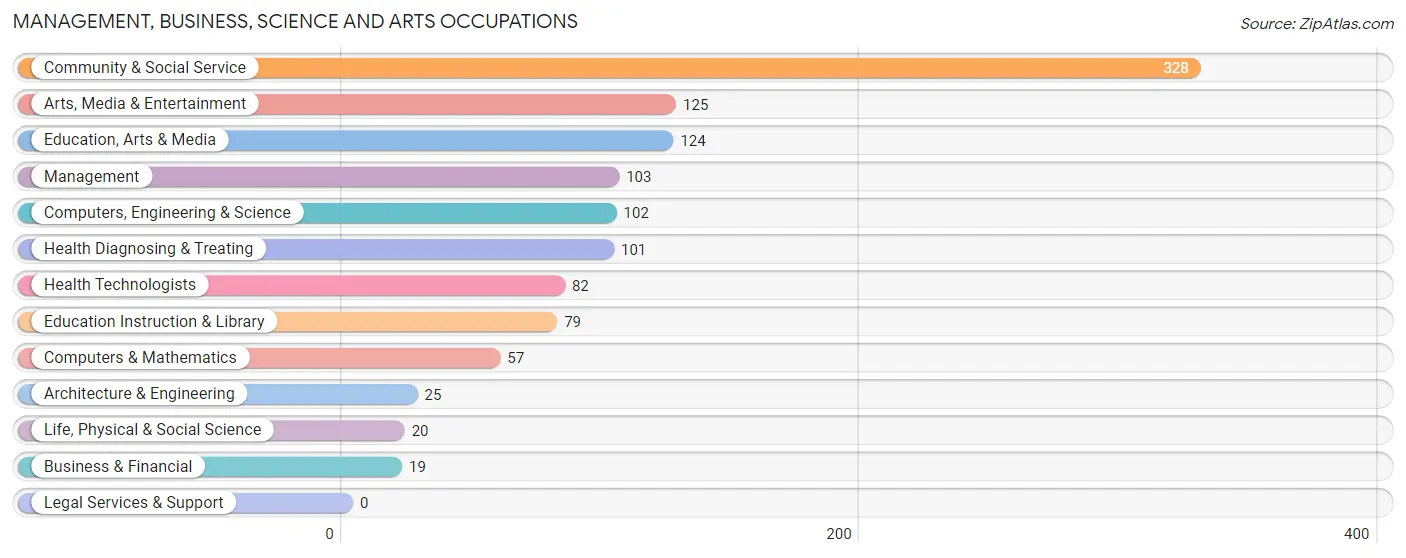
Management, Business, Science and Arts Occupations
The most common Management, Business, Science and Arts occupations in Clairton are Community & Social Service (328 | 13.7%), Arts, Media & Entertainment (125 | 5.2%), Education, Arts & Media (124 | 5.2%), Management (103 | 4.3%), and Computers, Engineering & Science (102 | 4.3%).
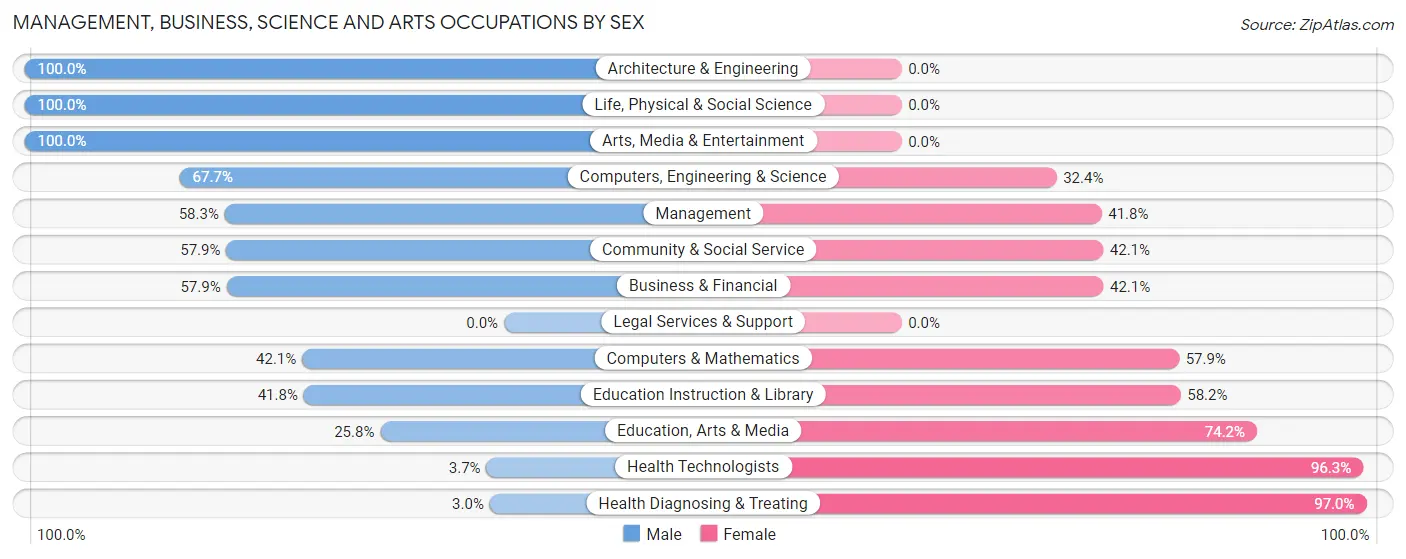
Management, Business, Science and Arts Occupations by Sex
Within the Management, Business, Science and Arts occupations in Clairton, the most male-oriented occupations are Architecture & Engineering (100.0%), Life, Physical & Social Science (100.0%), and Arts, Media & Entertainment (100.0%), while the most female-oriented occupations are Health Diagnosing & Treating (97.0%), Health Technologists (96.3%), and Education, Arts & Media (74.2%).
| Occupation | Male | Female |
| Management | 60 (58.3%) | 43 (41.7%) |
| Business & Financial | 11 (57.9%) | 8 (42.1%) |
| Computers, Engineering & Science | 69 (67.6%) | 33 (32.4%) |
| Computers & Mathematics | 24 (42.1%) | 33 (57.9%) |
| Architecture & Engineering | 25 (100.0%) | 0 (0.0%) |
| Life, Physical & Social Science | 20 (100.0%) | 0 (0.0%) |
| Community & Social Service | 190 (57.9%) | 138 (42.1%) |
| Education, Arts & Media | 32 (25.8%) | 92 (74.2%) |
| Legal Services & Support | 0 (0.0%) | 0 (0.0%) |
| Education Instruction & Library | 33 (41.8%) | 46 (58.2%) |
| Arts, Media & Entertainment | 125 (100.0%) | 0 (0.0%) |
| Health Diagnosing & Treating | 3 (3.0%) | 98 (97.0%) |
| Health Technologists | 3 (3.7%) | 79 (96.3%) |
| Total (Category) | 333 (51.0%) | 320 (49.0%) |
| Total (Overall) | 1,335 (55.6%) | 1,067 (44.4%) |
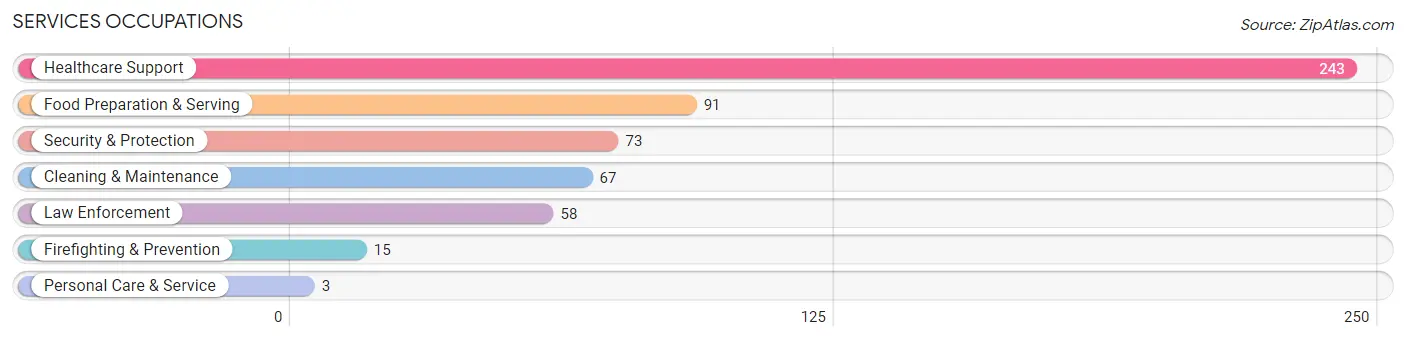
Services Occupations
The most common Services occupations in Clairton are Healthcare Support (243 | 10.1%), Food Preparation & Serving (91 | 3.8%), Security & Protection (73 | 3.0%), Cleaning & Maintenance (67 | 2.8%), and Law Enforcement (58 | 2.4%).
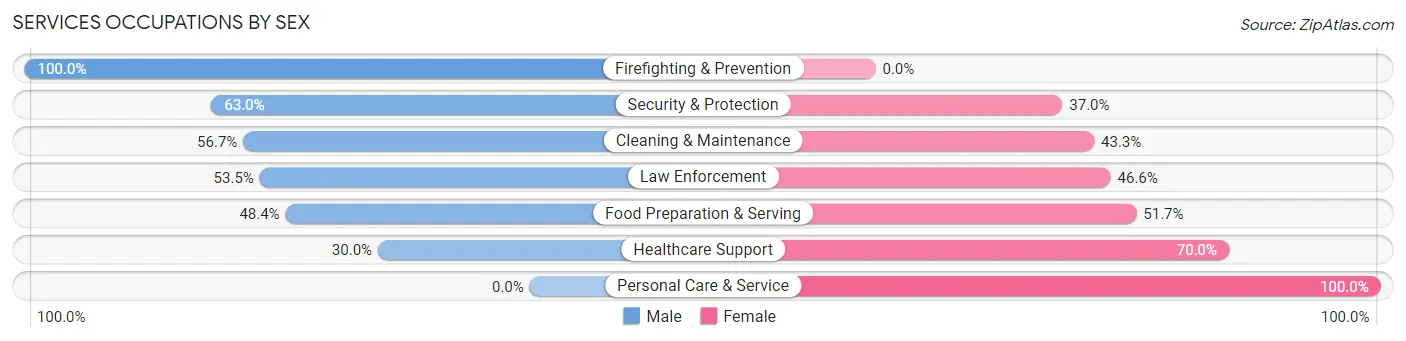
Services Occupations by Sex
Within the Services occupations in Clairton, the most male-oriented occupations are Firefighting & Prevention (100.0%), Security & Protection (63.0%), and Cleaning & Maintenance (56.7%), while the most female-oriented occupations are Personal Care & Service (100.0%), Healthcare Support (70.0%), and Food Preparation & Serving (51.6%).
| Occupation | Male | Female |
| Healthcare Support | 73 (30.0%) | 170 (70.0%) |
| Security & Protection | 46 (63.0%) | 27 (37.0%) |
| Firefighting & Prevention | 15 (100.0%) | 0 (0.0%) |
| Law Enforcement | 31 (53.4%) | 27 (46.6%) |
| Food Preparation & Serving | 44 (48.3%) | 47 (51.6%) |
| Cleaning & Maintenance | 38 (56.7%) | 29 (43.3%) |
| Personal Care & Service | 0 (0.0%) | 3 (100.0%) |
| Total (Category) | 201 (42.1%) | 276 (57.9%) |
| Total (Overall) | 1,335 (55.6%) | 1,067 (44.4%) |
Sales and Office Occupations
The most common Sales and Office occupations in Clairton are Office & Administration (490 | 20.4%), and Sales & Related (109 | 4.5%).
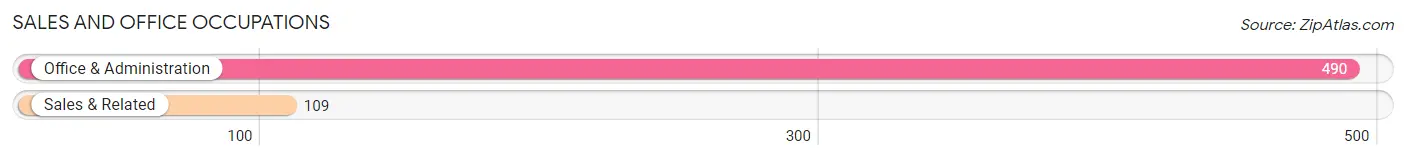
Sales and Office Occupations by Sex
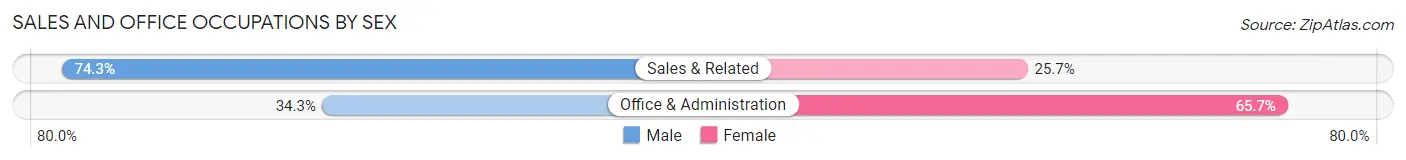
| Occupation | Male | Female |
| Sales & Related | 81 (74.3%) | 28 (25.7%) |
| Office & Administration | 168 (34.3%) | 322 (65.7%) |
| Total (Category) | 249 (41.6%) | 350 (58.4%) |
| Total (Overall) | 1,335 (55.6%) | 1,067 (44.4%) |
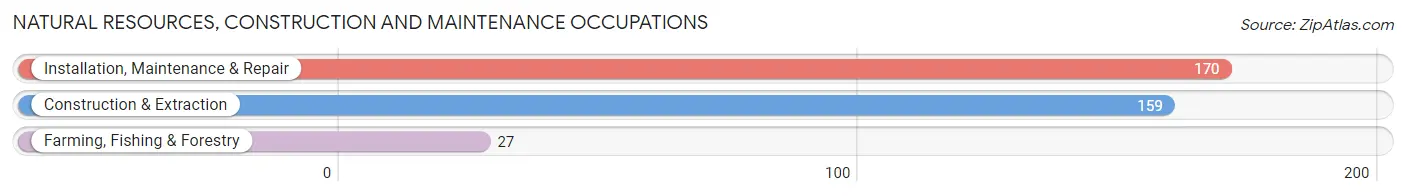
Natural Resources, Construction and Maintenance Occupations
The most common Natural Resources, Construction and Maintenance occupations in Clairton are Installation, Maintenance & Repair (170 | 7.1%), Construction & Extraction (159 | 6.6%), and Farming, Fishing & Forestry (27 | 1.1%).
Natural Resources, Construction and Maintenance Occupations by Sex
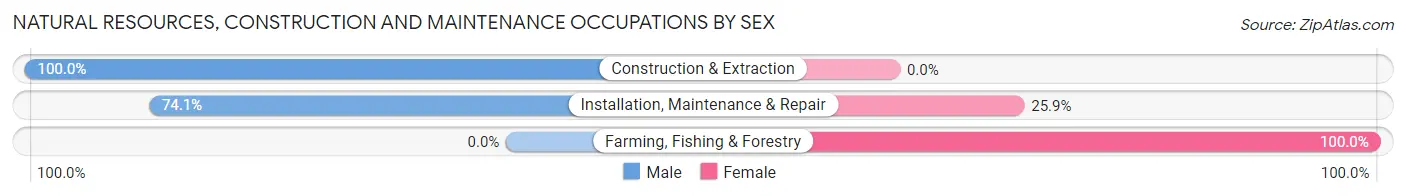
| Occupation | Male | Female |
| Farming, Fishing & Forestry | 0 (0.0%) | 27 (100.0%) |
| Construction & Extraction | 159 (100.0%) | 0 (0.0%) |
| Installation, Maintenance & Repair | 126 (74.1%) | 44 (25.9%) |
| Total (Category) | 285 (80.1%) | 71 (19.9%) |
| Total (Overall) | 1,335 (55.6%) | 1,067 (44.4%) |
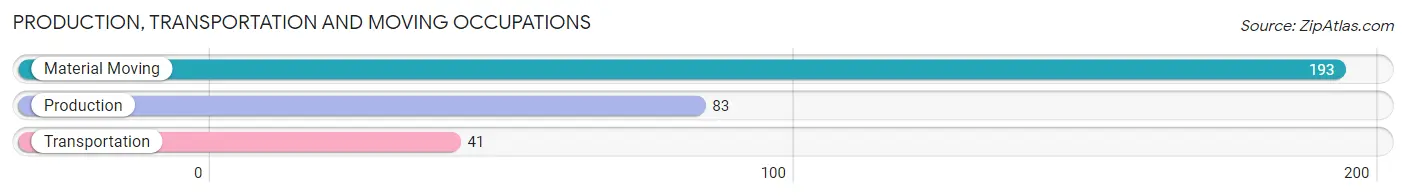
Production, Transportation and Moving Occupations
The most common Production, Transportation and Moving occupations in Clairton are Material Moving (193 | 8.0%), Production (83 | 3.5%), and Transportation (41 | 1.7%).
Production, Transportation and Moving Occupations by Sex
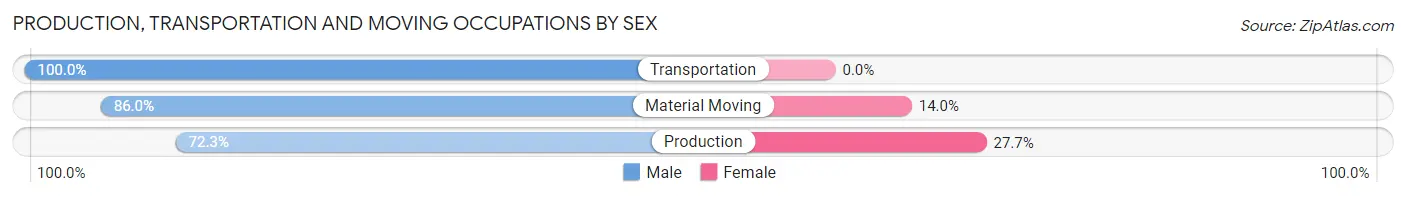
| Occupation | Male | Female |
| Production | 60 (72.3%) | 23 (27.7%) |
| Transportation | 41 (100.0%) | 0 (0.0%) |
| Material Moving | 166 (86.0%) | 27 (14.0%) |
| Total (Category) | 267 (84.2%) | 50 (15.8%) |
| Total (Overall) | 1,335 (55.6%) | 1,067 (44.4%) |
Employment Industries by Sex in Clairton
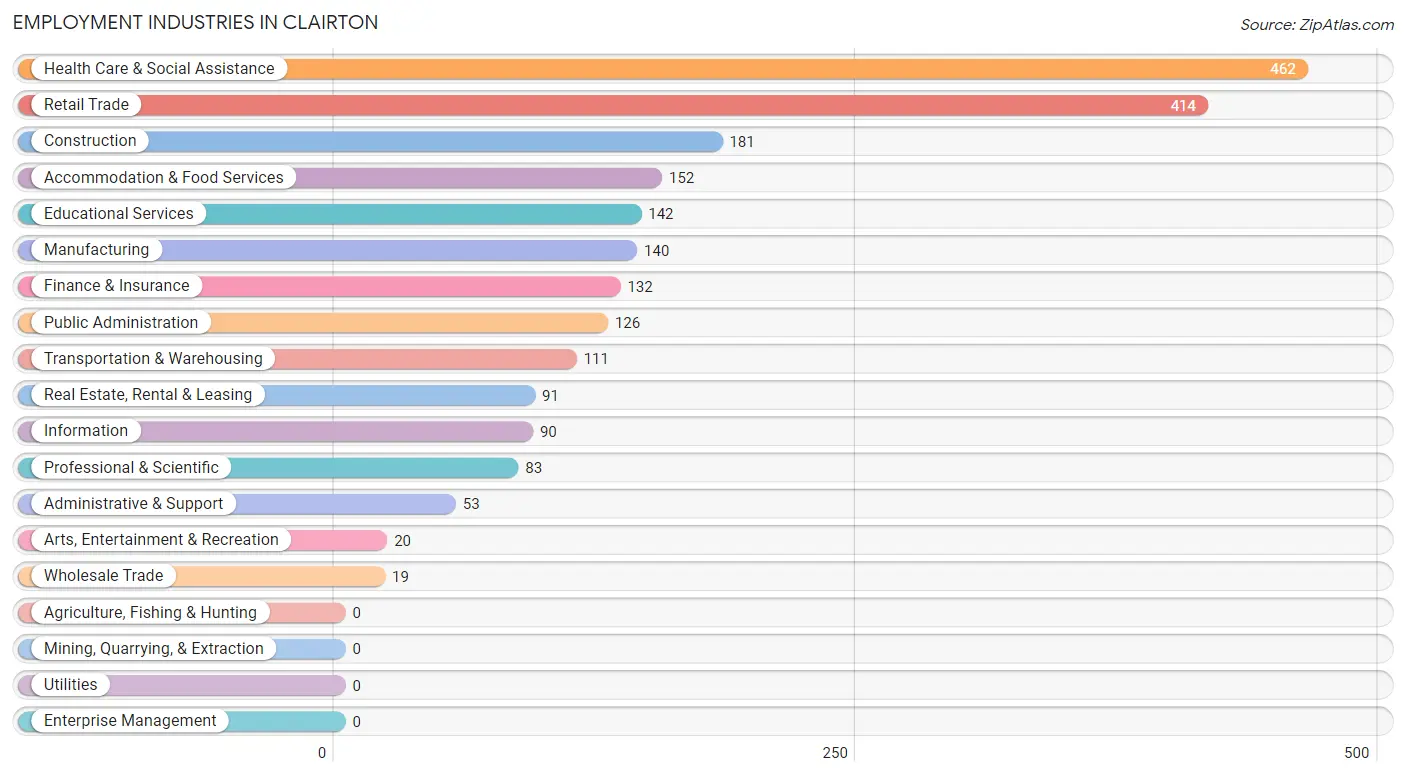
Employment Industries in Clairton
The major employment industries in Clairton include Health Care & Social Assistance (462 | 19.2%), Retail Trade (414 | 17.2%), Construction (181 | 7.5%), Accommodation & Food Services (152 | 6.3%), and Educational Services (142 | 5.9%).
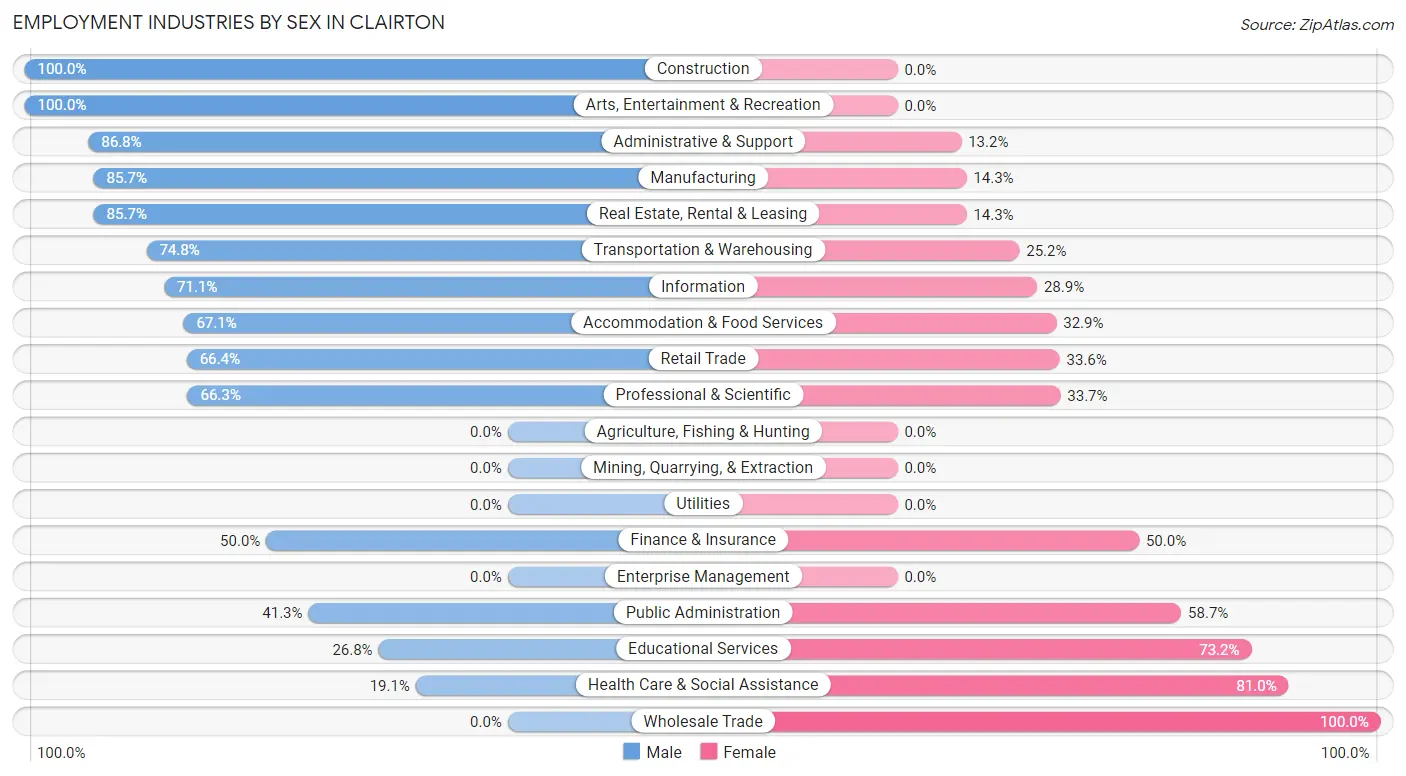
Employment Industries by Sex in Clairton
The Clairton industries that see more men than women are Construction (100.0%), Arts, Entertainment & Recreation (100.0%), and Administrative & Support (86.8%), whereas the industries that tend to have a higher number of women are Wholesale Trade (100.0%), Health Care & Social Assistance (80.9%), and Educational Services (73.2%).
| Industry | Male | Female |
| Agriculture, Fishing & Hunting | 0 (0.0%) | 0 (0.0%) |
| Mining, Quarrying, & Extraction | 0 (0.0%) | 0 (0.0%) |
| Construction | 181 (100.0%) | 0 (0.0%) |
| Manufacturing | 120 (85.7%) | 20 (14.3%) |
| Wholesale Trade | 0 (0.0%) | 19 (100.0%) |
| Retail Trade | 275 (66.4%) | 139 (33.6%) |
| Transportation & Warehousing | 83 (74.8%) | 28 (25.2%) |
| Utilities | 0 (0.0%) | 0 (0.0%) |
| Information | 64 (71.1%) | 26 (28.9%) |
| Finance & Insurance | 66 (50.0%) | 66 (50.0%) |
| Real Estate, Rental & Leasing | 78 (85.7%) | 13 (14.3%) |
| Professional & Scientific | 55 (66.3%) | 28 (33.7%) |
| Enterprise Management | 0 (0.0%) | 0 (0.0%) |
| Administrative & Support | 46 (86.8%) | 7 (13.2%) |
| Educational Services | 38 (26.8%) | 104 (73.2%) |
| Health Care & Social Assistance | 88 (19.1%) | 374 (80.9%) |
| Arts, Entertainment & Recreation | 20 (100.0%) | 0 (0.0%) |
| Accommodation & Food Services | 102 (67.1%) | 50 (32.9%) |
| Public Administration | 52 (41.3%) | 74 (58.7%) |
| Total | 1,335 (55.6%) | 1,067 (44.4%) |
Education in Clairton
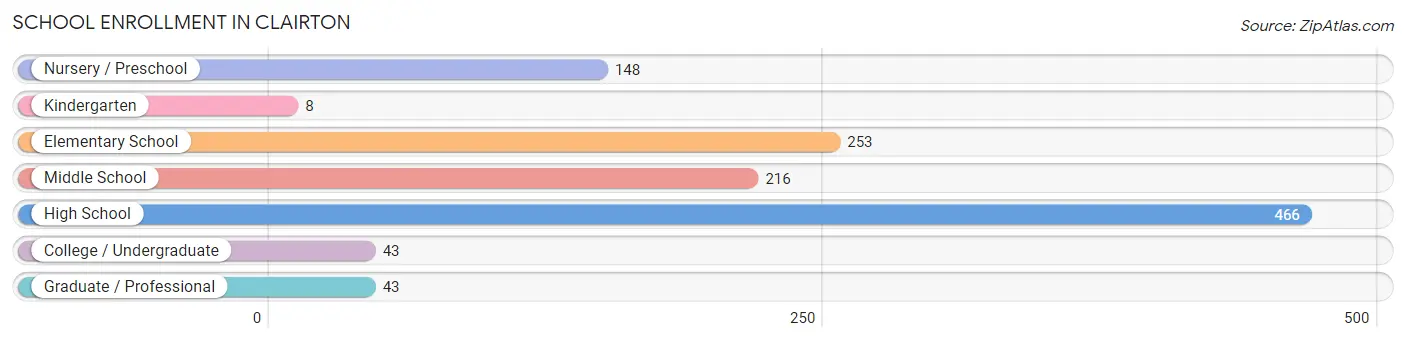
School Enrollment in Clairton
The most common levels of schooling among the 1,177 students in Clairton are high school (466 | 39.6%), elementary school (253 | 21.5%), and middle school (216 | 18.3%).
| School Level | # Students | % Students |
| Nursery / Preschool | 148 | 12.6% |
| Kindergarten | 8 | 0.7% |
| Elementary School | 253 | 21.5% |
| Middle School | 216 | 18.3% |
| High School | 466 | 39.6% |
| College / Undergraduate | 43 | 3.6% |
| Graduate / Professional | 43 | 3.6% |
| Total | 1,177 | 100.0% |
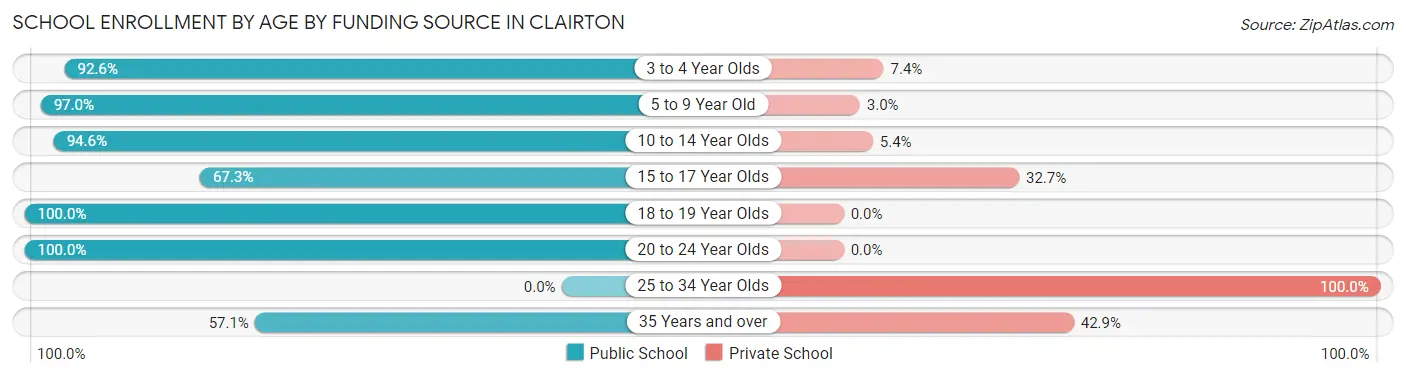
School Enrollment by Age by Funding Source in Clairton
Out of a total of 1,177 students who are enrolled in schools in Clairton, 142 (12.1%) attend a private institution, while the remaining 1,035 (87.9%) are enrolled in public schools. The age group of 25 to 34 year olds has the highest likelihood of being enrolled in private schools, with 8 (100.0% in the age bracket) enrolled. Conversely, the age group of 18 to 19 year olds has the lowest likelihood of being enrolled in a private school, with 78 (100.0% in the age bracket) attending a public institution.
| Age Bracket | Public School | Private School |
| 3 to 4 Year Olds | 112 (92.6%) | 9 (7.4%) |
| 5 to 9 Year Old | 258 (97.0%) | 8 (3.0%) |
| 10 to 14 Year Olds | 348 (94.6%) | 20 (5.4%) |
| 15 to 17 Year Olds | 169 (67.3%) | 82 (32.7%) |
| 18 to 19 Year Olds | 78 (100.0%) | 0 (0.0%) |
| 20 to 24 Year Olds | 50 (100.0%) | 0 (0.0%) |
| 25 to 34 Year Olds | 0 (0.0%) | 8 (100.0%) |
| 35 Years and over | 20 (57.1%) | 15 (42.9%) |
| Total | 1,035 (87.9%) | 142 (12.1%) |
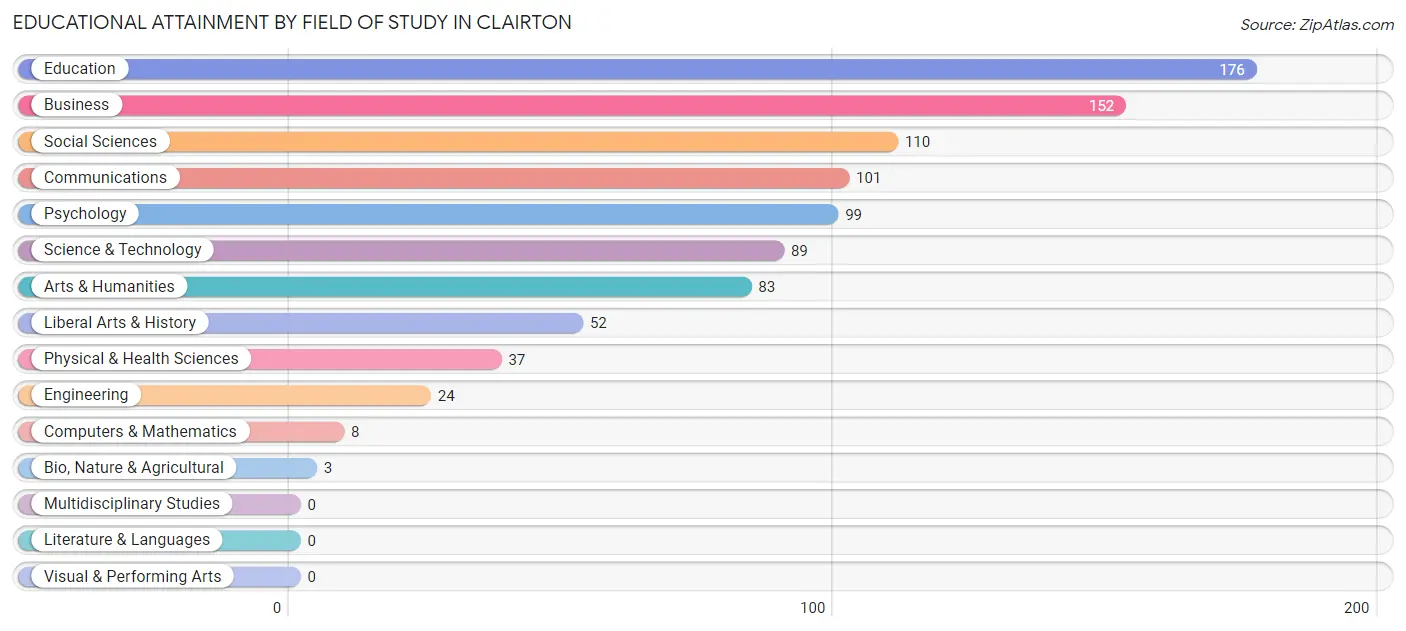
Educational Attainment by Field of Study in Clairton
Education (176 | 18.8%), business (152 | 16.3%), social sciences (110 | 11.8%), communications (101 | 10.8%), and psychology (99 | 10.6%) are the most common fields of study among 934 individuals in Clairton who have obtained a bachelor's degree or higher.
| Field of Study | # Graduates | % Graduates |
| Computers & Mathematics | 8 | 0.9% |
| Bio, Nature & Agricultural | 3 | 0.3% |
| Physical & Health Sciences | 37 | 4.0% |
| Psychology | 99 | 10.6% |
| Social Sciences | 110 | 11.8% |
| Engineering | 24 | 2.6% |
| Multidisciplinary Studies | 0 | 0.0% |
| Science & Technology | 89 | 9.5% |
| Business | 152 | 16.3% |
| Education | 176 | 18.8% |
| Literature & Languages | 0 | 0.0% |
| Liberal Arts & History | 52 | 5.6% |
| Visual & Performing Arts | 0 | 0.0% |
| Communications | 101 | 10.8% |
| Arts & Humanities | 83 | 8.9% |
| Total | 934 | 100.0% |
Transportation & Commute in Clairton
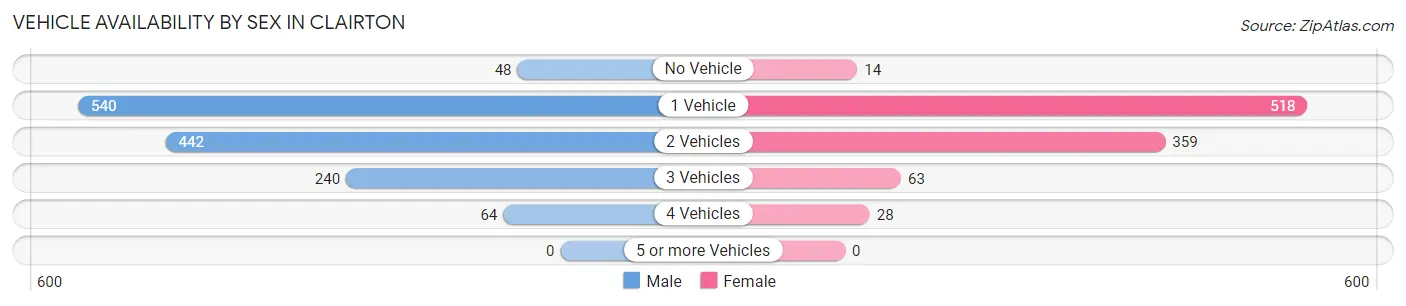
Vehicle Availability by Sex in Clairton
The most prevalent vehicle ownership categories in Clairton are males with 1 vehicle (540, accounting for 40.5%) and females with 1 vehicle (518, making up 55.0%).
| Vehicles Available | Male | Female |
| No Vehicle | 48 (3.6%) | 14 (1.4%) |
| 1 Vehicle | 540 (40.5%) | 518 (52.7%) |
| 2 Vehicles | 442 (33.1%) | 359 (36.6%) |
| 3 Vehicles | 240 (18.0%) | 63 (6.4%) |
| 4 Vehicles | 64 (4.8%) | 28 (2.9%) |
| 5 or more Vehicles | 0 (0.0%) | 0 (0.0%) |
| Total | 1,334 (100.0%) | 982 (100.0%) |
Commute Time in Clairton
The most frequently occuring commute durations in Clairton are 30 to 34 minutes (433 commuters, 20.7%), 45 to 59 minutes (312 commuters, 14.9%), and 15 to 19 minutes (282 commuters, 13.5%).
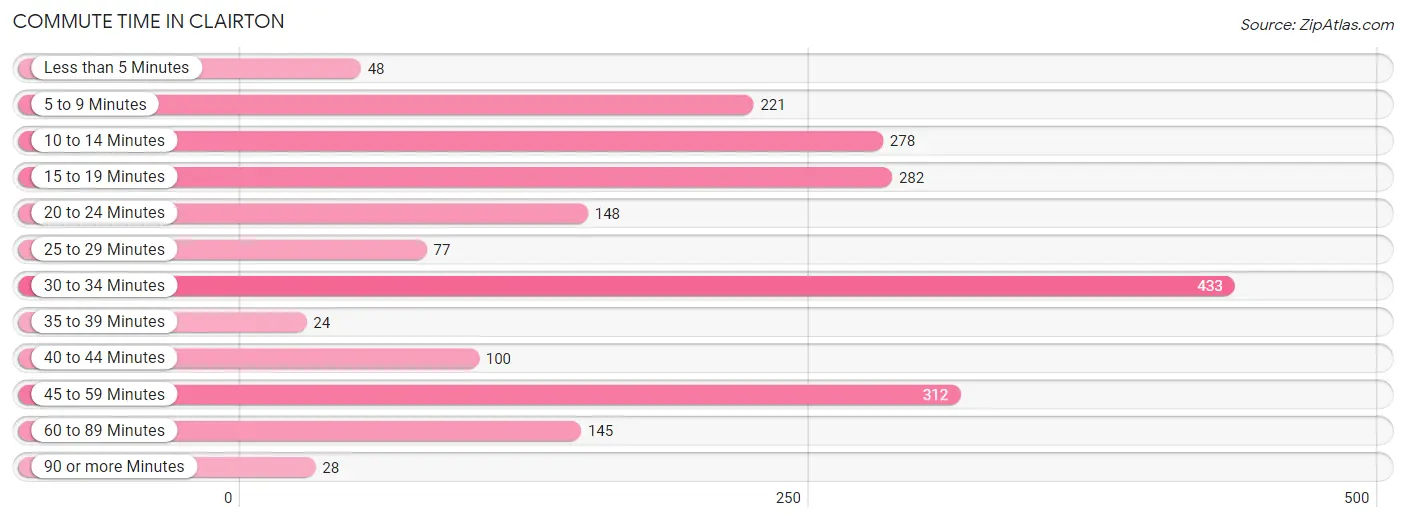
| Commute Time | # Commuters | % Commuters |
| Less than 5 Minutes | 48 | 2.3% |
| 5 to 9 Minutes | 221 | 10.5% |
| 10 to 14 Minutes | 278 | 13.3% |
| 15 to 19 Minutes | 282 | 13.5% |
| 20 to 24 Minutes | 148 | 7.1% |
| 25 to 29 Minutes | 77 | 3.7% |
| 30 to 34 Minutes | 433 | 20.7% |
| 35 to 39 Minutes | 24 | 1.1% |
| 40 to 44 Minutes | 100 | 4.8% |
| 45 to 59 Minutes | 312 | 14.9% |
| 60 to 89 Minutes | 145 | 6.9% |
| 90 or more Minutes | 28 | 1.3% |
Commute Time by Sex in Clairton
The most common commute times in Clairton are 30 to 34 minutes (305 commuters, 25.0%) for males and 10 to 14 minutes (159 commuters, 18.1%) for females.
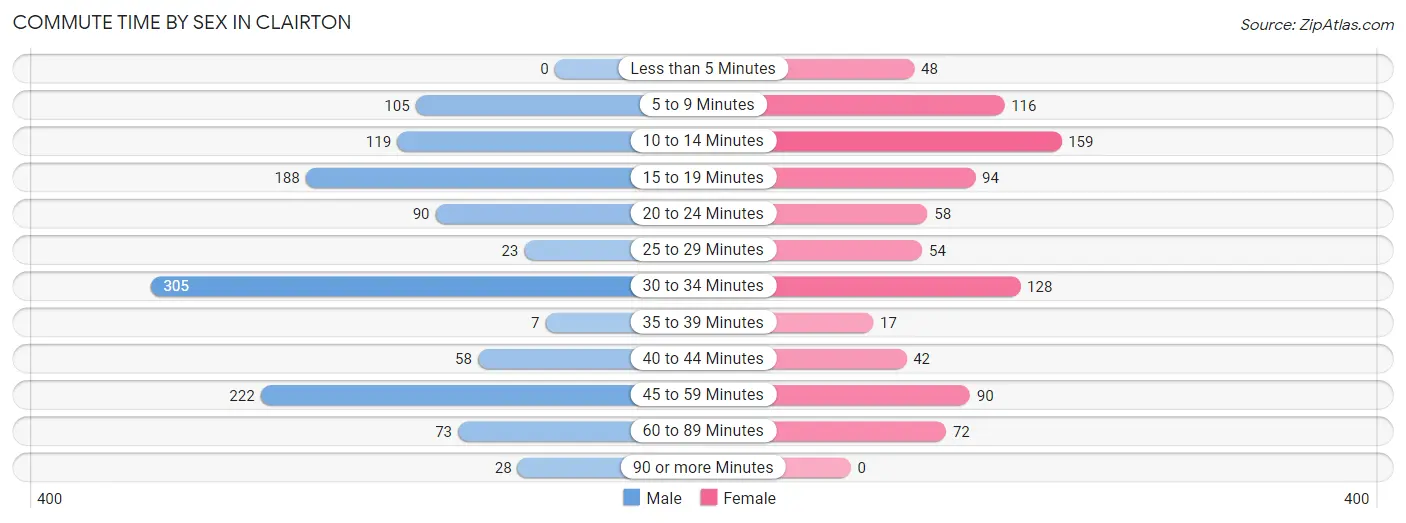
| Commute Time | Male | Female |
| Less than 5 Minutes | 0 (0.0%) | 48 (5.5%) |
| 5 to 9 Minutes | 105 (8.6%) | 116 (13.2%) |
| 10 to 14 Minutes | 119 (9.8%) | 159 (18.1%) |
| 15 to 19 Minutes | 188 (15.4%) | 94 (10.7%) |
| 20 to 24 Minutes | 90 (7.4%) | 58 (6.6%) |
| 25 to 29 Minutes | 23 (1.9%) | 54 (6.1%) |
| 30 to 34 Minutes | 305 (25.0%) | 128 (14.6%) |
| 35 to 39 Minutes | 7 (0.6%) | 17 (1.9%) |
| 40 to 44 Minutes | 58 (4.8%) | 42 (4.8%) |
| 45 to 59 Minutes | 222 (18.2%) | 90 (10.2%) |
| 60 to 89 Minutes | 73 (6.0%) | 72 (8.2%) |
| 90 or more Minutes | 28 (2.3%) | 0 (0.0%) |
Time of Departure to Work by Sex in Clairton
The most frequent times of departure to work in Clairton are 12:00 PM to 3:59 PM (212, 17.4%) for males and 7:00 AM to 7:29 AM (181, 20.6%) for females.
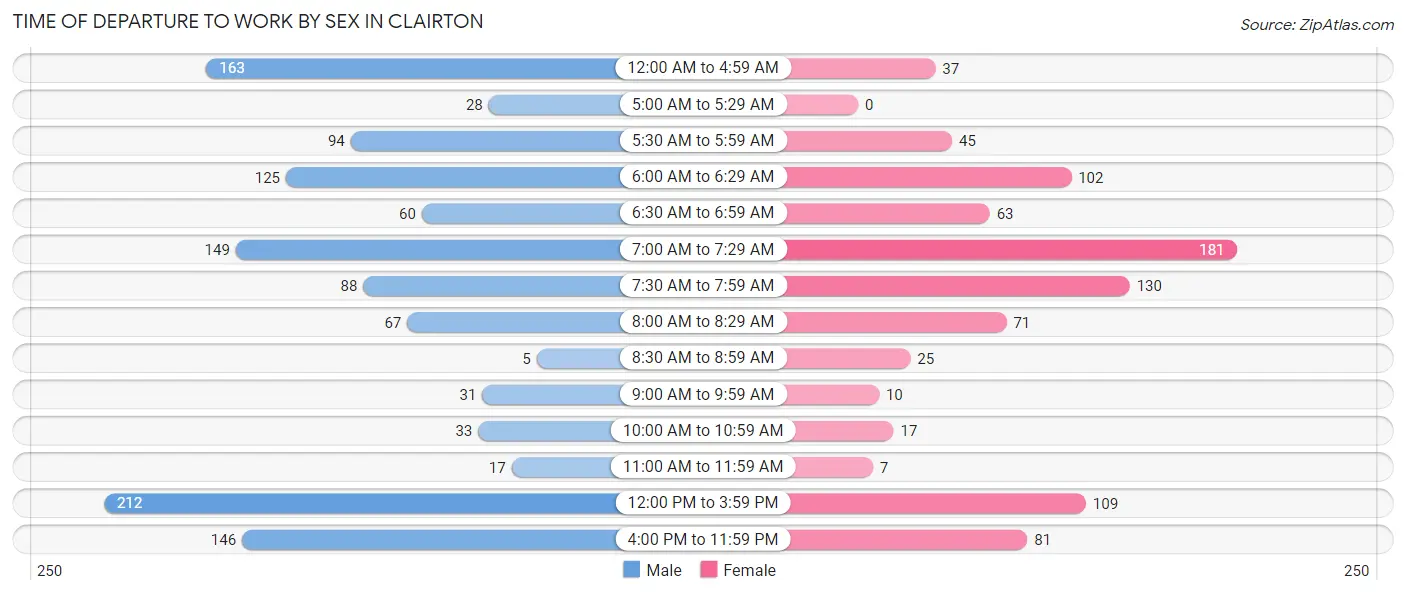
| Time of Departure | Male | Female |
| 12:00 AM to 4:59 AM | 163 (13.4%) | 37 (4.2%) |
| 5:00 AM to 5:29 AM | 28 (2.3%) | 0 (0.0%) |
| 5:30 AM to 5:59 AM | 94 (7.7%) | 45 (5.1%) |
| 6:00 AM to 6:29 AM | 125 (10.3%) | 102 (11.6%) |
| 6:30 AM to 6:59 AM | 60 (4.9%) | 63 (7.2%) |
| 7:00 AM to 7:29 AM | 149 (12.2%) | 181 (20.6%) |
| 7:30 AM to 7:59 AM | 88 (7.2%) | 130 (14.8%) |
| 8:00 AM to 8:29 AM | 67 (5.5%) | 71 (8.1%) |
| 8:30 AM to 8:59 AM | 5 (0.4%) | 25 (2.9%) |
| 9:00 AM to 9:59 AM | 31 (2.5%) | 10 (1.1%) |
| 10:00 AM to 10:59 AM | 33 (2.7%) | 17 (1.9%) |
| 11:00 AM to 11:59 AM | 17 (1.4%) | 7 (0.8%) |
| 12:00 PM to 3:59 PM | 212 (17.4%) | 109 (12.4%) |
| 4:00 PM to 11:59 PM | 146 (12.0%) | 81 (9.2%) |
| Total | 1,218 (100.0%) | 878 (100.0%) |
Housing Occupancy in Clairton
Occupancy by Ownership in Clairton
Of the total 2,747 dwellings in Clairton, owner-occupied units account for 1,640 (59.7%), while renter-occupied units make up 1,107 (40.3%).
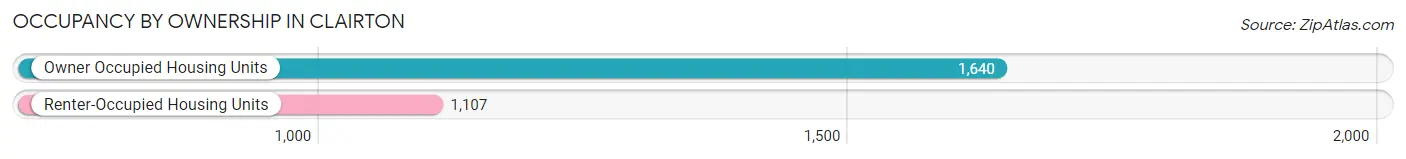
| Occupancy | # Housing Units | % Housing Units |
| Owner Occupied Housing Units | 1,640 | 59.7% |
| Renter-Occupied Housing Units | 1,107 | 40.3% |
| Total Occupied Housing Units | 2,747 | 100.0% |
Occupancy by Household Size in Clairton
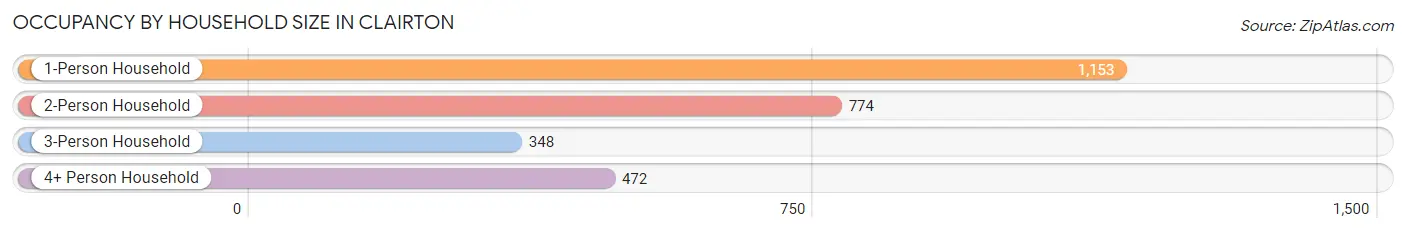
| Household Size | # Housing Units | % Housing Units |
| 1-Person Household | 1,153 | 42.0% |
| 2-Person Household | 774 | 28.2% |
| 3-Person Household | 348 | 12.7% |
| 4+ Person Household | 472 | 17.2% |
| Total Housing Units | 2,747 | 100.0% |
Occupancy by Ownership by Household Size in Clairton
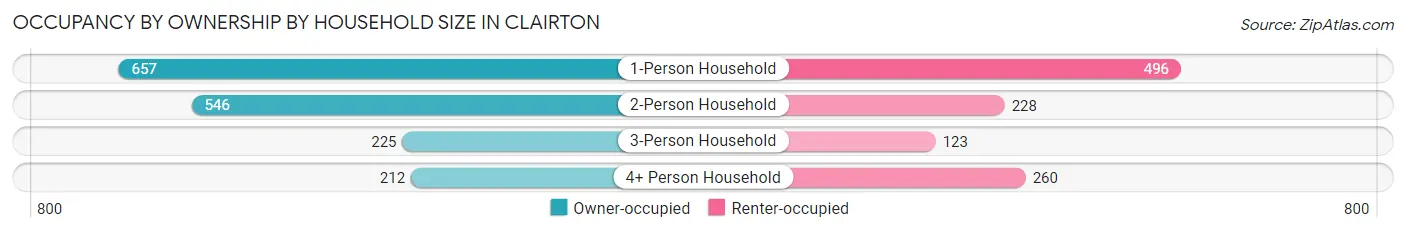
| Household Size | Owner-occupied | Renter-occupied |
| 1-Person Household | 657 (57.0%) | 496 (43.0%) |
| 2-Person Household | 546 (70.5%) | 228 (29.5%) |
| 3-Person Household | 225 (64.7%) | 123 (35.3%) |
| 4+ Person Household | 212 (44.9%) | 260 (55.1%) |
| Total Housing Units | 1,640 (59.7%) | 1,107 (40.3%) |
Occupancy by Educational Attainment in Clairton
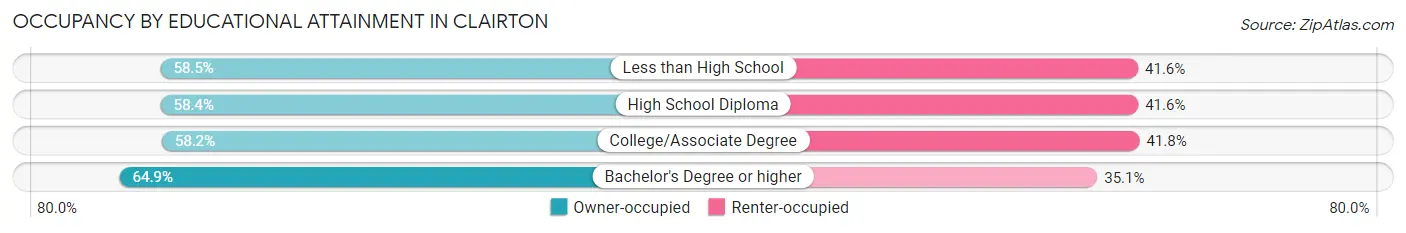
| Household Size | Owner-occupied | Renter-occupied |
| Less than High School | 83 (58.5%) | 59 (41.5%) |
| High School Diploma | 558 (58.4%) | 397 (41.6%) |
| College/Associate Degree | 627 (58.2%) | 450 (41.8%) |
| Bachelor's Degree or higher | 372 (64.9%) | 201 (35.1%) |
Occupancy by Age of Householder in Clairton
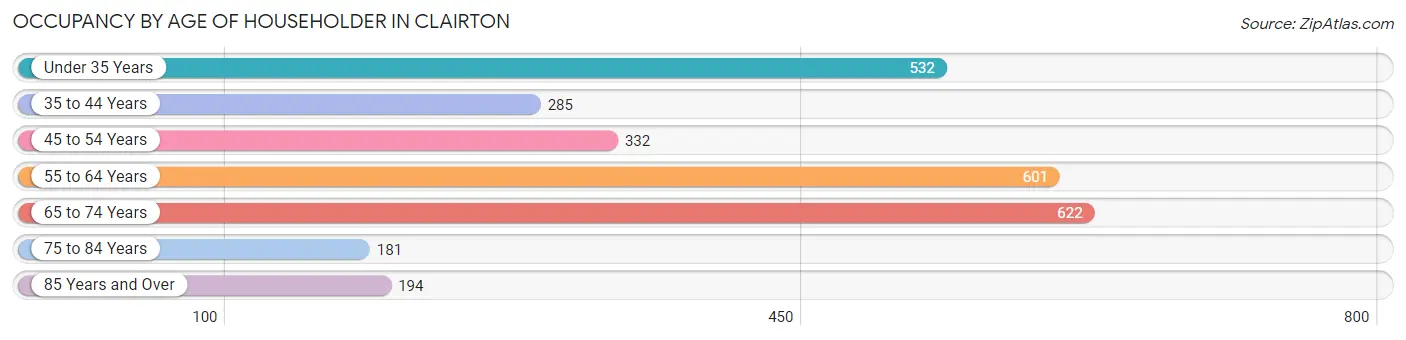
| Age Bracket | # Households | % Households |
| Under 35 Years | 532 | 19.4% |
| 35 to 44 Years | 285 | 10.4% |
| 45 to 54 Years | 332 | 12.1% |
| 55 to 64 Years | 601 | 21.9% |
| 65 to 74 Years | 622 | 22.6% |
| 75 to 84 Years | 181 | 6.6% |
| 85 Years and Over | 194 | 7.1% |
| Total | 2,747 | 100.0% |
Housing Finances in Clairton
Median Income by Occupancy in Clairton
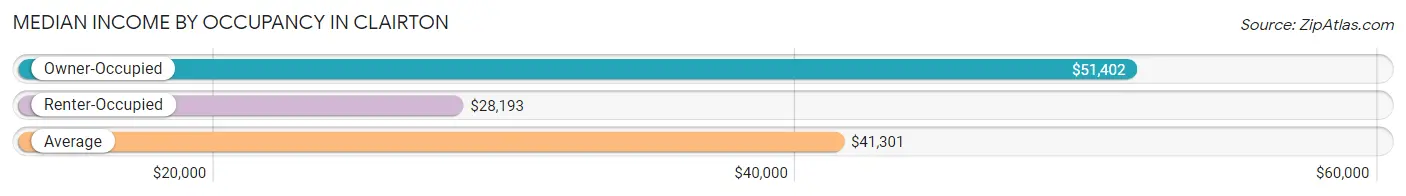
| Occupancy Type | # Households | Median Income |
| Owner-Occupied | 1,640 (59.7%) | $51,402 |
| Renter-Occupied | 1,107 (40.3%) | $28,193 |
| Average | 2,747 (100.0%) | $41,301 |
Occupancy by Householder Income Bracket in Clairton
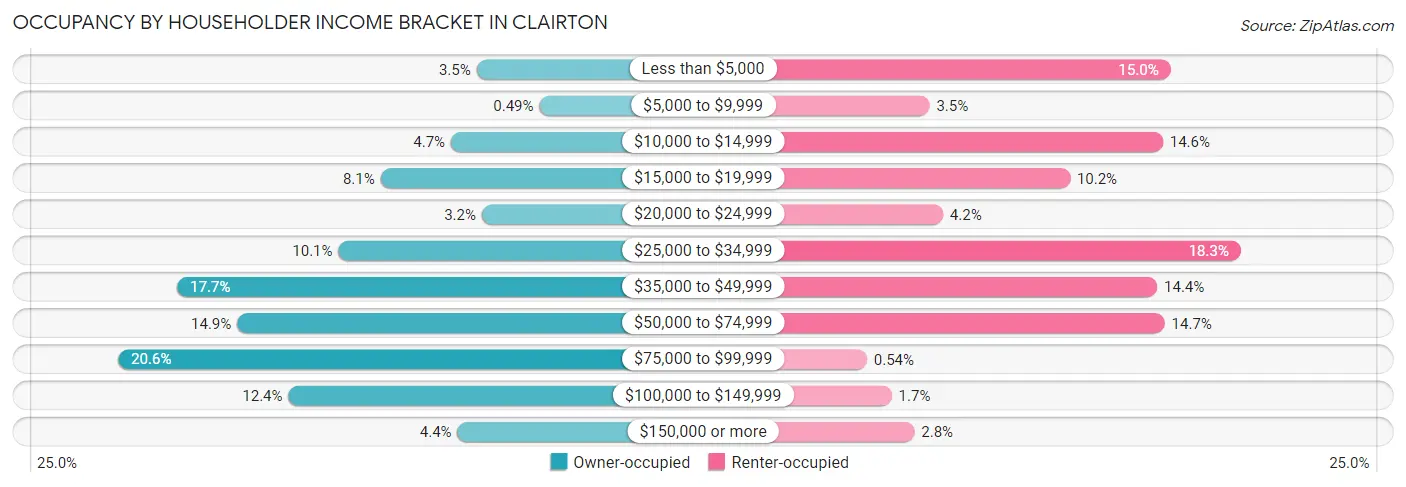
| Income Bracket | Owner-occupied | Renter-occupied |
| Less than $5,000 | 57 (3.5%) | 166 (15.0%) |
| $5,000 to $9,999 | 8 (0.5%) | 39 (3.5%) |
| $10,000 to $14,999 | 77 (4.7%) | 162 (14.6%) |
| $15,000 to $19,999 | 132 (8.1%) | 113 (10.2%) |
| $20,000 to $24,999 | 53 (3.2%) | 46 (4.2%) |
| $25,000 to $34,999 | 165 (10.1%) | 203 (18.3%) |
| $35,000 to $49,999 | 291 (17.7%) | 159 (14.4%) |
| $50,000 to $74,999 | 244 (14.9%) | 163 (14.7%) |
| $75,000 to $99,999 | 337 (20.5%) | 6 (0.5%) |
| $100,000 to $149,999 | 204 (12.4%) | 19 (1.7%) |
| $150,000 or more | 72 (4.4%) | 31 (2.8%) |
| Total | 1,640 (100.0%) | 1,107 (100.0%) |
Monthly Housing Cost Tiers in Clairton
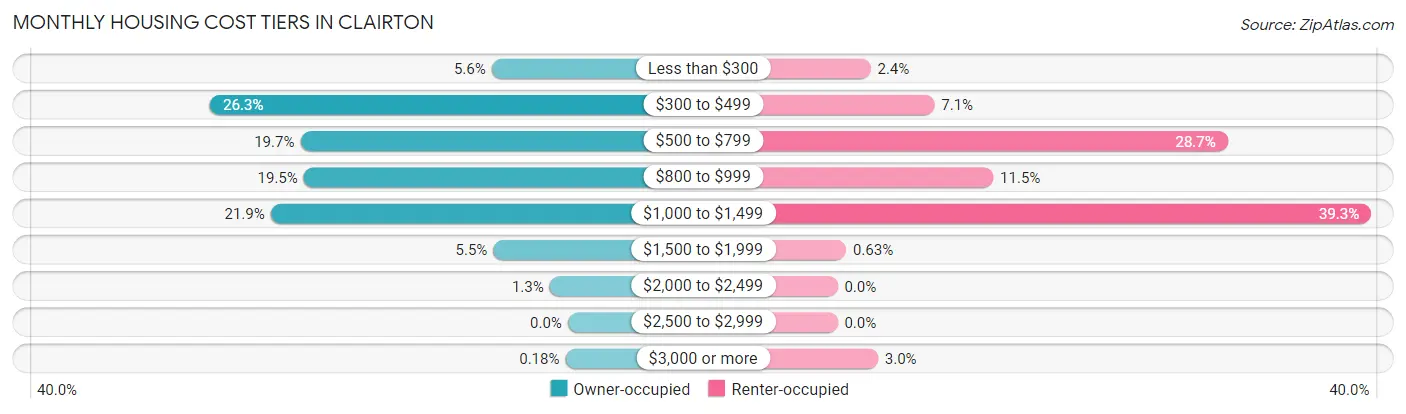
| Monthly Cost | Owner-occupied | Renter-occupied |
| Less than $300 | 92 (5.6%) | 27 (2.4%) |
| $300 to $499 | 432 (26.3%) | 79 (7.1%) |
| $500 to $799 | 323 (19.7%) | 318 (28.7%) |
| $800 to $999 | 319 (19.5%) | 127 (11.5%) |
| $1,000 to $1,499 | 359 (21.9%) | 435 (39.3%) |
| $1,500 to $1,999 | 90 (5.5%) | 7 (0.6%) |
| $2,000 to $2,499 | 22 (1.3%) | 0 (0.0%) |
| $2,500 to $2,999 | 0 (0.0%) | 0 (0.0%) |
| $3,000 or more | 3 (0.2%) | 33 (3.0%) |
| Total | 1,640 (100.0%) | 1,107 (100.0%) |
Physical Housing Characteristics in Clairton
Housing Structures in Clairton
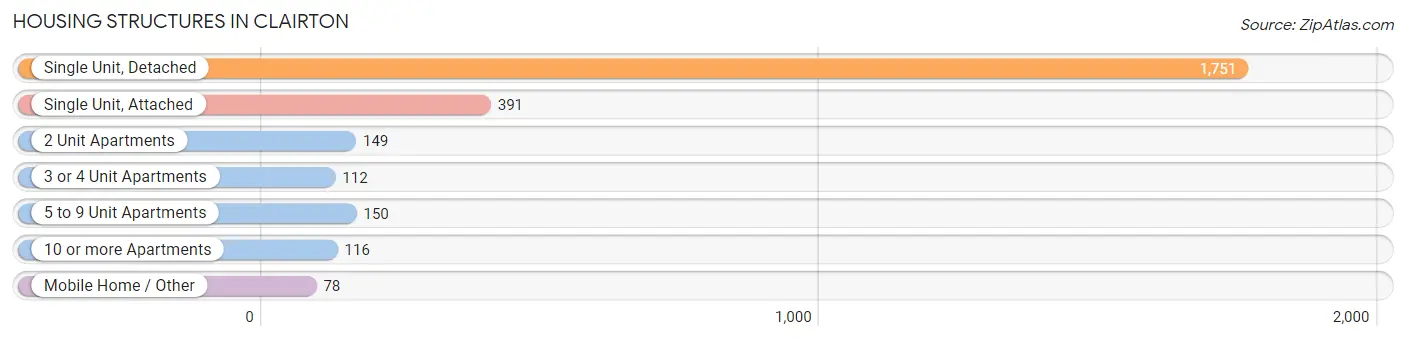
| Structure Type | # Housing Units | % Housing Units |
| Single Unit, Detached | 1,751 | 63.7% |
| Single Unit, Attached | 391 | 14.2% |
| 2 Unit Apartments | 149 | 5.4% |
| 3 or 4 Unit Apartments | 112 | 4.1% |
| 5 to 9 Unit Apartments | 150 | 5.5% |
| 10 or more Apartments | 116 | 4.2% |
| Mobile Home / Other | 78 | 2.8% |
| Total | 2,747 | 100.0% |
Housing Structures by Occupancy in Clairton
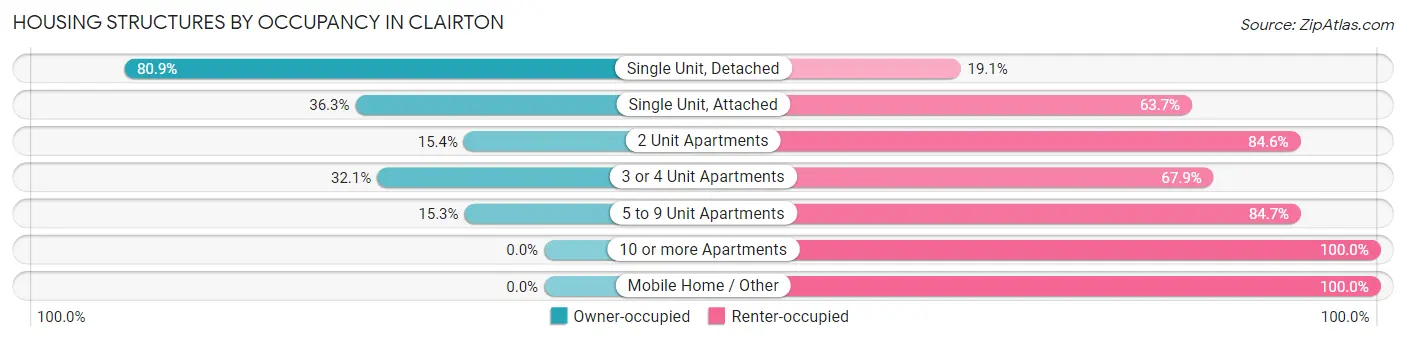
| Structure Type | Owner-occupied | Renter-occupied |
| Single Unit, Detached | 1,416 (80.9%) | 335 (19.1%) |
| Single Unit, Attached | 142 (36.3%) | 249 (63.7%) |
| 2 Unit Apartments | 23 (15.4%) | 126 (84.6%) |
| 3 or 4 Unit Apartments | 36 (32.1%) | 76 (67.9%) |
| 5 to 9 Unit Apartments | 23 (15.3%) | 127 (84.7%) |
| 10 or more Apartments | 0 (0.0%) | 116 (100.0%) |
| Mobile Home / Other | 0 (0.0%) | 78 (100.0%) |
| Total | 1,640 (59.7%) | 1,107 (40.3%) |
Housing Structures by Number of Rooms in Clairton
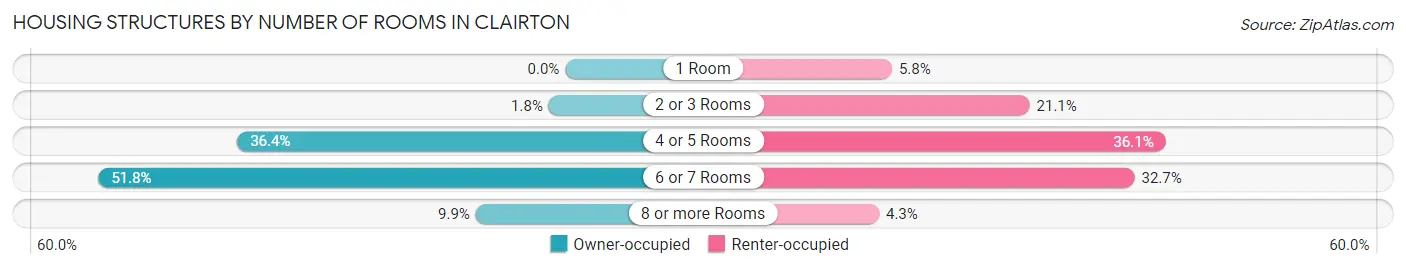
| Number of Rooms | Owner-occupied | Renter-occupied |
| 1 Room | 0 (0.0%) | 64 (5.8%) |
| 2 or 3 Rooms | 30 (1.8%) | 233 (21.0%) |
| 4 or 5 Rooms | 597 (36.4%) | 400 (36.1%) |
| 6 or 7 Rooms | 850 (51.8%) | 362 (32.7%) |
| 8 or more Rooms | 163 (9.9%) | 48 (4.3%) |
| Total | 1,640 (100.0%) | 1,107 (100.0%) |
Housing Structure by Heating Type in Clairton
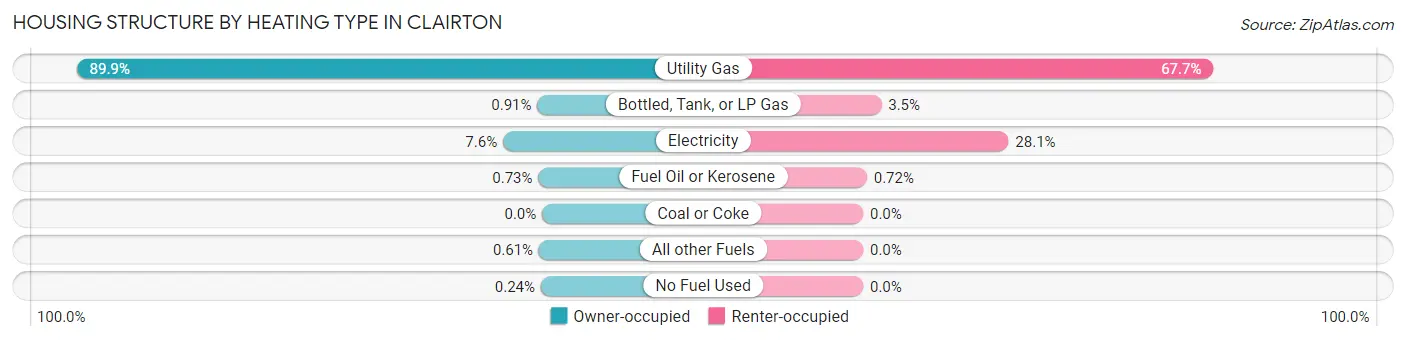
| Heating Type | Owner-occupied | Renter-occupied |
| Utility Gas | 1,475 (89.9%) | 749 (67.7%) |
| Bottled, Tank, or LP Gas | 15 (0.9%) | 39 (3.5%) |
| Electricity | 124 (7.6%) | 311 (28.1%) |
| Fuel Oil or Kerosene | 12 (0.7%) | 8 (0.7%) |
| Coal or Coke | 0 (0.0%) | 0 (0.0%) |
| All other Fuels | 10 (0.6%) | 0 (0.0%) |
| No Fuel Used | 4 (0.2%) | 0 (0.0%) |
| Total | 1,640 (100.0%) | 1,107 (100.0%) |
Household Vehicle Usage in Clairton
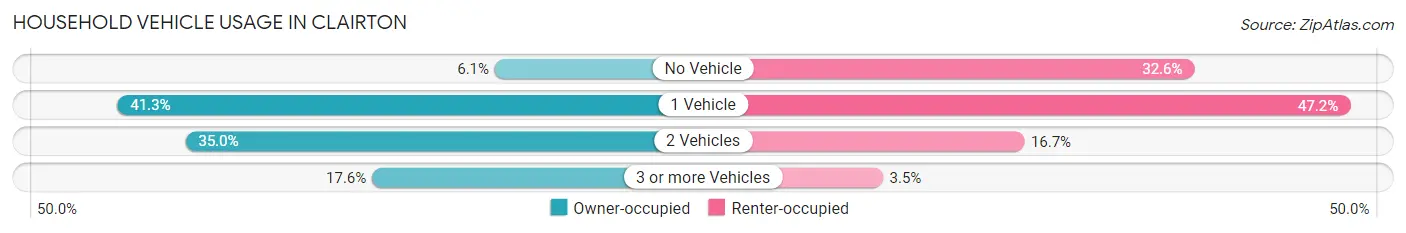
| Vehicles per Household | Owner-occupied | Renter-occupied |
| No Vehicle | 100 (6.1%) | 361 (32.6%) |
| 1 Vehicle | 678 (41.3%) | 522 (47.1%) |
| 2 Vehicles | 574 (35.0%) | 185 (16.7%) |
| 3 or more Vehicles | 288 (17.6%) | 39 (3.5%) |
| Total | 1,640 (100.0%) | 1,107 (100.0%) |
Real Estate & Mortgages in Clairton
Real Estate and Mortgage Overview in Clairton
| Characteristic | Without Mortgage | With Mortgage |
| Housing Units | 649 | 991 |
| Median Property Value | $46,600 | $60,300 |
| Median Household Income | $43,980 | $49 |
| Monthly Housing Costs | $429 | $3 |
| Real Estate Taxes | $908 | $37 |
Property Value by Mortgage Status in Clairton
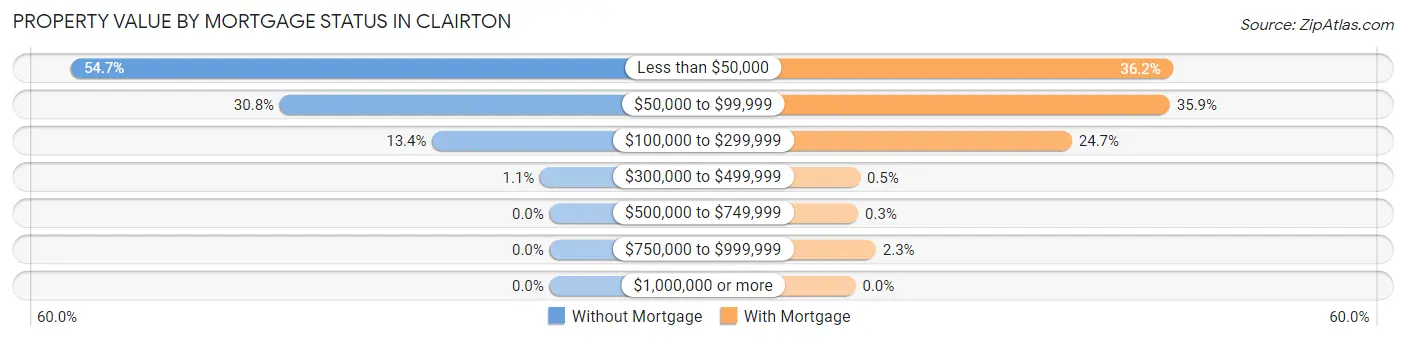
| Property Value | Without Mortgage | With Mortgage |
| Less than $50,000 | 355 (54.7%) | 359 (36.2%) |
| $50,000 to $99,999 | 200 (30.8%) | 356 (35.9%) |
| $100,000 to $299,999 | 87 (13.4%) | 245 (24.7%) |
| $300,000 to $499,999 | 7 (1.1%) | 5 (0.5%) |
| $500,000 to $749,999 | 0 (0.0%) | 3 (0.3%) |
| $750,000 to $999,999 | 0 (0.0%) | 23 (2.3%) |
| $1,000,000 or more | 0 (0.0%) | 0 (0.0%) |
| Total | 649 (100.0%) | 991 (100.0%) |
Household Income by Mortgage Status in Clairton
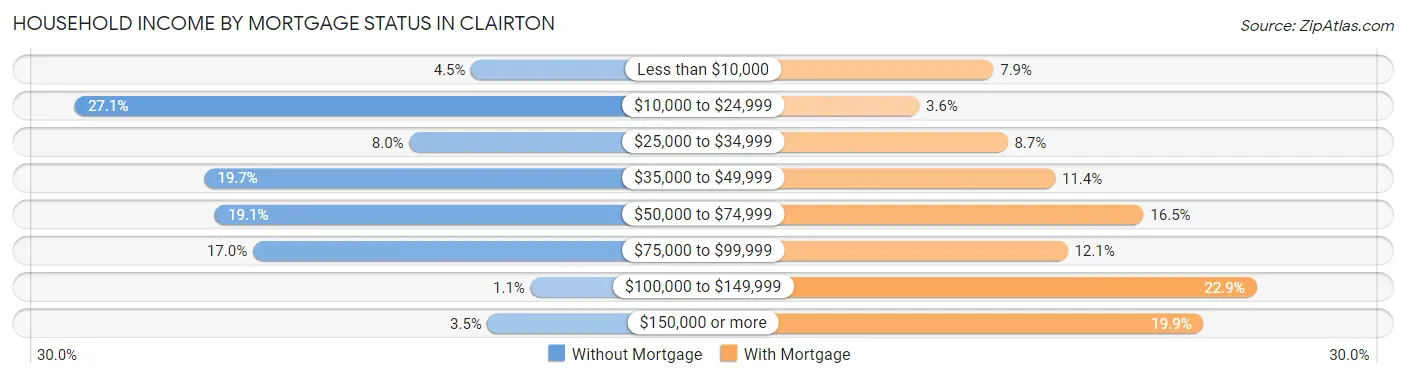
| Household Income | Without Mortgage | With Mortgage |
| Less than $10,000 | 29 (4.5%) | 78 (7.9%) |
| $10,000 to $24,999 | 176 (27.1%) | 36 (3.6%) |
| $25,000 to $34,999 | 52 (8.0%) | 86 (8.7%) |
| $35,000 to $49,999 | 128 (19.7%) | 113 (11.4%) |
| $50,000 to $74,999 | 124 (19.1%) | 163 (16.5%) |
| $75,000 to $99,999 | 110 (17.0%) | 120 (12.1%) |
| $100,000 to $149,999 | 7 (1.1%) | 227 (22.9%) |
| $150,000 or more | 23 (3.5%) | 197 (19.9%) |
| Total | 649 (100.0%) | 991 (100.0%) |
Property Value to Household Income Ratio in Clairton
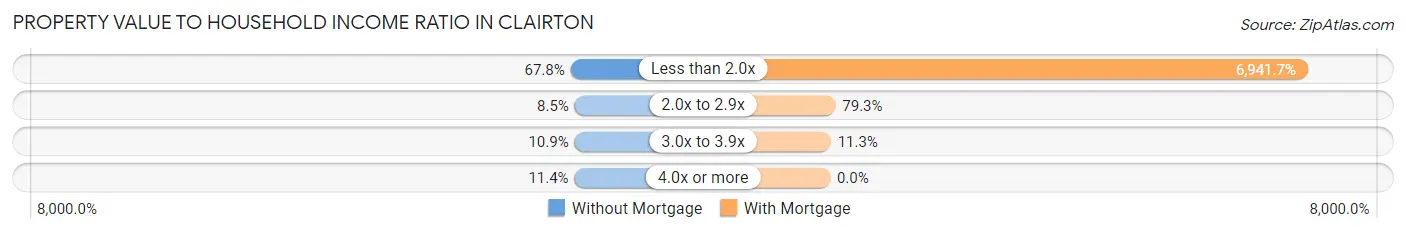
| Value-to-Income Ratio | Without Mortgage | With Mortgage |
| Less than 2.0x | 440 (67.8%) | 68,792 (6,941.7%) |
| 2.0x to 2.9x | 55 (8.5%) | 786 (79.3%) |
| 3.0x to 3.9x | 71 (10.9%) | 112 (11.3%) |
| 4.0x or more | 74 (11.4%) | 0 (0.0%) |
| Total | 649 (100.0%) | 991 (100.0%) |
Real Estate Taxes by Mortgage Status in Clairton
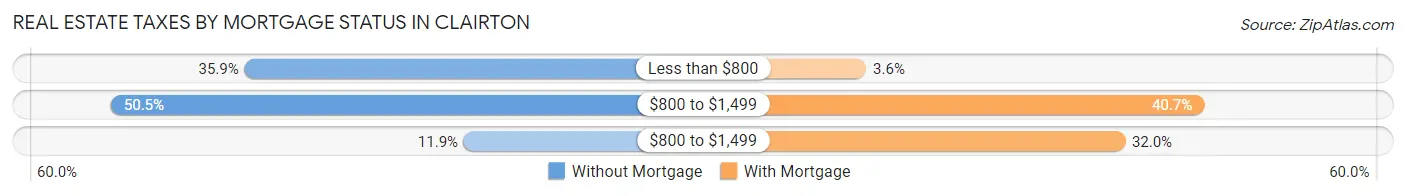
| Property Taxes | Without Mortgage | With Mortgage |
| Less than $800 | 233 (35.9%) | 36 (3.6%) |
| $800 to $1,499 | 328 (50.5%) | 403 (40.7%) |
| $800 to $1,499 | 77 (11.9%) | 317 (32.0%) |
| Total | 649 (100.0%) | 991 (100.0%) |
Health & Disability in Clairton
Health Insurance Coverage by Age in Clairton
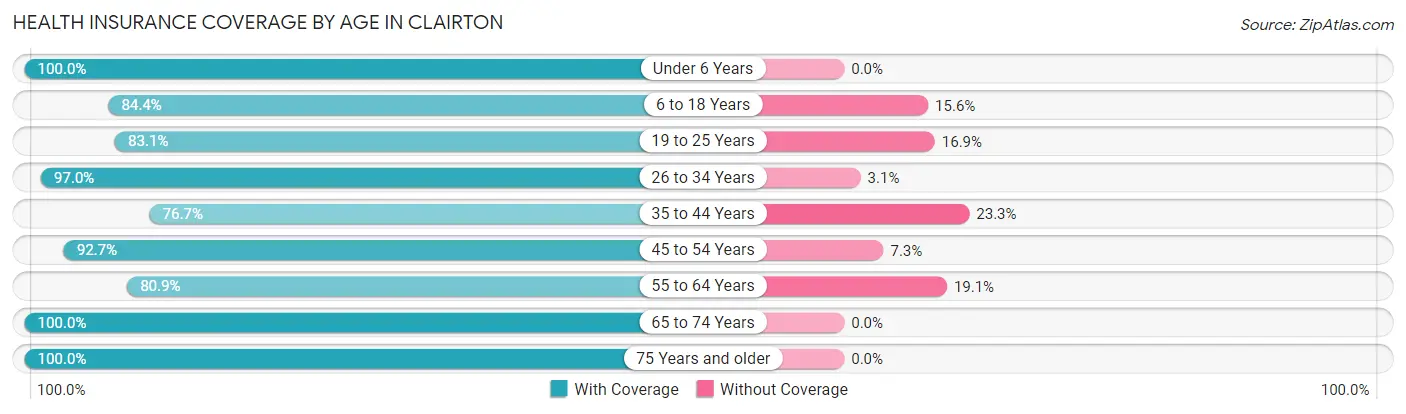
| Age Bracket | With Coverage | Without Coverage |
| Under 6 Years | 440 (100.0%) | 0 (0.0%) |
| 6 to 18 Years | 782 (84.4%) | 145 (15.6%) |
| 19 to 25 Years | 374 (83.1%) | 76 (16.9%) |
| 26 to 34 Years | 731 (97.0%) | 23 (3.0%) |
| 35 to 44 Years | 559 (76.7%) | 170 (23.3%) |
| 45 to 54 Years | 456 (92.7%) | 36 (7.3%) |
| 55 to 64 Years | 794 (80.9%) | 188 (19.1%) |
| 65 to 74 Years | 855 (100.0%) | 0 (0.0%) |
| 75 Years and older | 534 (100.0%) | 0 (0.0%) |
| Total | 5,525 (89.6%) | 638 (10.3%) |
Health Insurance Coverage by Citizenship Status in Clairton
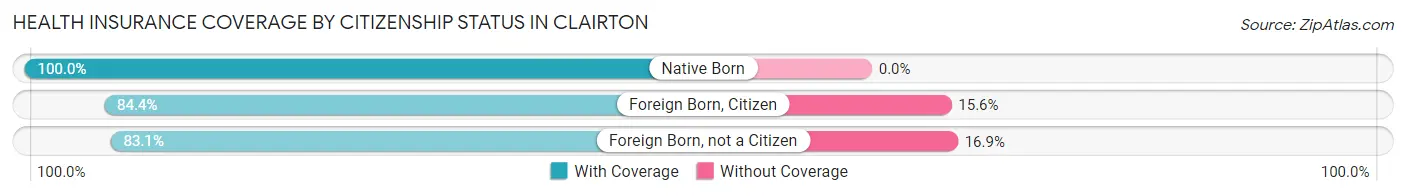
| Citizenship Status | With Coverage | Without Coverage |
| Native Born | 440 (100.0%) | 0 (0.0%) |
| Foreign Born, Citizen | 782 (84.4%) | 145 (15.6%) |
| Foreign Born, not a Citizen | 374 (83.1%) | 76 (16.9%) |
Health Insurance Coverage by Household Income in Clairton
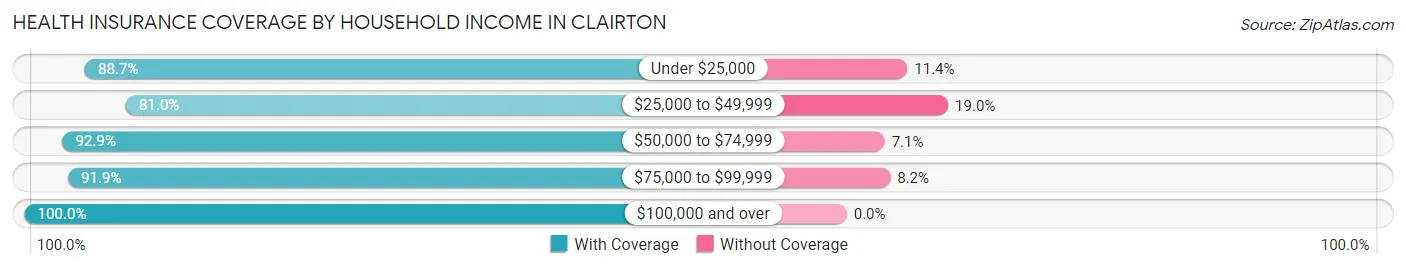
| Household Income | With Coverage | Without Coverage |
| Under $25,000 | 1,374 (88.6%) | 176 (11.4%) |
| $25,000 to $49,999 | 1,335 (81.0%) | 313 (19.0%) |
| $50,000 to $74,999 | 772 (92.9%) | 59 (7.1%) |
| $75,000 to $99,999 | 1,003 (91.8%) | 89 (8.2%) |
| $100,000 and over | 992 (100.0%) | 0 (0.0%) |
Public vs Private Health Insurance Coverage by Age in Clairton
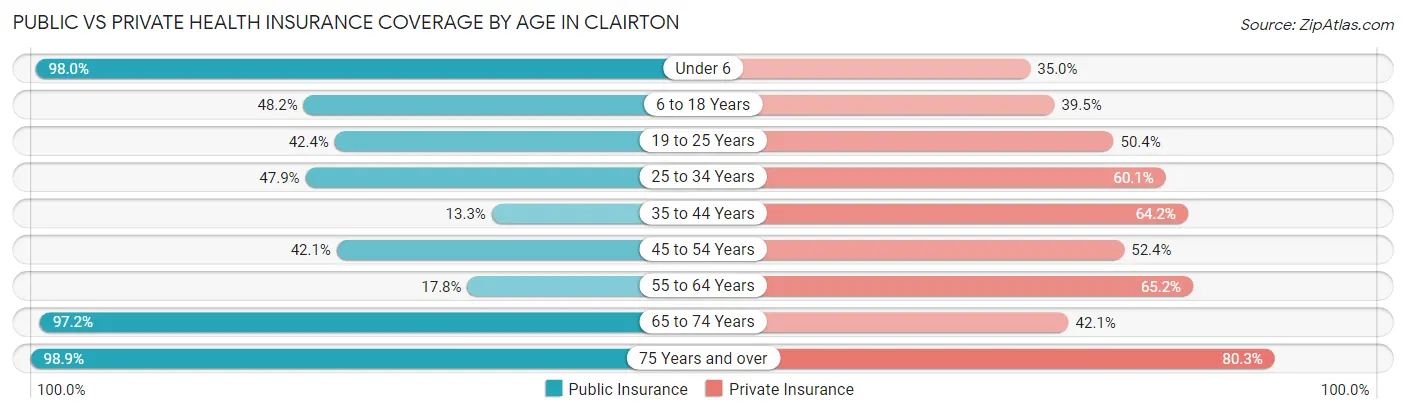
| Age Bracket | Public Insurance | Private Insurance |
| Under 6 | 431 (98.0%) | 154 (35.0%) |
| 6 to 18 Years | 447 (48.2%) | 366 (39.5%) |
| 19 to 25 Years | 191 (42.4%) | 227 (50.4%) |
| 25 to 34 Years | 361 (47.9%) | 453 (60.1%) |
| 35 to 44 Years | 97 (13.3%) | 468 (64.2%) |
| 45 to 54 Years | 207 (42.1%) | 258 (52.4%) |
| 55 to 64 Years | 175 (17.8%) | 640 (65.2%) |
| 65 to 74 Years | 831 (97.2%) | 360 (42.1%) |
| 75 Years and over | 528 (98.9%) | 429 (80.3%) |
| Total | 3,268 (53.0%) | 3,355 (54.4%) |
Disability Status by Sex by Age in Clairton
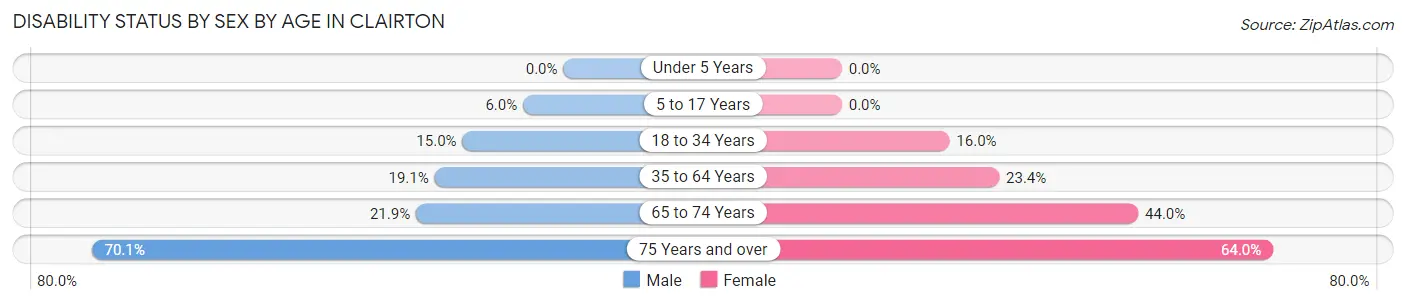
| Age Bracket | Male | Female |
| Under 5 Years | 0 (0.0%) | 0 (0.0%) |
| 5 to 17 Years | 22 (6.0%) | 0 (0.0%) |
| 18 to 34 Years | 101 (15.0%) | 97 (16.0%) |
| 35 to 64 Years | 188 (19.1%) | 285 (23.4%) |
| 65 to 74 Years | 105 (21.9%) | 165 (44.0%) |
| 75 Years and over | 152 (70.1%) | 203 (64.0%) |
Disability Class by Sex by Age in Clairton
Disability Class: Hearing Difficulty
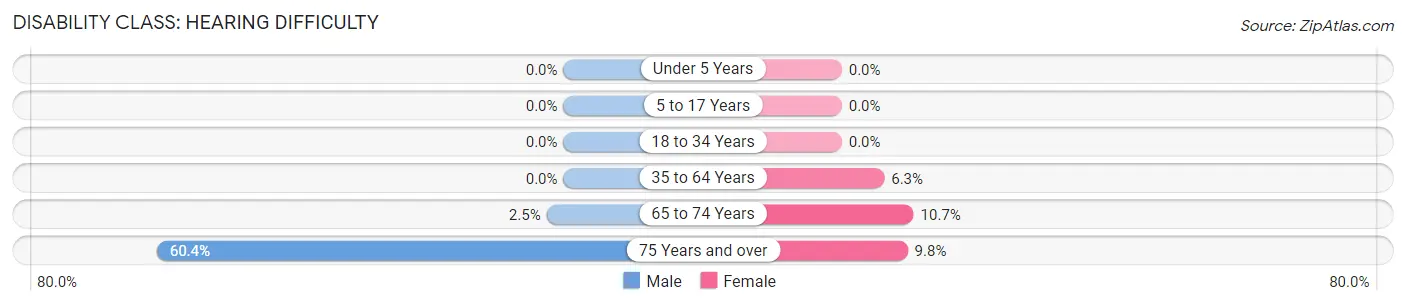
| Age Bracket | Male | Female |
| Under 5 Years | 0 (0.0%) | 0 (0.0%) |
| 5 to 17 Years | 0 (0.0%) | 0 (0.0%) |
| 18 to 34 Years | 0 (0.0%) | 0 (0.0%) |
| 35 to 64 Years | 0 (0.0%) | 77 (6.3%) |
| 65 to 74 Years | 12 (2.5%) | 40 (10.7%) |
| 75 Years and over | 131 (60.4%) | 31 (9.8%) |
Disability Class: Vision Difficulty
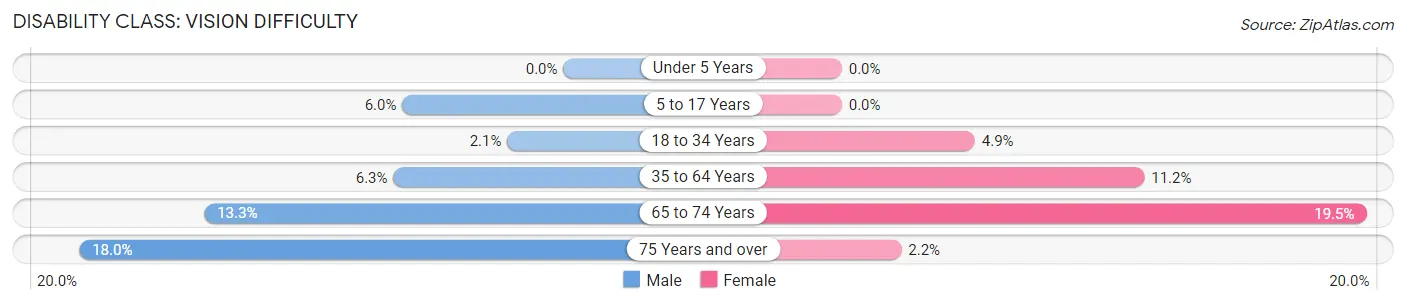
| Age Bracket | Male | Female |
| Under 5 Years | 0 (0.0%) | 0 (0.0%) |
| 5 to 17 Years | 22 (6.0%) | 0 (0.0%) |
| 18 to 34 Years | 14 (2.1%) | 30 (4.9%) |
| 35 to 64 Years | 62 (6.3%) | 137 (11.2%) |
| 65 to 74 Years | 64 (13.3%) | 73 (19.5%) |
| 75 Years and over | 39 (18.0%) | 7 (2.2%) |
Disability Class: Cognitive Difficulty
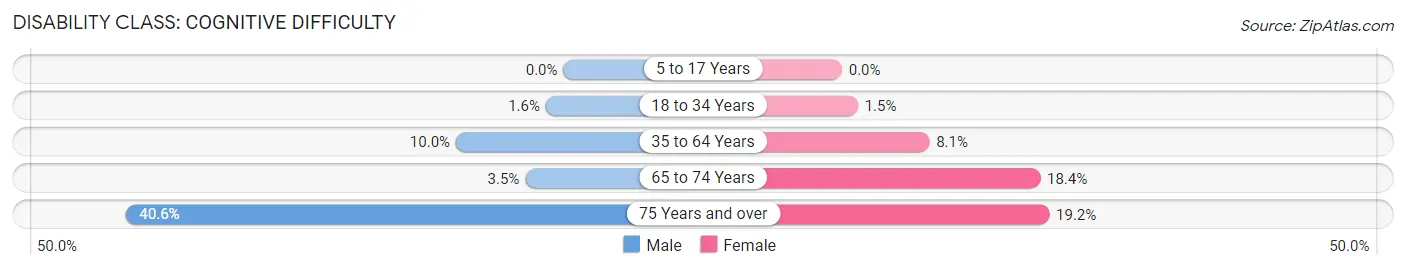
| Age Bracket | Male | Female |
| 5 to 17 Years | 0 (0.0%) | 0 (0.0%) |
| 18 to 34 Years | 11 (1.6%) | 9 (1.5%) |
| 35 to 64 Years | 98 (10.0%) | 99 (8.1%) |
| 65 to 74 Years | 17 (3.5%) | 69 (18.4%) |
| 75 Years and over | 88 (40.6%) | 61 (19.2%) |
Disability Class: Ambulatory Difficulty
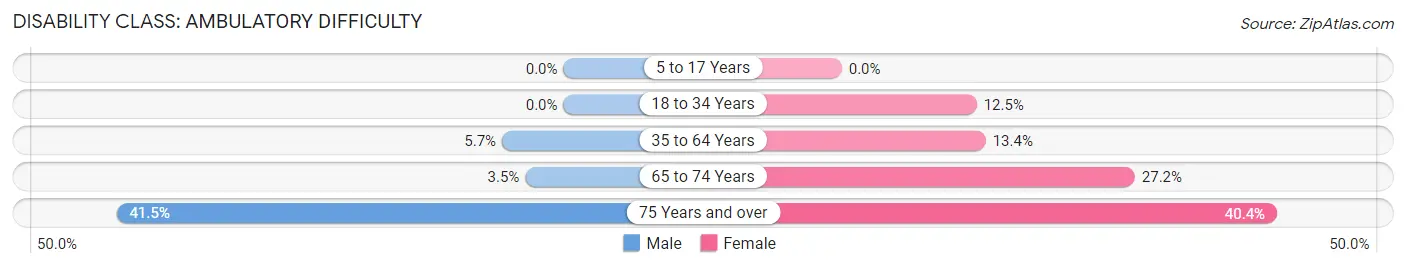
| Age Bracket | Male | Female |
| 5 to 17 Years | 0 (0.0%) | 0 (0.0%) |
| 18 to 34 Years | 0 (0.0%) | 76 (12.5%) |
| 35 to 64 Years | 56 (5.7%) | 163 (13.4%) |
| 65 to 74 Years | 17 (3.5%) | 102 (27.2%) |
| 75 Years and over | 90 (41.5%) | 128 (40.4%) |
Disability Class: Self-Care Difficulty
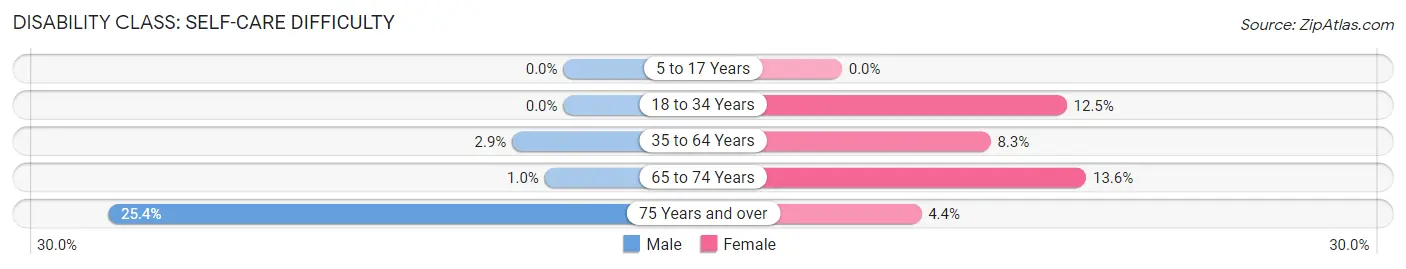
| Age Bracket | Male | Female |
| 5 to 17 Years | 0 (0.0%) | 0 (0.0%) |
| 18 to 34 Years | 0 (0.0%) | 76 (12.5%) |
| 35 to 64 Years | 28 (2.9%) | 101 (8.3%) |
| 65 to 74 Years | 5 (1.0%) | 51 (13.6%) |
| 75 Years and over | 55 (25.4%) | 14 (4.4%) |
Technology Access in Clairton
Computing Device Access in Clairton
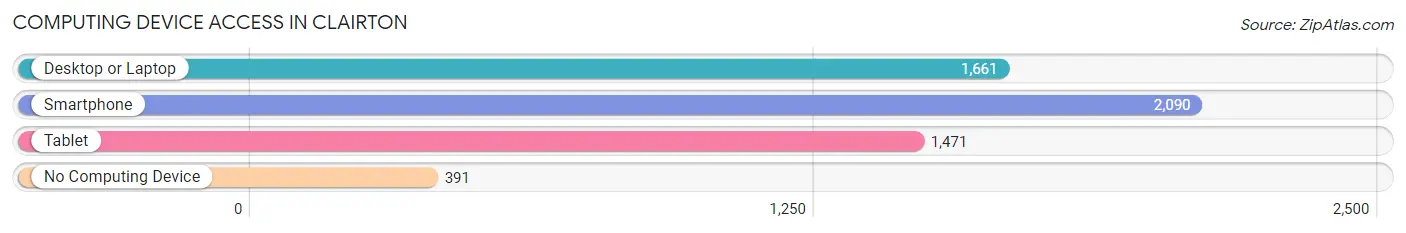
| Device Type | # Households | % Households |
| Desktop or Laptop | 1,661 | 60.5% |
| Smartphone | 2,090 | 76.1% |
| Tablet | 1,471 | 53.5% |
| No Computing Device | 391 | 14.2% |
| Total | 2,747 | 100.0% |
Internet Access in Clairton
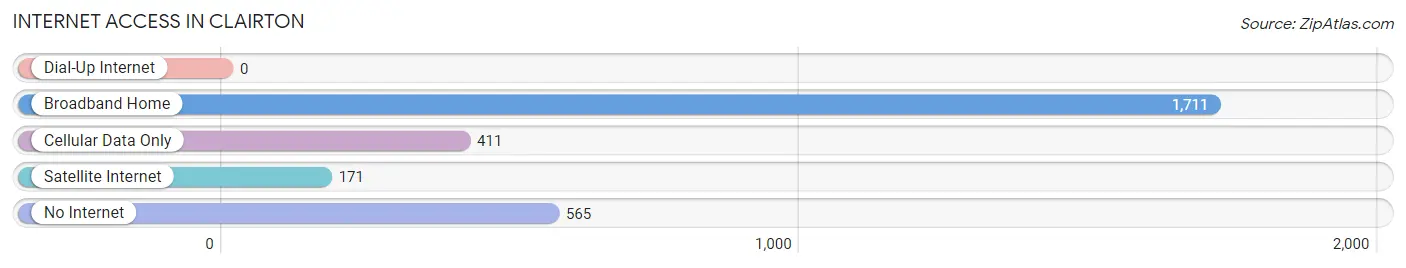
| Internet Type | # Households | % Households |
| Dial-Up Internet | 0 | 0.0% |
| Broadband Home | 1,711 | 62.3% |
| Cellular Data Only | 411 | 15.0% |
| Satellite Internet | 171 | 6.2% |
| No Internet | 565 | 20.6% |
| Total | 2,747 | 100.0% |
Clairton Summary
Clairton, Pennsylvania is a small borough located in Allegheny County, just south of Pittsburgh. It is situated along the Monongahela River and is part of the Pittsburgh metropolitan area. The population of Clairton was 6,796 at the 2010 census.
History
Clairton was founded in 1842 by William B. Foster, who named it after his father, Clair. The town was originally a farming community, but it soon became a center for the coal and coke industry. The first coal mine in the area was opened in 1845, and by the late 19th century, Clairton was one of the largest coal-producing towns in the United States.
The town was incorporated in 1891 and was home to several steel mills, including the Clairton Works, which was the largest steel mill in the world at the time. The steel industry in Clairton declined in the mid-20th century, and the town has since become a bedroom community for Pittsburgh.
Geography
Clairton is located at 40°17'45" North, 79°56'45" West (40.295833, -79.945278). It is situated along the Monongahela River, about 10 miles south of Pittsburgh. The borough has a total area of 1.3 square miles, all of which is land.
Economy
Clairton’s economy is largely based on the steel industry. The town is home to the Clairton Works, which is the largest steel mill in the United States. The mill employs over 1,000 people and produces steel products for the automotive, construction, and energy industries.
The town is also home to several other businesses, including a number of restaurants, retail stores, and service providers. The Clairton Municipal Airport is located in the borough, and it serves as a general aviation facility.
Demographics
As of the 2010 census, the population of Clairton was 6,796. The racial makeup of the borough was 94.3% White, 3.3% African American, 0.2% Native American, 0.3% Asian, 0.1% Pacific Islander, 0.7% from other races, and 1.2% from two or more races. Hispanic or Latino of any race were 1.7% of the population.
The median household income in Clairton was $37,917, and the median family income was $45,938. The per capita income was $17,945. About 11.3% of families and 14.2% of the population were below the poverty line, including 22.2% of those under age 18 and 8.2% of those age 65 or over.
Common Questions
What is the Total Population of Clairton?
Total Population of Clairton is 6,182.
What is the Total Male Population of Clairton?
Total Male Population of Clairton is 2,996.
What is the Total Female Population of Clairton?
Total Female Population of Clairton is 3,186.
What is the Ratio of Males per 100 Females in Clairton?
There are 94.04 Males per 100 Females in Clairton.
What is the Ratio of Females per 100 Males in Clairton?
There are 106.34 Females per 100 Males in Clairton.
What is the Median Population Age in Clairton?
Median Population Age in Clairton is 41.8 Years.
What is the Average Family Size in Clairton
Average Family Size in Clairton is 3.1 People.
What is the Average Household Size in Clairton
Average Household Size in Clairton is 2.2 People.
What is Per Capita Income in Clairton?
Per Capita income in Clairton is $25,125.
What is the Median Family Income in Clairton?
Median Family Income in Clairton is $60,500.
What is the Median Household income in Clairton?
Median Household Income in Clairton is $41,301.
What is Income or Wage Gap in Clairton?
Income or Wage Gap in Clairton is 9.4%.
Women in Clairton earn 90.6 cents for every dollar earned by a man.
What is Family Income Deficit in Clairton?
Family Income Deficit in Clairton is $13,774.
Families that are below poverty line in Clairton earn $13,774 less on average than the poverty threshold level.
What is Inequality or Gini Index in Clairton?
Inequality or Gini Index in Clairton is 0.47.
How Large is the Labor Force in Clairton?
There are 2,705 People in the Labor Forcein in Clairton.
What is the Percentage of People in the Labor Force in Clairton?
52.7% of People are in the Labor Force in Clairton.
What is the Unemployment Rate in Clairton?
Unemployment Rate in Clairton is 10.6%.