Cities with the Highest Percentage of Immigrants from Western Asia in Louisiana
RELATED REPORTS & OPTIONS
Western Asia
Louisiana
Compare Cities
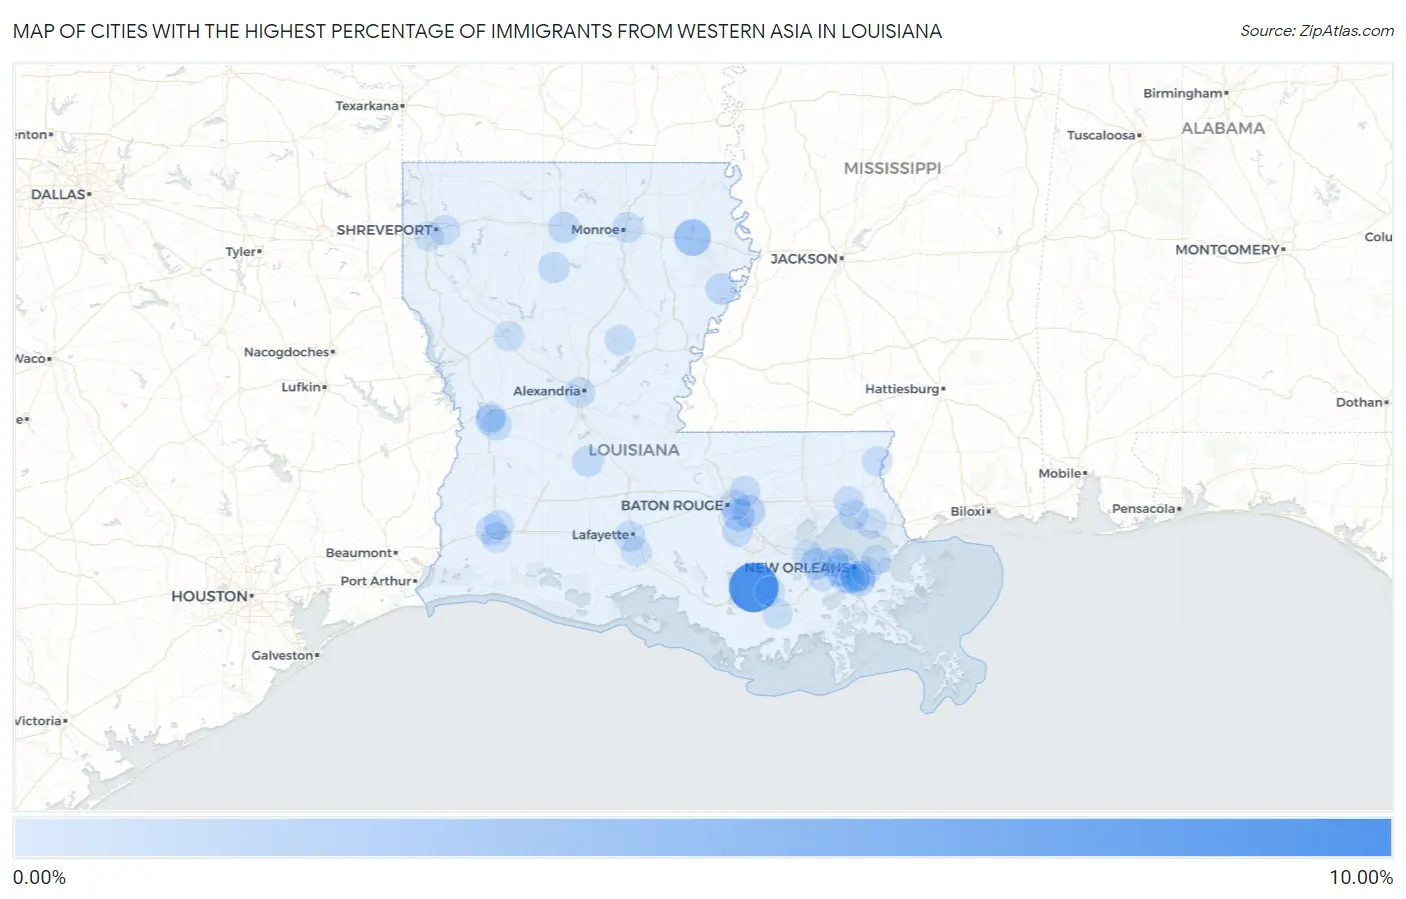
Map of Cities with the Highest Percentage of Immigrants from Western Asia in Louisiana
0.00%
10.00%
Cities with the Highest Percentage of Immigrants from Western Asia in Louisiana
| City | Western Asia | vs State | vs National | |
| 1. | Labadieville | 9.90% | 0.15%(+9.75)#-1 | 0.36%(+9.53)#0 |
| 2. | Delhi | 3.31% | 0.15%(+3.16)#0 | 0.36%(+2.94)#1 |
| 3. | Timberlane | 1.37% | 0.15%(+1.23)#1 | 0.36%(+1.01)#2 |
| 4. | Shenandoah | 1.35% | 0.15%(+1.20)#2 | 0.36%(+0.989)#3 |
| 5. | Oak Hills Place | 1.25% | 0.15%(+1.10)#3 | 0.36%(+0.884)#4 |
| 6. | Elmwood | 1.02% | 0.15%(+0.871)#4 | 0.36%(+0.656)#5 |
| 7. | Norco | 0.91% | 0.15%(+0.764)#5 | 0.36%(+0.549)#6 |
| 8. | Newellton | 0.78% | 0.15%(+0.632)#6 | 0.36%(+0.418)#7 |
| 9. | Ruston | 0.76% | 0.15%(+0.614)#7 | 0.36%(+0.399)#8 |
| 10. | Metairie | 0.71% | 0.15%(+0.562)#8 | 0.36%(+0.348)#9 |
| 11. | Jonesboro | 0.63% | 0.15%(+0.480)#9 | 0.36%(+0.265)#10 |
| 12. | Pine Prairie | 0.57% | 0.15%(+0.417)#10 | 0.36%(+0.202)#11 |
| 13. | Lafayette | 0.55% | 0.15%(+0.400)#11 | 0.36%(+0.185)#12 |
| 14. | Gretna | 0.51% | 0.15%(+0.361)#12 | 0.36%(+0.147)#13 |
| 15. | Westwego | 0.51% | 0.15%(+0.359)#13 | 0.36%(+0.144)#14 |
| 16. | Fort Polk South | 0.50% | 0.15%(+0.356)#14 | 0.36%(+0.141)#15 |
| 17. | Kenner | 0.42% | 0.15%(+0.269)#15 | 0.36%(+0.054)#16 |
| 18. | St Gabriel | 0.41% | 0.15%(+0.265)#16 | 0.36%(+0.050)#17 |
| 19. | Westlake | 0.39% | 0.15%(+0.243)#17 | 0.36%(+0.028)#18 |
| 20. | Baton Rouge | 0.37% | 0.15%(+0.225)#18 | 0.36%(+0.011)#19 |
| 21. | Central | 0.35% | 0.15%(+0.203)#19 | 0.36%(-0.011)#20 |
| 22. | Monroe | 0.34% | 0.15%(+0.187)#20 | 0.36%(-0.028)#21 |
| 23. | Terrytown | 0.32% | 0.15%(+0.173)#21 | 0.36%(-0.042)#22 |
| 24. | Jena | 0.27% | 0.15%(+0.119)#22 | 0.36%(-0.095)#23 |
| 25. | Alexandria | 0.27% | 0.15%(+0.117)#23 | 0.36%(-0.098)#24 |
| 26. | New Llano | 0.26% | 0.15%(+0.113)#24 | 0.36%(-0.102)#25 |
| 27. | Lacombe | 0.20% | 0.15%(+0.050)#25 | 0.36%(-0.165)#26 |
| 28. | Mandeville | 0.19% | 0.15%(+0.041)#26 | 0.36%(-0.174)#27 |
| 29. | Marrero | 0.18% | 0.15%(+0.035)#27 | 0.36%(-0.179)#28 |
| 30. | Luling | 0.18% | 0.15%(+0.034)#28 | 0.36%(-0.181)#29 |
| 31. | Laplace | 0.17% | 0.15%(+0.020)#29 | 0.36%(-0.194)#30 |
| 32. | Bossier City | 0.15% | 0.15%(+0.004)#30 | 0.36%(-0.211)#31 |
| 33. | Covington | 0.15% | 0.15%(-0.000)#31 | 0.36%(-0.215)#32 |
| 34. | Bogalusa | 0.13% | 0.15%(-0.018)#32 | 0.36%(-0.233)#33 |
| 35. | Leesville | 0.12% | 0.15%(-0.026)#33 | 0.36%(-0.240)#34 |
| 36. | Chalmette | 0.12% | 0.15%(-0.027)#34 | 0.36%(-0.242)#35 |
| 37. | Lake Charles | 0.12% | 0.15%(-0.029)#35 | 0.36%(-0.244)#36 |
| 38. | Youngsville | 0.12% | 0.15%(-0.030)#36 | 0.36%(-0.245)#37 |
| 39. | New Orleans | 0.096% | 0.15%(-0.053)#37 | 0.36%(-0.268)#38 |
| 40. | Bayou Cane | 0.095% | 0.15%(-0.054)#38 | 0.36%(-0.269)#39 |
| 41. | Moss Bluff | 0.086% | 0.15%(-0.063)#39 | 0.36%(-0.277)#40 |
| 42. | Natchitoches | 0.061% | 0.15%(-0.087)#40 | 0.36%(-0.302)#41 |
| 43. | Harvey | 0.056% | 0.15%(-0.093)#41 | 0.36%(-0.308)#42 |
| 44. | Thibodaux | 0.032% | 0.15%(-0.117)#42 | 0.36%(-0.332)#43 |
| 45. | Shreveport | 0.025% | 0.15%(-0.124)#43 | 0.36%(-0.339)#44 |
Common Questions
What are the Top 10 Cities with the Highest Percentage of Immigrants from Western Asia in Louisiana?
Top 10 Cities with the Highest Percentage of Immigrants from Western Asia in Louisiana are:
#1
9.90%
#2
3.31%
#3
1.37%
#4
1.35%
#5
1.25%
#6
1.02%
#7
0.91%
#8
0.78%
#9
0.76%
#10
0.71%
What city has the Highest Percentage of Immigrants from Western Asia in Louisiana?
Labadieville has the Highest Percentage of Immigrants from Western Asia in Louisiana with 9.90%.
What is the Percentage of Immigrants from Western Asia in the State of Louisiana?
Percentage of Immigrants from Western Asia in Louisiana is 0.15%.
What is the Percentage of Immigrants from Western Asia in the United States?
Percentage of Immigrants from Western Asia in the United States is 0.36%.