Cities with the Highest Percentage of Immigrants from Western Asia in Utah
RELATED REPORTS & OPTIONS
Western Asia
Utah
Compare Cities
Map of Cities with the Highest Percentage of Immigrants from Western Asia in Utah
0.00%
1.50%
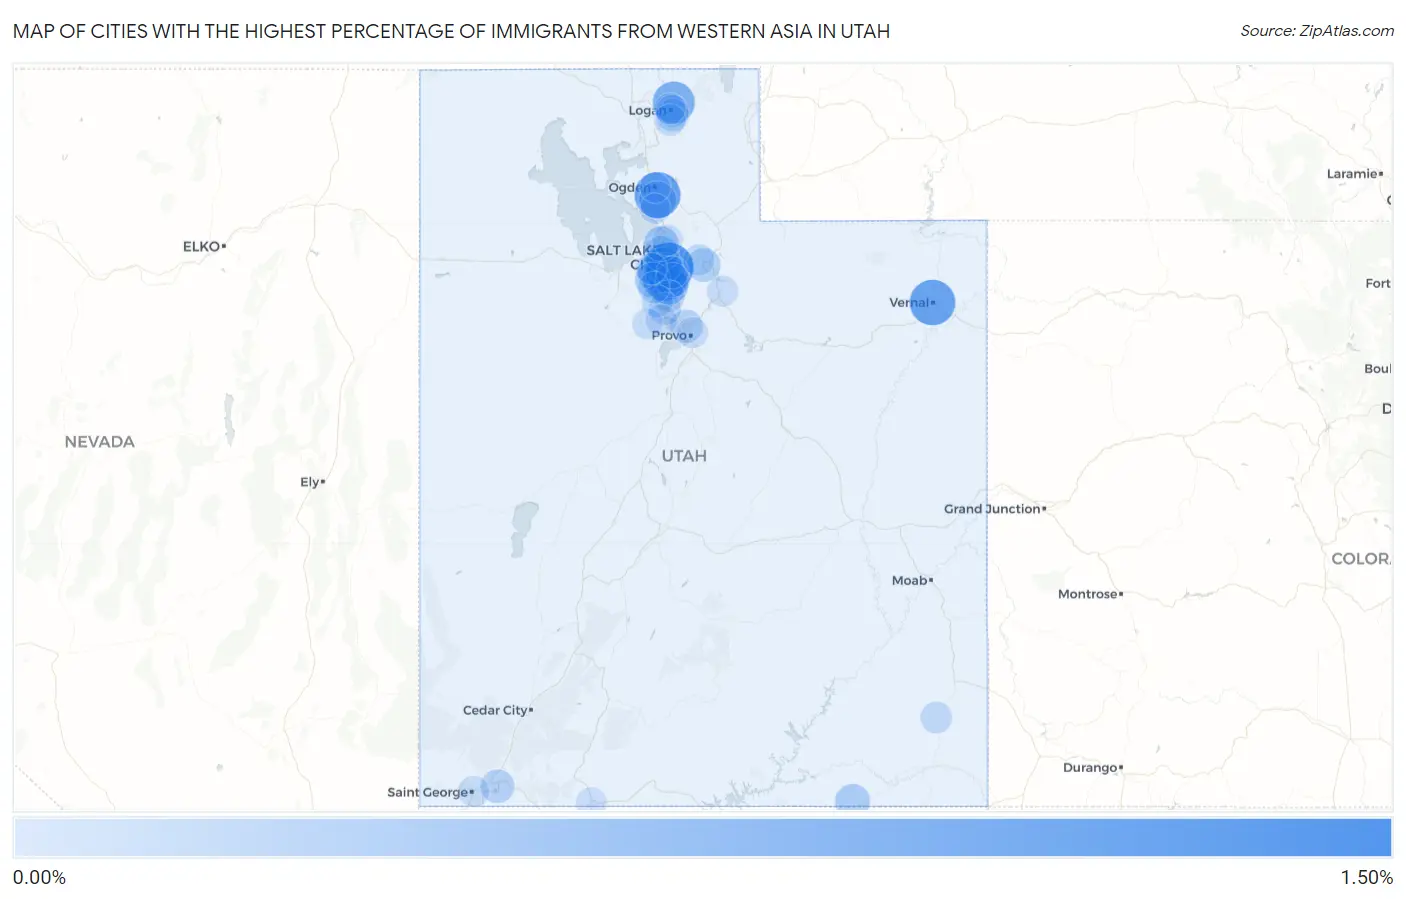
Cities with the Highest Percentage of Immigrants from Western Asia in Utah
| City | Western Asia | vs State | vs National | |
| 1. | Millcreek | 1.17% | 0.14%(+1.03)#-1 | 0.36%(+0.808)#0 |
| 2. | South Ogden | 0.94% | 0.14%(+0.804)#0 | 0.36%(+0.580)#1 |
| 3. | Vernal | 0.93% | 0.14%(+0.787)#1 | 0.36%(+0.563)#2 |
| 4. | Midvale | 0.84% | 0.14%(+0.700)#2 | 0.36%(+0.476)#3 |
| 5. | North Logan | 0.71% | 0.14%(+0.570)#3 | 0.36%(+0.347)#4 |
| 6. | Taylorsville | 0.56% | 0.14%(+0.419)#4 | 0.36%(+0.196)#5 |
| 7. | Murray | 0.54% | 0.14%(+0.396)#5 | 0.36%(+0.172)#6 |
| 8. | Sandy | 0.53% | 0.14%(+0.386)#6 | 0.36%(+0.162)#7 |
| 9. | South Weber | 0.43% | 0.14%(+0.288)#7 | 0.36%(+0.065)#8 |
| 10. | South Salt Lake | 0.33% | 0.14%(+0.195)#8 | 0.36%(-0.029)#9 |
| 11. | Salt Lake City | 0.30% | 0.14%(+0.158)#9 | 0.36%(-0.066)#10 |
| 12. | West Jordan | 0.30% | 0.14%(+0.156)#10 | 0.36%(-0.068)#11 |
| 13. | North Salt Lake | 0.28% | 0.14%(+0.144)#11 | 0.36%(-0.080)#12 |
| 14. | Oljato Monument Valley | 0.27% | 0.14%(+0.134)#12 | 0.36%(-0.089)#13 |
| 15. | Cottonwood Heights | 0.24% | 0.14%(+0.104)#13 | 0.36%(-0.120)#14 |
| 16. | Snyderville | 0.21% | 0.14%(+0.070)#14 | 0.36%(-0.154)#15 |
| 17. | Hurricane | 0.20% | 0.14%(+0.064)#15 | 0.36%(-0.160)#16 |
| 18. | Orem | 0.17% | 0.14%(+0.028)#16 | 0.36%(-0.196)#17 |
| 19. | Providence | 0.14% | 0.14%(+0.003)#17 | 0.36%(-0.221)#18 |
| 20. | River Heights | 0.13% | 0.14%(-0.006)#18 | 0.36%(-0.230)#19 |
| 21. | Holladay | 0.11% | 0.14%(-0.026)#19 | 0.36%(-0.250)#20 |
| 22. | Lehi | 0.11% | 0.14%(-0.027)#20 | 0.36%(-0.251)#21 |
| 23. | Draper | 0.093% | 0.14%(-0.047)#21 | 0.36%(-0.271)#22 |
| 24. | Bluffdale | 0.092% | 0.14%(-0.048)#22 | 0.36%(-0.272)#23 |
| 25. | Blanding | 0.090% | 0.14%(-0.050)#23 | 0.36%(-0.274)#24 |
| 26. | Nibley | 0.081% | 0.14%(-0.059)#24 | 0.36%(-0.282)#25 |
| 27. | South Jordan | 0.077% | 0.14%(-0.063)#25 | 0.36%(-0.287)#26 |
| 28. | Summit Park | 0.069% | 0.14%(-0.071)#26 | 0.36%(-0.295)#27 |
| 29. | West Valley City | 0.065% | 0.14%(-0.075)#27 | 0.36%(-0.299)#28 |
| 30. | Logan | 0.060% | 0.14%(-0.080)#28 | 0.36%(-0.304)#29 |
| 31. | Saratoga Springs | 0.047% | 0.14%(-0.093)#29 | 0.36%(-0.317)#30 |
| 32. | Provo | 0.046% | 0.14%(-0.094)#30 | 0.36%(-0.317)#31 |
| 33. | Eagle Mountain | 0.046% | 0.14%(-0.094)#31 | 0.36%(-0.318)#32 |
| 34. | Bountiful | 0.042% | 0.14%(-0.098)#32 | 0.36%(-0.322)#33 |
| 35. | Heber | 0.041% | 0.14%(-0.099)#33 | 0.36%(-0.322)#34 |
| 36. | St George | 0.037% | 0.14%(-0.102)#34 | 0.36%(-0.326)#35 |
| 37. | Ogden | 0.028% | 0.14%(-0.112)#35 | 0.36%(-0.336)#36 |
| 38. | Kanab | 0.021% | 0.14%(-0.119)#36 | 0.36%(-0.343)#37 |
| 39. | Layton | 0.020% | 0.14%(-0.120)#37 | 0.36%(-0.344)#38 |
Common Questions
What are the Top 10 Cities with the Highest Percentage of Immigrants from Western Asia in Utah?
Top 10 Cities with the Highest Percentage of Immigrants from Western Asia in Utah are:
#1
1.17%
#2
0.94%
#3
0.93%
#4
0.84%
#5
0.71%
#6
0.56%
#7
0.54%
#8
0.53%
#9
0.43%
#10
0.33%
What city has the Highest Percentage of Immigrants from Western Asia in Utah?
Millcreek has the Highest Percentage of Immigrants from Western Asia in Utah with 1.17%.
What is the Percentage of Immigrants from Western Asia in the State of Utah?
Percentage of Immigrants from Western Asia in Utah is 0.14%.
What is the Percentage of Immigrants from Western Asia in the United States?
Percentage of Immigrants from Western Asia in the United States is 0.36%.