Malvern borough, PA
Malvern borough Overview
3,389
TOTAL POPULATION
1,693
MALE POPULATION
1,696
FEMALE POPULATION
99.82
MALES / 100 FEMALES
100.18
FEMALES / 100 MALES
46.0
MEDIAN AGE
2.7
AVG FAMILY SIZE
2.1
AVG HOUSEHOLD SIZE
$78,031
PER CAPITA INCOME
$165,786
AVG FAMILY INCOME
$115,743
AVG HOUSEHOLD INCOME
20.1%
WAGE / INCOME GAP [ % ]
79.9¢/ $1
WAGE / INCOME GAP [ $ ]
0.45
INEQUALITY / GINI INDEX
2,121
LABOR FORCE [ PEOPLE ]
72.9%
PERCENT IN LABOR FORCE
5.9%
UNEMPLOYMENT RATE
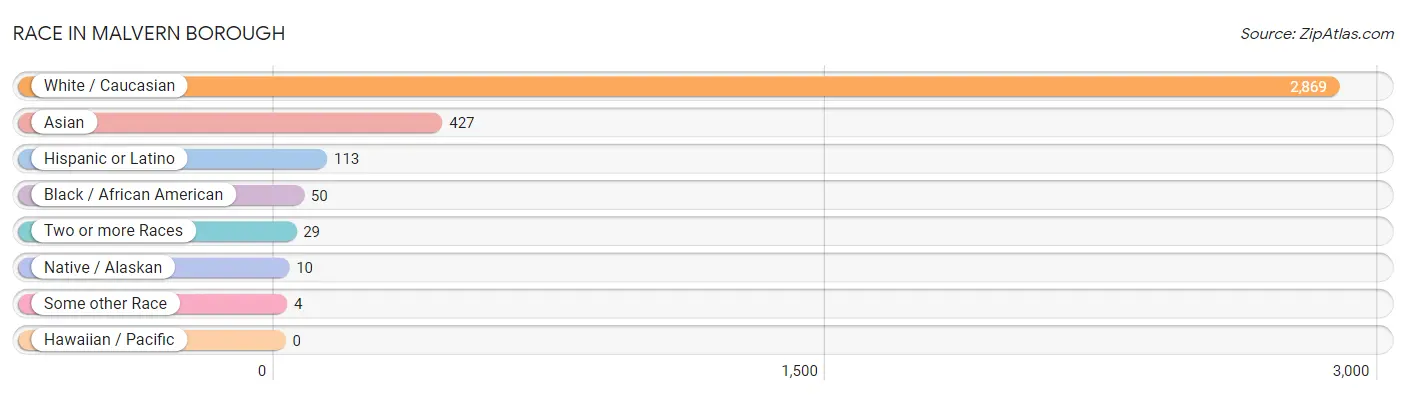
Race in Malvern borough
The most populous races in Malvern borough are White / Caucasian (2,869 | 84.7%), Asian (427 | 12.6%), and Hispanic or Latino (113 | 3.3%).
| Race | # Population | % Population |
| Asian | 427 | 12.6% |
| Black / African American | 50 | 1.5% |
| Hawaiian / Pacific | 0 | 0.0% |
| Hispanic or Latino | 113 | 3.3% |
| Native / Alaskan | 10 | 0.3% |
| White / Caucasian | 2,869 | 84.7% |
| Two or more Races | 29 | 0.9% |
| Some other Race | 4 | 0.1% |
| Total | 3,389 | 100.0% |
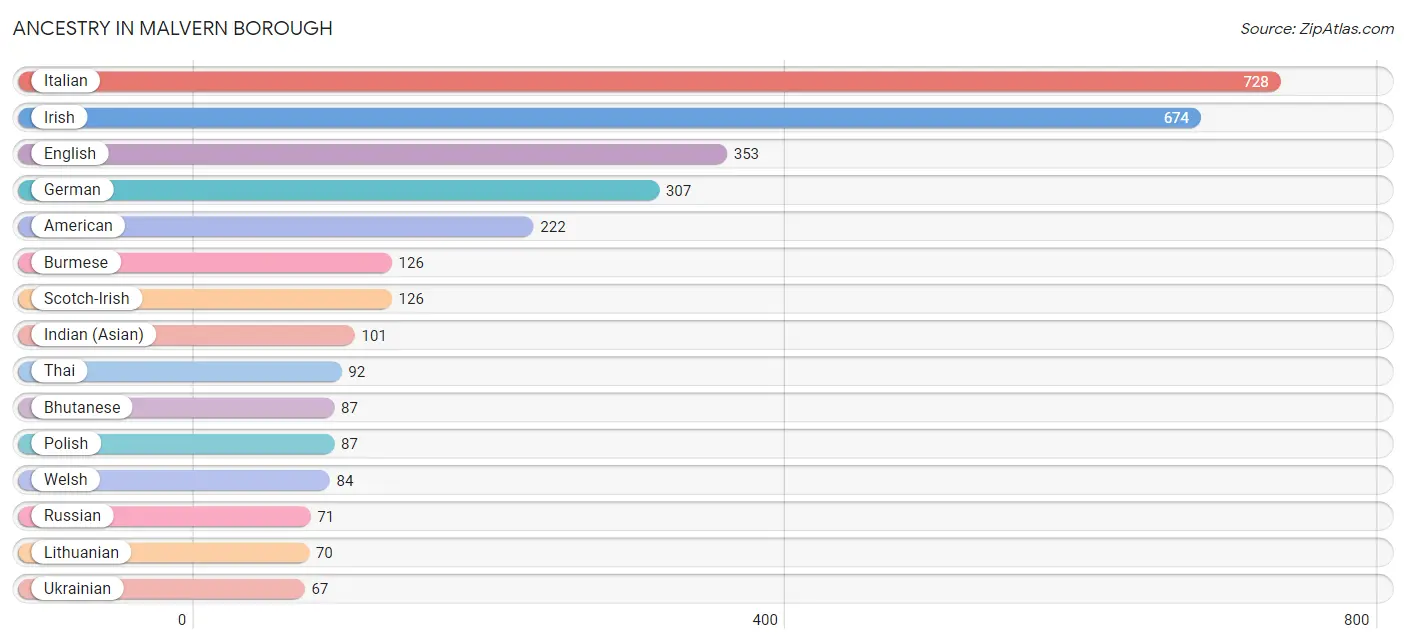
Ancestry in Malvern borough
The most populous ancestries reported in Malvern borough are Italian (728 | 21.5%), Irish (674 | 19.9%), English (353 | 10.4%), German (307 | 9.1%), and American (222 | 6.6%), together accounting for 67.4% of all Malvern borough residents.
| Ancestry | # Population | % Population |
| American | 222 | 6.6% |
| Arab | 14 | 0.4% |
| Assyrian / Chaldean / Syriac | 18 | 0.5% |
| Austrian | 23 | 0.7% |
| Bhutanese | 87 | 2.6% |
| British | 10 | 0.3% |
| Burmese | 126 | 3.7% |
| Carpatho Rusyn | 17 | 0.5% |
| Central American Indian | 10 | 0.3% |
| Croatian | 18 | 0.5% |
| Dutch | 7 | 0.2% |
| Eastern European | 7 | 0.2% |
| English | 353 | 10.4% |
| European | 10 | 0.3% |
| French | 54 | 1.6% |
| German | 307 | 9.1% |
| Greek | 20 | 0.6% |
| Indian (Asian) | 101 | 3.0% |
| Iranian | 18 | 0.5% |
| Irish | 674 | 19.9% |
| Italian | 728 | 21.5% |
| Jamaican | 9 | 0.3% |
| Jordanian | 14 | 0.4% |
| Lithuanian | 70 | 2.1% |
| Mexican | 59 | 1.7% |
| Norwegian | 27 | 0.8% |
| Pennsylvania German | 34 | 1.0% |
| Polish | 87 | 2.6% |
| Puerto Rican | 54 | 1.6% |
| Russian | 71 | 2.1% |
| Scandinavian | 9 | 0.3% |
| Scotch-Irish | 126 | 3.7% |
| Scottish | 64 | 1.9% |
| Slovak | 36 | 1.1% |
| Swedish | 24 | 0.7% |
| Thai | 92 | 2.7% |
| Ukrainian | 67 | 2.0% |
| Welsh | 84 | 2.5% | View All 38 Rows |
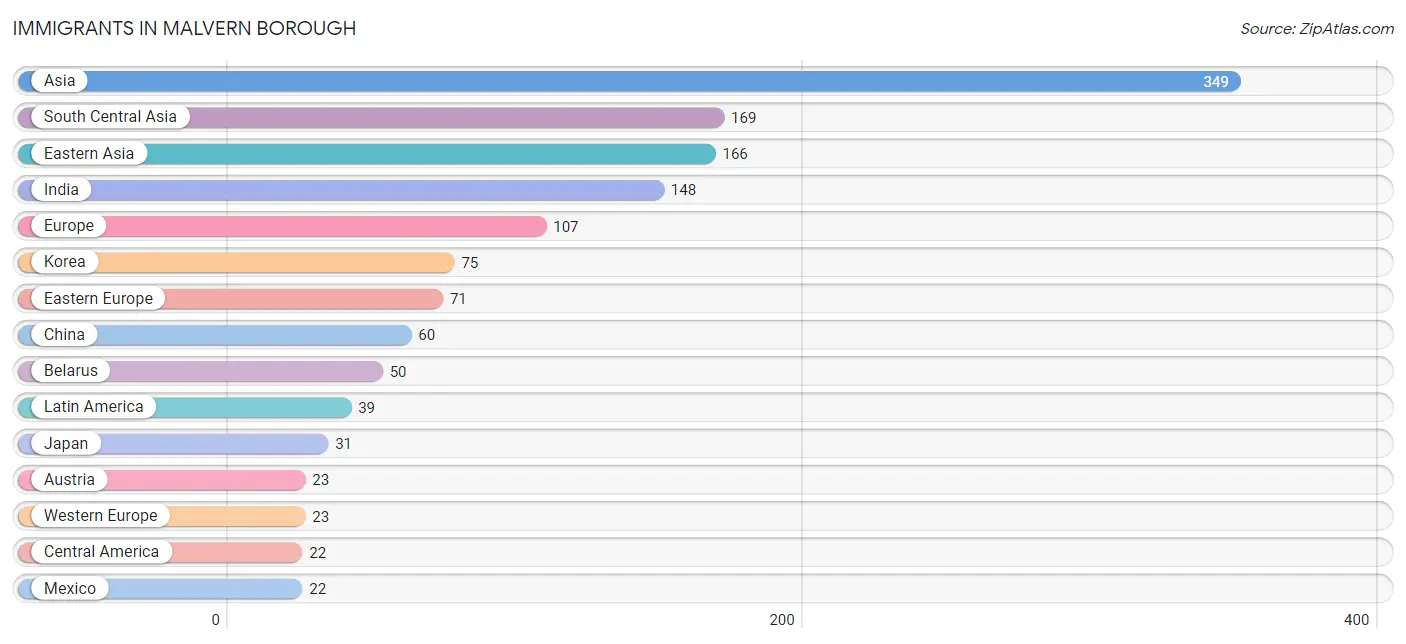
Immigrants in Malvern borough
The most numerous immigrant groups reported in Malvern borough came from Asia (349 | 10.3%), South Central Asia (169 | 5.0%), Eastern Asia (166 | 4.9%), India (148 | 4.4%), and Europe (107 | 3.2%), together accounting for 27.7% of all Malvern borough residents.
| Immigration Origin | # Population | % Population |
| Asia | 349 | 10.3% |
| Austria | 23 | 0.7% |
| Belarus | 50 | 1.5% |
| Caribbean | 17 | 0.5% |
| Central America | 22 | 0.6% |
| China | 60 | 1.8% |
| Eastern Asia | 166 | 4.9% |
| Eastern Europe | 71 | 2.1% |
| Europe | 107 | 3.2% |
| India | 148 | 4.4% |
| Jamaica | 17 | 0.5% |
| Japan | 31 | 0.9% |
| Jordan | 14 | 0.4% |
| Korea | 75 | 2.2% |
| Latin America | 39 | 1.1% |
| Mexico | 22 | 0.6% |
| Northern Europe | 13 | 0.4% |
| Pakistan | 21 | 0.6% |
| Poland | 12 | 0.4% |
| Scotland | 13 | 0.4% |
| South Central Asia | 169 | 5.0% |
| Taiwan | 10 | 0.3% |
| Ukraine | 9 | 0.3% |
| Western Asia | 14 | 0.4% |
| Western Europe | 23 | 0.7% | View All 25 Rows |
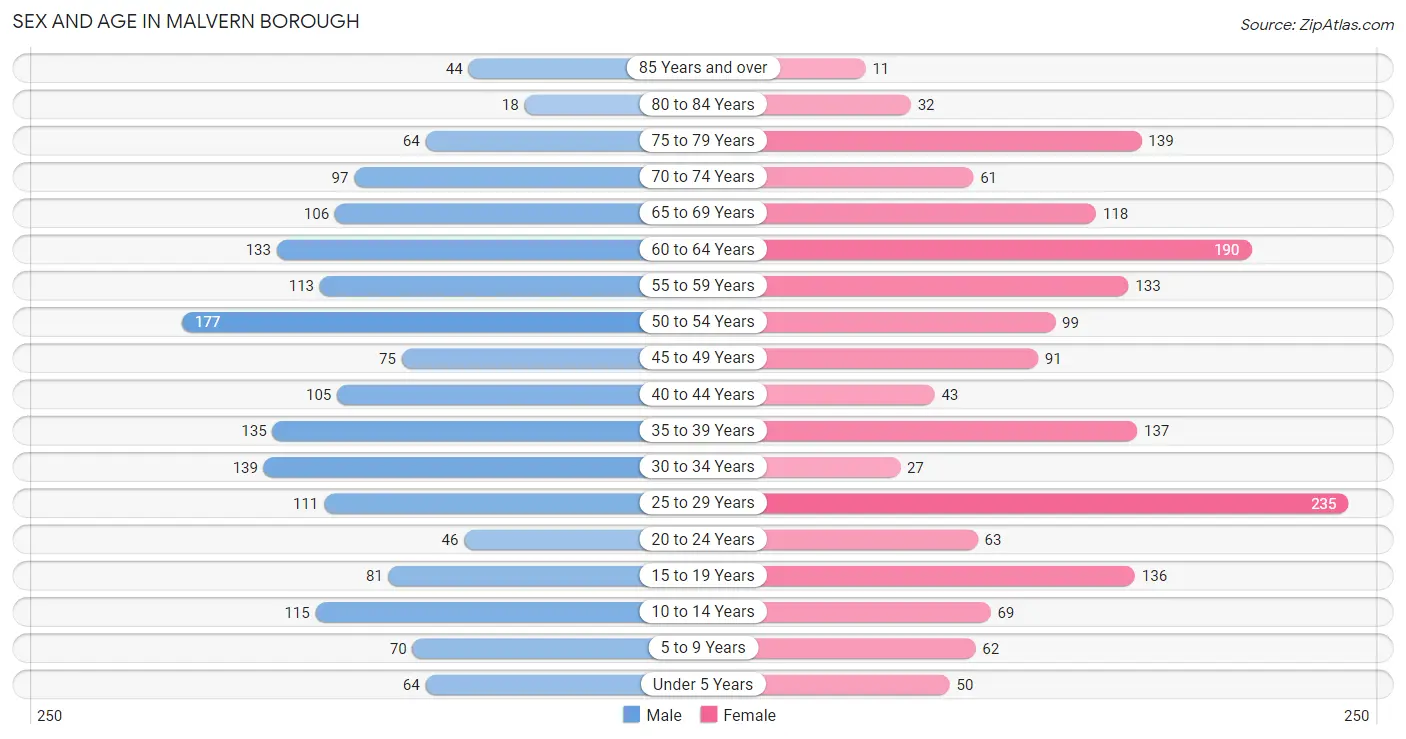
Sex and Age in Malvern borough
Sex and Age in Malvern borough
The most populous age groups in Malvern borough are 50 to 54 Years (177 | 10.4%) for men and 25 to 29 Years (235 | 13.9%) for women.
| Age Bracket | Male | Female |
| Under 5 Years | 64 (3.8%) | 50 (2.9%) |
| 5 to 9 Years | 70 (4.1%) | 62 (3.7%) |
| 10 to 14 Years | 115 (6.8%) | 69 (4.1%) |
| 15 to 19 Years | 81 (4.8%) | 136 (8.0%) |
| 20 to 24 Years | 46 (2.7%) | 63 (3.7%) |
| 25 to 29 Years | 111 (6.6%) | 235 (13.9%) |
| 30 to 34 Years | 139 (8.2%) | 27 (1.6%) |
| 35 to 39 Years | 135 (8.0%) | 137 (8.1%) |
| 40 to 44 Years | 105 (6.2%) | 43 (2.5%) |
| 45 to 49 Years | 75 (4.4%) | 91 (5.4%) |
| 50 to 54 Years | 177 (10.4%) | 99 (5.8%) |
| 55 to 59 Years | 113 (6.7%) | 133 (7.8%) |
| 60 to 64 Years | 133 (7.9%) | 190 (11.2%) |
| 65 to 69 Years | 106 (6.3%) | 118 (7.0%) |
| 70 to 74 Years | 97 (5.7%) | 61 (3.6%) |
| 75 to 79 Years | 64 (3.8%) | 139 (8.2%) |
| 80 to 84 Years | 18 (1.1%) | 32 (1.9%) |
| 85 Years and over | 44 (2.6%) | 11 (0.6%) |
| Total | 1,693 (100.0%) | 1,696 (100.0%) |
Families and Households in Malvern borough
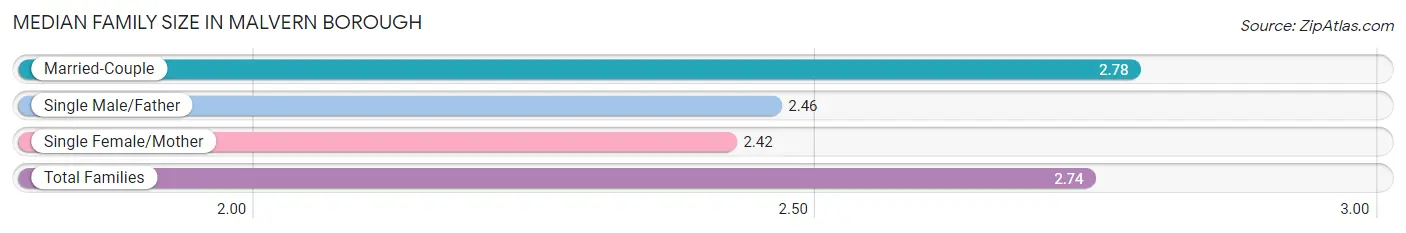
Median Family Size in Malvern borough
The median family size in Malvern borough is 2.74 persons per family, with married-couple families (830 | 88.7%) accounting for the largest median family size of 2.78 persons per family. On the other hand, single female/mother families (43 | 4.6%) represent the smallest median family size with 2.42 persons per family.
| Family Type | # Families | Family Size |
| Married-Couple | 830 (88.7%) | 2.78 |
| Single Male/Father | 63 (6.7%) | 2.46 |
| Single Female/Mother | 43 (4.6%) | 2.42 |
| Total Families | 936 (100.0%) | 2.74 |
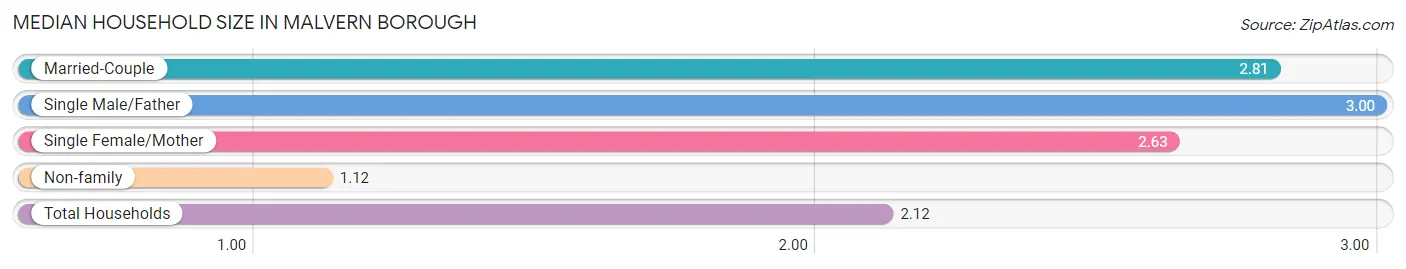
Median Household Size in Malvern borough
The median household size in Malvern borough is 2.12 persons per household, with single male/father households (63 | 4.0%) accounting for the largest median household size of 3 persons per household. non-family households (652 | 41.1%) represent the smallest median household size with 1.12 persons per household.
| Household Type | # Households | Household Size |
| Married-Couple | 830 (52.3%) | 2.81 |
| Single Male/Father | 63 (4.0%) | 3.00 |
| Single Female/Mother | 43 (2.7%) | 2.63 |
| Non-family | 652 (41.1%) | 1.12 |
| Total Households | 1,588 (100.0%) | 2.12 |
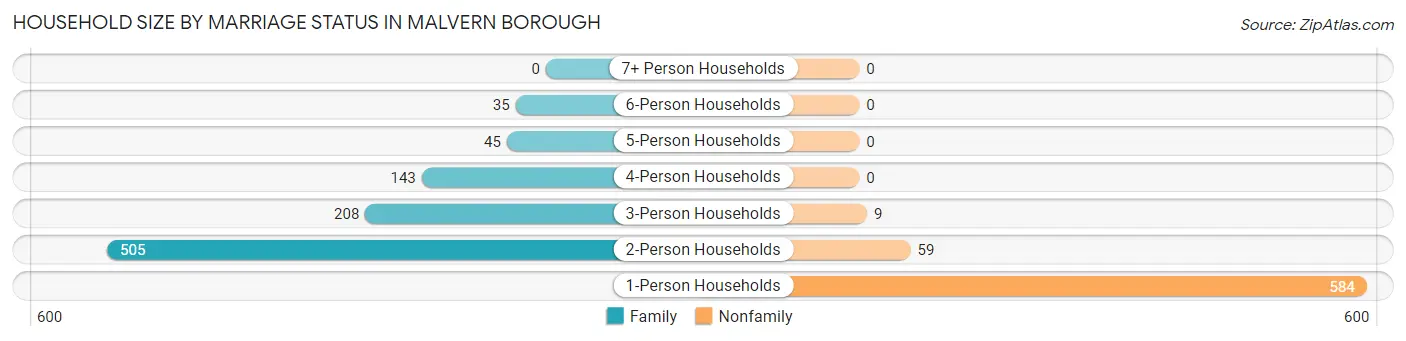
Household Size by Marriage Status in Malvern borough
Out of a total of 1,588 households in Malvern borough, 936 (58.9%) are family households, while 652 (41.1%) are nonfamily households. The most numerous type of family households are 2-person households, comprising 505, and the most common type of nonfamily households are 1-person households, comprising 584.
| Household Size | Family Households | Nonfamily Households |
| 1-Person Households | - | 584 (36.8%) |
| 2-Person Households | 505 (31.8%) | 59 (3.7%) |
| 3-Person Households | 208 (13.1%) | 9 (0.6%) |
| 4-Person Households | 143 (9.0%) | 0 (0.0%) |
| 5-Person Households | 45 (2.8%) | 0 (0.0%) |
| 6-Person Households | 35 (2.2%) | 0 (0.0%) |
| 7+ Person Households | 0 (0.0%) | 0 (0.0%) |
| Total | 936 (58.9%) | 652 (41.1%) |
Female Fertility in Malvern borough
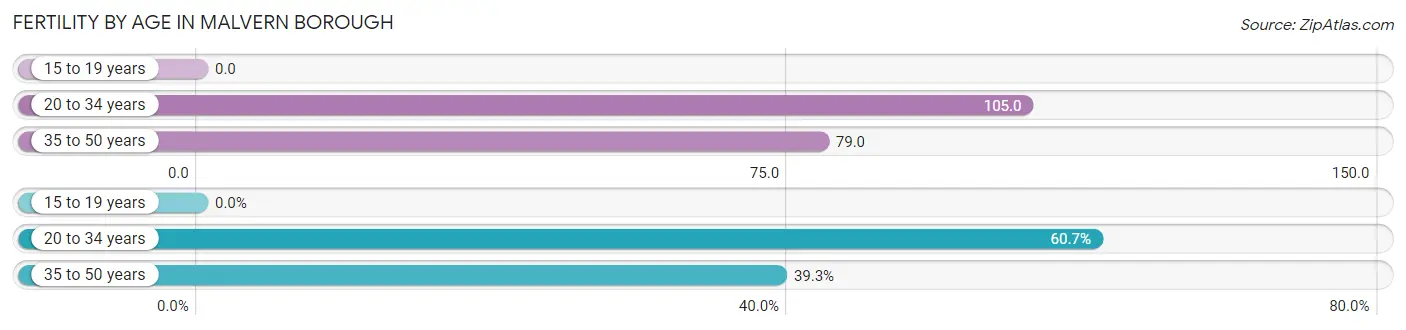
Fertility by Age in Malvern borough
Average fertility rate in Malvern borough is 76.0 births per 1,000 women. Women in the age bracket of 20 to 34 years have the highest fertility rate with 105.0 births per 1,000 women. Women in the age bracket of 20 to 34 years acount for 60.7% of all women with births.
| Age Bracket | Women with Births | Births / 1,000 Women |
| 15 to 19 years | 0 (0.0%) | 0.0 |
| 20 to 34 years | 34 (60.7%) | 105.0 |
| 35 to 50 years | 22 (39.3%) | 79.0 |
| Total | 56 (100.0%) | 76.0 |
Fertility by Age by Marriage Status in Malvern borough
39.3% of women with births (56) in Malvern borough are married. The highest percentage of unmarried women with births falls into 20 to 34 years age bracket with 100.0% of them unmarried at the time of birth, while the lowest percentage of unmarried women with births belong to 35 to 50 years age bracket with 0.0% of them unmarried.
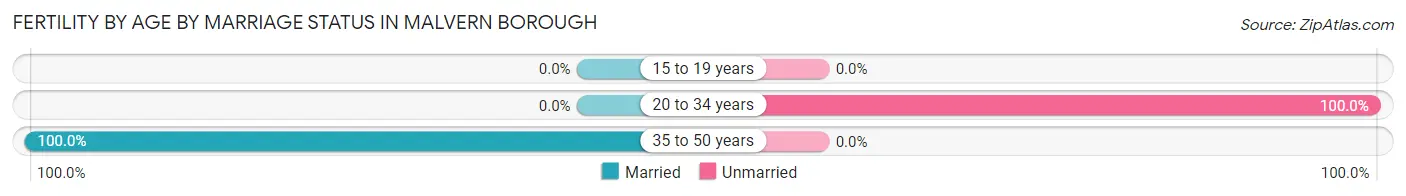
| Age Bracket | Married | Unmarried |
| 15 to 19 years | 0 (0.0%) | 0 (0.0%) |
| 20 to 34 years | 0 (0.0%) | 34 (100.0%) |
| 35 to 50 years | 22 (100.0%) | 0 (0.0%) |
| Total | 22 (39.3%) | 34 (60.7%) |
Fertility by Education in Malvern borough
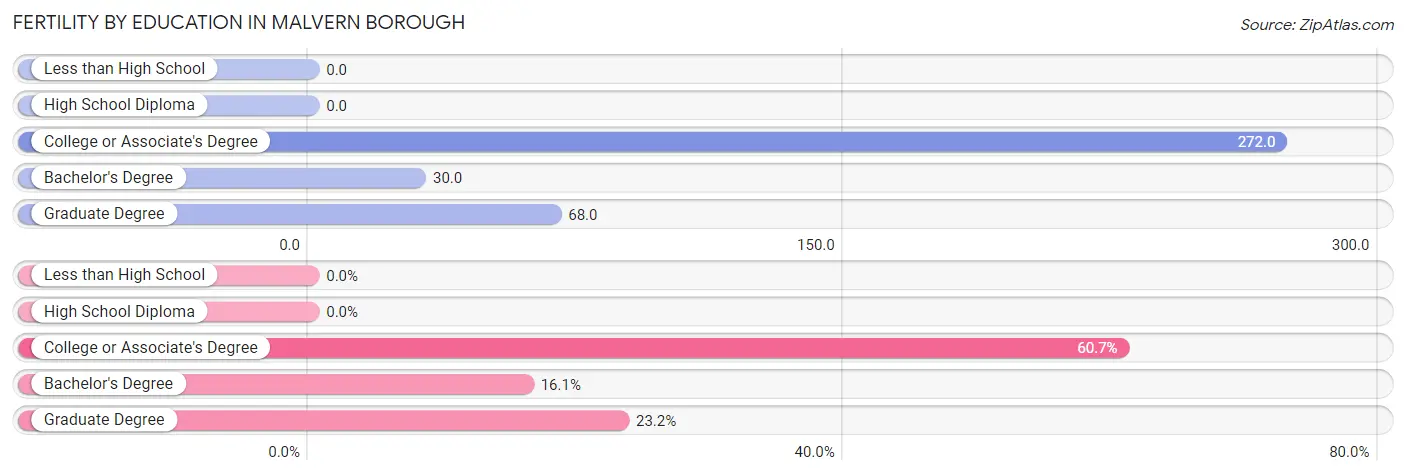
| Educational Attainment | Women with Births | Births / 1,000 Women |
| Less than High School | 0 (0.0%) | 0.0 |
| High School Diploma | 0 (0.0%) | 0.0 |
| College or Associate's Degree | 34 (60.7%) | 272.0 |
| Bachelor's Degree | 9 (16.1%) | 30.0 |
| Graduate Degree | 13 (23.2%) | 68.0 |
| Total | 56 (100.0%) | 76.0 |
Fertility by Education by Marriage Status in Malvern borough
60.7% of women with births in Malvern borough are unmarried. Women with the educational attainment of bachelor's degree are most likely to be married with 100.0% of them married at childbirth, while women with the educational attainment of college or associate's degree are least likely to be married with 100.0% of them unmarried at childbirth.
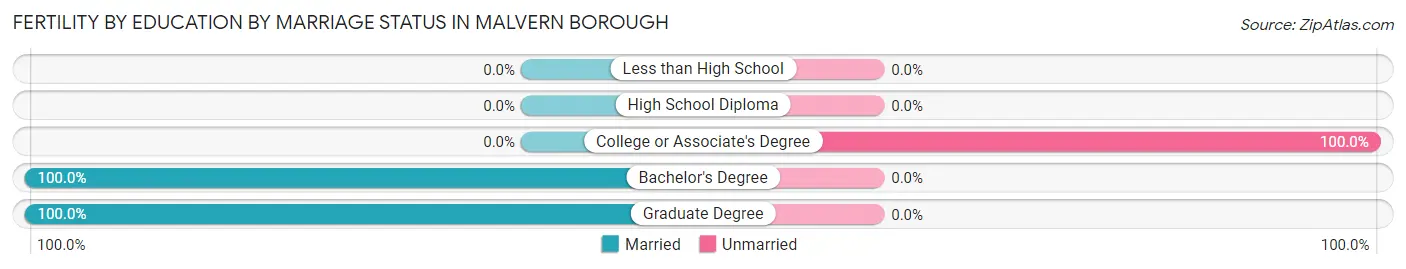
| Educational Attainment | Married | Unmarried |
| Less than High School | 0 (0.0%) | 0 (0.0%) |
| High School Diploma | 0 (0.0%) | 0 (0.0%) |
| College or Associate's Degree | 0 (0.0%) | 34 (100.0%) |
| Bachelor's Degree | 9 (100.0%) | 0 (0.0%) |
| Graduate Degree | 13 (100.0%) | 0 (0.0%) |
| Total | 22 (39.3%) | 34 (60.7%) |
Income in Malvern borough
Income Overview in Malvern borough
Per Capita Income in Malvern borough is $78,031, while median incomes of families and households are $165,786 and $115,743 respectively.
| Characteristic | Number | Measure |
| Per Capita Income | 3,389 | $78,031 |
| Median Family Income | 936 | $165,786 |
| Mean Family Income | 936 | $205,144 |
| Median Household Income | 1,588 | $115,743 |
| Mean Household Income | 1,588 | $162,519 |
| Income Deficit | 936 | $0 |
| Wage / Income Gap (%) | 3,389 | 20.14% |
| Wage / Income Gap ($) | 3,389 | 79.86¢ per $1 |
| Gini / Inequality Index | 3,389 | 0.45 |
Earnings by Sex in Malvern borough
Average Earnings in Malvern borough are $72,446, $78,969 for men and $63,068 for women, a difference of 20.1%.
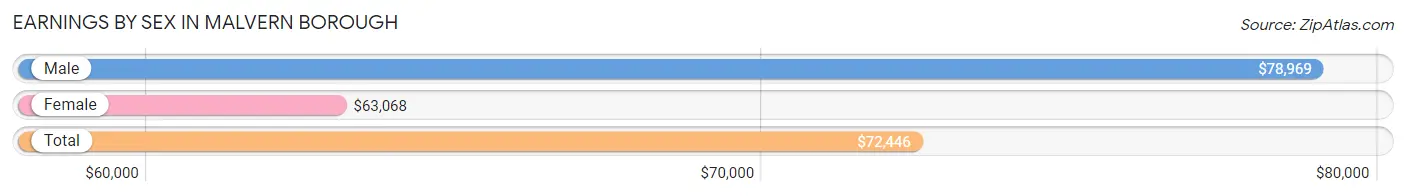
| Sex | Number | Average Earnings |
| Male | 1,111 (51.5%) | $78,969 |
| Female | 1,046 (48.5%) | $63,068 |
| Total | 2,157 (100.0%) | $72,446 |
Earnings by Sex by Income Bracket in Malvern borough
The most common earnings brackets in Malvern borough are $100,000+ for men (460 | 41.4%) and $100,000+ for women (293 | 28.0%).
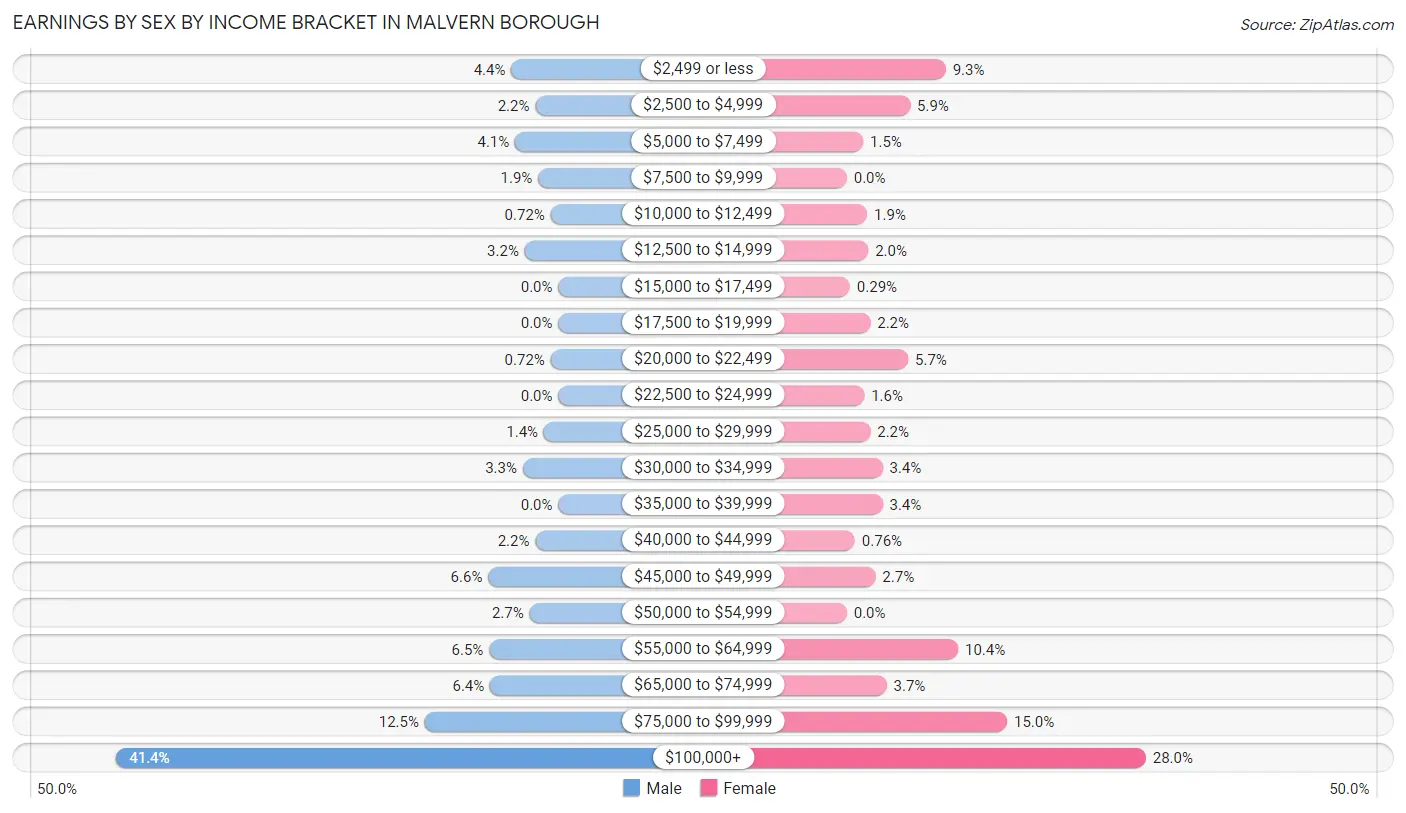
| Income | Male | Female |
| $2,499 or less | 49 (4.4%) | 97 (9.3%) |
| $2,500 to $4,999 | 24 (2.2%) | 62 (5.9%) |
| $5,000 to $7,499 | 45 (4.1%) | 16 (1.5%) |
| $7,500 to $9,999 | 21 (1.9%) | 0 (0.0%) |
| $10,000 to $12,499 | 8 (0.7%) | 20 (1.9%) |
| $12,500 to $14,999 | 35 (3.2%) | 21 (2.0%) |
| $15,000 to $17,499 | 0 (0.0%) | 3 (0.3%) |
| $17,500 to $19,999 | 0 (0.0%) | 23 (2.2%) |
| $20,000 to $22,499 | 8 (0.7%) | 60 (5.7%) |
| $22,500 to $24,999 | 0 (0.0%) | 17 (1.6%) |
| $25,000 to $29,999 | 15 (1.3%) | 23 (2.2%) |
| $30,000 to $34,999 | 37 (3.3%) | 35 (3.4%) |
| $35,000 to $39,999 | 0 (0.0%) | 35 (3.4%) |
| $40,000 to $44,999 | 24 (2.2%) | 8 (0.8%) |
| $45,000 to $49,999 | 73 (6.6%) | 28 (2.7%) |
| $50,000 to $54,999 | 30 (2.7%) | 0 (0.0%) |
| $55,000 to $64,999 | 72 (6.5%) | 109 (10.4%) |
| $65,000 to $74,999 | 71 (6.4%) | 39 (3.7%) |
| $75,000 to $99,999 | 139 (12.5%) | 157 (15.0%) |
| $100,000+ | 460 (41.4%) | 293 (28.0%) |
| Total | 1,111 (100.0%) | 1,046 (100.0%) |
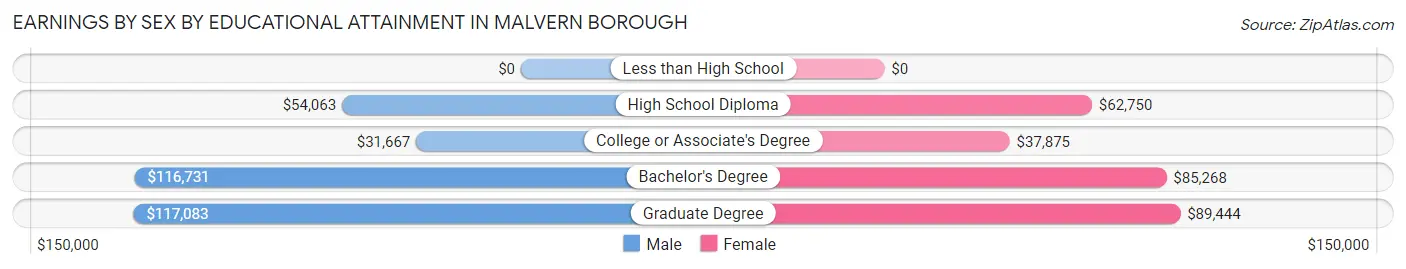
Earnings by Sex by Educational Attainment in Malvern borough
Average earnings in Malvern borough are $85,938 for men and $71,458 for women, a difference of 16.9%. Men with an educational attainment of graduate degree enjoy the highest average annual earnings of $117,083, while those with college or associate's degree education earn the least with $31,667. Women with an educational attainment of graduate degree earn the most with the average annual earnings of $89,444, while those with college or associate's degree education have the smallest earnings of $37,875.
| Educational Attainment | Male Income | Female Income |
| Less than High School | - | - |
| High School Diploma | $54,063 | $62,750 |
| College or Associate's Degree | $31,667 | $37,875 |
| Bachelor's Degree | $116,731 | $85,268 |
| Graduate Degree | $117,083 | $89,444 |
| Total | $85,938 | $71,458 |
Family Income in Malvern borough
Family Income Brackets in Malvern borough
According to the Malvern borough family income data, there are 356 families falling into the $200,000+ income range, which is the most common income bracket and makes up 38.0% of all families.
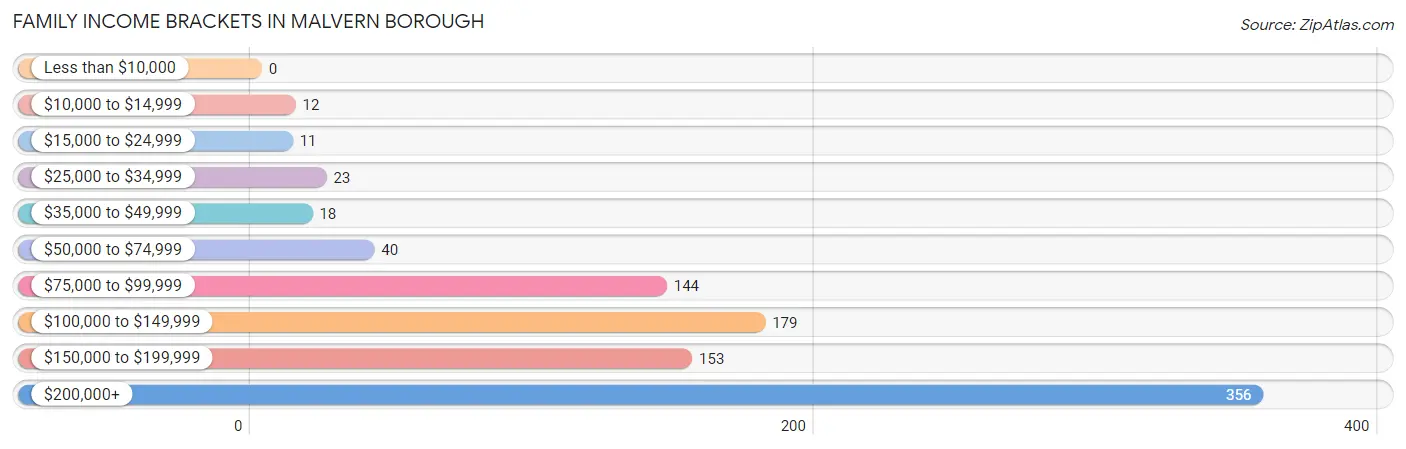
| Income Bracket | # Families | % Families |
| Less than $10,000 | 0 | 0.0% |
| $10,000 to $14,999 | 12 | 1.3% |
| $15,000 to $24,999 | 11 | 1.2% |
| $25,000 to $34,999 | 23 | 2.5% |
| $35,000 to $49,999 | 18 | 1.9% |
| $50,000 to $74,999 | 40 | 4.3% |
| $75,000 to $99,999 | 144 | 15.4% |
| $100,000 to $149,999 | 179 | 19.1% |
| $150,000 to $199,999 | 153 | 16.3% |
| $200,000+ | 356 | 38.0% |
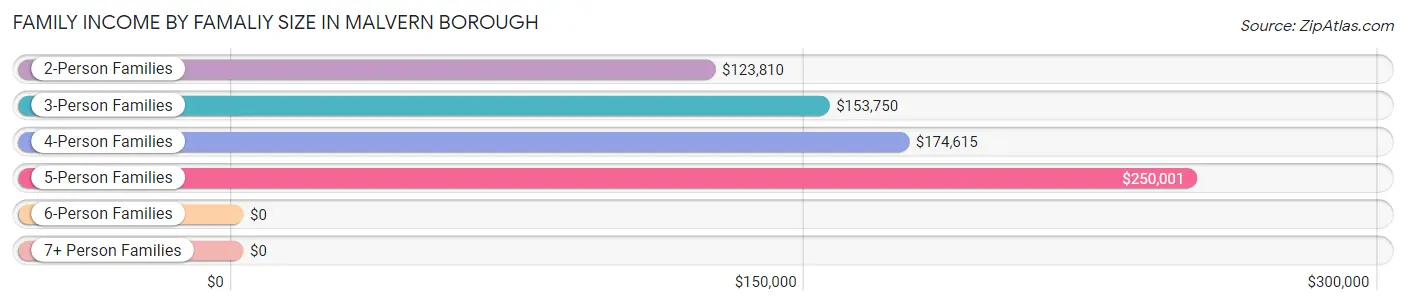
Family Income by Famaliy Size in Malvern borough
5-person families (71 | 7.6%) account for the highest median family income in Malvern borough with $250,001 per family, while 2-person families (538 | 57.5%) have the highest median income of $61,905 per family member.
| Income Bracket | # Families | Median Income |
| 2-Person Families | 538 (57.5%) | $123,810 |
| 3-Person Families | 182 (19.4%) | $153,750 |
| 4-Person Families | 136 (14.5%) | $174,615 |
| 5-Person Families | 71 (7.6%) | $250,001 |
| 6-Person Families | 9 (1.0%) | $0 |
| 7+ Person Families | 0 (0.0%) | $0 |
| Total | 936 (100.0%) | $165,786 |
Family Income by Number of Earners in Malvern borough
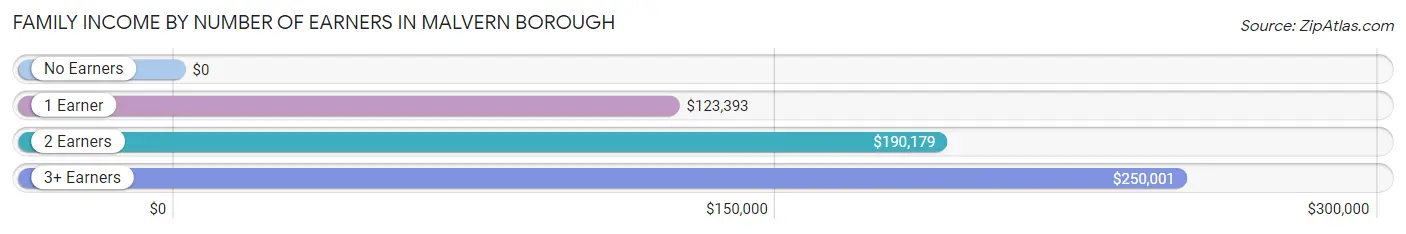
| Number of Earners | # Families | Median Income |
| No Earners | 88 (9.4%) | $0 |
| 1 Earner | 303 (32.4%) | $123,393 |
| 2 Earners | 395 (42.2%) | $190,179 |
| 3+ Earners | 150 (16.0%) | $250,001 |
| Total | 936 (100.0%) | $165,786 |
Household Income in Malvern borough
Household Income Brackets in Malvern borough
With 443 households falling in the category, the $200,000+ income range is the most frequent in Malvern borough, accounting for 27.9% of all households. In contrast, only 30 households (1.9%) fall into the less than $10,000 income bracket, making it the least populous group.
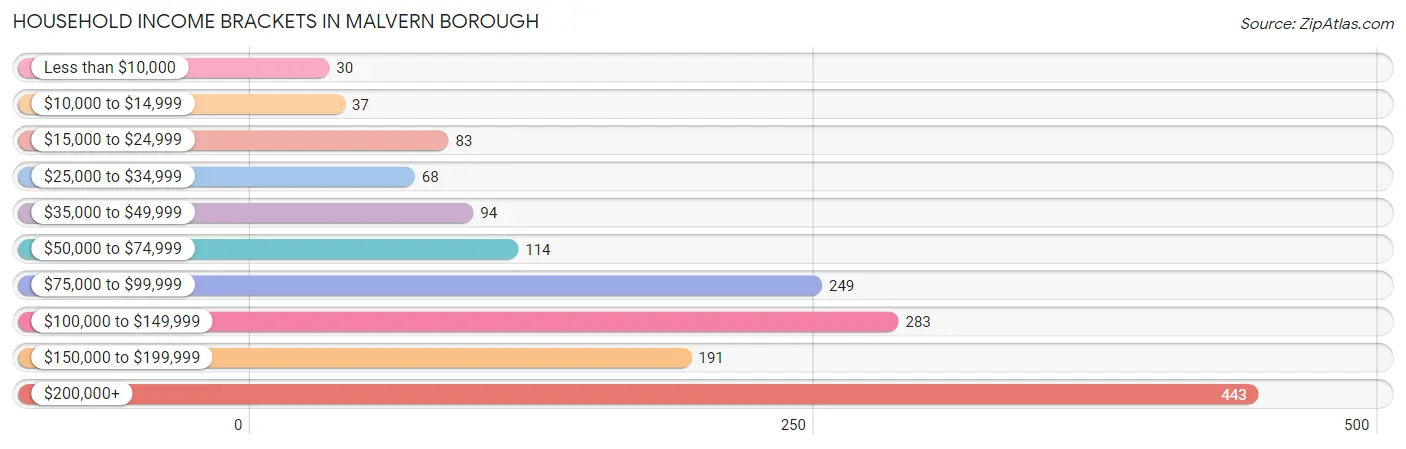
| Income Bracket | # Households | % Households |
| Less than $10,000 | 30 | 1.9% |
| $10,000 to $14,999 | 37 | 2.3% |
| $15,000 to $24,999 | 83 | 5.2% |
| $25,000 to $34,999 | 68 | 4.3% |
| $35,000 to $49,999 | 94 | 5.9% |
| $50,000 to $74,999 | 114 | 7.2% |
| $75,000 to $99,999 | 249 | 15.7% |
| $100,000 to $149,999 | 283 | 17.8% |
| $150,000 to $199,999 | 191 | 12.0% |
| $200,000+ | 443 | 27.9% |
Household Income by Householder Age in Malvern borough
The median household income in Malvern borough is $115,743, with the highest median household income of $136,250 found in the 25 to 44 years age bracket for the primary householder. A total of 494 households (31.1%) fall into this category. Meanwhile, the 15 to 24 years age bracket for the primary householder has the lowest median household income of $0, with 33 households (2.1%) in this group.
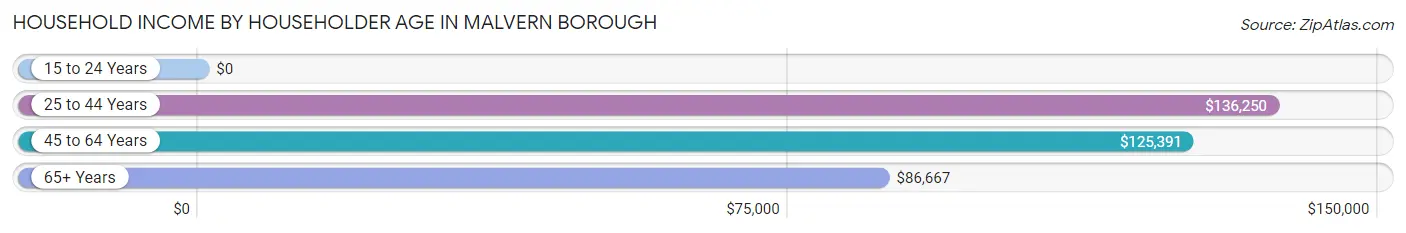
| Income Bracket | # Households | Median Income |
| 15 to 24 Years | 33 (2.1%) | $0 |
| 25 to 44 Years | 494 (31.1%) | $136,250 |
| 45 to 64 Years | 621 (39.1%) | $125,391 |
| 65+ Years | 440 (27.7%) | $86,667 |
| Total | 1,588 (100.0%) | $115,743 |
Poverty in Malvern borough
Income Below Poverty by Sex and Age in Malvern borough
With 5.8% poverty level for males and 4.6% for females among the residents of Malvern borough, 15 year old males and 25 to 34 year old females are the most vulnerable to poverty, with 11 males (57.9%) and 35 females (13.4%) in their respective age groups living below the poverty level.
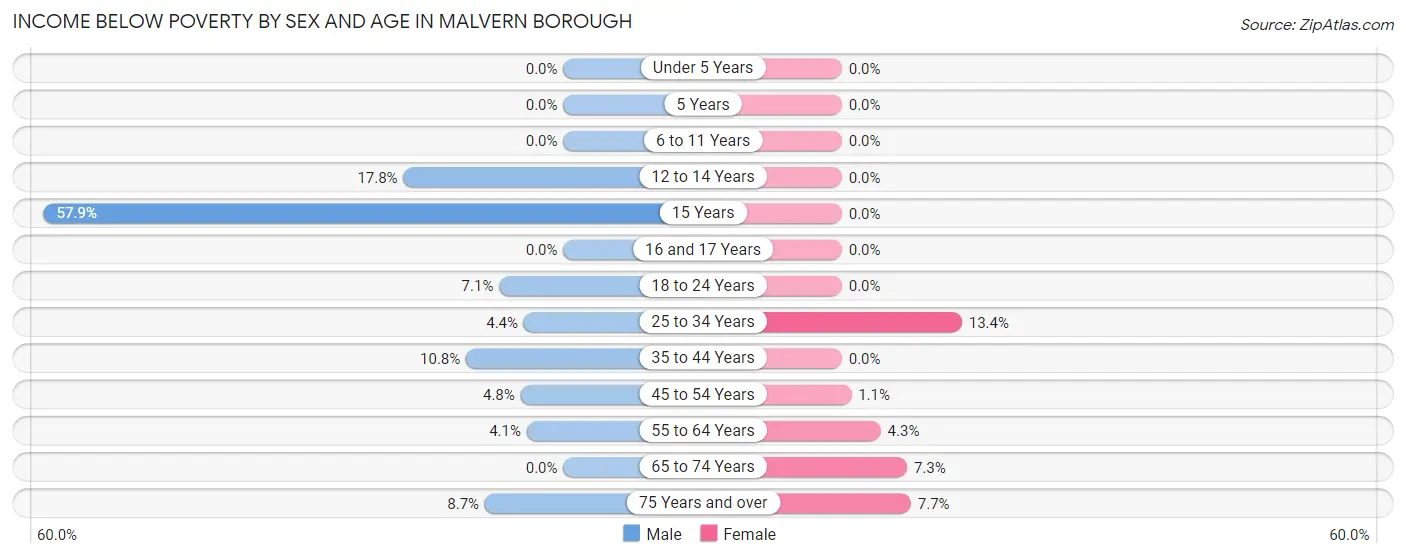
| Age Bracket | Male | Female |
| Under 5 Years | 0 (0.0%) | 0 (0.0%) |
| 5 Years | 0 (0.0%) | 0 (0.0%) |
| 6 to 11 Years | 0 (0.0%) | 0 (0.0%) |
| 12 to 14 Years | 13 (17.8%) | 0 (0.0%) |
| 15 Years | 11 (57.9%) | 0 (0.0%) |
| 16 and 17 Years | 0 (0.0%) | 0 (0.0%) |
| 18 to 24 Years | 4 (7.1%) | 0 (0.0%) |
| 25 to 34 Years | 11 (4.4%) | 35 (13.4%) |
| 35 to 44 Years | 26 (10.8%) | 0 (0.0%) |
| 45 to 54 Years | 12 (4.8%) | 2 (1.1%) |
| 55 to 64 Years | 10 (4.1%) | 14 (4.3%) |
| 65 to 74 Years | 0 (0.0%) | 13 (7.3%) |
| 75 Years and over | 11 (8.7%) | 14 (7.7%) |
| Total | 98 (5.8%) | 78 (4.6%) |
Income Above Poverty by Sex and Age in Malvern borough
According to the poverty statistics in Malvern borough, males aged under 5 years and females aged under 5 years are the age groups that are most secure financially, with 100.0% of males and 100.0% of females in these age groups living above the poverty line.
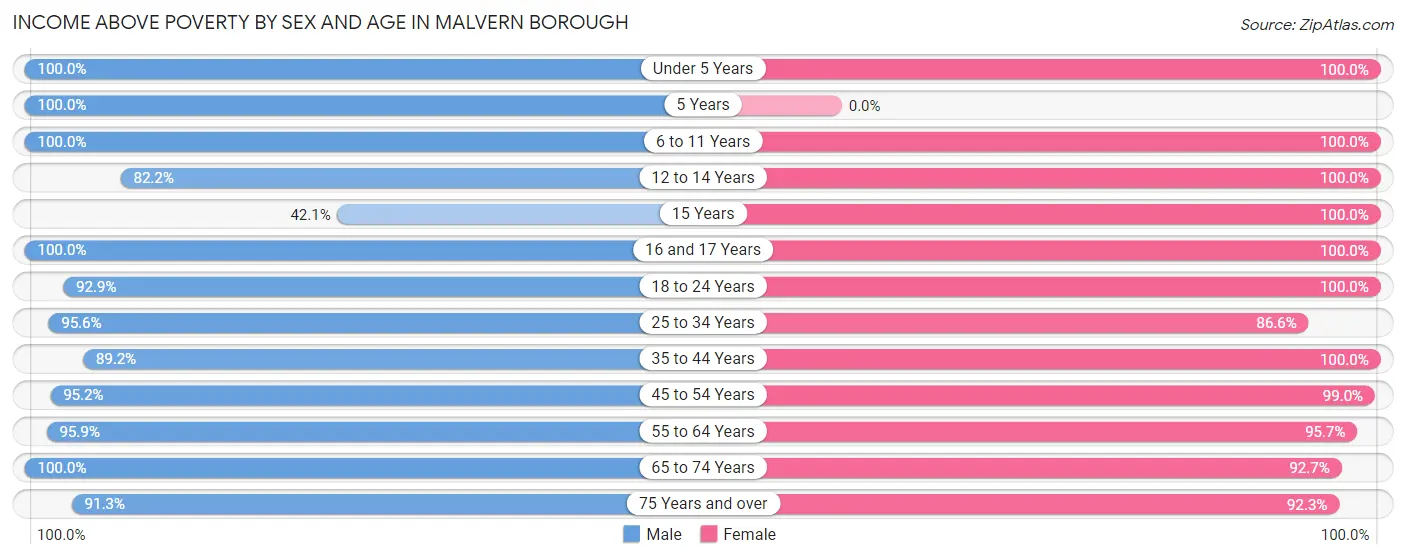
| Age Bracket | Male | Female |
| Under 5 Years | 64 (100.0%) | 50 (100.0%) |
| 5 Years | 5 (100.0%) | 0 (0.0%) |
| 6 to 11 Years | 107 (100.0%) | 62 (100.0%) |
| 12 to 14 Years | 60 (82.2%) | 69 (100.0%) |
| 15 Years | 8 (42.1%) | 31 (100.0%) |
| 16 and 17 Years | 52 (100.0%) | 82 (100.0%) |
| 18 to 24 Years | 52 (92.9%) | 86 (100.0%) |
| 25 to 34 Years | 239 (95.6%) | 227 (86.6%) |
| 35 to 44 Years | 214 (89.2%) | 180 (100.0%) |
| 45 to 54 Years | 240 (95.2%) | 188 (99.0%) |
| 55 to 64 Years | 236 (95.9%) | 309 (95.7%) |
| 65 to 74 Years | 203 (100.0%) | 166 (92.7%) |
| 75 Years and over | 115 (91.3%) | 168 (92.3%) |
| Total | 1,595 (94.2%) | 1,618 (95.4%) |
Income Below Poverty Among Married-Couple Families in Malvern borough
The poverty statistics for married-couple families in Malvern borough show that 1.3% or 11 of the total 830 families live below the poverty line. Families with no children have the highest poverty rate of 2.0%, comprising of 11 families. On the other hand, families with 1 or 2 children have the lowest poverty rate of 0.0%, which includes 0 families.
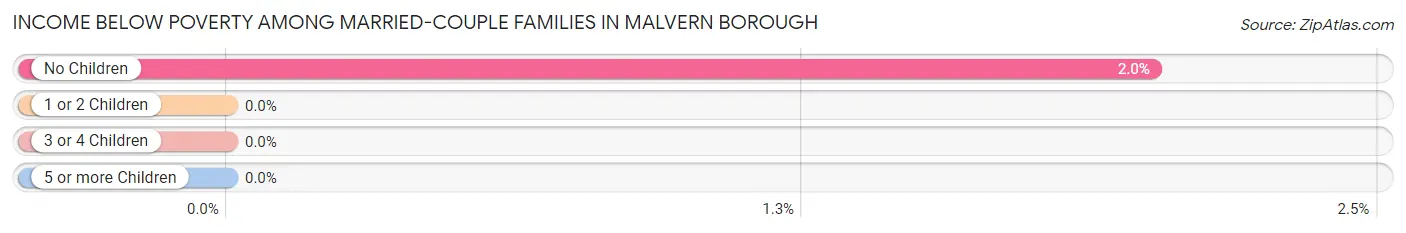
| Children | Above Poverty | Below Poverty |
| No Children | 536 (98.0%) | 11 (2.0%) |
| 1 or 2 Children | 220 (100.0%) | 0 (0.0%) |
| 3 or 4 Children | 63 (100.0%) | 0 (0.0%) |
| 5 or more Children | 0 (0.0%) | 0 (0.0%) |
| Total | 819 (98.7%) | 11 (1.3%) |
Income Below Poverty Among Single-Parent Households in Malvern borough
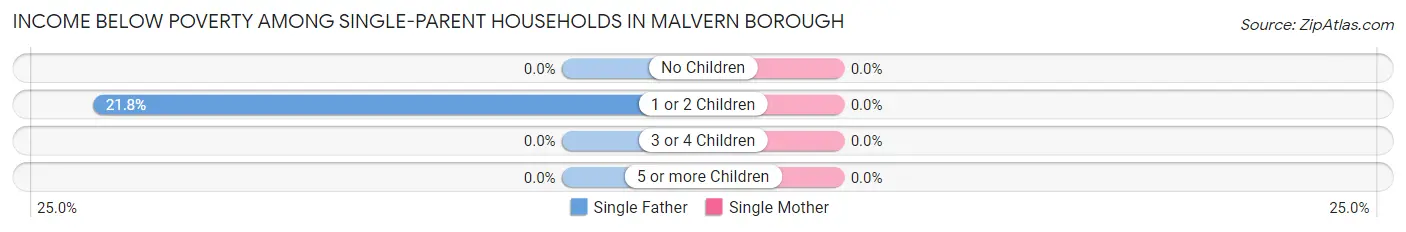
| Children | Single Father | Single Mother |
| No Children | 0 (0.0%) | 0 (0.0%) |
| 1 or 2 Children | 12 (21.8%) | 0 (0.0%) |
| 3 or 4 Children | 0 (0.0%) | 0 (0.0%) |
| 5 or more Children | 0 (0.0%) | 0 (0.0%) |
| Total | 12 (19.1%) | 0 (0.0%) |
Income Below Poverty Among Married-Couple vs Single-Parent Households in Malvern borough
The poverty data for Malvern borough shows that 11 of the married-couple family households (1.3%) and 12 of the single-parent households (11.3%) are living below the poverty level. Within the married-couple family households, those with no children have the highest poverty rate, with 11 households (2.0%) falling below the poverty line. Among the single-parent households, those with 1 or 2 children have the highest poverty rate, with 12 household (14.8%) living below poverty.
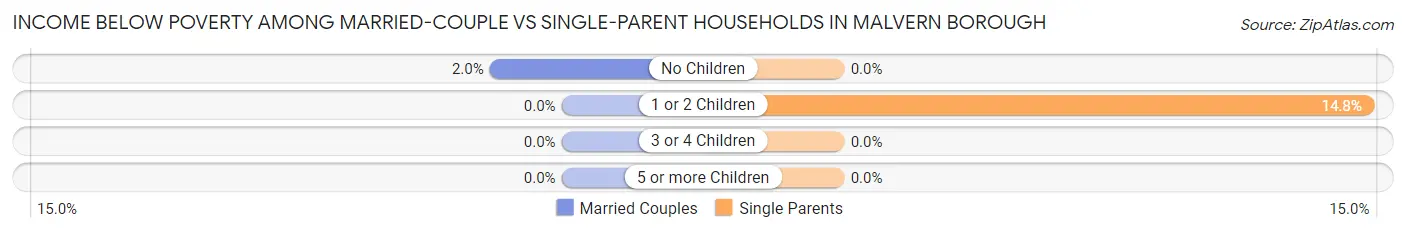
| Children | Married-Couple Families | Single-Parent Households |
| No Children | 11 (2.0%) | 0 (0.0%) |
| 1 or 2 Children | 0 (0.0%) | 12 (14.8%) |
| 3 or 4 Children | 0 (0.0%) | 0 (0.0%) |
| 5 or more Children | 0 (0.0%) | 0 (0.0%) |
| Total | 11 (1.3%) | 12 (11.3%) |
Employment Characteristics in Malvern borough
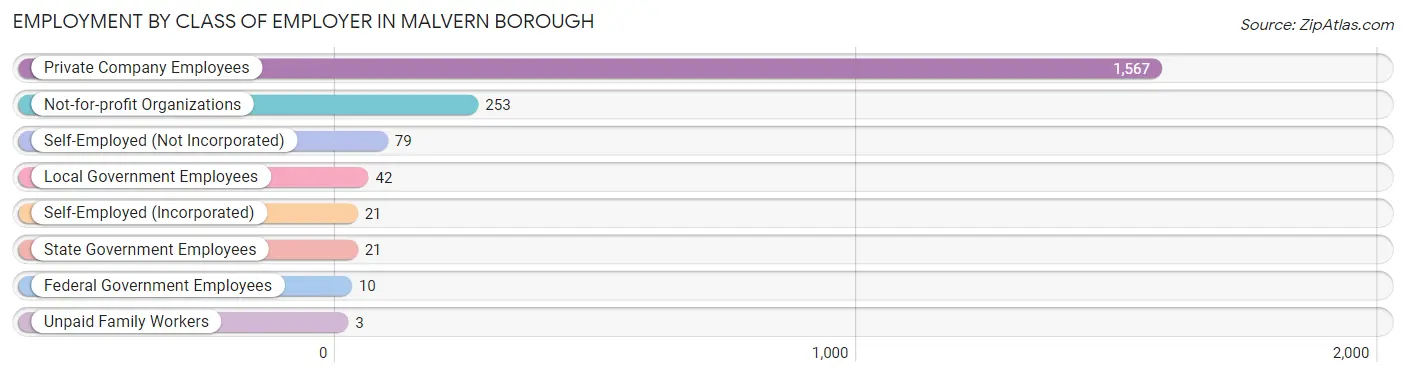
Employment by Class of Employer in Malvern borough
Among the 1,996 employed individuals in Malvern borough, private company employees (1,567 | 78.5%), not-for-profit organizations (253 | 12.7%), and self-employed (not incorporated) (79 | 4.0%) make up the most common classes of employment.
| Employer Class | # Employees | % Employees |
| Private Company Employees | 1,567 | 78.5% |
| Self-Employed (Incorporated) | 21 | 1.1% |
| Self-Employed (Not Incorporated) | 79 | 4.0% |
| Not-for-profit Organizations | 253 | 12.7% |
| Local Government Employees | 42 | 2.1% |
| State Government Employees | 21 | 1.1% |
| Federal Government Employees | 10 | 0.5% |
| Unpaid Family Workers | 3 | 0.2% |
| Total | 1,996 | 100.0% |
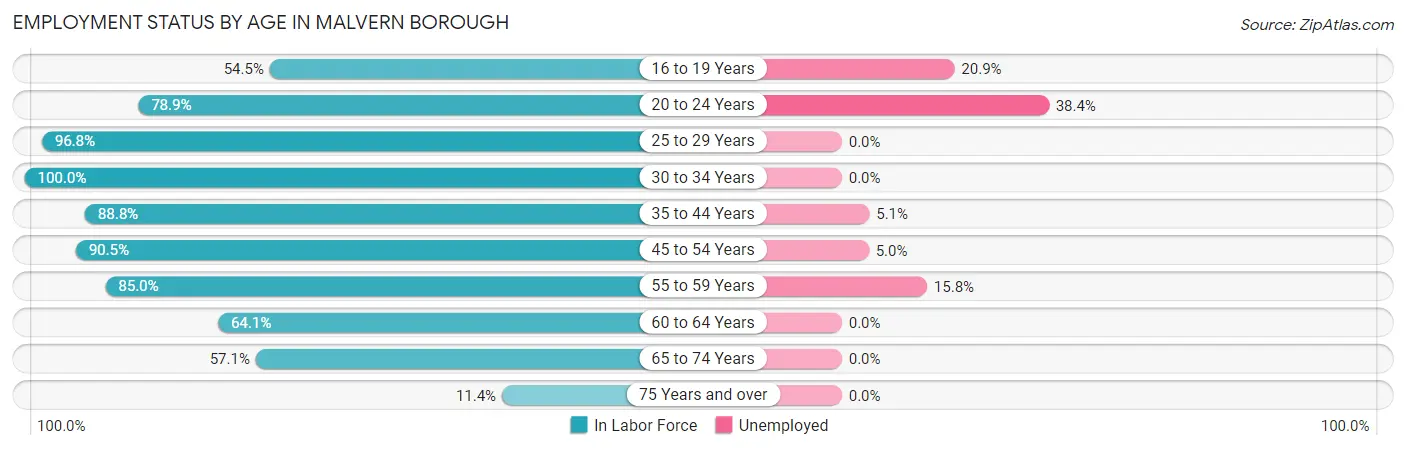
Employment Status by Age in Malvern borough
According to the labor force statistics for Malvern borough, out of the total population over 16 years of age (2,909), 72.9% or 2,121 individuals are in the labor force, with 5.9% or 125 of them unemployed. The age group with the highest labor force participation rate is 30 to 34 years, with 100.0% or 166 individuals in the labor force. Within the labor force, the 20 to 24 years age range has the highest percentage of unemployed individuals, with 38.4% or 33 of them being unemployed.
| Age Bracket | In Labor Force | Unemployed |
| 16 to 19 Years | 91 (54.5%) | 19 (20.9%) |
| 20 to 24 Years | 86 (78.9%) | 33 (38.4%) |
| 25 to 29 Years | 335 (96.8%) | 0 (0.0%) |
| 30 to 34 Years | 166 (100.0%) | 0 (0.0%) |
| 35 to 44 Years | 373 (88.8%) | 19 (5.1%) |
| 45 to 54 Years | 400 (90.5%) | 20 (5.0%) |
| 55 to 59 Years | 209 (85.0%) | 33 (15.8%) |
| 60 to 64 Years | 207 (64.1%) | 0 (0.0%) |
| 65 to 74 Years | 218 (57.1%) | 0 (0.0%) |
| 75 Years and over | 35 (11.4%) | 0 (0.0%) |
| Total | 2,121 (72.9%) | 125 (5.9%) |
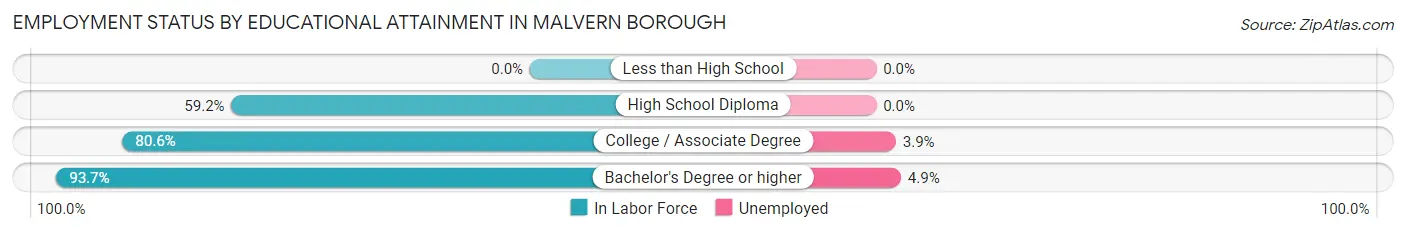
Employment Status by Educational Attainment in Malvern borough
According to labor force statistics for Malvern borough, 87.0% of individuals (1,690) out of the total population between 25 and 64 years of age (1,943) are in the labor force, with 4.3% or 73 of them being unemployed. The group with the highest labor force participation rate are those with the educational attainment of bachelor's degree or higher, with 93.7% or 1,319 individuals in the labor force. Within the labor force, individuals with bachelor's degree or higher education have the highest percentage of unemployment, with 4.9% or 65 of them being unemployed.
| Educational Attainment | In Labor Force | Unemployed |
| Less than High School | 0 (0.0%) | 0 (0.0%) |
| High School Diploma | 167 (59.2%) | 0 (0.0%) |
| College / Associate Degree | 204 (80.6%) | 10 (3.9%) |
| Bachelor's Degree or higher | 1,319 (93.7%) | 69 (4.9%) |
| Total | 1,690 (87.0%) | 84 (4.3%) |
Employment Occupations by Sex in Malvern borough
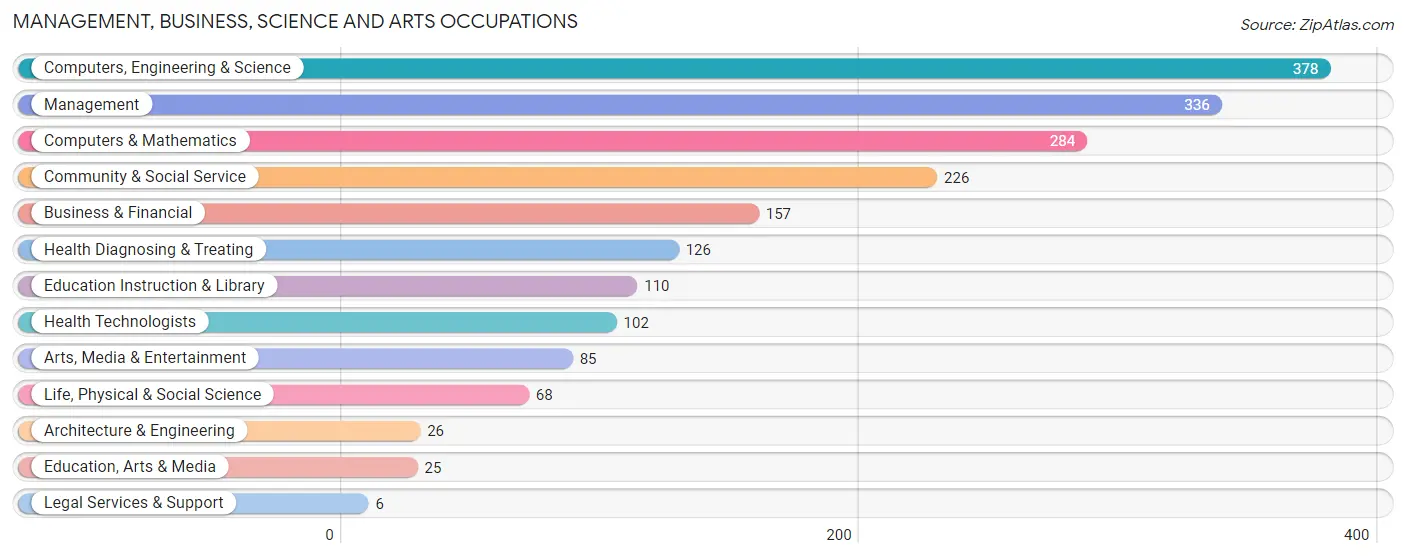
Management, Business, Science and Arts Occupations
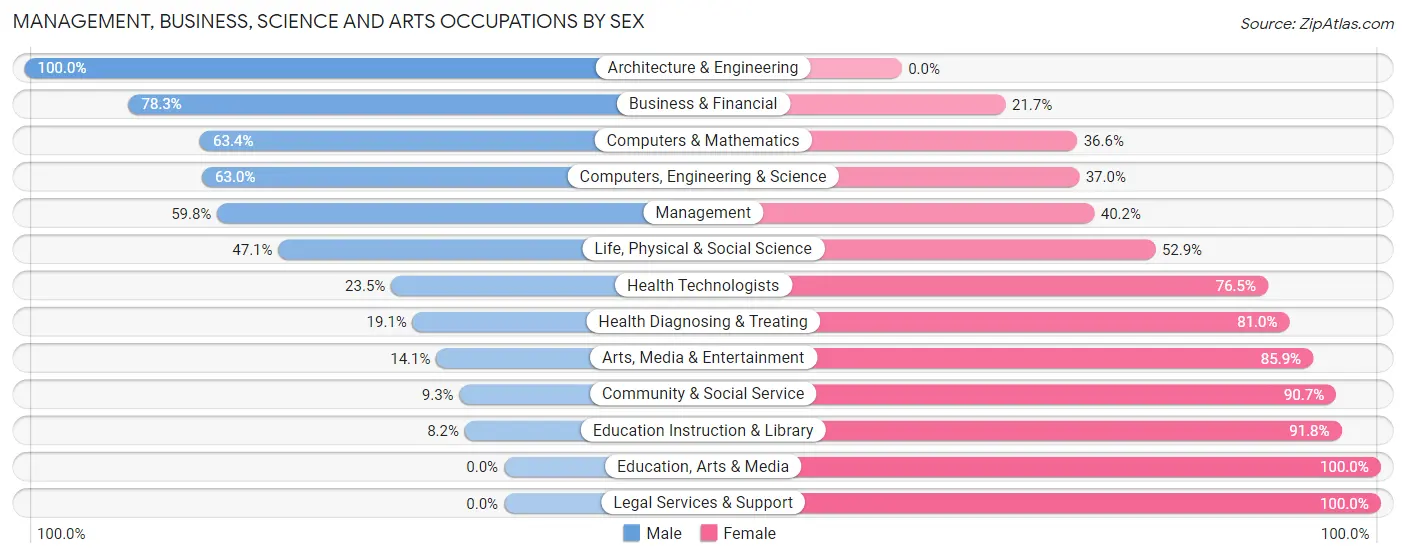
The most common Management, Business, Science and Arts occupations in Malvern borough are Computers, Engineering & Science (378 | 19.0%), Management (336 | 16.9%), Computers & Mathematics (284 | 14.3%), Community & Social Service (226 | 11.4%), and Business & Financial (157 | 7.9%).
Management, Business, Science and Arts Occupations by Sex
Within the Management, Business, Science and Arts occupations in Malvern borough, the most male-oriented occupations are Architecture & Engineering (100.0%), Business & Financial (78.3%), and Computers & Mathematics (63.4%), while the most female-oriented occupations are Education, Arts & Media (100.0%), Legal Services & Support (100.0%), and Education Instruction & Library (91.8%).
| Occupation | Male | Female |
| Management | 201 (59.8%) | 135 (40.2%) |
| Business & Financial | 123 (78.3%) | 34 (21.7%) |
| Computers, Engineering & Science | 238 (63.0%) | 140 (37.0%) |
| Computers & Mathematics | 180 (63.4%) | 104 (36.6%) |
| Architecture & Engineering | 26 (100.0%) | 0 (0.0%) |
| Life, Physical & Social Science | 32 (47.1%) | 36 (52.9%) |
| Community & Social Service | 21 (9.3%) | 205 (90.7%) |
| Education, Arts & Media | 0 (0.0%) | 25 (100.0%) |
| Legal Services & Support | 0 (0.0%) | 6 (100.0%) |
| Education Instruction & Library | 9 (8.2%) | 101 (91.8%) |
| Arts, Media & Entertainment | 12 (14.1%) | 73 (85.9%) |
| Health Diagnosing & Treating | 24 (19.1%) | 102 (80.9%) |
| Health Technologists | 24 (23.5%) | 78 (76.5%) |
| Total (Category) | 607 (49.6%) | 616 (50.4%) |
| Total (Overall) | 1,014 (51.1%) | 972 (48.9%) |
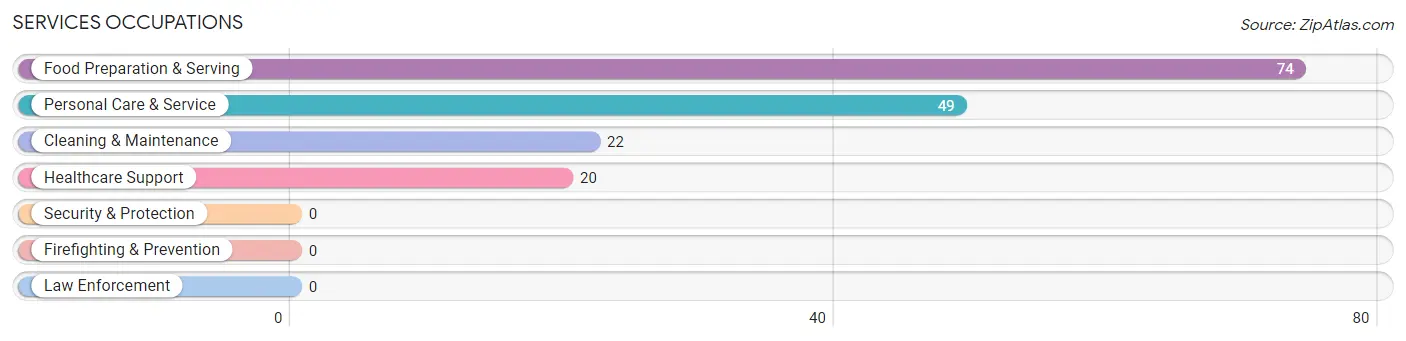
Services Occupations
The most common Services occupations in Malvern borough are Food Preparation & Serving (74 | 3.7%), Personal Care & Service (49 | 2.5%), Cleaning & Maintenance (22 | 1.1%), and Healthcare Support (20 | 1.0%).
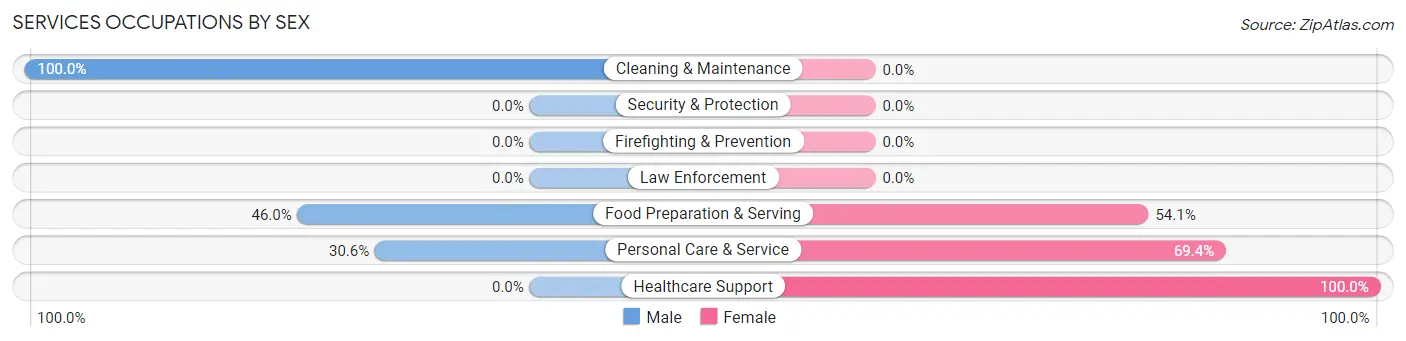
Services Occupations by Sex
Within the Services occupations in Malvern borough, the most male-oriented occupations are Cleaning & Maintenance (100.0%), Food Preparation & Serving (46.0%), and Personal Care & Service (30.6%), while the most female-oriented occupations are Healthcare Support (100.0%), Personal Care & Service (69.4%), and Food Preparation & Serving (54.0%).
| Occupation | Male | Female |
| Healthcare Support | 0 (0.0%) | 20 (100.0%) |
| Security & Protection | 0 (0.0%) | 0 (0.0%) |
| Firefighting & Prevention | 0 (0.0%) | 0 (0.0%) |
| Law Enforcement | 0 (0.0%) | 0 (0.0%) |
| Food Preparation & Serving | 34 (46.0%) | 40 (54.0%) |
| Cleaning & Maintenance | 22 (100.0%) | 0 (0.0%) |
| Personal Care & Service | 15 (30.6%) | 34 (69.4%) |
| Total (Category) | 71 (43.0%) | 94 (57.0%) |
| Total (Overall) | 1,014 (51.1%) | 972 (48.9%) |
Sales and Office Occupations
The most common Sales and Office occupations in Malvern borough are Office & Administration (237 | 11.9%), and Sales & Related (195 | 9.8%).

Sales and Office Occupations by Sex

| Occupation | Male | Female |
| Sales & Related | 118 (60.5%) | 77 (39.5%) |
| Office & Administration | 70 (29.5%) | 167 (70.5%) |
| Total (Category) | 188 (43.5%) | 244 (56.5%) |
| Total (Overall) | 1,014 (51.1%) | 972 (48.9%) |
Natural Resources, Construction and Maintenance Occupations
The most common Natural Resources, Construction and Maintenance occupations in Malvern borough are Installation, Maintenance & Repair (50 | 2.5%), and Construction & Extraction (38 | 1.9%).

Natural Resources, Construction and Maintenance Occupations by Sex

| Occupation | Male | Female |
| Farming, Fishing & Forestry | 0 (0.0%) | 0 (0.0%) |
| Construction & Extraction | 38 (100.0%) | 0 (0.0%) |
| Installation, Maintenance & Repair | 50 (100.0%) | 0 (0.0%) |
| Total (Category) | 88 (100.0%) | 0 (0.0%) |
| Total (Overall) | 1,014 (51.1%) | 972 (48.9%) |
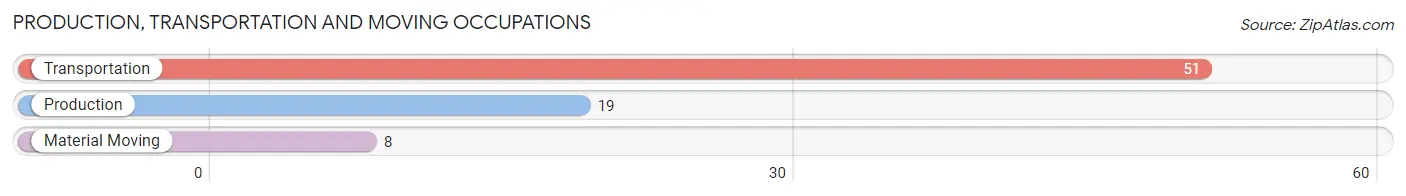
Production, Transportation and Moving Occupations
The most common Production, Transportation and Moving occupations in Malvern borough are Transportation (51 | 2.6%), Production (19 | 1.0%), and Material Moving (8 | 0.4%).
Production, Transportation and Moving Occupations by Sex
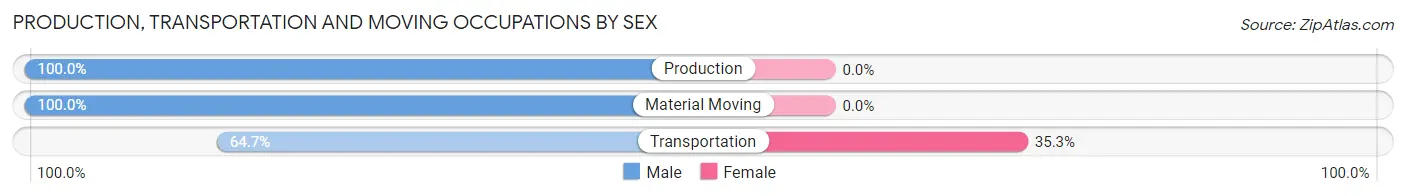
| Occupation | Male | Female |
| Production | 19 (100.0%) | 0 (0.0%) |
| Transportation | 33 (64.7%) | 18 (35.3%) |
| Material Moving | 8 (100.0%) | 0 (0.0%) |
| Total (Category) | 60 (76.9%) | 18 (23.1%) |
| Total (Overall) | 1,014 (51.1%) | 972 (48.9%) |
Employment Industries by Sex in Malvern borough
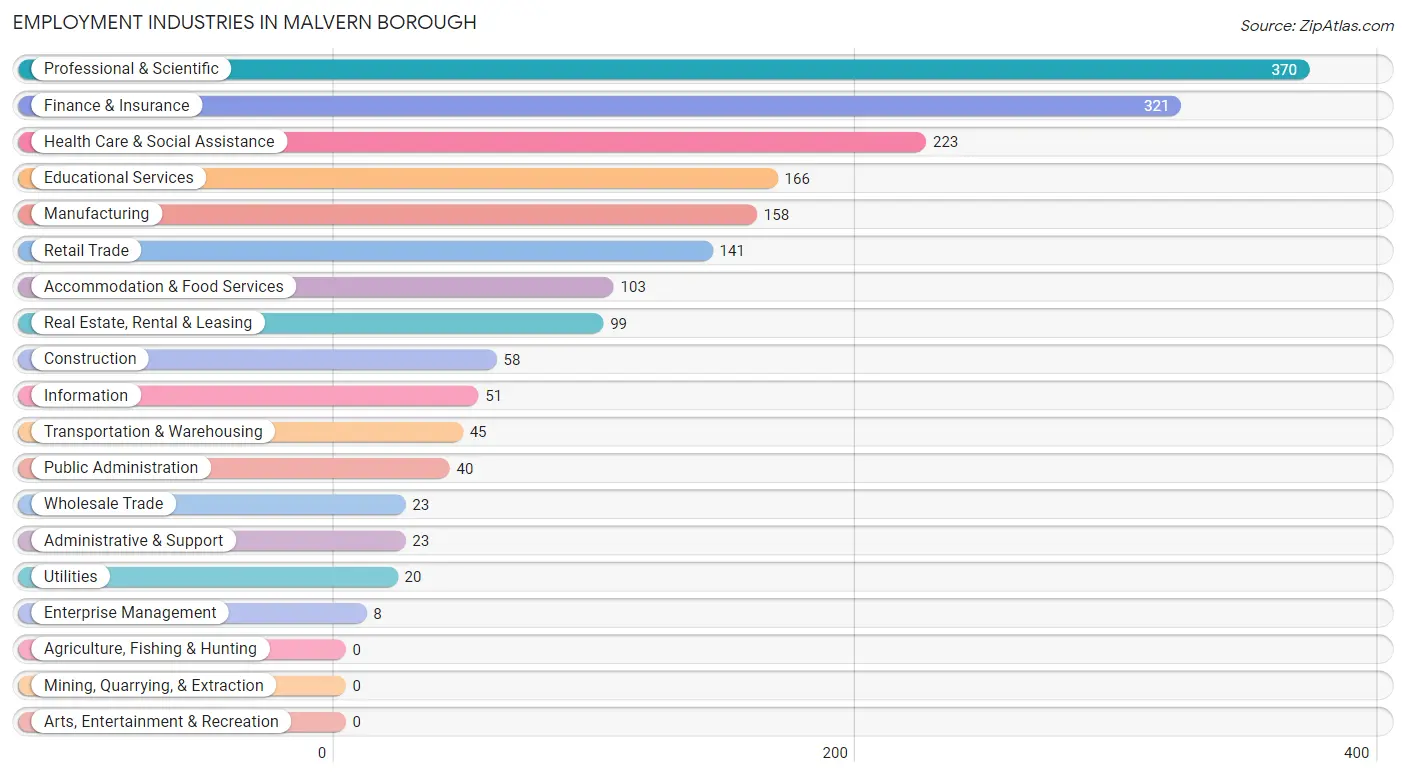
Employment Industries in Malvern borough
The major employment industries in Malvern borough include Professional & Scientific (370 | 18.6%), Finance & Insurance (321 | 16.2%), Health Care & Social Assistance (223 | 11.2%), Educational Services (166 | 8.4%), and Manufacturing (158 | 8.0%).
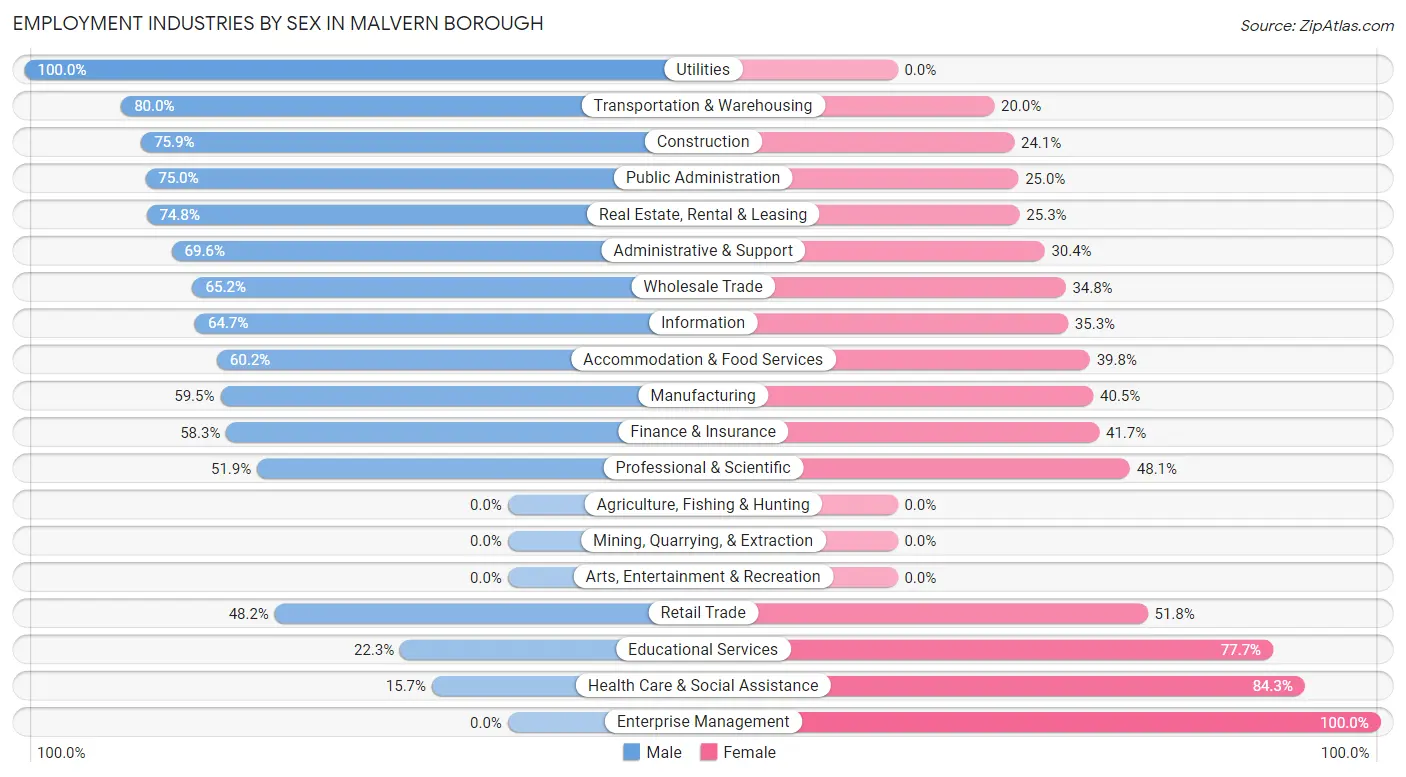
Employment Industries by Sex in Malvern borough
The Malvern borough industries that see more men than women are Utilities (100.0%), Transportation & Warehousing (80.0%), and Construction (75.9%), whereas the industries that tend to have a higher number of women are Enterprise Management (100.0%), Health Care & Social Assistance (84.3%), and Educational Services (77.7%).
| Industry | Male | Female |
| Agriculture, Fishing & Hunting | 0 (0.0%) | 0 (0.0%) |
| Mining, Quarrying, & Extraction | 0 (0.0%) | 0 (0.0%) |
| Construction | 44 (75.9%) | 14 (24.1%) |
| Manufacturing | 94 (59.5%) | 64 (40.5%) |
| Wholesale Trade | 15 (65.2%) | 8 (34.8%) |
| Retail Trade | 68 (48.2%) | 73 (51.8%) |
| Transportation & Warehousing | 36 (80.0%) | 9 (20.0%) |
| Utilities | 20 (100.0%) | 0 (0.0%) |
| Information | 33 (64.7%) | 18 (35.3%) |
| Finance & Insurance | 187 (58.3%) | 134 (41.7%) |
| Real Estate, Rental & Leasing | 74 (74.8%) | 25 (25.3%) |
| Professional & Scientific | 192 (51.9%) | 178 (48.1%) |
| Enterprise Management | 0 (0.0%) | 8 (100.0%) |
| Administrative & Support | 16 (69.6%) | 7 (30.4%) |
| Educational Services | 37 (22.3%) | 129 (77.7%) |
| Health Care & Social Assistance | 35 (15.7%) | 188 (84.3%) |
| Arts, Entertainment & Recreation | 0 (0.0%) | 0 (0.0%) |
| Accommodation & Food Services | 62 (60.2%) | 41 (39.8%) |
| Public Administration | 30 (75.0%) | 10 (25.0%) |
| Total | 1,014 (51.1%) | 972 (48.9%) |
Education in Malvern borough
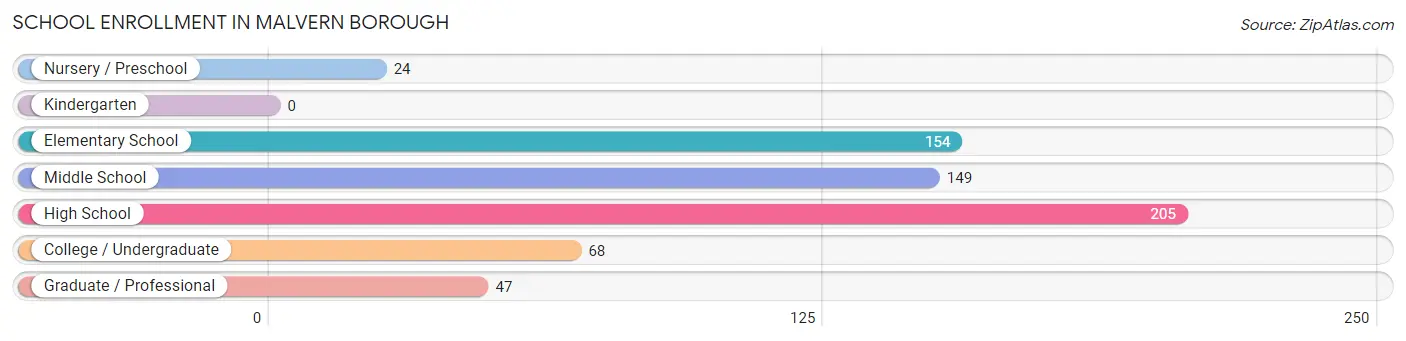
School Enrollment in Malvern borough
The most common levels of schooling among the 647 students in Malvern borough are high school (205 | 31.7%), elementary school (154 | 23.8%), and middle school (149 | 23.0%).
| School Level | # Students | % Students |
| Nursery / Preschool | 24 | 3.7% |
| Kindergarten | 0 | 0.0% |
| Elementary School | 154 | 23.8% |
| Middle School | 149 | 23.0% |
| High School | 205 | 31.7% |
| College / Undergraduate | 68 | 10.5% |
| Graduate / Professional | 47 | 7.3% |
| Total | 647 | 100.0% |
School Enrollment by Age by Funding Source in Malvern borough
Out of a total of 647 students who are enrolled in schools in Malvern borough, 193 (29.8%) attend a private institution, while the remaining 454 (70.2%) are enrolled in public schools. The age group of 15 to 17 year olds has the highest likelihood of being enrolled in private schools, with 76 (41.3% in the age bracket) enrolled. Conversely, the age group of 18 to 19 year olds has the lowest likelihood of being enrolled in a private school, with 20 (100.0% in the age bracket) attending a public institution.
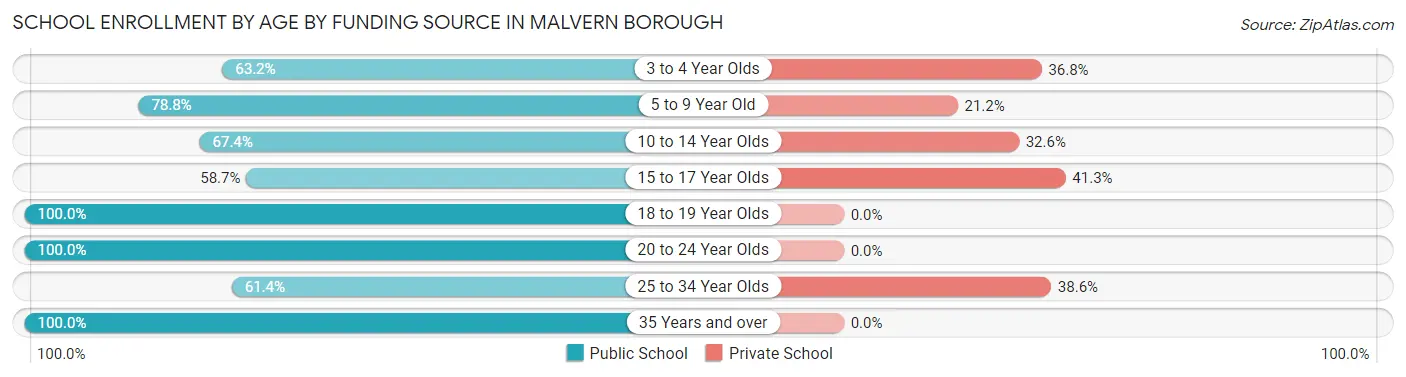
| Age Bracket | Public School | Private School |
| 3 to 4 Year Olds | 12 (63.2%) | 7 (36.8%) |
| 5 to 9 Year Old | 104 (78.8%) | 28 (21.2%) |
| 10 to 14 Year Olds | 124 (67.4%) | 60 (32.6%) |
| 15 to 17 Year Olds | 108 (58.7%) | 76 (41.3%) |
| 18 to 19 Year Olds | 20 (100.0%) | 0 (0.0%) |
| 20 to 24 Year Olds | 19 (100.0%) | 0 (0.0%) |
| 25 to 34 Year Olds | 35 (61.4%) | 22 (38.6%) |
| 35 Years and over | 32 (100.0%) | 0 (0.0%) |
| Total | 454 (70.2%) | 193 (29.8%) |
Educational Attainment by Field of Study in Malvern borough
Business (529 | 27.2%), computers & mathematics (181 | 9.3%), science & technology (174 | 8.9%), engineering (146 | 7.5%), and bio, nature & agricultural (116 | 6.0%) are the most common fields of study among 1,947 individuals in Malvern borough who have obtained a bachelor's degree or higher.
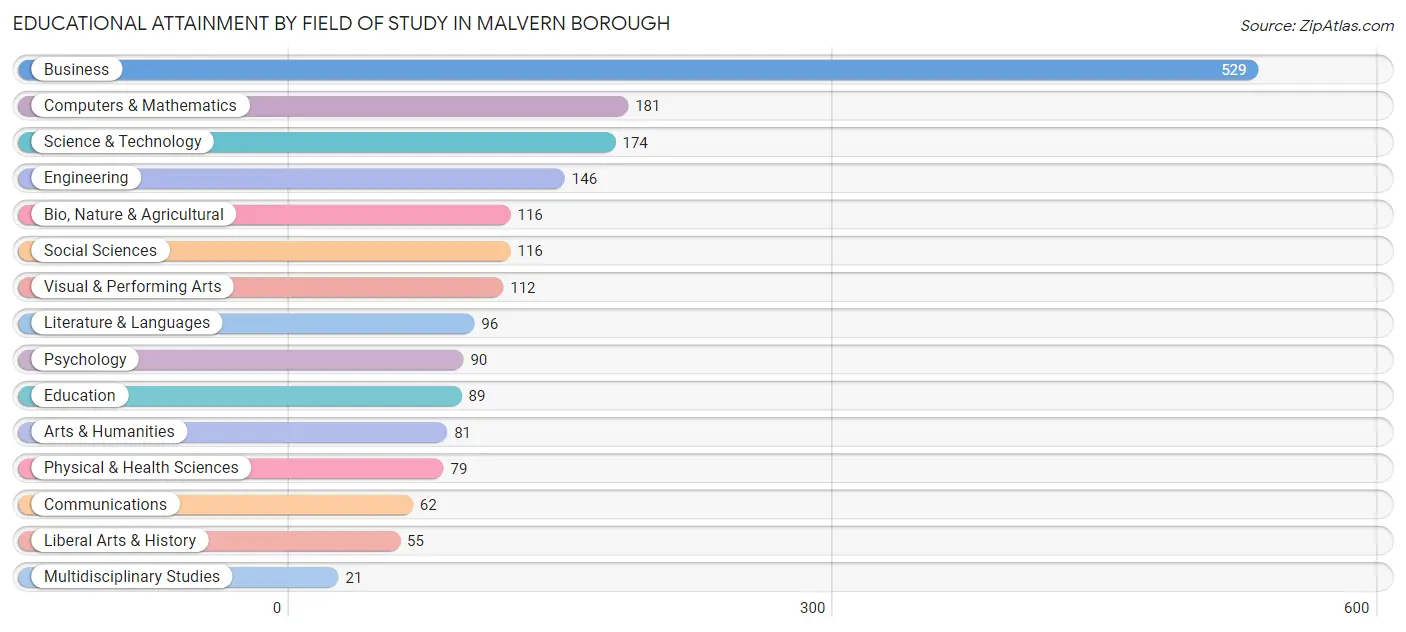
| Field of Study | # Graduates | % Graduates |
| Computers & Mathematics | 181 | 9.3% |
| Bio, Nature & Agricultural | 116 | 6.0% |
| Physical & Health Sciences | 79 | 4.1% |
| Psychology | 90 | 4.6% |
| Social Sciences | 116 | 6.0% |
| Engineering | 146 | 7.5% |
| Multidisciplinary Studies | 21 | 1.1% |
| Science & Technology | 174 | 8.9% |
| Business | 529 | 27.2% |
| Education | 89 | 4.6% |
| Literature & Languages | 96 | 4.9% |
| Liberal Arts & History | 55 | 2.8% |
| Visual & Performing Arts | 112 | 5.8% |
| Communications | 62 | 3.2% |
| Arts & Humanities | 81 | 4.2% |
| Total | 1,947 | 100.0% |
Transportation & Commute in Malvern borough
Vehicle Availability by Sex in Malvern borough
The most prevalent vehicle ownership categories in Malvern borough are males with 2 vehicles (511, accounting for 49.9%) and females with 2 vehicles (505, making up 52.6%).
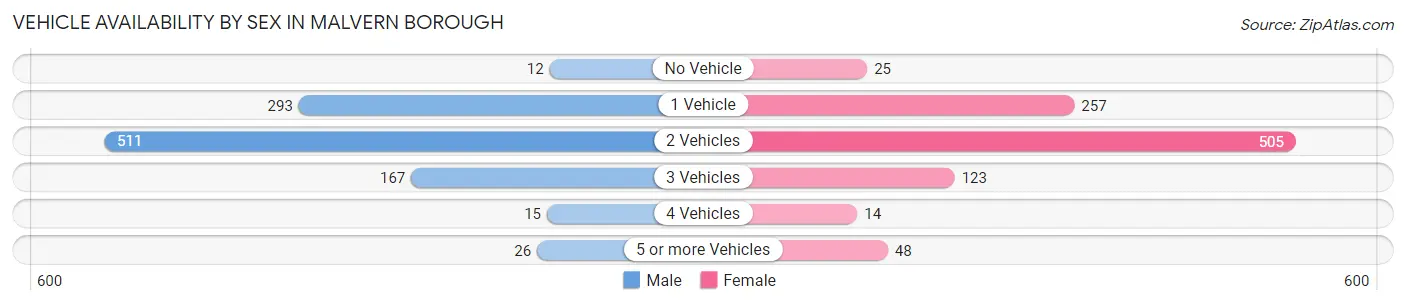
| Vehicles Available | Male | Female |
| No Vehicle | 12 (1.2%) | 25 (2.6%) |
| 1 Vehicle | 293 (28.6%) | 257 (26.4%) |
| 2 Vehicles | 511 (49.9%) | 505 (51.9%) |
| 3 Vehicles | 167 (16.3%) | 123 (12.7%) |
| 4 Vehicles | 15 (1.5%) | 14 (1.4%) |
| 5 or more Vehicles | 26 (2.5%) | 48 (4.9%) |
| Total | 1,024 (100.0%) | 972 (100.0%) |
Commute Time in Malvern borough
The most frequently occuring commute durations in Malvern borough are 10 to 14 minutes (380 commuters, 22.3%), 15 to 19 minutes (328 commuters, 19.3%), and 5 to 9 minutes (201 commuters, 11.8%).
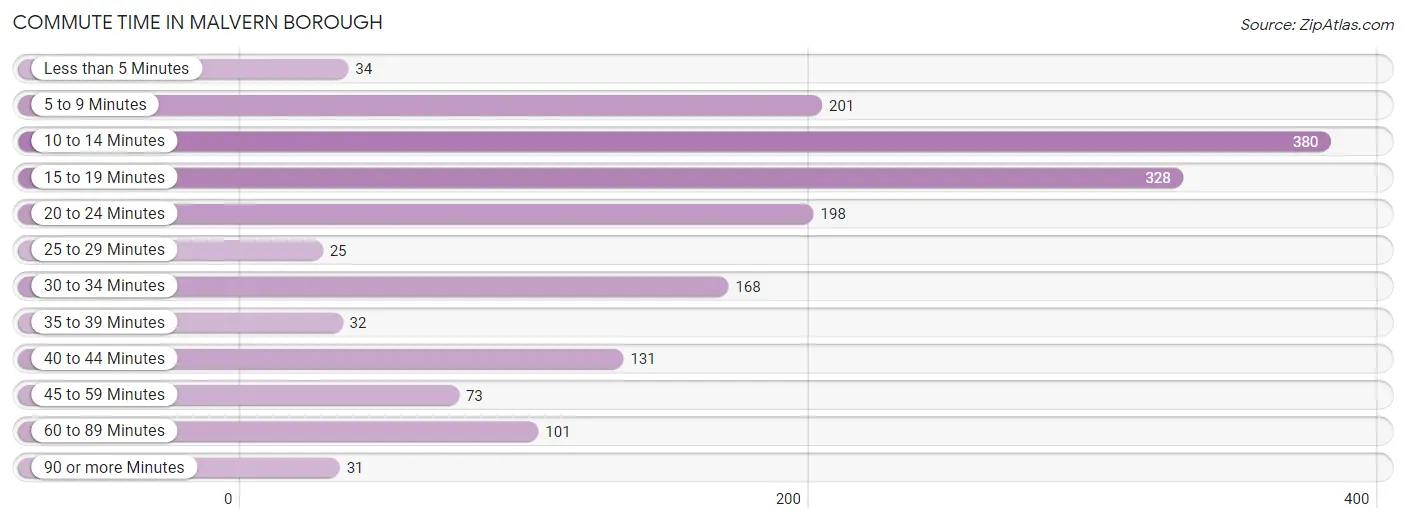
| Commute Time | # Commuters | % Commuters |
| Less than 5 Minutes | 34 | 2.0% |
| 5 to 9 Minutes | 201 | 11.8% |
| 10 to 14 Minutes | 380 | 22.3% |
| 15 to 19 Minutes | 328 | 19.3% |
| 20 to 24 Minutes | 198 | 11.6% |
| 25 to 29 Minutes | 25 | 1.5% |
| 30 to 34 Minutes | 168 | 9.9% |
| 35 to 39 Minutes | 32 | 1.9% |
| 40 to 44 Minutes | 131 | 7.7% |
| 45 to 59 Minutes | 73 | 4.3% |
| 60 to 89 Minutes | 101 | 5.9% |
| 90 or more Minutes | 31 | 1.8% |
Commute Time by Sex in Malvern borough
The most common commute times in Malvern borough are 10 to 14 minutes (208 commuters, 24.9%) for males and 15 to 19 minutes (211 commuters, 24.4%) for females.
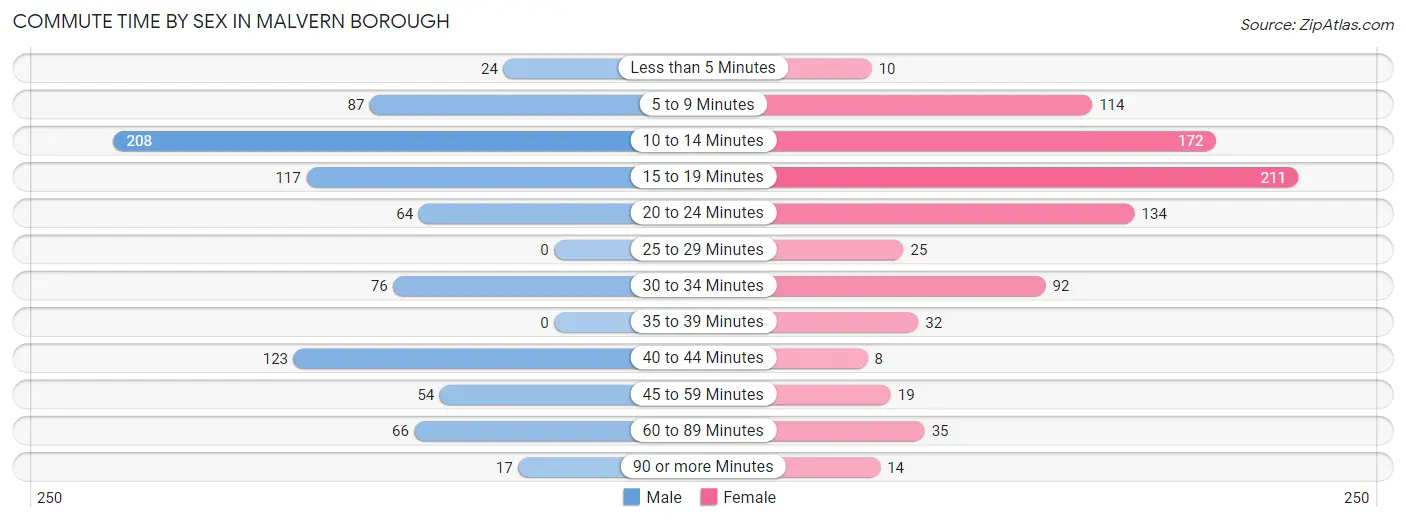
| Commute Time | Male | Female |
| Less than 5 Minutes | 24 (2.9%) | 10 (1.1%) |
| 5 to 9 Minutes | 87 (10.4%) | 114 (13.2%) |
| 10 to 14 Minutes | 208 (24.9%) | 172 (19.9%) |
| 15 to 19 Minutes | 117 (14.0%) | 211 (24.4%) |
| 20 to 24 Minutes | 64 (7.7%) | 134 (15.5%) |
| 25 to 29 Minutes | 0 (0.0%) | 25 (2.9%) |
| 30 to 34 Minutes | 76 (9.1%) | 92 (10.6%) |
| 35 to 39 Minutes | 0 (0.0%) | 32 (3.7%) |
| 40 to 44 Minutes | 123 (14.7%) | 8 (0.9%) |
| 45 to 59 Minutes | 54 (6.5%) | 19 (2.2%) |
| 60 to 89 Minutes | 66 (7.9%) | 35 (4.0%) |
| 90 or more Minutes | 17 (2.0%) | 14 (1.6%) |
Time of Departure to Work by Sex in Malvern borough
The most frequent times of departure to work in Malvern borough are 7:30 AM to 7:59 AM (179, 21.4%) for males and 8:30 AM to 8:59 AM (202, 23.3%) for females.
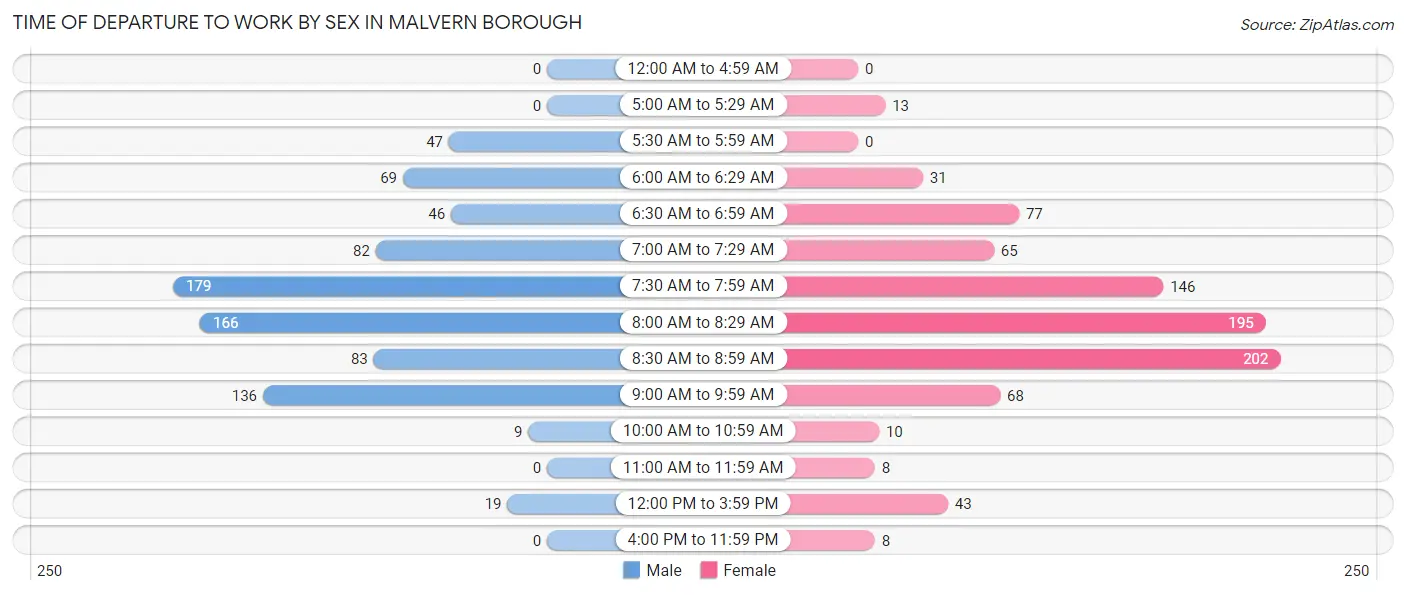
| Time of Departure | Male | Female |
| 12:00 AM to 4:59 AM | 0 (0.0%) | 0 (0.0%) |
| 5:00 AM to 5:29 AM | 0 (0.0%) | 13 (1.5%) |
| 5:30 AM to 5:59 AM | 47 (5.6%) | 0 (0.0%) |
| 6:00 AM to 6:29 AM | 69 (8.3%) | 31 (3.6%) |
| 6:30 AM to 6:59 AM | 46 (5.5%) | 77 (8.9%) |
| 7:00 AM to 7:29 AM | 82 (9.8%) | 65 (7.5%) |
| 7:30 AM to 7:59 AM | 179 (21.4%) | 146 (16.9%) |
| 8:00 AM to 8:29 AM | 166 (19.9%) | 195 (22.5%) |
| 8:30 AM to 8:59 AM | 83 (9.9%) | 202 (23.3%) |
| 9:00 AM to 9:59 AM | 136 (16.3%) | 68 (7.9%) |
| 10:00 AM to 10:59 AM | 9 (1.1%) | 10 (1.1%) |
| 11:00 AM to 11:59 AM | 0 (0.0%) | 8 (0.9%) |
| 12:00 PM to 3:59 PM | 19 (2.3%) | 43 (5.0%) |
| 4:00 PM to 11:59 PM | 0 (0.0%) | 8 (0.9%) |
| Total | 836 (100.0%) | 866 (100.0%) |
Housing Occupancy in Malvern borough
Occupancy by Ownership in Malvern borough
Of the total 1,588 dwellings in Malvern borough, owner-occupied units account for 885 (55.7%), while renter-occupied units make up 703 (44.3%).
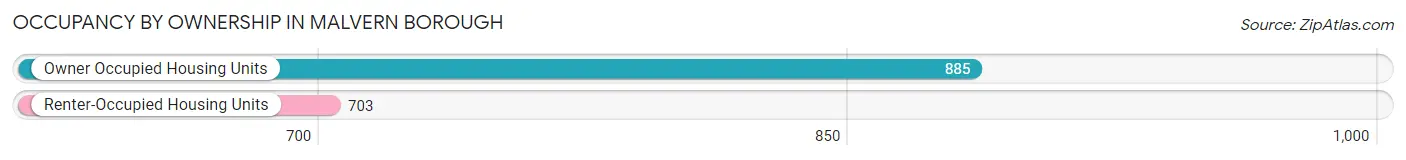
| Occupancy | # Housing Units | % Housing Units |
| Owner Occupied Housing Units | 885 | 55.7% |
| Renter-Occupied Housing Units | 703 | 44.3% |
| Total Occupied Housing Units | 1,588 | 100.0% |
Occupancy by Household Size in Malvern borough
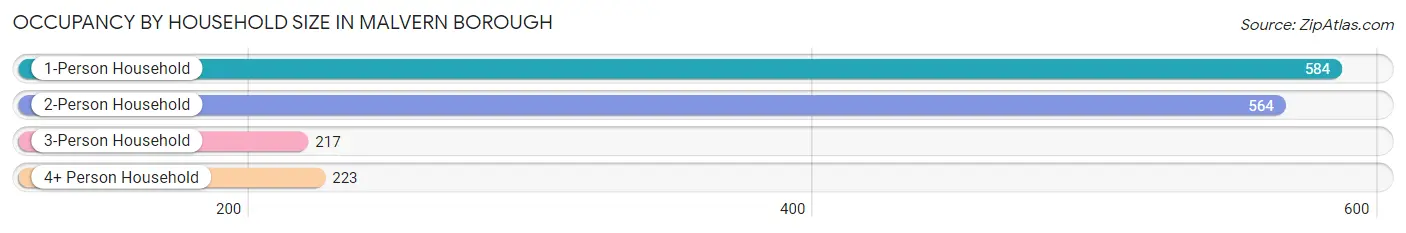
| Household Size | # Housing Units | % Housing Units |
| 1-Person Household | 584 | 36.8% |
| 2-Person Household | 564 | 35.5% |
| 3-Person Household | 217 | 13.7% |
| 4+ Person Household | 223 | 14.0% |
| Total Housing Units | 1,588 | 100.0% |
Occupancy by Ownership by Household Size in Malvern borough
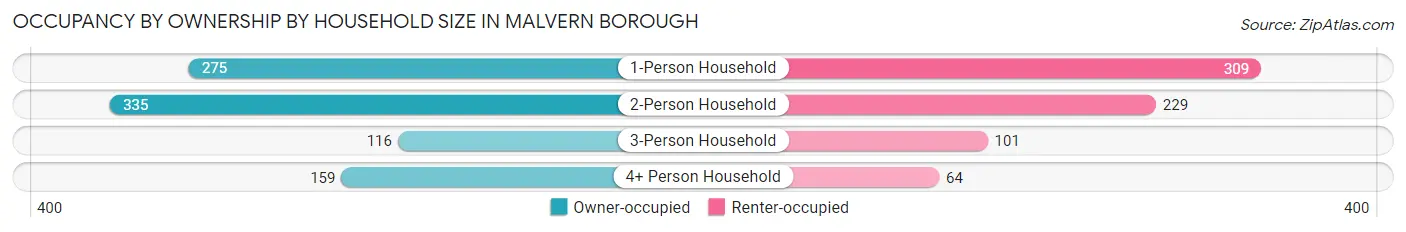
| Household Size | Owner-occupied | Renter-occupied |
| 1-Person Household | 275 (47.1%) | 309 (52.9%) |
| 2-Person Household | 335 (59.4%) | 229 (40.6%) |
| 3-Person Household | 116 (53.5%) | 101 (46.5%) |
| 4+ Person Household | 159 (71.3%) | 64 (28.7%) |
| Total Housing Units | 885 (55.7%) | 703 (44.3%) |
Occupancy by Educational Attainment in Malvern borough
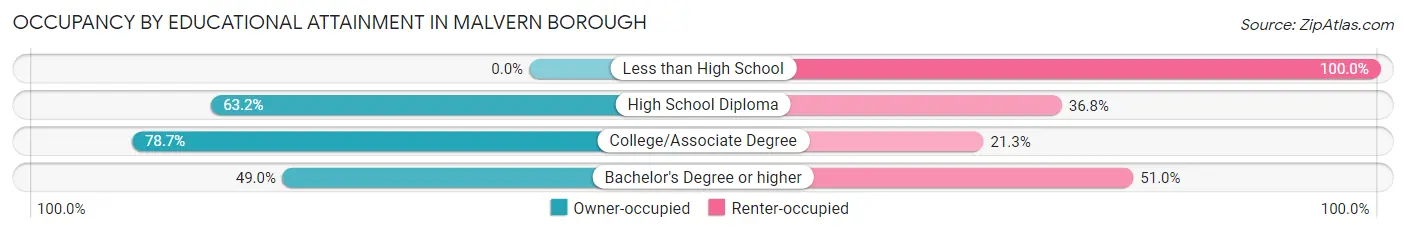
| Household Size | Owner-occupied | Renter-occupied |
| Less than High School | 0 (0.0%) | 11 (100.0%) |
| High School Diploma | 170 (63.2%) | 99 (36.8%) |
| College/Associate Degree | 196 (78.7%) | 53 (21.3%) |
| Bachelor's Degree or higher | 519 (49.0%) | 540 (51.0%) |
Occupancy by Age of Householder in Malvern borough
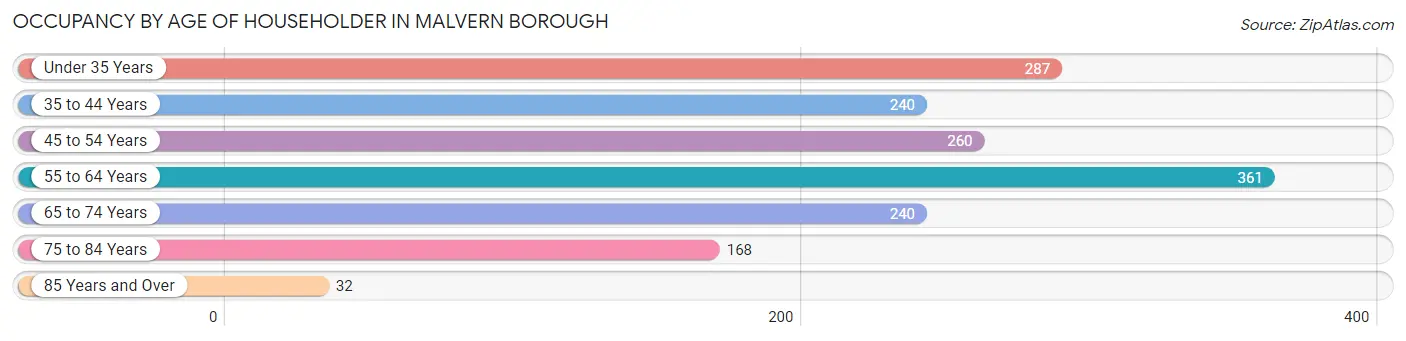
| Age Bracket | # Households | % Households |
| Under 35 Years | 287 | 18.1% |
| 35 to 44 Years | 240 | 15.1% |
| 45 to 54 Years | 260 | 16.4% |
| 55 to 64 Years | 361 | 22.7% |
| 65 to 74 Years | 240 | 15.1% |
| 75 to 84 Years | 168 | 10.6% |
| 85 Years and Over | 32 | 2.0% |
| Total | 1,588 | 100.0% |
Housing Finances in Malvern borough
Median Income by Occupancy in Malvern borough
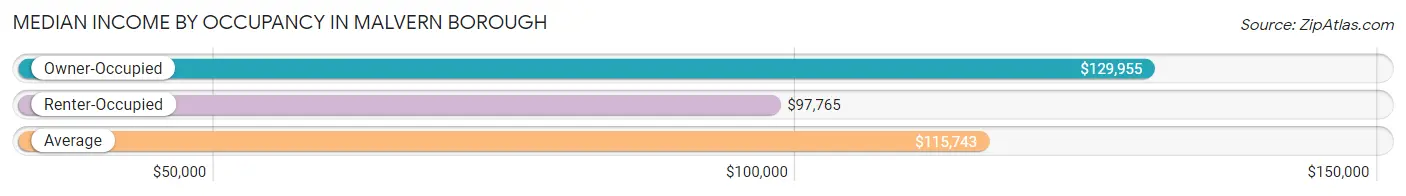
| Occupancy Type | # Households | Median Income |
| Owner-Occupied | 885 (55.7%) | $129,955 |
| Renter-Occupied | 703 (44.3%) | $97,765 |
| Average | 1,588 (100.0%) | $115,743 |
Occupancy by Householder Income Bracket in Malvern borough
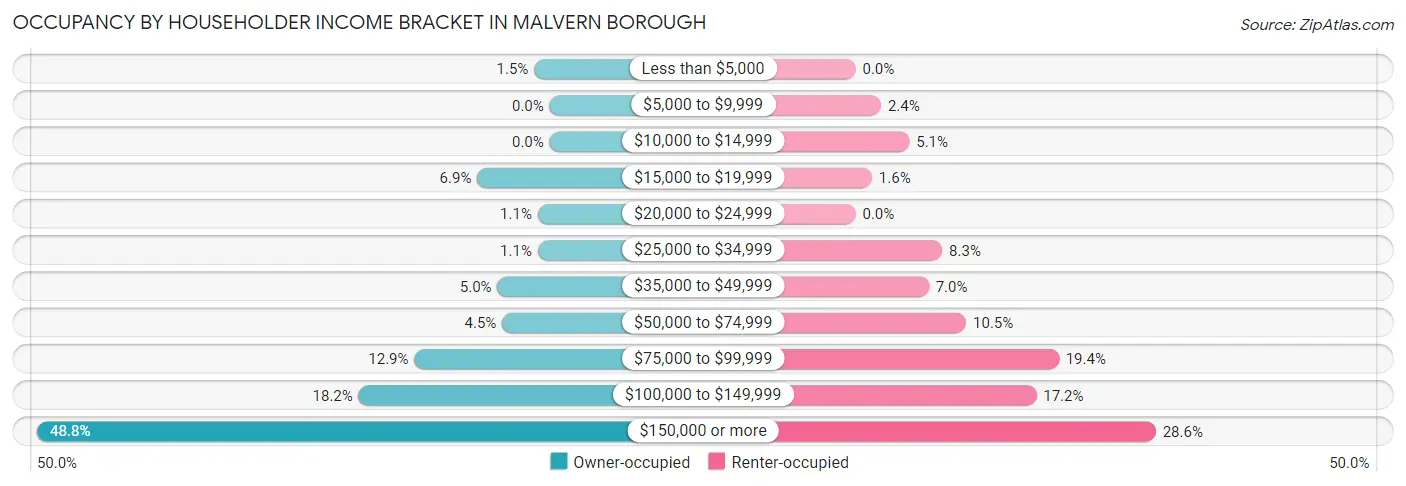
| Income Bracket | Owner-occupied | Renter-occupied |
| Less than $5,000 | 13 (1.5%) | 0 (0.0%) |
| $5,000 to $9,999 | 0 (0.0%) | 17 (2.4%) |
| $10,000 to $14,999 | 0 (0.0%) | 36 (5.1%) |
| $15,000 to $19,999 | 61 (6.9%) | 11 (1.6%) |
| $20,000 to $24,999 | 10 (1.1%) | 0 (0.0%) |
| $25,000 to $34,999 | 10 (1.1%) | 58 (8.3%) |
| $35,000 to $49,999 | 44 (5.0%) | 49 (7.0%) |
| $50,000 to $74,999 | 40 (4.5%) | 74 (10.5%) |
| $75,000 to $99,999 | 114 (12.9%) | 136 (19.4%) |
| $100,000 to $149,999 | 161 (18.2%) | 121 (17.2%) |
| $150,000 or more | 432 (48.8%) | 201 (28.6%) |
| Total | 885 (100.0%) | 703 (100.0%) |
Monthly Housing Cost Tiers in Malvern borough
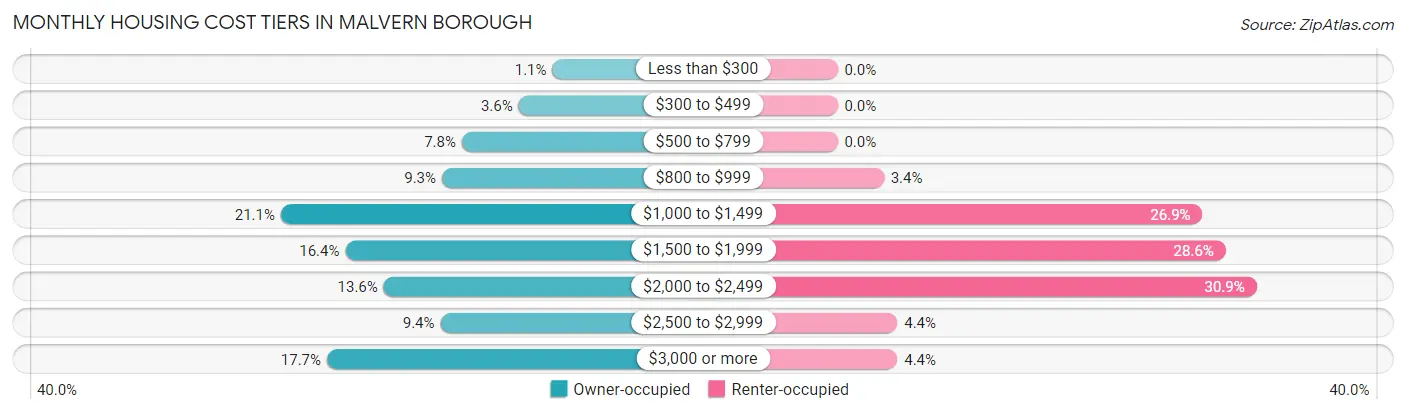
| Monthly Cost | Owner-occupied | Renter-occupied |
| Less than $300 | 10 (1.1%) | 0 (0.0%) |
| $300 to $499 | 32 (3.6%) | 0 (0.0%) |
| $500 to $799 | 69 (7.8%) | 0 (0.0%) |
| $800 to $999 | 82 (9.3%) | 24 (3.4%) |
| $1,000 to $1,499 | 187 (21.1%) | 189 (26.9%) |
| $1,500 to $1,999 | 145 (16.4%) | 201 (28.6%) |
| $2,000 to $2,499 | 120 (13.6%) | 217 (30.9%) |
| $2,500 to $2,999 | 83 (9.4%) | 31 (4.4%) |
| $3,000 or more | 157 (17.7%) | 31 (4.4%) |
| Total | 885 (100.0%) | 703 (100.0%) |
Physical Housing Characteristics in Malvern borough
Housing Structures in Malvern borough
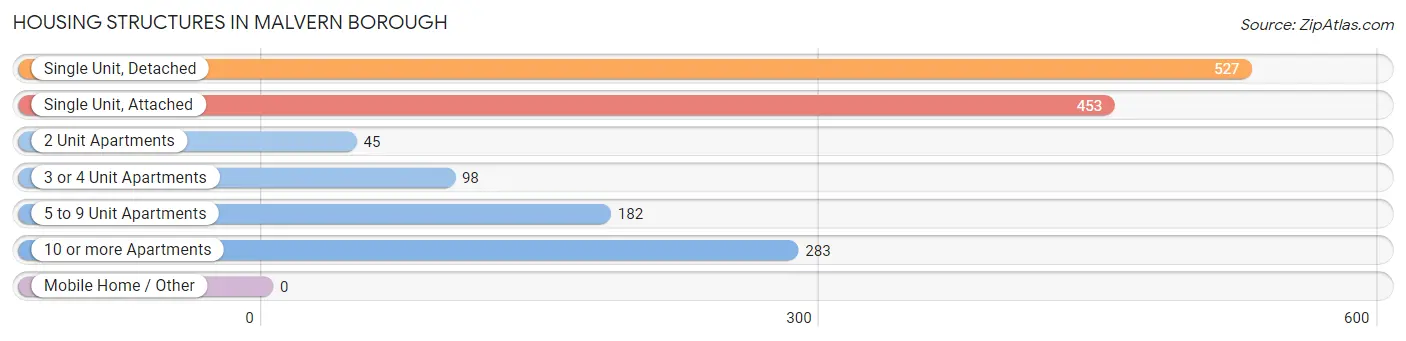
| Structure Type | # Housing Units | % Housing Units |
| Single Unit, Detached | 527 | 33.2% |
| Single Unit, Attached | 453 | 28.5% |
| 2 Unit Apartments | 45 | 2.8% |
| 3 or 4 Unit Apartments | 98 | 6.2% |
| 5 to 9 Unit Apartments | 182 | 11.5% |
| 10 or more Apartments | 283 | 17.8% |
| Mobile Home / Other | 0 | 0.0% |
| Total | 1,588 | 100.0% |
Housing Structures by Occupancy in Malvern borough
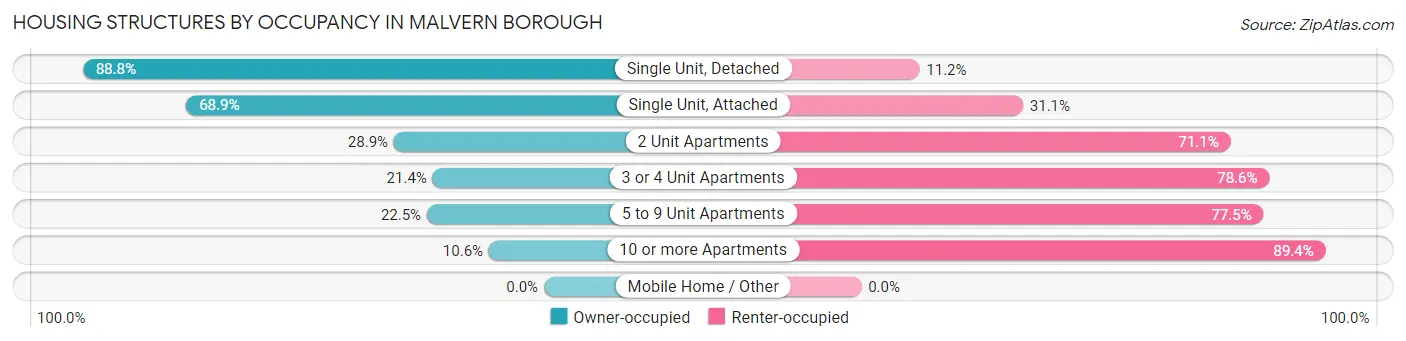
| Structure Type | Owner-occupied | Renter-occupied |
| Single Unit, Detached | 468 (88.8%) | 59 (11.2%) |
| Single Unit, Attached | 312 (68.9%) | 141 (31.1%) |
| 2 Unit Apartments | 13 (28.9%) | 32 (71.1%) |
| 3 or 4 Unit Apartments | 21 (21.4%) | 77 (78.6%) |
| 5 to 9 Unit Apartments | 41 (22.5%) | 141 (77.5%) |
| 10 or more Apartments | 30 (10.6%) | 253 (89.4%) |
| Mobile Home / Other | 0 (0.0%) | 0 (0.0%) |
| Total | 885 (55.7%) | 703 (44.3%) |
Housing Structures by Number of Rooms in Malvern borough
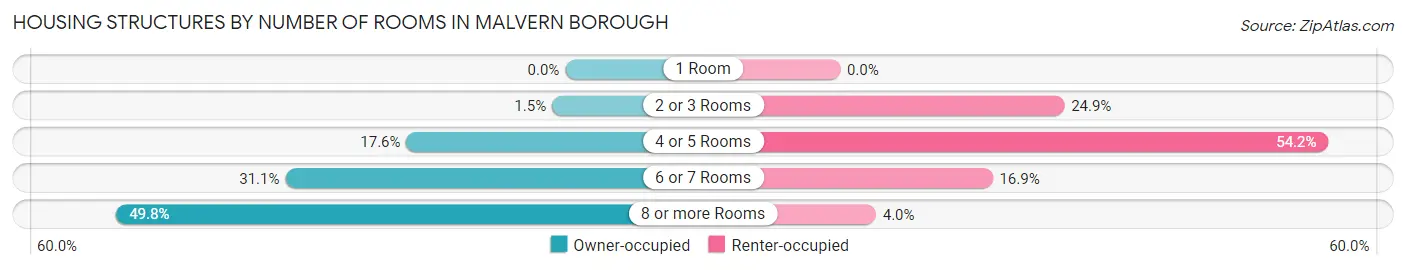
| Number of Rooms | Owner-occupied | Renter-occupied |
| 1 Room | 0 (0.0%) | 0 (0.0%) |
| 2 or 3 Rooms | 13 (1.5%) | 175 (24.9%) |
| 4 or 5 Rooms | 156 (17.6%) | 381 (54.2%) |
| 6 or 7 Rooms | 275 (31.1%) | 119 (16.9%) |
| 8 or more Rooms | 441 (49.8%) | 28 (4.0%) |
| Total | 885 (100.0%) | 703 (100.0%) |
Housing Structure by Heating Type in Malvern borough
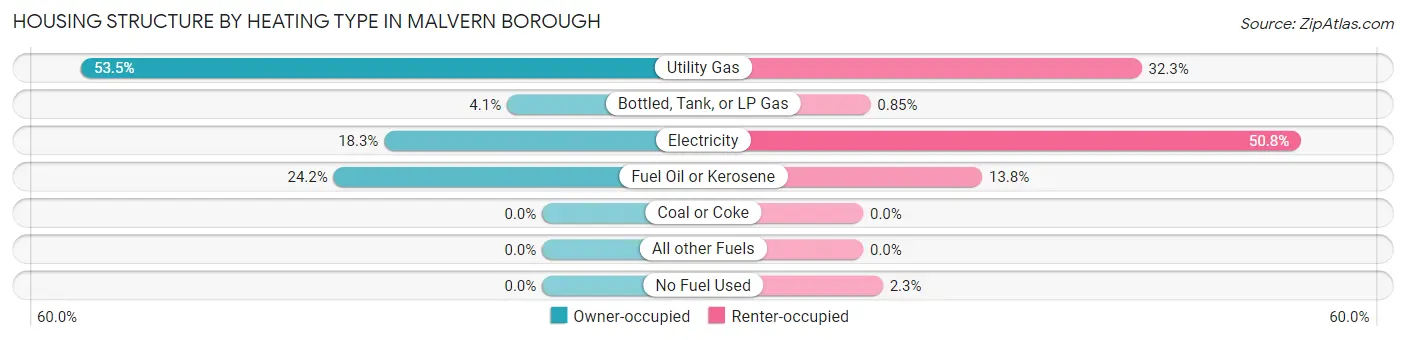
| Heating Type | Owner-occupied | Renter-occupied |
| Utility Gas | 473 (53.4%) | 227 (32.3%) |
| Bottled, Tank, or LP Gas | 36 (4.1%) | 6 (0.9%) |
| Electricity | 162 (18.3%) | 357 (50.8%) |
| Fuel Oil or Kerosene | 214 (24.2%) | 97 (13.8%) |
| Coal or Coke | 0 (0.0%) | 0 (0.0%) |
| All other Fuels | 0 (0.0%) | 0 (0.0%) |
| No Fuel Used | 0 (0.0%) | 16 (2.3%) |
| Total | 885 (100.0%) | 703 (100.0%) |
Household Vehicle Usage in Malvern borough
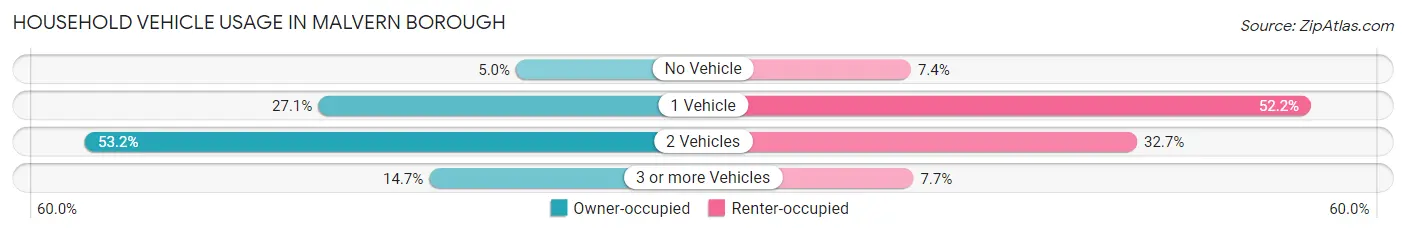
| Vehicles per Household | Owner-occupied | Renter-occupied |
| No Vehicle | 44 (5.0%) | 52 (7.4%) |
| 1 Vehicle | 240 (27.1%) | 367 (52.2%) |
| 2 Vehicles | 471 (53.2%) | 230 (32.7%) |
| 3 or more Vehicles | 130 (14.7%) | 54 (7.7%) |
| Total | 885 (100.0%) | 703 (100.0%) |
Real Estate & Mortgages in Malvern borough
Real Estate and Mortgage Overview in Malvern borough
| Characteristic | Without Mortgage | With Mortgage |
| Housing Units | 376 | 509 |
| Median Property Value | $458,100 | $490,500 |
| Median Household Income | $83,077 | $298 |
| Monthly Housing Costs | $1,016 | $131 |
| Real Estate Taxes | $5,858 | $0 |
Property Value by Mortgage Status in Malvern borough
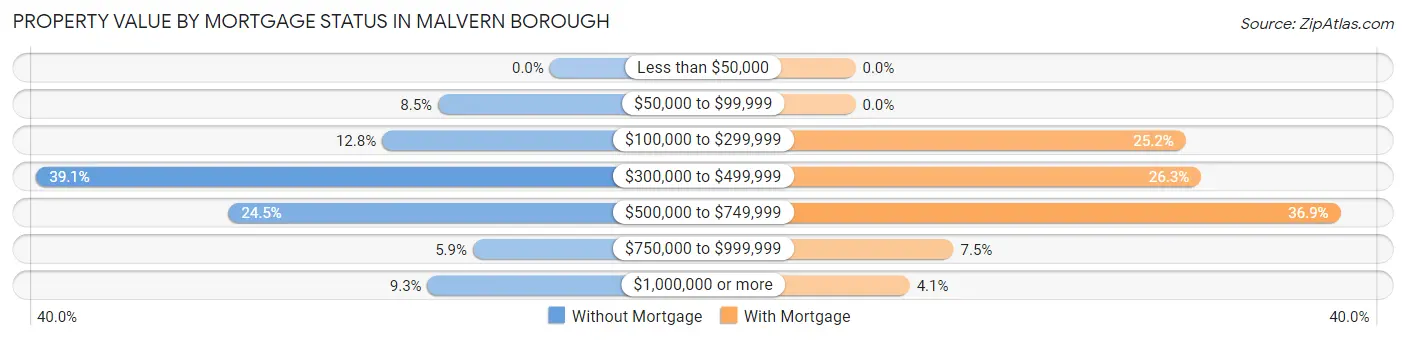
| Property Value | Without Mortgage | With Mortgage |
| Less than $50,000 | 0 (0.0%) | 0 (0.0%) |
| $50,000 to $99,999 | 32 (8.5%) | 0 (0.0%) |
| $100,000 to $299,999 | 48 (12.8%) | 128 (25.2%) |
| $300,000 to $499,999 | 147 (39.1%) | 134 (26.3%) |
| $500,000 to $749,999 | 92 (24.5%) | 188 (36.9%) |
| $750,000 to $999,999 | 22 (5.9%) | 38 (7.5%) |
| $1,000,000 or more | 35 (9.3%) | 21 (4.1%) |
| Total | 376 (100.0%) | 509 (100.0%) |
Household Income by Mortgage Status in Malvern borough
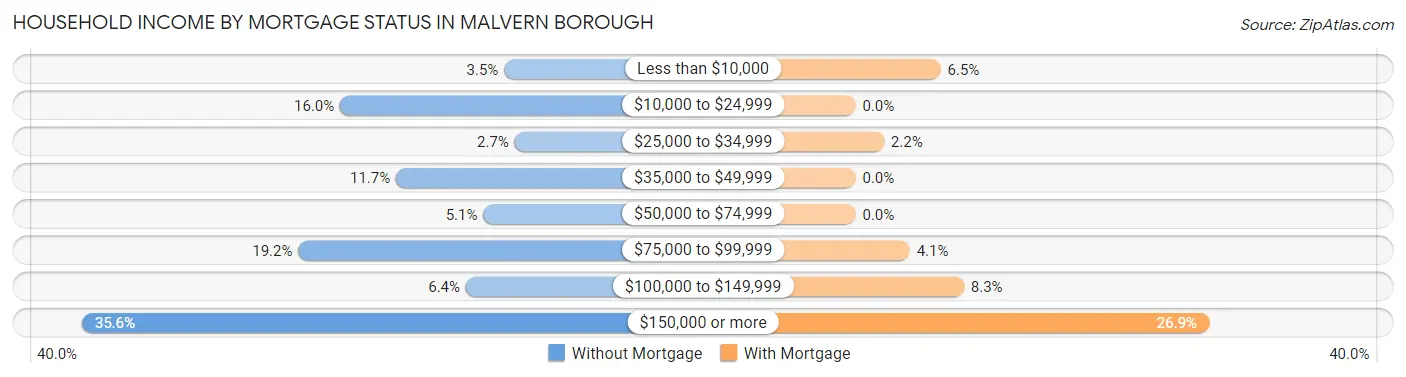
| Household Income | Without Mortgage | With Mortgage |
| Less than $10,000 | 13 (3.5%) | 33 (6.5%) |
| $10,000 to $24,999 | 60 (16.0%) | 0 (0.0%) |
| $25,000 to $34,999 | 10 (2.7%) | 11 (2.2%) |
| $35,000 to $49,999 | 44 (11.7%) | 0 (0.0%) |
| $50,000 to $74,999 | 19 (5.1%) | 0 (0.0%) |
| $75,000 to $99,999 | 72 (19.2%) | 21 (4.1%) |
| $100,000 to $149,999 | 24 (6.4%) | 42 (8.3%) |
| $150,000 or more | 134 (35.6%) | 137 (26.9%) |
| Total | 376 (100.0%) | 509 (100.0%) |
Property Value to Household Income Ratio in Malvern borough
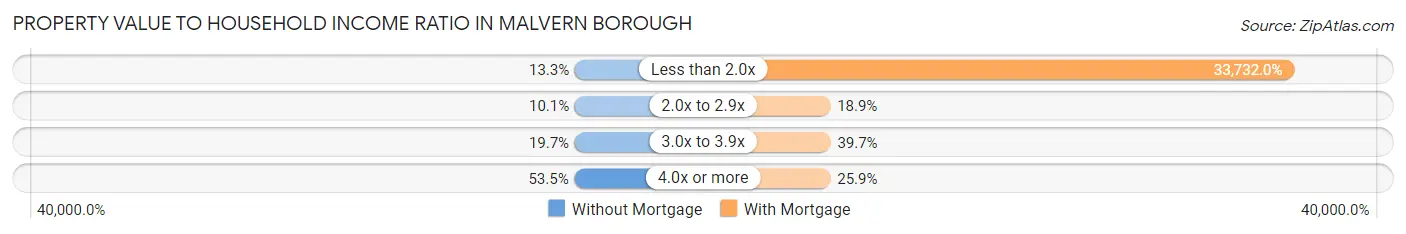
| Value-to-Income Ratio | Without Mortgage | With Mortgage |
| Less than 2.0x | 50 (13.3%) | 171,696 (33,732.0%) |
| 2.0x to 2.9x | 38 (10.1%) | 96 (18.9%) |
| 3.0x to 3.9x | 74 (19.7%) | 202 (39.7%) |
| 4.0x or more | 201 (53.5%) | 132 (25.9%) |
| Total | 376 (100.0%) | 509 (100.0%) |
Real Estate Taxes by Mortgage Status in Malvern borough

| Property Taxes | Without Mortgage | With Mortgage |
| Less than $800 | 0 (0.0%) | 0 (0.0%) |
| $800 to $1,499 | 0 (0.0%) | 0 (0.0%) |
| $800 to $1,499 | 366 (97.3%) | 0 (0.0%) |
| Total | 376 (100.0%) | 509 (100.0%) |
Health & Disability in Malvern borough
Health Insurance Coverage by Age in Malvern borough
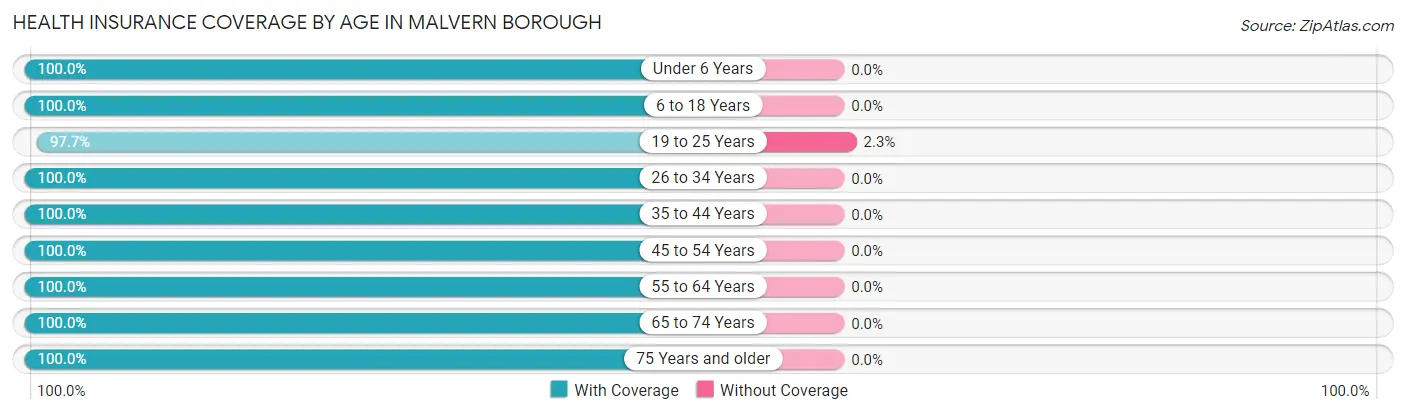
| Age Bracket | With Coverage | Without Coverage |
| Under 6 Years | 119 (100.0%) | 0 (0.0%) |
| 6 to 18 Years | 515 (100.0%) | 0 (0.0%) |
| 19 to 25 Years | 170 (97.7%) | 4 (2.3%) |
| 26 to 34 Years | 450 (100.0%) | 0 (0.0%) |
| 35 to 44 Years | 420 (100.0%) | 0 (0.0%) |
| 45 to 54 Years | 442 (100.0%) | 0 (0.0%) |
| 55 to 64 Years | 569 (100.0%) | 0 (0.0%) |
| 65 to 74 Years | 382 (100.0%) | 0 (0.0%) |
| 75 Years and older | 308 (100.0%) | 0 (0.0%) |
| Total | 3,375 (99.9%) | 4 (0.1%) |
Health Insurance Coverage by Citizenship Status in Malvern borough

| Citizenship Status | With Coverage | Without Coverage |
| Native Born | 119 (100.0%) | 0 (0.0%) |
| Foreign Born, Citizen | 515 (100.0%) | 0 (0.0%) |
| Foreign Born, not a Citizen | 170 (97.7%) | 4 (2.3%) |
Health Insurance Coverage by Household Income in Malvern borough
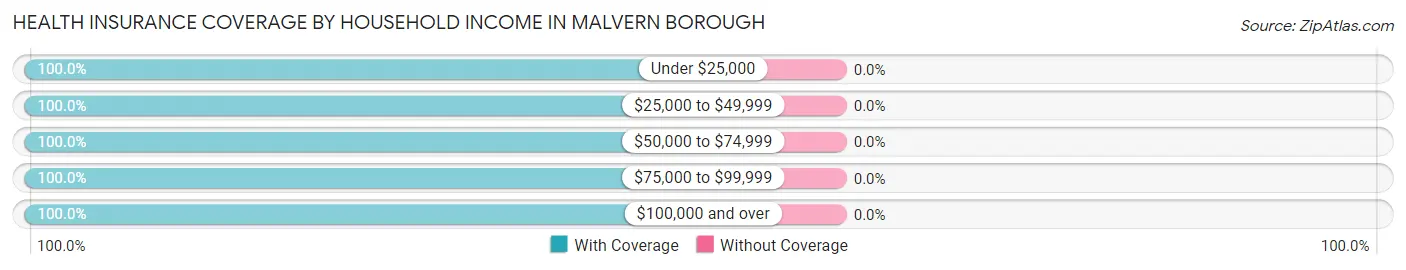
| Household Income | With Coverage | Without Coverage |
| Under $25,000 | 183 (100.0%) | 0 (0.0%) |
| $25,000 to $49,999 | 215 (100.0%) | 0 (0.0%) |
| $50,000 to $74,999 | 155 (100.0%) | 0 (0.0%) |
| $75,000 to $99,999 | 460 (100.0%) | 0 (0.0%) |
| $100,000 and over | 2,336 (100.0%) | 0 (0.0%) |
Public vs Private Health Insurance Coverage by Age in Malvern borough
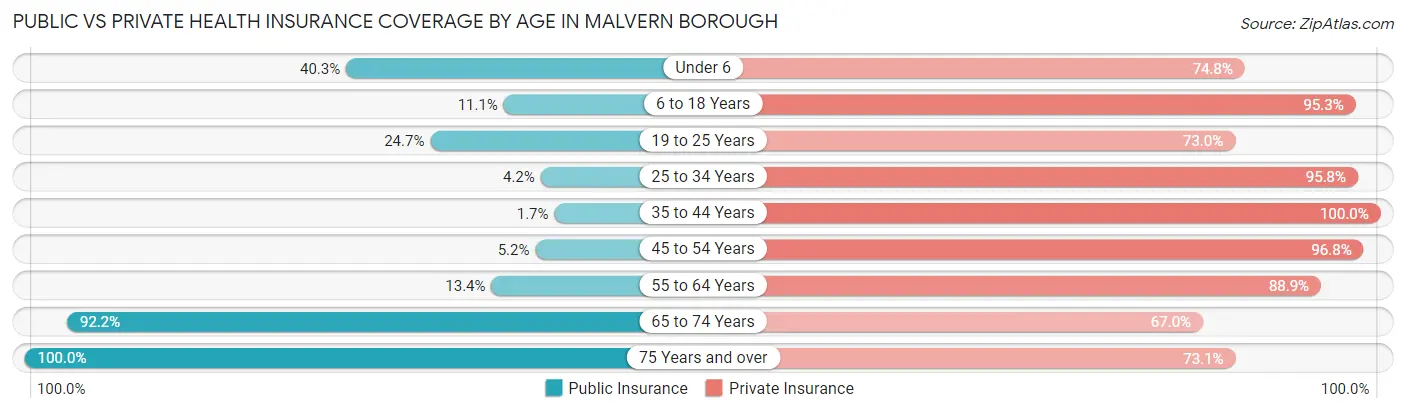
| Age Bracket | Public Insurance | Private Insurance |
| Under 6 | 48 (40.3%) | 89 (74.8%) |
| 6 to 18 Years | 57 (11.1%) | 491 (95.3%) |
| 19 to 25 Years | 43 (24.7%) | 127 (73.0%) |
| 25 to 34 Years | 19 (4.2%) | 431 (95.8%) |
| 35 to 44 Years | 7 (1.7%) | 420 (100.0%) |
| 45 to 54 Years | 23 (5.2%) | 428 (96.8%) |
| 55 to 64 Years | 76 (13.4%) | 506 (88.9%) |
| 65 to 74 Years | 352 (92.1%) | 256 (67.0%) |
| 75 Years and over | 308 (100.0%) | 225 (73.1%) |
| Total | 933 (27.6%) | 2,973 (88.0%) |
Disability Status by Sex by Age in Malvern borough
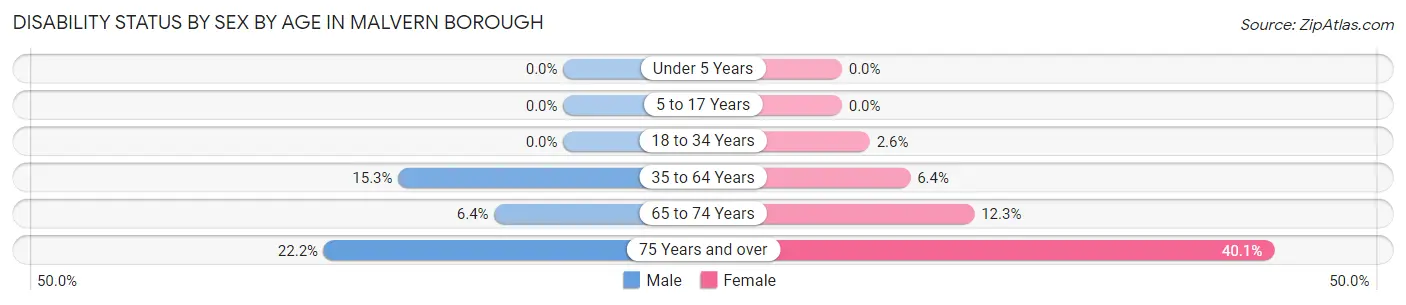
| Age Bracket | Male | Female |
| Under 5 Years | 0 (0.0%) | 0 (0.0%) |
| 5 to 17 Years | 0 (0.0%) | 0 (0.0%) |
| 18 to 34 Years | 0 (0.0%) | 9 (2.6%) |
| 35 to 64 Years | 113 (15.3%) | 44 (6.4%) |
| 65 to 74 Years | 13 (6.4%) | 22 (12.3%) |
| 75 Years and over | 28 (22.2%) | 73 (40.1%) |
Disability Class by Sex by Age in Malvern borough
Disability Class: Hearing Difficulty
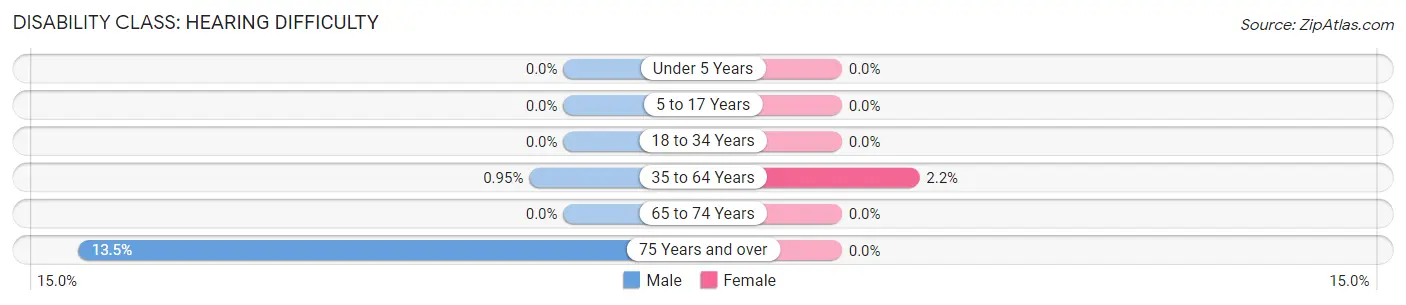
| Age Bracket | Male | Female |
| Under 5 Years | 0 (0.0%) | 0 (0.0%) |
| 5 to 17 Years | 0 (0.0%) | 0 (0.0%) |
| 18 to 34 Years | 0 (0.0%) | 0 (0.0%) |
| 35 to 64 Years | 7 (0.9%) | 15 (2.2%) |
| 65 to 74 Years | 0 (0.0%) | 0 (0.0%) |
| 75 Years and over | 17 (13.5%) | 0 (0.0%) |
Disability Class: Vision Difficulty
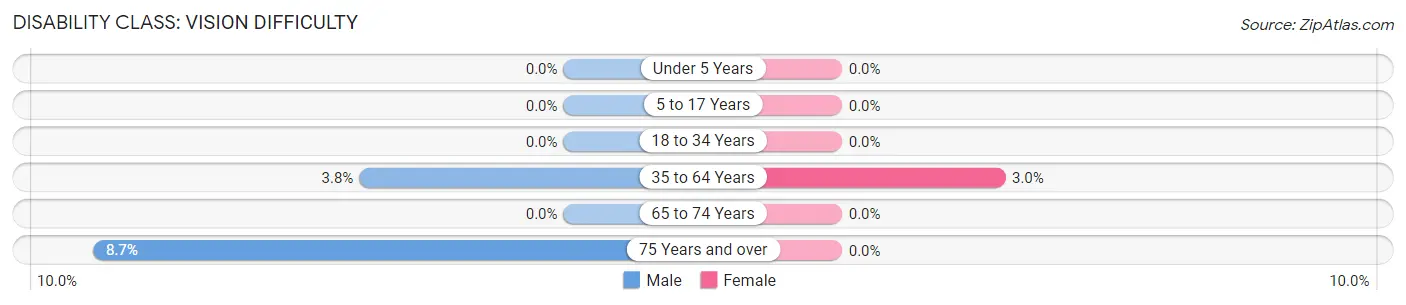
| Age Bracket | Male | Female |
| Under 5 Years | 0 (0.0%) | 0 (0.0%) |
| 5 to 17 Years | 0 (0.0%) | 0 (0.0%) |
| 18 to 34 Years | 0 (0.0%) | 0 (0.0%) |
| 35 to 64 Years | 28 (3.8%) | 21 (3.0%) |
| 65 to 74 Years | 0 (0.0%) | 0 (0.0%) |
| 75 Years and over | 11 (8.7%) | 0 (0.0%) |
Disability Class: Cognitive Difficulty
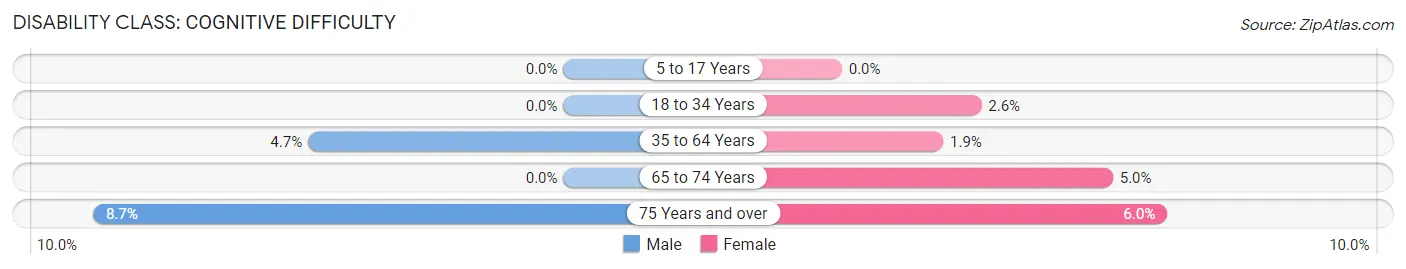
| Age Bracket | Male | Female |
| 5 to 17 Years | 0 (0.0%) | 0 (0.0%) |
| 18 to 34 Years | 0 (0.0%) | 9 (2.6%) |
| 35 to 64 Years | 35 (4.7%) | 13 (1.9%) |
| 65 to 74 Years | 0 (0.0%) | 9 (5.0%) |
| 75 Years and over | 11 (8.7%) | 11 (6.0%) |
Disability Class: Ambulatory Difficulty
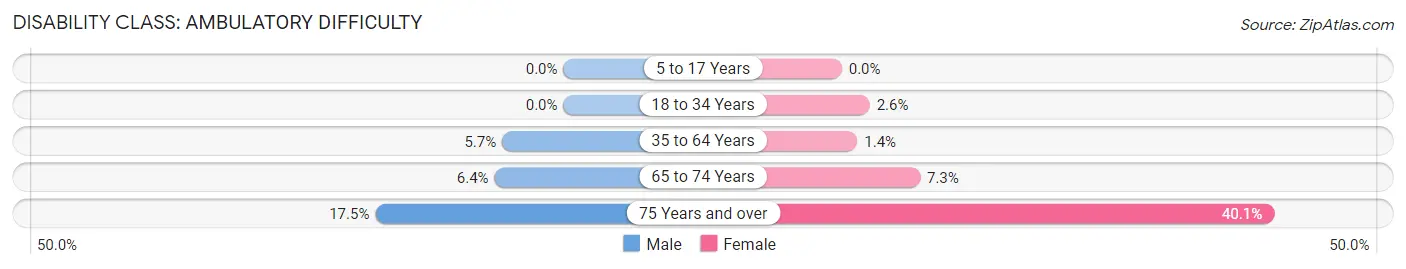
| Age Bracket | Male | Female |
| 5 to 17 Years | 0 (0.0%) | 0 (0.0%) |
| 18 to 34 Years | 0 (0.0%) | 9 (2.6%) |
| 35 to 64 Years | 42 (5.7%) | 10 (1.4%) |
| 65 to 74 Years | 13 (6.4%) | 13 (7.3%) |
| 75 Years and over | 22 (17.5%) | 73 (40.1%) |
Disability Class: Self-Care Difficulty
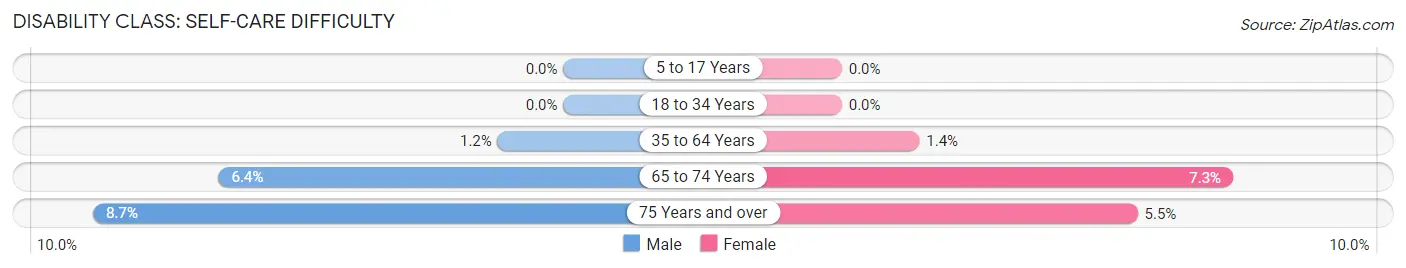
| Age Bracket | Male | Female |
| 5 to 17 Years | 0 (0.0%) | 0 (0.0%) |
| 18 to 34 Years | 0 (0.0%) | 0 (0.0%) |
| 35 to 64 Years | 9 (1.2%) | 10 (1.4%) |
| 65 to 74 Years | 13 (6.4%) | 13 (7.3%) |
| 75 Years and over | 11 (8.7%) | 10 (5.5%) |
Technology Access in Malvern borough
Computing Device Access in Malvern borough
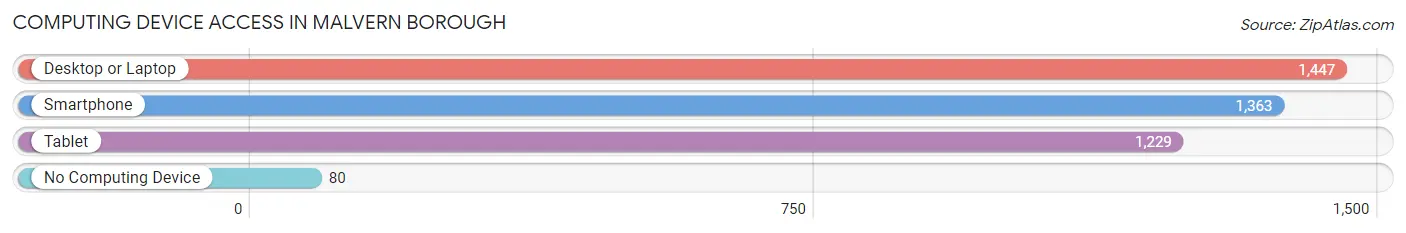
| Device Type | # Households | % Households |
| Desktop or Laptop | 1,447 | 91.1% |
| Smartphone | 1,363 | 85.8% |
| Tablet | 1,229 | 77.4% |
| No Computing Device | 80 | 5.0% |
| Total | 1,588 | 100.0% |
Internet Access in Malvern borough
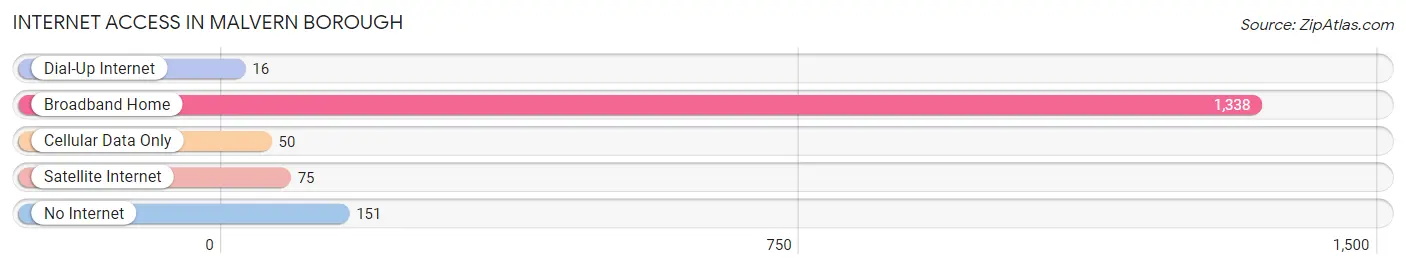
| Internet Type | # Households | % Households |
| Dial-Up Internet | 16 | 1.0% |
| Broadband Home | 1,338 | 84.3% |
| Cellular Data Only | 50 | 3.2% |
| Satellite Internet | 75 | 4.7% |
| No Internet | 151 | 9.5% |
| Total | 1,588 | 100.0% |
Malvern borough Summary
Malvern Borough is a small borough located in Chester County, Pennsylvania. It is situated in the southeastern corner of the county, approximately 25 miles west of Philadelphia. The borough is bordered by East Whiteland Township to the north, Willistown Township to the east, East Goshen Township to the south, and West Whiteland Township to the west. The population of Malvern Borough was 2,998 at the 2010 census.
History
The area that is now Malvern Borough was originally inhabited by the Lenni Lenape Native Americans. The first European settlers arrived in the area in the late 17th century. The area was part of the Welsh Tract, a large tract of land granted to Welsh Quakers by William Penn in 1681. The area was known as Great Valley until 1845, when it was renamed Malvern after the town of Malvern Hill in England.
The borough was incorporated in 1872. In the late 19th century, the borough was a popular summer resort destination for wealthy Philadelphians. The borough was also home to several large estates, including the estate of industrialist and philanthropist John C. Haas.
Geography
Malvern Borough is located at 40°2'17" North, 75°31'25" West (40.038, -75.523). According to the United States Census Bureau, the borough has a total area of 1.2 square miles, all of it land.
The borough is located in the Great Valley region of southeastern Pennsylvania. The borough is situated in the Great Valley along the Schuylkill River. The borough is located in the Piedmont region of Pennsylvania, which is characterized by rolling hills and valleys.
Economy
The economy of Malvern Borough is largely based on the service industry. The borough is home to several banks, law firms, and other professional services. The borough is also home to several retail stores, restaurants, and other businesses.
The borough is home to several large employers, including Vanguard Group, a financial services company, and QVC, a television shopping network. The borough is also home to several technology companies, including SAP America, a software company, and Siemens, an engineering and electronics company.
Demographics
As of the 2010 census, the population of Malvern Borough was 2,998. The racial makeup of the borough was 90.2% White, 4.2% African American, 0.2% Native American, 3.2% Asian, 0.1% Pacific Islander, 0.7% from other races, and 1.6% from two or more races. Hispanic or Latino of any race were 2.3% of the population.
The median income for a household in the borough was $90,945, and the median income for a family was $106,945. The per capita income for the borough was $45,945. About 3.2% of families and 4.2% of the population were below the poverty line, including 5.2% of those under age 18 and 2.2% of those age 65 or over.
Common Questions
What is the Total Population of Malvern borough?
Total Population of Malvern borough is 3,389.
What is the Total Male Population of Malvern borough?
Total Male Population of Malvern borough is 1,693.
What is the Total Female Population of Malvern borough?
Total Female Population of Malvern borough is 1,696.
What is the Ratio of Males per 100 Females in Malvern borough?
There are 99.82 Males per 100 Females in Malvern borough.
What is the Ratio of Females per 100 Males in Malvern borough?
There are 100.18 Females per 100 Males in Malvern borough.
What is the Median Population Age in Malvern borough?
Median Population Age in Malvern borough is 46.0 Years.
What is the Average Family Size in Malvern borough
Average Family Size in Malvern borough is 2.7 People.
What is the Average Household Size in Malvern borough
Average Household Size in Malvern borough is 2.1 People.
What is Per Capita Income in Malvern borough?
Per Capita income in Malvern borough is $78,031.
What is the Median Family Income in Malvern borough?
Median Family Income in Malvern borough is $165,786.
What is the Median Household income in Malvern borough?
Median Household Income in Malvern borough is $115,743.
What is Income or Wage Gap in Malvern borough?
Income or Wage Gap in Malvern borough is 20.1%.
Women in Malvern borough earn 79.9 cents for every dollar earned by a man.
What is Inequality or Gini Index in Malvern borough?
Inequality or Gini Index in Malvern borough is 0.45.
How Large is the Labor Force in Malvern borough?
There are 2,121 People in the Labor Forcein in Malvern borough.
What is the Percentage of People in the Labor Force in Malvern borough?
72.9% of People are in the Labor Force in Malvern borough.
What is the Unemployment Rate in Malvern borough?
Unemployment Rate in Malvern borough is 5.9%.