Beckett Ridge, OH
Beckett Ridge Map
Beckett Ridge Overview
9,880
TOTAL POPULATION
4,538
MALE POPULATION
5,342
FEMALE POPULATION
84.95
MALES / 100 FEMALES
117.72
FEMALES / 100 MALES
38.4
MEDIAN AGE
3.0
AVG FAMILY SIZE
2.5
AVG HOUSEHOLD SIZE
$60,488
PER CAPITA INCOME
$139,485
AVG FAMILY INCOME
$111,953
AVG HOUSEHOLD INCOME
33.6%
WAGE / INCOME GAP [ % ]
66.4¢/ $1
WAGE / INCOME GAP [ $ ]
0.42
INEQUALITY / GINI INDEX
5,389
LABOR FORCE [ PEOPLE ]
69.3%
PERCENT IN LABOR FORCE
4.4%
UNEMPLOYMENT RATE
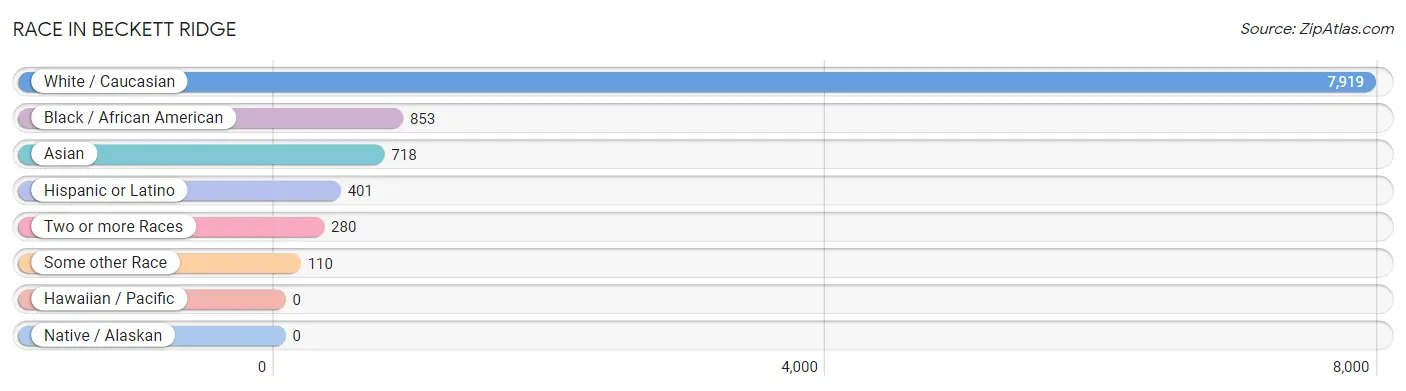
Race in Beckett Ridge
The most populous races in Beckett Ridge are White / Caucasian (7,919 | 80.1%), Black / African American (853 | 8.6%), and Asian (718 | 7.3%).
| Race | # Population | % Population |
| Asian | 718 | 7.3% |
| Black / African American | 853 | 8.6% |
| Hawaiian / Pacific | 0 | 0.0% |
| Hispanic or Latino | 401 | 4.1% |
| Native / Alaskan | 0 | 0.0% |
| White / Caucasian | 7,919 | 80.1% |
| Two or more Races | 280 | 2.8% |
| Some other Race | 110 | 1.1% |
| Total | 9,880 | 100.0% |
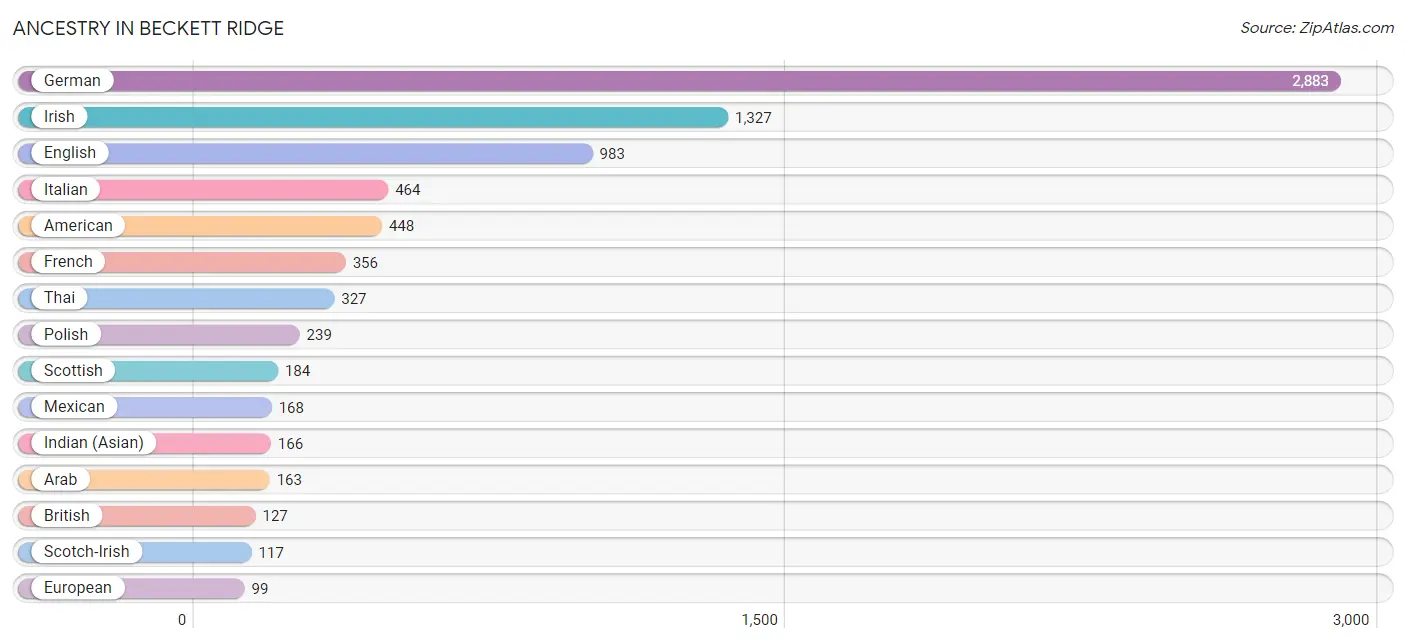
Ancestry in Beckett Ridge
The most populous ancestries reported in Beckett Ridge are German (2,883 | 29.2%), Irish (1,327 | 13.4%), English (983 | 10.0%), Italian (464 | 4.7%), and American (448 | 4.5%), together accounting for 61.8% of all Beckett Ridge residents.
| Ancestry | # Population | % Population |
| African | 17 | 0.2% |
| American | 448 | 4.5% |
| Arab | 163 | 1.7% |
| Austrian | 39 | 0.4% |
| Belgian | 9 | 0.1% |
| Bhutanese | 49 | 0.5% |
| Brazilian | 18 | 0.2% |
| British | 127 | 1.3% |
| Burmese | 23 | 0.2% |
| Central American | 30 | 0.3% |
| Cherokee | 3 | 0.0% |
| Colombian | 4 | 0.0% |
| Costa Rican | 19 | 0.2% |
| Croatian | 16 | 0.2% |
| Czech | 37 | 0.4% |
| Danish | 34 | 0.3% |
| Dominican | 16 | 0.2% |
| Dutch | 29 | 0.3% |
| Eastern European | 11 | 0.1% |
| English | 983 | 10.0% |
| Ethiopian | 42 | 0.4% |
| European | 99 | 1.0% |
| French | 356 | 3.6% |
| French Canadian | 28 | 0.3% |
| German | 2,883 | 29.2% |
| Greek | 48 | 0.5% |
| Guatemalan | 11 | 0.1% |
| Hungarian | 56 | 0.6% |
| Indian (Asian) | 166 | 1.7% |
| Indonesian | 14 | 0.1% |
| Irish | 1,327 | 13.4% |
| Italian | 464 | 4.7% |
| Jordanian | 9 | 0.1% |
| Korean | 91 | 0.9% |
| Latvian | 12 | 0.1% |
| Lebanese | 38 | 0.4% |
| Lithuanian | 8 | 0.1% |
| Mexican | 168 | 1.7% |
| Native Hawaiian | 5 | 0.1% |
| Nigerian | 15 | 0.2% |
| Northern European | 33 | 0.3% |
| Norwegian | 79 | 0.8% |
| Palestinian | 14 | 0.1% |
| Peruvian | 51 | 0.5% |
| Polish | 239 | 2.4% |
| Portuguese | 18 | 0.2% |
| Puerto Rican | 33 | 0.3% |
| Russian | 97 | 1.0% |
| Samoan | 12 | 0.1% |
| Scandinavian | 23 | 0.2% |
| Scotch-Irish | 117 | 1.2% |
| Scottish | 184 | 1.9% |
| Serbian | 41 | 0.4% |
| Slavic | 24 | 0.2% |
| Slovak | 36 | 0.4% |
| South American | 81 | 0.8% |
| Spaniard | 28 | 0.3% |
| Spanish | 39 | 0.4% |
| Sri Lankan | 66 | 0.7% |
| Subsaharan African | 98 | 1.0% |
| Swedish | 53 | 0.5% |
| Swiss | 45 | 0.5% |
| Syrian | 25 | 0.3% |
| Thai | 327 | 3.3% |
| Ukrainian | 11 | 0.1% |
| Venezuelan | 26 | 0.3% |
| Welsh | 85 | 0.9% | View All 67 Rows |
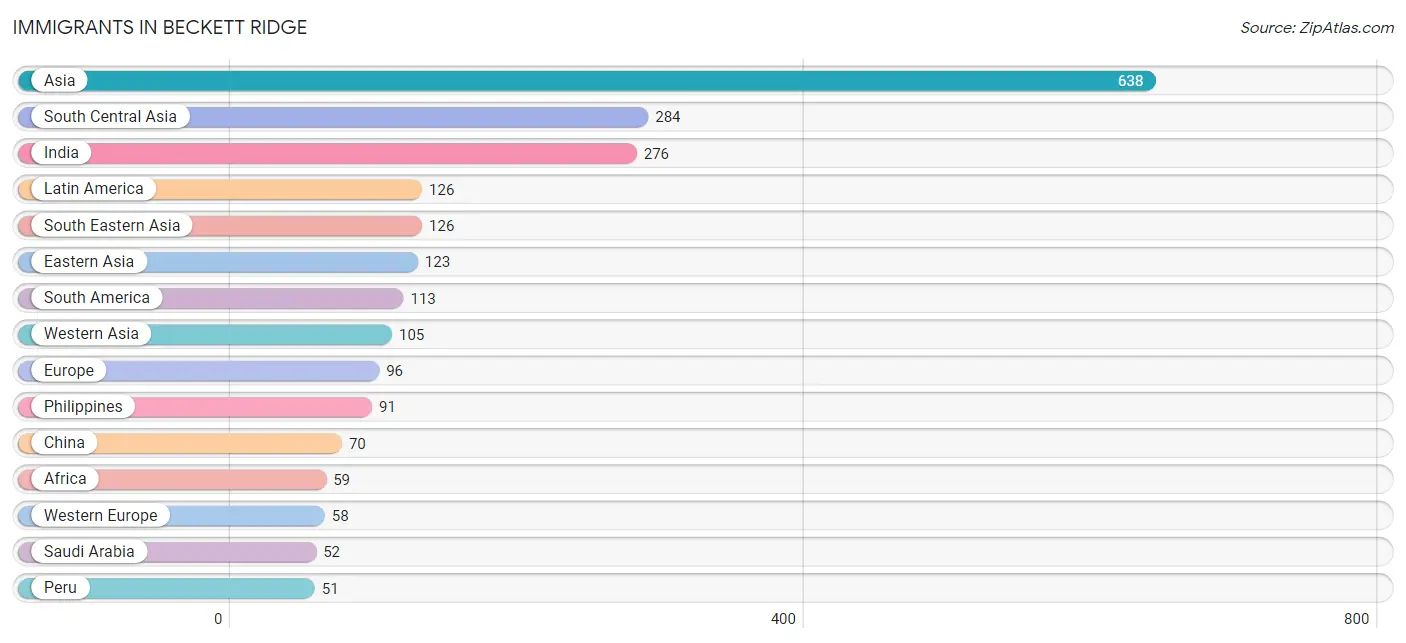
Immigrants in Beckett Ridge
The most numerous immigrant groups reported in Beckett Ridge came from Asia (638 | 6.5%), South Central Asia (284 | 2.9%), India (276 | 2.8%), Latin America (126 | 1.3%), and South Eastern Asia (126 | 1.3%), together accounting for 14.7% of all Beckett Ridge residents.
| Immigration Origin | # Population | % Population |
| Africa | 59 | 0.6% |
| Asia | 638 | 6.5% |
| Belgium | 9 | 0.1% |
| Brazil | 32 | 0.3% |
| Canada | 46 | 0.5% |
| Central America | 13 | 0.1% |
| China | 70 | 0.7% |
| Colombia | 4 | 0.0% |
| Costa Rica | 7 | 0.1% |
| Eastern Africa | 39 | 0.4% |
| Eastern Asia | 123 | 1.2% |
| Eastern Europe | 14 | 0.1% |
| Egypt | 20 | 0.2% |
| Ethiopia | 28 | 0.3% |
| Europe | 96 | 1.0% |
| Germany | 49 | 0.5% |
| Greece | 11 | 0.1% |
| India | 276 | 2.8% |
| Israel | 44 | 0.4% |
| Japan | 30 | 0.3% |
| Jordan | 9 | 0.1% |
| Kenya | 11 | 0.1% |
| Korea | 23 | 0.2% |
| Latin America | 126 | 1.3% |
| Mexico | 6 | 0.1% |
| Northern Africa | 20 | 0.2% |
| Northern Europe | 13 | 0.1% |
| Pakistan | 8 | 0.1% |
| Peru | 51 | 0.5% |
| Philippines | 91 | 0.9% |
| Russia | 11 | 0.1% |
| Saudi Arabia | 52 | 0.5% |
| Serbia | 3 | 0.0% |
| South America | 113 | 1.1% |
| South Central Asia | 284 | 2.9% |
| South Eastern Asia | 126 | 1.3% |
| Southern Europe | 11 | 0.1% |
| Taiwan | 12 | 0.1% |
| Venezuela | 26 | 0.3% |
| Vietnam | 21 | 0.2% |
| Western Asia | 105 | 1.1% |
| Western Europe | 58 | 0.6% | View All 42 Rows |
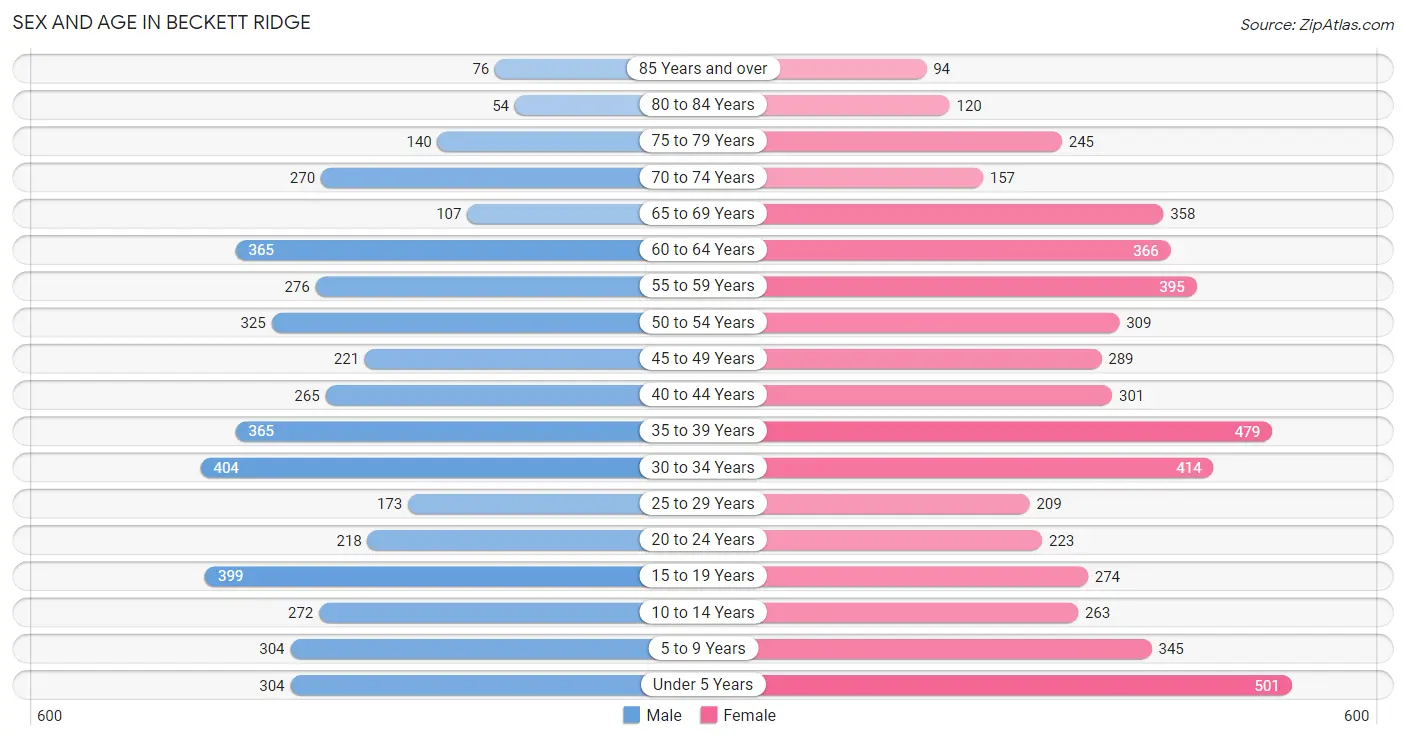
Sex and Age in Beckett Ridge
Sex and Age in Beckett Ridge
The most populous age groups in Beckett Ridge are 30 to 34 Years (404 | 8.9%) for men and Under 5 Years (501 | 9.4%) for women.
| Age Bracket | Male | Female |
| Under 5 Years | 304 (6.7%) | 501 (9.4%) |
| 5 to 9 Years | 304 (6.7%) | 345 (6.5%) |
| 10 to 14 Years | 272 (6.0%) | 263 (4.9%) |
| 15 to 19 Years | 399 (8.8%) | 274 (5.1%) |
| 20 to 24 Years | 218 (4.8%) | 223 (4.2%) |
| 25 to 29 Years | 173 (3.8%) | 209 (3.9%) |
| 30 to 34 Years | 404 (8.9%) | 414 (7.7%) |
| 35 to 39 Years | 365 (8.0%) | 479 (9.0%) |
| 40 to 44 Years | 265 (5.8%) | 301 (5.6%) |
| 45 to 49 Years | 221 (4.9%) | 289 (5.4%) |
| 50 to 54 Years | 325 (7.2%) | 309 (5.8%) |
| 55 to 59 Years | 276 (6.1%) | 395 (7.4%) |
| 60 to 64 Years | 365 (8.0%) | 366 (6.9%) |
| 65 to 69 Years | 107 (2.4%) | 358 (6.7%) |
| 70 to 74 Years | 270 (5.9%) | 157 (2.9%) |
| 75 to 79 Years | 140 (3.1%) | 245 (4.6%) |
| 80 to 84 Years | 54 (1.2%) | 120 (2.2%) |
| 85 Years and over | 76 (1.7%) | 94 (1.8%) |
| Total | 4,538 (100.0%) | 5,342 (100.0%) |
Families and Households in Beckett Ridge
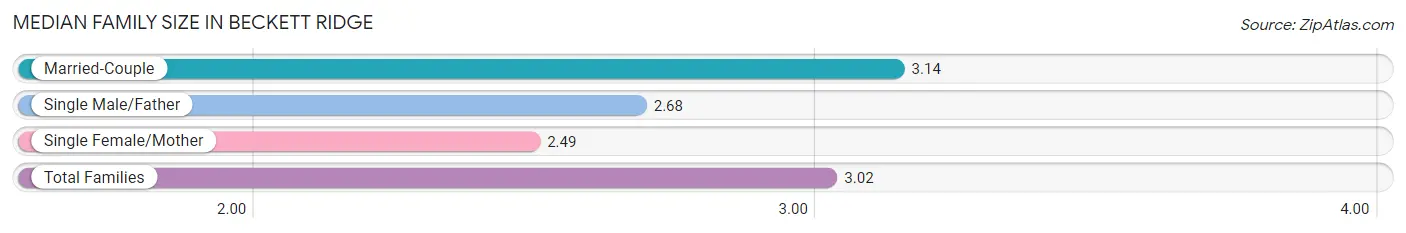
Median Family Size in Beckett Ridge
The median family size in Beckett Ridge is 3.02 persons per family, with married-couple families (2,240 | 80.4%) accounting for the largest median family size of 3.14 persons per family. On the other hand, single female/mother families (471 | 16.9%) represent the smallest median family size with 2.49 persons per family.
| Family Type | # Families | Family Size |
| Married-Couple | 2,240 (80.4%) | 3.14 |
| Single Male/Father | 74 (2.7%) | 2.68 |
| Single Female/Mother | 471 (16.9%) | 2.49 |
| Total Families | 2,785 (100.0%) | 3.02 |
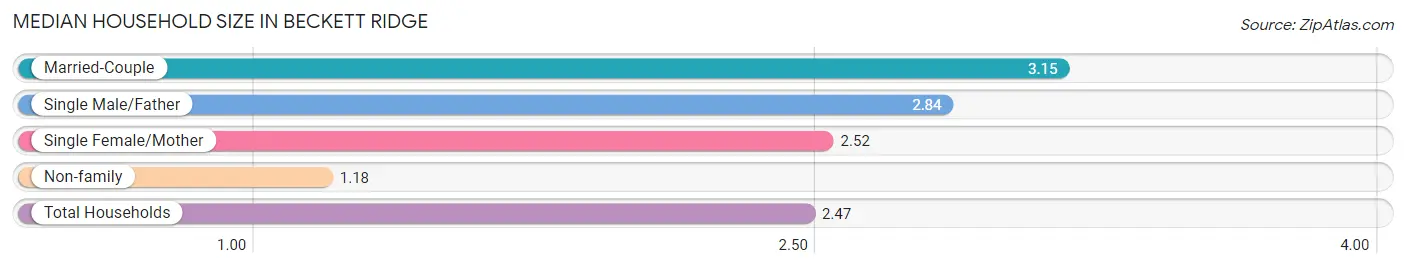
Median Household Size in Beckett Ridge
The median household size in Beckett Ridge is 2.47 persons per household, with married-couple households (2,240 | 56.0%) accounting for the largest median household size of 3.15 persons per household. non-family households (1,212 | 30.3%) represent the smallest median household size with 1.18 persons per household.
| Household Type | # Households | Household Size |
| Married-Couple | 2,240 (56.0%) | 3.15 |
| Single Male/Father | 74 (1.8%) | 2.84 |
| Single Female/Mother | 471 (11.8%) | 2.52 |
| Non-family | 1,212 (30.3%) | 1.18 |
| Total Households | 3,997 (100.0%) | 2.47 |
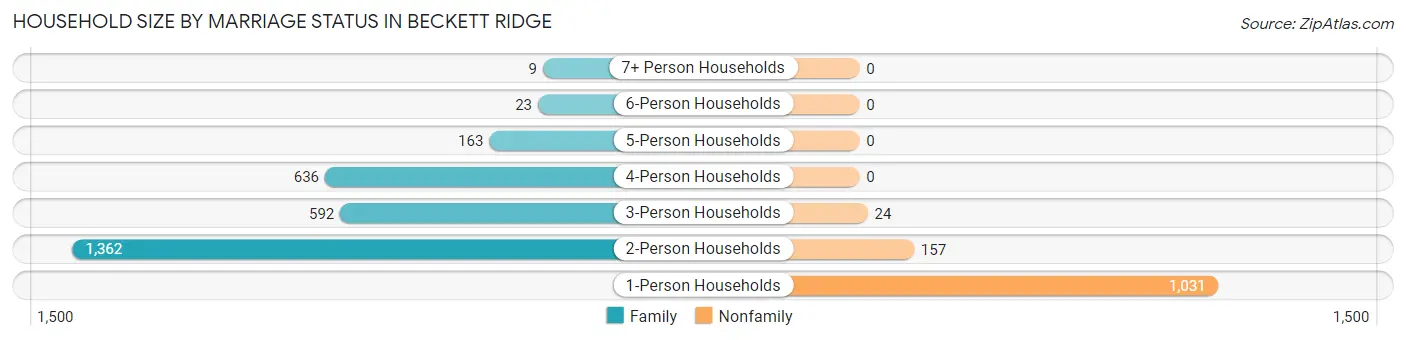
Household Size by Marriage Status in Beckett Ridge
Out of a total of 3,997 households in Beckett Ridge, 2,785 (69.7%) are family households, while 1,212 (30.3%) are nonfamily households. The most numerous type of family households are 2-person households, comprising 1,362, and the most common type of nonfamily households are 1-person households, comprising 1,031.
| Household Size | Family Households | Nonfamily Households |
| 1-Person Households | - | 1,031 (25.8%) |
| 2-Person Households | 1,362 (34.1%) | 157 (3.9%) |
| 3-Person Households | 592 (14.8%) | 24 (0.6%) |
| 4-Person Households | 636 (15.9%) | 0 (0.0%) |
| 5-Person Households | 163 (4.1%) | 0 (0.0%) |
| 6-Person Households | 23 (0.6%) | 0 (0.0%) |
| 7+ Person Households | 9 (0.2%) | 0 (0.0%) |
| Total | 2,785 (69.7%) | 1,212 (30.3%) |
Female Fertility in Beckett Ridge
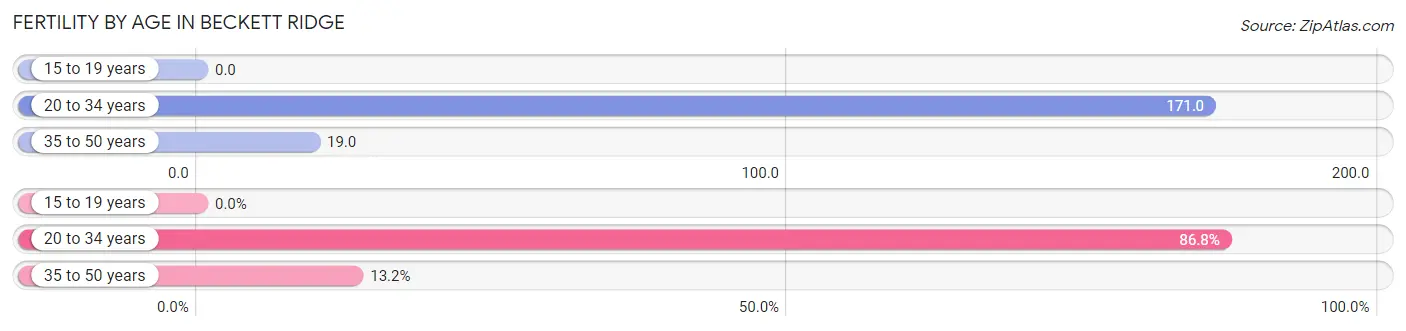
Fertility by Age in Beckett Ridge
Average fertility rate in Beckett Ridge is 72.0 births per 1,000 women. Women in the age bracket of 20 to 34 years have the highest fertility rate with 171.0 births per 1,000 women. Women in the age bracket of 20 to 34 years acount for 86.8% of all women with births.
| Age Bracket | Women with Births | Births / 1,000 Women |
| 15 to 19 years | 0 (0.0%) | 0.0 |
| 20 to 34 years | 145 (86.8%) | 171.0 |
| 35 to 50 years | 22 (13.2%) | 19.0 |
| Total | 167 (100.0%) | 72.0 |
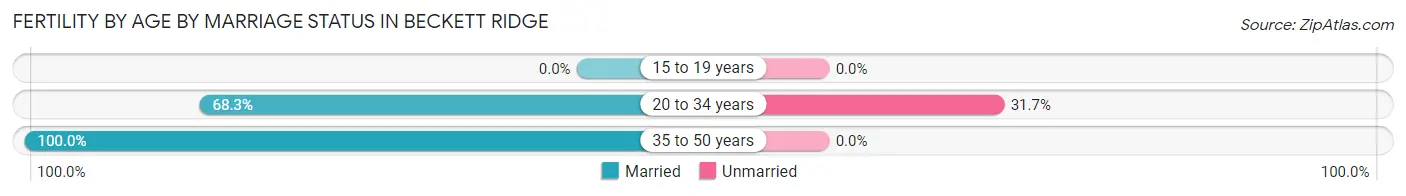
Fertility by Age by Marriage Status in Beckett Ridge
72.5% of women with births (167) in Beckett Ridge are married. The highest percentage of unmarried women with births falls into 20 to 34 years age bracket with 31.7% of them unmarried at the time of birth, while the lowest percentage of unmarried women with births belong to 35 to 50 years age bracket with 0.0% of them unmarried.
| Age Bracket | Married | Unmarried |
| 15 to 19 years | 0 (0.0%) | 0 (0.0%) |
| 20 to 34 years | 99 (68.3%) | 46 (31.7%) |
| 35 to 50 years | 22 (100.0%) | 0 (0.0%) |
| Total | 121 (72.5%) | 46 (27.5%) |
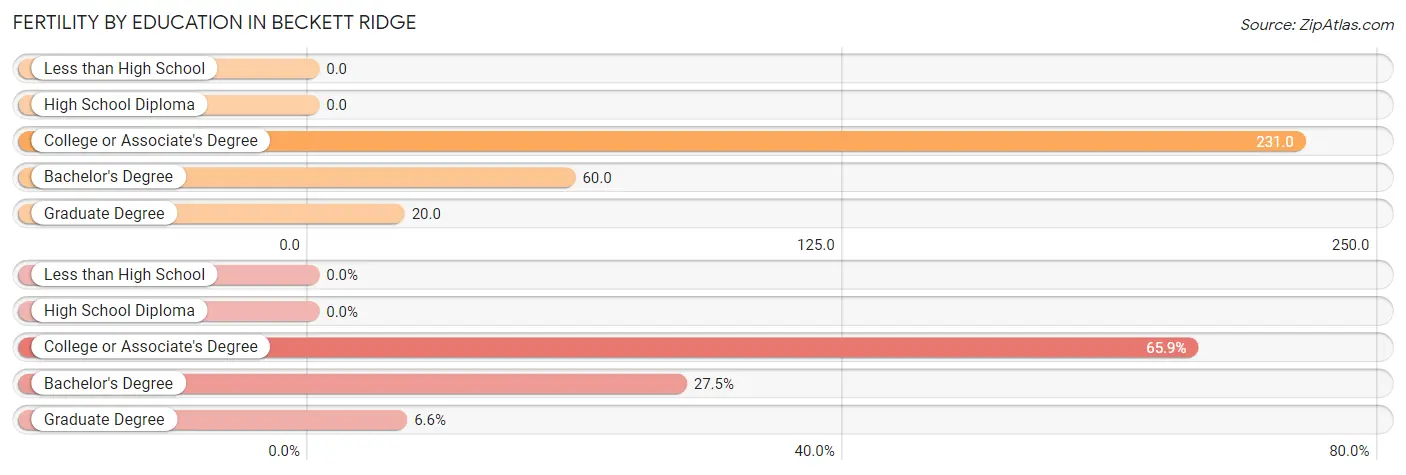
Fertility by Education in Beckett Ridge
| Educational Attainment | Women with Births | Births / 1,000 Women |
| Less than High School | 0 (0.0%) | 0.0 |
| High School Diploma | 0 (0.0%) | 0.0 |
| College or Associate's Degree | 110 (65.9%) | 231.0 |
| Bachelor's Degree | 46 (27.5%) | 60.0 |
| Graduate Degree | 11 (6.6%) | 20.0 |
| Total | 167 (100.0%) | 72.0 |
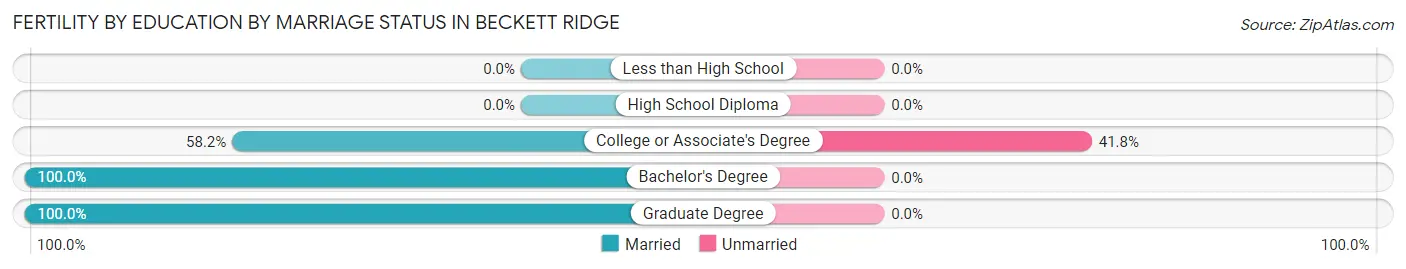
Fertility by Education by Marriage Status in Beckett Ridge
27.5% of women with births in Beckett Ridge are unmarried. Women with the educational attainment of bachelor's degree are most likely to be married with 100.0% of them married at childbirth, while women with the educational attainment of college or associate's degree are least likely to be married with 41.8% of them unmarried at childbirth.
| Educational Attainment | Married | Unmarried |
| Less than High School | 0 (0.0%) | 0 (0.0%) |
| High School Diploma | 0 (0.0%) | 0 (0.0%) |
| College or Associate's Degree | 64 (58.2%) | 46 (41.8%) |
| Bachelor's Degree | 46 (100.0%) | 0 (0.0%) |
| Graduate Degree | 11 (100.0%) | 0 (0.0%) |
| Total | 121 (72.5%) | 46 (27.5%) |
Income in Beckett Ridge
Income Overview in Beckett Ridge
Per Capita Income in Beckett Ridge is $60,488, while median incomes of families and households are $139,485 and $111,953 respectively.
| Characteristic | Number | Measure |
| Per Capita Income | 9,880 | $60,488 |
| Median Family Income | 2,785 | $139,485 |
| Mean Family Income | 2,785 | $172,962 |
| Median Household Income | 3,997 | $111,953 |
| Mean Household Income | 3,997 | $148,253 |
| Income Deficit | 2,785 | $0 |
| Wage / Income Gap (%) | 9,880 | 33.64% |
| Wage / Income Gap ($) | 9,880 | 66.36¢ per $1 |
| Gini / Inequality Index | 9,880 | 0.42 |
Earnings by Sex in Beckett Ridge
Average Earnings in Beckett Ridge are $67,261, $84,542 for men and $56,100 for women, a difference of 33.6%.
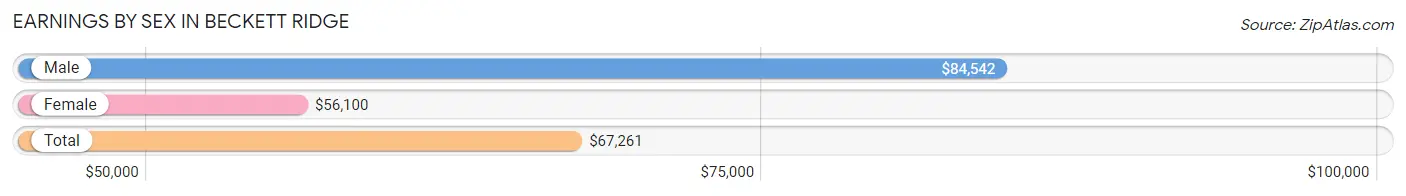
| Sex | Number | Average Earnings |
| Male | 2,713 (49.4%) | $84,542 |
| Female | 2,776 (50.6%) | $56,100 |
| Total | 5,489 (100.0%) | $67,261 |
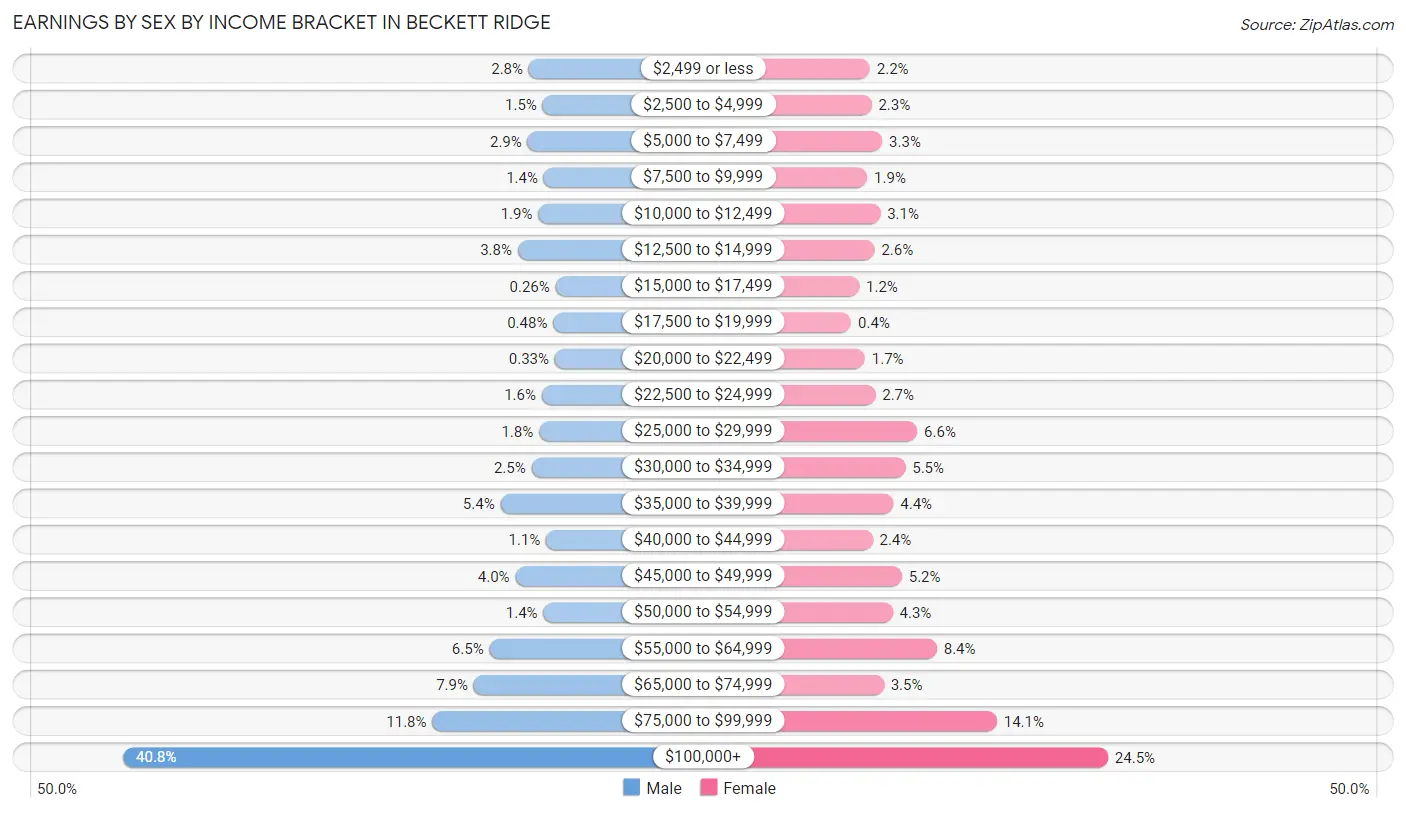
Earnings by Sex by Income Bracket in Beckett Ridge
The most common earnings brackets in Beckett Ridge are $100,000+ for men (1,106 | 40.8%) and $100,000+ for women (679 | 24.5%).
| Income | Male | Female |
| $2,499 or less | 75 (2.8%) | 60 (2.2%) |
| $2,500 to $4,999 | 40 (1.5%) | 64 (2.3%) |
| $5,000 to $7,499 | 78 (2.9%) | 92 (3.3%) |
| $7,500 to $9,999 | 37 (1.4%) | 53 (1.9%) |
| $10,000 to $12,499 | 51 (1.9%) | 87 (3.1%) |
| $12,500 to $14,999 | 103 (3.8%) | 72 (2.6%) |
| $15,000 to $17,499 | 7 (0.3%) | 32 (1.1%) |
| $17,500 to $19,999 | 13 (0.5%) | 11 (0.4%) |
| $20,000 to $22,499 | 9 (0.3%) | 47 (1.7%) |
| $22,500 to $24,999 | 42 (1.5%) | 74 (2.7%) |
| $25,000 to $29,999 | 49 (1.8%) | 183 (6.6%) |
| $30,000 to $34,999 | 68 (2.5%) | 152 (5.5%) |
| $35,000 to $39,999 | 147 (5.4%) | 121 (4.4%) |
| $40,000 to $44,999 | 31 (1.1%) | 67 (2.4%) |
| $45,000 to $49,999 | 109 (4.0%) | 143 (5.1%) |
| $50,000 to $54,999 | 38 (1.4%) | 119 (4.3%) |
| $55,000 to $64,999 | 175 (6.5%) | 234 (8.4%) |
| $65,000 to $74,999 | 215 (7.9%) | 96 (3.5%) |
| $75,000 to $99,999 | 320 (11.8%) | 390 (14.1%) |
| $100,000+ | 1,106 (40.8%) | 679 (24.5%) |
| Total | 2,713 (100.0%) | 2,776 (100.0%) |
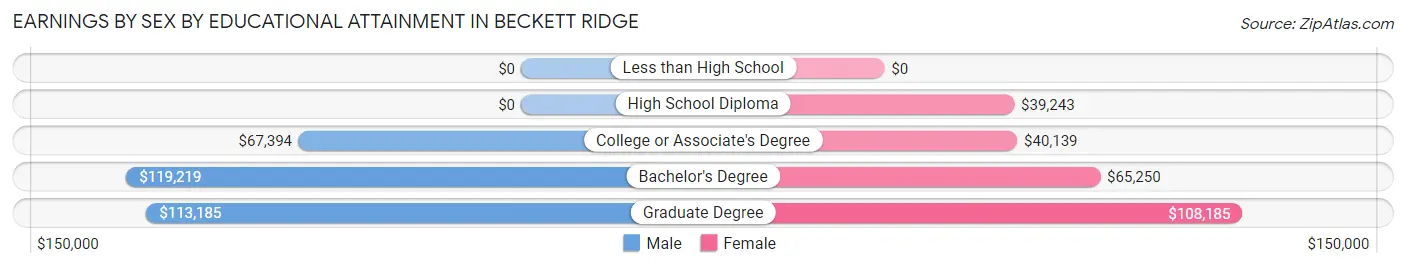
Earnings by Sex by Educational Attainment in Beckett Ridge
Average earnings in Beckett Ridge are $94,719 for men and $59,121 for women, a difference of 37.6%. Men with an educational attainment of bachelor's degree enjoy the highest average annual earnings of $119,219, while those with college or associate's degree education earn the least with $67,394. Women with an educational attainment of graduate degree earn the most with the average annual earnings of $108,185, while those with high school diploma education have the smallest earnings of $39,243.
| Educational Attainment | Male Income | Female Income |
| Less than High School | - | - |
| High School Diploma | - | - |
| College or Associate's Degree | $67,394 | $40,139 |
| Bachelor's Degree | $119,219 | $65,250 |
| Graduate Degree | $113,185 | $108,185 |
| Total | $94,719 | $59,121 |
Family Income in Beckett Ridge
Family Income Brackets in Beckett Ridge
According to the Beckett Ridge family income data, there are 1,000 families falling into the $200,000+ income range, which is the most common income bracket and makes up 35.9% of all families. Conversely, the less than $10,000 income bracket is the least frequent group with only 17 families (0.6%) belonging to this category.
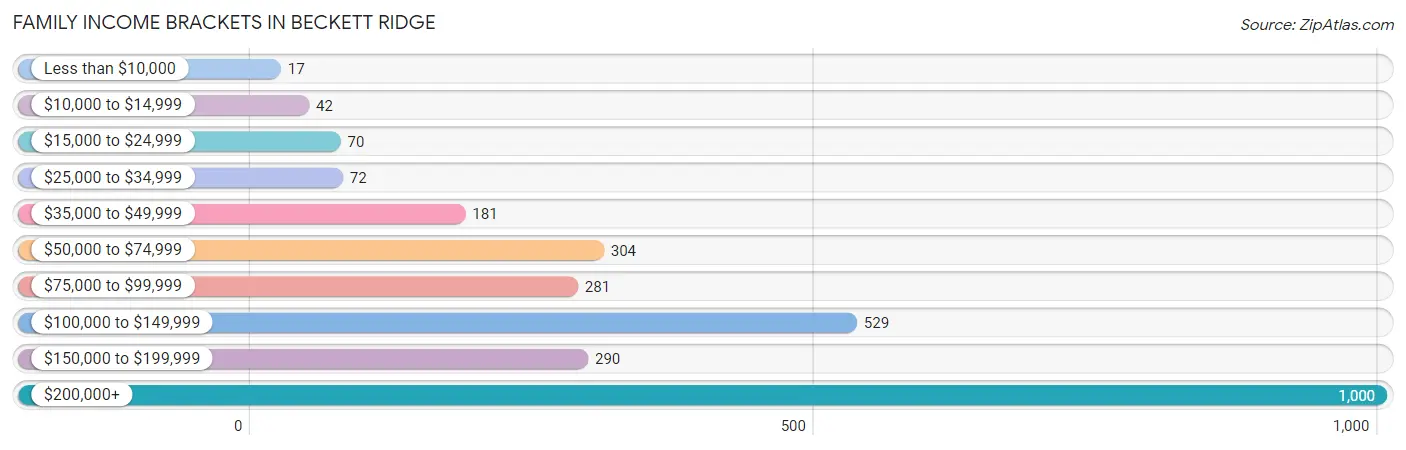
| Income Bracket | # Families | % Families |
| Less than $10,000 | 17 | 0.6% |
| $10,000 to $14,999 | 42 | 1.5% |
| $15,000 to $24,999 | 70 | 2.5% |
| $25,000 to $34,999 | 72 | 2.6% |
| $35,000 to $49,999 | 181 | 6.5% |
| $50,000 to $74,999 | 304 | 10.9% |
| $75,000 to $99,999 | 281 | 10.1% |
| $100,000 to $149,999 | 529 | 19.0% |
| $150,000 to $199,999 | 290 | 10.4% |
| $200,000+ | 1,000 | 35.9% |
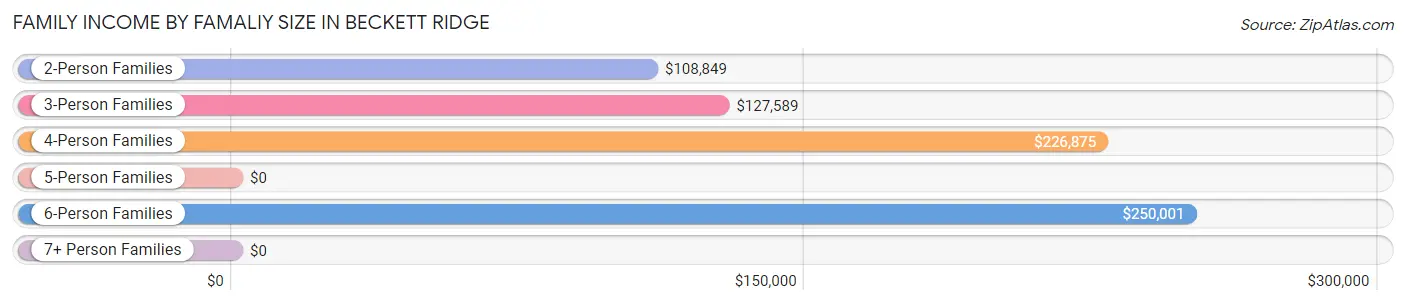
Family Income by Famaliy Size in Beckett Ridge
6-person families (23 | 0.8%) account for the highest median family income in Beckett Ridge with $250,001 per family, while 4-person families (622 | 22.3%) have the highest median income of $56,719 per family member.
| Income Bracket | # Families | Median Income |
| 2-Person Families | 1,395 (50.1%) | $108,849 |
| 3-Person Families | 573 (20.6%) | $127,589 |
| 4-Person Families | 622 (22.3%) | $226,875 |
| 5-Person Families | 163 (5.9%) | $0 |
| 6-Person Families | 23 (0.8%) | $250,001 |
| 7+ Person Families | 9 (0.3%) | $0 |
| Total | 2,785 (100.0%) | $139,485 |
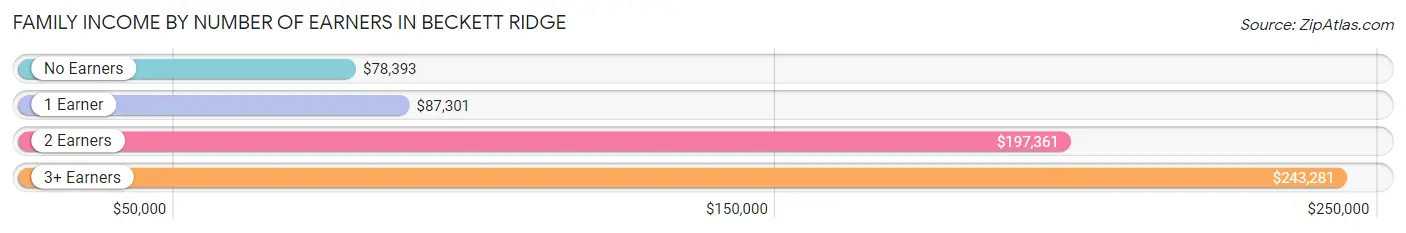
Family Income by Number of Earners in Beckett Ridge
The median family income in Beckett Ridge is $139,485, with families comprising 3+ earners (271) having the highest median family income of $243,281, while families with no earners (368) have the lowest median family income of $78,393, accounting for 9.7% and 13.2% of families, respectively.
| Number of Earners | # Families | Median Income |
| No Earners | 368 (13.2%) | $78,393 |
| 1 Earner | 933 (33.5%) | $87,301 |
| 2 Earners | 1,213 (43.5%) | $197,361 |
| 3+ Earners | 271 (9.7%) | $243,281 |
| Total | 2,785 (100.0%) | $139,485 |
Household Income in Beckett Ridge
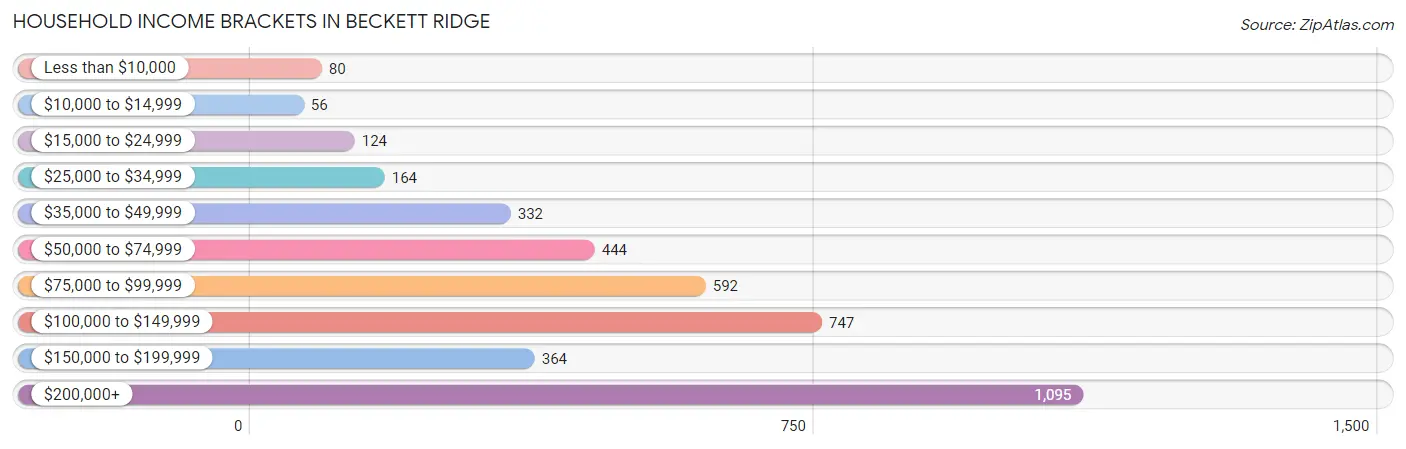
Household Income Brackets in Beckett Ridge
With 1,095 households falling in the category, the $200,000+ income range is the most frequent in Beckett Ridge, accounting for 27.4% of all households. In contrast, only 56 households (1.4%) fall into the $10,000 to $14,999 income bracket, making it the least populous group.
| Income Bracket | # Households | % Households |
| Less than $10,000 | 80 | 2.0% |
| $10,000 to $14,999 | 56 | 1.4% |
| $15,000 to $24,999 | 124 | 3.1% |
| $25,000 to $34,999 | 164 | 4.1% |
| $35,000 to $49,999 | 332 | 8.3% |
| $50,000 to $74,999 | 444 | 11.1% |
| $75,000 to $99,999 | 592 | 14.8% |
| $100,000 to $149,999 | 747 | 18.7% |
| $150,000 to $199,999 | 364 | 9.1% |
| $200,000+ | 1,095 | 27.4% |
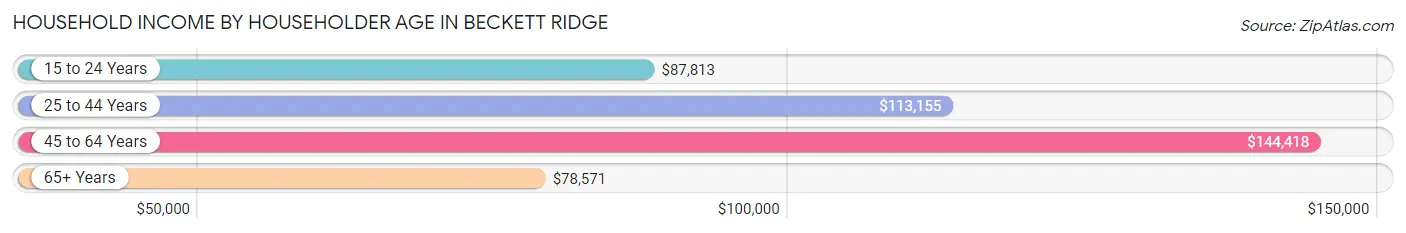
Household Income by Householder Age in Beckett Ridge
The median household income in Beckett Ridge is $111,953, with the highest median household income of $144,418 found in the 45 to 64 years age bracket for the primary householder. A total of 1,527 households (38.2%) fall into this category. Meanwhile, the 65+ years age bracket for the primary householder has the lowest median household income of $78,571, with 978 households (24.5%) in this group.
| Income Bracket | # Households | Median Income |
| 15 to 24 Years | 110 (2.8%) | $87,813 |
| 25 to 44 Years | 1,382 (34.6%) | $113,155 |
| 45 to 64 Years | 1,527 (38.2%) | $144,418 |
| 65+ Years | 978 (24.5%) | $78,571 |
| Total | 3,997 (100.0%) | $111,953 |
Poverty in Beckett Ridge
Income Below Poverty by Sex and Age in Beckett Ridge
With 4.9% poverty level for males and 5.8% for females among the residents of Beckett Ridge, 16 and 17 year old males and 15 year old females are the most vulnerable to poverty, with 73 males (34.4%) and 8 females (50.0%) in their respective age groups living below the poverty level.
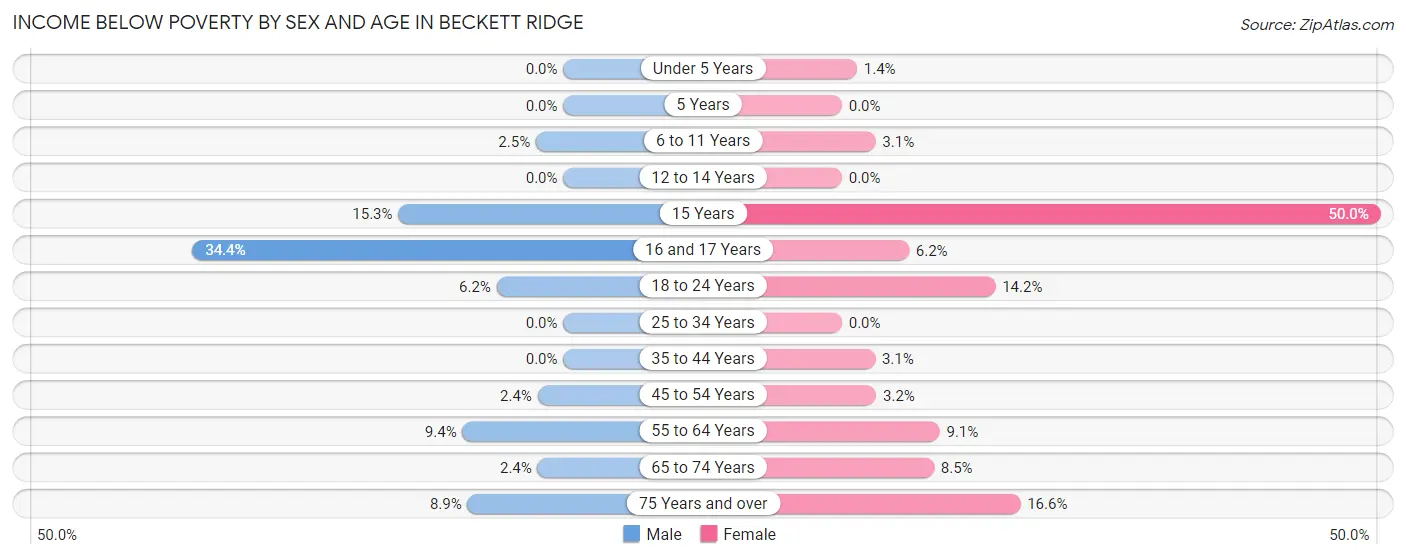
| Age Bracket | Male | Female |
| Under 5 Years | 0 (0.0%) | 7 (1.4%) |
| 5 Years | 0 (0.0%) | 0 (0.0%) |
| 6 to 11 Years | 8 (2.5%) | 12 (3.1%) |
| 12 to 14 Years | 0 (0.0%) | 0 (0.0%) |
| 15 Years | 15 (15.3%) | 8 (50.0%) |
| 16 and 17 Years | 73 (34.4%) | 12 (6.2%) |
| 18 to 24 Years | 19 (6.2%) | 41 (14.2%) |
| 25 to 34 Years | 0 (0.0%) | 0 (0.0%) |
| 35 to 44 Years | 0 (0.0%) | 24 (3.1%) |
| 45 to 54 Years | 13 (2.4%) | 19 (3.2%) |
| 55 to 64 Years | 60 (9.4%) | 69 (9.1%) |
| 65 to 74 Years | 9 (2.4%) | 44 (8.5%) |
| 75 Years and over | 24 (8.9%) | 76 (16.6%) |
| Total | 221 (4.9%) | 312 (5.8%) |
Income Above Poverty by Sex and Age in Beckett Ridge
According to the poverty statistics in Beckett Ridge, males aged under 5 years and females aged 5 years are the age groups that are most secure financially, with 100.0% of males and 100.0% of females in these age groups living above the poverty line.
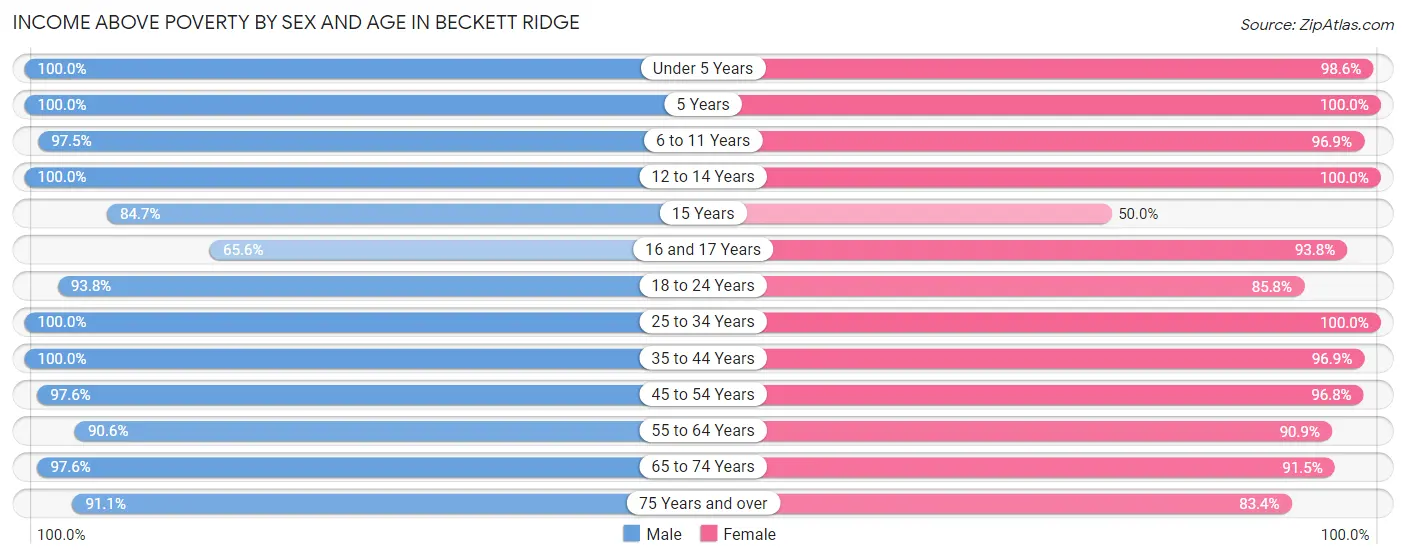
| Age Bracket | Male | Female |
| Under 5 Years | 290 (100.0%) | 494 (98.6%) |
| 5 Years | 95 (100.0%) | 77 (100.0%) |
| 6 to 11 Years | 307 (97.5%) | 373 (96.9%) |
| 12 to 14 Years | 166 (100.0%) | 146 (100.0%) |
| 15 Years | 83 (84.7%) | 8 (50.0%) |
| 16 and 17 Years | 139 (65.6%) | 181 (93.8%) |
| 18 to 24 Years | 288 (93.8%) | 247 (85.8%) |
| 25 to 34 Years | 577 (100.0%) | 623 (100.0%) |
| 35 to 44 Years | 630 (100.0%) | 756 (96.9%) |
| 45 to 54 Years | 533 (97.6%) | 579 (96.8%) |
| 55 to 64 Years | 581 (90.6%) | 692 (90.9%) |
| 65 to 74 Years | 368 (97.6%) | 471 (91.5%) |
| 75 Years and over | 246 (91.1%) | 383 (83.4%) |
| Total | 4,303 (95.1%) | 5,030 (94.2%) |
Income Below Poverty Among Married-Couple Families in Beckett Ridge
The poverty statistics for married-couple families in Beckett Ridge show that 3.1% or 70 of the total 2,240 families live below the poverty line. Families with 1 or 2 children have the highest poverty rate of 4.3%, comprising of 42 families. On the other hand, families with 3 or 4 children have the lowest poverty rate of 0.0%, which includes 0 families.
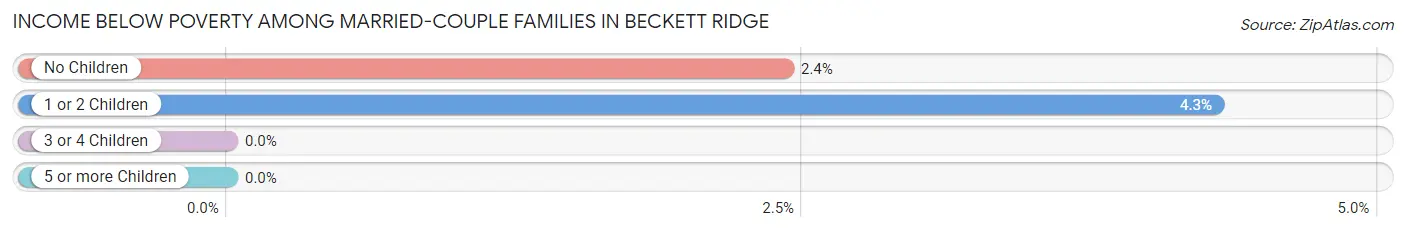
| Children | Above Poverty | Below Poverty |
| No Children | 1,130 (97.6%) | 28 (2.4%) |
| 1 or 2 Children | 936 (95.7%) | 42 (4.3%) |
| 3 or 4 Children | 104 (100.0%) | 0 (0.0%) |
| 5 or more Children | 0 (0.0%) | 0 (0.0%) |
| Total | 2,170 (96.9%) | 70 (3.1%) |
Income Below Poverty Among Single-Parent Households in Beckett Ridge
According to the poverty data in Beckett Ridge, 17.6% or 13 single-father households and 7.0% or 33 single-mother households are living below the poverty line. Among single-father households, those with no children have the highest poverty rate, with 13 households (35.1%) experiencing poverty. Likewise, among single-mother households, those with 3 or 4 children have the highest poverty rate, with 8 households (44.4%) falling below the poverty line.
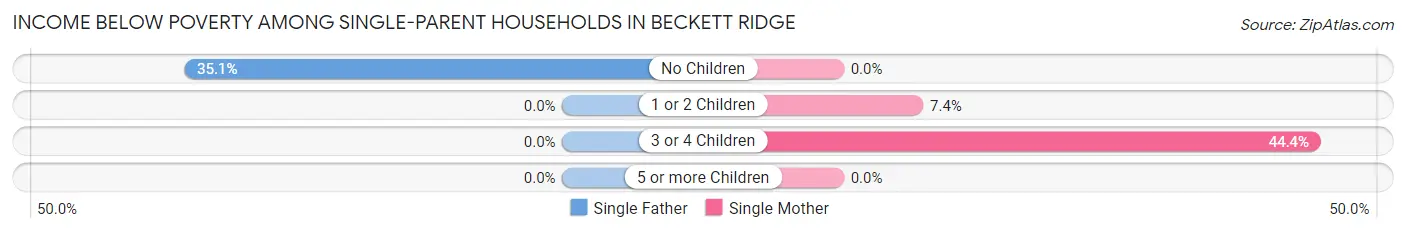
| Children | Single Father | Single Mother |
| No Children | 13 (35.1%) | 0 (0.0%) |
| 1 or 2 Children | 0 (0.0%) | 25 (7.4%) |
| 3 or 4 Children | 0 (0.0%) | 8 (44.4%) |
| 5 or more Children | 0 (0.0%) | 0 (0.0%) |
| Total | 13 (17.6%) | 33 (7.0%) |
Income Below Poverty Among Married-Couple vs Single-Parent Households in Beckett Ridge
The poverty data for Beckett Ridge shows that 70 of the married-couple family households (3.1%) and 46 of the single-parent households (8.4%) are living below the poverty level. Within the married-couple family households, those with 1 or 2 children have the highest poverty rate, with 42 households (4.3%) falling below the poverty line. Among the single-parent households, those with 3 or 4 children have the highest poverty rate, with 8 household (44.4%) living below poverty.
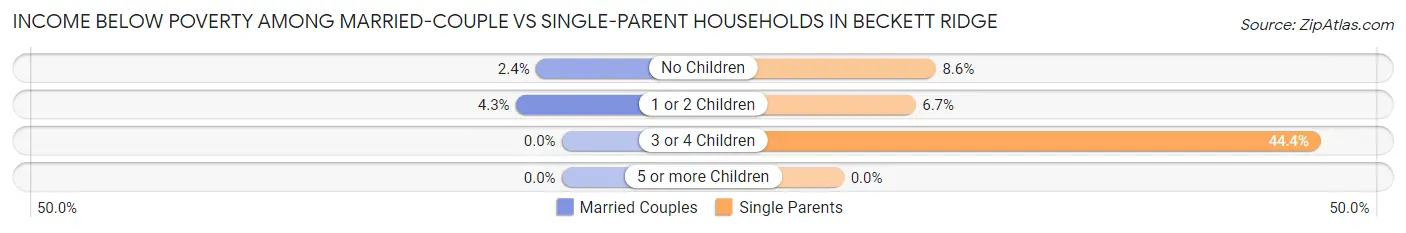
| Children | Married-Couple Families | Single-Parent Households |
| No Children | 28 (2.4%) | 13 (8.6%) |
| 1 or 2 Children | 42 (4.3%) | 25 (6.7%) |
| 3 or 4 Children | 0 (0.0%) | 8 (44.4%) |
| 5 or more Children | 0 (0.0%) | 0 (0.0%) |
| Total | 70 (3.1%) | 46 (8.4%) |
Employment Characteristics in Beckett Ridge
Employment by Class of Employer in Beckett Ridge
Among the 5,121 employed individuals in Beckett Ridge, private company employees (3,763 | 73.5%), not-for-profit organizations (361 | 7.0%), and local government employees (336 | 6.6%) make up the most common classes of employment.
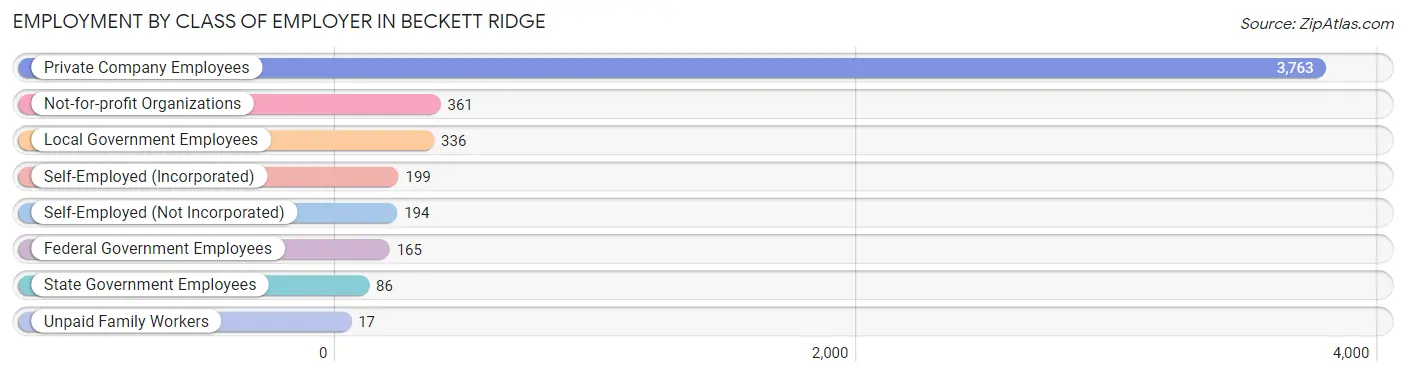
| Employer Class | # Employees | % Employees |
| Private Company Employees | 3,763 | 73.5% |
| Self-Employed (Incorporated) | 199 | 3.9% |
| Self-Employed (Not Incorporated) | 194 | 3.8% |
| Not-for-profit Organizations | 361 | 7.0% |
| Local Government Employees | 336 | 6.6% |
| State Government Employees | 86 | 1.7% |
| Federal Government Employees | 165 | 3.2% |
| Unpaid Family Workers | 17 | 0.3% |
| Total | 5,121 | 100.0% |
Employment Status by Age in Beckett Ridge
According to the labor force statistics for Beckett Ridge, out of the total population over 16 years of age (7,777), 69.3% or 5,389 individuals are in the labor force, with 4.4% or 237 of them unemployed. The age group with the highest labor force participation rate is 35 to 44 years, with 93.4% or 1,317 individuals in the labor force. Within the labor force, the 16 to 19 years age range has the highest percentage of unemployed individuals, with 39.6% or 78 of them being unemployed.
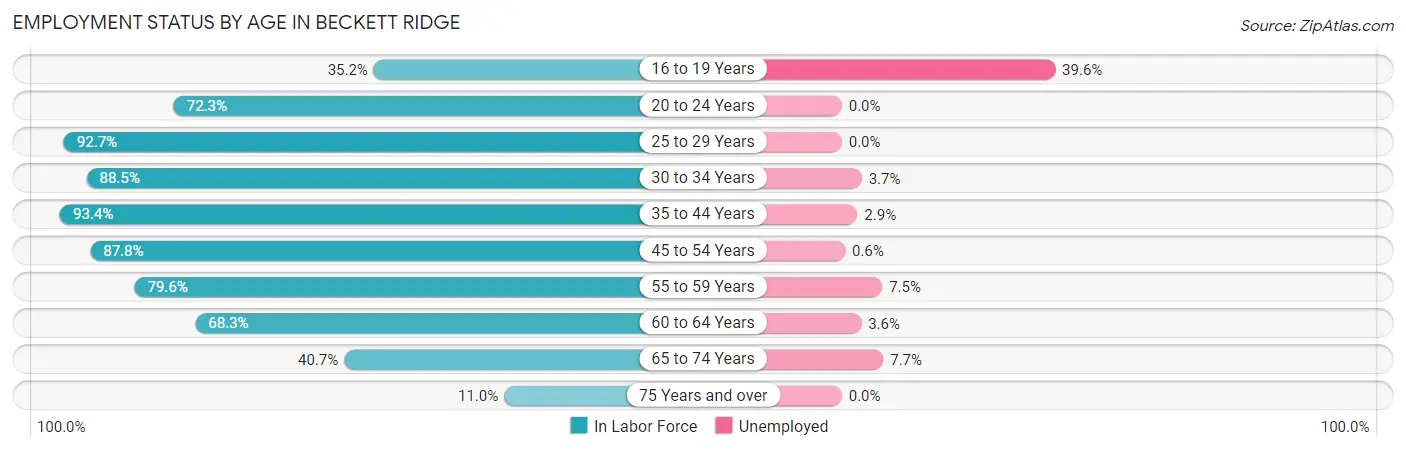
| Age Bracket | In Labor Force | Unemployed |
| 16 to 19 Years | 197 (35.2%) | 78 (39.6%) |
| 20 to 24 Years | 319 (72.3%) | 0 (0.0%) |
| 25 to 29 Years | 354 (92.7%) | 0 (0.0%) |
| 30 to 34 Years | 724 (88.5%) | 27 (3.7%) |
| 35 to 44 Years | 1,317 (93.4%) | 38 (2.9%) |
| 45 to 54 Years | 1,004 (87.8%) | 6 (0.6%) |
| 55 to 59 Years | 534 (79.6%) | 40 (7.5%) |
| 60 to 64 Years | 499 (68.3%) | 18 (3.6%) |
| 65 to 74 Years | 363 (40.7%) | 28 (7.7%) |
| 75 Years and over | 80 (11.0%) | 0 (0.0%) |
| Total | 5,389 (69.3%) | 237 (4.4%) |
Employment Status by Educational Attainment in Beckett Ridge
According to labor force statistics for Beckett Ridge, 86.0% of individuals (4,434) out of the total population between 25 and 64 years of age (5,156) are in the labor force, with 2.9% or 129 of them being unemployed. The group with the highest labor force participation rate are those with the educational attainment of college / associate degree, with 90.4% or 928 individuals in the labor force. Within the labor force, individuals with high school diploma education have the highest percentage of unemployment, with 5.2% or 35 of them being unemployed.
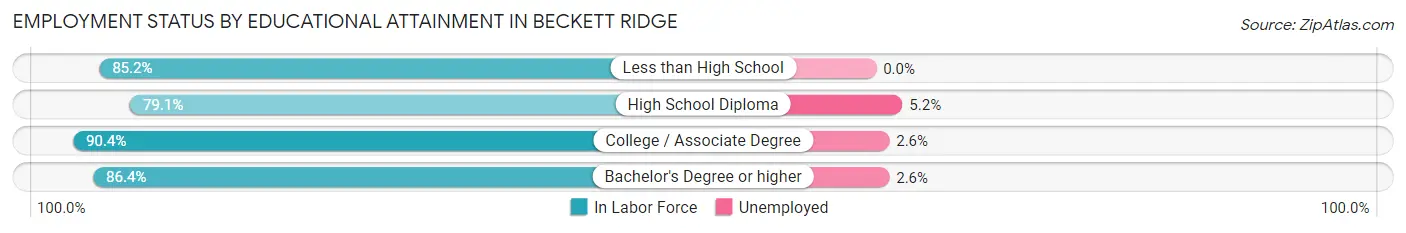
| Educational Attainment | In Labor Force | Unemployed |
| Less than High School | 121 (85.2%) | 0 (0.0%) |
| High School Diploma | 668 (79.1%) | 44 (5.2%) |
| College / Associate Degree | 928 (90.4%) | 27 (2.6%) |
| Bachelor's Degree or higher | 2,716 (86.4%) | 82 (2.6%) |
| Total | 4,434 (86.0%) | 150 (2.9%) |
Employment Occupations by Sex in Beckett Ridge
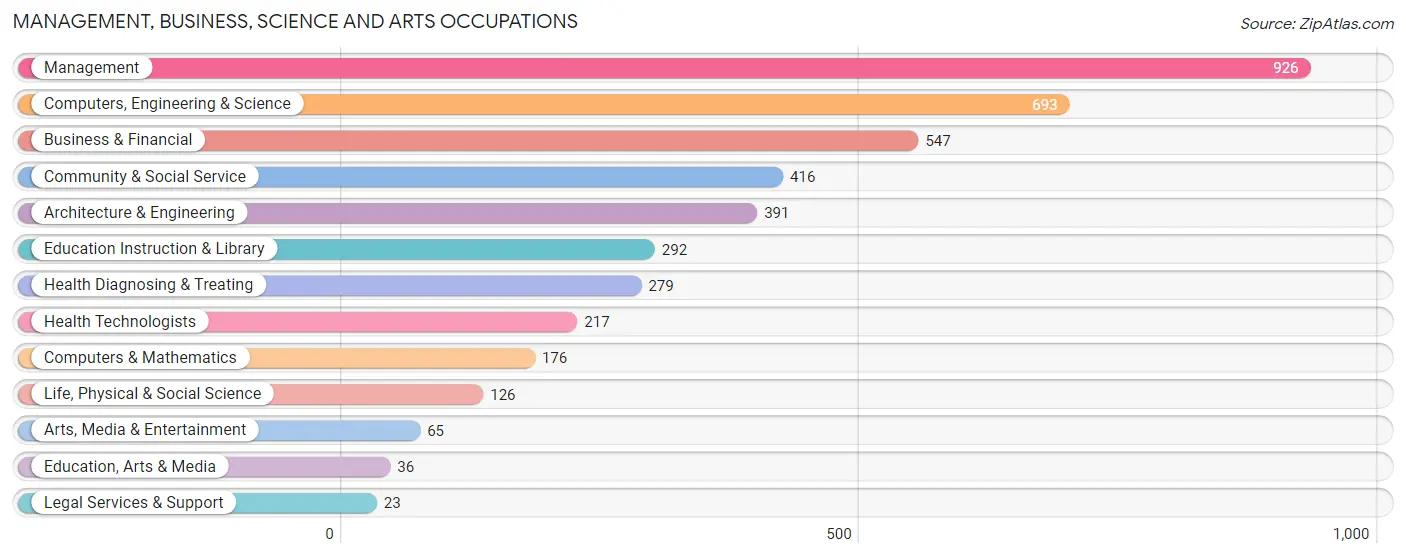
Management, Business, Science and Arts Occupations
The most common Management, Business, Science and Arts occupations in Beckett Ridge are Management (926 | 18.0%), Computers, Engineering & Science (693 | 13.4%), Business & Financial (547 | 10.6%), Community & Social Service (416 | 8.1%), and Architecture & Engineering (391 | 7.6%).
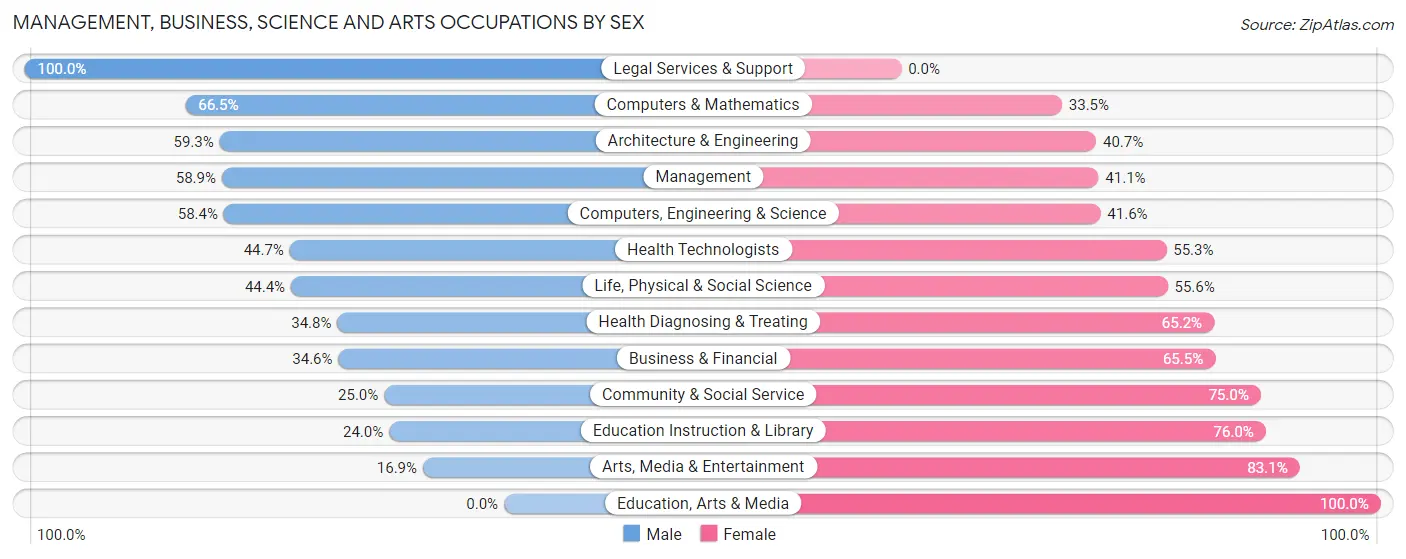
Management, Business, Science and Arts Occupations by Sex
Within the Management, Business, Science and Arts occupations in Beckett Ridge, the most male-oriented occupations are Legal Services & Support (100.0%), Computers & Mathematics (66.5%), and Architecture & Engineering (59.3%), while the most female-oriented occupations are Education, Arts & Media (100.0%), Arts, Media & Entertainment (83.1%), and Education Instruction & Library (76.0%).
| Occupation | Male | Female |
| Management | 545 (58.9%) | 381 (41.1%) |
| Business & Financial | 189 (34.5%) | 358 (65.4%) |
| Computers, Engineering & Science | 405 (58.4%) | 288 (41.6%) |
| Computers & Mathematics | 117 (66.5%) | 59 (33.5%) |
| Architecture & Engineering | 232 (59.3%) | 159 (40.7%) |
| Life, Physical & Social Science | 56 (44.4%) | 70 (55.6%) |
| Community & Social Service | 104 (25.0%) | 312 (75.0%) |
| Education, Arts & Media | 0 (0.0%) | 36 (100.0%) |
| Legal Services & Support | 23 (100.0%) | 0 (0.0%) |
| Education Instruction & Library | 70 (24.0%) | 222 (76.0%) |
| Arts, Media & Entertainment | 11 (16.9%) | 54 (83.1%) |
| Health Diagnosing & Treating | 97 (34.8%) | 182 (65.2%) |
| Health Technologists | 97 (44.7%) | 120 (55.3%) |
| Total (Category) | 1,340 (46.8%) | 1,521 (53.2%) |
| Total (Overall) | 2,521 (48.9%) | 2,636 (51.1%) |
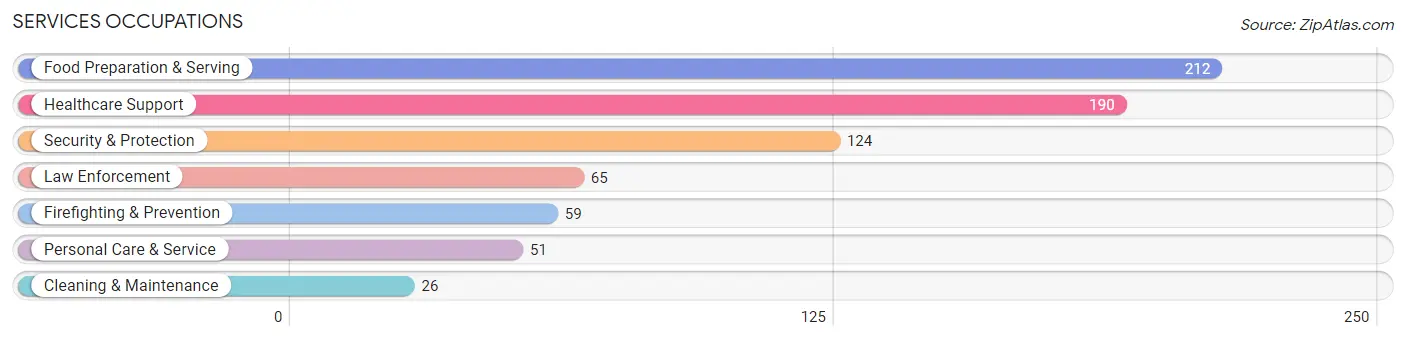
Services Occupations
The most common Services occupations in Beckett Ridge are Food Preparation & Serving (212 | 4.1%), Healthcare Support (190 | 3.7%), Security & Protection (124 | 2.4%), Law Enforcement (65 | 1.3%), and Firefighting & Prevention (59 | 1.1%).
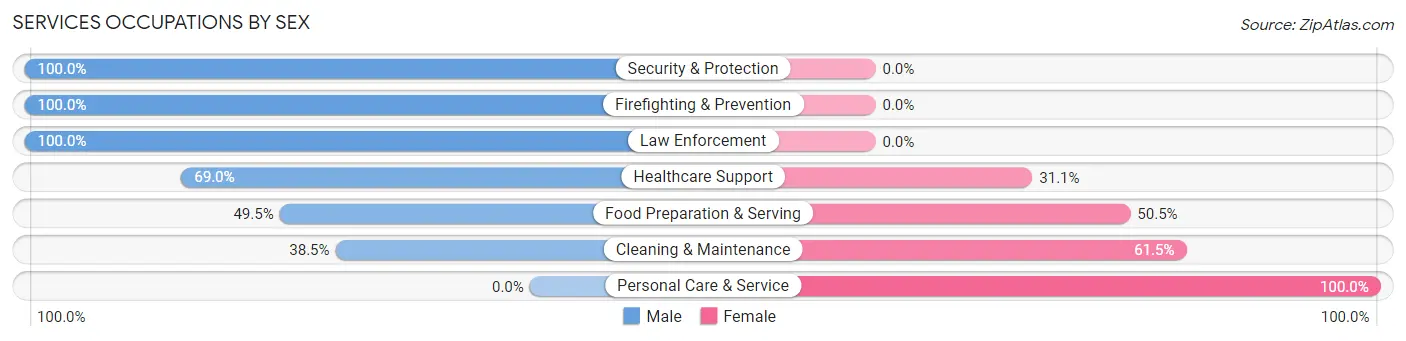
Services Occupations by Sex
Within the Services occupations in Beckett Ridge, the most male-oriented occupations are Security & Protection (100.0%), Firefighting & Prevention (100.0%), and Law Enforcement (100.0%), while the most female-oriented occupations are Personal Care & Service (100.0%), Cleaning & Maintenance (61.5%), and Food Preparation & Serving (50.5%).
| Occupation | Male | Female |
| Healthcare Support | 131 (69.0%) | 59 (31.0%) |
| Security & Protection | 124 (100.0%) | 0 (0.0%) |
| Firefighting & Prevention | 59 (100.0%) | 0 (0.0%) |
| Law Enforcement | 65 (100.0%) | 0 (0.0%) |
| Food Preparation & Serving | 105 (49.5%) | 107 (50.5%) |
| Cleaning & Maintenance | 10 (38.5%) | 16 (61.5%) |
| Personal Care & Service | 0 (0.0%) | 51 (100.0%) |
| Total (Category) | 370 (61.4%) | 233 (38.6%) |
| Total (Overall) | 2,521 (48.9%) | 2,636 (51.1%) |
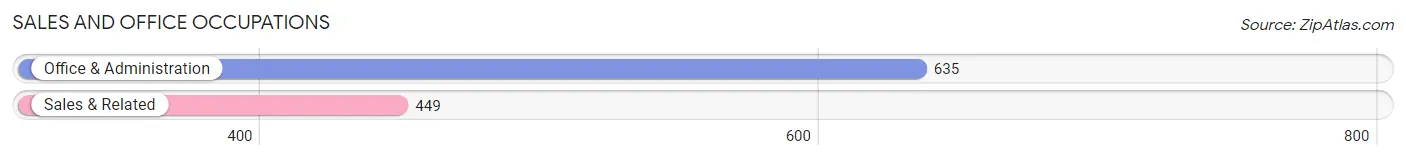
Sales and Office Occupations
The most common Sales and Office occupations in Beckett Ridge are Office & Administration (635 | 12.3%), and Sales & Related (449 | 8.7%).
Sales and Office Occupations by Sex
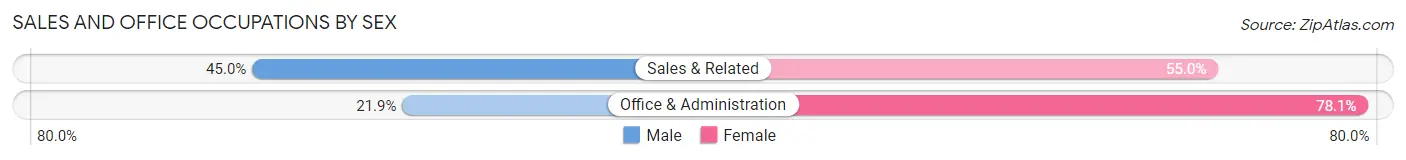
| Occupation | Male | Female |
| Sales & Related | 202 (45.0%) | 247 (55.0%) |
| Office & Administration | 139 (21.9%) | 496 (78.1%) |
| Total (Category) | 341 (31.5%) | 743 (68.5%) |
| Total (Overall) | 2,521 (48.9%) | 2,636 (51.1%) |
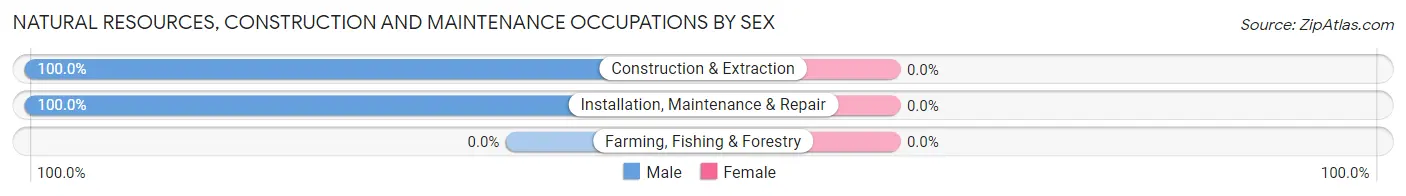
Natural Resources, Construction and Maintenance Occupations
The most common Natural Resources, Construction and Maintenance occupations in Beckett Ridge are Installation, Maintenance & Repair (89 | 1.7%), and Construction & Extraction (45 | 0.9%).

Natural Resources, Construction and Maintenance Occupations by Sex
| Occupation | Male | Female |
| Farming, Fishing & Forestry | 0 (0.0%) | 0 (0.0%) |
| Construction & Extraction | 45 (100.0%) | 0 (0.0%) |
| Installation, Maintenance & Repair | 89 (100.0%) | 0 (0.0%) |
| Total (Category) | 134 (100.0%) | 0 (0.0%) |
| Total (Overall) | 2,521 (48.9%) | 2,636 (51.1%) |
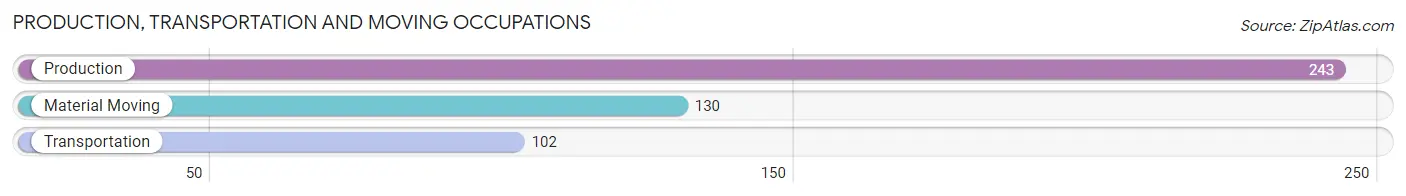
Production, Transportation and Moving Occupations
The most common Production, Transportation and Moving occupations in Beckett Ridge are Production (243 | 4.7%), Material Moving (130 | 2.5%), and Transportation (102 | 2.0%).
Production, Transportation and Moving Occupations by Sex
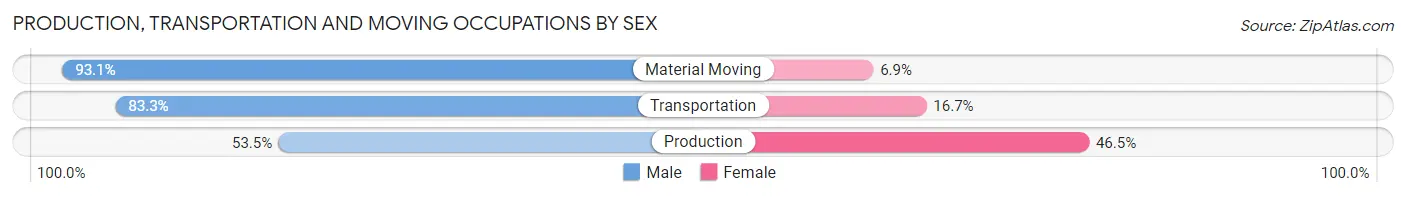
| Occupation | Male | Female |
| Production | 130 (53.5%) | 113 (46.5%) |
| Transportation | 85 (83.3%) | 17 (16.7%) |
| Material Moving | 121 (93.1%) | 9 (6.9%) |
| Total (Category) | 336 (70.7%) | 139 (29.3%) |
| Total (Overall) | 2,521 (48.9%) | 2,636 (51.1%) |
Employment Industries by Sex in Beckett Ridge
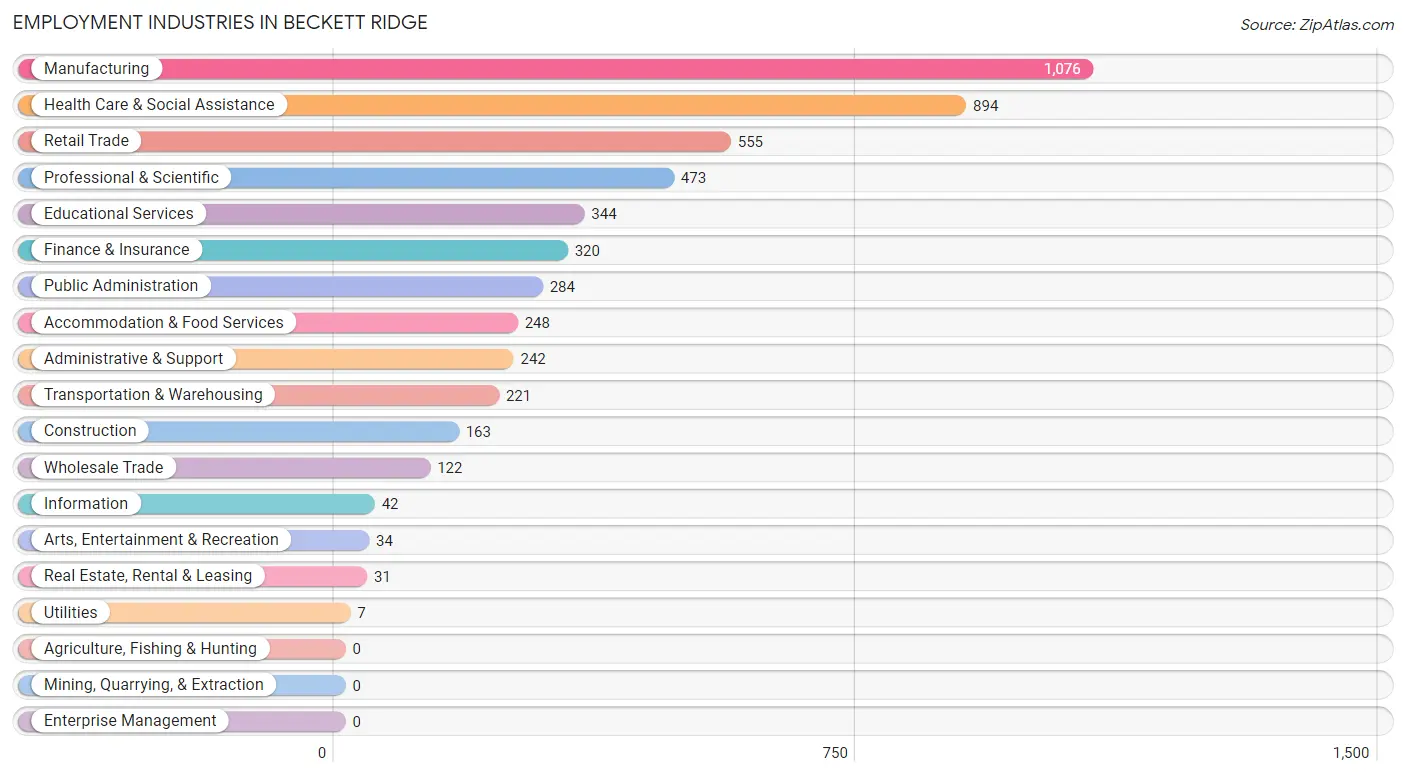
Employment Industries in Beckett Ridge
The major employment industries in Beckett Ridge include Manufacturing (1,076 | 20.9%), Health Care & Social Assistance (894 | 17.3%), Retail Trade (555 | 10.8%), Professional & Scientific (473 | 9.2%), and Educational Services (344 | 6.7%).
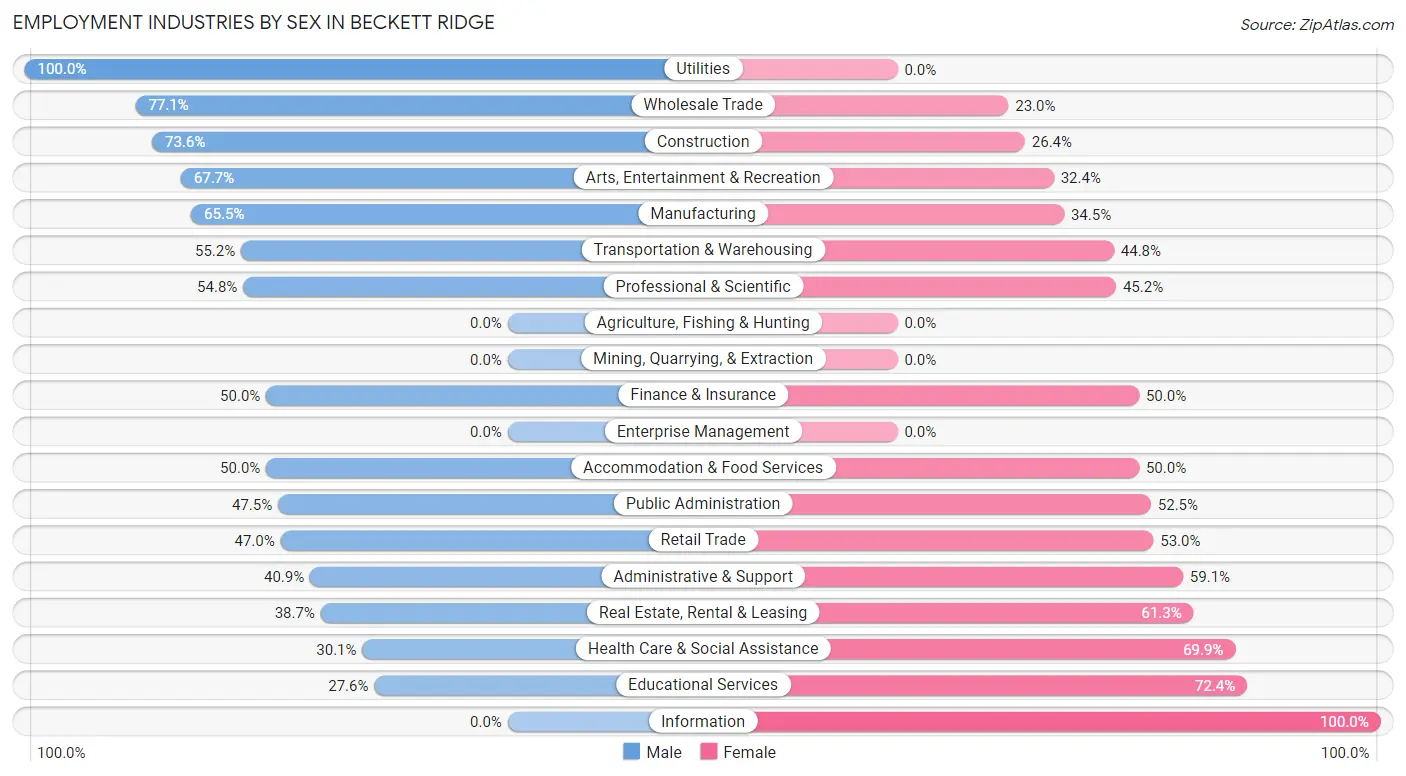
Employment Industries by Sex in Beckett Ridge
The Beckett Ridge industries that see more men than women are Utilities (100.0%), Wholesale Trade (77.0%), and Construction (73.6%), whereas the industries that tend to have a higher number of women are Information (100.0%), Educational Services (72.4%), and Health Care & Social Assistance (69.9%).
| Industry | Male | Female |
| Agriculture, Fishing & Hunting | 0 (0.0%) | 0 (0.0%) |
| Mining, Quarrying, & Extraction | 0 (0.0%) | 0 (0.0%) |
| Construction | 120 (73.6%) | 43 (26.4%) |
| Manufacturing | 705 (65.5%) | 371 (34.5%) |
| Wholesale Trade | 94 (77.0%) | 28 (23.0%) |
| Retail Trade | 261 (47.0%) | 294 (53.0%) |
| Transportation & Warehousing | 122 (55.2%) | 99 (44.8%) |
| Utilities | 7 (100.0%) | 0 (0.0%) |
| Information | 0 (0.0%) | 42 (100.0%) |
| Finance & Insurance | 160 (50.0%) | 160 (50.0%) |
| Real Estate, Rental & Leasing | 12 (38.7%) | 19 (61.3%) |
| Professional & Scientific | 259 (54.8%) | 214 (45.2%) |
| Enterprise Management | 0 (0.0%) | 0 (0.0%) |
| Administrative & Support | 99 (40.9%) | 143 (59.1%) |
| Educational Services | 95 (27.6%) | 249 (72.4%) |
| Health Care & Social Assistance | 269 (30.1%) | 625 (69.9%) |
| Arts, Entertainment & Recreation | 23 (67.6%) | 11 (32.4%) |
| Accommodation & Food Services | 124 (50.0%) | 124 (50.0%) |
| Public Administration | 135 (47.5%) | 149 (52.5%) |
| Total | 2,521 (48.9%) | 2,636 (51.1%) |
Education in Beckett Ridge
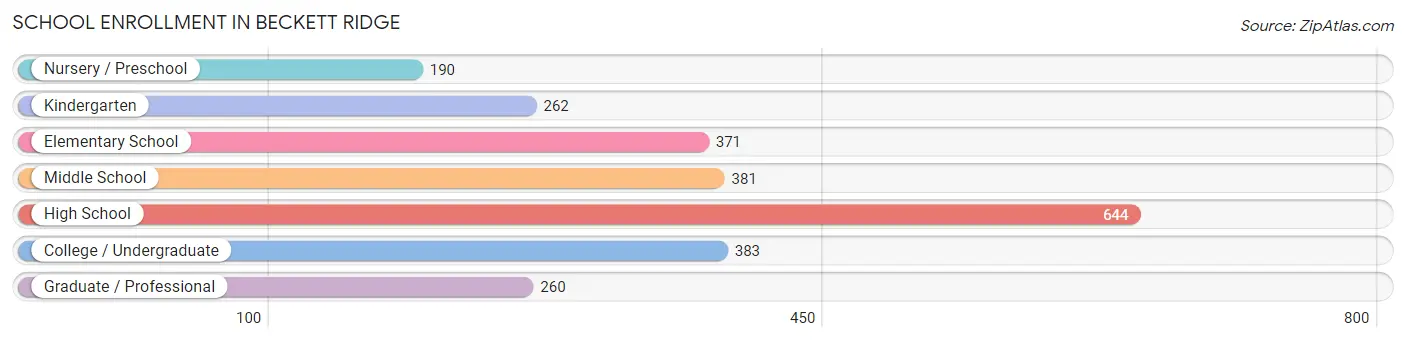
School Enrollment in Beckett Ridge
The most common levels of schooling among the 2,491 students in Beckett Ridge are high school (644 | 25.9%), college / undergraduate (383 | 15.4%), and middle school (381 | 15.3%).
| School Level | # Students | % Students |
| Nursery / Preschool | 190 | 7.6% |
| Kindergarten | 262 | 10.5% |
| Elementary School | 371 | 14.9% |
| Middle School | 381 | 15.3% |
| High School | 644 | 25.9% |
| College / Undergraduate | 383 | 15.4% |
| Graduate / Professional | 260 | 10.4% |
| Total | 2,491 | 100.0% |
School Enrollment by Age by Funding Source in Beckett Ridge
Out of a total of 2,491 students who are enrolled in schools in Beckett Ridge, 423 (17.0%) attend a private institution, while the remaining 2,068 (83.0%) are enrolled in public schools. The age group of 25 to 34 year olds has the highest likelihood of being enrolled in private schools, with 59 (74.7% in the age bracket) enrolled. Conversely, the age group of 10 to 14 year olds has the lowest likelihood of being enrolled in a private school, with 501 (98.2% in the age bracket) attending a public institution.
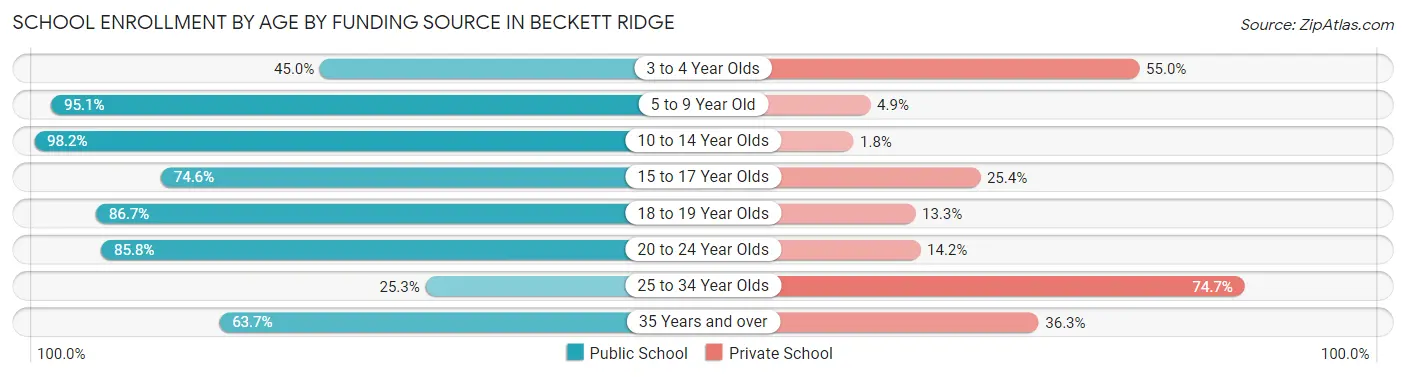
| Age Bracket | Public School | Private School |
| 3 to 4 Year Olds | 58 (45.0%) | 71 (55.0%) |
| 5 to 9 Year Old | 617 (95.1%) | 32 (4.9%) |
| 10 to 14 Year Olds | 501 (98.2%) | 9 (1.8%) |
| 15 to 17 Year Olds | 379 (74.6%) | 129 (25.4%) |
| 18 to 19 Year Olds | 124 (86.7%) | 19 (13.3%) |
| 20 to 24 Year Olds | 259 (85.8%) | 43 (14.2%) |
| 25 to 34 Year Olds | 20 (25.3%) | 59 (74.7%) |
| 35 Years and over | 109 (63.7%) | 62 (36.3%) |
| Total | 2,068 (83.0%) | 423 (17.0%) |
Educational Attainment by Field of Study in Beckett Ridge
Business (960 | 22.7%), engineering (690 | 16.3%), education (508 | 12.0%), science & technology (350 | 8.3%), and physical & health sciences (344 | 8.1%) are the most common fields of study among 4,230 individuals in Beckett Ridge who have obtained a bachelor's degree or higher.
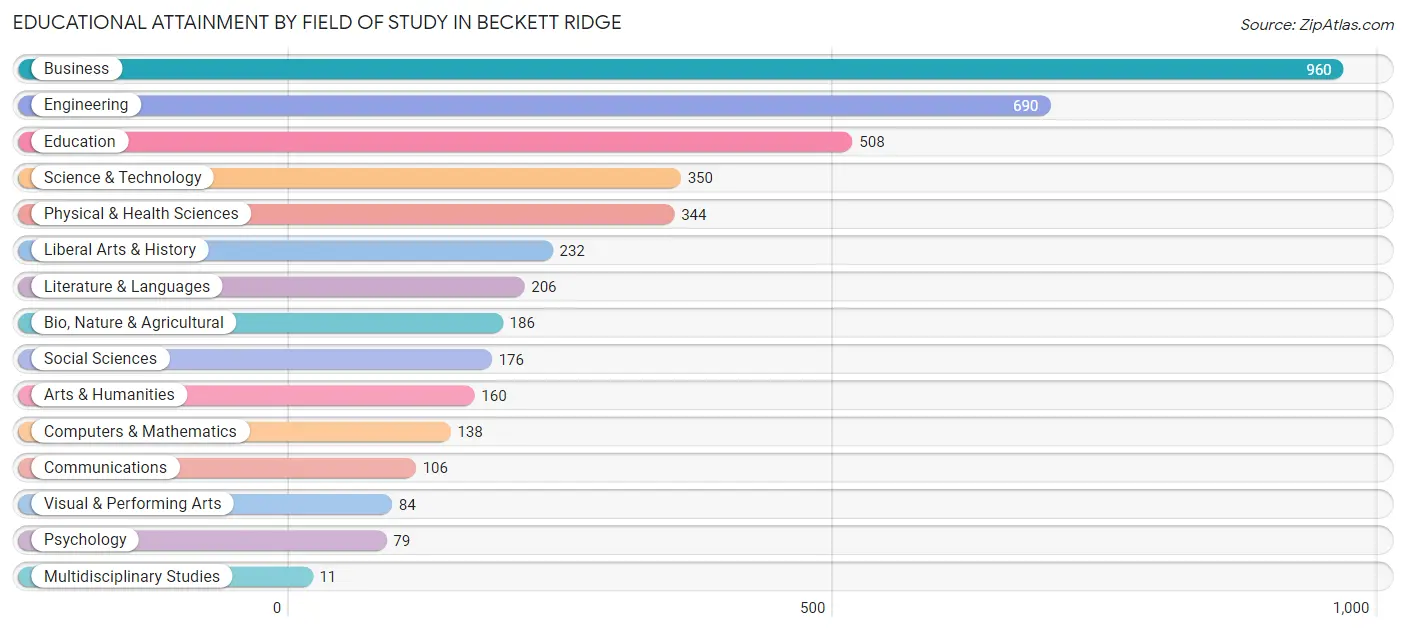
| Field of Study | # Graduates | % Graduates |
| Computers & Mathematics | 138 | 3.3% |
| Bio, Nature & Agricultural | 186 | 4.4% |
| Physical & Health Sciences | 344 | 8.1% |
| Psychology | 79 | 1.9% |
| Social Sciences | 176 | 4.2% |
| Engineering | 690 | 16.3% |
| Multidisciplinary Studies | 11 | 0.3% |
| Science & Technology | 350 | 8.3% |
| Business | 960 | 22.7% |
| Education | 508 | 12.0% |
| Literature & Languages | 206 | 4.9% |
| Liberal Arts & History | 232 | 5.5% |
| Visual & Performing Arts | 84 | 2.0% |
| Communications | 106 | 2.5% |
| Arts & Humanities | 160 | 3.8% |
| Total | 4,230 | 100.0% |
Transportation & Commute in Beckett Ridge
Vehicle Availability by Sex in Beckett Ridge
The most prevalent vehicle ownership categories in Beckett Ridge are males with 2 vehicles (1,351, accounting for 53.6%) and females with 2 vehicles (1,147, making up 52.0%).
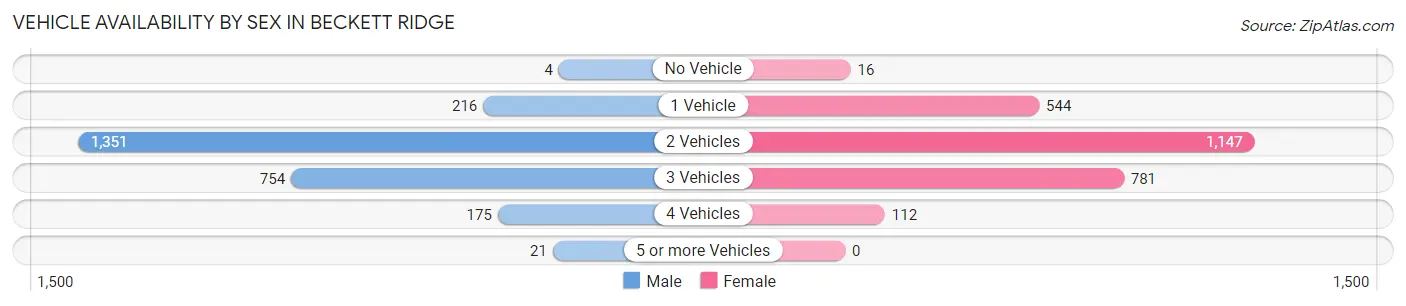
| Vehicles Available | Male | Female |
| No Vehicle | 4 (0.2%) | 16 (0.6%) |
| 1 Vehicle | 216 (8.6%) | 544 (20.9%) |
| 2 Vehicles | 1,351 (53.6%) | 1,147 (44.1%) |
| 3 Vehicles | 754 (29.9%) | 781 (30.0%) |
| 4 Vehicles | 175 (6.9%) | 112 (4.3%) |
| 5 or more Vehicles | 21 (0.8%) | 0 (0.0%) |
| Total | 2,521 (100.0%) | 2,600 (100.0%) |
Commute Time in Beckett Ridge
The most frequently occuring commute durations in Beckett Ridge are 15 to 19 minutes (980 commuters, 22.6%), 30 to 34 minutes (657 commuters, 15.1%), and 20 to 24 minutes (591 commuters, 13.6%).
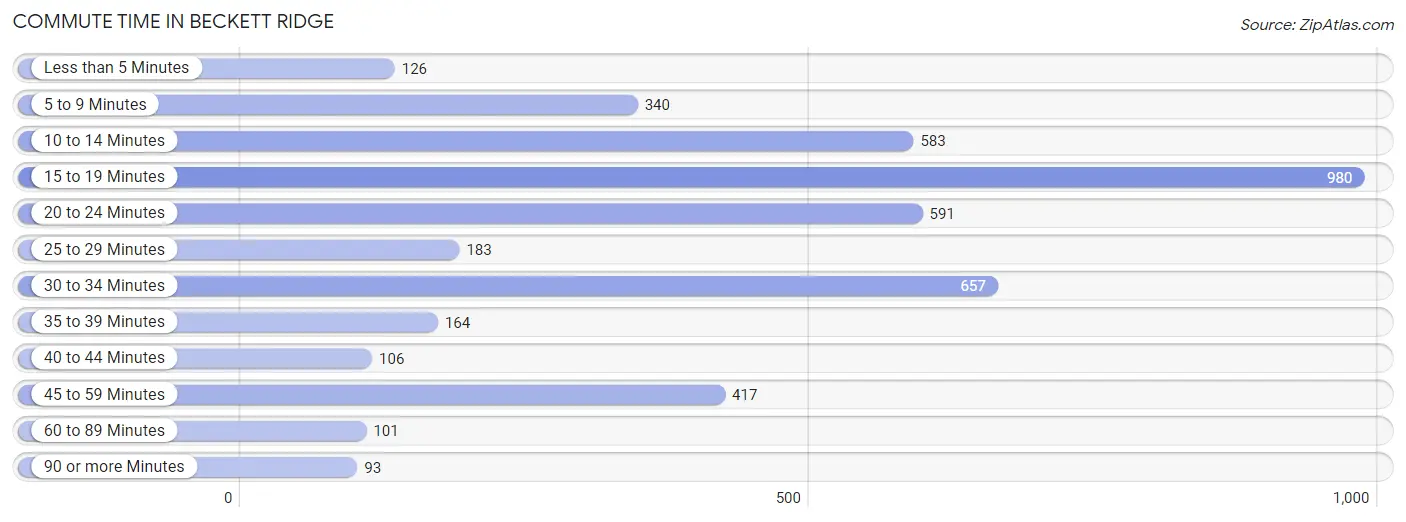
| Commute Time | # Commuters | % Commuters |
| Less than 5 Minutes | 126 | 2.9% |
| 5 to 9 Minutes | 340 | 7.8% |
| 10 to 14 Minutes | 583 | 13.4% |
| 15 to 19 Minutes | 980 | 22.6% |
| 20 to 24 Minutes | 591 | 13.6% |
| 25 to 29 Minutes | 183 | 4.2% |
| 30 to 34 Minutes | 657 | 15.1% |
| 35 to 39 Minutes | 164 | 3.8% |
| 40 to 44 Minutes | 106 | 2.4% |
| 45 to 59 Minutes | 417 | 9.6% |
| 60 to 89 Minutes | 101 | 2.3% |
| 90 or more Minutes | 93 | 2.1% |
Commute Time by Sex in Beckett Ridge
The most common commute times in Beckett Ridge are 15 to 19 minutes (578 commuters, 26.6%) for males and 10 to 14 minutes (427 commuters, 19.7%) for females.
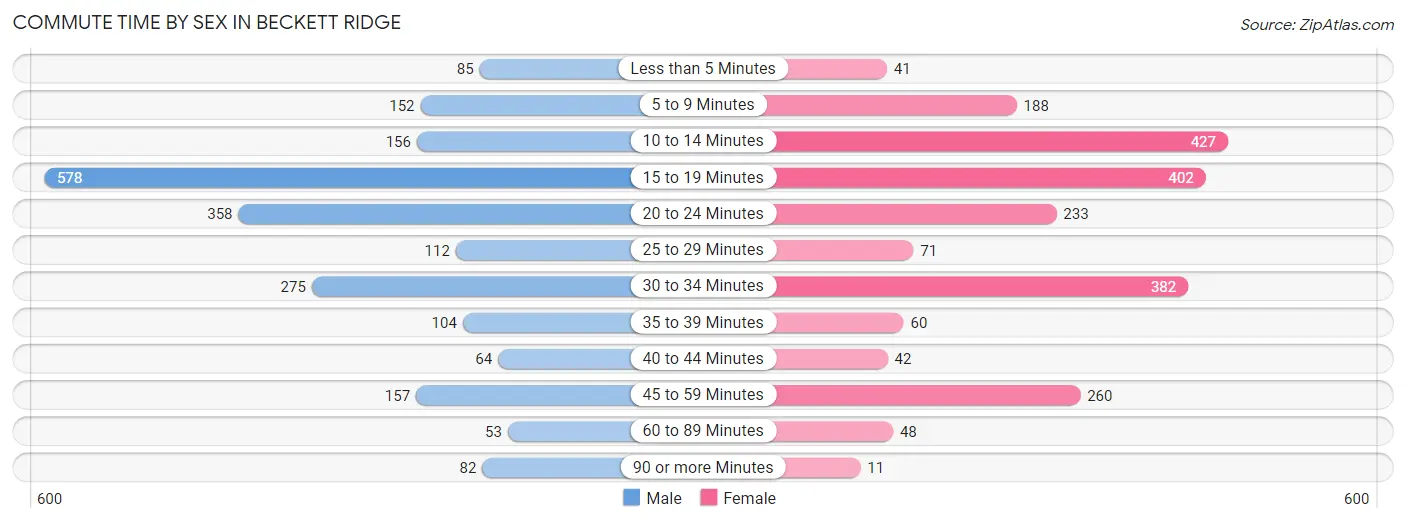
| Commute Time | Male | Female |
| Less than 5 Minutes | 85 (3.9%) | 41 (1.9%) |
| 5 to 9 Minutes | 152 (7.0%) | 188 (8.7%) |
| 10 to 14 Minutes | 156 (7.2%) | 427 (19.7%) |
| 15 to 19 Minutes | 578 (26.6%) | 402 (18.6%) |
| 20 to 24 Minutes | 358 (16.5%) | 233 (10.8%) |
| 25 to 29 Minutes | 112 (5.1%) | 71 (3.3%) |
| 30 to 34 Minutes | 275 (12.6%) | 382 (17.6%) |
| 35 to 39 Minutes | 104 (4.8%) | 60 (2.8%) |
| 40 to 44 Minutes | 64 (2.9%) | 42 (1.9%) |
| 45 to 59 Minutes | 157 (7.2%) | 260 (12.0%) |
| 60 to 89 Minutes | 53 (2.4%) | 48 (2.2%) |
| 90 or more Minutes | 82 (3.8%) | 11 (0.5%) |
Time of Departure to Work by Sex in Beckett Ridge
The most frequent times of departure to work in Beckett Ridge are 6:00 AM to 6:29 AM (312, 14.3%) for males and 7:30 AM to 7:59 AM (428, 19.8%) for females.
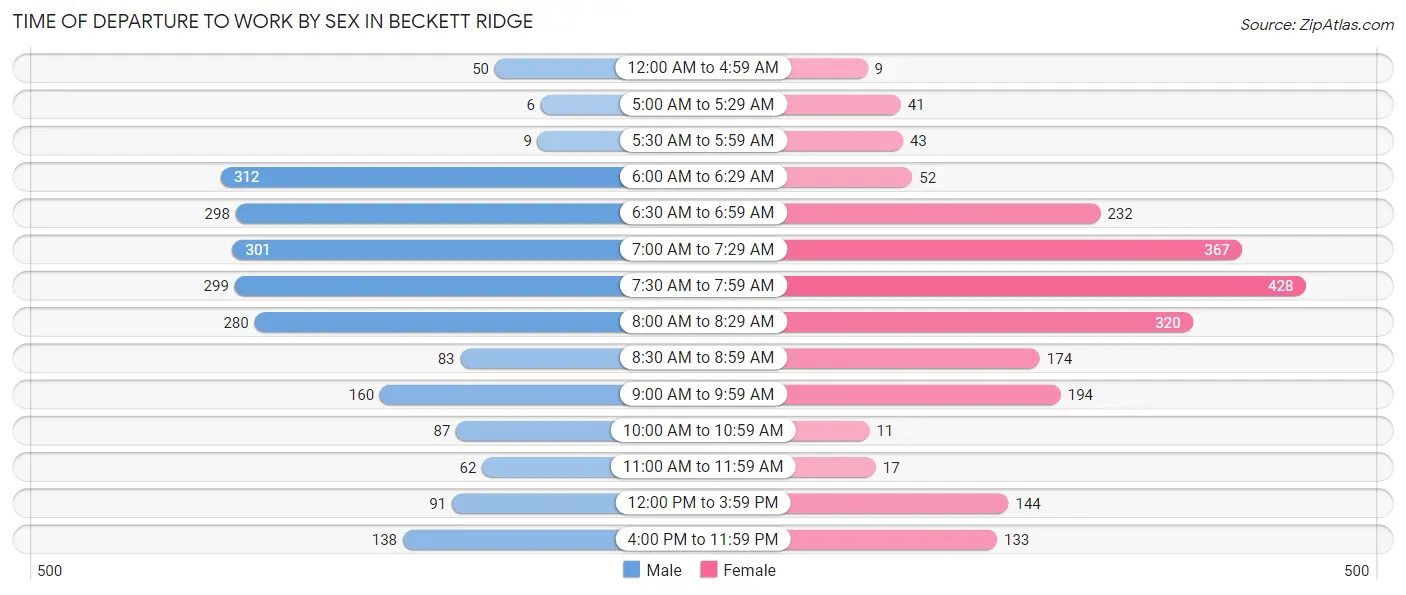
| Time of Departure | Male | Female |
| 12:00 AM to 4:59 AM | 50 (2.3%) | 9 (0.4%) |
| 5:00 AM to 5:29 AM | 6 (0.3%) | 41 (1.9%) |
| 5:30 AM to 5:59 AM | 9 (0.4%) | 43 (2.0%) |
| 6:00 AM to 6:29 AM | 312 (14.3%) | 52 (2.4%) |
| 6:30 AM to 6:59 AM | 298 (13.7%) | 232 (10.7%) |
| 7:00 AM to 7:29 AM | 301 (13.8%) | 367 (17.0%) |
| 7:30 AM to 7:59 AM | 299 (13.7%) | 428 (19.8%) |
| 8:00 AM to 8:29 AM | 280 (12.9%) | 320 (14.8%) |
| 8:30 AM to 8:59 AM | 83 (3.8%) | 174 (8.0%) |
| 9:00 AM to 9:59 AM | 160 (7.3%) | 194 (9.0%) |
| 10:00 AM to 10:59 AM | 87 (4.0%) | 11 (0.5%) |
| 11:00 AM to 11:59 AM | 62 (2.9%) | 17 (0.8%) |
| 12:00 PM to 3:59 PM | 91 (4.2%) | 144 (6.7%) |
| 4:00 PM to 11:59 PM | 138 (6.3%) | 133 (6.1%) |
| Total | 2,176 (100.0%) | 2,165 (100.0%) |
Housing Occupancy in Beckett Ridge
Occupancy by Ownership in Beckett Ridge
Of the total 3,997 dwellings in Beckett Ridge, owner-occupied units account for 3,259 (81.5%), while renter-occupied units make up 738 (18.5%).
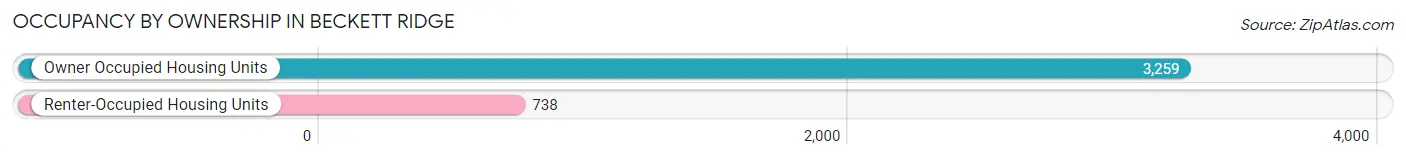
| Occupancy | # Housing Units | % Housing Units |
| Owner Occupied Housing Units | 3,259 | 81.5% |
| Renter-Occupied Housing Units | 738 | 18.5% |
| Total Occupied Housing Units | 3,997 | 100.0% |
Occupancy by Household Size in Beckett Ridge
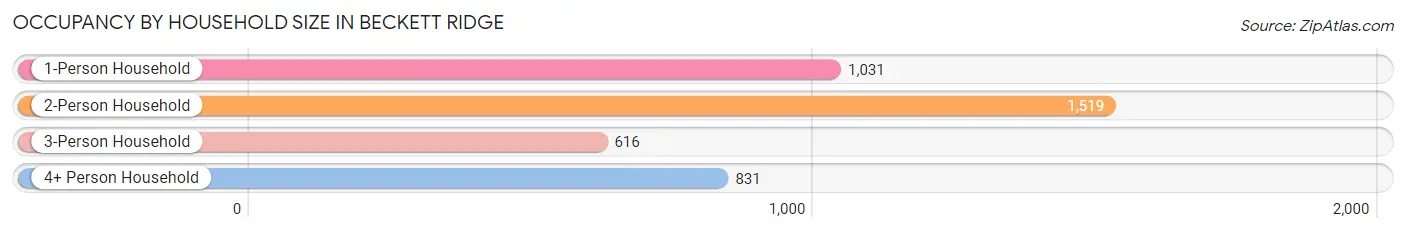
| Household Size | # Housing Units | % Housing Units |
| 1-Person Household | 1,031 | 25.8% |
| 2-Person Household | 1,519 | 38.0% |
| 3-Person Household | 616 | 15.4% |
| 4+ Person Household | 831 | 20.8% |
| Total Housing Units | 3,997 | 100.0% |
Occupancy by Ownership by Household Size in Beckett Ridge
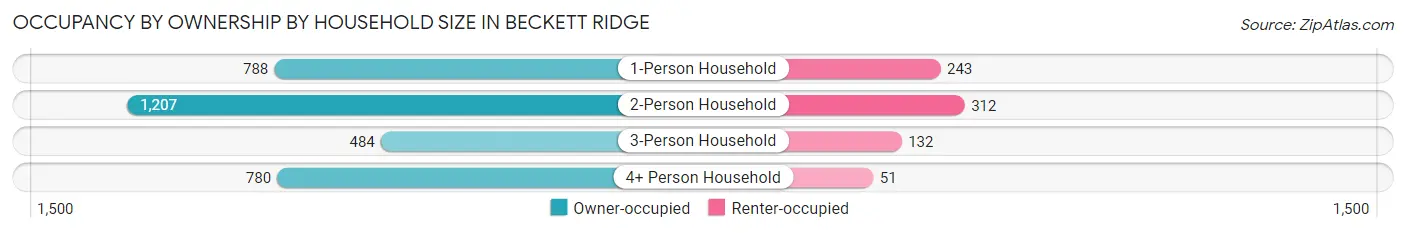
| Household Size | Owner-occupied | Renter-occupied |
| 1-Person Household | 788 (76.4%) | 243 (23.6%) |
| 2-Person Household | 1,207 (79.5%) | 312 (20.5%) |
| 3-Person Household | 484 (78.6%) | 132 (21.4%) |
| 4+ Person Household | 780 (93.9%) | 51 (6.1%) |
| Total Housing Units | 3,259 (81.5%) | 738 (18.5%) |
Occupancy by Educational Attainment in Beckett Ridge
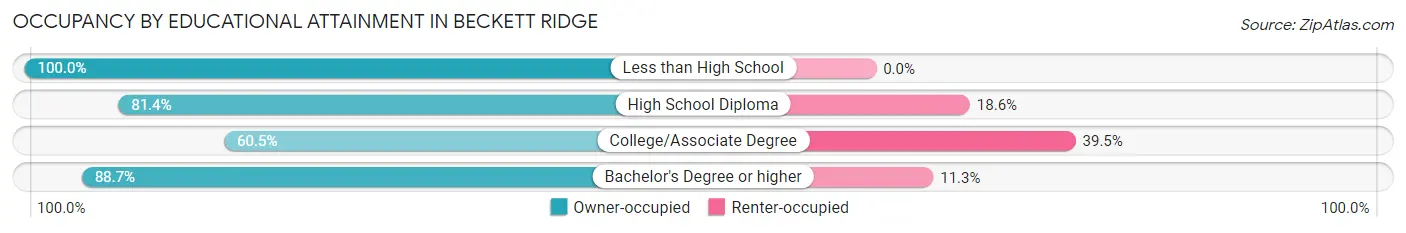
| Household Size | Owner-occupied | Renter-occupied |
| Less than High School | 116 (100.0%) | 0 (0.0%) |
| High School Diploma | 425 (81.4%) | 97 (18.6%) |
| College/Associate Degree | 558 (60.5%) | 365 (39.5%) |
| Bachelor's Degree or higher | 2,160 (88.7%) | 276 (11.3%) |
Occupancy by Age of Householder in Beckett Ridge
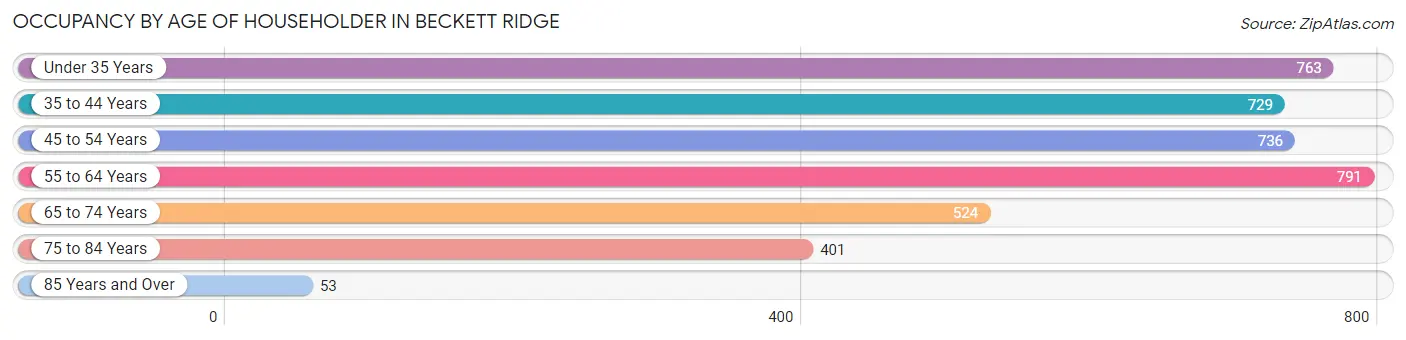
| Age Bracket | # Households | % Households |
| Under 35 Years | 763 | 19.1% |
| 35 to 44 Years | 729 | 18.2% |
| 45 to 54 Years | 736 | 18.4% |
| 55 to 64 Years | 791 | 19.8% |
| 65 to 74 Years | 524 | 13.1% |
| 75 to 84 Years | 401 | 10.0% |
| 85 Years and Over | 53 | 1.3% |
| Total | 3,997 | 100.0% |
Housing Finances in Beckett Ridge
Median Income by Occupancy in Beckett Ridge
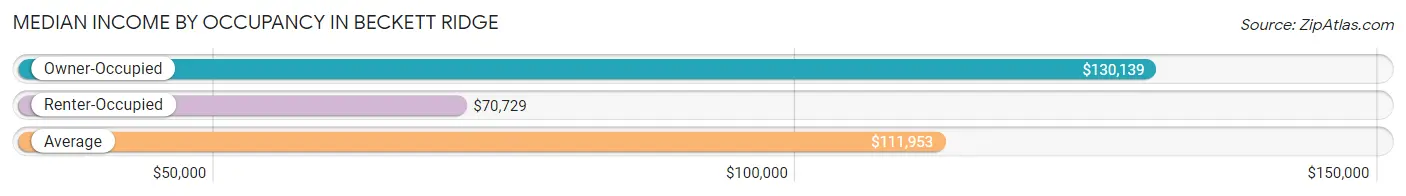
| Occupancy Type | # Households | Median Income |
| Owner-Occupied | 3,259 (81.5%) | $130,139 |
| Renter-Occupied | 738 (18.5%) | $70,729 |
| Average | 3,997 (100.0%) | $111,953 |
Occupancy by Householder Income Bracket in Beckett Ridge
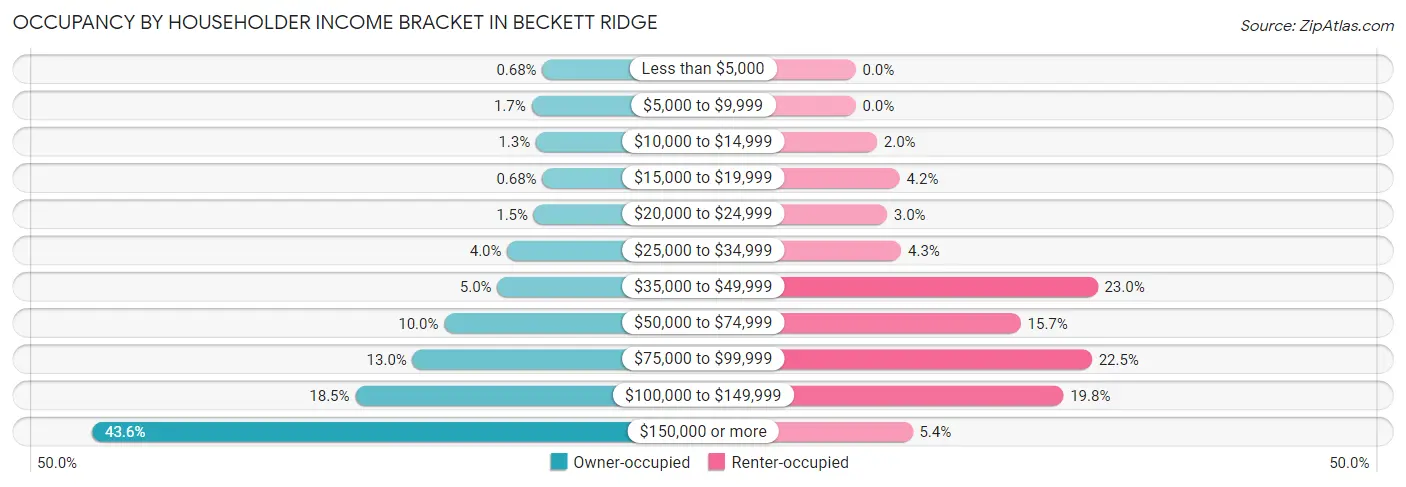
| Income Bracket | Owner-occupied | Renter-occupied |
| Less than $5,000 | 22 (0.7%) | 0 (0.0%) |
| $5,000 to $9,999 | 56 (1.7%) | 0 (0.0%) |
| $10,000 to $14,999 | 42 (1.3%) | 15 (2.0%) |
| $15,000 to $19,999 | 22 (0.7%) | 31 (4.2%) |
| $20,000 to $24,999 | 49 (1.5%) | 22 (3.0%) |
| $25,000 to $34,999 | 131 (4.0%) | 32 (4.3%) |
| $35,000 to $49,999 | 162 (5.0%) | 170 (23.0%) |
| $50,000 to $74,999 | 327 (10.0%) | 116 (15.7%) |
| $75,000 to $99,999 | 425 (13.0%) | 166 (22.5%) |
| $100,000 to $149,999 | 603 (18.5%) | 146 (19.8%) |
| $150,000 or more | 1,420 (43.6%) | 40 (5.4%) |
| Total | 3,259 (100.0%) | 738 (100.0%) |
Monthly Housing Cost Tiers in Beckett Ridge
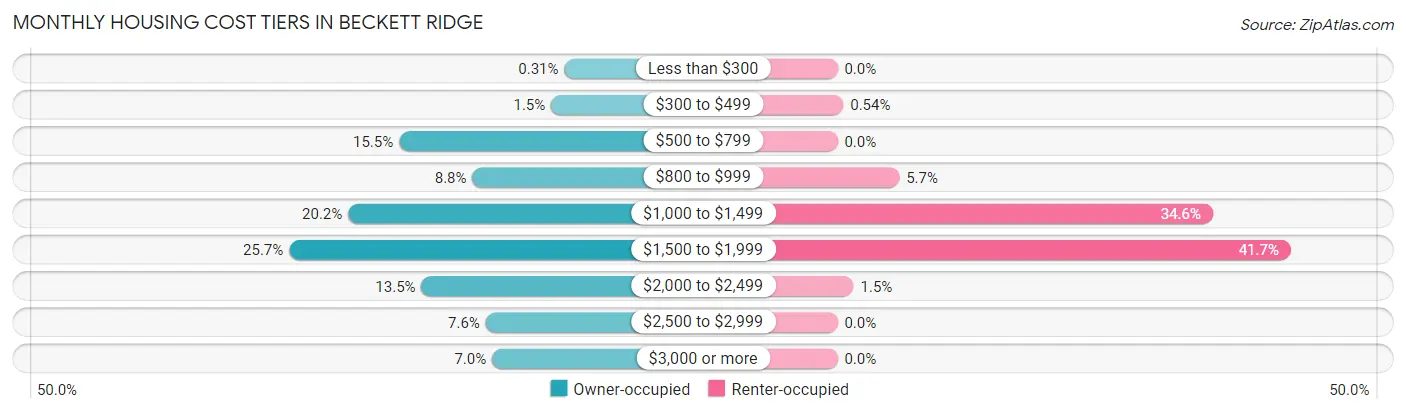
| Monthly Cost | Owner-occupied | Renter-occupied |
| Less than $300 | 10 (0.3%) | 0 (0.0%) |
| $300 to $499 | 50 (1.5%) | 4 (0.5%) |
| $500 to $799 | 506 (15.5%) | 0 (0.0%) |
| $800 to $999 | 286 (8.8%) | 42 (5.7%) |
| $1,000 to $1,499 | 659 (20.2%) | 255 (34.5%) |
| $1,500 to $1,999 | 836 (25.7%) | 308 (41.7%) |
| $2,000 to $2,499 | 439 (13.5%) | 11 (1.5%) |
| $2,500 to $2,999 | 246 (7.5%) | 0 (0.0%) |
| $3,000 or more | 227 (7.0%) | 0 (0.0%) |
| Total | 3,259 (100.0%) | 738 (100.0%) |
Physical Housing Characteristics in Beckett Ridge
Housing Structures in Beckett Ridge
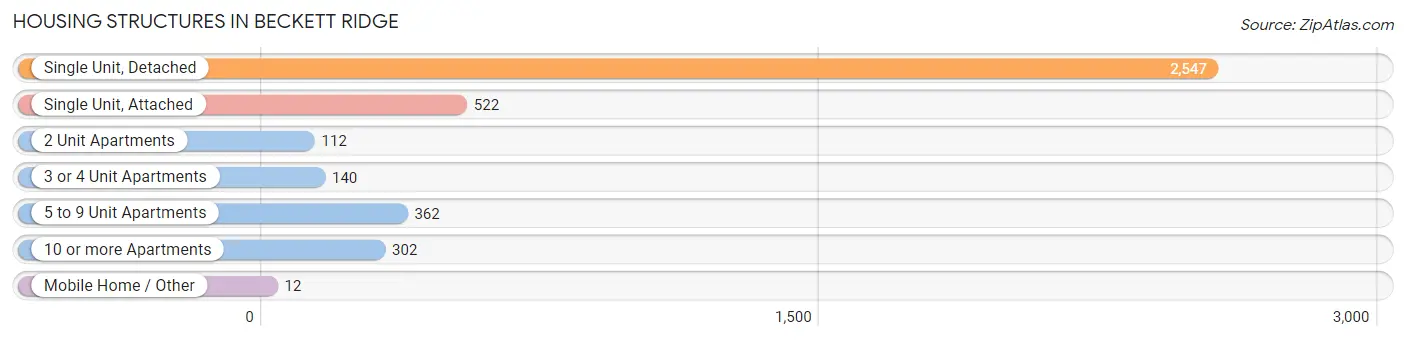
| Structure Type | # Housing Units | % Housing Units |
| Single Unit, Detached | 2,547 | 63.7% |
| Single Unit, Attached | 522 | 13.1% |
| 2 Unit Apartments | 112 | 2.8% |
| 3 or 4 Unit Apartments | 140 | 3.5% |
| 5 to 9 Unit Apartments | 362 | 9.1% |
| 10 or more Apartments | 302 | 7.6% |
| Mobile Home / Other | 12 | 0.3% |
| Total | 3,997 | 100.0% |
Housing Structures by Occupancy in Beckett Ridge
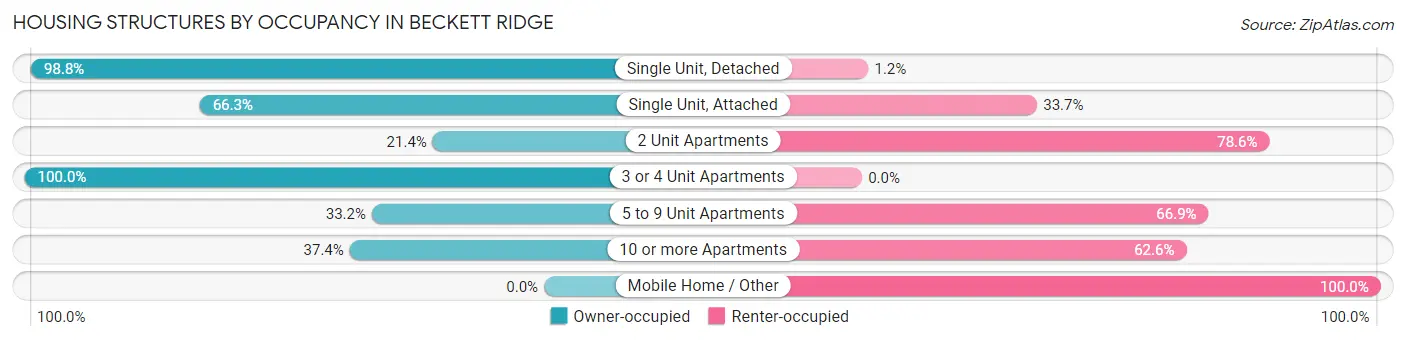
| Structure Type | Owner-occupied | Renter-occupied |
| Single Unit, Detached | 2,516 (98.8%) | 31 (1.2%) |
| Single Unit, Attached | 346 (66.3%) | 176 (33.7%) |
| 2 Unit Apartments | 24 (21.4%) | 88 (78.6%) |
| 3 or 4 Unit Apartments | 140 (100.0%) | 0 (0.0%) |
| 5 to 9 Unit Apartments | 120 (33.2%) | 242 (66.8%) |
| 10 or more Apartments | 113 (37.4%) | 189 (62.6%) |
| Mobile Home / Other | 0 (0.0%) | 12 (100.0%) |
| Total | 3,259 (81.5%) | 738 (18.5%) |
Housing Structures by Number of Rooms in Beckett Ridge
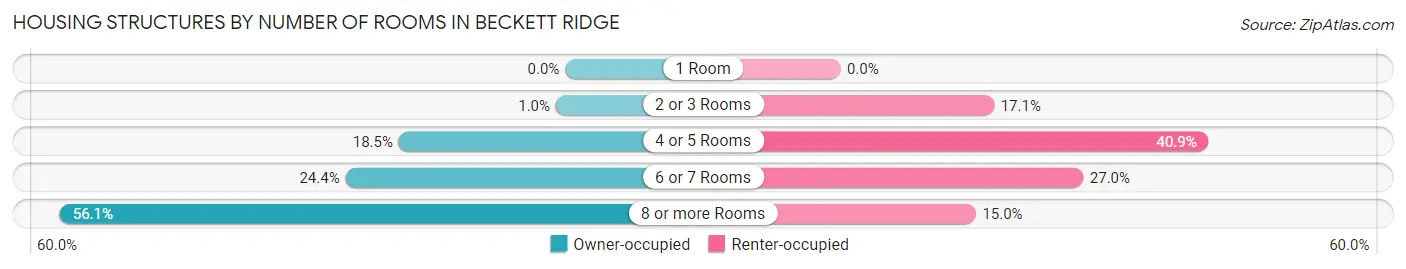
| Number of Rooms | Owner-occupied | Renter-occupied |
| 1 Room | 0 (0.0%) | 0 (0.0%) |
| 2 or 3 Rooms | 34 (1.0%) | 126 (17.1%) |
| 4 or 5 Rooms | 602 (18.5%) | 302 (40.9%) |
| 6 or 7 Rooms | 795 (24.4%) | 199 (27.0%) |
| 8 or more Rooms | 1,828 (56.1%) | 111 (15.0%) |
| Total | 3,259 (100.0%) | 738 (100.0%) |
Housing Structure by Heating Type in Beckett Ridge
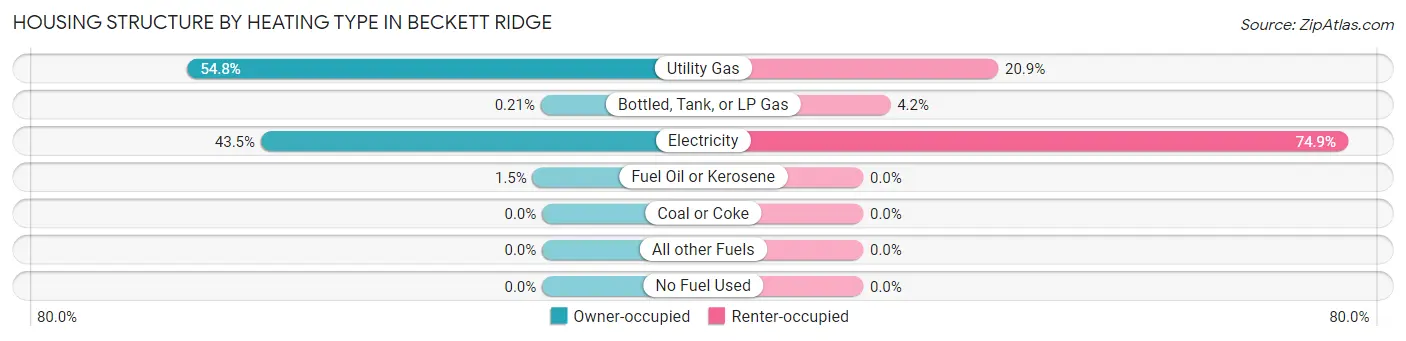
| Heating Type | Owner-occupied | Renter-occupied |
| Utility Gas | 1,787 (54.8%) | 154 (20.9%) |
| Bottled, Tank, or LP Gas | 7 (0.2%) | 31 (4.2%) |
| Electricity | 1,417 (43.5%) | 553 (74.9%) |
| Fuel Oil or Kerosene | 48 (1.5%) | 0 (0.0%) |
| Coal or Coke | 0 (0.0%) | 0 (0.0%) |
| All other Fuels | 0 (0.0%) | 0 (0.0%) |
| No Fuel Used | 0 (0.0%) | 0 (0.0%) |
| Total | 3,259 (100.0%) | 738 (100.0%) |
Household Vehicle Usage in Beckett Ridge
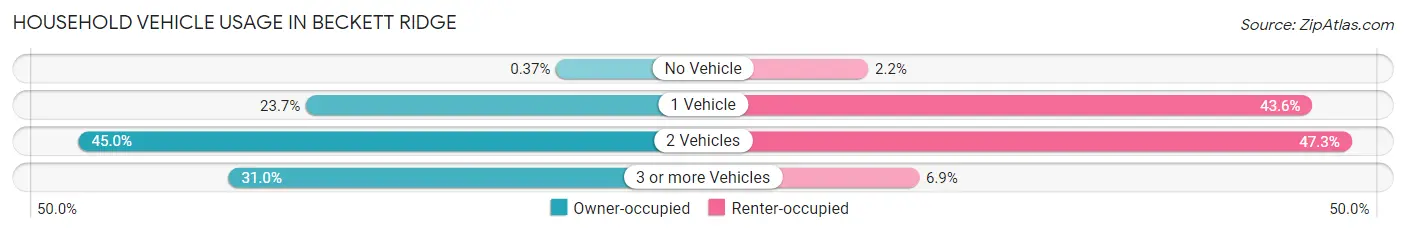
| Vehicles per Household | Owner-occupied | Renter-occupied |
| No Vehicle | 12 (0.4%) | 16 (2.2%) |
| 1 Vehicle | 773 (23.7%) | 322 (43.6%) |
| 2 Vehicles | 1,465 (45.0%) | 349 (47.3%) |
| 3 or more Vehicles | 1,009 (31.0%) | 51 (6.9%) |
| Total | 3,259 (100.0%) | 738 (100.0%) |
Real Estate & Mortgages in Beckett Ridge
Real Estate and Mortgage Overview in Beckett Ridge
| Characteristic | Without Mortgage | With Mortgage |
| Housing Units | 935 | 2,324 |
| Median Property Value | $277,900 | $278,200 |
| Median Household Income | $111,806 | $1,065 |
| Monthly Housing Costs | $762 | $227 |
| Real Estate Taxes | $4,329 | $0 |
Property Value by Mortgage Status in Beckett Ridge
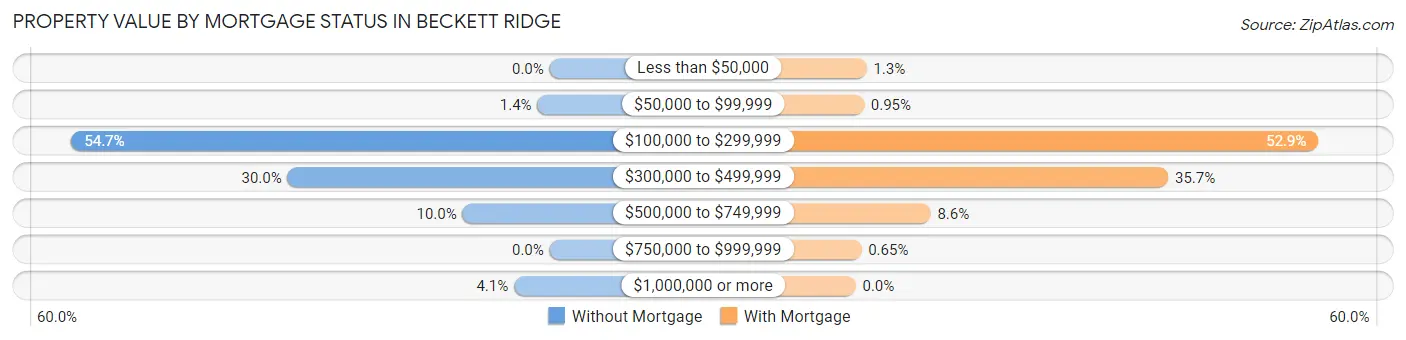
| Property Value | Without Mortgage | With Mortgage |
| Less than $50,000 | 0 (0.0%) | 29 (1.3%) |
| $50,000 to $99,999 | 13 (1.4%) | 22 (0.9%) |
| $100,000 to $299,999 | 511 (54.6%) | 1,229 (52.9%) |
| $300,000 to $499,999 | 280 (29.9%) | 830 (35.7%) |
| $500,000 to $749,999 | 93 (10.0%) | 199 (8.6%) |
| $750,000 to $999,999 | 0 (0.0%) | 15 (0.6%) |
| $1,000,000 or more | 38 (4.1%) | 0 (0.0%) |
| Total | 935 (100.0%) | 2,324 (100.0%) |
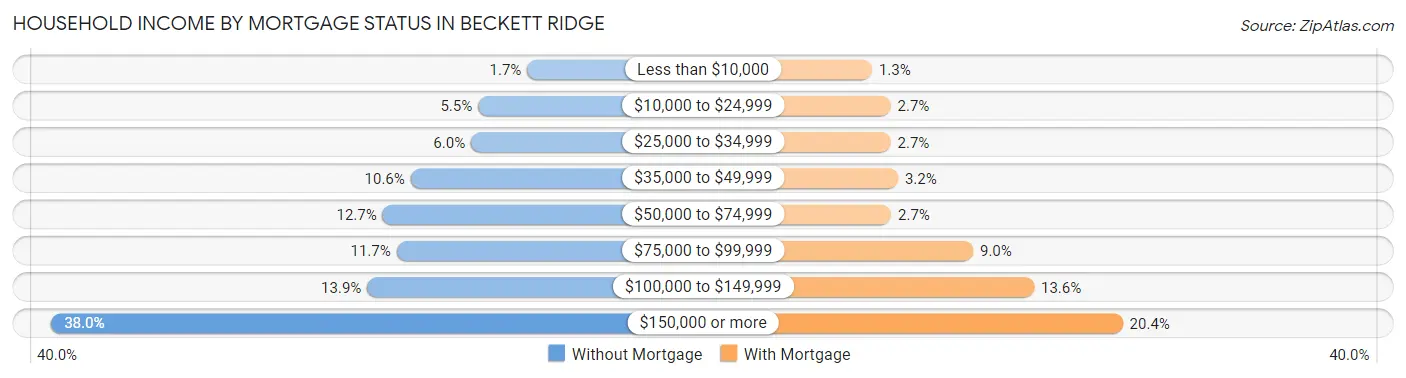
Household Income by Mortgage Status in Beckett Ridge
| Household Income | Without Mortgage | With Mortgage |
| Less than $10,000 | 16 (1.7%) | 29 (1.3%) |
| $10,000 to $24,999 | 51 (5.4%) | 62 (2.7%) |
| $25,000 to $34,999 | 56 (6.0%) | 62 (2.7%) |
| $35,000 to $49,999 | 99 (10.6%) | 75 (3.2%) |
| $50,000 to $74,999 | 119 (12.7%) | 63 (2.7%) |
| $75,000 to $99,999 | 109 (11.7%) | 208 (8.9%) |
| $100,000 to $149,999 | 130 (13.9%) | 316 (13.6%) |
| $150,000 or more | 355 (38.0%) | 473 (20.3%) |
| Total | 935 (100.0%) | 2,324 (100.0%) |
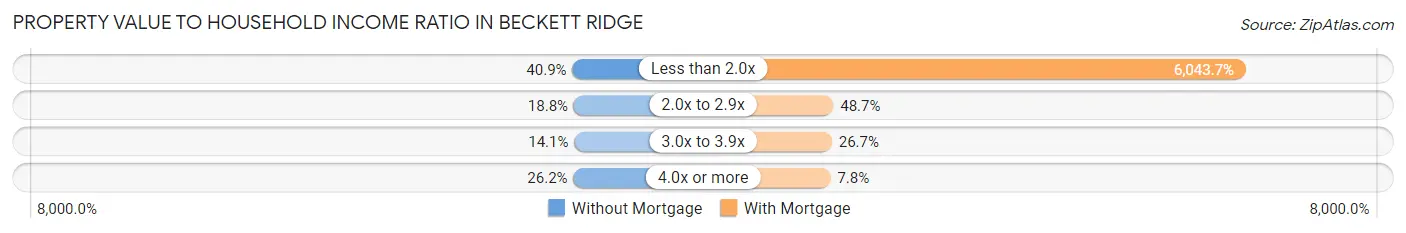
Property Value to Household Income Ratio in Beckett Ridge
| Value-to-Income Ratio | Without Mortgage | With Mortgage |
| Less than 2.0x | 382 (40.9%) | 140,455 (6,043.7%) |
| 2.0x to 2.9x | 176 (18.8%) | 1,131 (48.7%) |
| 3.0x to 3.9x | 132 (14.1%) | 621 (26.7%) |
| 4.0x or more | 245 (26.2%) | 181 (7.8%) |
| Total | 935 (100.0%) | 2,324 (100.0%) |
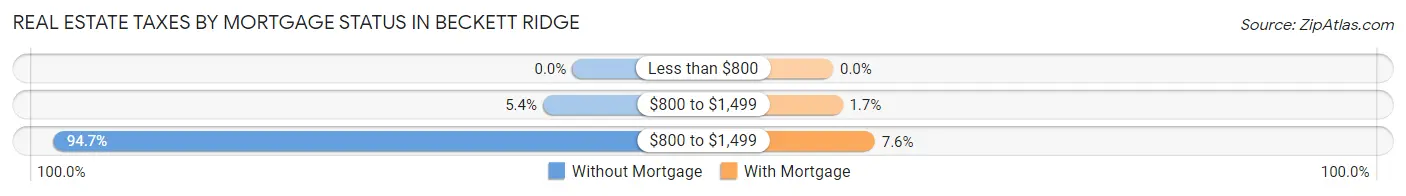
Real Estate Taxes by Mortgage Status in Beckett Ridge
| Property Taxes | Without Mortgage | With Mortgage |
| Less than $800 | 0 (0.0%) | 0 (0.0%) |
| $800 to $1,499 | 50 (5.3%) | 40 (1.7%) |
| $800 to $1,499 | 885 (94.7%) | 177 (7.6%) |
| Total | 935 (100.0%) | 2,324 (100.0%) |
Health & Disability in Beckett Ridge
Health Insurance Coverage by Age in Beckett Ridge
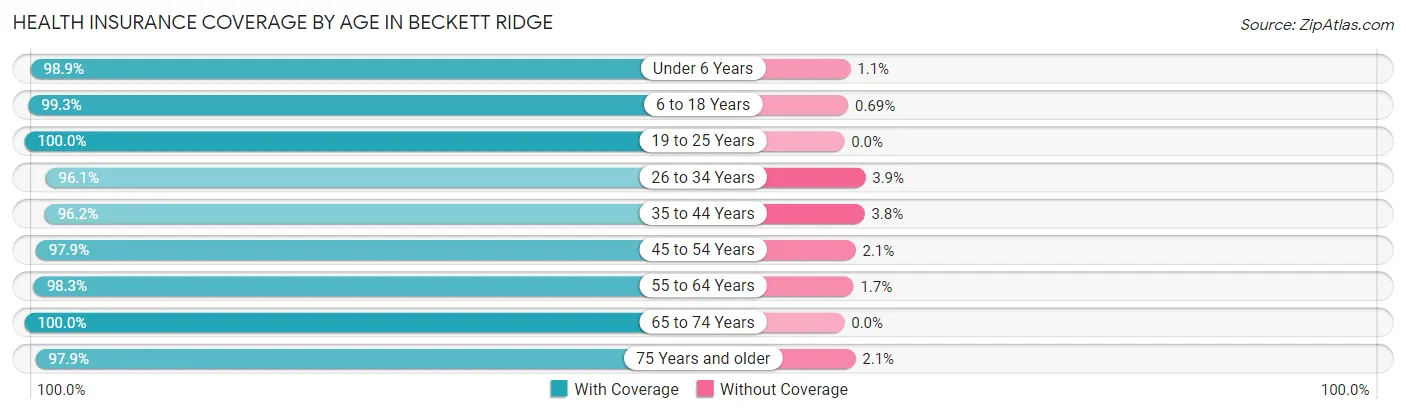
| Age Bracket | With Coverage | Without Coverage |
| Under 6 Years | 966 (98.9%) | 11 (1.1%) |
| 6 to 18 Years | 1,587 (99.3%) | 11 (0.7%) |
| 19 to 25 Years | 628 (100.0%) | 0 (0.0%) |
| 26 to 34 Years | 1,057 (96.1%) | 43 (3.9%) |
| 35 to 44 Years | 1,357 (96.2%) | 53 (3.8%) |
| 45 to 54 Years | 1,120 (97.9%) | 24 (2.1%) |
| 55 to 64 Years | 1,378 (98.3%) | 24 (1.7%) |
| 65 to 74 Years | 892 (100.0%) | 0 (0.0%) |
| 75 Years and older | 714 (97.9%) | 15 (2.1%) |
| Total | 9,699 (98.2%) | 181 (1.8%) |
Health Insurance Coverage by Citizenship Status in Beckett Ridge
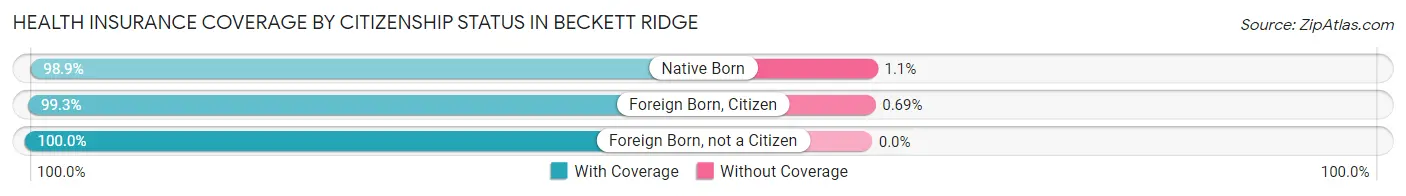
| Citizenship Status | With Coverage | Without Coverage |
| Native Born | 966 (98.9%) | 11 (1.1%) |
| Foreign Born, Citizen | 1,587 (99.3%) | 11 (0.7%) |
| Foreign Born, not a Citizen | 628 (100.0%) | 0 (0.0%) |
Health Insurance Coverage by Household Income in Beckett Ridge
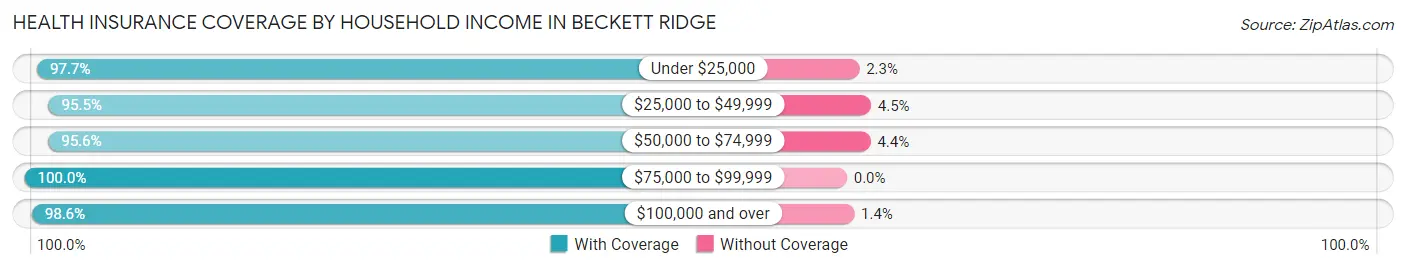
| Household Income | With Coverage | Without Coverage |
| Under $25,000 | 461 (97.7%) | 11 (2.3%) |
| $25,000 to $49,999 | 869 (95.5%) | 41 (4.5%) |
| $50,000 to $74,999 | 903 (95.6%) | 42 (4.4%) |
| $75,000 to $99,999 | 1,207 (100.0%) | 0 (0.0%) |
| $100,000 and over | 6,259 (98.6%) | 87 (1.4%) |
Public vs Private Health Insurance Coverage by Age in Beckett Ridge
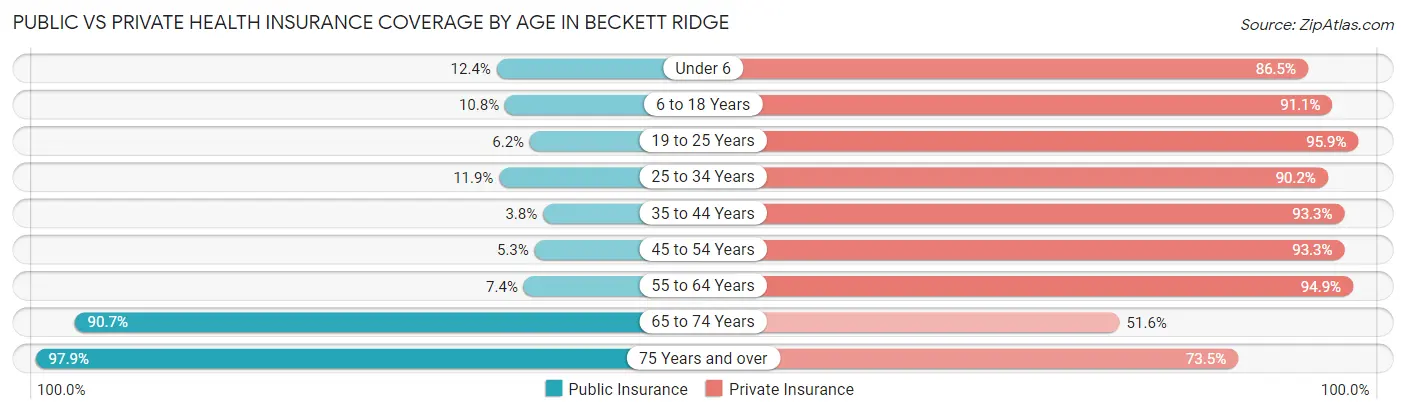
| Age Bracket | Public Insurance | Private Insurance |
| Under 6 | 121 (12.4%) | 845 (86.5%) |
| 6 to 18 Years | 173 (10.8%) | 1,455 (91.0%) |
| 19 to 25 Years | 39 (6.2%) | 602 (95.9%) |
| 25 to 34 Years | 131 (11.9%) | 992 (90.2%) |
| 35 to 44 Years | 53 (3.8%) | 1,315 (93.3%) |
| 45 to 54 Years | 61 (5.3%) | 1,067 (93.3%) |
| 55 to 64 Years | 103 (7.3%) | 1,330 (94.9%) |
| 65 to 74 Years | 809 (90.7%) | 460 (51.6%) |
| 75 Years and over | 714 (97.9%) | 536 (73.5%) |
| Total | 2,204 (22.3%) | 8,602 (87.1%) |
Disability Status by Sex by Age in Beckett Ridge
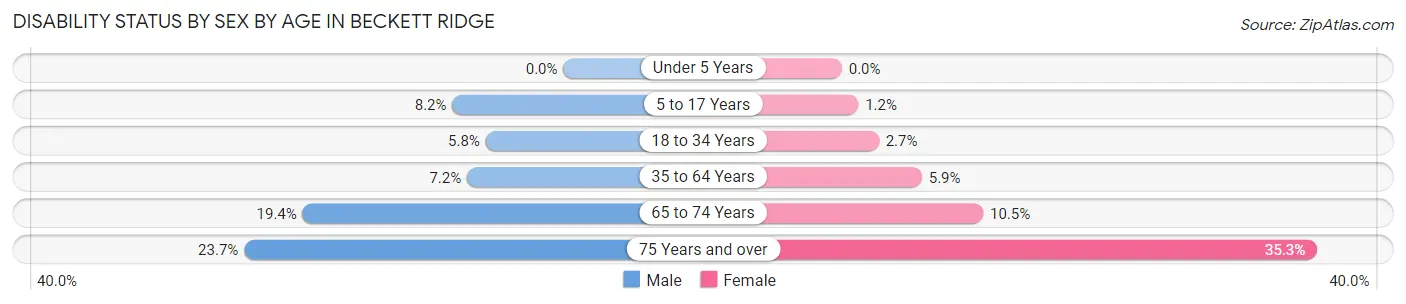
| Age Bracket | Male | Female |
| Under 5 Years | 0 (0.0%) | 0 (0.0%) |
| 5 to 17 Years | 73 (8.2%) | 10 (1.2%) |
| 18 to 34 Years | 51 (5.8%) | 25 (2.7%) |
| 35 to 64 Years | 130 (7.1%) | 127 (5.9%) |
| 65 to 74 Years | 73 (19.4%) | 54 (10.5%) |
| 75 Years and over | 64 (23.7%) | 162 (35.3%) |
Disability Class by Sex by Age in Beckett Ridge
Disability Class: Hearing Difficulty
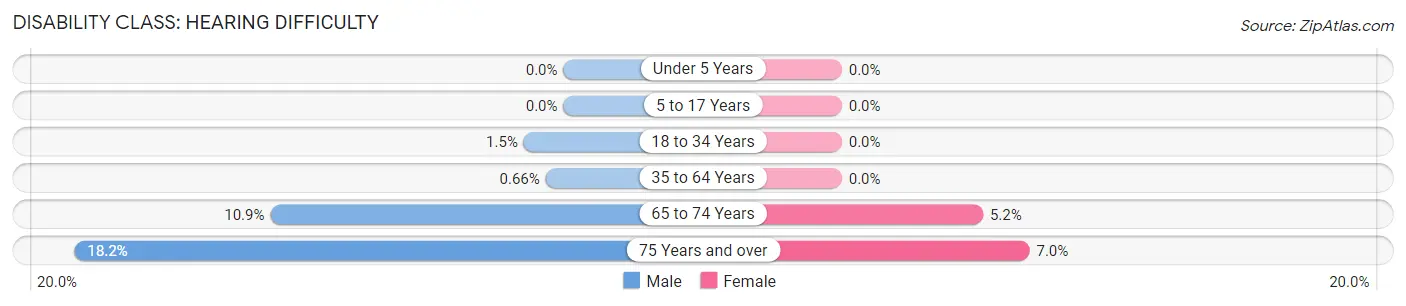
| Age Bracket | Male | Female |
| Under 5 Years | 0 (0.0%) | 0 (0.0%) |
| 5 to 17 Years | 0 (0.0%) | 0 (0.0%) |
| 18 to 34 Years | 13 (1.5%) | 0 (0.0%) |
| 35 to 64 Years | 12 (0.7%) | 0 (0.0%) |
| 65 to 74 Years | 41 (10.9%) | 27 (5.2%) |
| 75 Years and over | 49 (18.1%) | 32 (7.0%) |
Disability Class: Vision Difficulty
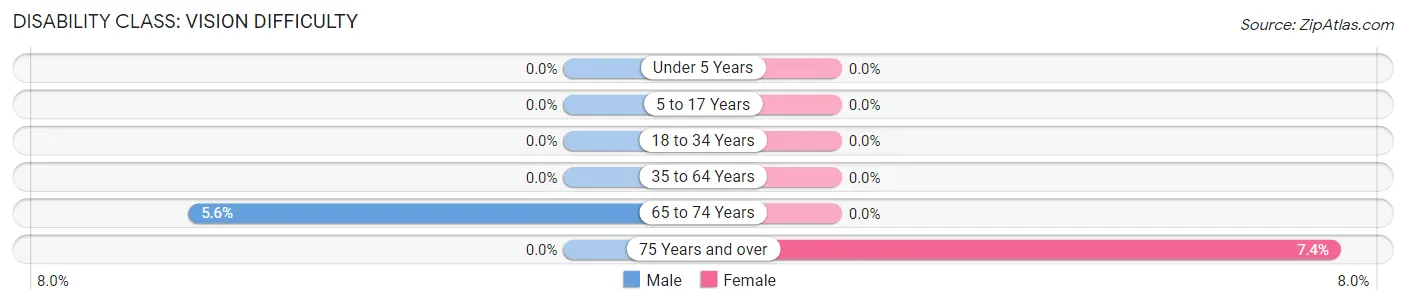
| Age Bracket | Male | Female |
| Under 5 Years | 0 (0.0%) | 0 (0.0%) |
| 5 to 17 Years | 0 (0.0%) | 0 (0.0%) |
| 18 to 34 Years | 0 (0.0%) | 0 (0.0%) |
| 35 to 64 Years | 0 (0.0%) | 0 (0.0%) |
| 65 to 74 Years | 21 (5.6%) | 0 (0.0%) |
| 75 Years and over | 0 (0.0%) | 34 (7.4%) |
Disability Class: Cognitive Difficulty
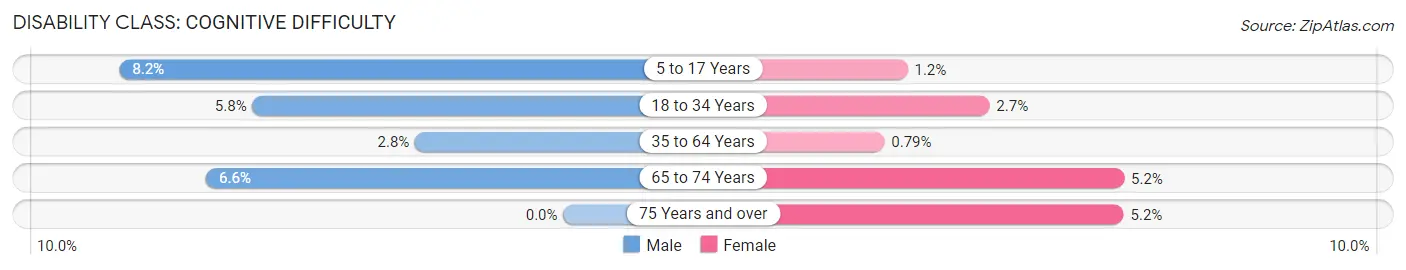
| Age Bracket | Male | Female |
| 5 to 17 Years | 73 (8.2%) | 10 (1.2%) |
| 18 to 34 Years | 51 (5.8%) | 25 (2.7%) |
| 35 to 64 Years | 50 (2.8%) | 17 (0.8%) |
| 65 to 74 Years | 25 (6.6%) | 27 (5.2%) |
| 75 Years and over | 0 (0.0%) | 24 (5.2%) |
Disability Class: Ambulatory Difficulty
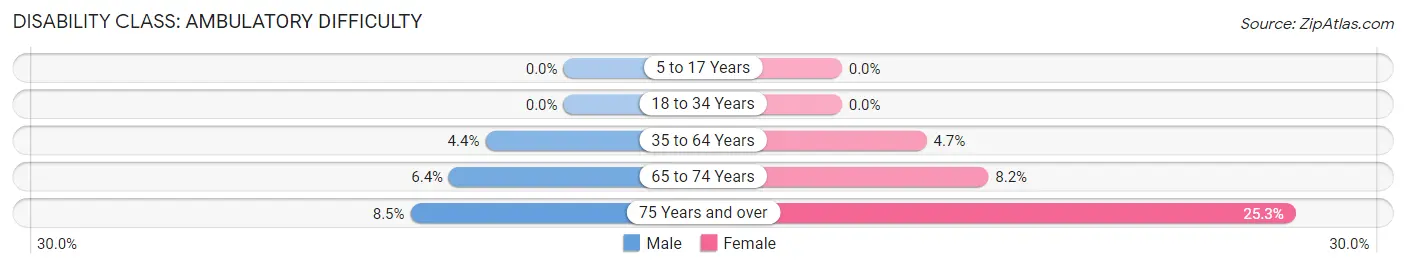
| Age Bracket | Male | Female |
| 5 to 17 Years | 0 (0.0%) | 0 (0.0%) |
| 18 to 34 Years | 0 (0.0%) | 0 (0.0%) |
| 35 to 64 Years | 79 (4.3%) | 101 (4.7%) |
| 65 to 74 Years | 24 (6.4%) | 42 (8.2%) |
| 75 Years and over | 23 (8.5%) | 116 (25.3%) |
Disability Class: Self-Care Difficulty
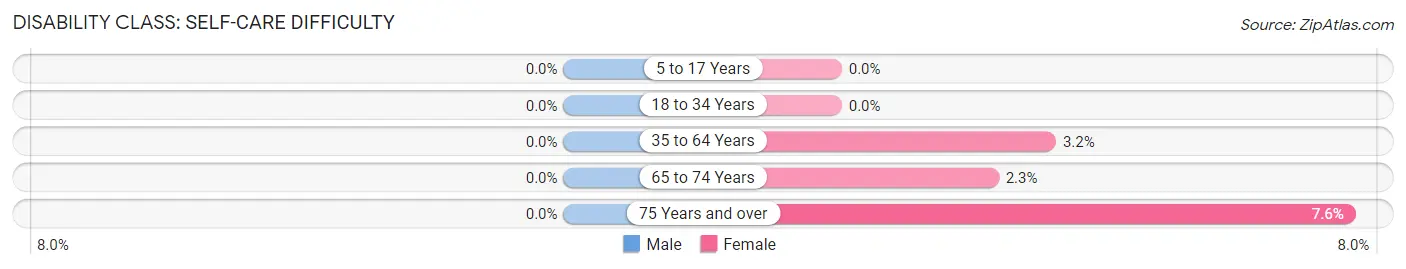
| Age Bracket | Male | Female |
| 5 to 17 Years | 0 (0.0%) | 0 (0.0%) |
| 18 to 34 Years | 0 (0.0%) | 0 (0.0%) |
| 35 to 64 Years | 0 (0.0%) | 68 (3.2%) |
| 65 to 74 Years | 0 (0.0%) | 12 (2.3%) |
| 75 Years and over | 0 (0.0%) | 35 (7.6%) |
Technology Access in Beckett Ridge
Computing Device Access in Beckett Ridge
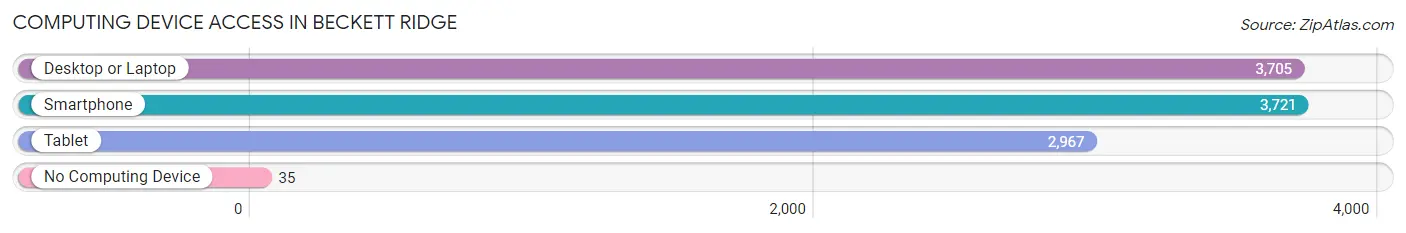
| Device Type | # Households | % Households |
| Desktop or Laptop | 3,705 | 92.7% |
| Smartphone | 3,721 | 93.1% |
| Tablet | 2,967 | 74.2% |
| No Computing Device | 35 | 0.9% |
| Total | 3,997 | 100.0% |
Internet Access in Beckett Ridge
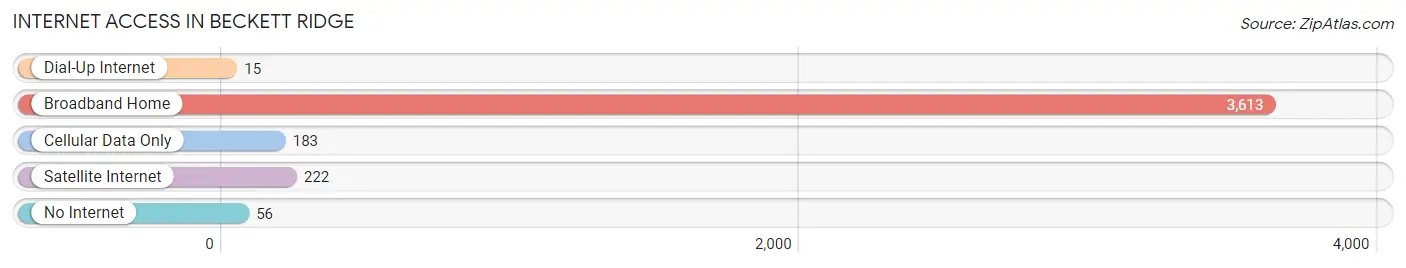
| Internet Type | # Households | % Households |
| Dial-Up Internet | 15 | 0.4% |
| Broadband Home | 3,613 | 90.4% |
| Cellular Data Only | 183 | 4.6% |
| Satellite Internet | 222 | 5.6% |
| No Internet | 56 | 1.4% |
| Total | 3,997 | 100.0% |
Beckett Ridge Summary
Beckett Ridge is a census-designated place (CDP) located in the southwestern corner of Butler County, Ohio, United States. It is a suburb of Cincinnati, located approximately 20 miles north of the city. The population of Beckett Ridge was 8,945 at the 2010 census.
History
The area that is now Beckett Ridge was originally inhabited by the Miami tribe of Native Americans. The first European settlers arrived in the area in the late 1700s. The area was originally known as “Beckett’s Ridge” after the family of William Beckett, who settled in the area in 1802. The area was officially incorporated as a village in 1845.
In the late 1800s, the area began to experience rapid growth due to its proximity to Cincinnati. The village was annexed by the city of West Chester in the early 1900s, and the name was changed to Beckett Ridge.
Geography
Beckett Ridge is located at 39°20'25" North, 84°25'45" West (39.340278, -84.429167). According to the United States Census Bureau, the CDP has a total area of 4.3 square miles, all of it land.
Economy
Beckett Ridge is home to a variety of businesses, including retail stores, restaurants, and professional services. The largest employer in the area is the Beckett Ridge Shopping Center, which is home to a variety of stores and restaurants. Other major employers include the West Chester Township Fire Department, the West Chester Township Police Department, and the West Chester Township School District.
Demographics
As of the 2010 census, there were 8,945 people, 3,541 households, and 2,541 families residing in the CDP. The population density was 2,082.2 people per square mile. The racial makeup of the CDP was 87.2% White, 5.2% African American, 0.3% Native American, 4.2% Asian, 0.1% Pacific Islander, 1.2% from other races, and 2.0% from two or more races. Hispanic or Latino of any race were 3.2% of the population.
The median income for a household in the CDP was $76,945, and the median income for a family was $87,945. Males had a median income of $60,945 versus $41,945 for females. The per capita income for the CDP was $32,945. About 2.2% of families and 3.2% of the population were below the poverty line, including 4.2% of those under age 18 and 1.2% of those age 65 or over.
Common Questions
What is the Total Population of Beckett Ridge?
Total Population of Beckett Ridge is 9,880.
What is the Total Male Population of Beckett Ridge?
Total Male Population of Beckett Ridge is 4,538.
What is the Total Female Population of Beckett Ridge?
Total Female Population of Beckett Ridge is 5,342.
What is the Ratio of Males per 100 Females in Beckett Ridge?
There are 84.95 Males per 100 Females in Beckett Ridge.
What is the Ratio of Females per 100 Males in Beckett Ridge?
There are 117.72 Females per 100 Males in Beckett Ridge.
What is the Median Population Age in Beckett Ridge?
Median Population Age in Beckett Ridge is 38.4 Years.
What is the Average Family Size in Beckett Ridge
Average Family Size in Beckett Ridge is 3.0 People.
What is the Average Household Size in Beckett Ridge
Average Household Size in Beckett Ridge is 2.5 People.
What is Per Capita Income in Beckett Ridge?
Per Capita income in Beckett Ridge is $60,488.
What is the Median Family Income in Beckett Ridge?
Median Family Income in Beckett Ridge is $139,485.
What is the Median Household income in Beckett Ridge?
Median Household Income in Beckett Ridge is $111,953.
What is Income or Wage Gap in Beckett Ridge?
Income or Wage Gap in Beckett Ridge is 33.6%.
Women in Beckett Ridge earn 66.4 cents for every dollar earned by a man.
What is Inequality or Gini Index in Beckett Ridge?
Inequality or Gini Index in Beckett Ridge is 0.42.
How Large is the Labor Force in Beckett Ridge?
There are 5,389 People in the Labor Forcein in Beckett Ridge.
What is the Percentage of People in the Labor Force in Beckett Ridge?
69.3% of People are in the Labor Force in Beckett Ridge.
What is the Unemployment Rate in Beckett Ridge?
Unemployment Rate in Beckett Ridge is 4.4%.