Gahanna, OH
Gahanna Map
Gahanna Overview
35,529
TOTAL POPULATION
17,082
MALE POPULATION
18,447
FEMALE POPULATION
92.60
MALES / 100 FEMALES
107.99
FEMALES / 100 MALES
39.1
MEDIAN AGE
3.0
AVG FAMILY SIZE
2.5
AVG HOUSEHOLD SIZE
$50,762
PER CAPITA INCOME
$124,510
AVG FAMILY INCOME
$104,555
AVG HOUSEHOLD INCOME
1.9%
WAGE / INCOME GAP [ % ]
98.1¢/ $1
WAGE / INCOME GAP [ $ ]
0.41
INEQUALITY / GINI INDEX
19,631
LABOR FORCE [ PEOPLE ]
69.8%
PERCENT IN LABOR FORCE
2.2%
UNEMPLOYMENT RATE
Gahanna Area Codes
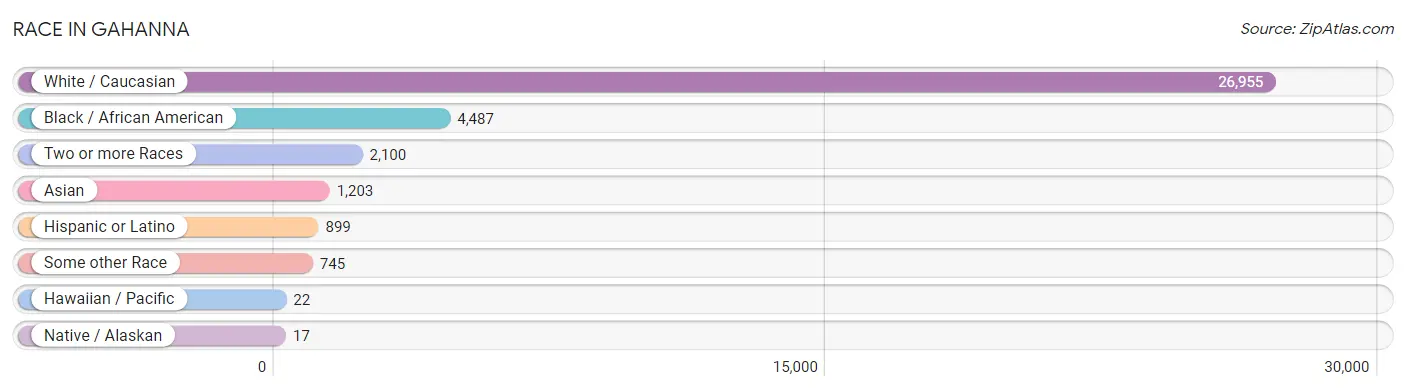
Race in Gahanna
The most populous races in Gahanna are White / Caucasian (26,955 | 75.9%), Black / African American (4,487 | 12.6%), and Two or more Races (2,100 | 5.9%).
| Race | # Population | % Population |
| Asian | 1,203 | 3.4% |
| Black / African American | 4,487 | 12.6% |
| Hawaiian / Pacific | 22 | 0.1% |
| Hispanic or Latino | 899 | 2.5% |
| Native / Alaskan | 17 | 0.1% |
| White / Caucasian | 26,955 | 75.9% |
| Two or more Races | 2,100 | 5.9% |
| Some other Race | 745 | 2.1% |
| Total | 35,529 | 100.0% |
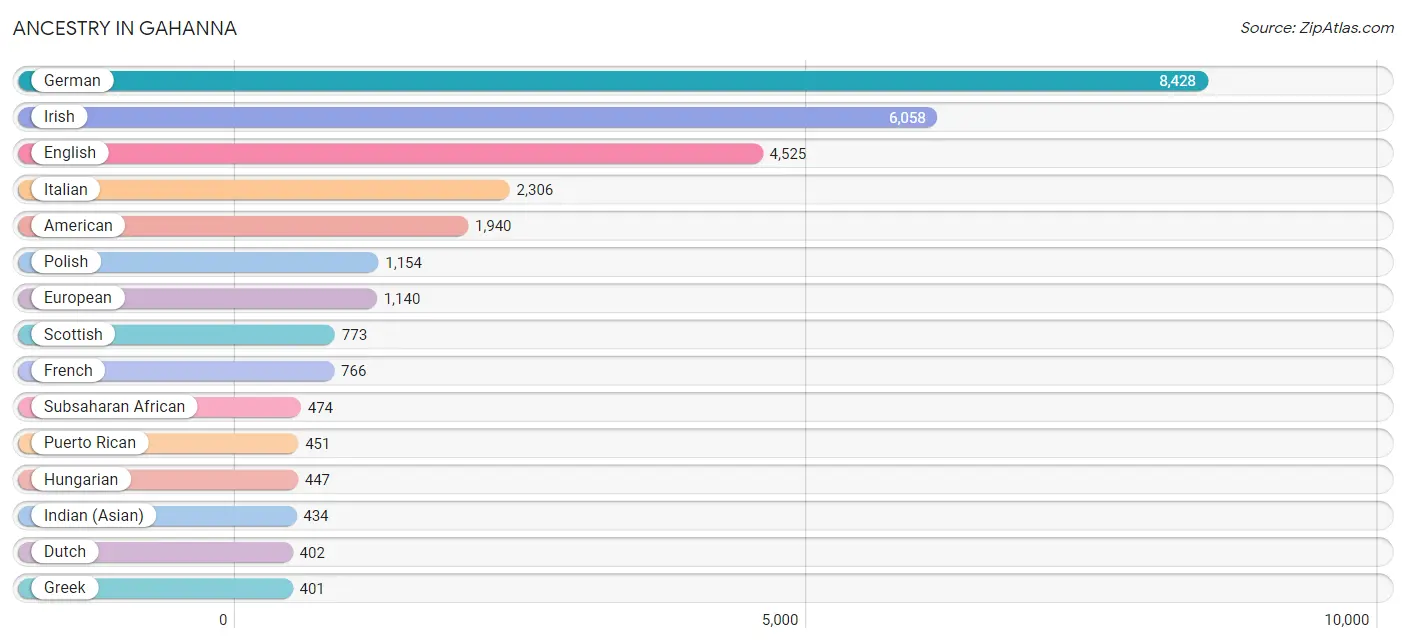
Ancestry in Gahanna
The most populous ancestries reported in Gahanna are German (8,428 | 23.7%), Irish (6,058 | 17.1%), English (4,525 | 12.7%), Italian (2,306 | 6.5%), and American (1,940 | 5.5%), together accounting for 65.5% of all Gahanna residents.
| Ancestry | # Population | % Population |
| African | 124 | 0.4% |
| American | 1,940 | 5.5% |
| Arab | 99 | 0.3% |
| Australian | 293 | 0.8% |
| Austrian | 28 | 0.1% |
| Belgian | 13 | 0.0% |
| Bhutanese | 71 | 0.2% |
| Brazilian | 11 | 0.0% |
| British | 247 | 0.7% |
| Bulgarian | 25 | 0.1% |
| Burmese | 142 | 0.4% |
| Canadian | 28 | 0.1% |
| Celtic | 7 | 0.0% |
| Central American | 36 | 0.1% |
| Cherokee | 24 | 0.1% |
| Colombian | 25 | 0.1% |
| Croatian | 62 | 0.2% |
| Czech | 112 | 0.3% |
| Danish | 17 | 0.1% |
| Delaware | 21 | 0.1% |
| Dominican | 4 | 0.0% |
| Dutch | 402 | 1.1% |
| Eastern European | 80 | 0.2% |
| Ecuadorian | 62 | 0.2% |
| English | 4,525 | 12.7% |
| Ethiopian | 263 | 0.7% |
| European | 1,140 | 3.2% |
| Finnish | 52 | 0.2% |
| French | 766 | 2.2% |
| French Canadian | 116 | 0.3% |
| German | 8,428 | 23.7% |
| Greek | 401 | 1.1% |
| Guamanian / Chamorro | 22 | 0.1% |
| Honduran | 31 | 0.1% |
| Hungarian | 447 | 1.3% |
| Indian (Asian) | 434 | 1.2% |
| Irish | 6,058 | 17.1% |
| Israeli | 45 | 0.1% |
| Italian | 2,306 | 6.5% |
| Jamaican | 54 | 0.2% |
| Korean | 313 | 0.9% |
| Lebanese | 87 | 0.2% |
| Liberian | 11 | 0.0% |
| Lithuanian | 12 | 0.0% |
| Lumbee | 7 | 0.0% |
| Macedonian | 82 | 0.2% |
| Malaysian | 16 | 0.1% |
| Mexican | 161 | 0.4% |
| Native Hawaiian | 42 | 0.1% |
| Nicaraguan | 5 | 0.0% |
| Nigerian | 23 | 0.1% |
| Northern European | 99 | 0.3% |
| Norwegian | 190 | 0.5% |
| Pakistani | 113 | 0.3% |
| Polish | 1,154 | 3.3% |
| Puerto Rican | 451 | 1.3% |
| Romanian | 58 | 0.2% |
| Russian | 336 | 0.9% |
| Scandinavian | 133 | 0.4% |
| Scotch-Irish | 400 | 1.1% |
| Scottish | 773 | 2.2% |
| Serbian | 10 | 0.0% |
| Sioux | 17 | 0.1% |
| Slavic | 48 | 0.1% |
| Slovak | 115 | 0.3% |
| Slovene | 8 | 0.0% |
| Somali | 53 | 0.2% |
| South American | 189 | 0.5% |
| Spanish | 28 | 0.1% |
| Sri Lankan | 267 | 0.7% |
| Subsaharan African | 474 | 1.3% |
| Swedish | 289 | 0.8% |
| Swiss | 189 | 0.5% |
| Syrian | 12 | 0.0% |
| Thai | 229 | 0.6% |
| Ukrainian | 114 | 0.3% |
| Venezuelan | 102 | 0.3% |
| Welsh | 239 | 0.7% | View All 78 Rows |
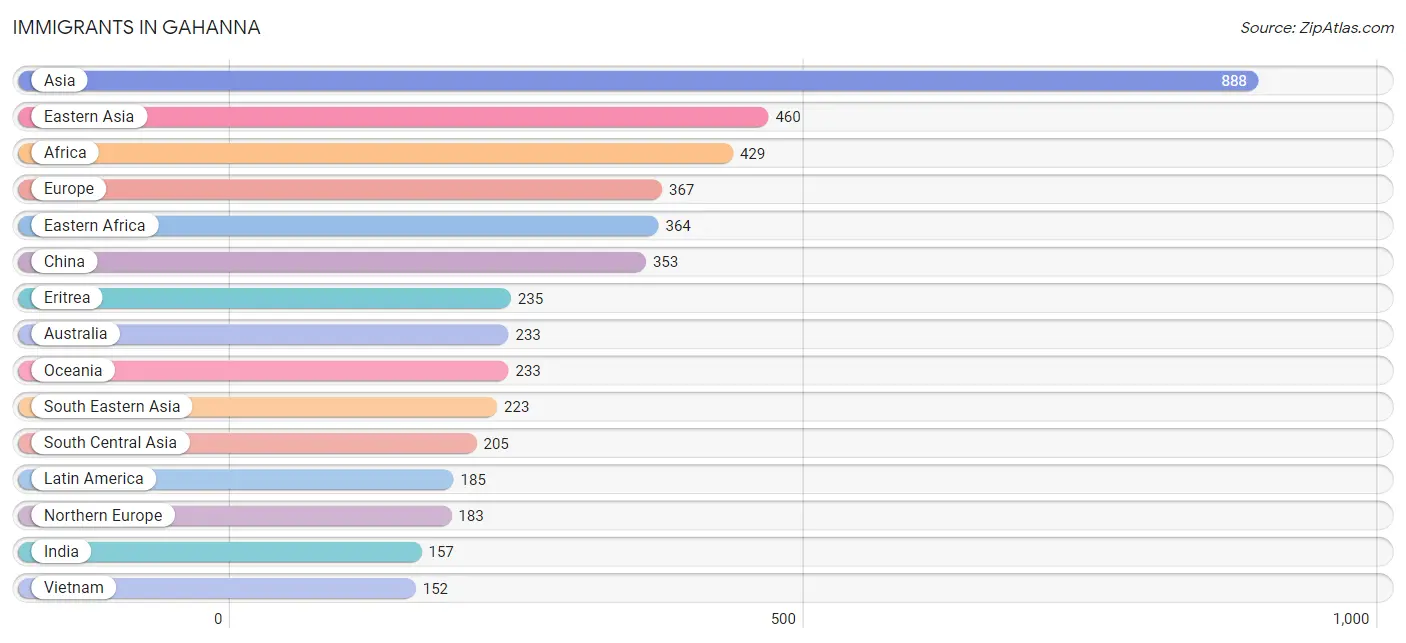
Immigrants in Gahanna
The most numerous immigrant groups reported in Gahanna came from Asia (888 | 2.5%), Eastern Asia (460 | 1.3%), Africa (429 | 1.2%), Europe (367 | 1.0%), and Eastern Africa (364 | 1.0%), together accounting for 7.1% of all Gahanna residents.
| Immigration Origin | # Population | % Population |
| Africa | 429 | 1.2% |
| Asia | 888 | 2.5% |
| Australia | 233 | 0.7% |
| Barbados | 8 | 0.0% |
| Brazil | 17 | 0.1% |
| Bulgaria | 8 | 0.0% |
| Canada | 82 | 0.2% |
| Caribbean | 37 | 0.1% |
| Central America | 87 | 0.2% |
| China | 353 | 1.0% |
| Czechoslovakia | 9 | 0.0% |
| Eastern Africa | 364 | 1.0% |
| Eastern Asia | 460 | 1.3% |
| Eastern Europe | 94 | 0.3% |
| England | 43 | 0.1% |
| Eritrea | 235 | 0.7% |
| Ethiopia | 12 | 0.0% |
| Europe | 367 | 1.0% |
| France | 43 | 0.1% |
| Germany | 35 | 0.1% |
| Honduras | 31 | 0.1% |
| India | 157 | 0.4% |
| Iran | 11 | 0.0% |
| Italy | 12 | 0.0% |
| Jamaica | 29 | 0.1% |
| Korea | 107 | 0.3% |
| Latin America | 185 | 0.5% |
| Liberia | 11 | 0.0% |
| Mexico | 56 | 0.2% |
| Morocco | 20 | 0.1% |
| Nigeria | 23 | 0.1% |
| North Macedonia | 38 | 0.1% |
| Northern Africa | 31 | 0.1% |
| Northern Europe | 183 | 0.5% |
| Oceania | 233 | 0.7% |
| Pakistan | 37 | 0.1% |
| Philippines | 16 | 0.1% |
| Romania | 28 | 0.1% |
| Russia | 11 | 0.0% |
| Somalia | 65 | 0.2% |
| South America | 61 | 0.2% |
| South Central Asia | 205 | 0.6% |
| South Eastern Asia | 223 | 0.6% |
| Southern Europe | 12 | 0.0% |
| Taiwan | 13 | 0.0% |
| Thailand | 55 | 0.2% |
| Venezuela | 44 | 0.1% |
| Vietnam | 152 | 0.4% |
| Western Africa | 34 | 0.1% |
| Western Europe | 78 | 0.2% | View All 50 Rows |
Sex and Age in Gahanna
Sex and Age in Gahanna
The most populous age groups in Gahanna are 10 to 14 Years (1,562 | 9.1%) for men and 30 to 34 Years (1,477 | 8.0%) for women.
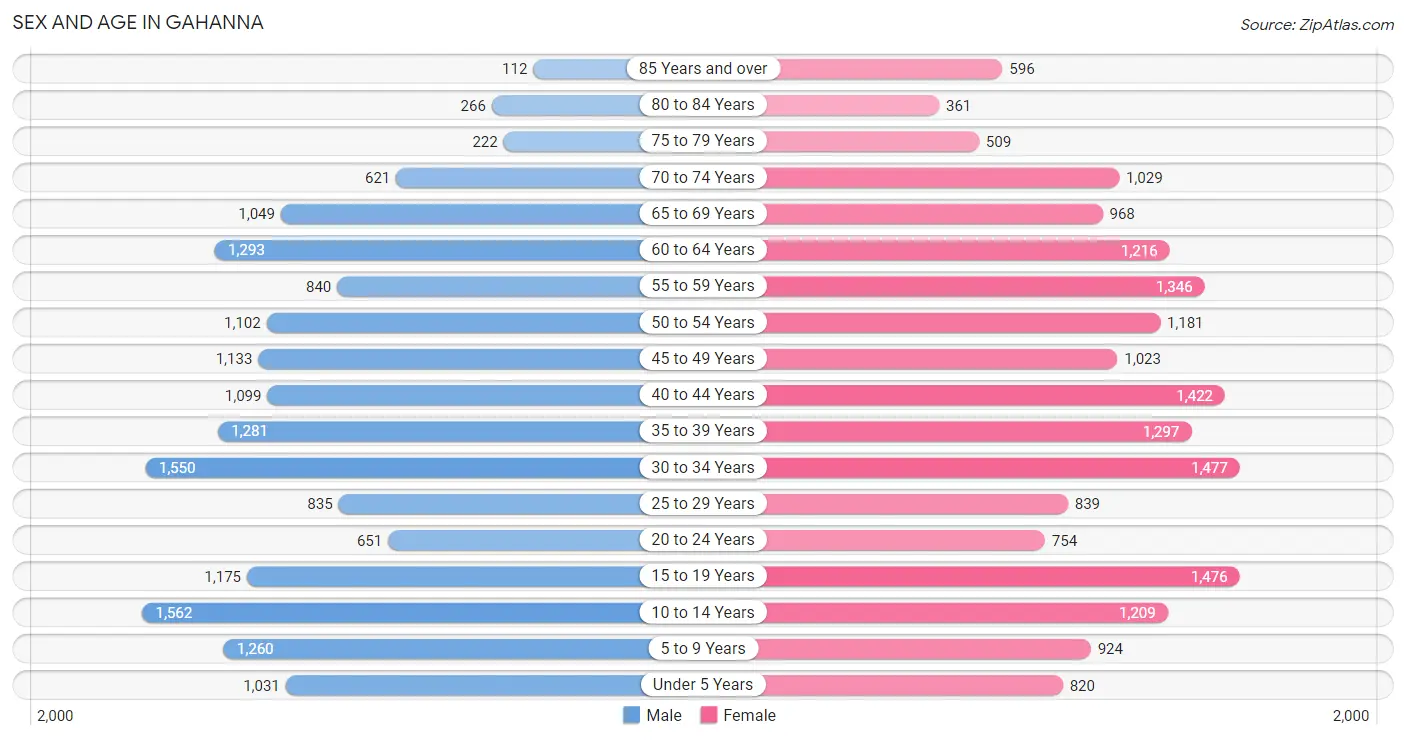
| Age Bracket | Male | Female |
| Under 5 Years | 1,031 (6.0%) | 820 (4.4%) |
| 5 to 9 Years | 1,260 (7.4%) | 924 (5.0%) |
| 10 to 14 Years | 1,562 (9.1%) | 1,209 (6.6%) |
| 15 to 19 Years | 1,175 (6.9%) | 1,476 (8.0%) |
| 20 to 24 Years | 651 (3.8%) | 754 (4.1%) |
| 25 to 29 Years | 835 (4.9%) | 839 (4.5%) |
| 30 to 34 Years | 1,550 (9.1%) | 1,477 (8.0%) |
| 35 to 39 Years | 1,281 (7.5%) | 1,297 (7.0%) |
| 40 to 44 Years | 1,099 (6.4%) | 1,422 (7.7%) |
| 45 to 49 Years | 1,133 (6.6%) | 1,023 (5.6%) |
| 50 to 54 Years | 1,102 (6.5%) | 1,181 (6.4%) |
| 55 to 59 Years | 840 (4.9%) | 1,346 (7.3%) |
| 60 to 64 Years | 1,293 (7.6%) | 1,216 (6.6%) |
| 65 to 69 Years | 1,049 (6.1%) | 968 (5.2%) |
| 70 to 74 Years | 621 (3.6%) | 1,029 (5.6%) |
| 75 to 79 Years | 222 (1.3%) | 509 (2.8%) |
| 80 to 84 Years | 266 (1.6%) | 361 (2.0%) |
| 85 Years and over | 112 (0.7%) | 596 (3.2%) |
| Total | 17,082 (100.0%) | 18,447 (100.0%) |
Families and Households in Gahanna
Median Family Size in Gahanna
The median family size in Gahanna is 3.04 persons per family, with married-couple families (7,676 | 79.4%) accounting for the largest median family size of 3.06 persons per family. On the other hand, single male/father families (521 | 5.4%) represent the smallest median family size with 2.79 persons per family.
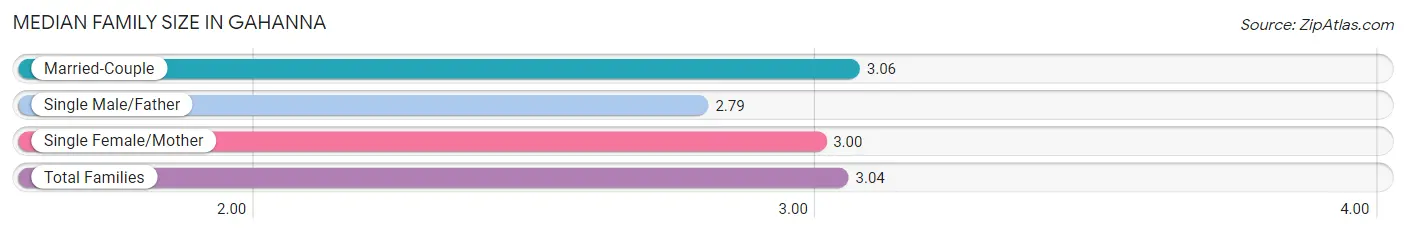
| Family Type | # Families | Family Size |
| Married-Couple | 7,676 (79.4%) | 3.06 |
| Single Male/Father | 521 (5.4%) | 2.79 |
| Single Female/Mother | 1,472 (15.2%) | 3.00 |
| Total Families | 9,669 (100.0%) | 3.04 |
Median Household Size in Gahanna
The median household size in Gahanna is 2.45 persons per household, with single female/mother households (1,472 | 10.2%) accounting for the largest median household size of 3.18 persons per household. non-family households (4,727 | 32.8%) represent the smallest median household size with 1.18 persons per household.
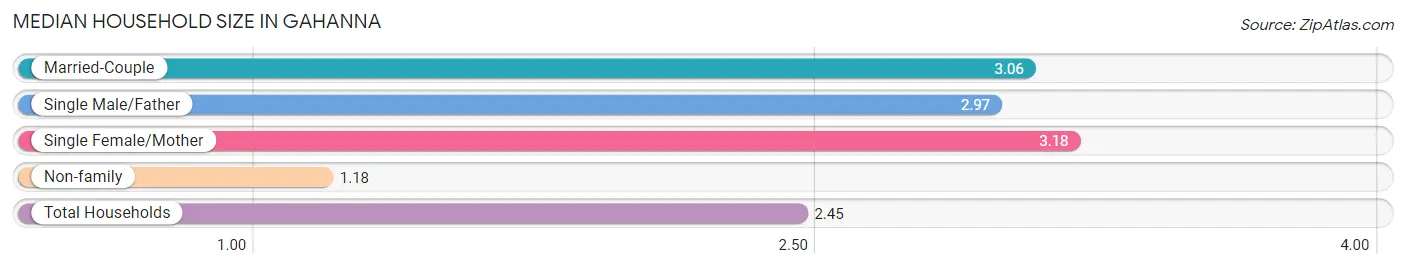
| Household Type | # Households | Household Size |
| Married-Couple | 7,676 (53.3%) | 3.06 |
| Single Male/Father | 521 (3.6%) | 2.97 |
| Single Female/Mother | 1,472 (10.2%) | 3.18 |
| Non-family | 4,727 (32.8%) | 1.18 |
| Total Households | 14,396 (100.0%) | 2.45 |
Household Size by Marriage Status in Gahanna
Out of a total of 14,396 households in Gahanna, 9,669 (67.2%) are family households, while 4,727 (32.8%) are nonfamily households. The most numerous type of family households are 2-person households, comprising 4,359, and the most common type of nonfamily households are 1-person households, comprising 3,937.
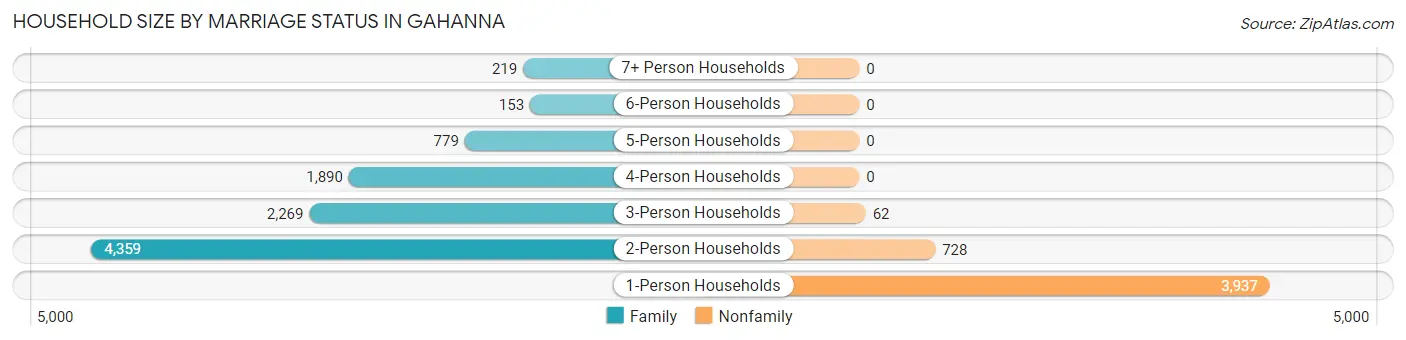
| Household Size | Family Households | Nonfamily Households |
| 1-Person Households | - | 3,937 (27.4%) |
| 2-Person Households | 4,359 (30.3%) | 728 (5.1%) |
| 3-Person Households | 2,269 (15.8%) | 62 (0.4%) |
| 4-Person Households | 1,890 (13.1%) | 0 (0.0%) |
| 5-Person Households | 779 (5.4%) | 0 (0.0%) |
| 6-Person Households | 153 (1.1%) | 0 (0.0%) |
| 7+ Person Households | 219 (1.5%) | 0 (0.0%) |
| Total | 9,669 (67.2%) | 4,727 (32.8%) |
Female Fertility in Gahanna
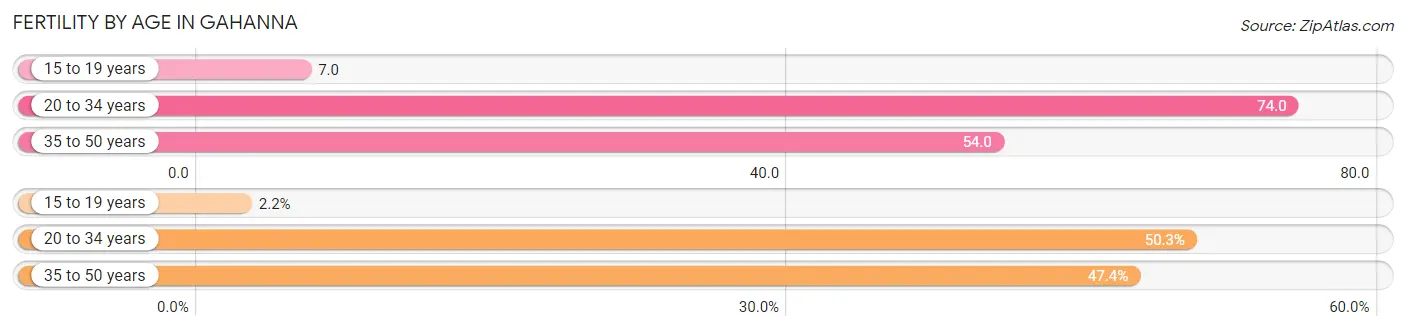
Fertility by Age in Gahanna
Average fertility rate in Gahanna is 53.0 births per 1,000 women. Women in the age bracket of 20 to 34 years have the highest fertility rate with 74.0 births per 1,000 women. Women in the age bracket of 20 to 34 years acount for 50.3% of all women with births.
| Age Bracket | Women with Births | Births / 1,000 Women |
| 15 to 19 years | 10 (2.2%) | 7.0 |
| 20 to 34 years | 226 (50.3%) | 74.0 |
| 35 to 50 years | 213 (47.4%) | 54.0 |
| Total | 449 (100.0%) | 53.0 |
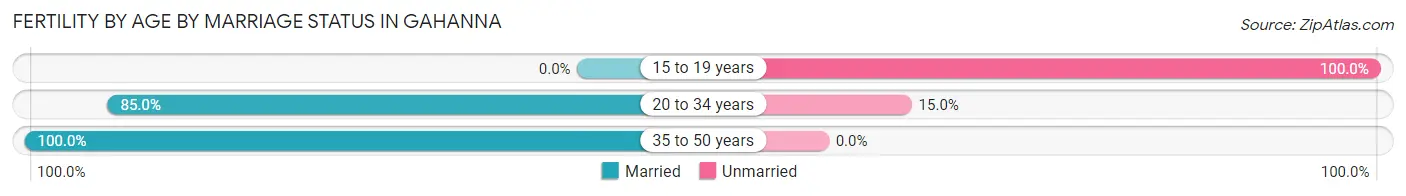
Fertility by Age by Marriage Status in Gahanna
90.2% of women with births (449) in Gahanna are married. The highest percentage of unmarried women with births falls into 15 to 19 years age bracket with 100.0% of them unmarried at the time of birth, while the lowest percentage of unmarried women with births belong to 35 to 50 years age bracket with 0.0% of them unmarried.
| Age Bracket | Married | Unmarried |
| 15 to 19 years | 0 (0.0%) | 10 (100.0%) |
| 20 to 34 years | 192 (85.0%) | 34 (15.0%) |
| 35 to 50 years | 213 (100.0%) | 0 (0.0%) |
| Total | 405 (90.2%) | 44 (9.8%) |
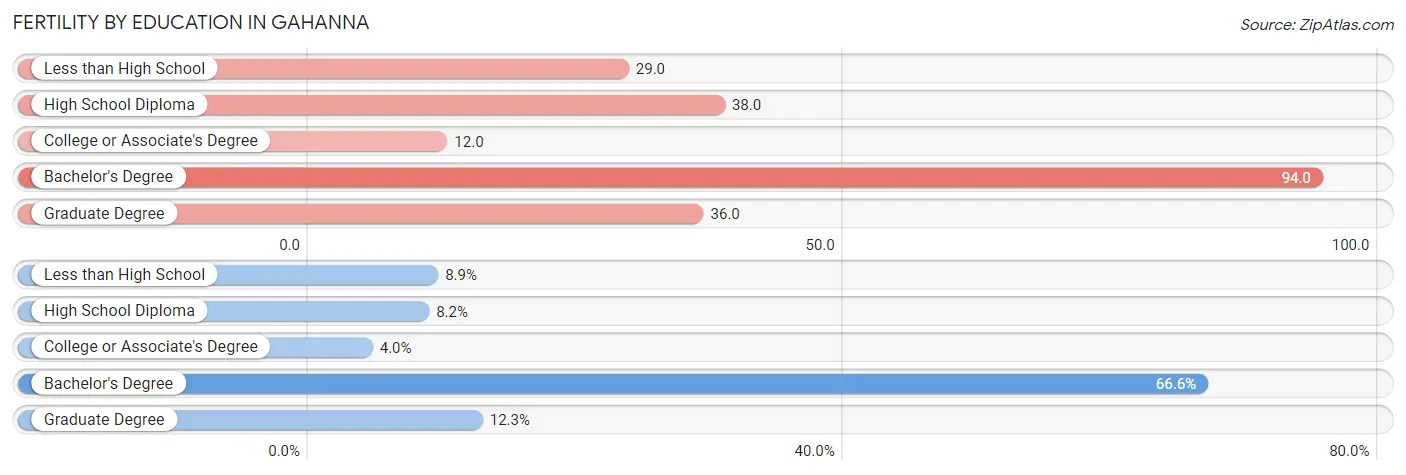
Fertility by Education in Gahanna
Average fertility rate in Gahanna is 53.0 births per 1,000 women. Women with the education attainment of bachelor's degree have the highest fertility rate of 94.0 births per 1,000 women, while women with the education attainment of college or associate's degree have the lowest fertility at 12.0 births per 1,000 women. Women with the education attainment of bachelor's degree represent 66.6% of all women with births.
| Educational Attainment | Women with Births | Births / 1,000 Women |
| Less than High School | 40 (8.9%) | 29.0 |
| High School Diploma | 37 (8.2%) | 38.0 |
| College or Associate's Degree | 18 (4.0%) | 12.0 |
| Bachelor's Degree | 299 (66.6%) | 94.0 |
| Graduate Degree | 55 (12.2%) | 36.0 |
| Total | 449 (100.0%) | 53.0 |
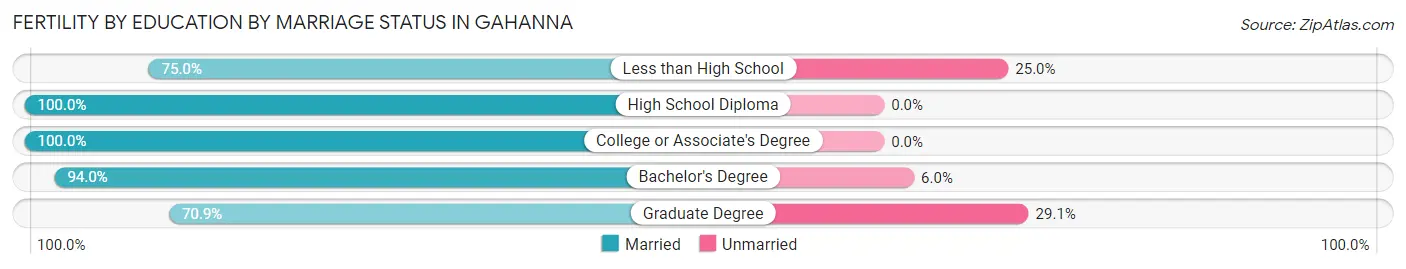
Fertility by Education by Marriage Status in Gahanna
9.8% of women with births in Gahanna are unmarried. Women with the educational attainment of high school diploma are most likely to be married with 100.0% of them married at childbirth, while women with the educational attainment of graduate degree are least likely to be married with 29.1% of them unmarried at childbirth.
| Educational Attainment | Married | Unmarried |
| Less than High School | 30 (75.0%) | 10 (25.0%) |
| High School Diploma | 37 (100.0%) | 0 (0.0%) |
| College or Associate's Degree | 18 (100.0%) | 0 (0.0%) |
| Bachelor's Degree | 281 (94.0%) | 18 (6.0%) |
| Graduate Degree | 39 (70.9%) | 16 (29.1%) |
| Total | 405 (90.2%) | 44 (9.8%) |
Income in Gahanna
Income Overview in Gahanna
Per Capita Income in Gahanna is $50,762, while median incomes of families and households are $124,510 and $104,555 respectively.
| Characteristic | Number | Measure |
| Per Capita Income | 35,529 | $50,762 |
| Median Family Income | 9,669 | $124,510 |
| Mean Family Income | 9,669 | $150,966 |
| Median Household Income | 14,396 | $104,555 |
| Mean Household Income | 14,396 | $125,729 |
| Income Deficit | 9,669 | $0 |
| Wage / Income Gap (%) | 35,529 | 1.93% |
| Wage / Income Gap ($) | 35,529 | 98.07¢ per $1 |
| Gini / Inequality Index | 35,529 | 0.41 |
Earnings by Sex in Gahanna
Average Earnings in Gahanna are $55,313, $54,602 for men and $55,674 for women, a difference of 1.9%.
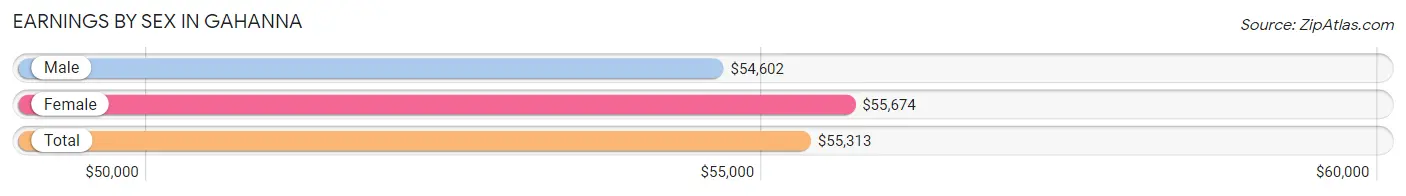
| Sex | Number | Average Earnings |
| Male | 10,449 (50.2%) | $54,602 |
| Female | 10,360 (49.8%) | $55,674 |
| Total | 20,809 (100.0%) | $55,313 |
Earnings by Sex by Income Bracket in Gahanna
The most common earnings brackets in Gahanna are $100,000+ for men (2,548 | 24.4%) and $100,000+ for women (1,998 | 19.3%).
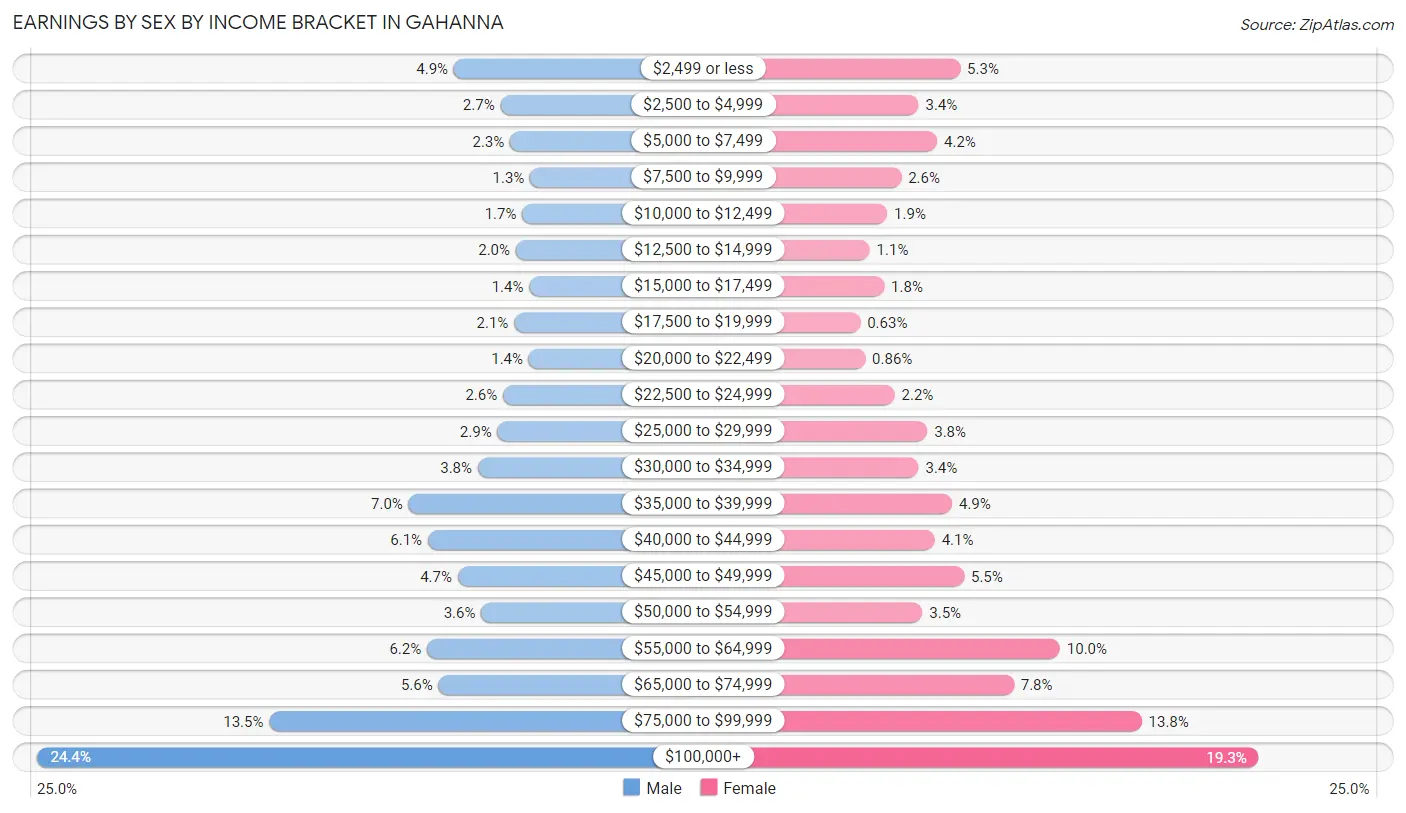
| Income | Male | Female |
| $2,499 or less | 511 (4.9%) | 550 (5.3%) |
| $2,500 to $4,999 | 283 (2.7%) | 348 (3.4%) |
| $5,000 to $7,499 | 236 (2.3%) | 438 (4.2%) |
| $7,500 to $9,999 | 138 (1.3%) | 264 (2.5%) |
| $10,000 to $12,499 | 177 (1.7%) | 196 (1.9%) |
| $12,500 to $14,999 | 208 (2.0%) | 111 (1.1%) |
| $15,000 to $17,499 | 142 (1.4%) | 181 (1.8%) |
| $17,500 to $19,999 | 216 (2.1%) | 65 (0.6%) |
| $20,000 to $22,499 | 144 (1.4%) | 89 (0.9%) |
| $22,500 to $24,999 | 271 (2.6%) | 232 (2.2%) |
| $25,000 to $29,999 | 298 (2.9%) | 391 (3.8%) |
| $30,000 to $34,999 | 394 (3.8%) | 348 (3.4%) |
| $35,000 to $39,999 | 732 (7.0%) | 511 (4.9%) |
| $40,000 to $44,999 | 638 (6.1%) | 427 (4.1%) |
| $45,000 to $49,999 | 492 (4.7%) | 569 (5.5%) |
| $50,000 to $54,999 | 377 (3.6%) | 367 (3.5%) |
| $55,000 to $64,999 | 643 (6.1%) | 1,034 (10.0%) |
| $65,000 to $74,999 | 586 (5.6%) | 810 (7.8%) |
| $75,000 to $99,999 | 1,415 (13.5%) | 1,431 (13.8%) |
| $100,000+ | 2,548 (24.4%) | 1,998 (19.3%) |
| Total | 10,449 (100.0%) | 10,360 (100.0%) |
Earnings by Sex by Educational Attainment in Gahanna
Average earnings in Gahanna are $63,830 for men and $60,222 for women, a difference of 5.7%. Men with an educational attainment of graduate degree enjoy the highest average annual earnings of $95,077, while those with high school diploma education earn the least with $44,701. Women with an educational attainment of graduate degree earn the most with the average annual earnings of $84,457, while those with high school diploma education have the smallest earnings of $32,337.
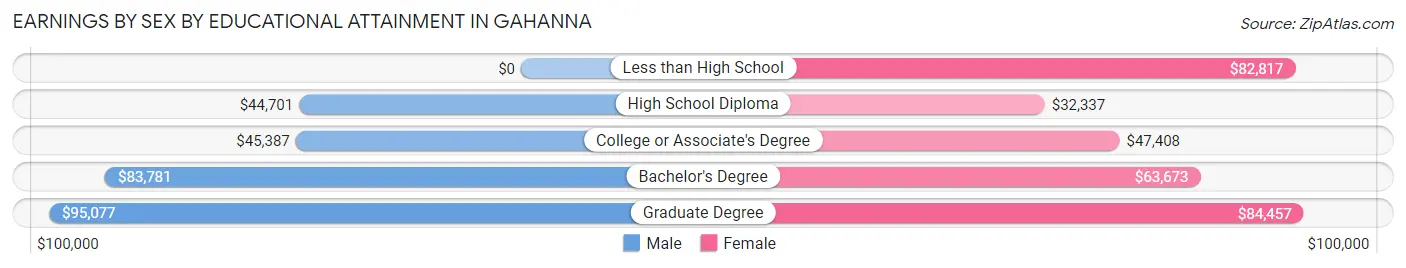
| Educational Attainment | Male Income | Female Income |
| Less than High School | - | - |
| High School Diploma | $44,701 | $32,337 |
| College or Associate's Degree | $45,387 | $47,408 |
| Bachelor's Degree | $83,781 | $63,673 |
| Graduate Degree | $95,077 | $84,457 |
| Total | $63,830 | $60,222 |
Family Income in Gahanna
Family Income Brackets in Gahanna
According to the Gahanna family income data, there are 2,939 families falling into the $100,000 to $149,999 income range, which is the most common income bracket and makes up 30.4% of all families. Conversely, the $10,000 to $14,999 income bracket is the least frequent group with only 58 families (0.6%) belonging to this category.
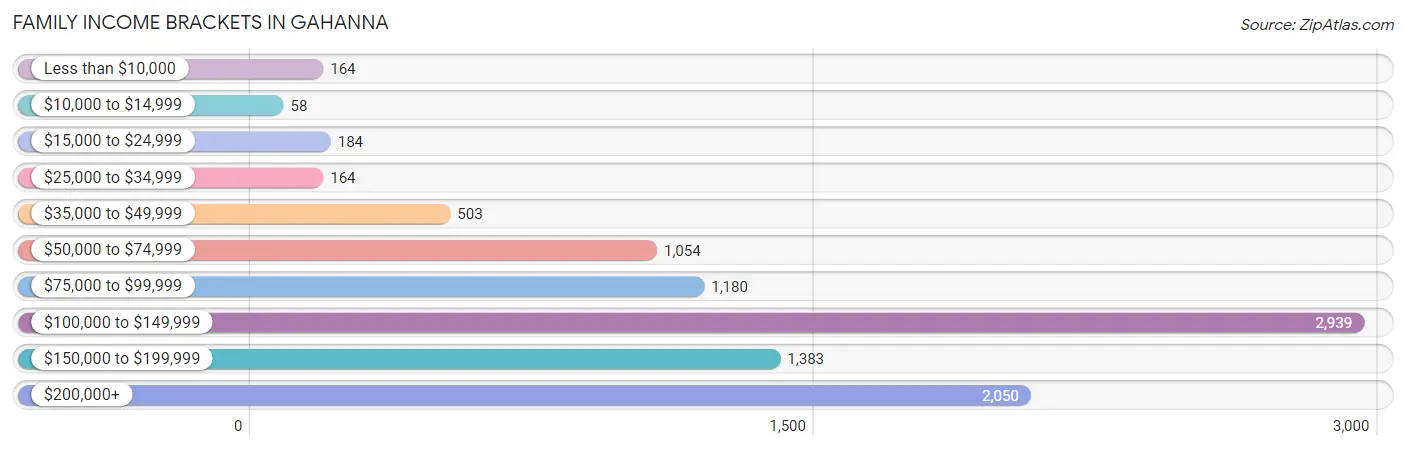
| Income Bracket | # Families | % Families |
| Less than $10,000 | 164 | 1.7% |
| $10,000 to $14,999 | 58 | 0.6% |
| $15,000 to $24,999 | 184 | 1.9% |
| $25,000 to $34,999 | 164 | 1.7% |
| $35,000 to $49,999 | 503 | 5.2% |
| $50,000 to $74,999 | 1,054 | 10.9% |
| $75,000 to $99,999 | 1,180 | 12.2% |
| $100,000 to $149,999 | 2,939 | 30.4% |
| $150,000 to $199,999 | 1,383 | 14.3% |
| $200,000+ | 2,050 | 21.2% |
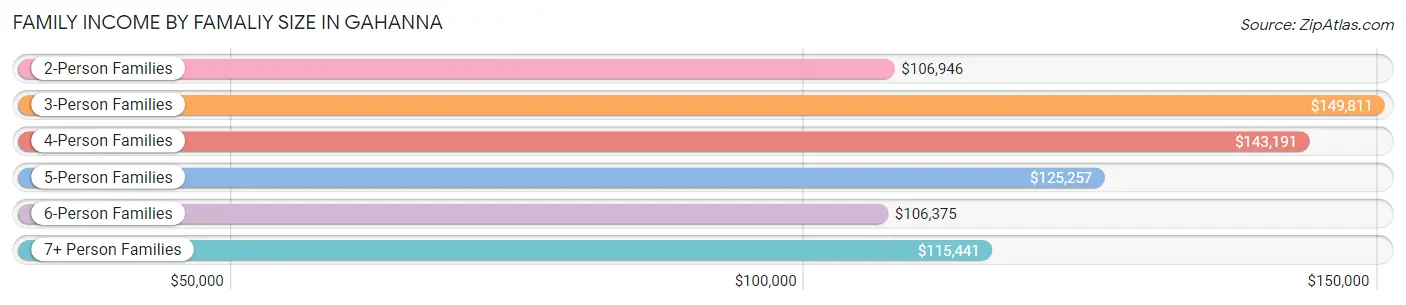
Family Income by Famaliy Size in Gahanna
3-person families (2,114 | 21.9%) account for the highest median family income in Gahanna with $149,811 per family, while 2-person families (4,551 | 47.1%) have the highest median income of $53,473 per family member.
| Income Bracket | # Families | Median Income |
| 2-Person Families | 4,551 (47.1%) | $106,946 |
| 3-Person Families | 2,114 (21.9%) | $149,811 |
| 4-Person Families | 1,914 (19.8%) | $143,191 |
| 5-Person Families | 728 (7.5%) | $125,257 |
| 6-Person Families | 200 (2.1%) | $106,375 |
| 7+ Person Families | 162 (1.7%) | $115,441 |
| Total | 9,669 (100.0%) | $124,510 |
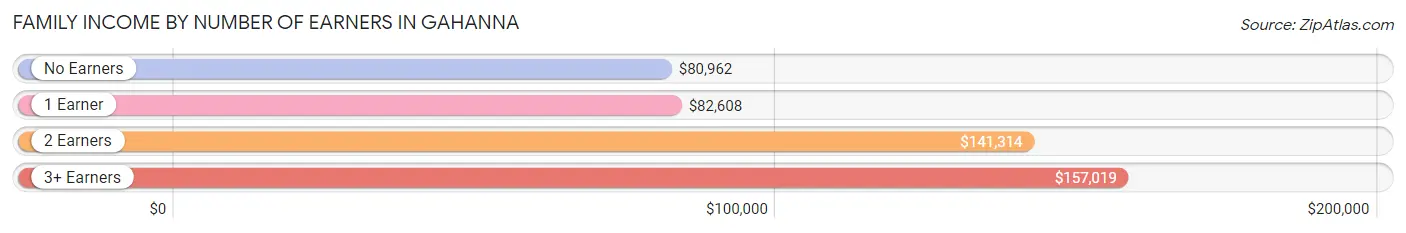
Family Income by Number of Earners in Gahanna
The median family income in Gahanna is $124,510, with families comprising 3+ earners (1,302) having the highest median family income of $157,019, while families with no earners (898) have the lowest median family income of $80,962, accounting for 13.5% and 9.3% of families, respectively.
| Number of Earners | # Families | Median Income |
| No Earners | 898 (9.3%) | $80,962 |
| 1 Earner | 2,595 (26.8%) | $82,608 |
| 2 Earners | 4,874 (50.4%) | $141,314 |
| 3+ Earners | 1,302 (13.5%) | $157,019 |
| Total | 9,669 (100.0%) | $124,510 |
Household Income in Gahanna
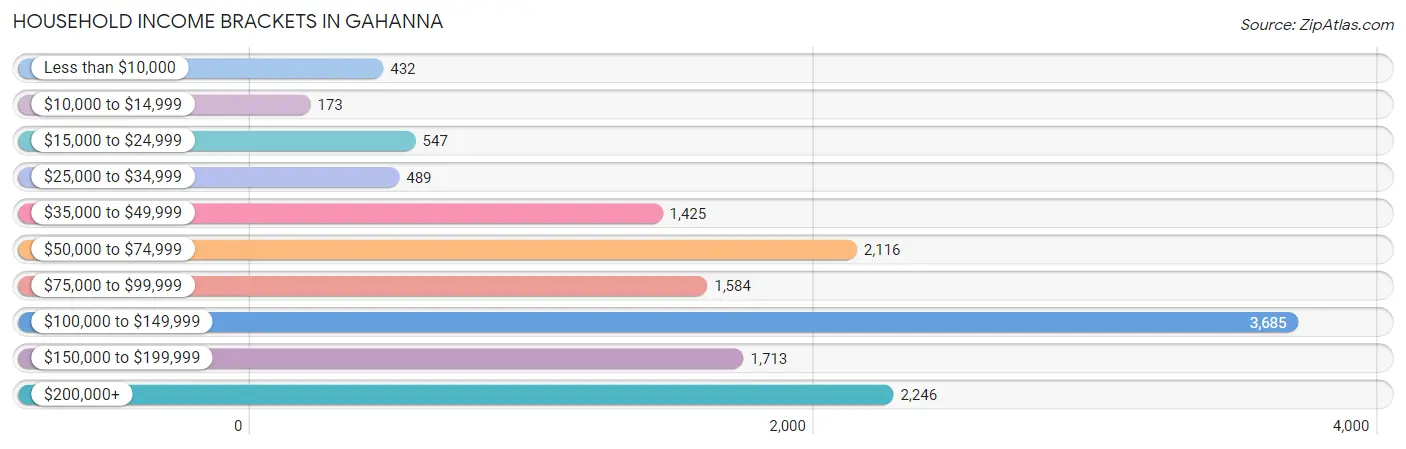
Household Income Brackets in Gahanna
With 3,685 households falling in the category, the $100,000 to $149,999 income range is the most frequent in Gahanna, accounting for 25.6% of all households. In contrast, only 173 households (1.2%) fall into the $10,000 to $14,999 income bracket, making it the least populous group.
| Income Bracket | # Households | % Households |
| Less than $10,000 | 432 | 3.0% |
| $10,000 to $14,999 | 173 | 1.2% |
| $15,000 to $24,999 | 547 | 3.8% |
| $25,000 to $34,999 | 489 | 3.4% |
| $35,000 to $49,999 | 1,425 | 9.9% |
| $50,000 to $74,999 | 2,116 | 14.7% |
| $75,000 to $99,999 | 1,584 | 11.0% |
| $100,000 to $149,999 | 3,685 | 25.6% |
| $150,000 to $199,999 | 1,713 | 11.9% |
| $200,000+ | 2,246 | 15.6% |
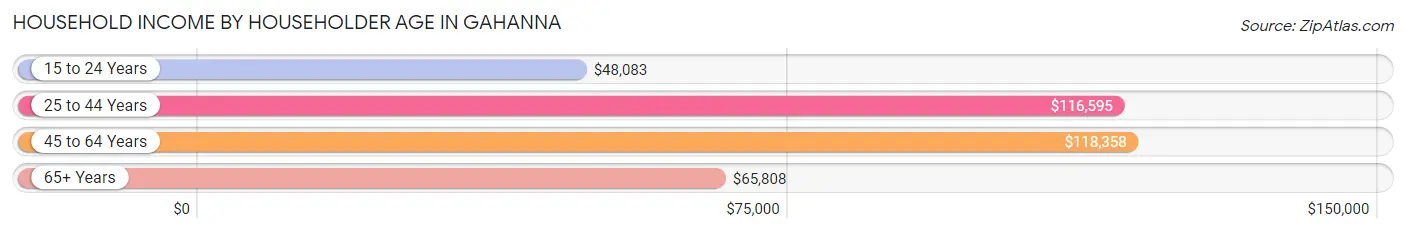
Household Income by Householder Age in Gahanna
The median household income in Gahanna is $104,555, with the highest median household income of $118,358 found in the 45 to 64 years age bracket for the primary householder. A total of 5,510 households (38.3%) fall into this category. Meanwhile, the 15 to 24 years age bracket for the primary householder has the lowest median household income of $48,083, with 401 households (2.8%) in this group.
| Income Bracket | # Households | Median Income |
| 15 to 24 Years | 401 (2.8%) | $48,083 |
| 25 to 44 Years | 4,831 (33.6%) | $116,595 |
| 45 to 64 Years | 5,510 (38.3%) | $118,358 |
| 65+ Years | 3,654 (25.4%) | $65,808 |
| Total | 14,396 (100.0%) | $104,555 |
Poverty in Gahanna
Income Below Poverty by Sex and Age in Gahanna
With 3.4% poverty level for males and 5.2% for females among the residents of Gahanna, 45 to 54 year old males and 5 year old females are the most vulnerable to poverty, with 151 males (6.8%) and 28 females (14.6%) in their respective age groups living below the poverty level.
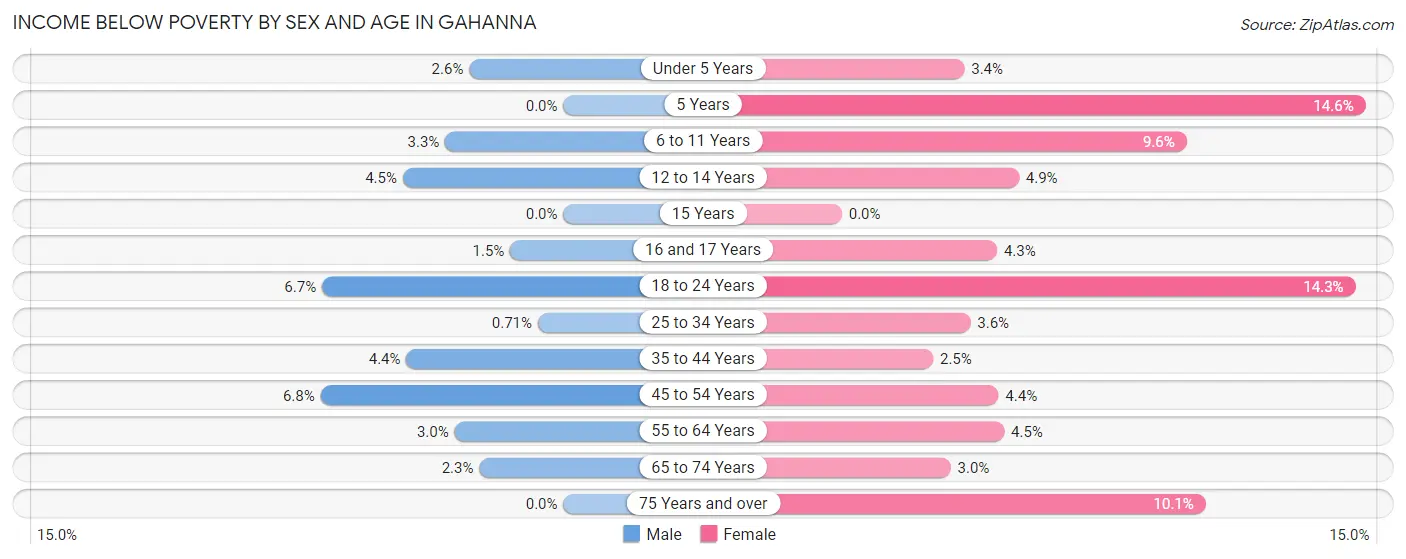
| Age Bracket | Male | Female |
| Under 5 Years | 27 (2.6%) | 28 (3.4%) |
| 5 Years | 0 (0.0%) | 28 (14.6%) |
| 6 to 11 Years | 56 (3.3%) | 102 (9.6%) |
| 12 to 14 Years | 46 (4.5%) | 43 (4.9%) |
| 15 Years | 0 (0.0%) | 0 (0.0%) |
| 16 and 17 Years | 8 (1.5%) | 29 (4.3%) |
| 18 to 24 Years | 72 (6.7%) | 167 (14.3%) |
| 25 to 34 Years | 17 (0.7%) | 83 (3.6%) |
| 35 to 44 Years | 104 (4.4%) | 69 (2.5%) |
| 45 to 54 Years | 151 (6.8%) | 96 (4.4%) |
| 55 to 64 Years | 63 (3.0%) | 115 (4.5%) |
| 65 to 74 Years | 39 (2.3%) | 60 (3.0%) |
| 75 Years and over | 0 (0.0%) | 140 (10.1%) |
| Total | 583 (3.4%) | 960 (5.2%) |
Income Above Poverty by Sex and Age in Gahanna
According to the poverty statistics in Gahanna, males aged 5 years and females aged 15 years are the age groups that are most secure financially, with 100.0% of males and 100.0% of females in these age groups living above the poverty line.
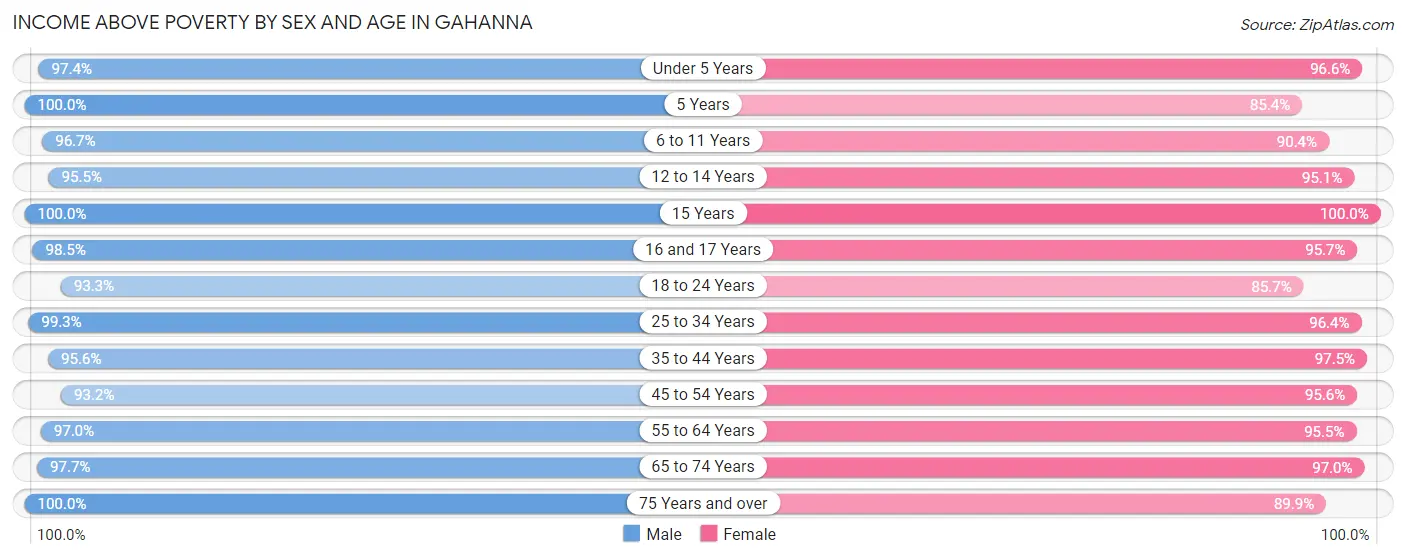
| Age Bracket | Male | Female |
| Under 5 Years | 1,004 (97.4%) | 792 (96.6%) |
| 5 Years | 93 (100.0%) | 164 (85.4%) |
| 6 to 11 Years | 1,644 (96.7%) | 961 (90.4%) |
| 12 to 14 Years | 983 (95.5%) | 829 (95.1%) |
| 15 Years | 207 (100.0%) | 390 (100.0%) |
| 16 and 17 Years | 533 (98.5%) | 643 (95.7%) |
| 18 to 24 Years | 1,000 (93.3%) | 1,001 (85.7%) |
| 25 to 34 Years | 2,368 (99.3%) | 2,233 (96.4%) |
| 35 to 44 Years | 2,276 (95.6%) | 2,650 (97.5%) |
| 45 to 54 Years | 2,084 (93.2%) | 2,104 (95.6%) |
| 55 to 64 Years | 2,013 (97.0%) | 2,432 (95.5%) |
| 65 to 74 Years | 1,626 (97.7%) | 1,922 (97.0%) |
| 75 Years and over | 582 (100.0%) | 1,242 (89.9%) |
| Total | 16,413 (96.6%) | 17,363 (94.8%) |
Income Below Poverty Among Married-Couple Families in Gahanna
The poverty statistics for married-couple families in Gahanna show that 0.6% or 46 of the total 7,676 families live below the poverty line. Families with 1 or 2 children have the highest poverty rate of 1.1%, comprising of 28 families. On the other hand, families with 3 or 4 children have the lowest poverty rate of 0.0%, which includes 0 families.
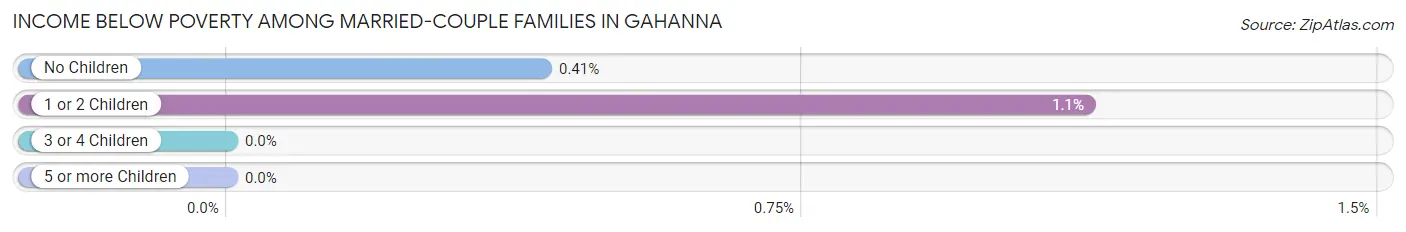
| Children | Above Poverty | Below Poverty |
| No Children | 4,399 (99.6%) | 18 (0.4%) |
| 1 or 2 Children | 2,481 (98.9%) | 28 (1.1%) |
| 3 or 4 Children | 710 (100.0%) | 0 (0.0%) |
| 5 or more Children | 40 (100.0%) | 0 (0.0%) |
| Total | 7,630 (99.4%) | 46 (0.6%) |
Income Below Poverty Among Single-Parent Households in Gahanna
According to the poverty data in Gahanna, 8.8% or 46 single-father households and 12.9% or 190 single-mother households are living below the poverty line. Among single-father households, those with 3 or 4 children have the highest poverty rate, with 28 households (31.8%) experiencing poverty. Likewise, among single-mother households, those with 3 or 4 children have the highest poverty rate, with 44 households (29.9%) falling below the poverty line.
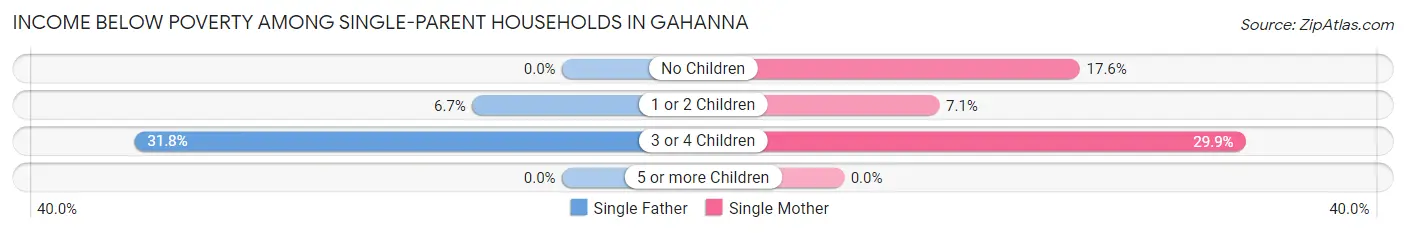
| Children | Single Father | Single Mother |
| No Children | 0 (0.0%) | 87 (17.6%) |
| 1 or 2 Children | 18 (6.7%) | 59 (7.1%) |
| 3 or 4 Children | 28 (31.8%) | 44 (29.9%) |
| 5 or more Children | 0 (0.0%) | 0 (0.0%) |
| Total | 46 (8.8%) | 190 (12.9%) |
Income Below Poverty Among Married-Couple vs Single-Parent Households in Gahanna
The poverty data for Gahanna shows that 46 of the married-couple family households (0.6%) and 236 of the single-parent households (11.8%) are living below the poverty level. Within the married-couple family households, those with 1 or 2 children have the highest poverty rate, with 28 households (1.1%) falling below the poverty line. Among the single-parent households, those with 3 or 4 children have the highest poverty rate, with 72 household (30.6%) living below poverty.
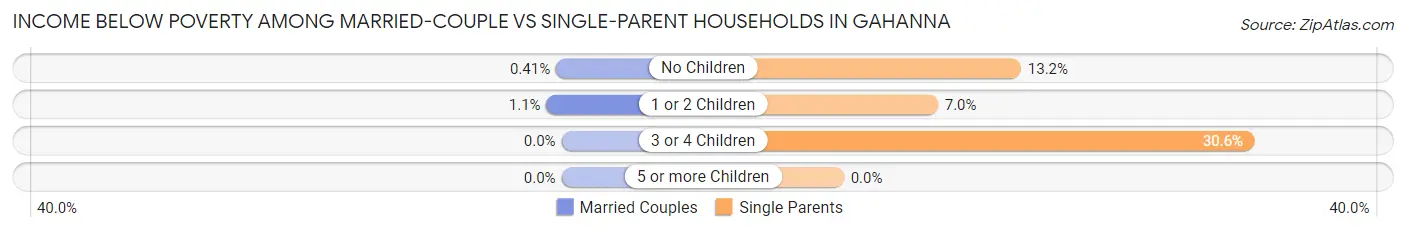
| Children | Married-Couple Families | Single-Parent Households |
| No Children | 18 (0.4%) | 87 (13.2%) |
| 1 or 2 Children | 28 (1.1%) | 77 (7.0%) |
| 3 or 4 Children | 0 (0.0%) | 72 (30.6%) |
| 5 or more Children | 0 (0.0%) | 0 (0.0%) |
| Total | 46 (0.6%) | 236 (11.8%) |
Employment Characteristics in Gahanna
Employment by Class of Employer in Gahanna
Among the 18,931 employed individuals in Gahanna, private company employees (12,236 | 64.6%), not-for-profit organizations (2,441 | 12.9%), and local government employees (1,301 | 6.9%) make up the most common classes of employment.
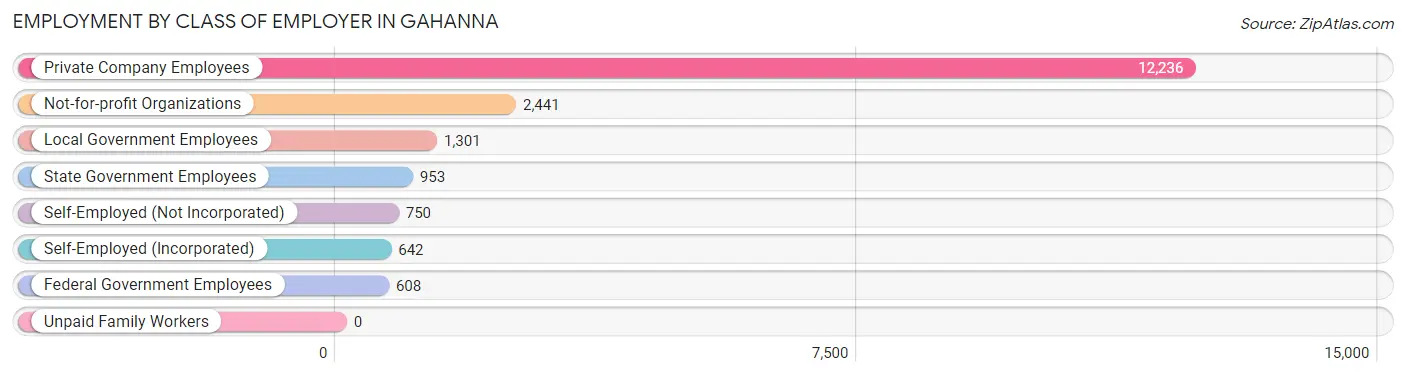
| Employer Class | # Employees | % Employees |
| Private Company Employees | 12,236 | 64.6% |
| Self-Employed (Incorporated) | 642 | 3.4% |
| Self-Employed (Not Incorporated) | 750 | 4.0% |
| Not-for-profit Organizations | 2,441 | 12.9% |
| Local Government Employees | 1,301 | 6.9% |
| State Government Employees | 953 | 5.0% |
| Federal Government Employees | 608 | 3.2% |
| Unpaid Family Workers | 0 | 0.0% |
| Total | 18,931 | 100.0% |
Employment Status by Age in Gahanna
According to the labor force statistics for Gahanna, out of the total population over 16 years of age (28,125), 69.8% or 19,631 individuals are in the labor force, with 2.2% or 432 of them unemployed. The age group with the highest labor force participation rate is 25 to 29 years, with 98.1% or 1,642 individuals in the labor force. Within the labor force, the 16 to 19 years age range has the highest percentage of unemployed individuals, with 7.5% or 59 of them being unemployed.
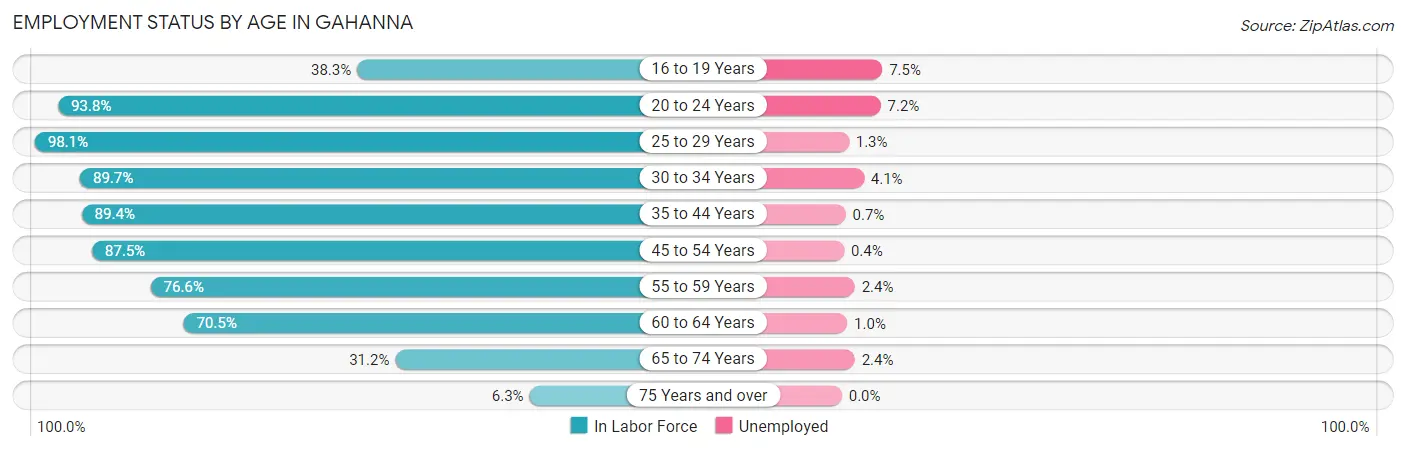
| Age Bracket | In Labor Force | Unemployed |
| 16 to 19 Years | 786 (38.3%) | 59 (7.5%) |
| 20 to 24 Years | 1,318 (93.8%) | 95 (7.2%) |
| 25 to 29 Years | 1,642 (98.1%) | 21 (1.3%) |
| 30 to 34 Years | 2,715 (89.7%) | 111 (4.1%) |
| 35 to 44 Years | 4,559 (89.4%) | 32 (0.7%) |
| 45 to 54 Years | 3,884 (87.5%) | 16 (0.4%) |
| 55 to 59 Years | 1,674 (76.6%) | 40 (2.4%) |
| 60 to 64 Years | 1,769 (70.5%) | 18 (1.0%) |
| 65 to 74 Years | 1,144 (31.2%) | 27 (2.4%) |
| 75 Years and over | 130 (6.3%) | 0 (0.0%) |
| Total | 19,631 (69.8%) | 432 (2.2%) |
Employment Status by Educational Attainment in Gahanna
According to labor force statistics for Gahanna, 85.8% of individuals (16,245) out of the total population between 25 and 64 years of age (18,934) are in the labor force, with 1.5% or 244 of them being unemployed. The group with the highest labor force participation rate are those with the educational attainment of bachelor's degree or higher, with 91.3% or 9,909 individuals in the labor force. Within the labor force, individuals with college / associate degree education have the highest percentage of unemployment, with 3.9% or 137 of them being unemployed.
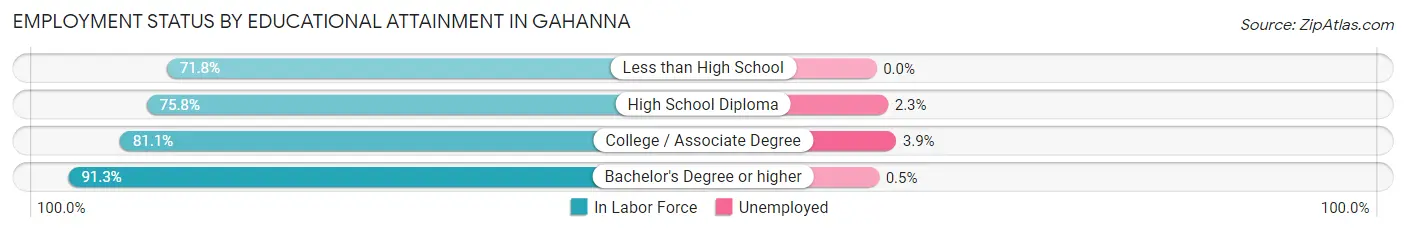
| Educational Attainment | In Labor Force | Unemployed |
| Less than High School | 376 (71.8%) | 0 (0.0%) |
| High School Diploma | 2,451 (75.8%) | 74 (2.3%) |
| College / Associate Degree | 3,506 (81.1%) | 169 (3.9%) |
| Bachelor's Degree or higher | 9,909 (91.3%) | 54 (0.5%) |
| Total | 16,245 (85.8%) | 284 (1.5%) |
Employment Occupations by Sex in Gahanna
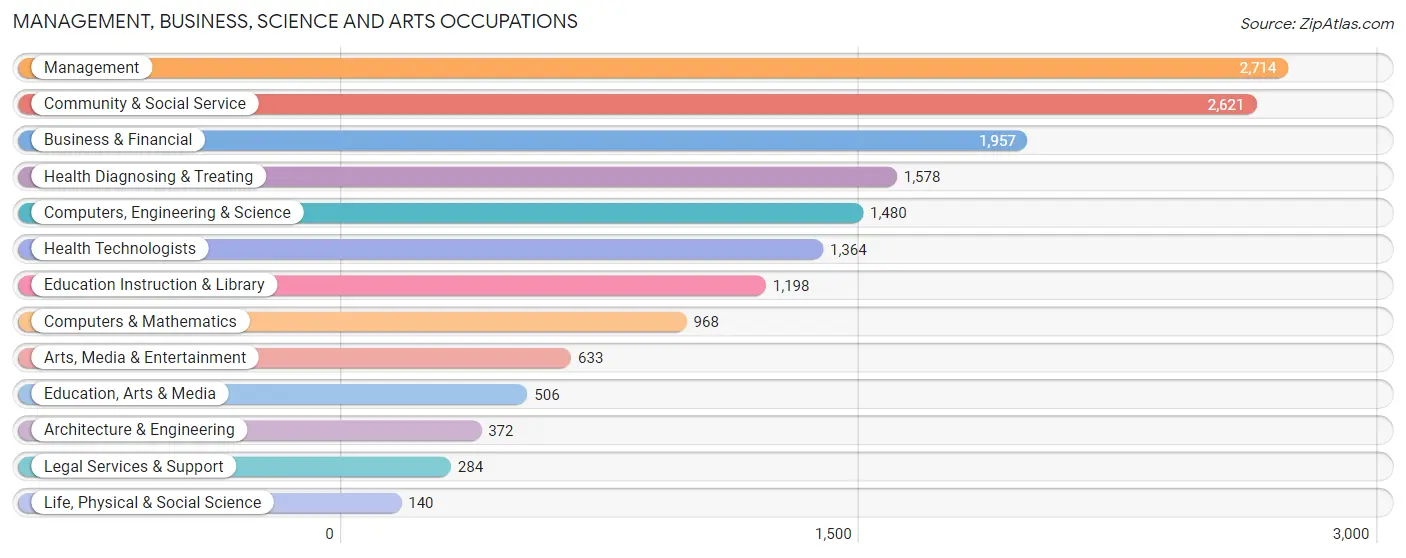
Management, Business, Science and Arts Occupations
The most common Management, Business, Science and Arts occupations in Gahanna are Management (2,714 | 14.3%), Community & Social Service (2,621 | 13.8%), Business & Financial (1,957 | 10.3%), Health Diagnosing & Treating (1,578 | 8.3%), and Computers, Engineering & Science (1,480 | 7.8%).
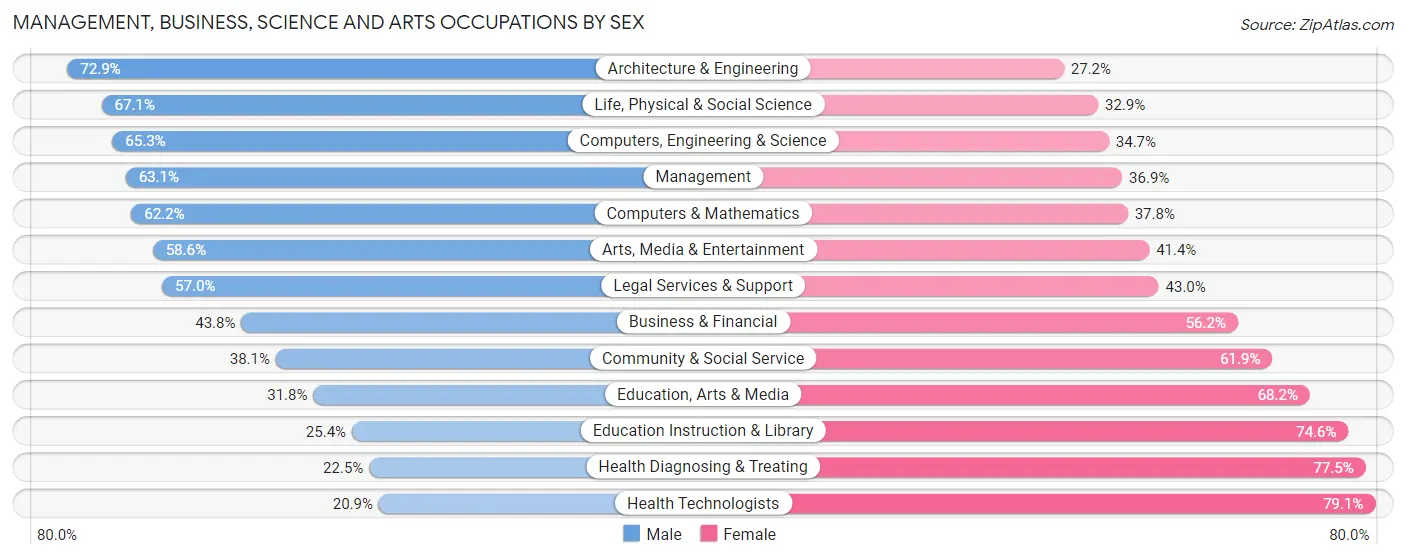
Management, Business, Science and Arts Occupations by Sex
Within the Management, Business, Science and Arts occupations in Gahanna, the most male-oriented occupations are Architecture & Engineering (72.9%), Life, Physical & Social Science (67.1%), and Computers, Engineering & Science (65.3%), while the most female-oriented occupations are Health Technologists (79.1%), Health Diagnosing & Treating (77.5%), and Education Instruction & Library (74.6%).
| Occupation | Male | Female |
| Management | 1,713 (63.1%) | 1,001 (36.9%) |
| Business & Financial | 858 (43.8%) | 1,099 (56.2%) |
| Computers, Engineering & Science | 967 (65.3%) | 513 (34.7%) |
| Computers & Mathematics | 602 (62.2%) | 366 (37.8%) |
| Architecture & Engineering | 271 (72.9%) | 101 (27.2%) |
| Life, Physical & Social Science | 94 (67.1%) | 46 (32.9%) |
| Community & Social Service | 998 (38.1%) | 1,623 (61.9%) |
| Education, Arts & Media | 161 (31.8%) | 345 (68.2%) |
| Legal Services & Support | 162 (57.0%) | 122 (43.0%) |
| Education Instruction & Library | 304 (25.4%) | 894 (74.6%) |
| Arts, Media & Entertainment | 371 (58.6%) | 262 (41.4%) |
| Health Diagnosing & Treating | 355 (22.5%) | 1,223 (77.5%) |
| Health Technologists | 285 (20.9%) | 1,079 (79.1%) |
| Total (Category) | 4,891 (47.3%) | 5,459 (52.7%) |
| Total (Overall) | 9,715 (51.1%) | 9,302 (48.9%) |
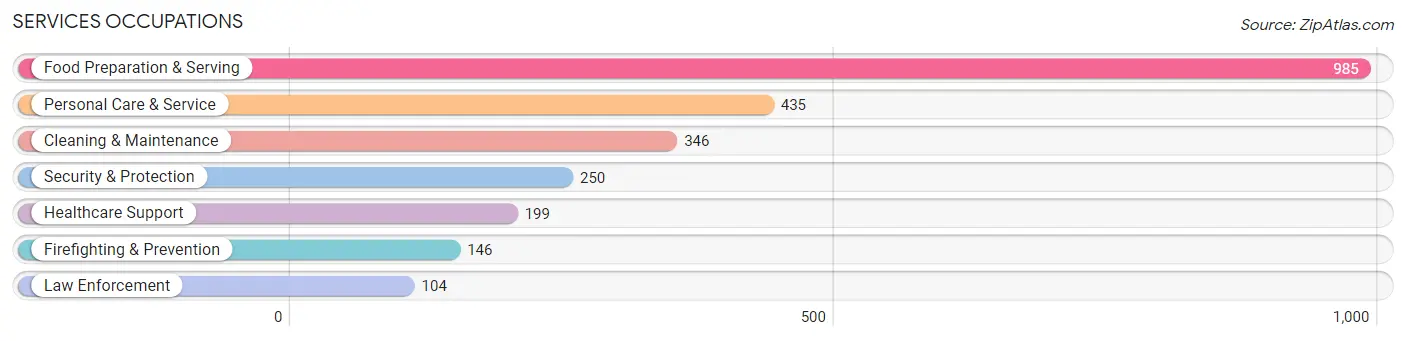
Services Occupations
The most common Services occupations in Gahanna are Food Preparation & Serving (985 | 5.2%), Personal Care & Service (435 | 2.3%), Cleaning & Maintenance (346 | 1.8%), Security & Protection (250 | 1.3%), and Healthcare Support (199 | 1.1%).
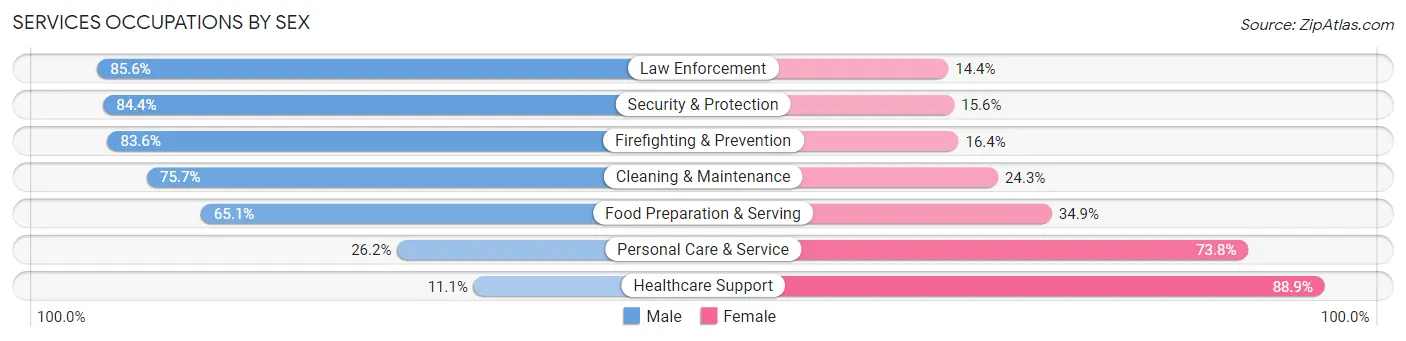
Services Occupations by Sex
Within the Services occupations in Gahanna, the most male-oriented occupations are Law Enforcement (85.6%), Security & Protection (84.4%), and Firefighting & Prevention (83.6%), while the most female-oriented occupations are Healthcare Support (88.9%), Personal Care & Service (73.8%), and Food Preparation & Serving (34.9%).
| Occupation | Male | Female |
| Healthcare Support | 22 (11.1%) | 177 (88.9%) |
| Security & Protection | 211 (84.4%) | 39 (15.6%) |
| Firefighting & Prevention | 122 (83.6%) | 24 (16.4%) |
| Law Enforcement | 89 (85.6%) | 15 (14.4%) |
| Food Preparation & Serving | 641 (65.1%) | 344 (34.9%) |
| Cleaning & Maintenance | 262 (75.7%) | 84 (24.3%) |
| Personal Care & Service | 114 (26.2%) | 321 (73.8%) |
| Total (Category) | 1,250 (56.4%) | 965 (43.6%) |
| Total (Overall) | 9,715 (51.1%) | 9,302 (48.9%) |
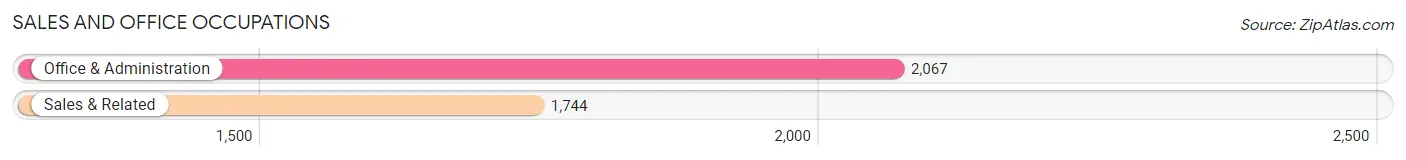
Sales and Office Occupations
The most common Sales and Office occupations in Gahanna are Office & Administration (2,067 | 10.9%), and Sales & Related (1,744 | 9.2%).
Sales and Office Occupations by Sex
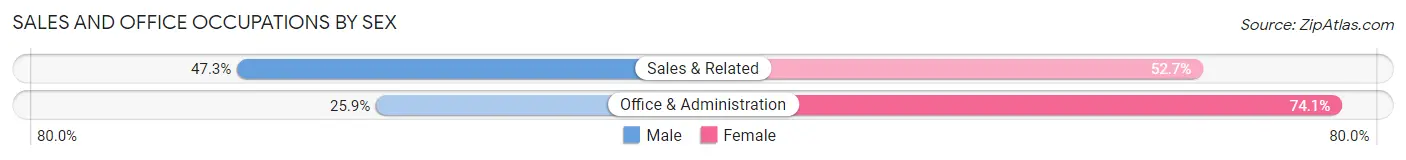
| Occupation | Male | Female |
| Sales & Related | 825 (47.3%) | 919 (52.7%) |
| Office & Administration | 536 (25.9%) | 1,531 (74.1%) |
| Total (Category) | 1,361 (35.7%) | 2,450 (64.3%) |
| Total (Overall) | 9,715 (51.1%) | 9,302 (48.9%) |
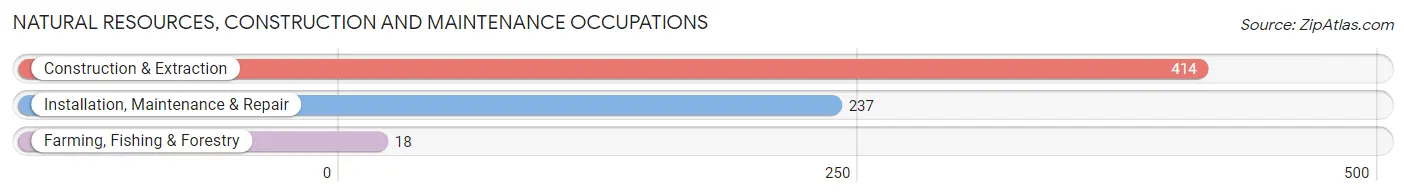
Natural Resources, Construction and Maintenance Occupations
The most common Natural Resources, Construction and Maintenance occupations in Gahanna are Construction & Extraction (414 | 2.2%), Installation, Maintenance & Repair (237 | 1.3%), and Farming, Fishing & Forestry (18 | 0.1%).
Natural Resources, Construction and Maintenance Occupations by Sex
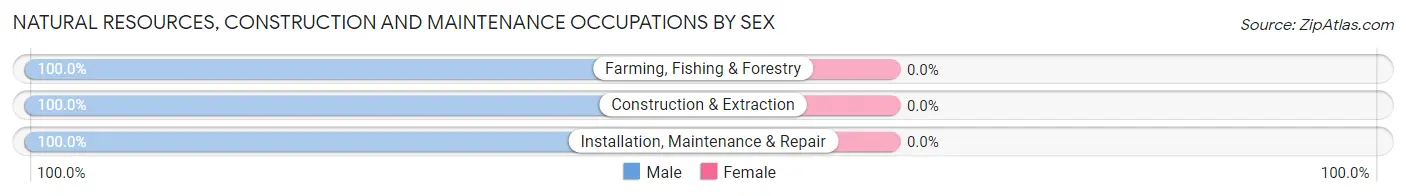
| Occupation | Male | Female |
| Farming, Fishing & Forestry | 18 (100.0%) | 0 (0.0%) |
| Construction & Extraction | 414 (100.0%) | 0 (0.0%) |
| Installation, Maintenance & Repair | 237 (100.0%) | 0 (0.0%) |
| Total (Category) | 669 (100.0%) | 0 (0.0%) |
| Total (Overall) | 9,715 (51.1%) | 9,302 (48.9%) |
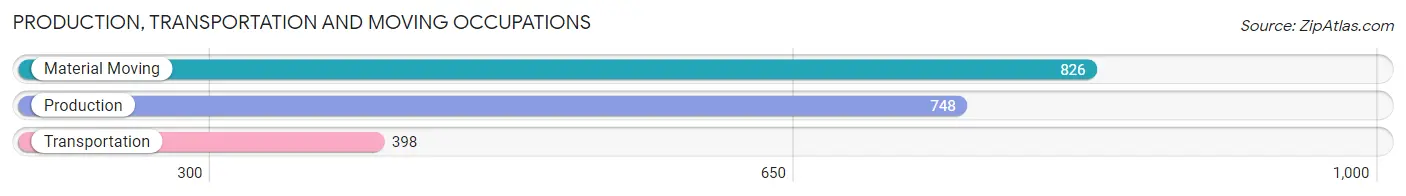
Production, Transportation and Moving Occupations
The most common Production, Transportation and Moving occupations in Gahanna are Material Moving (826 | 4.3%), Production (748 | 3.9%), and Transportation (398 | 2.1%).
Production, Transportation and Moving Occupations by Sex
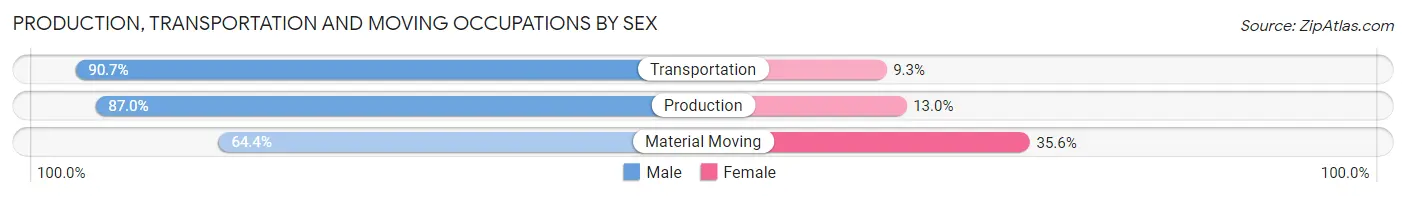
| Occupation | Male | Female |
| Production | 651 (87.0%) | 97 (13.0%) |
| Transportation | 361 (90.7%) | 37 (9.3%) |
| Material Moving | 532 (64.4%) | 294 (35.6%) |
| Total (Category) | 1,544 (78.3%) | 428 (21.7%) |
| Total (Overall) | 9,715 (51.1%) | 9,302 (48.9%) |
Employment Industries by Sex in Gahanna
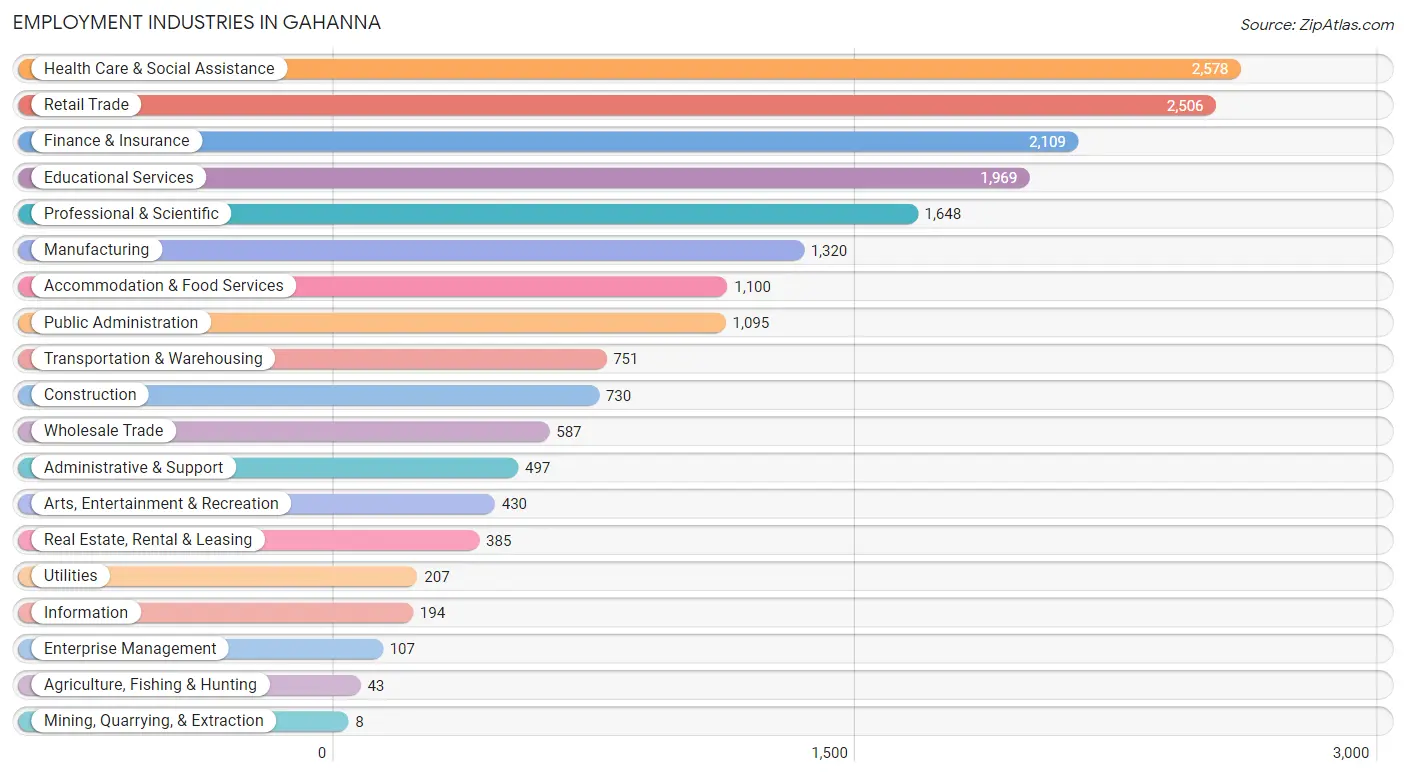
Employment Industries in Gahanna
The major employment industries in Gahanna include Health Care & Social Assistance (2,578 | 13.6%), Retail Trade (2,506 | 13.2%), Finance & Insurance (2,109 | 11.1%), Educational Services (1,969 | 10.3%), and Professional & Scientific (1,648 | 8.7%).
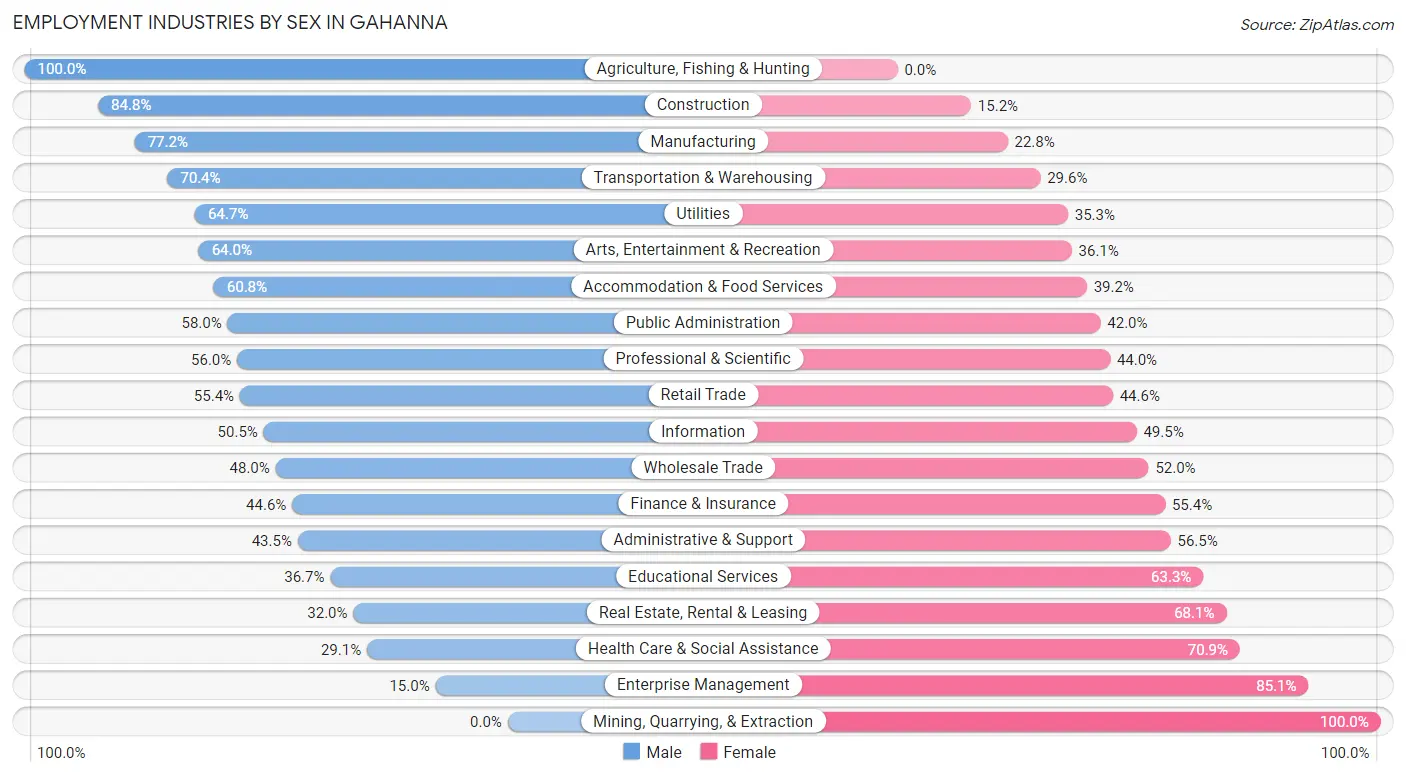
Employment Industries by Sex in Gahanna
The Gahanna industries that see more men than women are Agriculture, Fishing & Hunting (100.0%), Construction (84.8%), and Manufacturing (77.2%), whereas the industries that tend to have a higher number of women are Mining, Quarrying, & Extraction (100.0%), Enterprise Management (85.1%), and Health Care & Social Assistance (70.9%).
| Industry | Male | Female |
| Agriculture, Fishing & Hunting | 43 (100.0%) | 0 (0.0%) |
| Mining, Quarrying, & Extraction | 0 (0.0%) | 8 (100.0%) |
| Construction | 619 (84.8%) | 111 (15.2%) |
| Manufacturing | 1,019 (77.2%) | 301 (22.8%) |
| Wholesale Trade | 282 (48.0%) | 305 (52.0%) |
| Retail Trade | 1,389 (55.4%) | 1,117 (44.6%) |
| Transportation & Warehousing | 529 (70.4%) | 222 (29.6%) |
| Utilities | 134 (64.7%) | 73 (35.3%) |
| Information | 98 (50.5%) | 96 (49.5%) |
| Finance & Insurance | 941 (44.6%) | 1,168 (55.4%) |
| Real Estate, Rental & Leasing | 123 (32.0%) | 262 (68.0%) |
| Professional & Scientific | 923 (56.0%) | 725 (44.0%) |
| Enterprise Management | 16 (14.9%) | 91 (85.1%) |
| Administrative & Support | 216 (43.5%) | 281 (56.5%) |
| Educational Services | 723 (36.7%) | 1,246 (63.3%) |
| Health Care & Social Assistance | 751 (29.1%) | 1,827 (70.9%) |
| Arts, Entertainment & Recreation | 275 (63.9%) | 155 (36.0%) |
| Accommodation & Food Services | 669 (60.8%) | 431 (39.2%) |
| Public Administration | 635 (58.0%) | 460 (42.0%) |
| Total | 9,715 (51.1%) | 9,302 (48.9%) |
Education in Gahanna
School Enrollment in Gahanna
The most common levels of schooling among the 9,132 students in Gahanna are middle school (2,464 | 27.0%), high school (2,224 | 24.3%), and elementary school (1,762 | 19.3%).
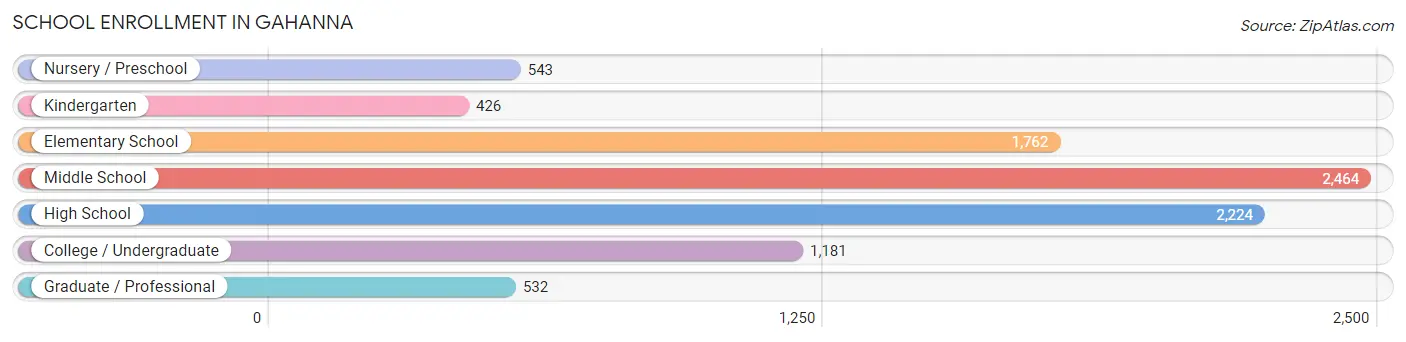
| School Level | # Students | % Students |
| Nursery / Preschool | 543 | 5.9% |
| Kindergarten | 426 | 4.7% |
| Elementary School | 1,762 | 19.3% |
| Middle School | 2,464 | 27.0% |
| High School | 2,224 | 24.3% |
| College / Undergraduate | 1,181 | 12.9% |
| Graduate / Professional | 532 | 5.8% |
| Total | 9,132 | 100.0% |
School Enrollment by Age by Funding Source in Gahanna
Out of a total of 9,132 students who are enrolled in schools in Gahanna, 1,808 (19.8%) attend a private institution, while the remaining 7,324 (80.2%) are enrolled in public schools. The age group of 3 to 4 year olds has the highest likelihood of being enrolled in private schools, with 263 (59.0% in the age bracket) enrolled. Conversely, the age group of 10 to 14 year olds has the lowest likelihood of being enrolled in a private school, with 2,526 (92.9% in the age bracket) attending a public institution.
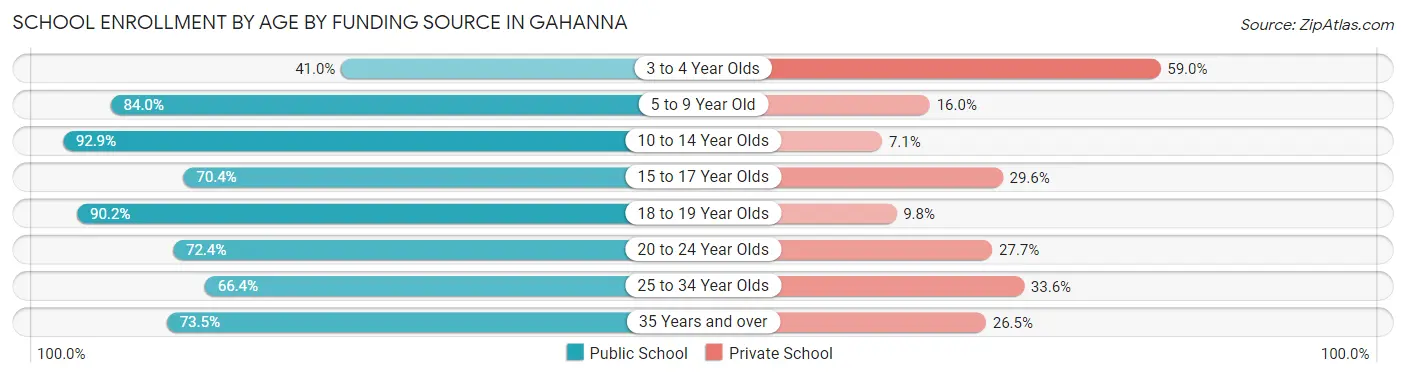
| Age Bracket | Public School | Private School |
| 3 to 4 Year Olds | 183 (41.0%) | 263 (59.0%) |
| 5 to 9 Year Old | 1,771 (84.0%) | 338 (16.0%) |
| 10 to 14 Year Olds | 2,526 (92.9%) | 194 (7.1%) |
| 15 to 17 Year Olds | 1,278 (70.4%) | 537 (29.6%) |
| 18 to 19 Year Olds | 563 (90.2%) | 61 (9.8%) |
| 20 to 24 Year Olds | 369 (72.4%) | 141 (27.7%) |
| 25 to 34 Year Olds | 277 (66.4%) | 140 (33.6%) |
| 35 Years and over | 361 (73.5%) | 130 (26.5%) |
| Total | 7,324 (80.2%) | 1,808 (19.8%) |
Educational Attainment by Field of Study in Gahanna
Business (3,556 | 24.8%), science & technology (1,811 | 12.6%), education (1,721 | 12.0%), engineering (1,004 | 7.0%), and social sciences (930 | 6.5%) are the most common fields of study among 14,344 individuals in Gahanna who have obtained a bachelor's degree or higher.
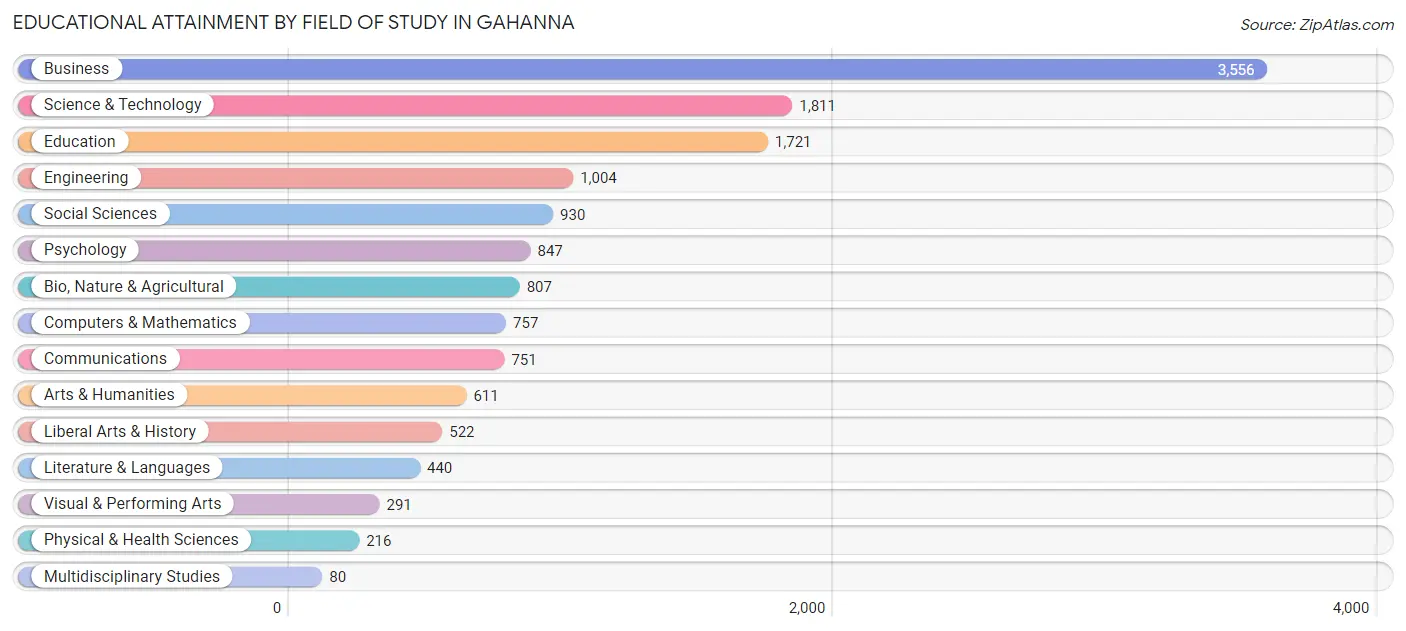
| Field of Study | # Graduates | % Graduates |
| Computers & Mathematics | 757 | 5.3% |
| Bio, Nature & Agricultural | 807 | 5.6% |
| Physical & Health Sciences | 216 | 1.5% |
| Psychology | 847 | 5.9% |
| Social Sciences | 930 | 6.5% |
| Engineering | 1,004 | 7.0% |
| Multidisciplinary Studies | 80 | 0.6% |
| Science & Technology | 1,811 | 12.6% |
| Business | 3,556 | 24.8% |
| Education | 1,721 | 12.0% |
| Literature & Languages | 440 | 3.1% |
| Liberal Arts & History | 522 | 3.6% |
| Visual & Performing Arts | 291 | 2.0% |
| Communications | 751 | 5.2% |
| Arts & Humanities | 611 | 4.3% |
| Total | 14,344 | 100.0% |
Transportation & Commute in Gahanna
Vehicle Availability by Sex in Gahanna
The most prevalent vehicle ownership categories in Gahanna are males with 2 vehicles (5,268, accounting for 54.0%) and females with 2 vehicles (4,529, making up 57.4%).
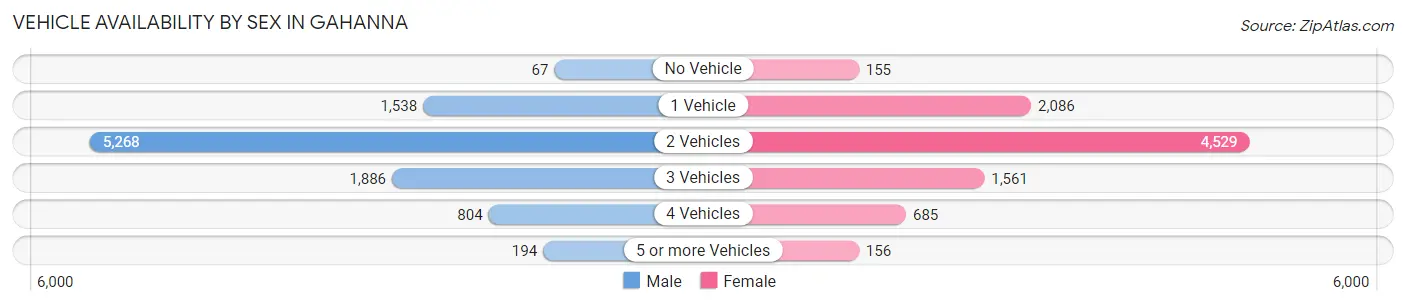
| Vehicles Available | Male | Female |
| No Vehicle | 67 (0.7%) | 155 (1.7%) |
| 1 Vehicle | 1,538 (15.8%) | 2,086 (22.7%) |
| 2 Vehicles | 5,268 (54.0%) | 4,529 (49.4%) |
| 3 Vehicles | 1,886 (19.3%) | 1,561 (17.0%) |
| 4 Vehicles | 804 (8.2%) | 685 (7.5%) |
| 5 or more Vehicles | 194 (2.0%) | 156 (1.7%) |
| Total | 9,757 (100.0%) | 9,172 (100.0%) |
Commute Time in Gahanna
The most frequently occuring commute durations in Gahanna are 20 to 24 minutes (3,454 commuters, 21.9%), 15 to 19 minutes (3,142 commuters, 19.9%), and 10 to 14 minutes (2,736 commuters, 17.3%).
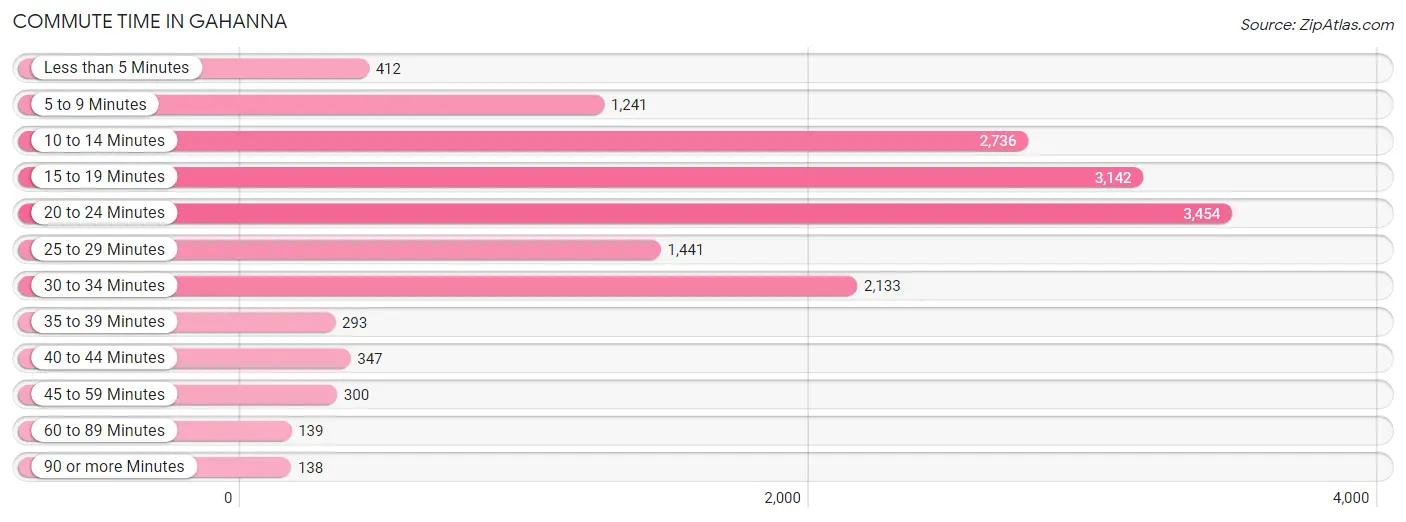
| Commute Time | # Commuters | % Commuters |
| Less than 5 Minutes | 412 | 2.6% |
| 5 to 9 Minutes | 1,241 | 7.9% |
| 10 to 14 Minutes | 2,736 | 17.3% |
| 15 to 19 Minutes | 3,142 | 19.9% |
| 20 to 24 Minutes | 3,454 | 21.9% |
| 25 to 29 Minutes | 1,441 | 9.1% |
| 30 to 34 Minutes | 2,133 | 13.5% |
| 35 to 39 Minutes | 293 | 1.9% |
| 40 to 44 Minutes | 347 | 2.2% |
| 45 to 59 Minutes | 300 | 1.9% |
| 60 to 89 Minutes | 139 | 0.9% |
| 90 or more Minutes | 138 | 0.9% |
Commute Time by Sex in Gahanna
The most common commute times in Gahanna are 20 to 24 minutes (1,697 commuters, 20.3%) for males and 20 to 24 minutes (1,757 commuters, 23.7%) for females.
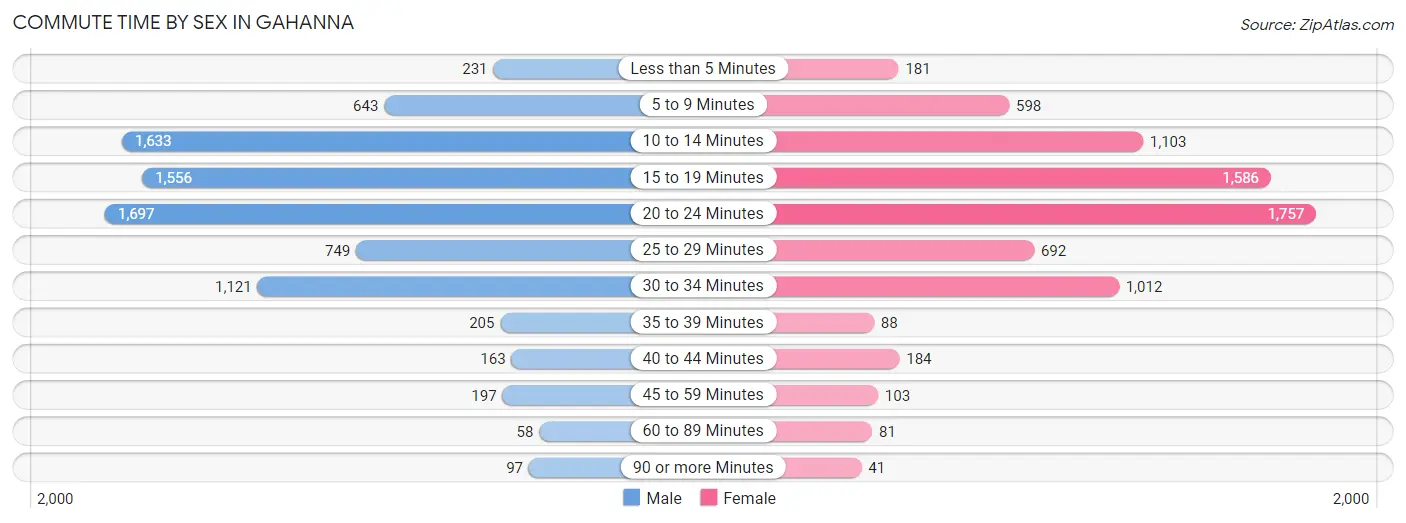
| Commute Time | Male | Female |
| Less than 5 Minutes | 231 (2.8%) | 181 (2.4%) |
| 5 to 9 Minutes | 643 (7.7%) | 598 (8.1%) |
| 10 to 14 Minutes | 1,633 (19.6%) | 1,103 (14.8%) |
| 15 to 19 Minutes | 1,556 (18.6%) | 1,586 (21.4%) |
| 20 to 24 Minutes | 1,697 (20.3%) | 1,757 (23.7%) |
| 25 to 29 Minutes | 749 (9.0%) | 692 (9.3%) |
| 30 to 34 Minutes | 1,121 (13.4%) | 1,012 (13.6%) |
| 35 to 39 Minutes | 205 (2.5%) | 88 (1.2%) |
| 40 to 44 Minutes | 163 (1.9%) | 184 (2.5%) |
| 45 to 59 Minutes | 197 (2.4%) | 103 (1.4%) |
| 60 to 89 Minutes | 58 (0.7%) | 81 (1.1%) |
| 90 or more Minutes | 97 (1.2%) | 41 (0.5%) |
Time of Departure to Work by Sex in Gahanna
The most frequent times of departure to work in Gahanna are 7:30 AM to 7:59 AM (1,232, 14.7%) for males and 8:00 AM to 8:29 AM (1,341, 18.1%) for females.
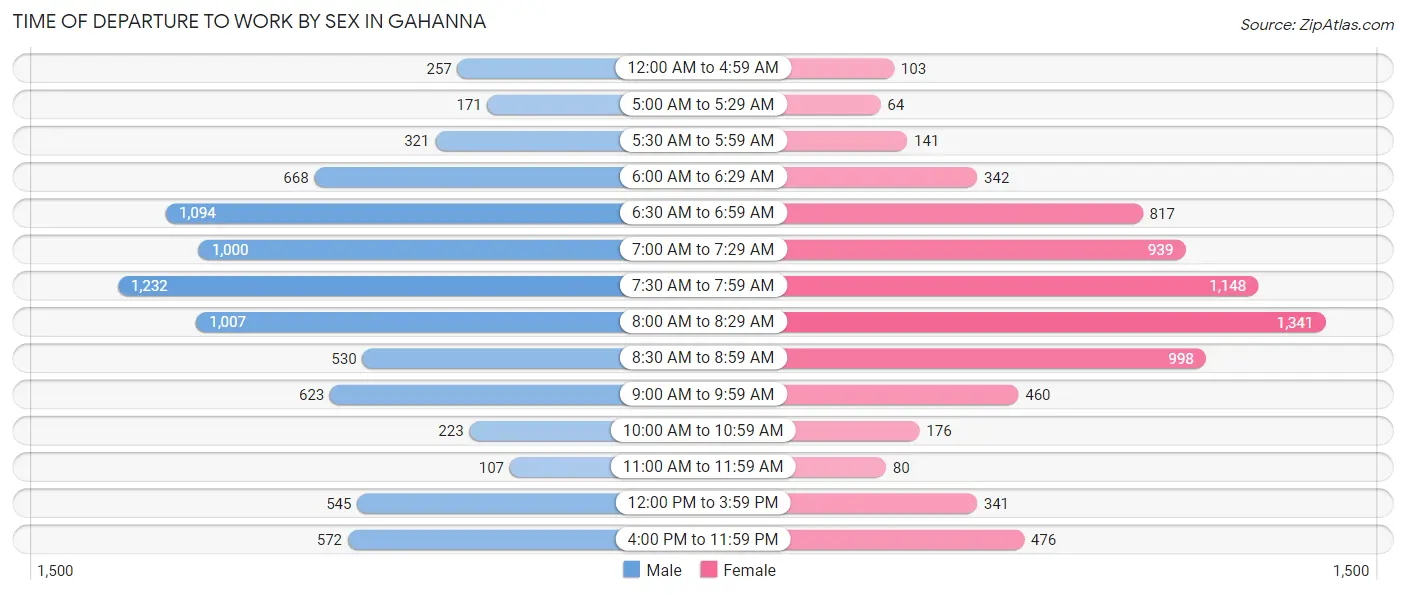
| Time of Departure | Male | Female |
| 12:00 AM to 4:59 AM | 257 (3.1%) | 103 (1.4%) |
| 5:00 AM to 5:29 AM | 171 (2.1%) | 64 (0.9%) |
| 5:30 AM to 5:59 AM | 321 (3.8%) | 141 (1.9%) |
| 6:00 AM to 6:29 AM | 668 (8.0%) | 342 (4.6%) |
| 6:30 AM to 6:59 AM | 1,094 (13.1%) | 817 (11.0%) |
| 7:00 AM to 7:29 AM | 1,000 (12.0%) | 939 (12.6%) |
| 7:30 AM to 7:59 AM | 1,232 (14.7%) | 1,148 (15.5%) |
| 8:00 AM to 8:29 AM | 1,007 (12.1%) | 1,341 (18.1%) |
| 8:30 AM to 8:59 AM | 530 (6.4%) | 998 (13.4%) |
| 9:00 AM to 9:59 AM | 623 (7.5%) | 460 (6.2%) |
| 10:00 AM to 10:59 AM | 223 (2.7%) | 176 (2.4%) |
| 11:00 AM to 11:59 AM | 107 (1.3%) | 80 (1.1%) |
| 12:00 PM to 3:59 PM | 545 (6.5%) | 341 (4.6%) |
| 4:00 PM to 11:59 PM | 572 (6.9%) | 476 (6.4%) |
| Total | 8,350 (100.0%) | 7,426 (100.0%) |
Housing Occupancy in Gahanna
Occupancy by Ownership in Gahanna
Of the total 14,396 dwellings in Gahanna, owner-occupied units account for 10,136 (70.4%), while renter-occupied units make up 4,260 (29.6%).
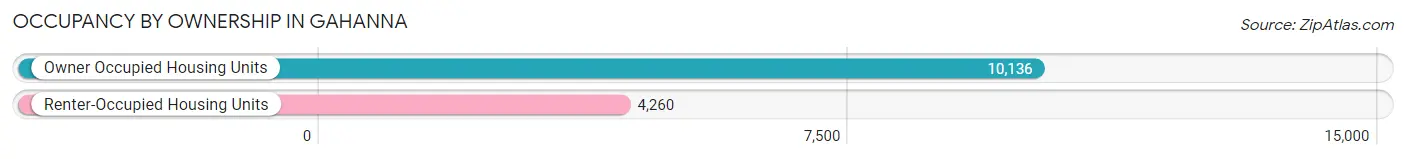
| Occupancy | # Housing Units | % Housing Units |
| Owner Occupied Housing Units | 10,136 | 70.4% |
| Renter-Occupied Housing Units | 4,260 | 29.6% |
| Total Occupied Housing Units | 14,396 | 100.0% |
Occupancy by Household Size in Gahanna
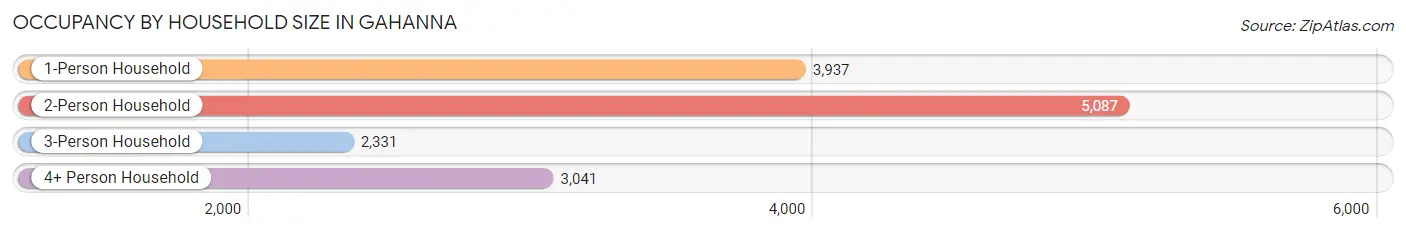
| Household Size | # Housing Units | % Housing Units |
| 1-Person Household | 3,937 | 27.4% |
| 2-Person Household | 5,087 | 35.3% |
| 3-Person Household | 2,331 | 16.2% |
| 4+ Person Household | 3,041 | 21.1% |
| Total Housing Units | 14,396 | 100.0% |
Occupancy by Ownership by Household Size in Gahanna
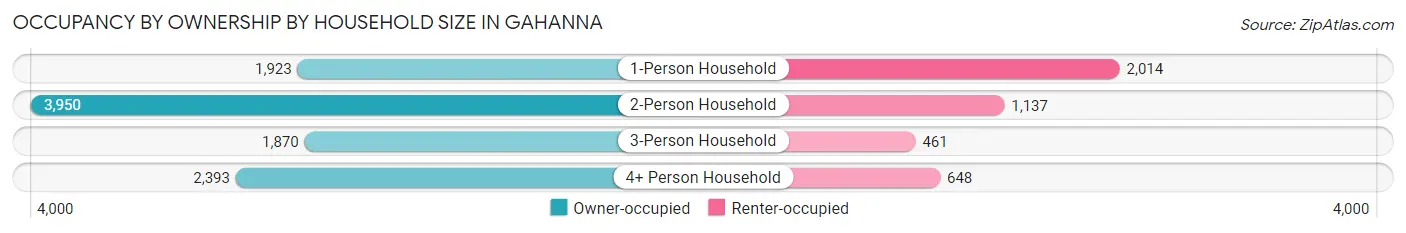
| Household Size | Owner-occupied | Renter-occupied |
| 1-Person Household | 1,923 (48.8%) | 2,014 (51.2%) |
| 2-Person Household | 3,950 (77.6%) | 1,137 (22.4%) |
| 3-Person Household | 1,870 (80.2%) | 461 (19.8%) |
| 4+ Person Household | 2,393 (78.7%) | 648 (21.3%) |
| Total Housing Units | 10,136 (70.4%) | 4,260 (29.6%) |
Occupancy by Educational Attainment in Gahanna
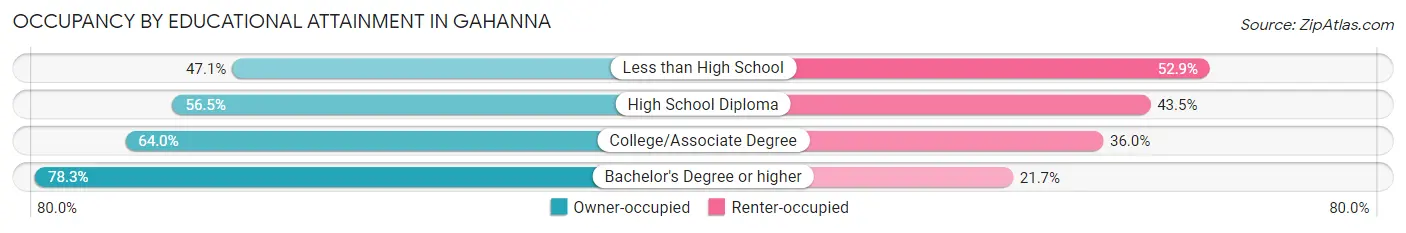
| Household Size | Owner-occupied | Renter-occupied |
| Less than High School | 113 (47.1%) | 127 (52.9%) |
| High School Diploma | 1,428 (56.5%) | 1,098 (43.5%) |
| College/Associate Degree | 2,298 (64.0%) | 1,292 (36.0%) |
| Bachelor's Degree or higher | 6,297 (78.3%) | 1,743 (21.7%) |
Occupancy by Age of Householder in Gahanna
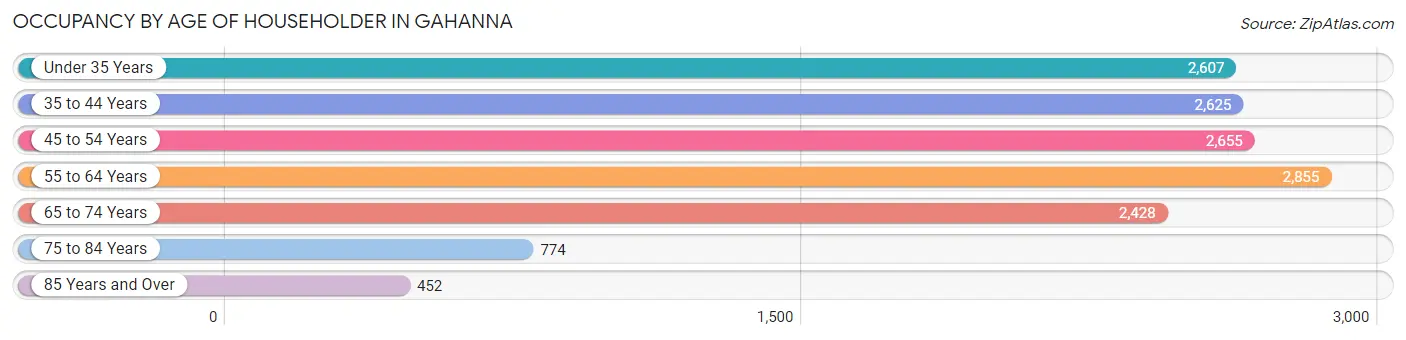
| Age Bracket | # Households | % Households |
| Under 35 Years | 2,607 | 18.1% |
| 35 to 44 Years | 2,625 | 18.2% |
| 45 to 54 Years | 2,655 | 18.4% |
| 55 to 64 Years | 2,855 | 19.8% |
| 65 to 74 Years | 2,428 | 16.9% |
| 75 to 84 Years | 774 | 5.4% |
| 85 Years and Over | 452 | 3.1% |
| Total | 14,396 | 100.0% |
Housing Finances in Gahanna
Median Income by Occupancy in Gahanna
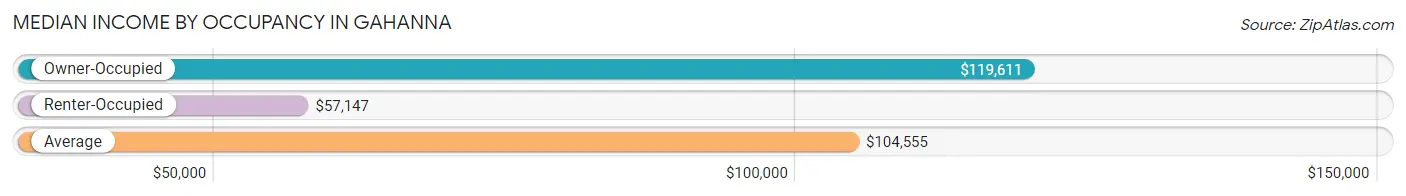
| Occupancy Type | # Households | Median Income |
| Owner-Occupied | 10,136 (70.4%) | $119,611 |
| Renter-Occupied | 4,260 (29.6%) | $57,147 |
| Average | 14,396 (100.0%) | $104,555 |
Occupancy by Householder Income Bracket in Gahanna
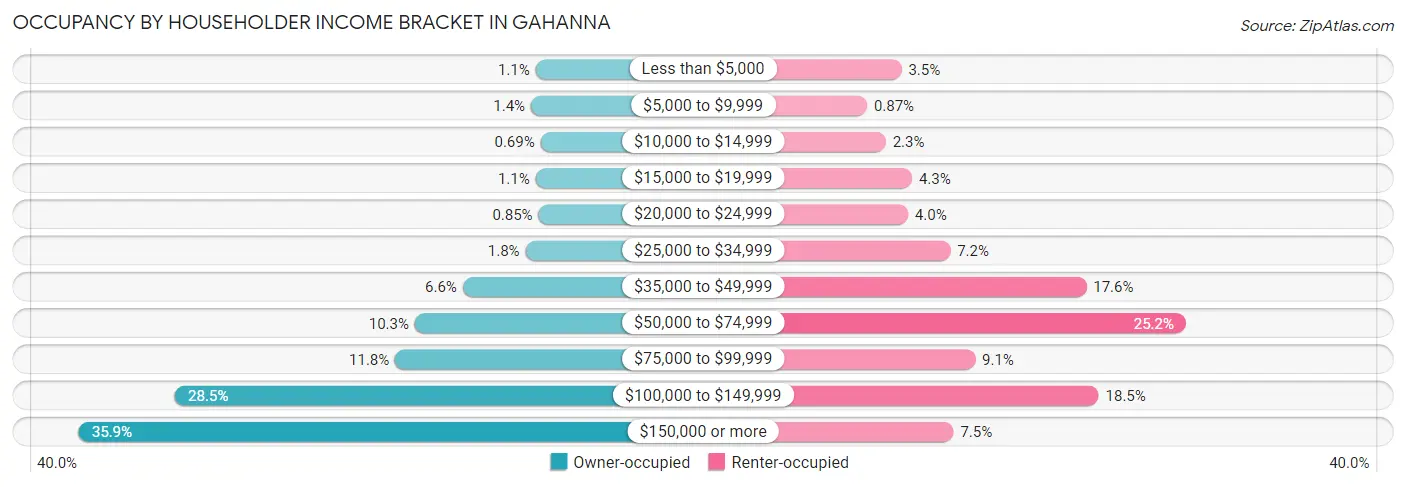
| Income Bracket | Owner-occupied | Renter-occupied |
| Less than $5,000 | 108 (1.1%) | 149 (3.5%) |
| $5,000 to $9,999 | 144 (1.4%) | 37 (0.9%) |
| $10,000 to $14,999 | 70 (0.7%) | 98 (2.3%) |
| $15,000 to $19,999 | 108 (1.1%) | 183 (4.3%) |
| $20,000 to $24,999 | 86 (0.9%) | 170 (4.0%) |
| $25,000 to $34,999 | 187 (1.8%) | 307 (7.2%) |
| $35,000 to $49,999 | 671 (6.6%) | 749 (17.6%) |
| $50,000 to $74,999 | 1,041 (10.3%) | 1,072 (25.2%) |
| $75,000 to $99,999 | 1,193 (11.8%) | 388 (9.1%) |
| $100,000 to $149,999 | 2,892 (28.5%) | 789 (18.5%) |
| $150,000 or more | 3,636 (35.9%) | 318 (7.5%) |
| Total | 10,136 (100.0%) | 4,260 (100.0%) |
Monthly Housing Cost Tiers in Gahanna
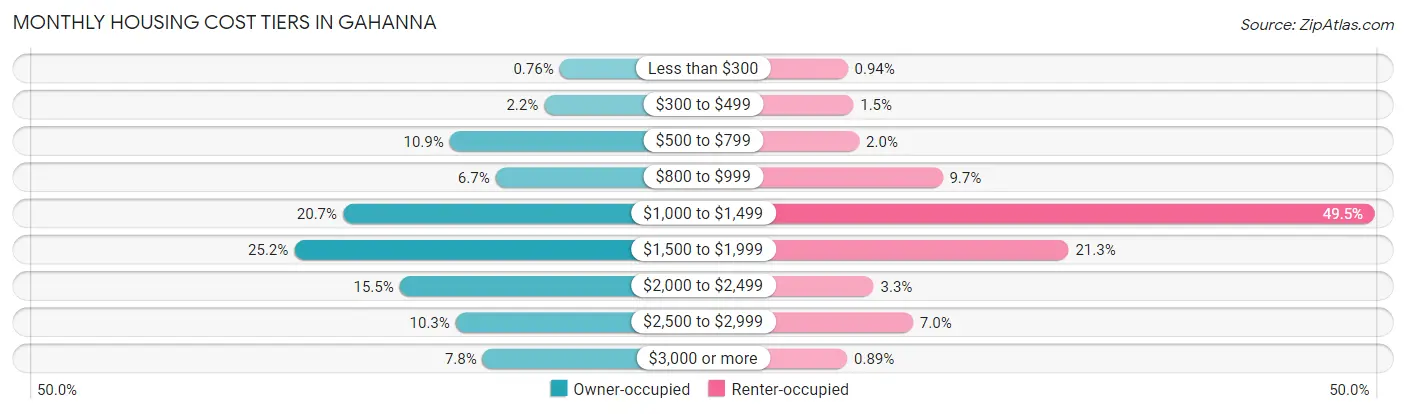
| Monthly Cost | Owner-occupied | Renter-occupied |
| Less than $300 | 77 (0.8%) | 40 (0.9%) |
| $300 to $499 | 221 (2.2%) | 62 (1.5%) |
| $500 to $799 | 1,103 (10.9%) | 85 (2.0%) |
| $800 to $999 | 674 (6.7%) | 412 (9.7%) |
| $1,000 to $1,499 | 2,098 (20.7%) | 2,108 (49.5%) |
| $1,500 to $1,999 | 2,553 (25.2%) | 906 (21.3%) |
| $2,000 to $2,499 | 1,569 (15.5%) | 142 (3.3%) |
| $2,500 to $2,999 | 1,046 (10.3%) | 296 (7.0%) |
| $3,000 or more | 795 (7.8%) | 38 (0.9%) |
| Total | 10,136 (100.0%) | 4,260 (100.0%) |
Physical Housing Characteristics in Gahanna
Housing Structures in Gahanna
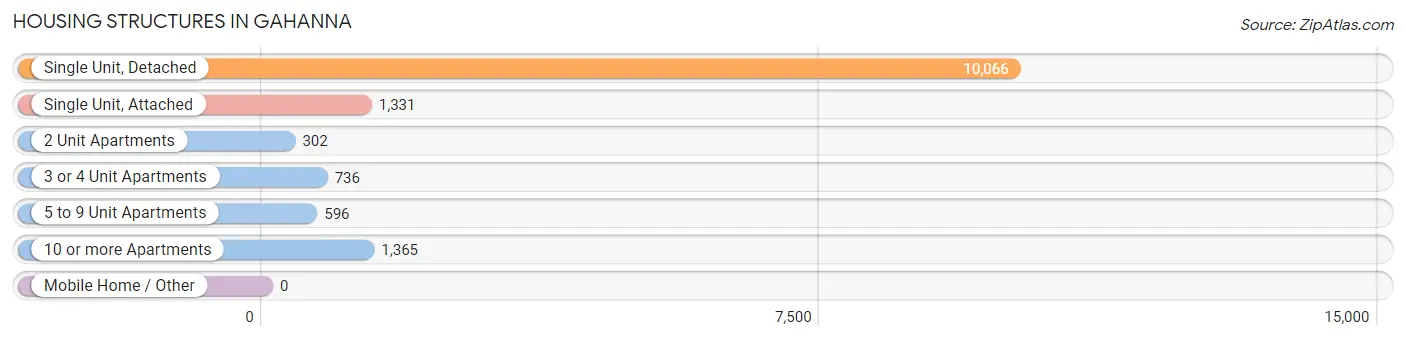
| Structure Type | # Housing Units | % Housing Units |
| Single Unit, Detached | 10,066 | 69.9% |
| Single Unit, Attached | 1,331 | 9.2% |
| 2 Unit Apartments | 302 | 2.1% |
| 3 or 4 Unit Apartments | 736 | 5.1% |
| 5 to 9 Unit Apartments | 596 | 4.1% |
| 10 or more Apartments | 1,365 | 9.5% |
| Mobile Home / Other | 0 | 0.0% |
| Total | 14,396 | 100.0% |
Housing Structures by Occupancy in Gahanna
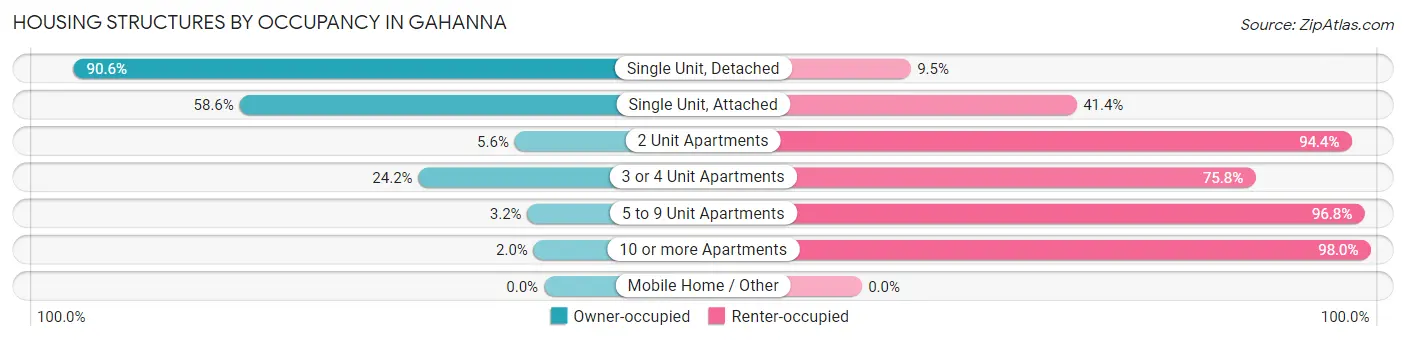
| Structure Type | Owner-occupied | Renter-occupied |
| Single Unit, Detached | 9,115 (90.5%) | 951 (9.5%) |
| Single Unit, Attached | 780 (58.6%) | 551 (41.4%) |
| 2 Unit Apartments | 17 (5.6%) | 285 (94.4%) |
| 3 or 4 Unit Apartments | 178 (24.2%) | 558 (75.8%) |
| 5 to 9 Unit Apartments | 19 (3.2%) | 577 (96.8%) |
| 10 or more Apartments | 27 (2.0%) | 1,338 (98.0%) |
| Mobile Home / Other | 0 (0.0%) | 0 (0.0%) |
| Total | 10,136 (70.4%) | 4,260 (29.6%) |
Housing Structures by Number of Rooms in Gahanna
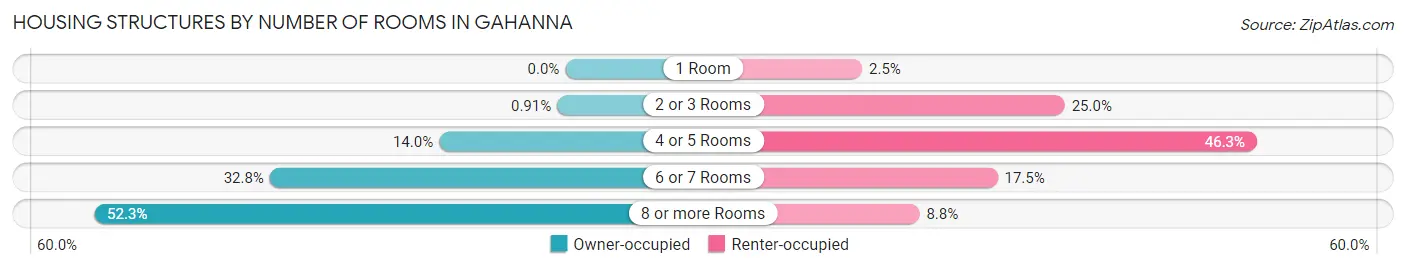
| Number of Rooms | Owner-occupied | Renter-occupied |
| 1 Room | 0 (0.0%) | 105 (2.5%) |
| 2 or 3 Rooms | 92 (0.9%) | 1,063 (24.9%) |
| 4 or 5 Rooms | 1,420 (14.0%) | 1,971 (46.3%) |
| 6 or 7 Rooms | 3,325 (32.8%) | 745 (17.5%) |
| 8 or more Rooms | 5,299 (52.3%) | 376 (8.8%) |
| Total | 10,136 (100.0%) | 4,260 (100.0%) |
Housing Structure by Heating Type in Gahanna
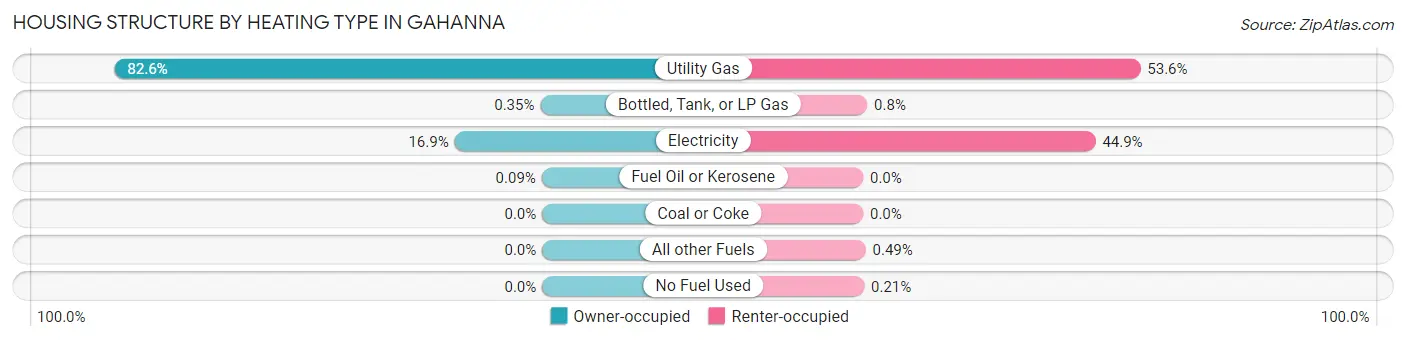
| Heating Type | Owner-occupied | Renter-occupied |
| Utility Gas | 8,376 (82.6%) | 2,283 (53.6%) |
| Bottled, Tank, or LP Gas | 35 (0.4%) | 34 (0.8%) |
| Electricity | 1,716 (16.9%) | 1,913 (44.9%) |
| Fuel Oil or Kerosene | 9 (0.1%) | 0 (0.0%) |
| Coal or Coke | 0 (0.0%) | 0 (0.0%) |
| All other Fuels | 0 (0.0%) | 21 (0.5%) |
| No Fuel Used | 0 (0.0%) | 9 (0.2%) |
| Total | 10,136 (100.0%) | 4,260 (100.0%) |
Household Vehicle Usage in Gahanna
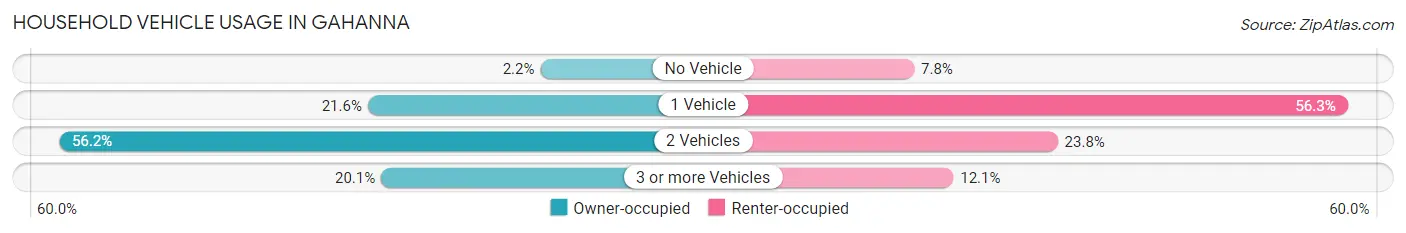
| Vehicles per Household | Owner-occupied | Renter-occupied |
| No Vehicle | 226 (2.2%) | 330 (7.7%) |
| 1 Vehicle | 2,185 (21.6%) | 2,398 (56.3%) |
| 2 Vehicles | 5,691 (56.1%) | 1,015 (23.8%) |
| 3 or more Vehicles | 2,034 (20.1%) | 517 (12.1%) |
| Total | 10,136 (100.0%) | 4,260 (100.0%) |
Real Estate & Mortgages in Gahanna
Real Estate and Mortgage Overview in Gahanna
| Characteristic | Without Mortgage | With Mortgage |
| Housing Units | 2,797 | 7,339 |
| Median Property Value | $274,300 | $308,600 |
| Median Household Income | $100,582 | $2,839 |
| Monthly Housing Costs | $821 | $795 |
| Real Estate Taxes | $5,301 | $49 |
Property Value by Mortgage Status in Gahanna
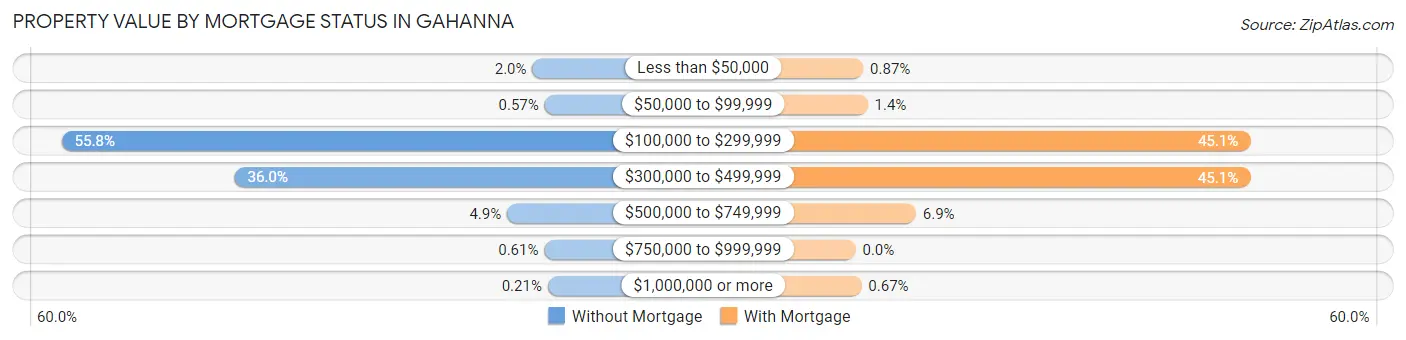
| Property Value | Without Mortgage | With Mortgage |
| Less than $50,000 | 55 (2.0%) | 64 (0.9%) |
| $50,000 to $99,999 | 16 (0.6%) | 101 (1.4%) |
| $100,000 to $299,999 | 1,560 (55.8%) | 3,310 (45.1%) |
| $300,000 to $499,999 | 1,007 (36.0%) | 3,309 (45.1%) |
| $500,000 to $749,999 | 136 (4.9%) | 506 (6.9%) |
| $750,000 to $999,999 | 17 (0.6%) | 0 (0.0%) |
| $1,000,000 or more | 6 (0.2%) | 49 (0.7%) |
| Total | 2,797 (100.0%) | 7,339 (100.0%) |
Household Income by Mortgage Status in Gahanna
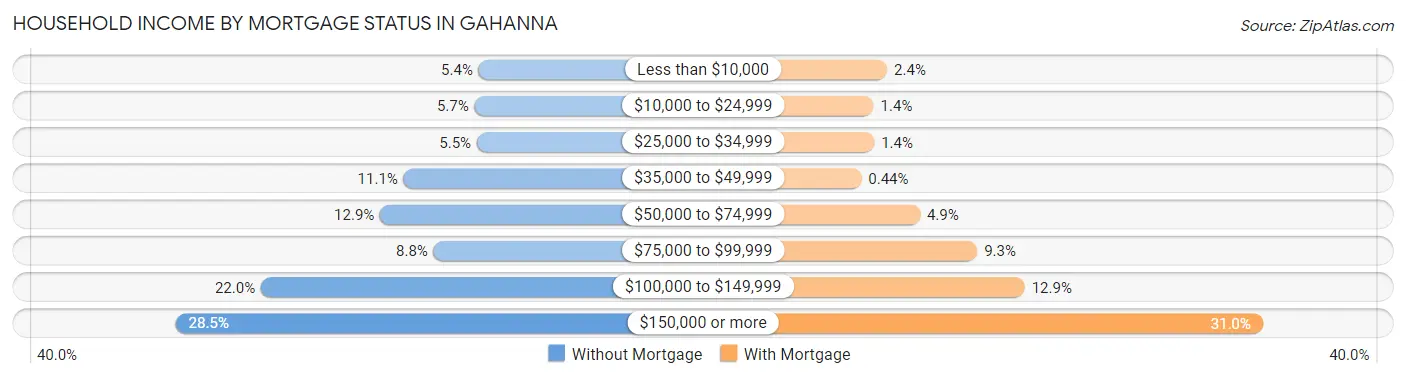
| Household Income | Without Mortgage | With Mortgage |
| Less than $10,000 | 151 (5.4%) | 177 (2.4%) |
| $10,000 to $24,999 | 160 (5.7%) | 101 (1.4%) |
| $25,000 to $34,999 | 155 (5.5%) | 104 (1.4%) |
| $35,000 to $49,999 | 311 (11.1%) | 32 (0.4%) |
| $50,000 to $74,999 | 361 (12.9%) | 360 (4.9%) |
| $75,000 to $99,999 | 247 (8.8%) | 680 (9.3%) |
| $100,000 to $149,999 | 615 (22.0%) | 946 (12.9%) |
| $150,000 or more | 797 (28.5%) | 2,277 (31.0%) |
| Total | 2,797 (100.0%) | 7,339 (100.0%) |
Property Value to Household Income Ratio in Gahanna
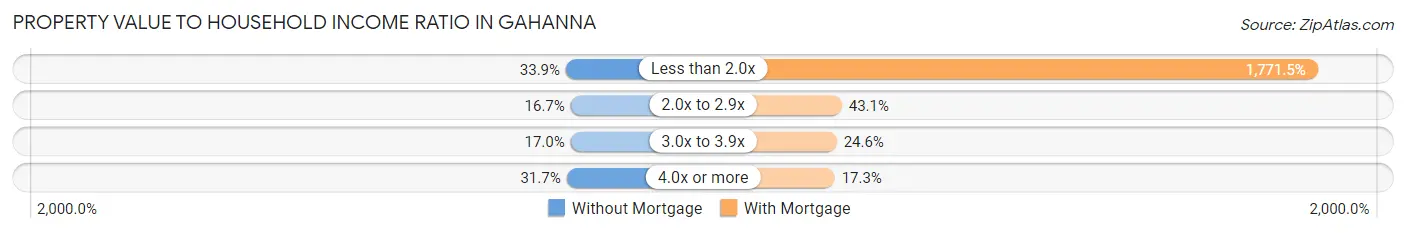
| Value-to-Income Ratio | Without Mortgage | With Mortgage |
| Less than 2.0x | 949 (33.9%) | 130,008 (1,771.5%) |
| 2.0x to 2.9x | 467 (16.7%) | 3,165 (43.1%) |
| 3.0x to 3.9x | 476 (17.0%) | 1,808 (24.6%) |
| 4.0x or more | 886 (31.7%) | 1,272 (17.3%) |
| Total | 2,797 (100.0%) | 7,339 (100.0%) |
Real Estate Taxes by Mortgage Status in Gahanna
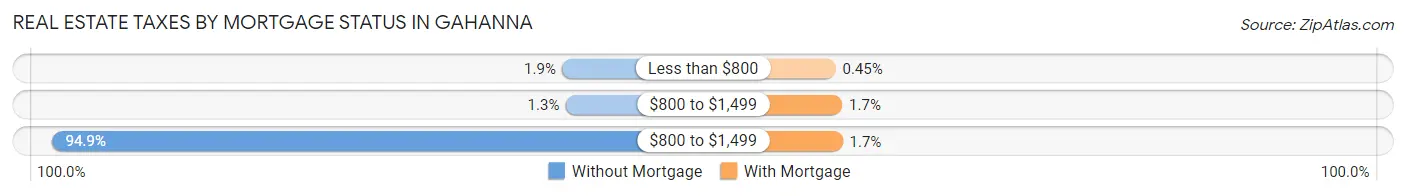
| Property Taxes | Without Mortgage | With Mortgage |
| Less than $800 | 53 (1.9%) | 33 (0.4%) |
| $800 to $1,499 | 35 (1.3%) | 122 (1.7%) |
| $800 to $1,499 | 2,654 (94.9%) | 128 (1.7%) |
| Total | 2,797 (100.0%) | 7,339 (100.0%) |
Health & Disability in Gahanna
Health Insurance Coverage by Age in Gahanna
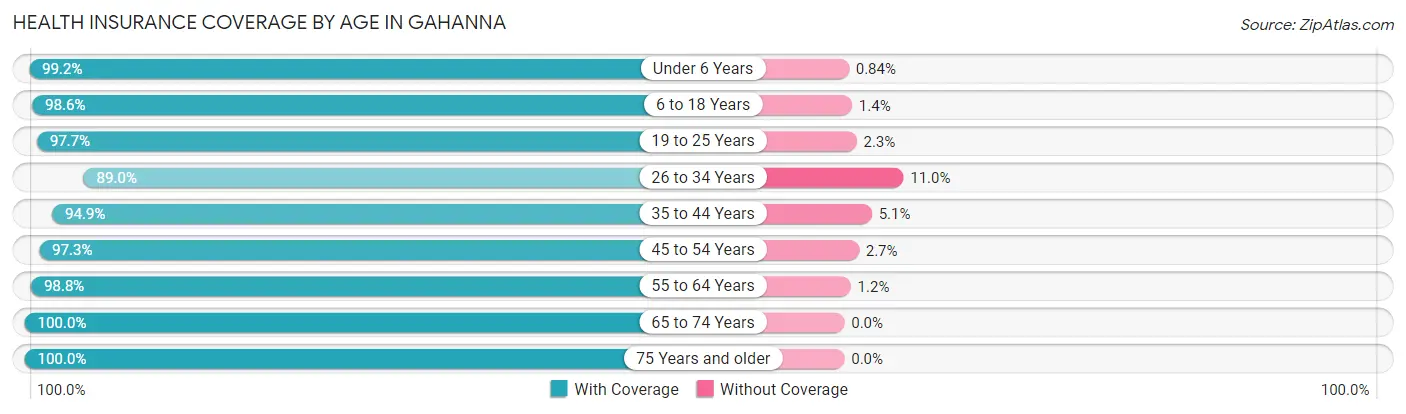
| Age Bracket | With Coverage | Without Coverage |
| Under 6 Years | 2,118 (99.2%) | 18 (0.8%) |
| 6 to 18 Years | 6,865 (98.6%) | 99 (1.4%) |
| 19 to 25 Years | 1,885 (97.7%) | 44 (2.3%) |
| 26 to 34 Years | 4,030 (89.0%) | 498 (11.0%) |
| 35 to 44 Years | 4,684 (94.9%) | 253 (5.1%) |
| 45 to 54 Years | 4,295 (97.3%) | 119 (2.7%) |
| 55 to 64 Years | 4,568 (98.8%) | 55 (1.2%) |
| 65 to 74 Years | 3,647 (100.0%) | 0 (0.0%) |
| 75 Years and older | 1,964 (100.0%) | 0 (0.0%) |
| Total | 34,056 (96.9%) | 1,086 (3.1%) |
Health Insurance Coverage by Citizenship Status in Gahanna
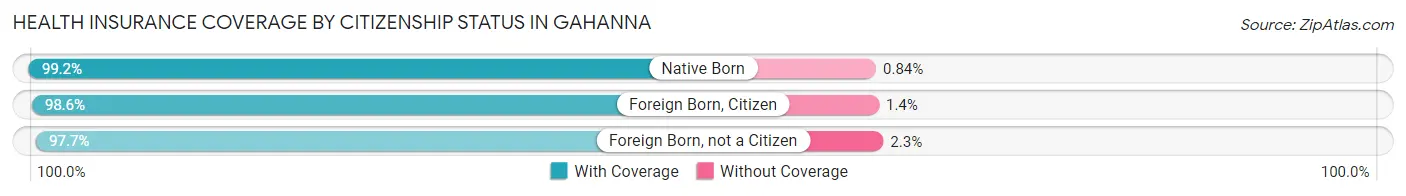
| Citizenship Status | With Coverage | Without Coverage |
| Native Born | 2,118 (99.2%) | 18 (0.8%) |
| Foreign Born, Citizen | 6,865 (98.6%) | 99 (1.4%) |
| Foreign Born, not a Citizen | 1,885 (97.7%) | 44 (2.3%) |
Health Insurance Coverage by Household Income in Gahanna
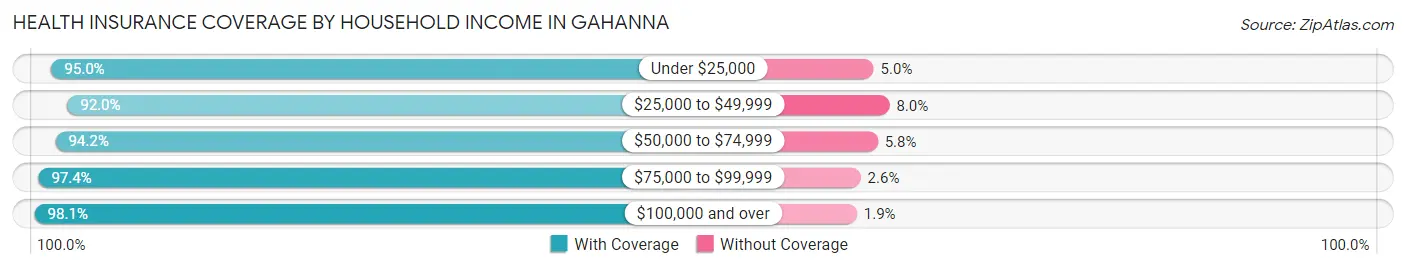
| Household Income | With Coverage | Without Coverage |
| Under $25,000 | 1,812 (95.0%) | 96 (5.0%) |
| $25,000 to $49,999 | 2,565 (92.0%) | 223 (8.0%) |
| $50,000 to $74,999 | 4,020 (94.2%) | 247 (5.8%) |
| $75,000 to $99,999 | 3,637 (97.4%) | 97 (2.6%) |
| $100,000 and over | 22,016 (98.1%) | 423 (1.9%) |
Public vs Private Health Insurance Coverage by Age in Gahanna
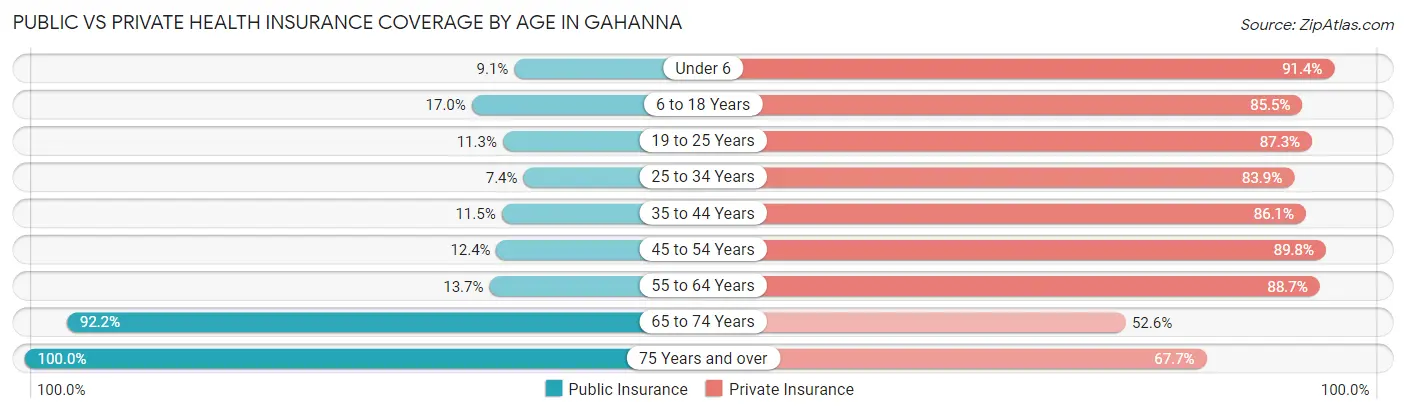
| Age Bracket | Public Insurance | Private Insurance |
| Under 6 | 195 (9.1%) | 1,952 (91.4%) |
| 6 to 18 Years | 1,186 (17.0%) | 5,953 (85.5%) |
| 19 to 25 Years | 217 (11.3%) | 1,683 (87.3%) |
| 25 to 34 Years | 336 (7.4%) | 3,801 (83.9%) |
| 35 to 44 Years | 567 (11.5%) | 4,252 (86.1%) |
| 45 to 54 Years | 548 (12.4%) | 3,965 (89.8%) |
| 55 to 64 Years | 635 (13.7%) | 4,099 (88.7%) |
| 65 to 74 Years | 3,361 (92.2%) | 1,917 (52.6%) |
| 75 Years and over | 1,964 (100.0%) | 1,329 (67.7%) |
| Total | 9,009 (25.6%) | 28,951 (82.4%) |
Disability Status by Sex by Age in Gahanna
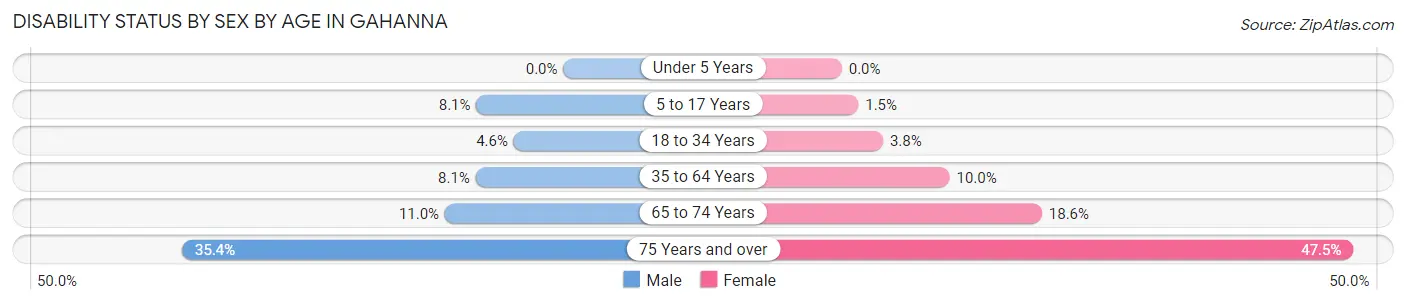
| Age Bracket | Male | Female |
| Under 5 Years | 0 (0.0%) | 0 (0.0%) |
| 5 to 17 Years | 288 (8.1%) | 49 (1.5%) |
| 18 to 34 Years | 159 (4.6%) | 133 (3.8%) |
| 35 to 64 Years | 530 (8.1%) | 746 (10.0%) |
| 65 to 74 Years | 183 (11.0%) | 368 (18.6%) |
| 75 Years and over | 206 (35.4%) | 656 (47.5%) |
Disability Class by Sex by Age in Gahanna
Disability Class: Hearing Difficulty
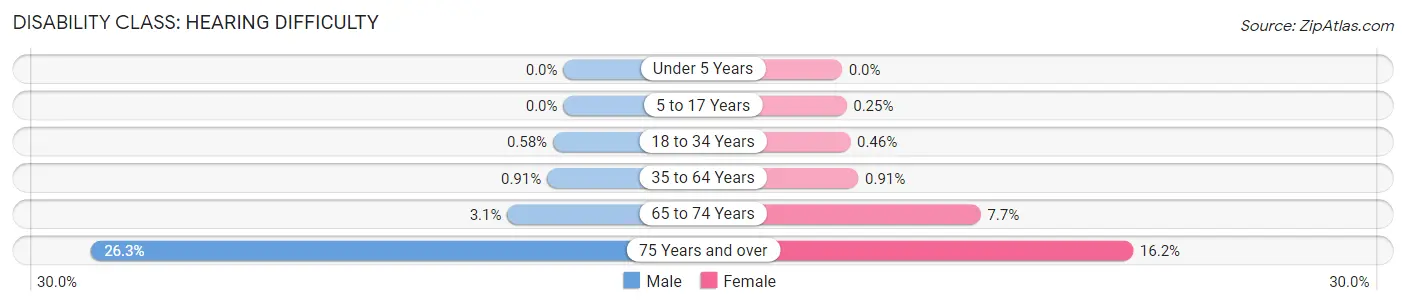
| Age Bracket | Male | Female |
| Under 5 Years | 0 (0.0%) | 0 (0.0%) |
| 5 to 17 Years | 0 (0.0%) | 8 (0.3%) |
| 18 to 34 Years | 20 (0.6%) | 16 (0.5%) |
| 35 to 64 Years | 59 (0.9%) | 68 (0.9%) |
| 65 to 74 Years | 52 (3.1%) | 153 (7.7%) |
| 75 Years and over | 153 (26.3%) | 224 (16.2%) |
Disability Class: Vision Difficulty
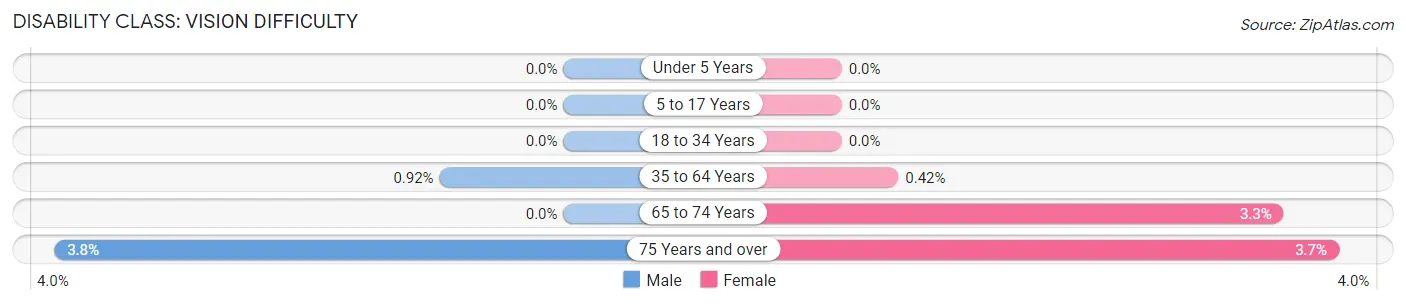
| Age Bracket | Male | Female |
| Under 5 Years | 0 (0.0%) | 0 (0.0%) |
| 5 to 17 Years | 0 (0.0%) | 0 (0.0%) |
| 18 to 34 Years | 0 (0.0%) | 0 (0.0%) |
| 35 to 64 Years | 60 (0.9%) | 31 (0.4%) |
| 65 to 74 Years | 0 (0.0%) | 65 (3.3%) |
| 75 Years and over | 22 (3.8%) | 51 (3.7%) |
Disability Class: Cognitive Difficulty

| Age Bracket | Male | Female |
| 5 to 17 Years | 288 (8.1%) | 41 (1.3%) |
| 18 to 34 Years | 139 (4.0%) | 123 (3.5%) |
| 35 to 64 Years | 378 (5.8%) | 343 (4.6%) |
| 65 to 74 Years | 44 (2.6%) | 15 (0.8%) |
| 75 Years and over | 40 (6.9%) | 221 (16.0%) |
Disability Class: Ambulatory Difficulty
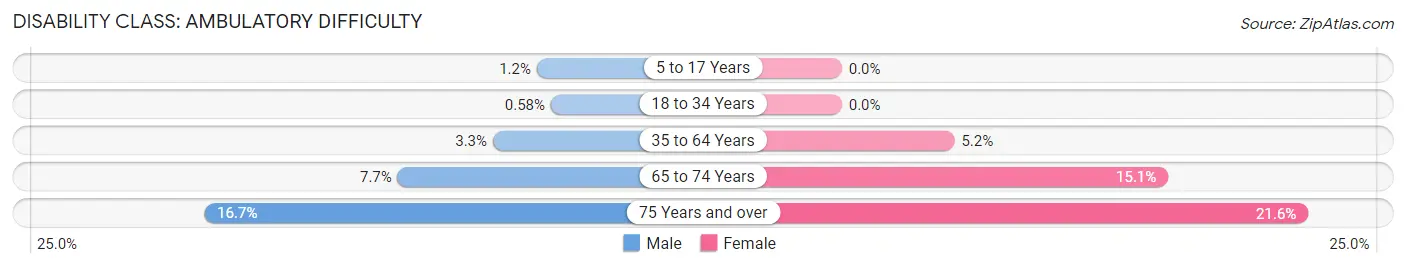
| Age Bracket | Male | Female |
| 5 to 17 Years | 44 (1.2%) | 0 (0.0%) |
| 18 to 34 Years | 20 (0.6%) | 0 (0.0%) |
| 35 to 64 Years | 213 (3.3%) | 390 (5.2%) |
| 65 to 74 Years | 128 (7.7%) | 300 (15.1%) |
| 75 Years and over | 97 (16.7%) | 299 (21.6%) |
Disability Class: Self-Care Difficulty
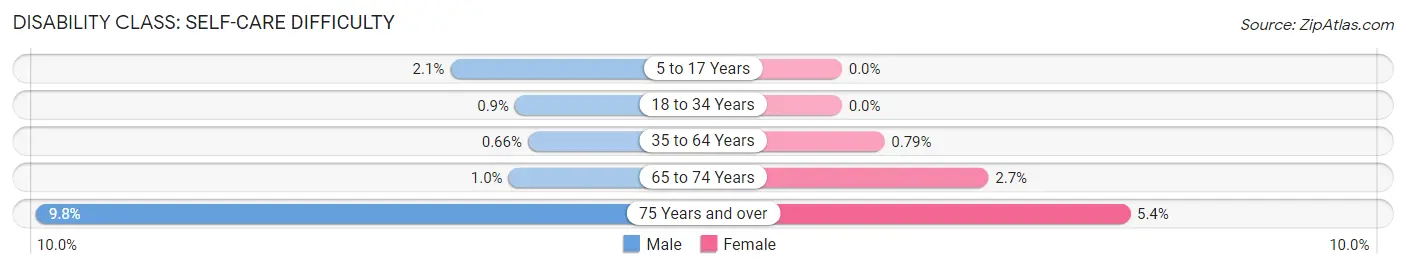
| Age Bracket | Male | Female |
| 5 to 17 Years | 75 (2.1%) | 0 (0.0%) |
| 18 to 34 Years | 31 (0.9%) | 0 (0.0%) |
| 35 to 64 Years | 43 (0.7%) | 59 (0.8%) |
| 65 to 74 Years | 17 (1.0%) | 54 (2.7%) |
| 75 Years and over | 57 (9.8%) | 74 (5.3%) |
Technology Access in Gahanna
Computing Device Access in Gahanna
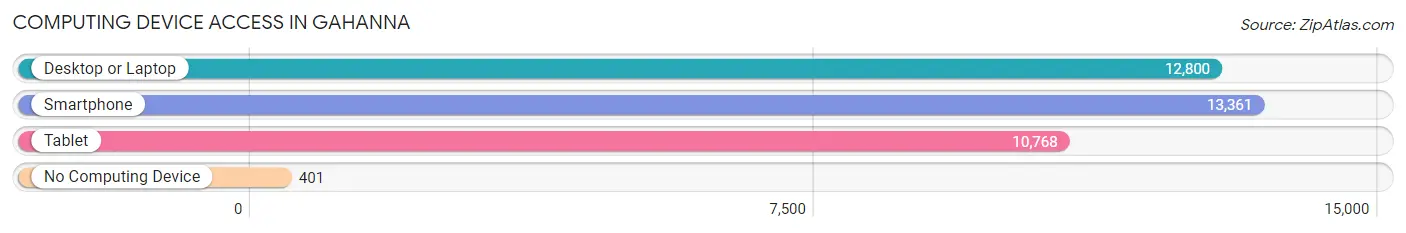
| Device Type | # Households | % Households |
| Desktop or Laptop | 12,800 | 88.9% |
| Smartphone | 13,361 | 92.8% |
| Tablet | 10,768 | 74.8% |
| No Computing Device | 401 | 2.8% |
| Total | 14,396 | 100.0% |
Internet Access in Gahanna
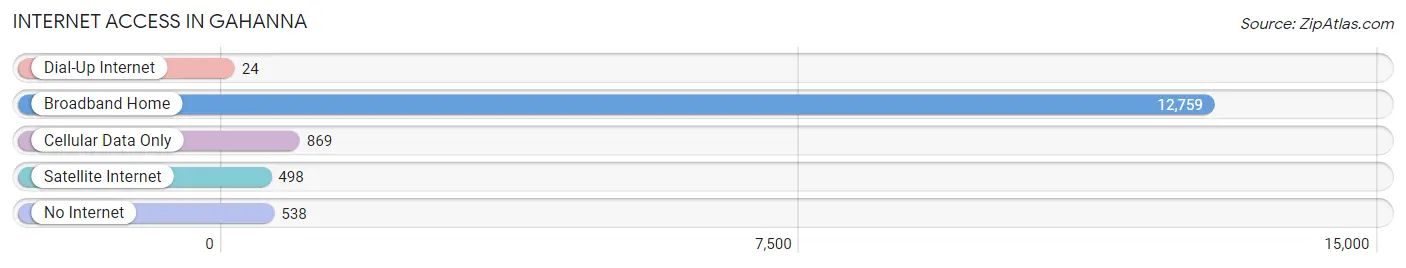
| Internet Type | # Households | % Households |
| Dial-Up Internet | 24 | 0.2% |
| Broadband Home | 12,759 | 88.6% |
| Cellular Data Only | 869 | 6.0% |
| Satellite Internet | 498 | 3.5% |
| No Internet | 538 | 3.7% |
| Total | 14,396 | 100.0% |
Gahanna Summary
Gahanna, Ohio is a city located in Franklin County, Ohio, United States. It is a suburb of Columbus, the state capital, and is located just east of the city. The population was 33,248 at the 2010 census. Gahanna is a part of the Columbus Metropolitan Statistical Area.
History
Gahanna was founded in 1849 by John Clark, a settler from Virginia. The city was originally known as "Bridgeport" due to the presence of a bridge over the Big Walnut Creek. The name was changed to Gahanna in 1881, derived from a Native American word meaning "three creeks".
The city was incorporated in 1881 and has grown steadily since then. In the early 20th century, Gahanna was a popular destination for tourists, with many resorts and hotels located in the area. The city was also home to a large amusement park, which closed in the 1950s.
Geography
Gahanna is located at 40°04′N 82°54′W (40.07, -82.90). According to the United States Census Bureau, the city has a total area of 16.2 square miles (41.9 km2), of which 16.1 square miles (41.7 km2) is land and 0.1 square miles (0.2 km2) is water.
The city is located in the central part of Franklin County, just east of Columbus. It is bordered by the cities of New Albany to the north, Reynoldsburg to the east, and Whitehall to the south.
Economy
Gahanna is home to a variety of businesses, including manufacturing, retail, and service industries. The city is also home to several corporate headquarters, including Nationwide Insurance, Honda of America, and Abercrombie & Fitch.
Gahanna is also home to a number of shopping centers, including Easton Town Center, a large outdoor shopping mall. The city is also home to a number of parks and recreational facilities, including the Gahanna Municipal Golf Course.
Demographics
As of the 2010 census, there were 33,248 people, 13,845 households, and 8,845 families residing in the city. The population density was 2,053.3 people per square mile (793.2/km2). There were 14,845 housing units at an average density of 919.2 per square mile (354.3/km2). The racial makeup of the city was 79.2% White, 11.3% African American, 0.3% Native American, 3.2% Asian, 0.1% Pacific Islander, 2.3% from other races, and 3.7% from two or more races. Hispanic or Latino of any race were 5.2% of the population.
There were 13,845 households, out of which 32.2% had children under the age of 18 living with them, 48.2% were married couples living together, 12.7% had a female householder with no husband present, and 34.3% were non-families. 28.2% of all households were made up of individuals, and 8.2% had someone living alone who was 65 years of age or older. The average household size was 2.41 and the average family size was 2.97.
In the city, the population was spread out, with 24.7% under the age of 18, 8.2% from 18 to 24, 30.2% from 25 to 44, 24.3% from 45 to 64, and 12.6% who were 65 years of age or older. The median age was 36 years. For every 100 females, there were 93.2 males. For every 100 females age 18 and over, there were 89.7 males.
The median income for a household in the city was $54,945, and the median income for a family was $67,845. Males had a median income of $45,945 versus $35,945 for females. The per capita income for the city was $27,945. About 4.2% of families and 6.2% of the population were below the poverty line, including 8.2% of those under age 18 and 5.2% of those age 65 or over.
Common Questions
What is the Total Population of Gahanna?
Total Population of Gahanna is 35,529.
What is the Total Male Population of Gahanna?
Total Male Population of Gahanna is 17,082.
What is the Total Female Population of Gahanna?
Total Female Population of Gahanna is 18,447.
What is the Ratio of Males per 100 Females in Gahanna?
There are 92.60 Males per 100 Females in Gahanna.
What is the Ratio of Females per 100 Males in Gahanna?
There are 107.99 Females per 100 Males in Gahanna.
What is the Median Population Age in Gahanna?
Median Population Age in Gahanna is 39.1 Years.
What is the Average Family Size in Gahanna
Average Family Size in Gahanna is 3.0 People.
What is the Average Household Size in Gahanna
Average Household Size in Gahanna is 2.5 People.
What is Per Capita Income in Gahanna?
Per Capita income in Gahanna is $50,762.
What is the Median Family Income in Gahanna?
Median Family Income in Gahanna is $124,510.
What is the Median Household income in Gahanna?
Median Household Income in Gahanna is $104,555.
What is Income or Wage Gap in Gahanna?
Income or Wage Gap in Gahanna is 1.9%.
Women in Gahanna earn 98.1 cents for every dollar earned by a man.
What is Inequality or Gini Index in Gahanna?
Inequality or Gini Index in Gahanna is 0.41.
How Large is the Labor Force in Gahanna?
There are 19,631 People in the Labor Forcein in Gahanna.
What is the Percentage of People in the Labor Force in Gahanna?
69.8% of People are in the Labor Force in Gahanna.
What is the Unemployment Rate in Gahanna?
Unemployment Rate in Gahanna is 2.2%.