Riverside, OH
Riverside Map
Riverside Overview
24,482
TOTAL POPULATION
12,069
MALE POPULATION
12,413
FEMALE POPULATION
97.23
MALES / 100 FEMALES
102.85
FEMALES / 100 MALES
34.7
MEDIAN AGE
2.9
AVG FAMILY SIZE
2.3
AVG HOUSEHOLD SIZE
$30,853
PER CAPITA INCOME
$71,414
AVG FAMILY INCOME
$56,232
AVG HOUSEHOLD INCOME
40.5%
WAGE / INCOME GAP [ % ]
59.5¢/ $1
WAGE / INCOME GAP [ $ ]
0.40
INEQUALITY / GINI INDEX
12,831
LABOR FORCE [ PEOPLE ]
66.5%
PERCENT IN LABOR FORCE
4.1%
UNEMPLOYMENT RATE
Riverside Area Codes
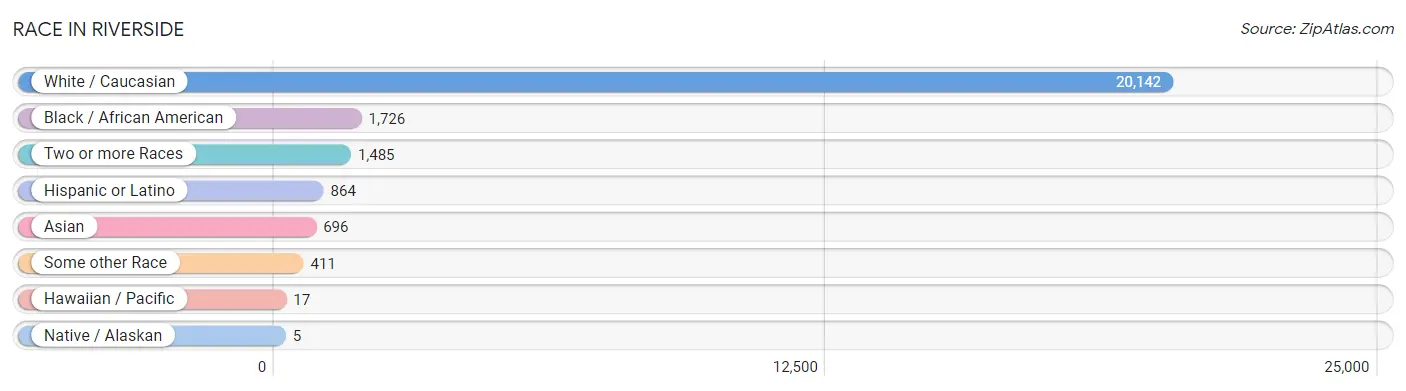
Race in Riverside
The most populous races in Riverside are White / Caucasian (20,142 | 82.3%), Black / African American (1,726 | 7.0%), and Two or more Races (1,485 | 6.1%).
| Race | # Population | % Population |
| Asian | 696 | 2.8% |
| Black / African American | 1,726 | 7.0% |
| Hawaiian / Pacific | 17 | 0.1% |
| Hispanic or Latino | 864 | 3.5% |
| Native / Alaskan | 5 | 0.0% |
| White / Caucasian | 20,142 | 82.3% |
| Two or more Races | 1,485 | 6.1% |
| Some other Race | 411 | 1.7% |
| Total | 24,482 | 100.0% |
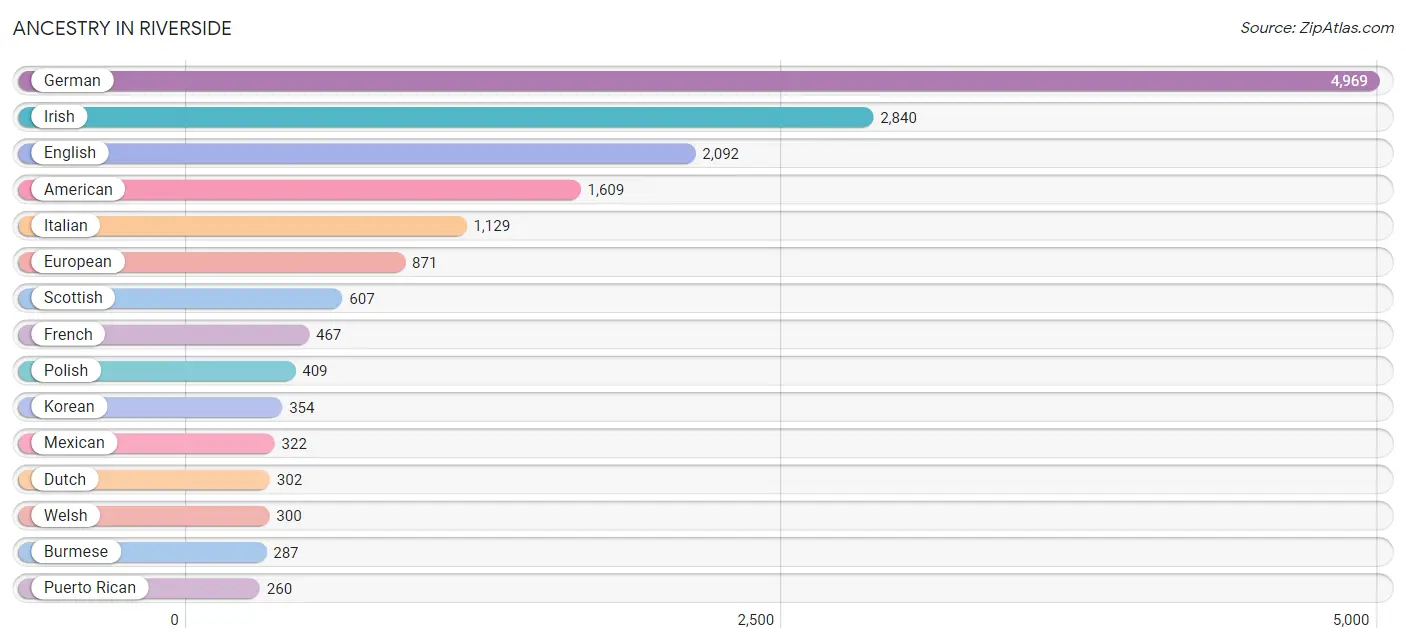
Ancestry in Riverside
The most populous ancestries reported in Riverside are German (4,969 | 20.3%), Irish (2,840 | 11.6%), English (2,092 | 8.6%), American (1,609 | 6.6%), and Italian (1,129 | 4.6%), together accounting for 51.6% of all Riverside residents.
| Ancestry | # Population | % Population |
| African | 39 | 0.2% |
| American | 1,609 | 6.6% |
| Arab | 87 | 0.4% |
| Armenian | 13 | 0.1% |
| Austrian | 38 | 0.2% |
| Belgian | 15 | 0.1% |
| Bhutanese | 111 | 0.4% |
| Blackfeet | 50 | 0.2% |
| British | 173 | 0.7% |
| British West Indian | 2 | 0.0% |
| Burmese | 287 | 1.2% |
| Canadian | 41 | 0.2% |
| Celtic | 21 | 0.1% |
| Central American | 141 | 0.6% |
| Cherokee | 129 | 0.5% |
| Colombian | 20 | 0.1% |
| Croatian | 46 | 0.2% |
| Czech | 18 | 0.1% |
| Danish | 32 | 0.1% |
| Dominican | 29 | 0.1% |
| Dutch | 302 | 1.2% |
| Eastern European | 68 | 0.3% |
| Ecuadorian | 32 | 0.1% |
| English | 2,092 | 8.6% |
| European | 871 | 3.6% |
| French | 467 | 1.9% |
| French Canadian | 26 | 0.1% |
| German | 4,969 | 20.3% |
| Greek | 174 | 0.7% |
| Guamanian / Chamorro | 16 | 0.1% |
| Haitian | 34 | 0.1% |
| Honduran | 16 | 0.1% |
| Hungarian | 115 | 0.5% |
| Indian (Asian) | 57 | 0.2% |
| Inupiat | 5 | 0.0% |
| Iraqi | 42 | 0.2% |
| Irish | 2,840 | 11.6% |
| Italian | 1,129 | 4.6% |
| Jamaican | 14 | 0.1% |
| Japanese | 25 | 0.1% |
| Korean | 354 | 1.5% |
| Laotian | 23 | 0.1% |
| Lebanese | 9 | 0.0% |
| Lithuanian | 15 | 0.1% |
| Malaysian | 29 | 0.1% |
| Mexican | 322 | 1.3% |
| Native Hawaiian | 2 | 0.0% |
| Nicaraguan | 33 | 0.1% |
| Nigerian | 10 | 0.0% |
| Norwegian | 45 | 0.2% |
| Polish | 409 | 1.7% |
| Portuguese | 8 | 0.0% |
| Puerto Rican | 260 | 1.1% |
| Romanian | 8 | 0.0% |
| Salvadoran | 92 | 0.4% |
| Samoan | 16 | 0.1% |
| Scandinavian | 76 | 0.3% |
| Scotch-Irish | 229 | 0.9% |
| Scottish | 607 | 2.5% |
| Slovak | 23 | 0.1% |
| South American | 52 | 0.2% |
| Sri Lankan | 128 | 0.5% |
| Subsaharan African | 185 | 0.8% |
| Swedish | 189 | 0.8% |
| Swiss | 15 | 0.1% |
| Syrian | 7 | 0.0% |
| Thai | 57 | 0.2% |
| Ukrainian | 19 | 0.1% |
| Welsh | 300 | 1.2% | View All 69 Rows |
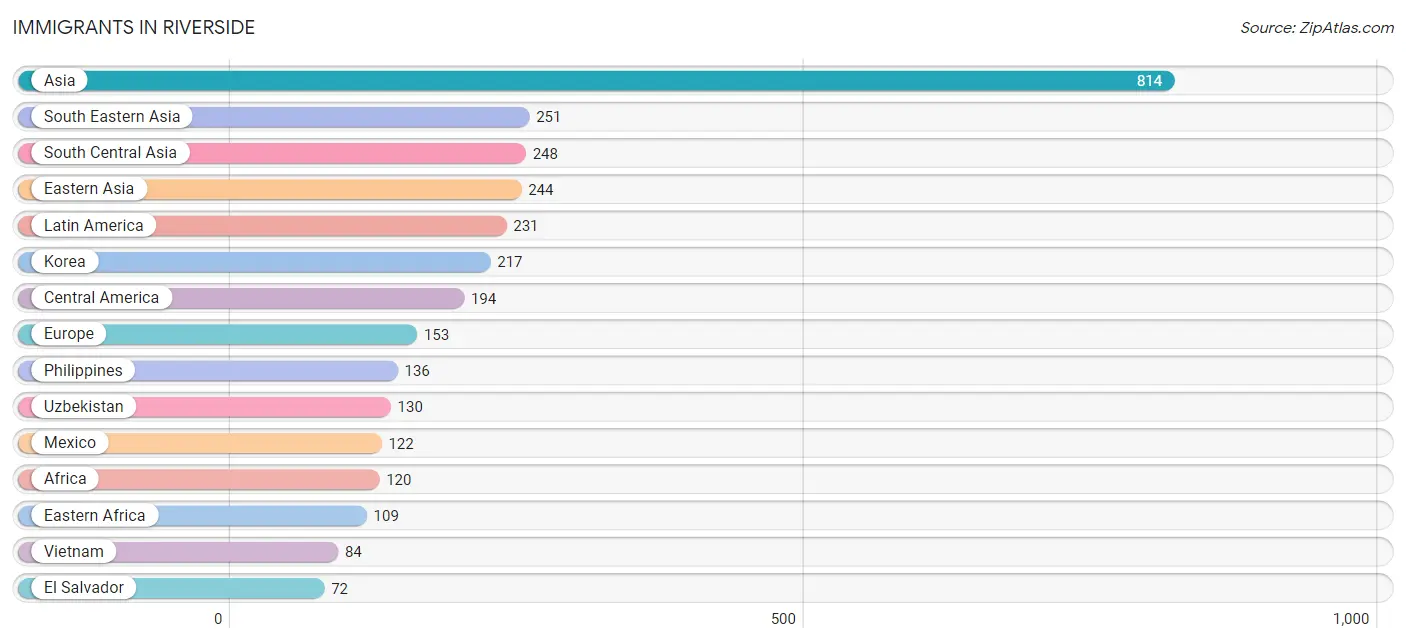
Immigrants in Riverside
The most numerous immigrant groups reported in Riverside came from Asia (814 | 3.3%), South Eastern Asia (251 | 1.0%), South Central Asia (248 | 1.0%), Eastern Asia (244 | 1.0%), and Latin America (231 | 0.9%), together accounting for 7.3% of all Riverside residents.
| Immigration Origin | # Population | % Population |
| Africa | 120 | 0.5% |
| Asia | 814 | 3.3% |
| Cambodia | 25 | 0.1% |
| Canada | 10 | 0.0% |
| Caribbean | 17 | 0.1% |
| Central America | 194 | 0.8% |
| China | 2 | 0.0% |
| Colombia | 20 | 0.1% |
| Eastern Africa | 109 | 0.4% |
| Eastern Asia | 244 | 1.0% |
| Eastern Europe | 47 | 0.2% |
| El Salvador | 72 | 0.3% |
| England | 18 | 0.1% |
| Europe | 153 | 0.6% |
| Germany | 59 | 0.2% |
| India | 41 | 0.2% |
| Indonesia | 6 | 0.0% |
| Iraq | 42 | 0.2% |
| Ireland | 19 | 0.1% |
| Jamaica | 12 | 0.1% |
| Japan | 25 | 0.1% |
| Korea | 217 | 0.9% |
| Kuwait | 20 | 0.1% |
| Latin America | 231 | 0.9% |
| Mexico | 122 | 0.5% |
| Nigeria | 11 | 0.0% |
| Northern Europe | 47 | 0.2% |
| Philippines | 136 | 0.6% |
| Russia | 41 | 0.2% |
| Saudi Arabia | 9 | 0.0% |
| South America | 20 | 0.1% |
| South Central Asia | 248 | 1.0% |
| South Eastern Asia | 251 | 1.0% |
| Uzbekistan | 130 | 0.5% |
| Vietnam | 84 | 0.3% |
| Western Africa | 11 | 0.0% |
| Western Asia | 71 | 0.3% |
| Western Europe | 59 | 0.2% | View All 38 Rows |
Sex and Age in Riverside
Sex and Age in Riverside
The most populous age groups in Riverside are Under 5 Years (1,237 | 10.2%) for men and 60 to 64 Years (1,131 | 9.1%) for women.
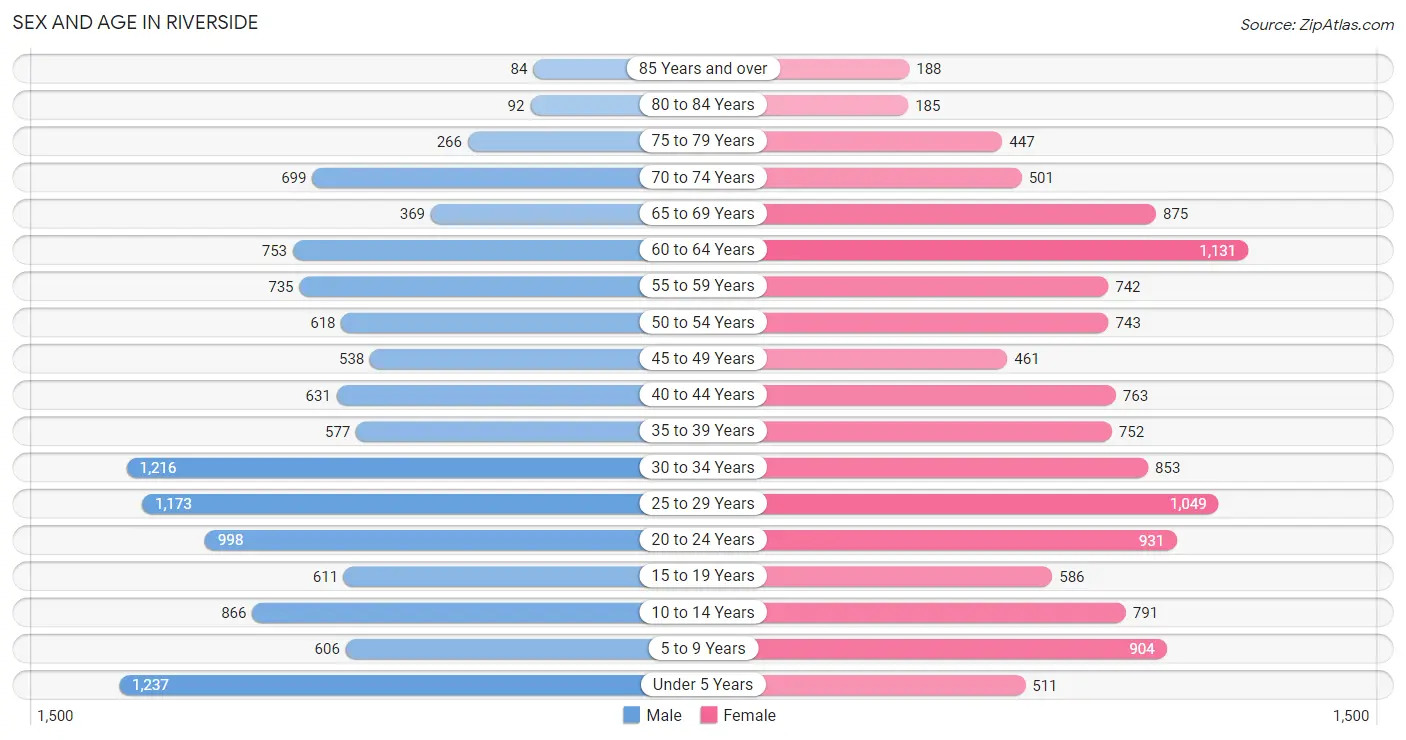
| Age Bracket | Male | Female |
| Under 5 Years | 1,237 (10.2%) | 511 (4.1%) |
| 5 to 9 Years | 606 (5.0%) | 904 (7.3%) |
| 10 to 14 Years | 866 (7.2%) | 791 (6.4%) |
| 15 to 19 Years | 611 (5.1%) | 586 (4.7%) |
| 20 to 24 Years | 998 (8.3%) | 931 (7.5%) |
| 25 to 29 Years | 1,173 (9.7%) | 1,049 (8.5%) |
| 30 to 34 Years | 1,216 (10.1%) | 853 (6.9%) |
| 35 to 39 Years | 577 (4.8%) | 752 (6.1%) |
| 40 to 44 Years | 631 (5.2%) | 763 (6.1%) |
| 45 to 49 Years | 538 (4.5%) | 461 (3.7%) |
| 50 to 54 Years | 618 (5.1%) | 743 (6.0%) |
| 55 to 59 Years | 735 (6.1%) | 742 (6.0%) |
| 60 to 64 Years | 753 (6.2%) | 1,131 (9.1%) |
| 65 to 69 Years | 369 (3.1%) | 875 (7.0%) |
| 70 to 74 Years | 699 (5.8%) | 501 (4.0%) |
| 75 to 79 Years | 266 (2.2%) | 447 (3.6%) |
| 80 to 84 Years | 92 (0.8%) | 185 (1.5%) |
| 85 Years and over | 84 (0.7%) | 188 (1.5%) |
| Total | 12,069 (100.0%) | 12,413 (100.0%) |
Families and Households in Riverside
Median Family Size in Riverside
The median family size in Riverside is 2.93 persons per family, with single female/mother families (1,689 | 28.0%) accounting for the largest median family size of 3.06 persons per family. On the other hand, single male/father families (286 | 4.7%) represent the smallest median family size with 2.47 persons per family.
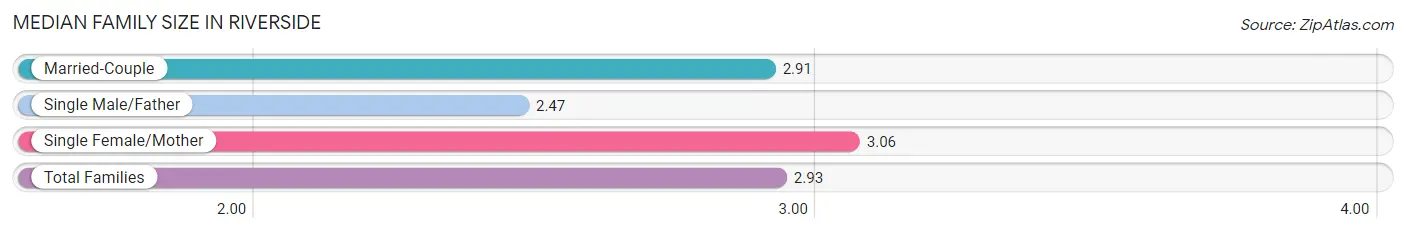
| Family Type | # Families | Family Size |
| Married-Couple | 4,063 (67.3%) | 2.91 |
| Single Male/Father | 286 (4.7%) | 2.47 |
| Single Female/Mother | 1,689 (28.0%) | 3.06 |
| Total Families | 6,038 (100.0%) | 2.93 |
Median Household Size in Riverside
The median household size in Riverside is 2.26 persons per household, with single female/mother households (1,689 | 15.6%) accounting for the largest median household size of 3.24 persons per household. non-family households (4,782 | 44.2%) represent the smallest median household size with 1.28 persons per household.
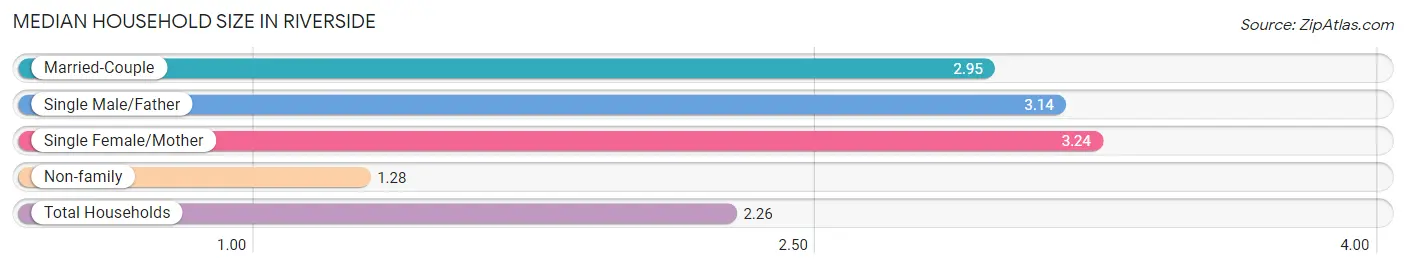
| Household Type | # Households | Household Size |
| Married-Couple | 4,063 (37.6%) | 2.95 |
| Single Male/Father | 286 (2.6%) | 3.14 |
| Single Female/Mother | 1,689 (15.6%) | 3.24 |
| Non-family | 4,782 (44.2%) | 1.28 |
| Total Households | 10,820 (100.0%) | 2.26 |
Household Size by Marriage Status in Riverside
Out of a total of 10,820 households in Riverside, 6,038 (55.8%) are family households, while 4,782 (44.2%) are nonfamily households. The most numerous type of family households are 2-person households, comprising 2,861, and the most common type of nonfamily households are 1-person households, comprising 3,705.
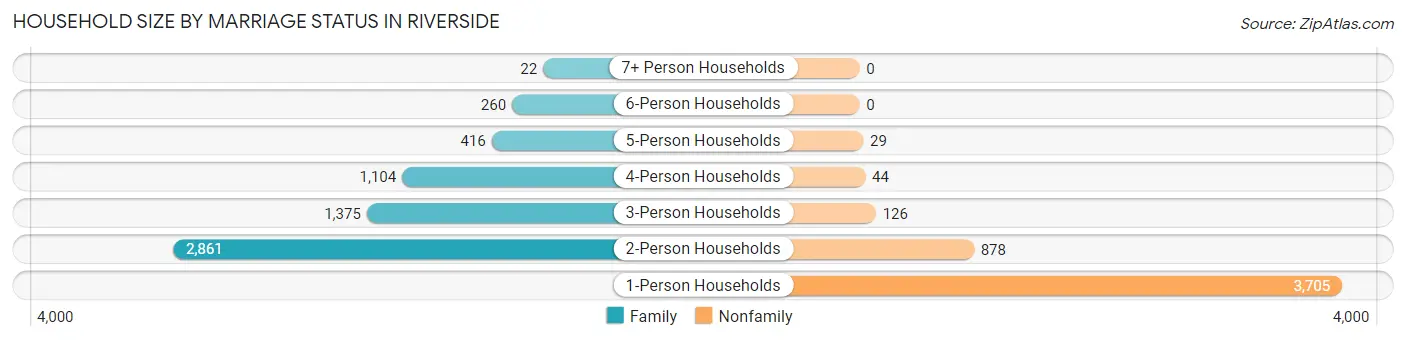
| Household Size | Family Households | Nonfamily Households |
| 1-Person Households | - | 3,705 (34.2%) |
| 2-Person Households | 2,861 (26.4%) | 878 (8.1%) |
| 3-Person Households | 1,375 (12.7%) | 126 (1.2%) |
| 4-Person Households | 1,104 (10.2%) | 44 (0.4%) |
| 5-Person Households | 416 (3.8%) | 29 (0.3%) |
| 6-Person Households | 260 (2.4%) | 0 (0.0%) |
| 7+ Person Households | 22 (0.2%) | 0 (0.0%) |
| Total | 6,038 (55.8%) | 4,782 (44.2%) |
Female Fertility in Riverside
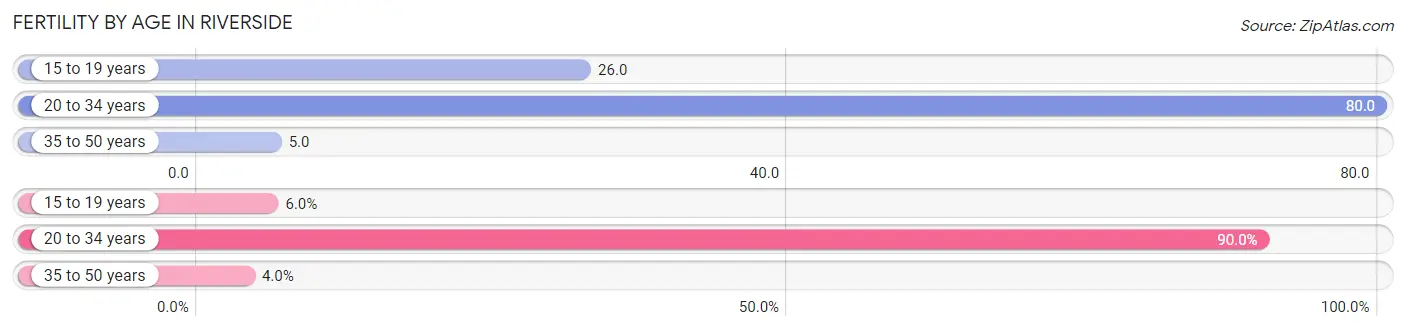
Fertility by Age in Riverside
Average fertility rate in Riverside is 45.0 births per 1,000 women. Women in the age bracket of 20 to 34 years have the highest fertility rate with 80.0 births per 1,000 women. Women in the age bracket of 20 to 34 years acount for 90.0% of all women with births.
| Age Bracket | Women with Births | Births / 1,000 Women |
| 15 to 19 years | 15 (6.0%) | 26.0 |
| 20 to 34 years | 226 (90.0%) | 80.0 |
| 35 to 50 years | 10 (4.0%) | 5.0 |
| Total | 251 (100.0%) | 45.0 |
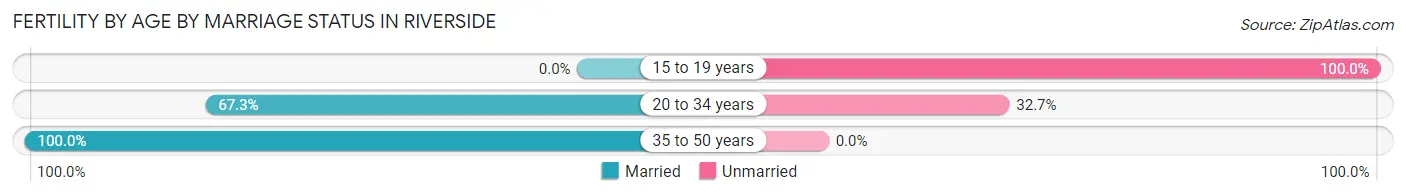
Fertility by Age by Marriage Status in Riverside
64.5% of women with births (251) in Riverside are married. The highest percentage of unmarried women with births falls into 15 to 19 years age bracket with 100.0% of them unmarried at the time of birth, while the lowest percentage of unmarried women with births belong to 35 to 50 years age bracket with 0.0% of them unmarried.
| Age Bracket | Married | Unmarried |
| 15 to 19 years | 0 (0.0%) | 15 (100.0%) |
| 20 to 34 years | 152 (67.3%) | 74 (32.7%) |
| 35 to 50 years | 10 (100.0%) | 0 (0.0%) |
| Total | 162 (64.5%) | 89 (35.5%) |
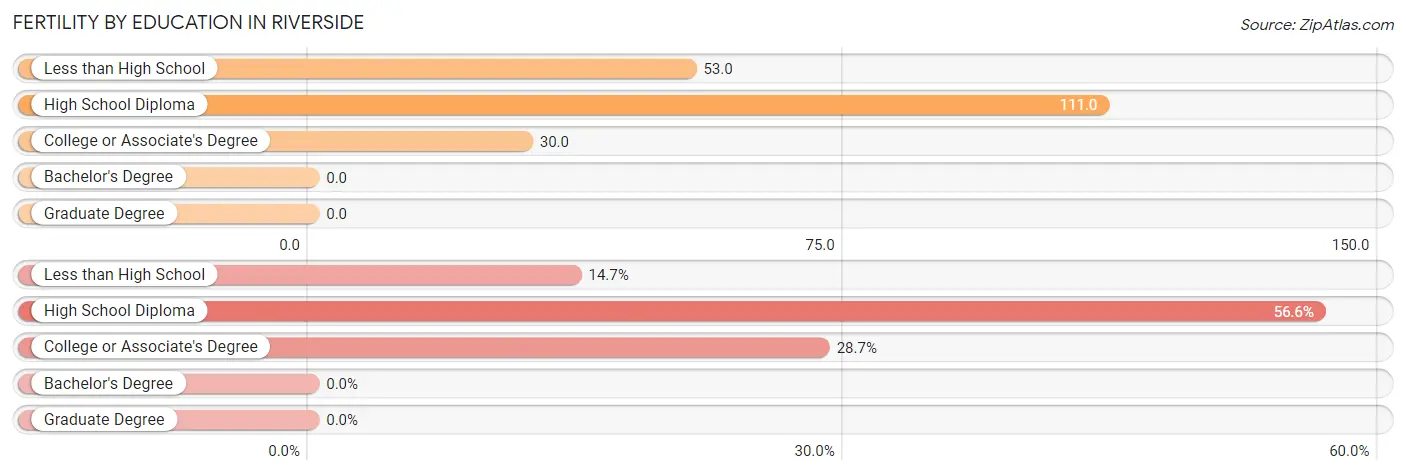
Fertility by Education in Riverside
| Educational Attainment | Women with Births | Births / 1,000 Women |
| Less than High School | 37 (14.7%) | 53.0 |
| High School Diploma | 142 (56.6%) | 111.0 |
| College or Associate's Degree | 72 (28.7%) | 30.0 |
| Bachelor's Degree | 0 (0.0%) | 0.0 |
| Graduate Degree | 0 (0.0%) | 0.0 |
| Total | 251 (100.0%) | 45.0 |
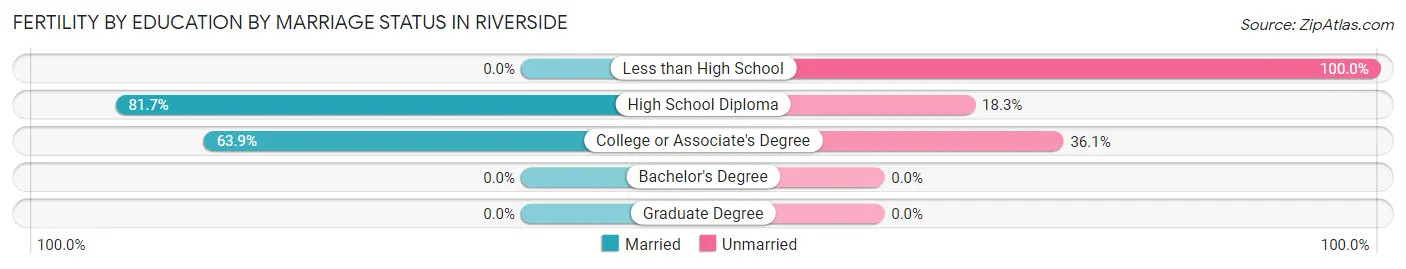
Fertility by Education by Marriage Status in Riverside
35.5% of women with births in Riverside are unmarried. Women with the educational attainment of high school diploma are most likely to be married with 81.7% of them married at childbirth, while women with the educational attainment of less than high school are least likely to be married with 100.0% of them unmarried at childbirth.
| Educational Attainment | Married | Unmarried |
| Less than High School | 0 (0.0%) | 37 (100.0%) |
| High School Diploma | 116 (81.7%) | 26 (18.3%) |
| College or Associate's Degree | 46 (63.9%) | 26 (36.1%) |
| Bachelor's Degree | 0 (0.0%) | 0 (0.0%) |
| Graduate Degree | 0 (0.0%) | 0 (0.0%) |
| Total | 162 (64.5%) | 89 (35.5%) |
Income in Riverside
Income Overview in Riverside
Per Capita Income in Riverside is $30,853, while median incomes of families and households are $71,414 and $56,232 respectively.
| Characteristic | Number | Measure |
| Per Capita Income | 24,482 | $30,853 |
| Median Family Income | 6,038 | $71,414 |
| Mean Family Income | 6,038 | $84,393 |
| Median Household Income | 10,820 | $56,232 |
| Mean Household Income | 10,820 | $69,614 |
| Income Deficit | 6,038 | $0 |
| Wage / Income Gap (%) | 24,482 | 40.49% |
| Wage / Income Gap ($) | 24,482 | 59.51¢ per $1 |
| Gini / Inequality Index | 24,482 | 0.40 |
Earnings by Sex in Riverside
Average Earnings in Riverside are $37,840, $46,547 for men and $27,698 for women, a difference of 40.5%.
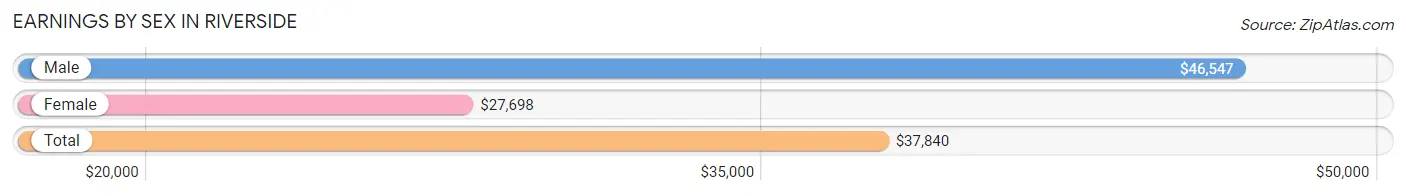
| Sex | Number | Average Earnings |
| Male | 6,947 (52.8%) | $46,547 |
| Female | 6,202 (47.2%) | $27,698 |
| Total | 13,149 (100.0%) | $37,840 |
Earnings by Sex by Income Bracket in Riverside
The most common earnings brackets in Riverside are $75,000 to $99,999 for men (956 | 13.8%) and $25,000 to $29,999 for women (567 | 9.1%).
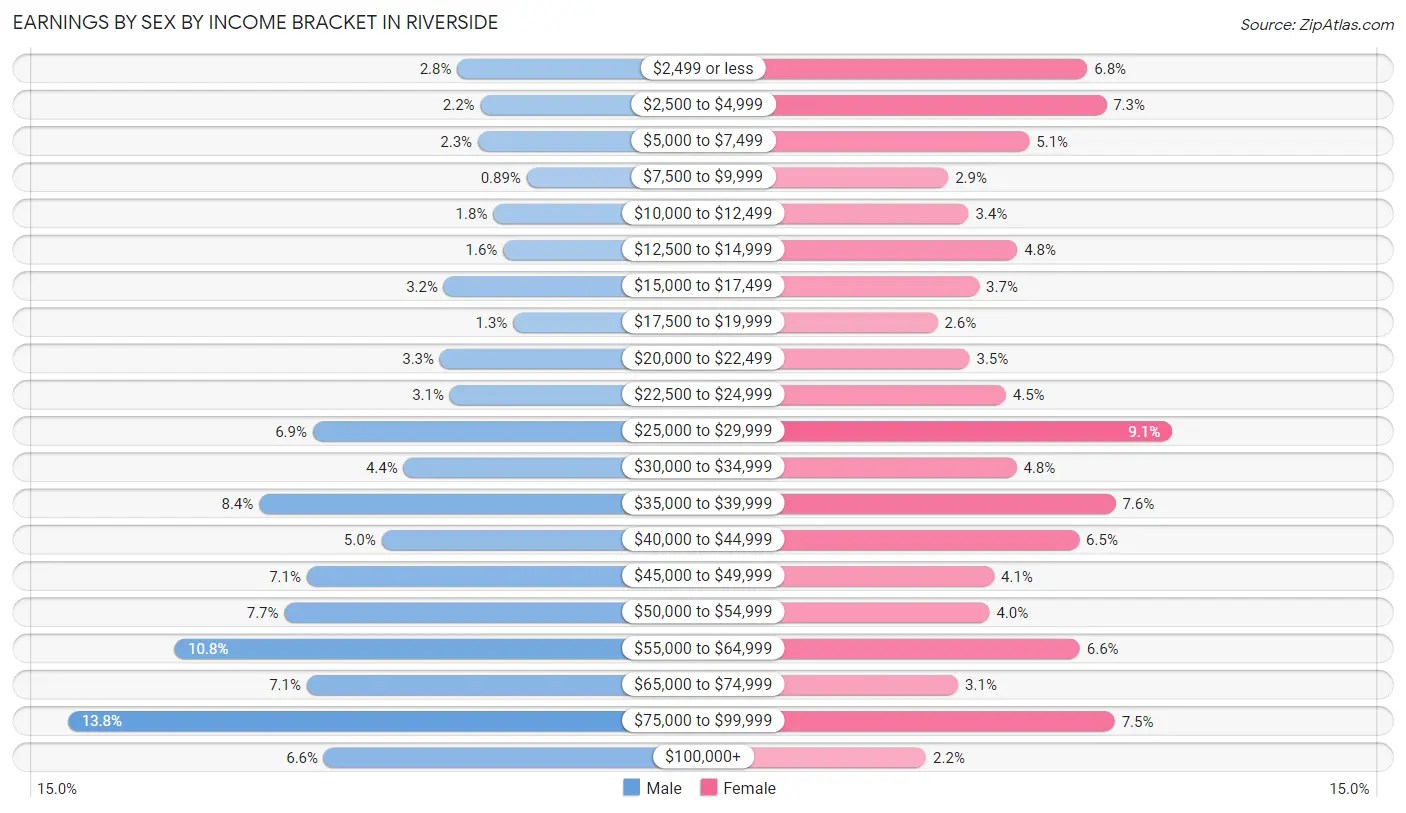
| Income | Male | Female |
| $2,499 or less | 197 (2.8%) | 419 (6.8%) |
| $2,500 to $4,999 | 152 (2.2%) | 452 (7.3%) |
| $5,000 to $7,499 | 157 (2.3%) | 318 (5.1%) |
| $7,500 to $9,999 | 62 (0.9%) | 177 (2.9%) |
| $10,000 to $12,499 | 127 (1.8%) | 212 (3.4%) |
| $12,500 to $14,999 | 108 (1.5%) | 297 (4.8%) |
| $15,000 to $17,499 | 224 (3.2%) | 231 (3.7%) |
| $17,500 to $19,999 | 88 (1.3%) | 158 (2.5%) |
| $20,000 to $22,499 | 231 (3.3%) | 214 (3.5%) |
| $22,500 to $24,999 | 212 (3.0%) | 277 (4.5%) |
| $25,000 to $29,999 | 479 (6.9%) | 567 (9.1%) |
| $30,000 to $34,999 | 302 (4.3%) | 296 (4.8%) |
| $35,000 to $39,999 | 584 (8.4%) | 468 (7.5%) |
| $40,000 to $44,999 | 345 (5.0%) | 405 (6.5%) |
| $45,000 to $49,999 | 491 (7.1%) | 257 (4.1%) |
| $50,000 to $54,999 | 535 (7.7%) | 249 (4.0%) |
| $55,000 to $64,999 | 748 (10.8%) | 406 (6.6%) |
| $65,000 to $74,999 | 491 (7.1%) | 194 (3.1%) |
| $75,000 to $99,999 | 956 (13.8%) | 467 (7.5%) |
| $100,000+ | 458 (6.6%) | 138 (2.2%) |
| Total | 6,947 (100.0%) | 6,202 (100.0%) |
Earnings by Sex by Educational Attainment in Riverside
Average earnings in Riverside are $50,980 for men and $33,679 for women, a difference of 33.9%. Men with an educational attainment of graduate degree enjoy the highest average annual earnings of $85,714, while those with less than high school education earn the least with $40,938. Women with an educational attainment of graduate degree earn the most with the average annual earnings of $61,417, while those with less than high school education have the smallest earnings of $16,393.
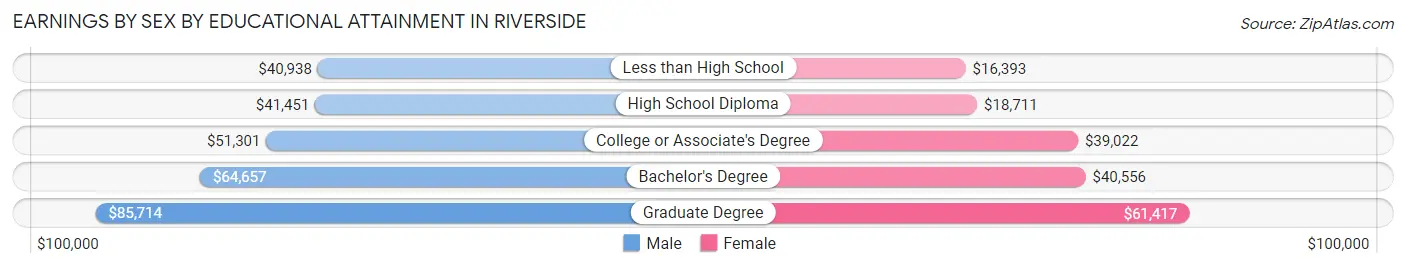
| Educational Attainment | Male Income | Female Income |
| Less than High School | $40,938 | $16,393 |
| High School Diploma | $41,451 | $18,711 |
| College or Associate's Degree | $51,301 | $39,022 |
| Bachelor's Degree | $64,657 | $40,556 |
| Graduate Degree | $85,714 | $61,417 |
| Total | $50,980 | $33,679 |
Family Income in Riverside
Family Income Brackets in Riverside
According to the Riverside family income data, there are 1,220 families falling into the $50,000 to $74,999 income range, which is the most common income bracket and makes up 20.2% of all families. Conversely, the $10,000 to $14,999 income bracket is the least frequent group with only 187 families (3.1%) belonging to this category.
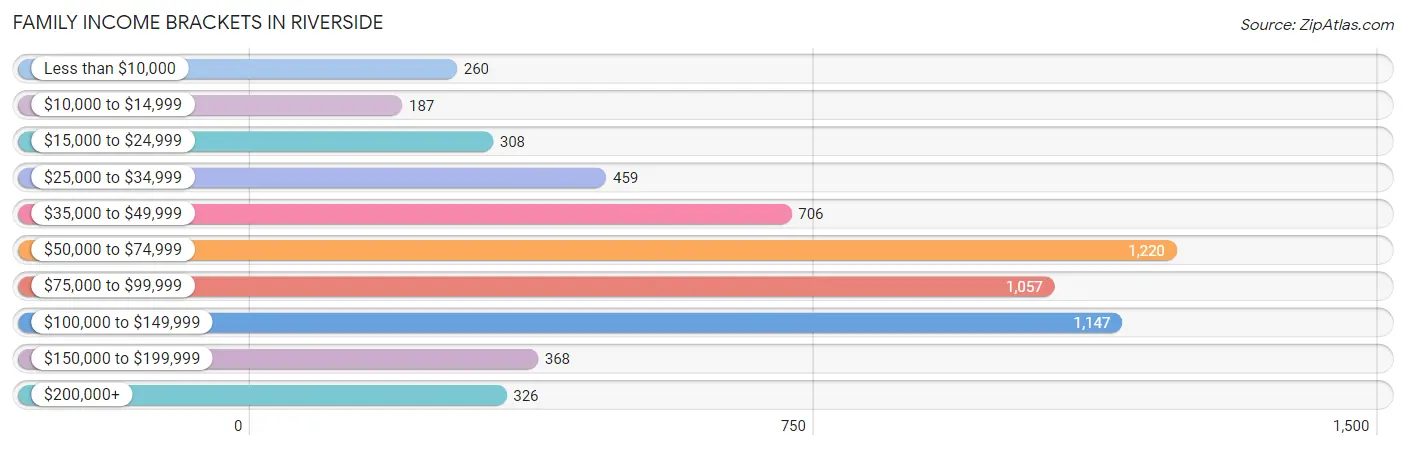
| Income Bracket | # Families | % Families |
| Less than $10,000 | 260 | 4.3% |
| $10,000 to $14,999 | 187 | 3.1% |
| $15,000 to $24,999 | 308 | 5.1% |
| $25,000 to $34,999 | 459 | 7.6% |
| $35,000 to $49,999 | 706 | 11.7% |
| $50,000 to $74,999 | 1,220 | 20.2% |
| $75,000 to $99,999 | 1,057 | 17.5% |
| $100,000 to $149,999 | 1,147 | 19.0% |
| $150,000 to $199,999 | 368 | 6.1% |
| $200,000+ | 326 | 5.4% |
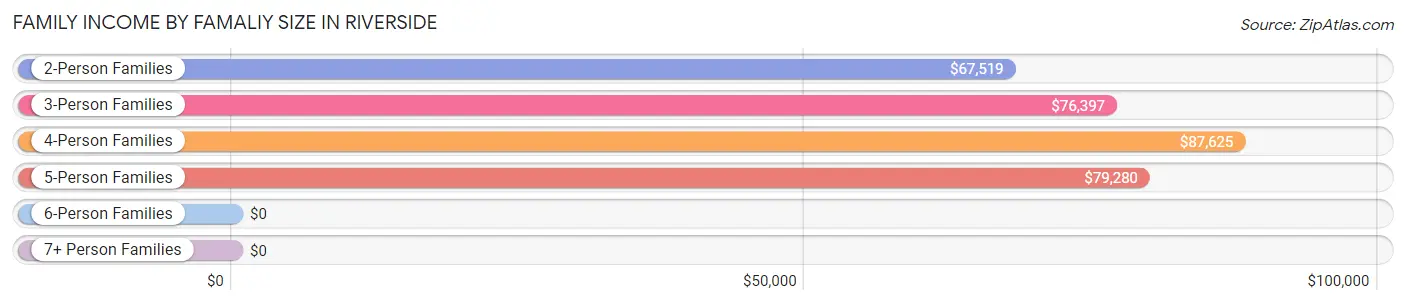
Family Income by Famaliy Size in Riverside
4-person families (950 | 15.7%) account for the highest median family income in Riverside with $87,625 per family, while 2-person families (2,925 | 48.4%) have the highest median income of $33,760 per family member.
| Income Bracket | # Families | Median Income |
| 2-Person Families | 2,925 (48.4%) | $67,519 |
| 3-Person Families | 1,575 (26.1%) | $76,397 |
| 4-Person Families | 950 (15.7%) | $87,625 |
| 5-Person Families | 442 (7.3%) | $79,280 |
| 6-Person Families | 146 (2.4%) | $0 |
| 7+ Person Families | 0 (0.0%) | $0 |
| Total | 6,038 (100.0%) | $71,414 |
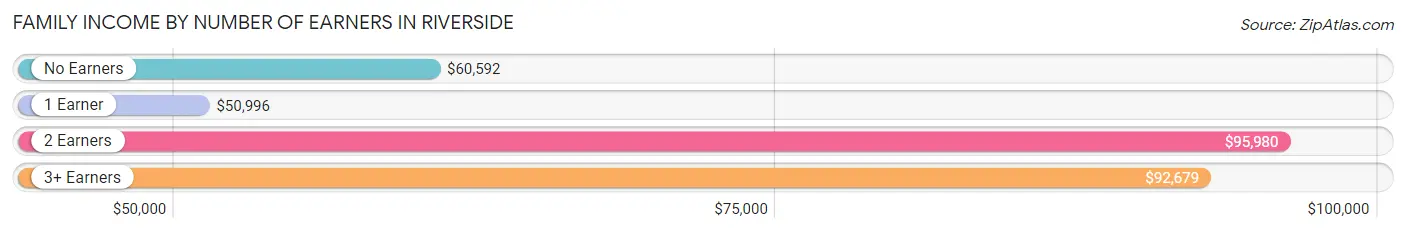
Family Income by Number of Earners in Riverside
The median family income in Riverside is $71,414, with families comprising 2 earners (2,298) having the highest median family income of $95,980, while families with 1 earner (2,675) have the lowest median family income of $50,996, accounting for 38.1% and 44.3% of families, respectively.
| Number of Earners | # Families | Median Income |
| No Earners | 639 (10.6%) | $60,592 |
| 1 Earner | 2,675 (44.3%) | $50,996 |
| 2 Earners | 2,298 (38.1%) | $95,980 |
| 3+ Earners | 426 (7.1%) | $92,679 |
| Total | 6,038 (100.0%) | $71,414 |
Household Income in Riverside
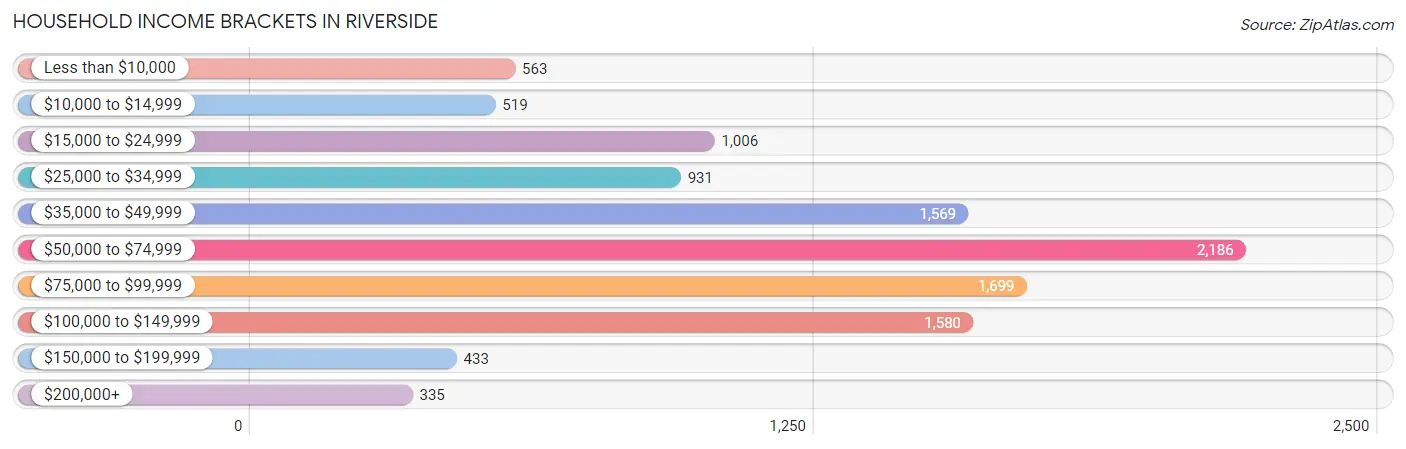
Household Income Brackets in Riverside
With 2,186 households falling in the category, the $50,000 to $74,999 income range is the most frequent in Riverside, accounting for 20.2% of all households. In contrast, only 335 households (3.1%) fall into the $200,000+ income bracket, making it the least populous group.
| Income Bracket | # Households | % Households |
| Less than $10,000 | 563 | 5.2% |
| $10,000 to $14,999 | 519 | 4.8% |
| $15,000 to $24,999 | 1,006 | 9.3% |
| $25,000 to $34,999 | 931 | 8.6% |
| $35,000 to $49,999 | 1,569 | 14.5% |
| $50,000 to $74,999 | 2,186 | 20.2% |
| $75,000 to $99,999 | 1,699 | 15.7% |
| $100,000 to $149,999 | 1,580 | 14.6% |
| $150,000 to $199,999 | 433 | 4.0% |
| $200,000+ | 335 | 3.1% |
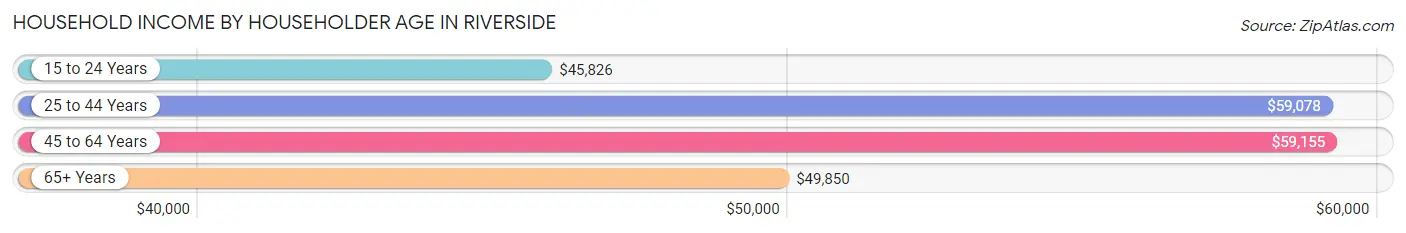
Household Income by Householder Age in Riverside
The median household income in Riverside is $56,232, with the highest median household income of $59,155 found in the 45 to 64 years age bracket for the primary householder. A total of 3,643 households (33.7%) fall into this category. Meanwhile, the 15 to 24 years age bracket for the primary householder has the lowest median household income of $45,826, with 739 households (6.8%) in this group.
| Income Bracket | # Households | Median Income |
| 15 to 24 Years | 739 (6.8%) | $45,826 |
| 25 to 44 Years | 3,850 (35.6%) | $59,078 |
| 45 to 64 Years | 3,643 (33.7%) | $59,155 |
| 65+ Years | 2,588 (23.9%) | $49,850 |
| Total | 10,820 (100.0%) | $56,232 |
Poverty in Riverside
Income Below Poverty by Sex and Age in Riverside
With 13.5% poverty level for males and 19.5% for females among the residents of Riverside, 5 year old males and 6 to 11 year old females are the most vulnerable to poverty, with 105 males (65.2%) and 351 females (33.8%) in their respective age groups living below the poverty level.
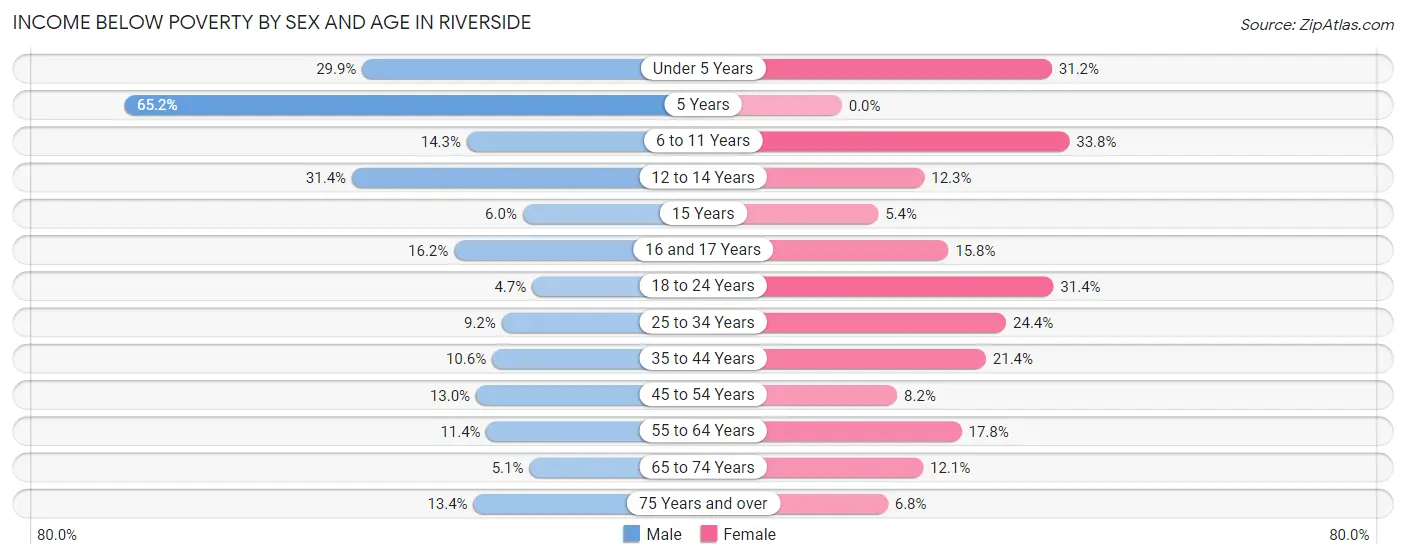
| Age Bracket | Male | Female |
| Under 5 Years | 362 (29.9%) | 150 (31.2%) |
| 5 Years | 105 (65.2%) | 0 (0.0%) |
| 6 to 11 Years | 105 (14.3%) | 351 (33.8%) |
| 12 to 14 Years | 162 (31.4%) | 37 (12.2%) |
| 15 Years | 12 (6.0%) | 4 (5.4%) |
| 16 and 17 Years | 30 (16.2%) | 46 (15.8%) |
| 18 to 24 Years | 57 (4.6%) | 362 (31.4%) |
| 25 to 34 Years | 219 (9.2%) | 464 (24.4%) |
| 35 to 44 Years | 128 (10.6%) | 324 (21.4%) |
| 45 to 54 Years | 150 (13.0%) | 99 (8.2%) |
| 55 to 64 Years | 170 (11.4%) | 333 (17.8%) |
| 65 to 74 Years | 54 (5.1%) | 166 (12.1%) |
| 75 Years and over | 59 (13.4%) | 56 (6.8%) |
| Total | 1,613 (13.5%) | 2,392 (19.5%) |
Income Above Poverty by Sex and Age in Riverside
According to the poverty statistics in Riverside, males aged 18 to 24 years and females aged 5 years are the age groups that are most secure financially, with 95.4% of males and 100.0% of females in these age groups living above the poverty line.
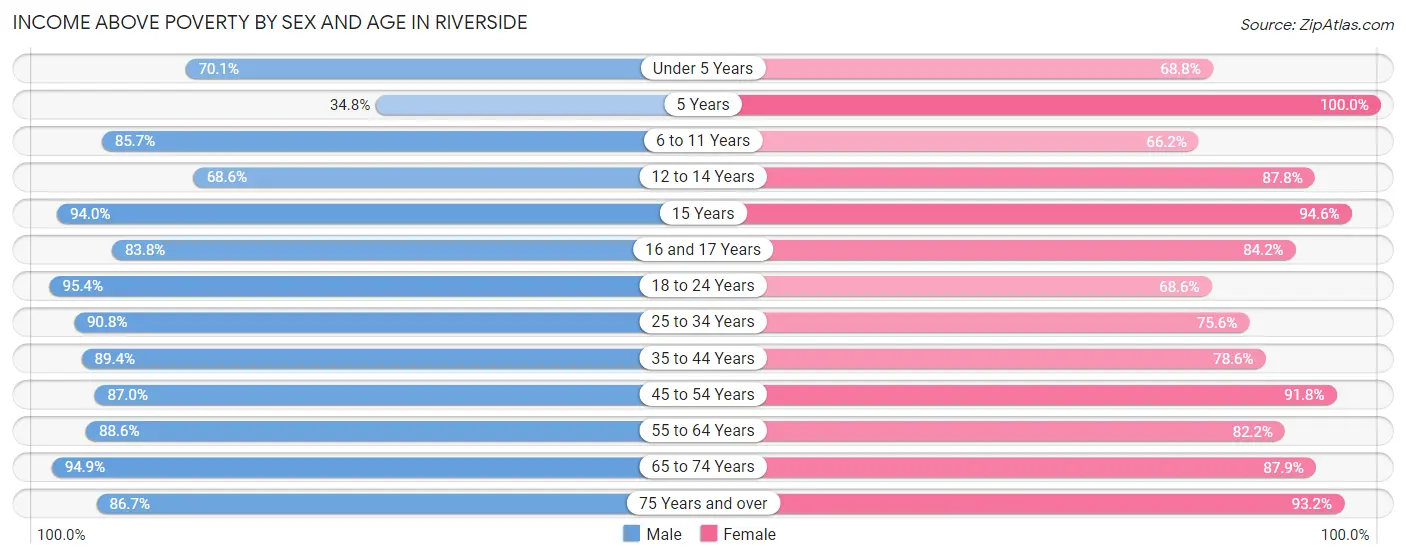
| Age Bracket | Male | Female |
| Under 5 Years | 850 (70.1%) | 331 (68.8%) |
| 5 Years | 56 (34.8%) | 221 (100.0%) |
| 6 to 11 Years | 627 (85.7%) | 688 (66.2%) |
| 12 to 14 Years | 354 (68.6%) | 265 (87.7%) |
| 15 Years | 187 (94.0%) | 70 (94.6%) |
| 16 and 17 Years | 155 (83.8%) | 245 (84.2%) |
| 18 to 24 Years | 1,168 (95.4%) | 790 (68.6%) |
| 25 to 34 Years | 2,170 (90.8%) | 1,438 (75.6%) |
| 35 to 44 Years | 1,080 (89.4%) | 1,191 (78.6%) |
| 45 to 54 Years | 1,006 (87.0%) | 1,105 (91.8%) |
| 55 to 64 Years | 1,318 (88.6%) | 1,540 (82.2%) |
| 65 to 74 Years | 1,014 (94.9%) | 1,210 (87.9%) |
| 75 Years and over | 383 (86.7%) | 764 (93.2%) |
| Total | 10,368 (86.5%) | 9,858 (80.5%) |
Income Below Poverty Among Married-Couple Families in Riverside
The poverty statistics for married-couple families in Riverside show that 4.7% or 190 of the total 4,063 families live below the poverty line. Families with 3 or 4 children have the highest poverty rate of 9.5%, comprising of 29 families. On the other hand, families with no children have the lowest poverty rate of 3.4%, which includes 89 families.
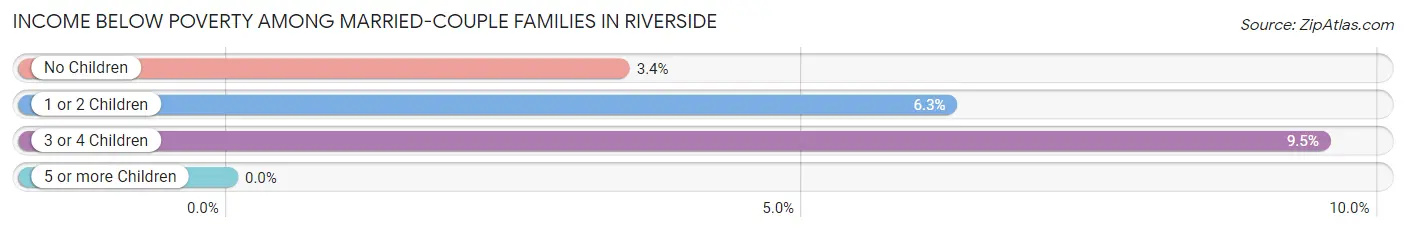
| Children | Above Poverty | Below Poverty |
| No Children | 2,518 (96.6%) | 89 (3.4%) |
| 1 or 2 Children | 1,079 (93.7%) | 72 (6.3%) |
| 3 or 4 Children | 276 (90.5%) | 29 (9.5%) |
| 5 or more Children | 0 (0.0%) | 0 (0.0%) |
| Total | 3,873 (95.3%) | 190 (4.7%) |
Income Below Poverty Among Single-Parent Households in Riverside
According to the poverty data in Riverside, 2.8% or 8 single-father households and 32.9% or 556 single-mother households are living below the poverty line. Among single-father households, those with 1 or 2 children have the highest poverty rate, with 8 households (4.2%) experiencing poverty. Likewise, among single-mother households, those with 5 or more children have the highest poverty rate, with 22 households (100.0%) falling below the poverty line.
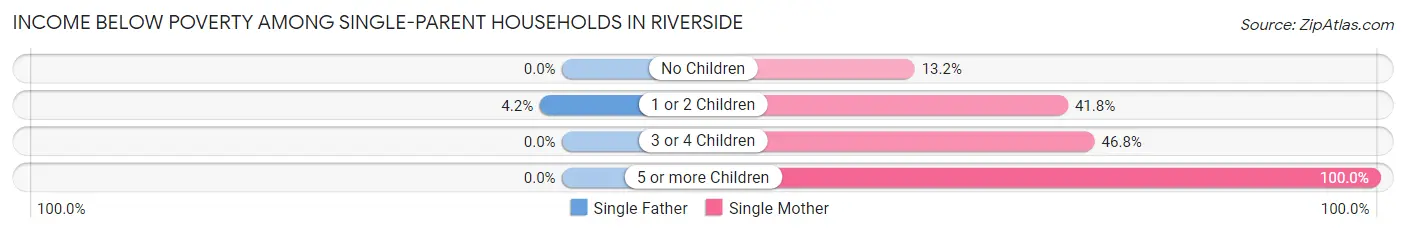
| Children | Single Father | Single Mother |
| No Children | 0 (0.0%) | 81 (13.2%) |
| 1 or 2 Children | 8 (4.2%) | 338 (41.8%) |
| 3 or 4 Children | 0 (0.0%) | 115 (46.8%) |
| 5 or more Children | 0 (0.0%) | 22 (100.0%) |
| Total | 8 (2.8%) | 556 (32.9%) |
Income Below Poverty Among Married-Couple vs Single-Parent Households in Riverside
The poverty data for Riverside shows that 190 of the married-couple family households (4.7%) and 564 of the single-parent households (28.6%) are living below the poverty level. Within the married-couple family households, those with 3 or 4 children have the highest poverty rate, with 29 households (9.5%) falling below the poverty line. Among the single-parent households, those with 5 or more children have the highest poverty rate, with 22 household (100.0%) living below poverty.
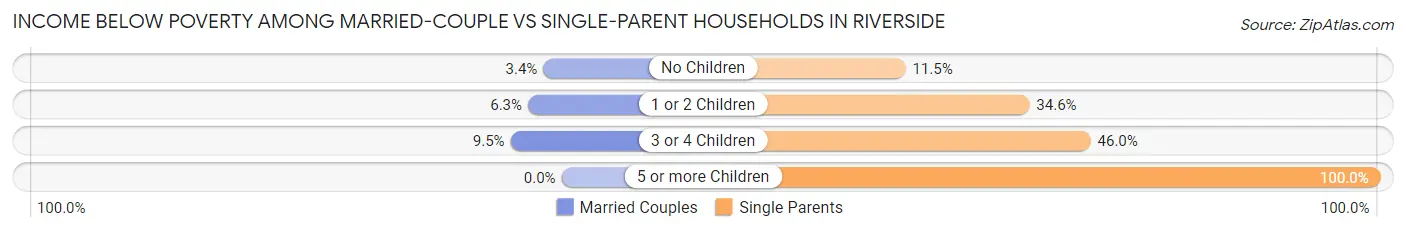
| Children | Married-Couple Families | Single-Parent Households |
| No Children | 89 (3.4%) | 81 (11.5%) |
| 1 or 2 Children | 72 (6.3%) | 346 (34.6%) |
| 3 or 4 Children | 29 (9.5%) | 115 (46.0%) |
| 5 or more Children | 0 (0.0%) | 22 (100.0%) |
| Total | 190 (4.7%) | 564 (28.6%) |
Employment Characteristics in Riverside
Employment by Class of Employer in Riverside
Among the 11,991 employed individuals in Riverside, private company employees (7,762 | 64.7%), federal government employees (1,739 | 14.5%), and not-for-profit organizations (1,040 | 8.7%) make up the most common classes of employment.
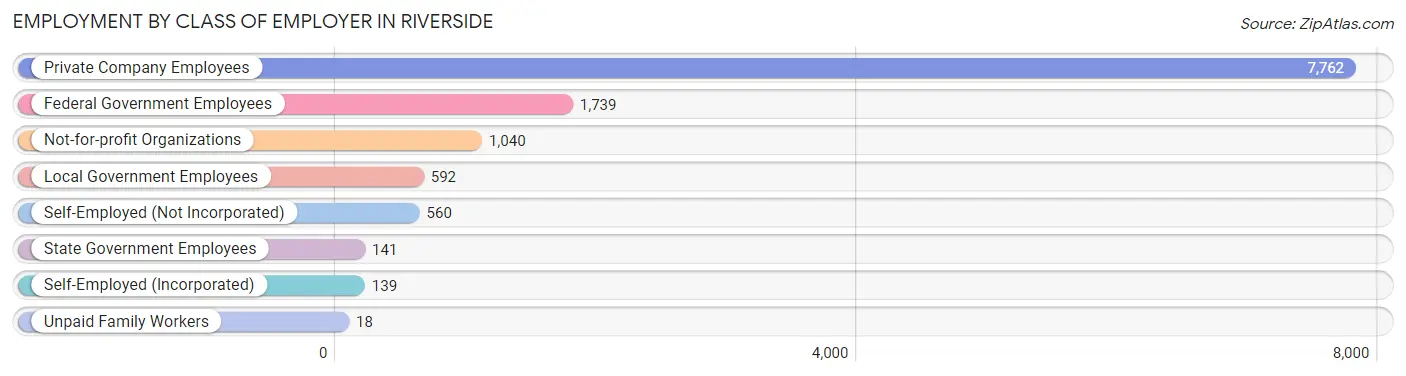
| Employer Class | # Employees | % Employees |
| Private Company Employees | 7,762 | 64.7% |
| Self-Employed (Incorporated) | 139 | 1.2% |
| Self-Employed (Not Incorporated) | 560 | 4.7% |
| Not-for-profit Organizations | 1,040 | 8.7% |
| Local Government Employees | 592 | 4.9% |
| State Government Employees | 141 | 1.2% |
| Federal Government Employees | 1,739 | 14.5% |
| Unpaid Family Workers | 18 | 0.2% |
| Total | 11,991 | 100.0% |
Employment Status by Age in Riverside
According to the labor force statistics for Riverside, out of the total population over 16 years of age (19,294), 66.5% or 12,831 individuals are in the labor force, with 4.1% or 526 of them unemployed. The age group with the highest labor force participation rate is 25 to 29 years, with 91.2% or 2,026 individuals in the labor force. Within the labor force, the 60 to 64 years age range has the highest percentage of unemployed individuals, with 16.1% or 197 of them being unemployed.
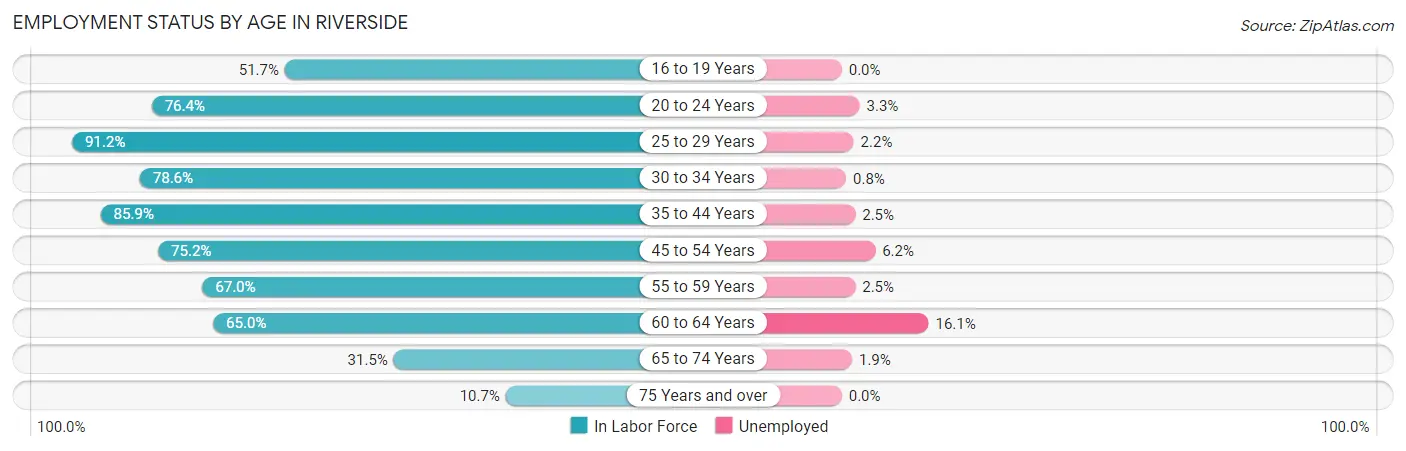
| Age Bracket | In Labor Force | Unemployed |
| 16 to 19 Years | 478 (51.7%) | 0 (0.0%) |
| 20 to 24 Years | 1,474 (76.4%) | 49 (3.3%) |
| 25 to 29 Years | 2,026 (91.2%) | 45 (2.2%) |
| 30 to 34 Years | 1,626 (78.6%) | 13 (0.8%) |
| 35 to 44 Years | 2,339 (85.9%) | 58 (2.5%) |
| 45 to 54 Years | 1,775 (75.2%) | 110 (6.2%) |
| 55 to 59 Years | 990 (67.0%) | 25 (2.5%) |
| 60 to 64 Years | 1,225 (65.0%) | 197 (16.1%) |
| 65 to 74 Years | 770 (31.5%) | 15 (1.9%) |
| 75 Years and over | 135 (10.7%) | 0 (0.0%) |
| Total | 12,831 (66.5%) | 526 (4.1%) |
Employment Status by Educational Attainment in Riverside
According to labor force statistics for Riverside, 78.4% of individuals (9,984) out of the total population between 25 and 64 years of age (12,735) are in the labor force, with 4.6% or 459 of them being unemployed. The group with the highest labor force participation rate are those with the educational attainment of bachelor's degree or higher, with 90.2% or 2,559 individuals in the labor force. Within the labor force, individuals with high school diploma education have the highest percentage of unemployment, with 6.0% or 160 of them being unemployed.
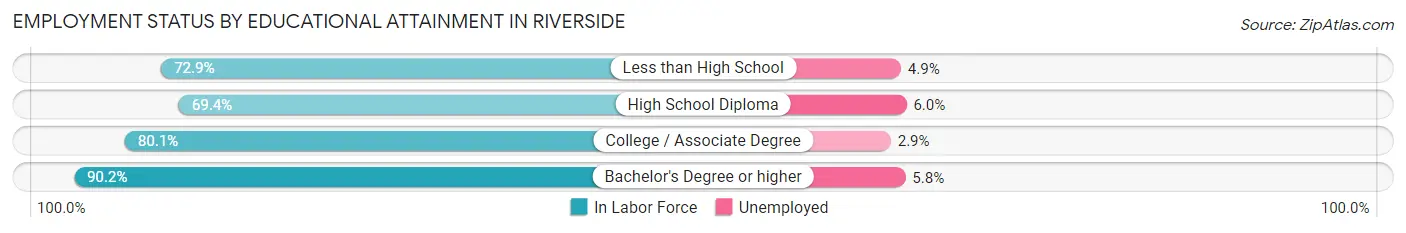
| Educational Attainment | In Labor Force | Unemployed |
| Less than High School | 903 (72.9%) | 61 (4.9%) |
| High School Diploma | 2,672 (69.4%) | 231 (6.0%) |
| College / Associate Degree | 3,852 (80.1%) | 139 (2.9%) |
| Bachelor's Degree or higher | 2,559 (90.2%) | 165 (5.8%) |
| Total | 9,984 (78.4%) | 586 (4.6%) |
Employment Occupations by Sex in Riverside
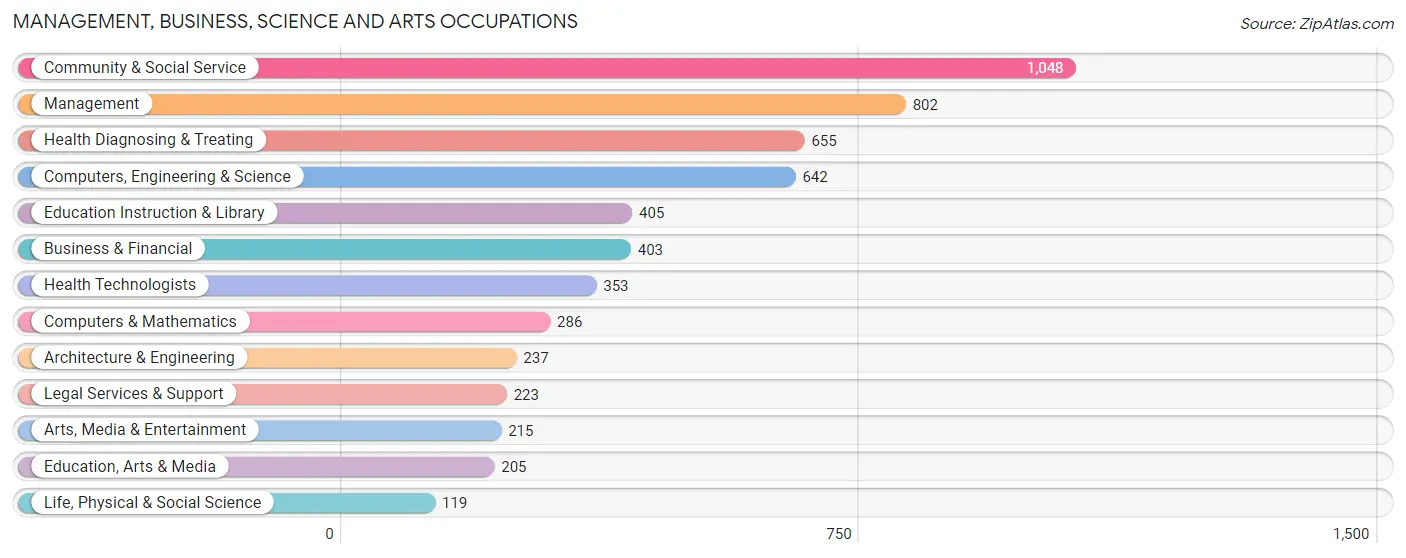
Management, Business, Science and Arts Occupations
The most common Management, Business, Science and Arts occupations in Riverside are Community & Social Service (1,048 | 9.0%), Management (802 | 6.9%), Health Diagnosing & Treating (655 | 5.6%), Computers, Engineering & Science (642 | 5.5%), and Education Instruction & Library (405 | 3.5%).
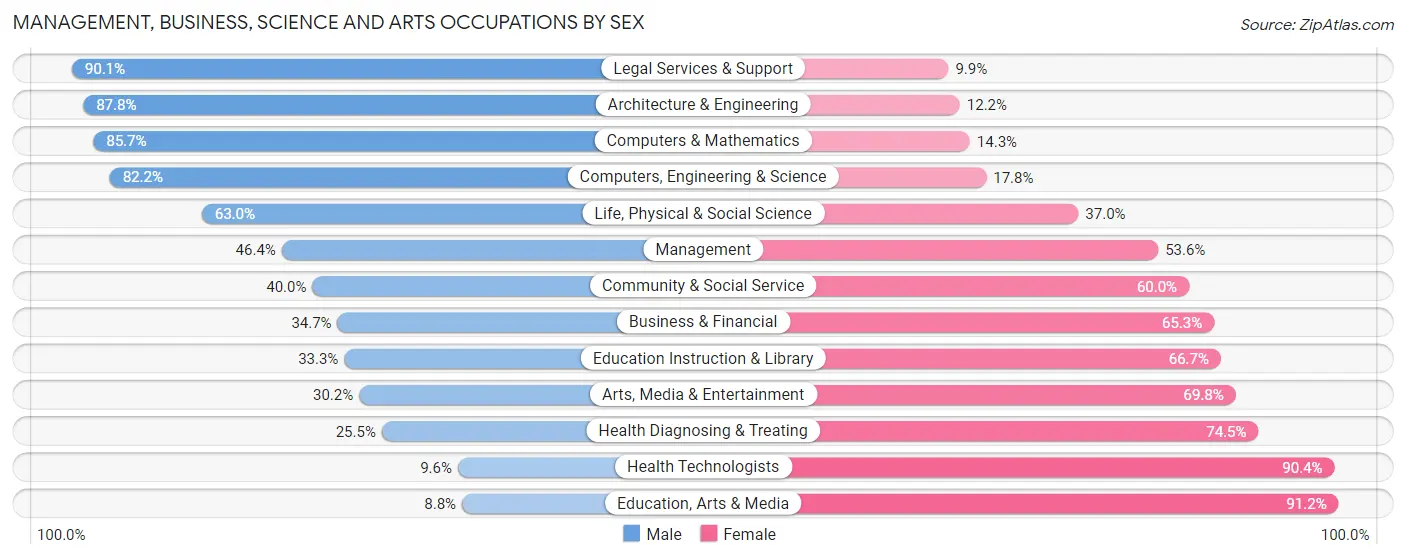
Management, Business, Science and Arts Occupations by Sex
Within the Management, Business, Science and Arts occupations in Riverside, the most male-oriented occupations are Legal Services & Support (90.1%), Architecture & Engineering (87.8%), and Computers & Mathematics (85.7%), while the most female-oriented occupations are Education, Arts & Media (91.2%), Health Technologists (90.4%), and Health Diagnosing & Treating (74.5%).
| Occupation | Male | Female |
| Management | 372 (46.4%) | 430 (53.6%) |
| Business & Financial | 140 (34.7%) | 263 (65.3%) |
| Computers, Engineering & Science | 528 (82.2%) | 114 (17.8%) |
| Computers & Mathematics | 245 (85.7%) | 41 (14.3%) |
| Architecture & Engineering | 208 (87.8%) | 29 (12.2%) |
| Life, Physical & Social Science | 75 (63.0%) | 44 (37.0%) |
| Community & Social Service | 419 (40.0%) | 629 (60.0%) |
| Education, Arts & Media | 18 (8.8%) | 187 (91.2%) |
| Legal Services & Support | 201 (90.1%) | 22 (9.9%) |
| Education Instruction & Library | 135 (33.3%) | 270 (66.7%) |
| Arts, Media & Entertainment | 65 (30.2%) | 150 (69.8%) |
| Health Diagnosing & Treating | 167 (25.5%) | 488 (74.5%) |
| Health Technologists | 34 (9.6%) | 319 (90.4%) |
| Total (Category) | 1,626 (45.8%) | 1,924 (54.2%) |
| Total (Overall) | 6,205 (53.4%) | 5,423 (46.6%) |
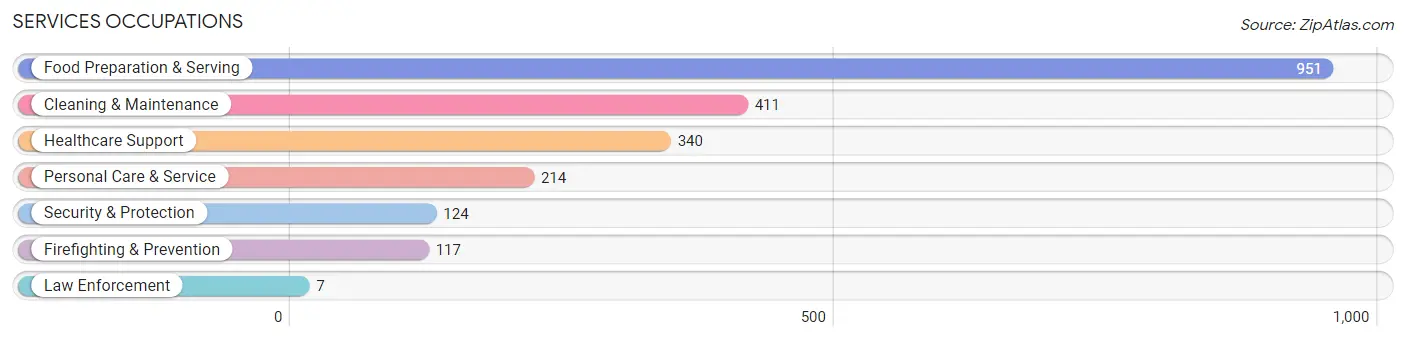
Services Occupations
The most common Services occupations in Riverside are Food Preparation & Serving (951 | 8.2%), Cleaning & Maintenance (411 | 3.5%), Healthcare Support (340 | 2.9%), Personal Care & Service (214 | 1.8%), and Security & Protection (124 | 1.1%).
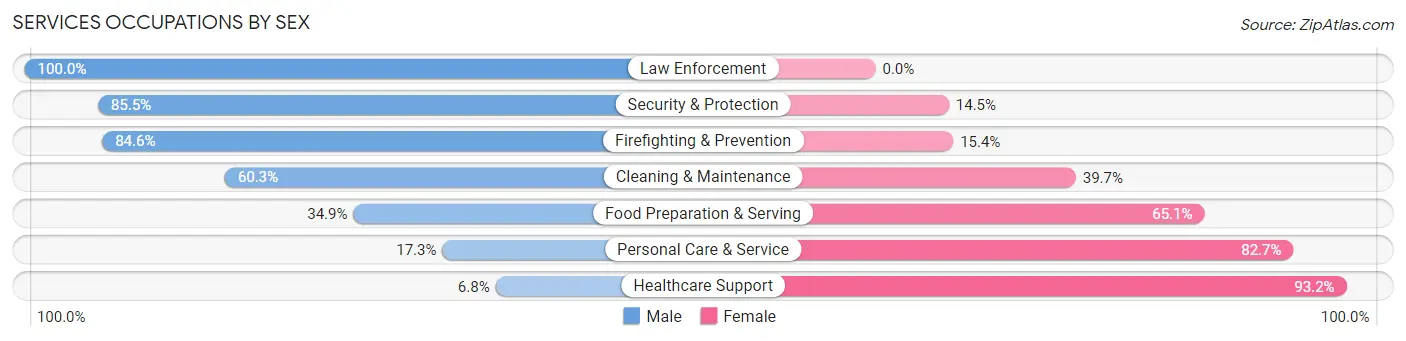
Services Occupations by Sex
Within the Services occupations in Riverside, the most male-oriented occupations are Law Enforcement (100.0%), Security & Protection (85.5%), and Firefighting & Prevention (84.6%), while the most female-oriented occupations are Healthcare Support (93.2%), Personal Care & Service (82.7%), and Food Preparation & Serving (65.1%).
| Occupation | Male | Female |
| Healthcare Support | 23 (6.8%) | 317 (93.2%) |
| Security & Protection | 106 (85.5%) | 18 (14.5%) |
| Firefighting & Prevention | 99 (84.6%) | 18 (15.4%) |
| Law Enforcement | 7 (100.0%) | 0 (0.0%) |
| Food Preparation & Serving | 332 (34.9%) | 619 (65.1%) |
| Cleaning & Maintenance | 248 (60.3%) | 163 (39.7%) |
| Personal Care & Service | 37 (17.3%) | 177 (82.7%) |
| Total (Category) | 746 (36.6%) | 1,294 (63.4%) |
| Total (Overall) | 6,205 (53.4%) | 5,423 (46.6%) |
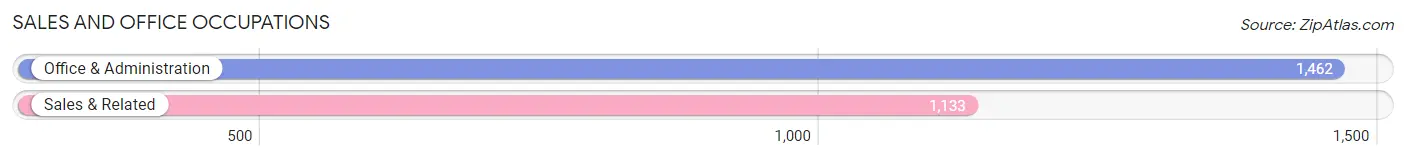
Sales and Office Occupations
The most common Sales and Office occupations in Riverside are Office & Administration (1,462 | 12.6%), and Sales & Related (1,133 | 9.7%).
Sales and Office Occupations by Sex
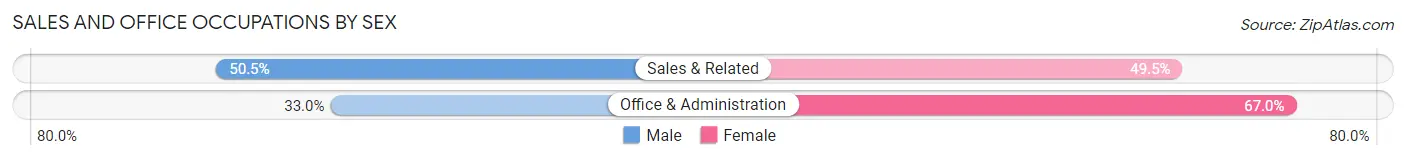
| Occupation | Male | Female |
| Sales & Related | 572 (50.5%) | 561 (49.5%) |
| Office & Administration | 482 (33.0%) | 980 (67.0%) |
| Total (Category) | 1,054 (40.6%) | 1,541 (59.4%) |
| Total (Overall) | 6,205 (53.4%) | 5,423 (46.6%) |
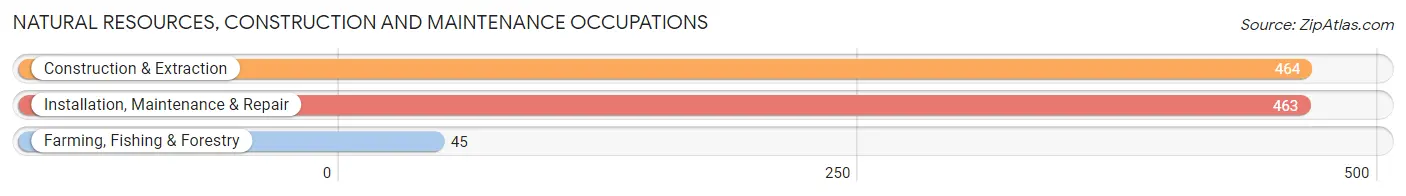
Natural Resources, Construction and Maintenance Occupations
The most common Natural Resources, Construction and Maintenance occupations in Riverside are Construction & Extraction (464 | 4.0%), Installation, Maintenance & Repair (463 | 4.0%), and Farming, Fishing & Forestry (45 | 0.4%).
Natural Resources, Construction and Maintenance Occupations by Sex
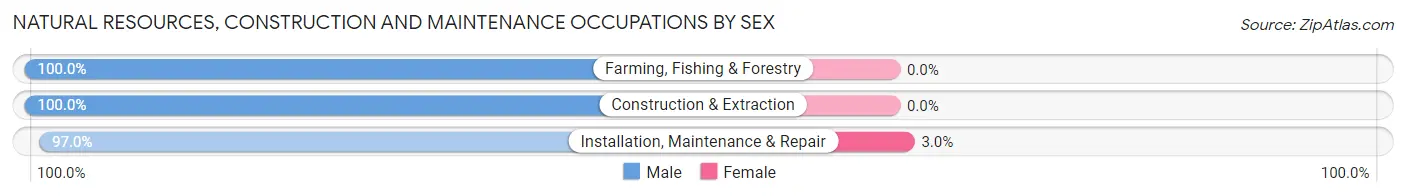
| Occupation | Male | Female |
| Farming, Fishing & Forestry | 45 (100.0%) | 0 (0.0%) |
| Construction & Extraction | 464 (100.0%) | 0 (0.0%) |
| Installation, Maintenance & Repair | 449 (97.0%) | 14 (3.0%) |
| Total (Category) | 958 (98.6%) | 14 (1.4%) |
| Total (Overall) | 6,205 (53.4%) | 5,423 (46.6%) |
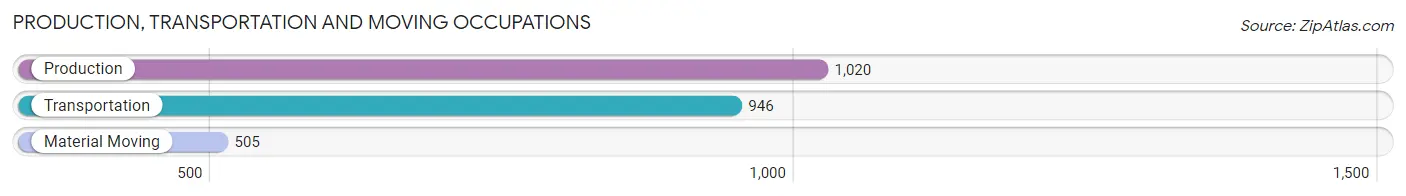
Production, Transportation and Moving Occupations
The most common Production, Transportation and Moving occupations in Riverside are Production (1,020 | 8.8%), Transportation (946 | 8.1%), and Material Moving (505 | 4.3%).
Production, Transportation and Moving Occupations by Sex
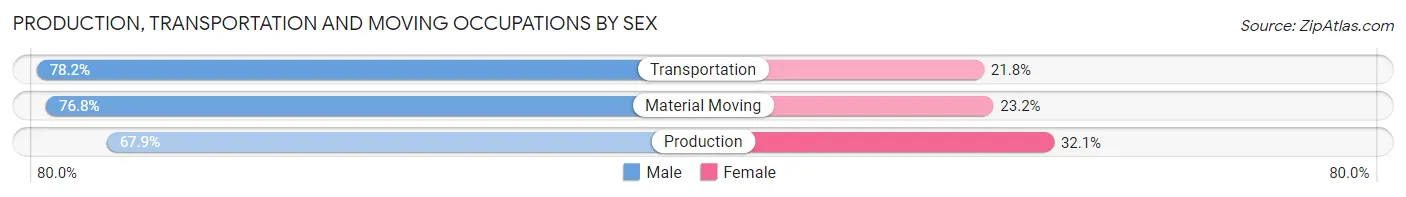
| Occupation | Male | Female |
| Production | 693 (67.9%) | 327 (32.1%) |
| Transportation | 740 (78.2%) | 206 (21.8%) |
| Material Moving | 388 (76.8%) | 117 (23.2%) |
| Total (Category) | 1,821 (73.7%) | 650 (26.3%) |
| Total (Overall) | 6,205 (53.4%) | 5,423 (46.6%) |
Employment Industries by Sex in Riverside
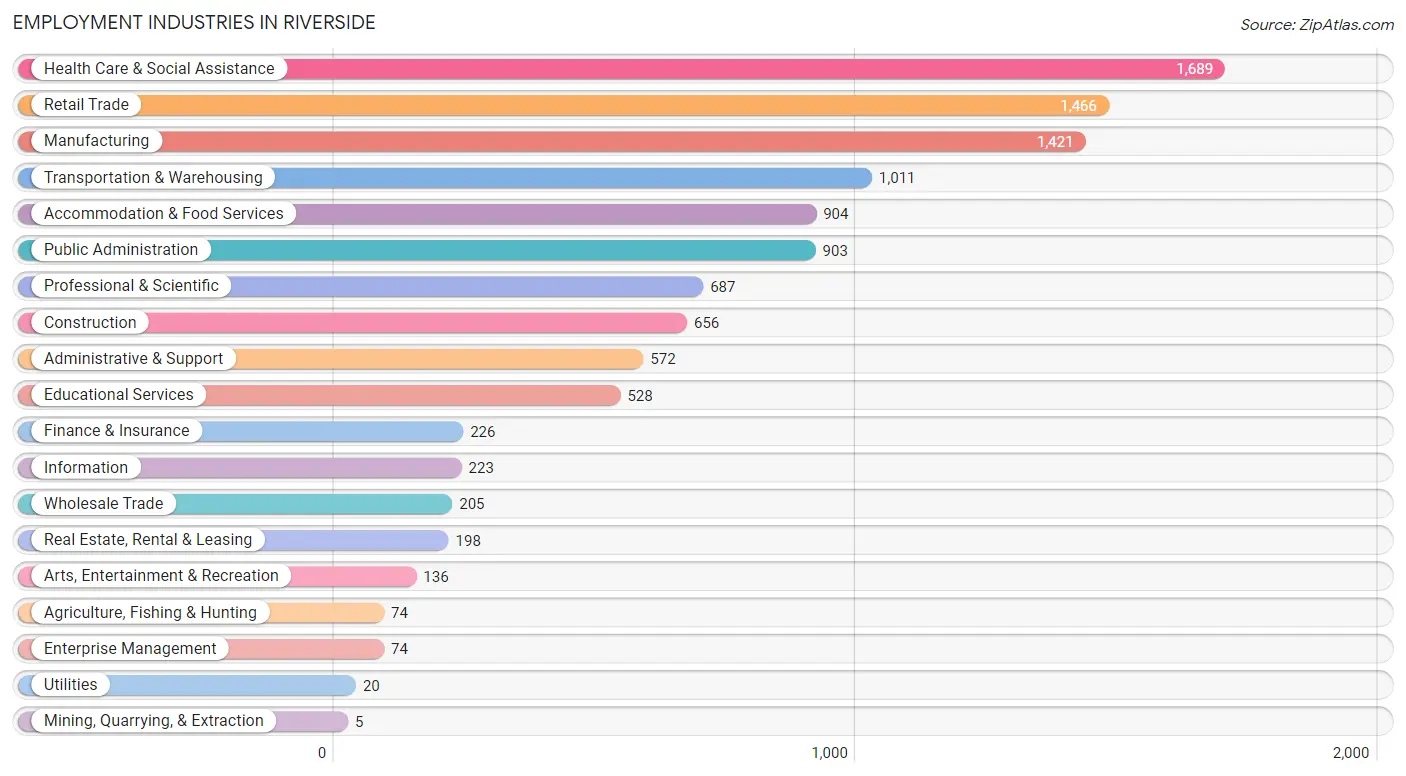
Employment Industries in Riverside
The major employment industries in Riverside include Health Care & Social Assistance (1,689 | 14.5%), Retail Trade (1,466 | 12.6%), Manufacturing (1,421 | 12.2%), Transportation & Warehousing (1,011 | 8.7%), and Accommodation & Food Services (904 | 7.8%).
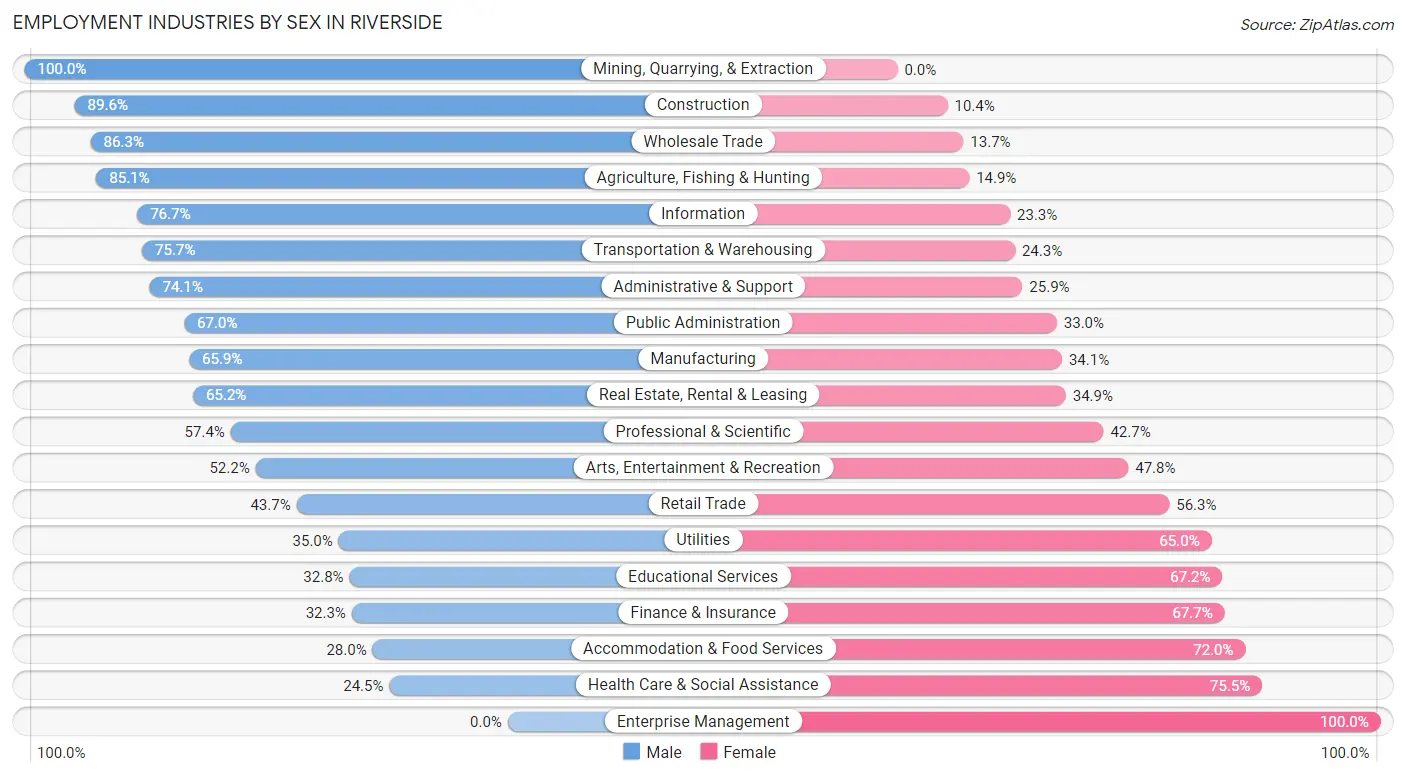
Employment Industries by Sex in Riverside
The Riverside industries that see more men than women are Mining, Quarrying, & Extraction (100.0%), Construction (89.6%), and Wholesale Trade (86.3%), whereas the industries that tend to have a higher number of women are Enterprise Management (100.0%), Health Care & Social Assistance (75.5%), and Accommodation & Food Services (72.0%).
| Industry | Male | Female |
| Agriculture, Fishing & Hunting | 63 (85.1%) | 11 (14.9%) |
| Mining, Quarrying, & Extraction | 5 (100.0%) | 0 (0.0%) |
| Construction | 588 (89.6%) | 68 (10.4%) |
| Manufacturing | 937 (65.9%) | 484 (34.1%) |
| Wholesale Trade | 177 (86.3%) | 28 (13.7%) |
| Retail Trade | 641 (43.7%) | 825 (56.3%) |
| Transportation & Warehousing | 765 (75.7%) | 246 (24.3%) |
| Utilities | 7 (35.0%) | 13 (65.0%) |
| Information | 171 (76.7%) | 52 (23.3%) |
| Finance & Insurance | 73 (32.3%) | 153 (67.7%) |
| Real Estate, Rental & Leasing | 129 (65.1%) | 69 (34.8%) |
| Professional & Scientific | 394 (57.4%) | 293 (42.6%) |
| Enterprise Management | 0 (0.0%) | 74 (100.0%) |
| Administrative & Support | 424 (74.1%) | 148 (25.9%) |
| Educational Services | 173 (32.8%) | 355 (67.2%) |
| Health Care & Social Assistance | 414 (24.5%) | 1,275 (75.5%) |
| Arts, Entertainment & Recreation | 71 (52.2%) | 65 (47.8%) |
| Accommodation & Food Services | 253 (28.0%) | 651 (72.0%) |
| Public Administration | 605 (67.0%) | 298 (33.0%) |
| Total | 6,205 (53.4%) | 5,423 (46.6%) |
Education in Riverside
School Enrollment in Riverside
The most common levels of schooling among the 5,309 students in Riverside are middle school (1,385 | 26.1%), elementary school (1,234 | 23.2%), and college / undergraduate (1,049 | 19.8%).
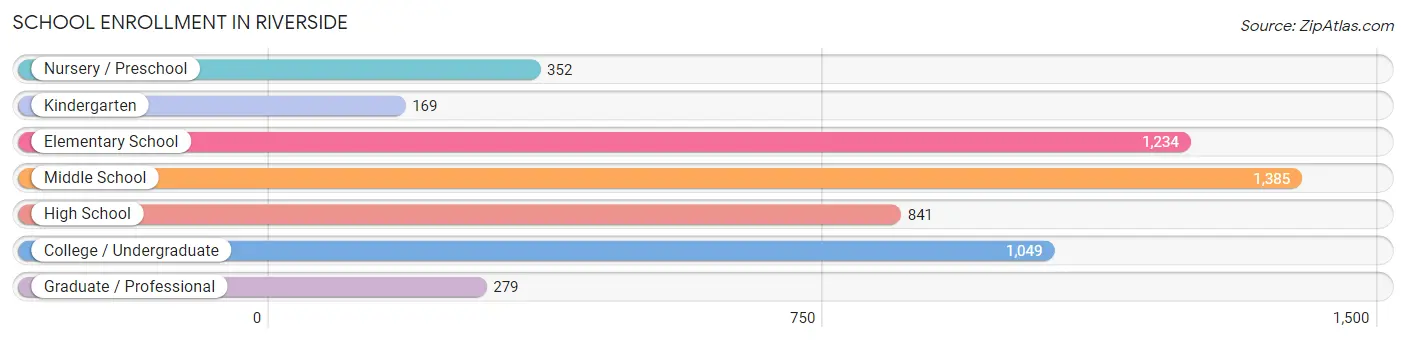
| School Level | # Students | % Students |
| Nursery / Preschool | 352 | 6.6% |
| Kindergarten | 169 | 3.2% |
| Elementary School | 1,234 | 23.2% |
| Middle School | 1,385 | 26.1% |
| High School | 841 | 15.8% |
| College / Undergraduate | 1,049 | 19.8% |
| Graduate / Professional | 279 | 5.3% |
| Total | 5,309 | 100.0% |
School Enrollment by Age by Funding Source in Riverside
Out of a total of 5,309 students who are enrolled in schools in Riverside, 871 (16.4%) attend a private institution, while the remaining 4,438 (83.6%) are enrolled in public schools. The age group of 3 to 4 year olds has the highest likelihood of being enrolled in private schools, with 82 (29.1% in the age bracket) enrolled. Conversely, the age group of 5 to 9 year old has the lowest likelihood of being enrolled in a private school, with 1,150 (90.5% in the age bracket) attending a public institution.
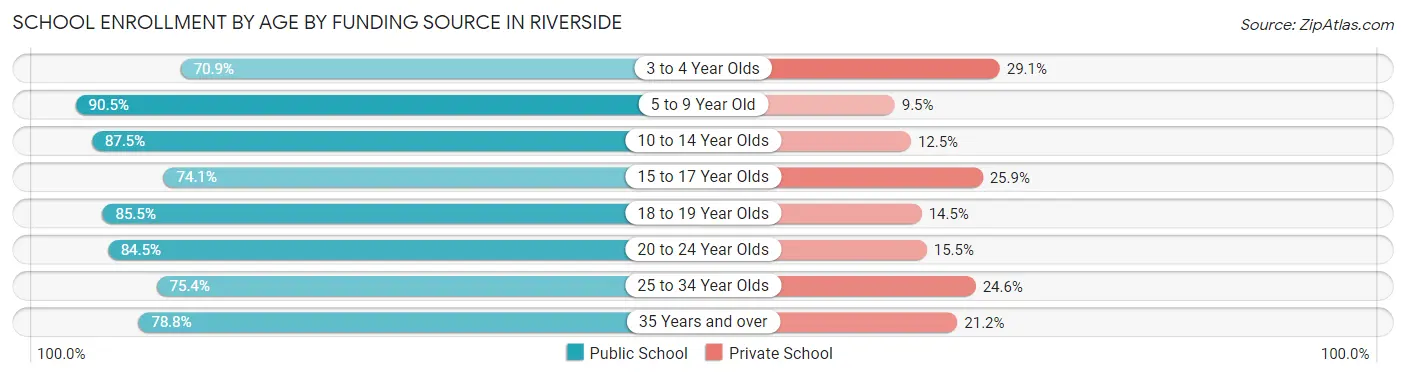
| Age Bracket | Public School | Private School |
| 3 to 4 Year Olds | 200 (70.9%) | 82 (29.1%) |
| 5 to 9 Year Old | 1,150 (90.5%) | 121 (9.5%) |
| 10 to 14 Year Olds | 1,438 (87.5%) | 206 (12.5%) |
| 15 to 17 Year Olds | 555 (74.1%) | 194 (25.9%) |
| 18 to 19 Year Olds | 100 (85.5%) | 17 (14.5%) |
| 20 to 24 Year Olds | 404 (84.5%) | 74 (15.5%) |
| 25 to 34 Year Olds | 273 (75.4%) | 89 (24.6%) |
| 35 Years and over | 320 (78.8%) | 86 (21.2%) |
| Total | 4,438 (83.6%) | 871 (16.4%) |
Educational Attainment by Field of Study in Riverside
Business (1,081 | 29.5%), science & technology (394 | 10.8%), education (383 | 10.5%), engineering (296 | 8.1%), and social sciences (260 | 7.1%) are the most common fields of study among 3,663 individuals in Riverside who have obtained a bachelor's degree or higher.
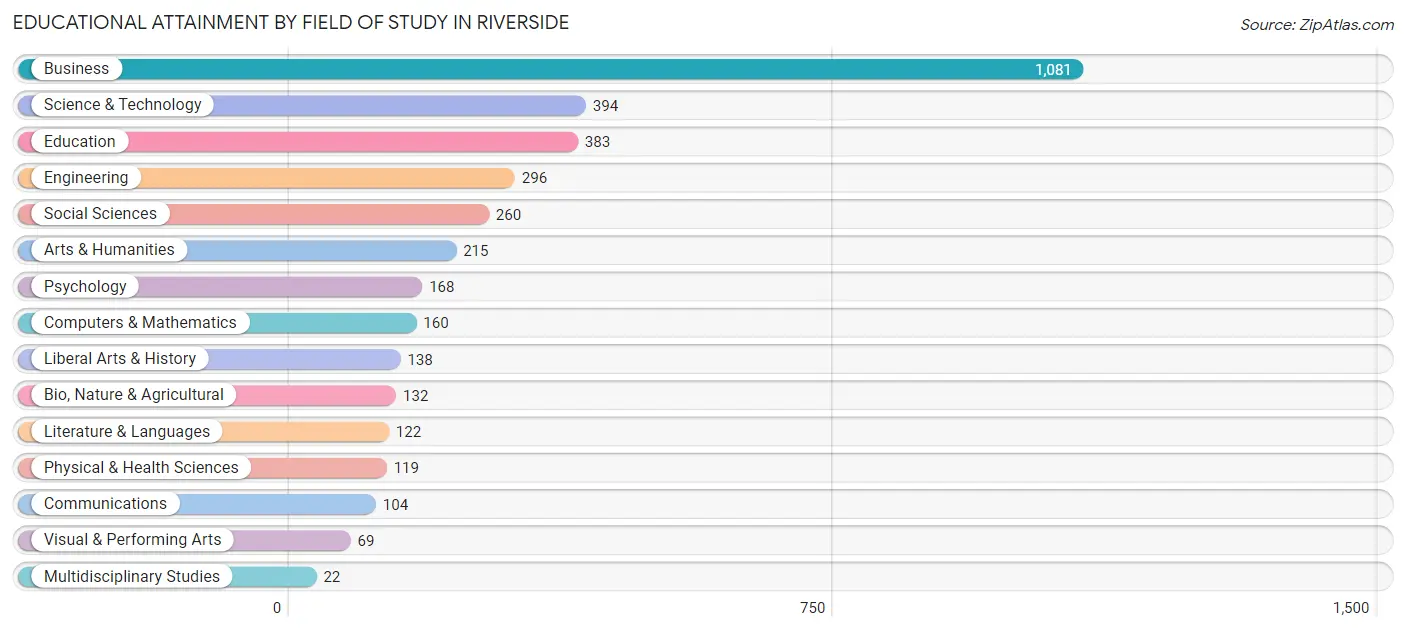
| Field of Study | # Graduates | % Graduates |
| Computers & Mathematics | 160 | 4.4% |
| Bio, Nature & Agricultural | 132 | 3.6% |
| Physical & Health Sciences | 119 | 3.3% |
| Psychology | 168 | 4.6% |
| Social Sciences | 260 | 7.1% |
| Engineering | 296 | 8.1% |
| Multidisciplinary Studies | 22 | 0.6% |
| Science & Technology | 394 | 10.8% |
| Business | 1,081 | 29.5% |
| Education | 383 | 10.5% |
| Literature & Languages | 122 | 3.3% |
| Liberal Arts & History | 138 | 3.8% |
| Visual & Performing Arts | 69 | 1.9% |
| Communications | 104 | 2.8% |
| Arts & Humanities | 215 | 5.9% |
| Total | 3,663 | 100.0% |
Transportation & Commute in Riverside
Vehicle Availability by Sex in Riverside
The most prevalent vehicle ownership categories in Riverside are males with 2 vehicles (3,140, accounting for 48.2%) and females with 2 vehicles (2,673, making up 57.3%).
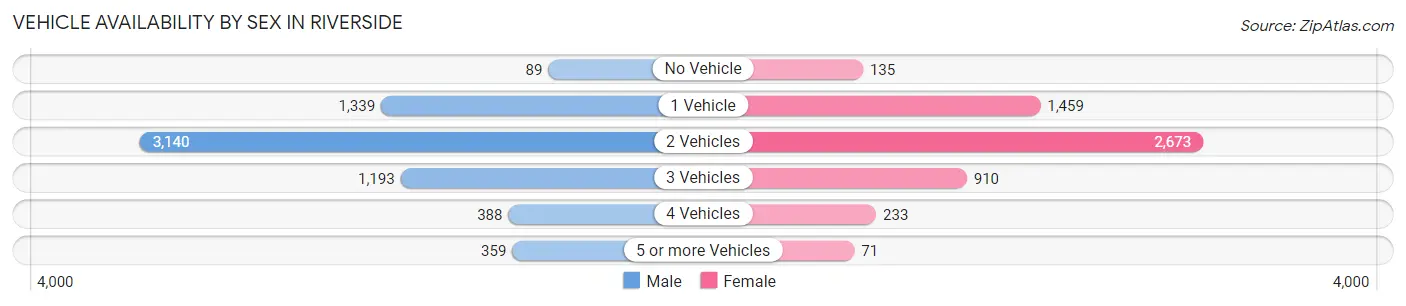
| Vehicles Available | Male | Female |
| No Vehicle | 89 (1.4%) | 135 (2.5%) |
| 1 Vehicle | 1,339 (20.6%) | 1,459 (26.6%) |
| 2 Vehicles | 3,140 (48.2%) | 2,673 (48.8%) |
| 3 Vehicles | 1,193 (18.3%) | 910 (16.6%) |
| 4 Vehicles | 388 (6.0%) | 233 (4.3%) |
| 5 or more Vehicles | 359 (5.5%) | 71 (1.3%) |
| Total | 6,508 (100.0%) | 5,481 (100.0%) |
Commute Time in Riverside
The most frequently occuring commute durations in Riverside are 15 to 19 minutes (2,675 commuters, 23.9%), 10 to 14 minutes (2,652 commuters, 23.7%), and 20 to 24 minutes (1,940 commuters, 17.4%).
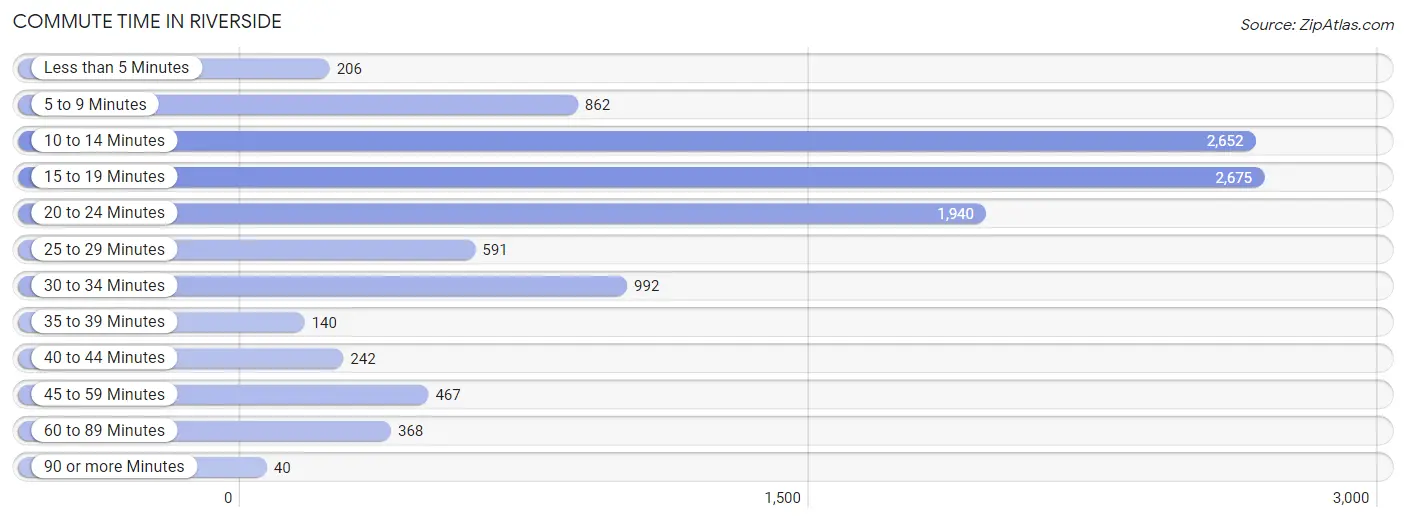
| Commute Time | # Commuters | % Commuters |
| Less than 5 Minutes | 206 | 1.8% |
| 5 to 9 Minutes | 862 | 7.7% |
| 10 to 14 Minutes | 2,652 | 23.7% |
| 15 to 19 Minutes | 2,675 | 23.9% |
| 20 to 24 Minutes | 1,940 | 17.4% |
| 25 to 29 Minutes | 591 | 5.3% |
| 30 to 34 Minutes | 992 | 8.9% |
| 35 to 39 Minutes | 140 | 1.3% |
| 40 to 44 Minutes | 242 | 2.2% |
| 45 to 59 Minutes | 467 | 4.2% |
| 60 to 89 Minutes | 368 | 3.3% |
| 90 or more Minutes | 40 | 0.4% |
Commute Time by Sex in Riverside
The most common commute times in Riverside are 10 to 14 minutes (1,359 commuters, 22.5%) for males and 15 to 19 minutes (1,316 commuters, 25.6%) for females.
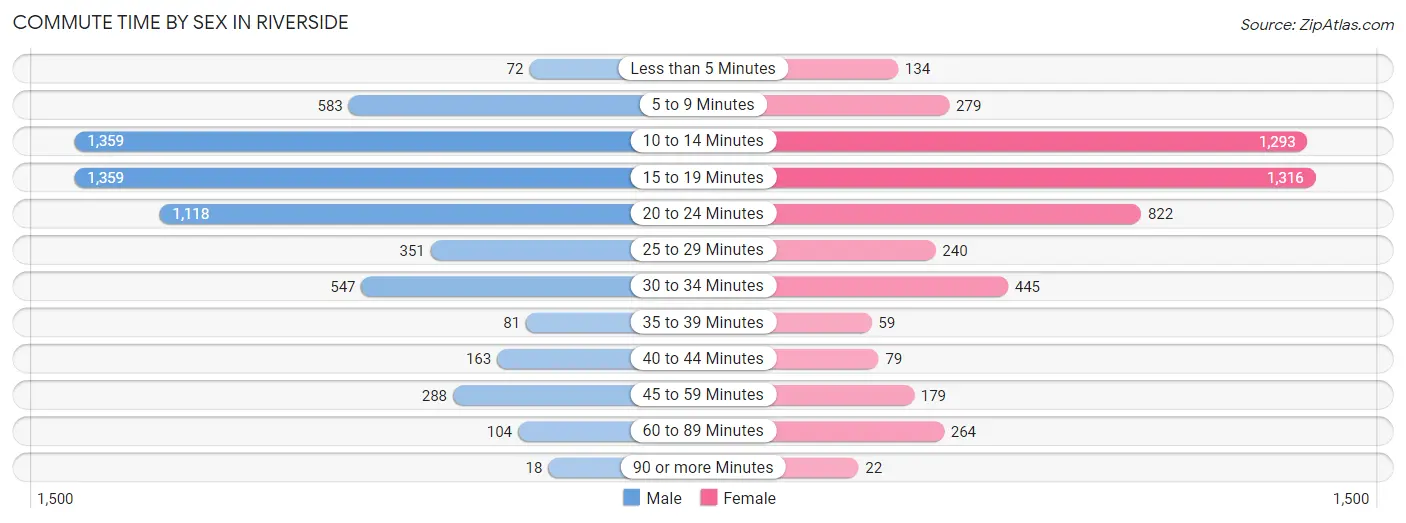
| Commute Time | Male | Female |
| Less than 5 Minutes | 72 (1.2%) | 134 (2.6%) |
| 5 to 9 Minutes | 583 (9.7%) | 279 (5.4%) |
| 10 to 14 Minutes | 1,359 (22.5%) | 1,293 (25.2%) |
| 15 to 19 Minutes | 1,359 (22.5%) | 1,316 (25.6%) |
| 20 to 24 Minutes | 1,118 (18.5%) | 822 (16.0%) |
| 25 to 29 Minutes | 351 (5.8%) | 240 (4.7%) |
| 30 to 34 Minutes | 547 (9.0%) | 445 (8.7%) |
| 35 to 39 Minutes | 81 (1.3%) | 59 (1.1%) |
| 40 to 44 Minutes | 163 (2.7%) | 79 (1.5%) |
| 45 to 59 Minutes | 288 (4.8%) | 179 (3.5%) |
| 60 to 89 Minutes | 104 (1.7%) | 264 (5.1%) |
| 90 or more Minutes | 18 (0.3%) | 22 (0.4%) |
Time of Departure to Work by Sex in Riverside
The most frequent times of departure to work in Riverside are 7:00 AM to 7:29 AM (800, 13.2%) for males and 7:30 AM to 7:59 AM (699, 13.6%) for females.
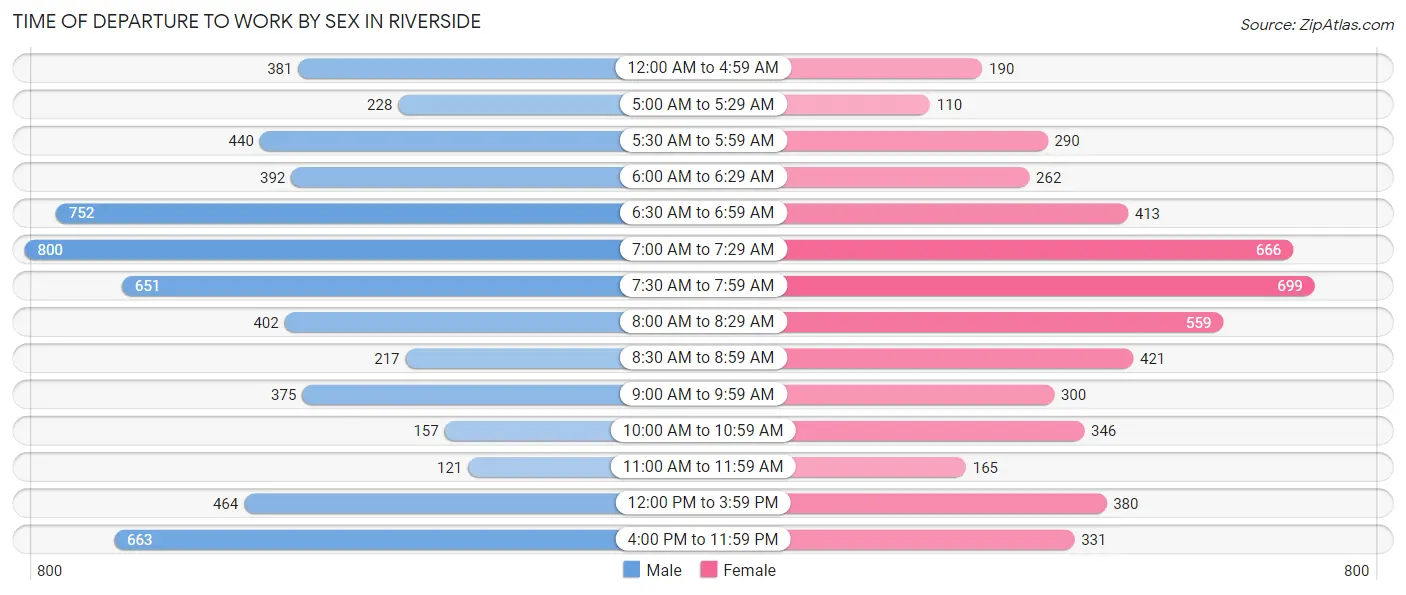
| Time of Departure | Male | Female |
| 12:00 AM to 4:59 AM | 381 (6.3%) | 190 (3.7%) |
| 5:00 AM to 5:29 AM | 228 (3.8%) | 110 (2.1%) |
| 5:30 AM to 5:59 AM | 440 (7.3%) | 290 (5.7%) |
| 6:00 AM to 6:29 AM | 392 (6.5%) | 262 (5.1%) |
| 6:30 AM to 6:59 AM | 752 (12.4%) | 413 (8.1%) |
| 7:00 AM to 7:29 AM | 800 (13.2%) | 666 (13.0%) |
| 7:30 AM to 7:59 AM | 651 (10.8%) | 699 (13.6%) |
| 8:00 AM to 8:29 AM | 402 (6.7%) | 559 (10.9%) |
| 8:30 AM to 8:59 AM | 217 (3.6%) | 421 (8.2%) |
| 9:00 AM to 9:59 AM | 375 (6.2%) | 300 (5.9%) |
| 10:00 AM to 10:59 AM | 157 (2.6%) | 346 (6.7%) |
| 11:00 AM to 11:59 AM | 121 (2.0%) | 165 (3.2%) |
| 12:00 PM to 3:59 PM | 464 (7.7%) | 380 (7.4%) |
| 4:00 PM to 11:59 PM | 663 (11.0%) | 331 (6.5%) |
| Total | 6,043 (100.0%) | 5,132 (100.0%) |
Housing Occupancy in Riverside
Occupancy by Ownership in Riverside
Of the total 10,820 dwellings in Riverside, owner-occupied units account for 6,030 (55.7%), while renter-occupied units make up 4,790 (44.3%).
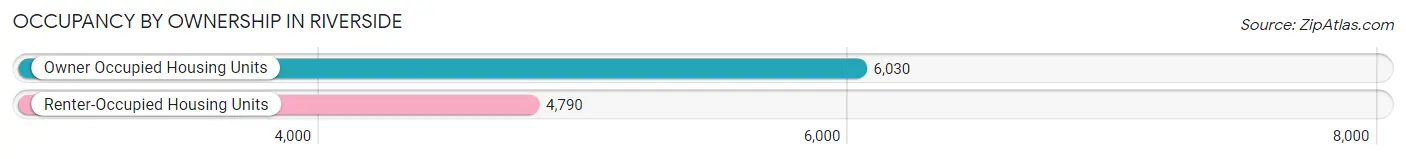
| Occupancy | # Housing Units | % Housing Units |
| Owner Occupied Housing Units | 6,030 | 55.7% |
| Renter-Occupied Housing Units | 4,790 | 44.3% |
| Total Occupied Housing Units | 10,820 | 100.0% |
Occupancy by Household Size in Riverside
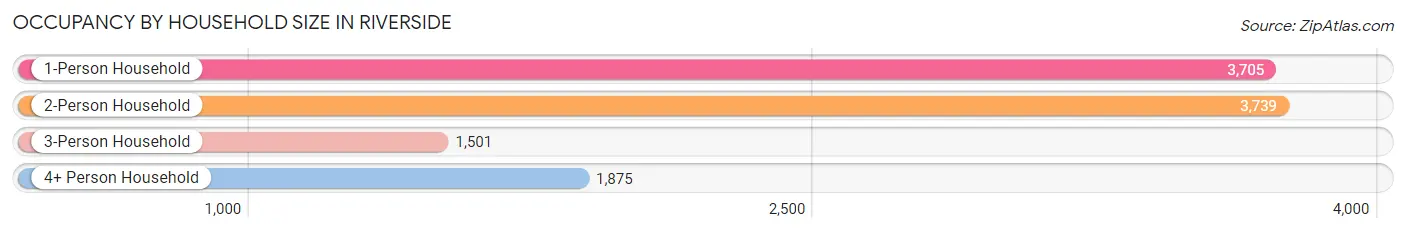
| Household Size | # Housing Units | % Housing Units |
| 1-Person Household | 3,705 | 34.2% |
| 2-Person Household | 3,739 | 34.6% |
| 3-Person Household | 1,501 | 13.9% |
| 4+ Person Household | 1,875 | 17.3% |
| Total Housing Units | 10,820 | 100.0% |
Occupancy by Ownership by Household Size in Riverside
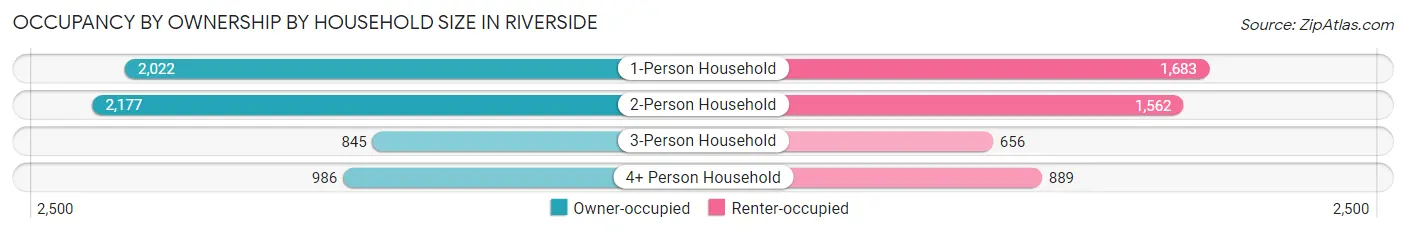
| Household Size | Owner-occupied | Renter-occupied |
| 1-Person Household | 2,022 (54.6%) | 1,683 (45.4%) |
| 2-Person Household | 2,177 (58.2%) | 1,562 (41.8%) |
| 3-Person Household | 845 (56.3%) | 656 (43.7%) |
| 4+ Person Household | 986 (52.6%) | 889 (47.4%) |
| Total Housing Units | 6,030 (55.7%) | 4,790 (44.3%) |
Occupancy by Educational Attainment in Riverside
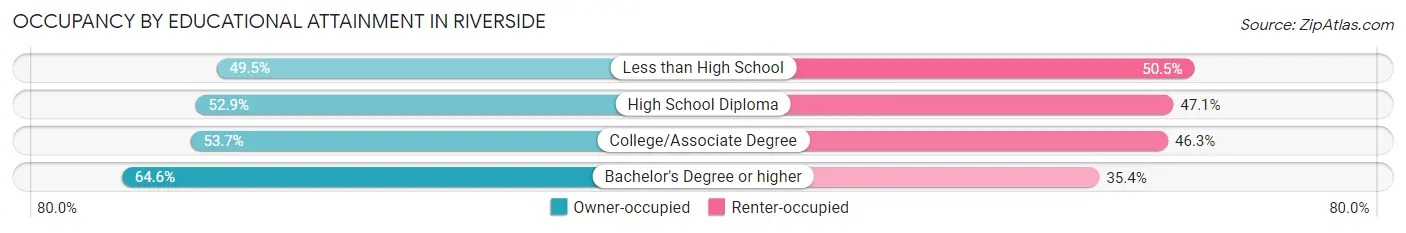
| Household Size | Owner-occupied | Renter-occupied |
| Less than High School | 482 (49.5%) | 491 (50.5%) |
| High School Diploma | 1,609 (52.9%) | 1,435 (47.1%) |
| College/Associate Degree | 2,240 (53.7%) | 1,932 (46.3%) |
| Bachelor's Degree or higher | 1,699 (64.6%) | 932 (35.4%) |
Occupancy by Age of Householder in Riverside
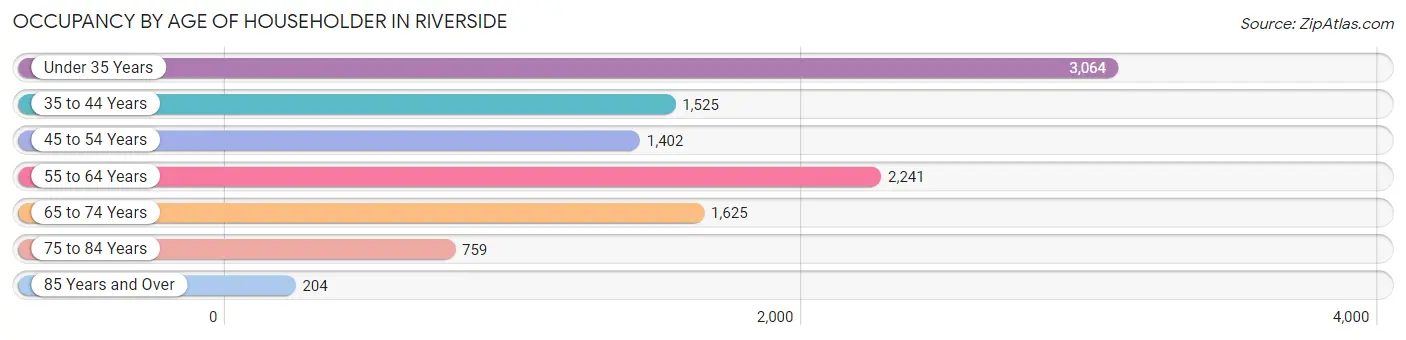
| Age Bracket | # Households | % Households |
| Under 35 Years | 3,064 | 28.3% |
| 35 to 44 Years | 1,525 | 14.1% |
| 45 to 54 Years | 1,402 | 13.0% |
| 55 to 64 Years | 2,241 | 20.7% |
| 65 to 74 Years | 1,625 | 15.0% |
| 75 to 84 Years | 759 | 7.0% |
| 85 Years and Over | 204 | 1.9% |
| Total | 10,820 | 100.0% |
Housing Finances in Riverside
Median Income by Occupancy in Riverside
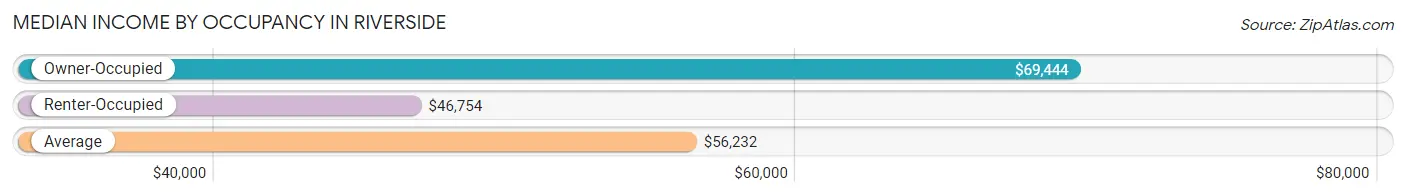
| Occupancy Type | # Households | Median Income |
| Owner-Occupied | 6,030 (55.7%) | $69,444 |
| Renter-Occupied | 4,790 (44.3%) | $46,754 |
| Average | 10,820 (100.0%) | $56,232 |
Occupancy by Householder Income Bracket in Riverside
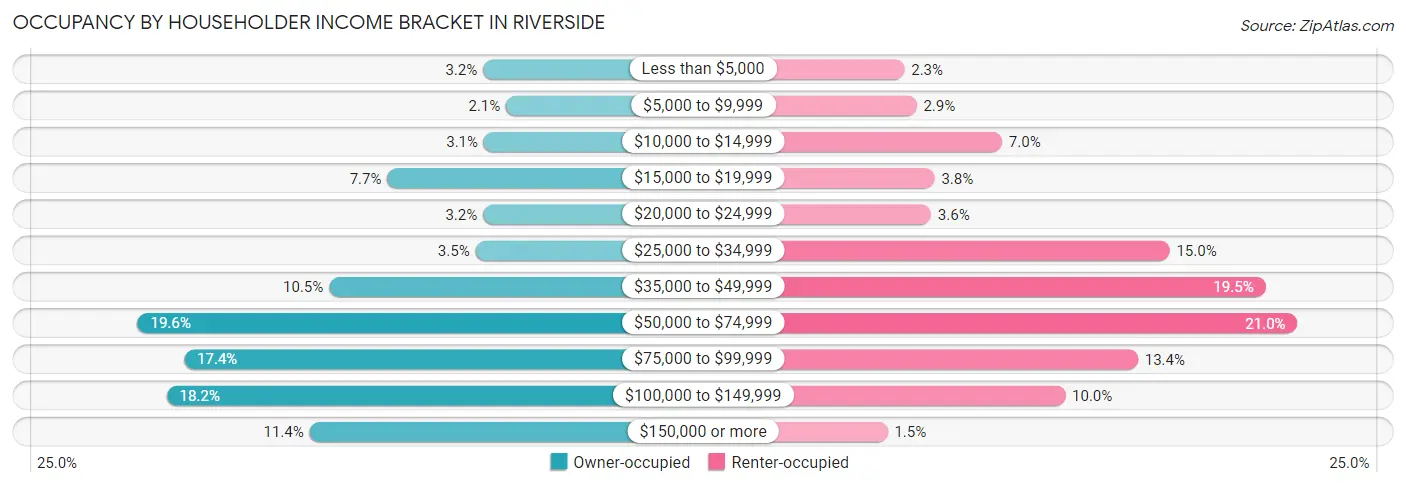
| Income Bracket | Owner-occupied | Renter-occupied |
| Less than $5,000 | 191 (3.2%) | 111 (2.3%) |
| $5,000 to $9,999 | 125 (2.1%) | 139 (2.9%) |
| $10,000 to $14,999 | 189 (3.1%) | 334 (7.0%) |
| $15,000 to $19,999 | 466 (7.7%) | 180 (3.8%) |
| $20,000 to $24,999 | 191 (3.2%) | 172 (3.6%) |
| $25,000 to $34,999 | 213 (3.5%) | 716 (14.9%) |
| $35,000 to $49,999 | 633 (10.5%) | 935 (19.5%) |
| $50,000 to $74,999 | 1,183 (19.6%) | 1,008 (21.0%) |
| $75,000 to $99,999 | 1,050 (17.4%) | 644 (13.4%) |
| $100,000 to $149,999 | 1,100 (18.2%) | 478 (10.0%) |
| $150,000 or more | 689 (11.4%) | 73 (1.5%) |
| Total | 6,030 (100.0%) | 4,790 (100.0%) |
Monthly Housing Cost Tiers in Riverside
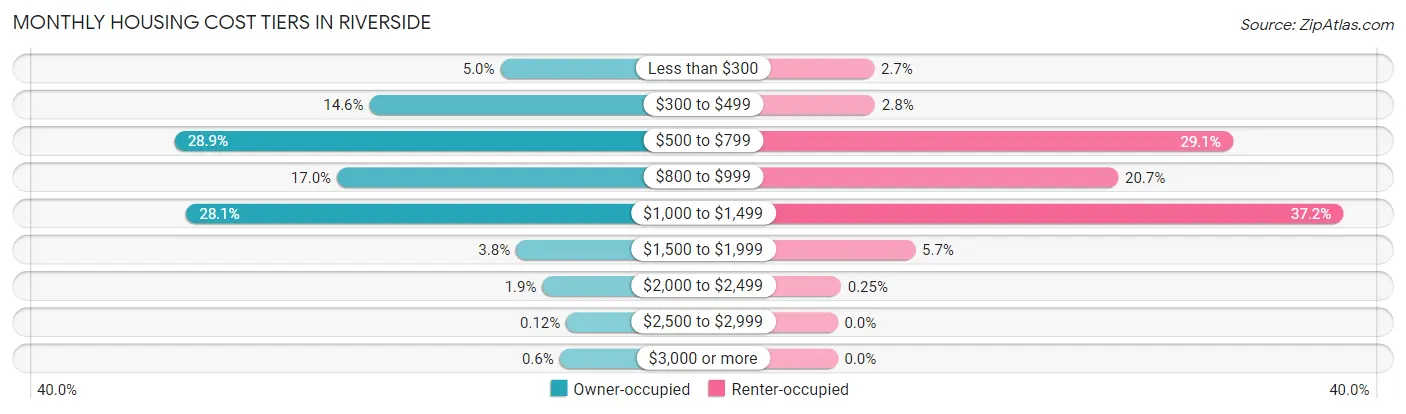
| Monthly Cost | Owner-occupied | Renter-occupied |
| Less than $300 | 299 (5.0%) | 129 (2.7%) |
| $300 to $499 | 881 (14.6%) | 132 (2.8%) |
| $500 to $799 | 1,745 (28.9%) | 1,394 (29.1%) |
| $800 to $999 | 1,025 (17.0%) | 990 (20.7%) |
| $1,000 to $1,499 | 1,694 (28.1%) | 1,784 (37.2%) |
| $1,500 to $1,999 | 230 (3.8%) | 274 (5.7%) |
| $2,000 to $2,499 | 113 (1.9%) | 12 (0.3%) |
| $2,500 to $2,999 | 7 (0.1%) | 0 (0.0%) |
| $3,000 or more | 36 (0.6%) | 0 (0.0%) |
| Total | 6,030 (100.0%) | 4,790 (100.0%) |
Physical Housing Characteristics in Riverside
Housing Structures in Riverside
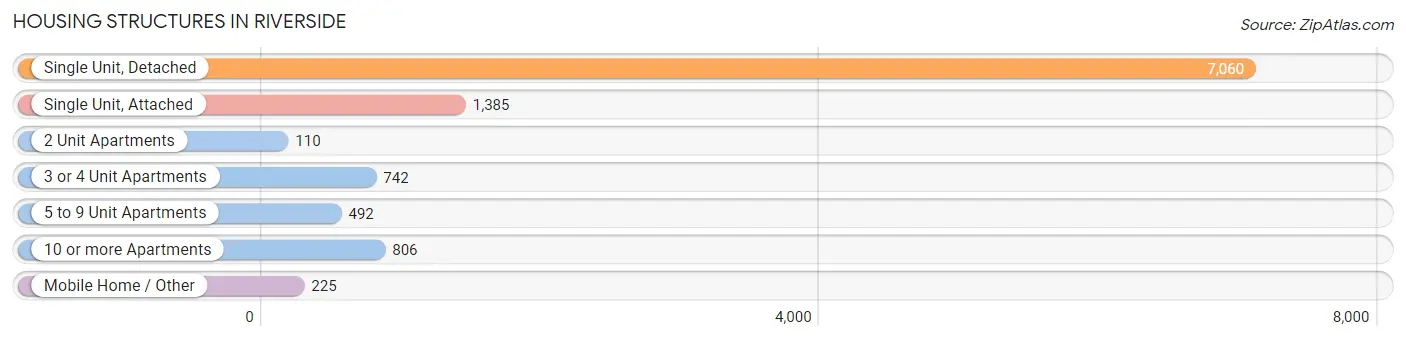
| Structure Type | # Housing Units | % Housing Units |
| Single Unit, Detached | 7,060 | 65.2% |
| Single Unit, Attached | 1,385 | 12.8% |
| 2 Unit Apartments | 110 | 1.0% |
| 3 or 4 Unit Apartments | 742 | 6.9% |
| 5 to 9 Unit Apartments | 492 | 4.5% |
| 10 or more Apartments | 806 | 7.4% |
| Mobile Home / Other | 225 | 2.1% |
| Total | 10,820 | 100.0% |
Housing Structures by Occupancy in Riverside
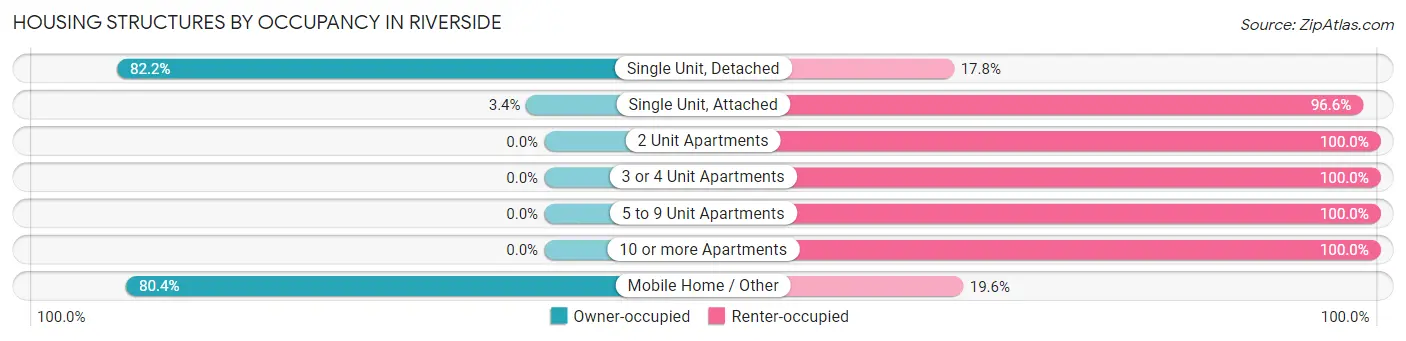
| Structure Type | Owner-occupied | Renter-occupied |
| Single Unit, Detached | 5,802 (82.2%) | 1,258 (17.8%) |
| Single Unit, Attached | 47 (3.4%) | 1,338 (96.6%) |
| 2 Unit Apartments | 0 (0.0%) | 110 (100.0%) |
| 3 or 4 Unit Apartments | 0 (0.0%) | 742 (100.0%) |
| 5 to 9 Unit Apartments | 0 (0.0%) | 492 (100.0%) |
| 10 or more Apartments | 0 (0.0%) | 806 (100.0%) |
| Mobile Home / Other | 181 (80.4%) | 44 (19.6%) |
| Total | 6,030 (55.7%) | 4,790 (44.3%) |
Housing Structures by Number of Rooms in Riverside
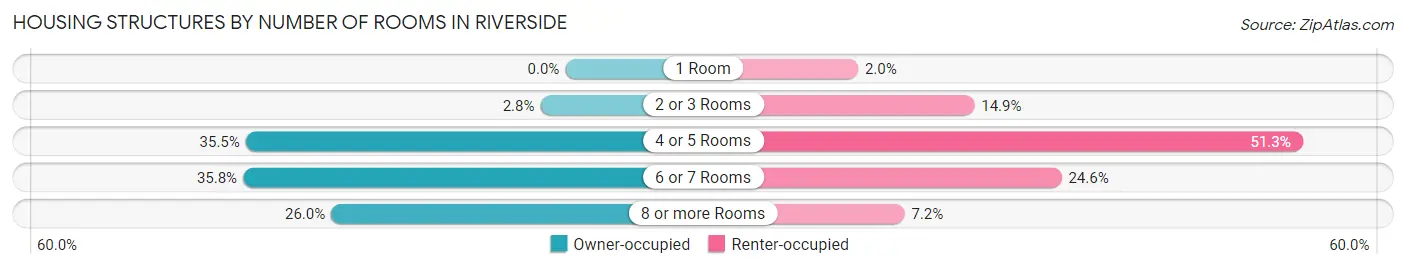
| Number of Rooms | Owner-occupied | Renter-occupied |
| 1 Room | 0 (0.0%) | 96 (2.0%) |
| 2 or 3 Rooms | 167 (2.8%) | 714 (14.9%) |
| 4 or 5 Rooms | 2,139 (35.5%) | 2,459 (51.3%) |
| 6 or 7 Rooms | 2,157 (35.8%) | 1,178 (24.6%) |
| 8 or more Rooms | 1,567 (26.0%) | 343 (7.2%) |
| Total | 6,030 (100.0%) | 4,790 (100.0%) |
Housing Structure by Heating Type in Riverside
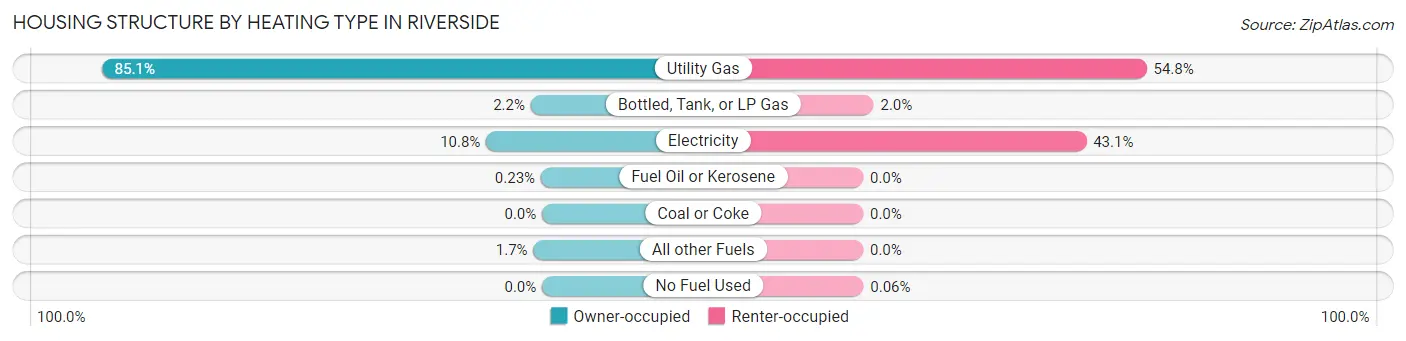
| Heating Type | Owner-occupied | Renter-occupied |
| Utility Gas | 5,132 (85.1%) | 2,624 (54.8%) |
| Bottled, Tank, or LP Gas | 132 (2.2%) | 97 (2.0%) |
| Electricity | 651 (10.8%) | 2,066 (43.1%) |
| Fuel Oil or Kerosene | 14 (0.2%) | 0 (0.0%) |
| Coal or Coke | 0 (0.0%) | 0 (0.0%) |
| All other Fuels | 101 (1.7%) | 0 (0.0%) |
| No Fuel Used | 0 (0.0%) | 3 (0.1%) |
| Total | 6,030 (100.0%) | 4,790 (100.0%) |
Household Vehicle Usage in Riverside
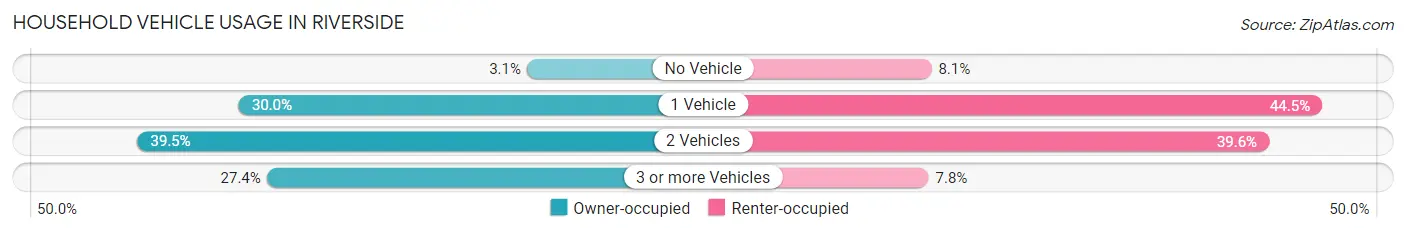
| Vehicles per Household | Owner-occupied | Renter-occupied |
| No Vehicle | 188 (3.1%) | 387 (8.1%) |
| 1 Vehicle | 1,809 (30.0%) | 2,133 (44.5%) |
| 2 Vehicles | 2,380 (39.5%) | 1,896 (39.6%) |
| 3 or more Vehicles | 1,653 (27.4%) | 374 (7.8%) |
| Total | 6,030 (100.0%) | 4,790 (100.0%) |
Real Estate & Mortgages in Riverside
Real Estate and Mortgage Overview in Riverside
| Characteristic | Without Mortgage | With Mortgage |
| Housing Units | 2,496 | 3,534 |
| Median Property Value | $112,700 | $128,900 |
| Median Household Income | $55,463 | $351 |
| Monthly Housing Costs | $517 | $0 |
| Real Estate Taxes | $2,416 | $11 |
Property Value by Mortgage Status in Riverside
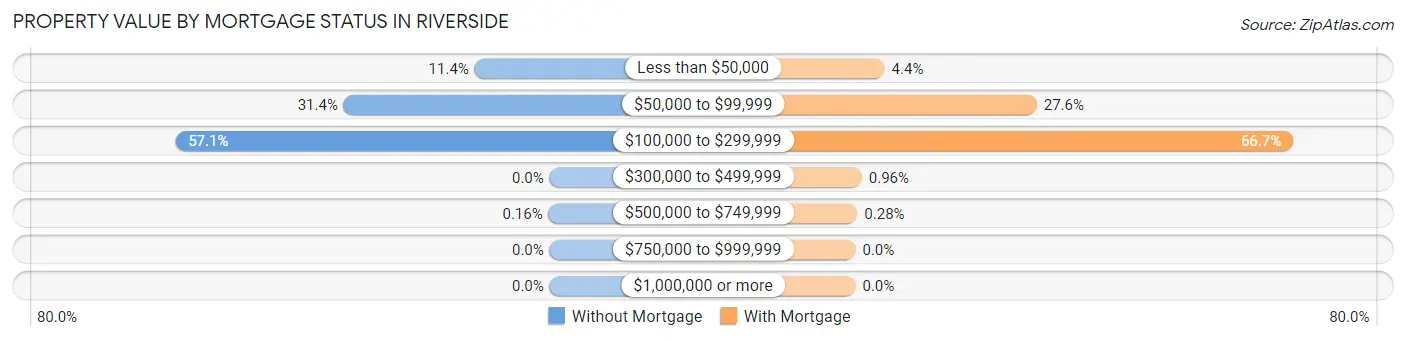
| Property Value | Without Mortgage | With Mortgage |
| Less than $50,000 | 285 (11.4%) | 157 (4.4%) |
| $50,000 to $99,999 | 783 (31.4%) | 976 (27.6%) |
| $100,000 to $299,999 | 1,424 (57.1%) | 2,357 (66.7%) |
| $300,000 to $499,999 | 0 (0.0%) | 34 (1.0%) |
| $500,000 to $749,999 | 4 (0.2%) | 10 (0.3%) |
| $750,000 to $999,999 | 0 (0.0%) | 0 (0.0%) |
| $1,000,000 or more | 0 (0.0%) | 0 (0.0%) |
| Total | 2,496 (100.0%) | 3,534 (100.0%) |
Household Income by Mortgage Status in Riverside
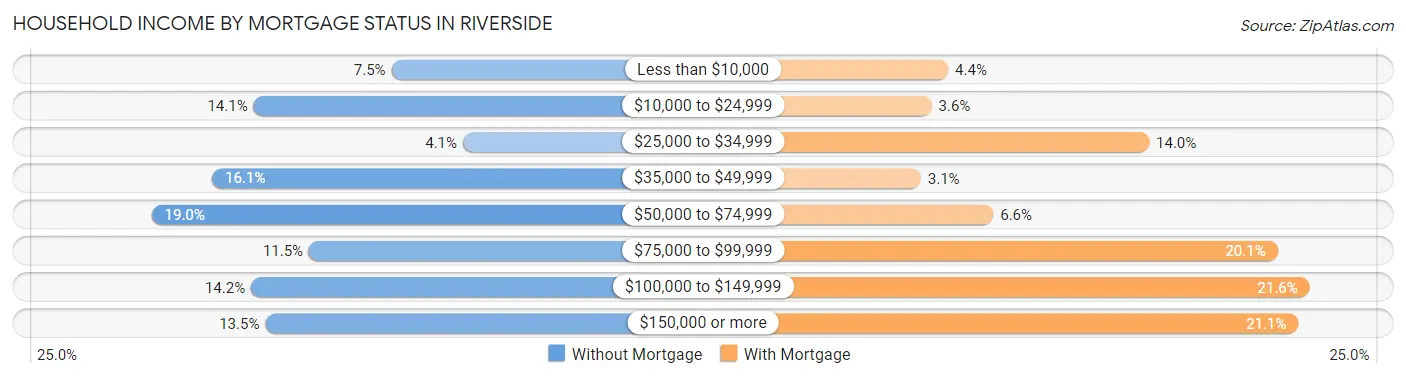
| Household Income | Without Mortgage | With Mortgage |
| Less than $10,000 | 188 (7.5%) | 156 (4.4%) |
| $10,000 to $24,999 | 352 (14.1%) | 128 (3.6%) |
| $25,000 to $34,999 | 103 (4.1%) | 494 (14.0%) |
| $35,000 to $49,999 | 401 (16.1%) | 110 (3.1%) |
| $50,000 to $74,999 | 473 (19.0%) | 232 (6.6%) |
| $75,000 to $99,999 | 286 (11.5%) | 710 (20.1%) |
| $100,000 to $149,999 | 355 (14.2%) | 764 (21.6%) |
| $150,000 or more | 338 (13.5%) | 745 (21.1%) |
| Total | 2,496 (100.0%) | 3,534 (100.0%) |
Property Value to Household Income Ratio in Riverside
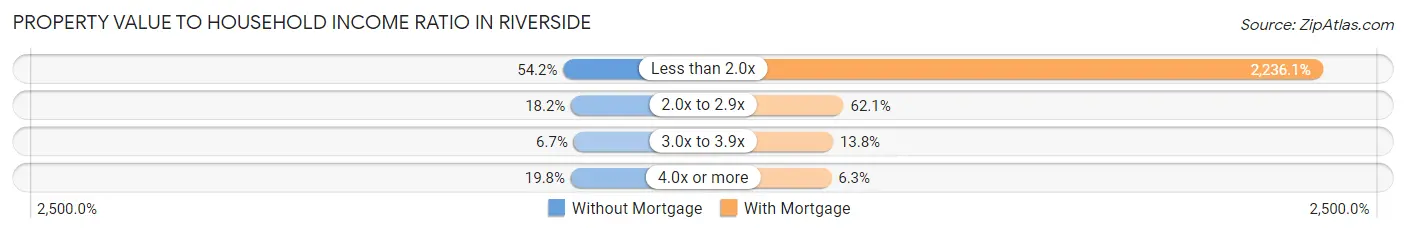
| Value-to-Income Ratio | Without Mortgage | With Mortgage |
| Less than 2.0x | 1,352 (54.2%) | 79,024 (2,236.1%) |
| 2.0x to 2.9x | 454 (18.2%) | 2,193 (62.1%) |
| 3.0x to 3.9x | 167 (6.7%) | 488 (13.8%) |
| 4.0x or more | 495 (19.8%) | 222 (6.3%) |
| Total | 2,496 (100.0%) | 3,534 (100.0%) |
Real Estate Taxes by Mortgage Status in Riverside
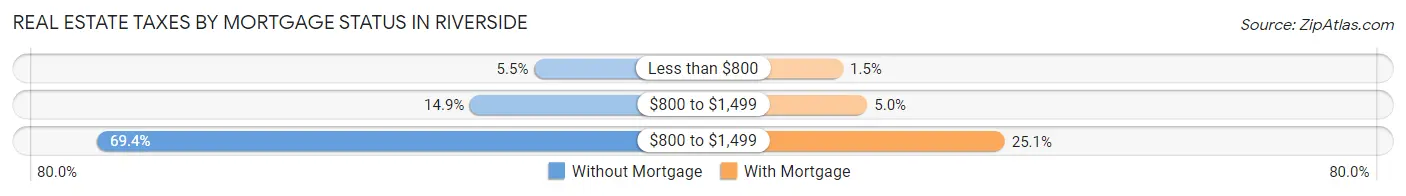
| Property Taxes | Without Mortgage | With Mortgage |
| Less than $800 | 138 (5.5%) | 52 (1.5%) |
| $800 to $1,499 | 372 (14.9%) | 177 (5.0%) |
| $800 to $1,499 | 1,732 (69.4%) | 887 (25.1%) |
| Total | 2,496 (100.0%) | 3,534 (100.0%) |
Health & Disability in Riverside
Health Insurance Coverage by Age in Riverside
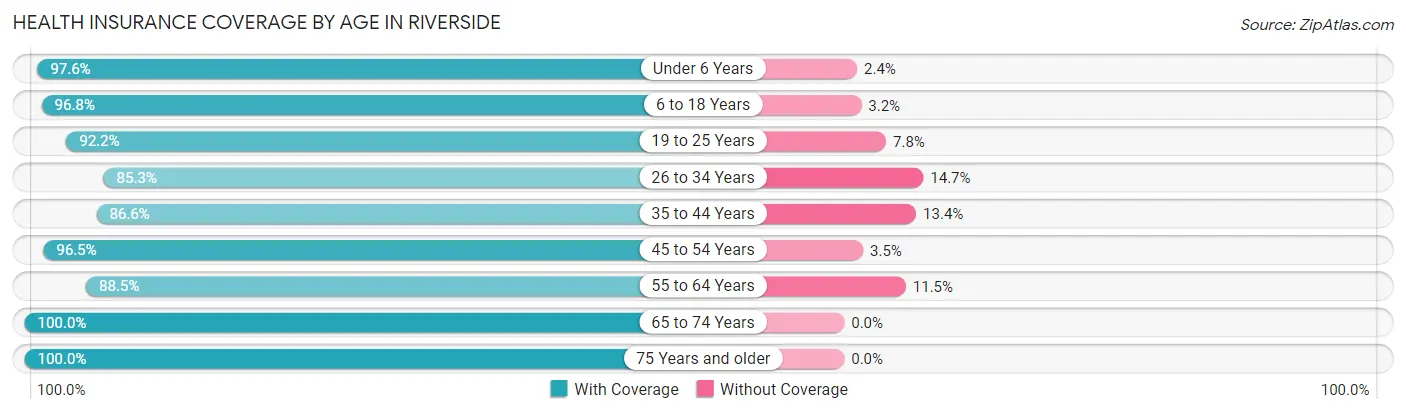
| Age Bracket | With Coverage | Without Coverage |
| Under 6 Years | 2,079 (97.6%) | 51 (2.4%) |
| 6 to 18 Years | 3,595 (96.8%) | 118 (3.2%) |
| 19 to 25 Years | 2,369 (92.2%) | 200 (7.8%) |
| 26 to 34 Years | 2,891 (85.3%) | 500 (14.7%) |
| 35 to 44 Years | 2,217 (86.6%) | 343 (13.4%) |
| 45 to 54 Years | 2,254 (96.5%) | 82 (3.5%) |
| 55 to 64 Years | 2,975 (88.5%) | 386 (11.5%) |
| 65 to 74 Years | 2,444 (100.0%) | 0 (0.0%) |
| 75 Years and older | 1,262 (100.0%) | 0 (0.0%) |
| Total | 22,086 (92.9%) | 1,680 (7.1%) |
Health Insurance Coverage by Citizenship Status in Riverside
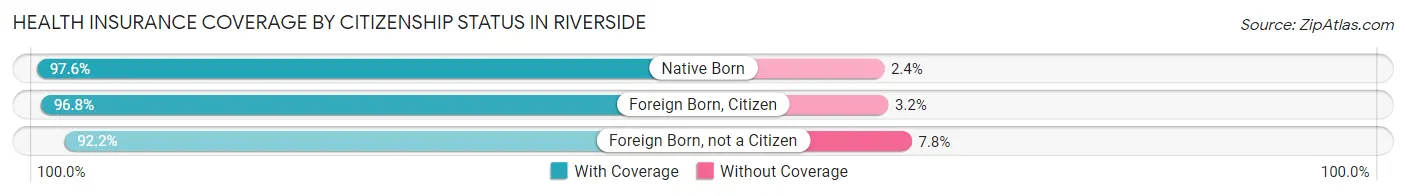
| Citizenship Status | With Coverage | Without Coverage |
| Native Born | 2,079 (97.6%) | 51 (2.4%) |
| Foreign Born, Citizen | 3,595 (96.8%) | 118 (3.2%) |
| Foreign Born, not a Citizen | 2,369 (92.2%) | 200 (7.8%) |
Health Insurance Coverage by Household Income in Riverside
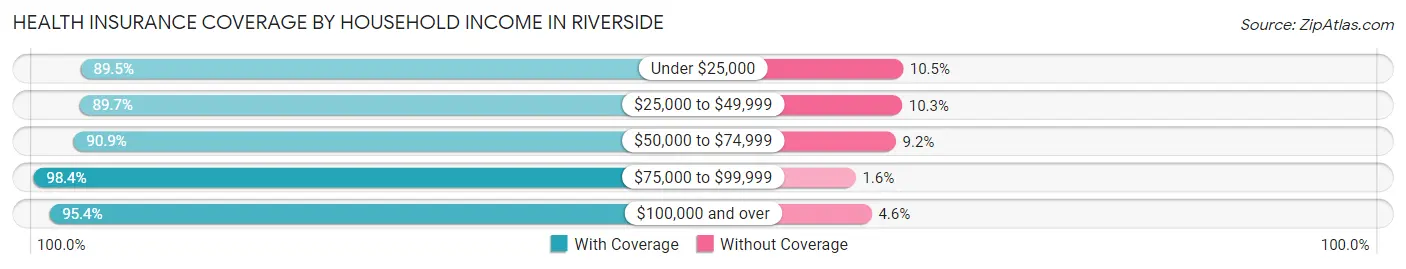
| Household Income | With Coverage | Without Coverage |
| Under $25,000 | 3,116 (89.5%) | 365 (10.5%) |
| $25,000 to $49,999 | 4,468 (89.7%) | 513 (10.3%) |
| $50,000 to $74,999 | 4,377 (90.8%) | 441 (9.1%) |
| $75,000 to $99,999 | 4,051 (98.4%) | 67 (1.6%) |
| $100,000 and over | 6,072 (95.4%) | 294 (4.6%) |
Public vs Private Health Insurance Coverage by Age in Riverside
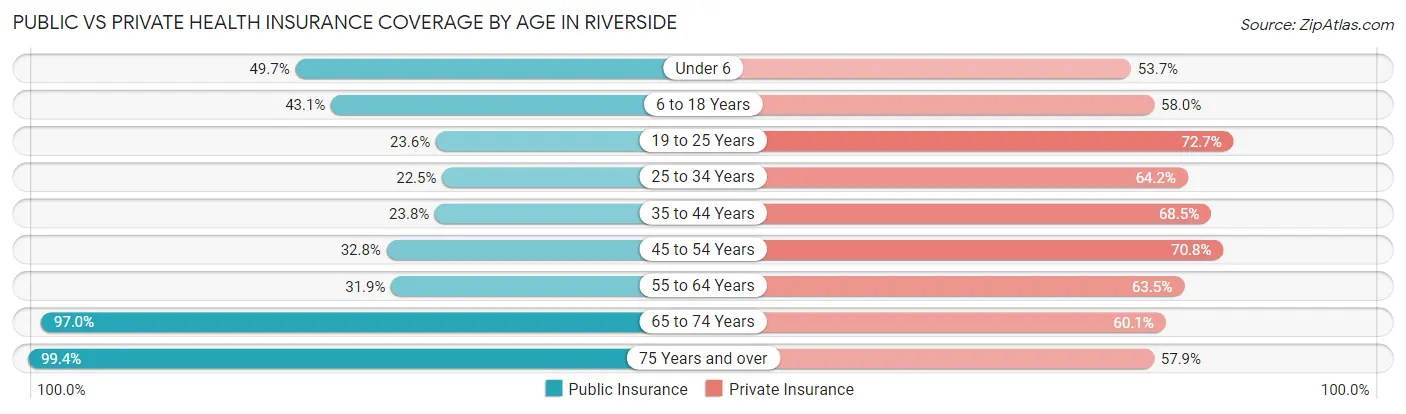
| Age Bracket | Public Insurance | Private Insurance |
| Under 6 | 1,059 (49.7%) | 1,143 (53.7%) |
| 6 to 18 Years | 1,600 (43.1%) | 2,152 (58.0%) |
| 19 to 25 Years | 607 (23.6%) | 1,868 (72.7%) |
| 25 to 34 Years | 762 (22.5%) | 2,177 (64.2%) |
| 35 to 44 Years | 609 (23.8%) | 1,754 (68.5%) |
| 45 to 54 Years | 766 (32.8%) | 1,654 (70.8%) |
| 55 to 64 Years | 1,073 (31.9%) | 2,135 (63.5%) |
| 65 to 74 Years | 2,370 (97.0%) | 1,469 (60.1%) |
| 75 Years and over | 1,254 (99.4%) | 731 (57.9%) |
| Total | 10,100 (42.5%) | 15,083 (63.5%) |
Disability Status by Sex by Age in Riverside
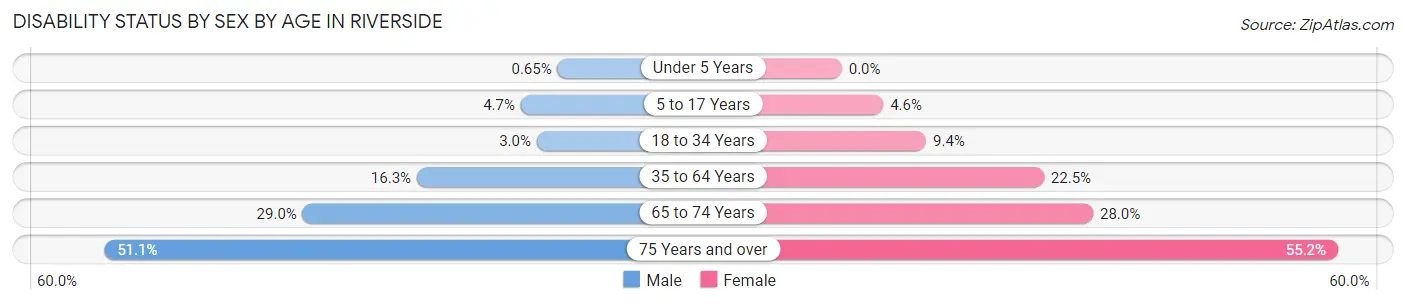
| Age Bracket | Male | Female |
| Under 5 Years | 8 (0.6%) | 0 (0.0%) |
| 5 to 17 Years | 88 (4.7%) | 95 (4.6%) |
| 18 to 34 Years | 95 (3.0%) | 275 (9.4%) |
| 35 to 64 Years | 612 (16.3%) | 1,014 (22.5%) |
| 65 to 74 Years | 310 (29.0%) | 385 (28.0%) |
| 75 Years and over | 226 (51.1%) | 453 (55.2%) |
Disability Class by Sex by Age in Riverside
Disability Class: Hearing Difficulty
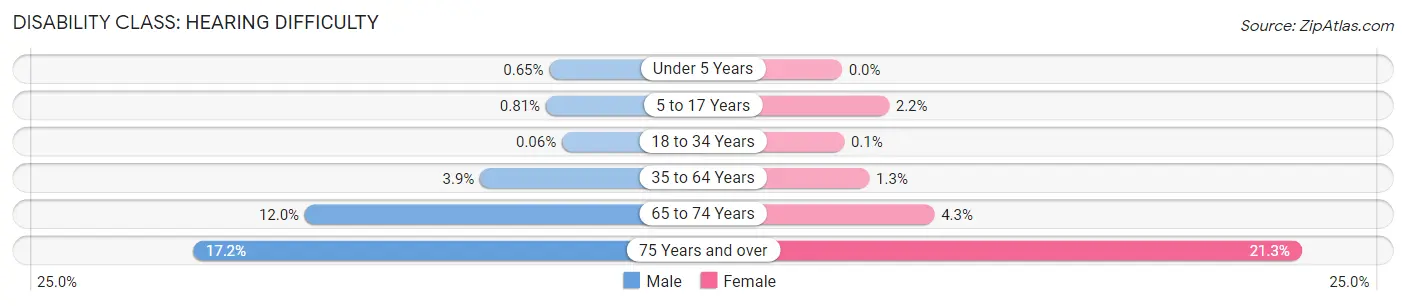
| Age Bracket | Male | Female |
| Under 5 Years | 8 (0.6%) | 0 (0.0%) |
| 5 to 17 Years | 15 (0.8%) | 45 (2.2%) |
| 18 to 34 Years | 2 (0.1%) | 3 (0.1%) |
| 35 to 64 Years | 145 (3.9%) | 57 (1.3%) |
| 65 to 74 Years | 128 (12.0%) | 59 (4.3%) |
| 75 Years and over | 76 (17.2%) | 175 (21.3%) |
Disability Class: Vision Difficulty
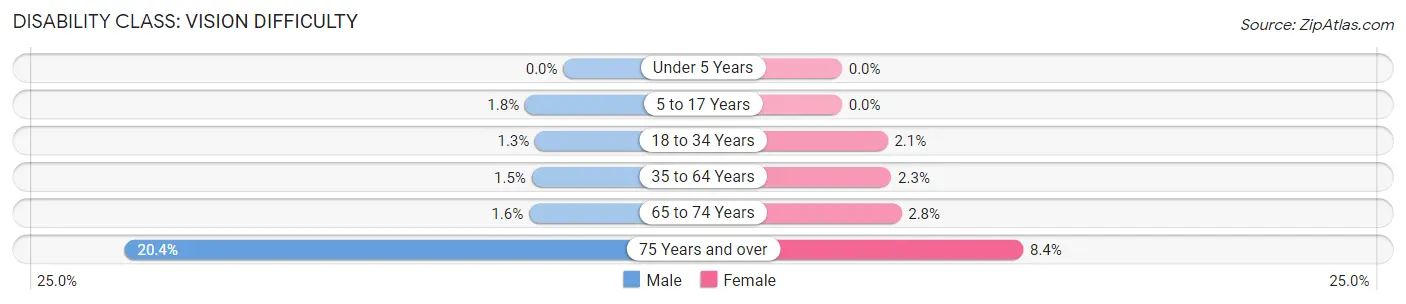
| Age Bracket | Male | Female |
| Under 5 Years | 0 (0.0%) | 0 (0.0%) |
| 5 to 17 Years | 33 (1.8%) | 0 (0.0%) |
| 18 to 34 Years | 42 (1.3%) | 62 (2.1%) |
| 35 to 64 Years | 55 (1.5%) | 103 (2.3%) |
| 65 to 74 Years | 17 (1.6%) | 38 (2.8%) |
| 75 Years and over | 90 (20.4%) | 69 (8.4%) |
Disability Class: Cognitive Difficulty
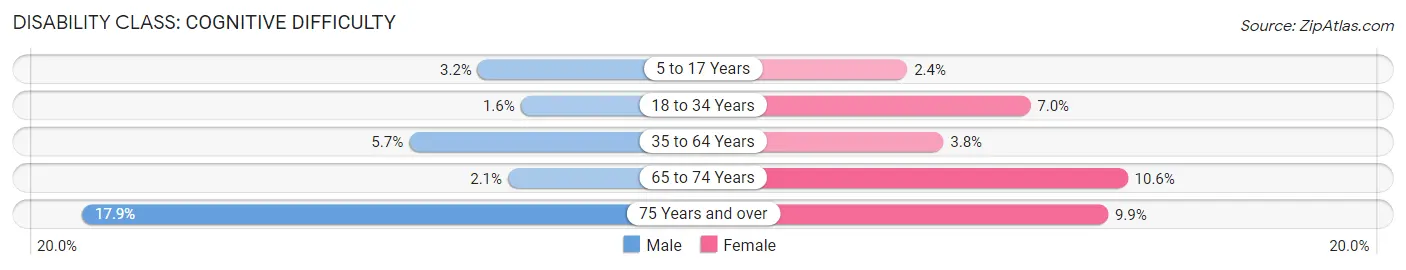
| Age Bracket | Male | Female |
| 5 to 17 Years | 59 (3.2%) | 50 (2.4%) |
| 18 to 34 Years | 51 (1.6%) | 205 (7.0%) |
| 35 to 64 Years | 215 (5.7%) | 170 (3.8%) |
| 65 to 74 Years | 22 (2.1%) | 146 (10.6%) |
| 75 Years and over | 79 (17.9%) | 81 (9.9%) |
Disability Class: Ambulatory Difficulty
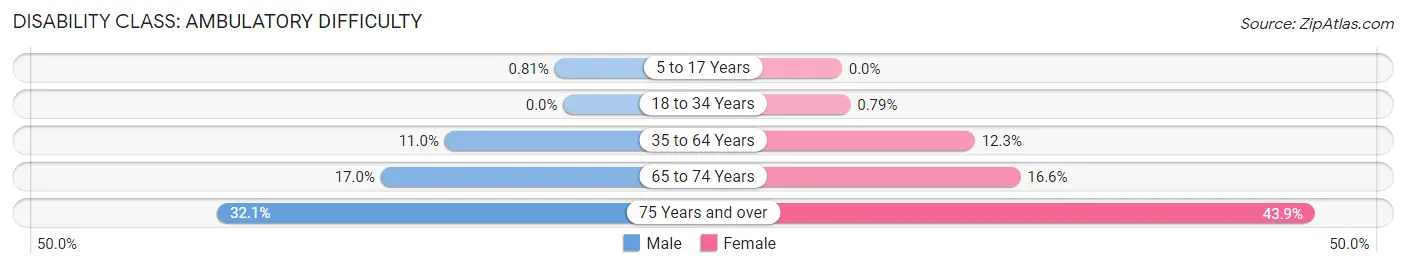
| Age Bracket | Male | Female |
| 5 to 17 Years | 15 (0.8%) | 0 (0.0%) |
| 18 to 34 Years | 0 (0.0%) | 23 (0.8%) |
| 35 to 64 Years | 413 (11.0%) | 556 (12.3%) |
| 65 to 74 Years | 181 (17.0%) | 228 (16.6%) |
| 75 Years and over | 142 (32.1%) | 360 (43.9%) |
Disability Class: Self-Care Difficulty
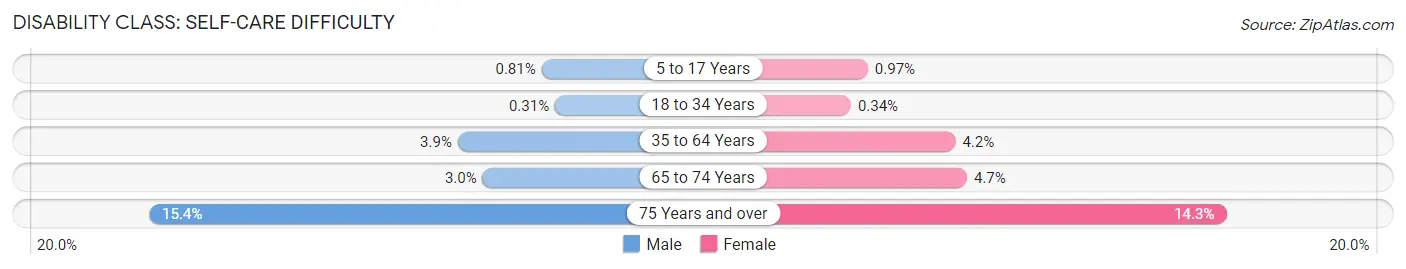
| Age Bracket | Male | Female |
| 5 to 17 Years | 15 (0.8%) | 20 (1.0%) |
| 18 to 34 Years | 10 (0.3%) | 10 (0.3%) |
| 35 to 64 Years | 147 (3.9%) | 190 (4.2%) |
| 65 to 74 Years | 32 (3.0%) | 64 (4.6%) |
| 75 Years and over | 68 (15.4%) | 117 (14.3%) |
Technology Access in Riverside
Computing Device Access in Riverside
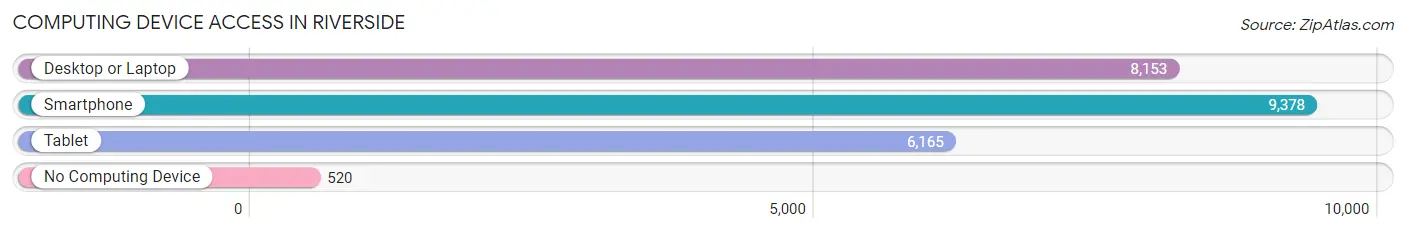
| Device Type | # Households | % Households |
| Desktop or Laptop | 8,153 | 75.3% |
| Smartphone | 9,378 | 86.7% |
| Tablet | 6,165 | 57.0% |
| No Computing Device | 520 | 4.8% |
| Total | 10,820 | 100.0% |
Internet Access in Riverside
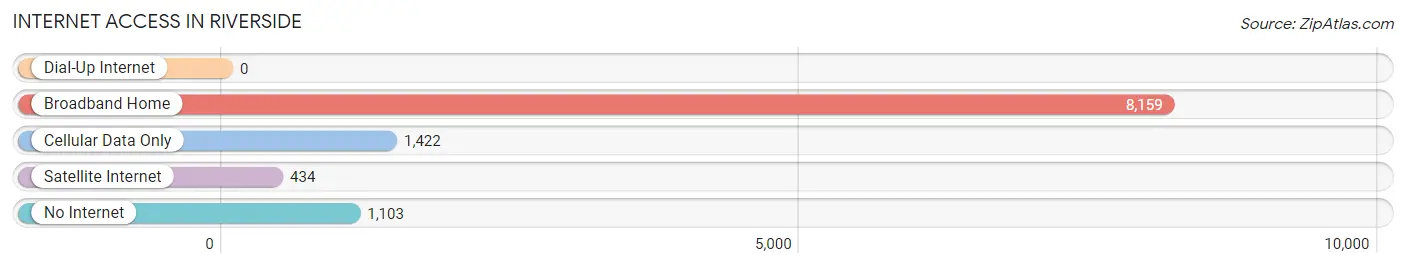
| Internet Type | # Households | % Households |
| Dial-Up Internet | 0 | 0.0% |
| Broadband Home | 8,159 | 75.4% |
| Cellular Data Only | 1,422 | 13.1% |
| Satellite Internet | 434 | 4.0% |
| No Internet | 1,103 | 10.2% |
| Total | 10,820 | 100.0% |
Riverside Summary
Riverside, Ohio is a small city located in Montgomery County, Ohio, United States. The city is situated on the east bank of the Great Miami River, approximately 8 miles north of Dayton. The population of Riverside was 25,201 at the 2010 census, making it the largest city in Montgomery County.
History
Riverside was founded in 1841 by a group of settlers from Pennsylvania. The city was named after the Great Miami River, which runs through the city. The first post office was established in 1845 and the first school was built in 1848. The city was incorporated in 1866.
Riverside experienced rapid growth in the late 19th and early 20th centuries, due to its proximity to Dayton and the Great Miami River. The city was home to several factories, including the Riverside Iron Works, which produced iron products for the railroad industry. The city also had a thriving agricultural industry, with several farms located in the area.
In the late 20th century, Riverside experienced a decline in population due to the decline of the manufacturing industry in the area. The city has since experienced a resurgence in population, due to its close proximity to Dayton and its growing economy.
Geography
Riverside is located at 39°45'25" North, 84°14'17" West (39.756944, -84.238333). According to the United States Census Bureau, the city has a total area of 8.2 square miles (21.2 km2), of which 8.1 square miles (21.0 km2) is land and 0.1 square miles (0.2 km2) is water.
The city is located on the east bank of the Great Miami River, approximately 8 miles north of Dayton. The city is bordered by the cities of Kettering to the south, Moraine to the west, and West Carrollton to the east.
Economy
Riverside has a diverse economy, with a mix of manufacturing, retail, and service industries. The city is home to several large employers, including the Riverside Iron Works, which produces iron products for the railroad industry, and the Riverside Medical Center, which is a major healthcare provider in the area.
The city also has a thriving retail sector, with several shopping centers and malls located in the area. The city is also home to several restaurants, bars, and entertainment venues.
Demographics
As of the 2010 census, the population of Riverside was 25,201. The racial makeup of the city was 79.2% White, 14.2% African American, 0.3% Native American, 1.7% Asian, 0.1% Pacific Islander, 1.3% from other races, and 3.4% from two or more races. Hispanic or Latino of any race were 4.2% of the population.
The median income for a household in the city was $45,945, and the median income for a family was $54,945. The per capita income for the city was $22,845. About 8.3% of families and 10.2% of the population were below the poverty line, including 14.2% of those under age 18 and 6.2% of those age 65 or over.
Common Questions
What is the Total Population of Riverside?
Total Population of Riverside is 24,482.
What is the Total Male Population of Riverside?
Total Male Population of Riverside is 12,069.
What is the Total Female Population of Riverside?
Total Female Population of Riverside is 12,413.
What is the Ratio of Males per 100 Females in Riverside?
There are 97.23 Males per 100 Females in Riverside.
What is the Ratio of Females per 100 Males in Riverside?
There are 102.85 Females per 100 Males in Riverside.
What is the Median Population Age in Riverside?
Median Population Age in Riverside is 34.7 Years.
What is the Average Family Size in Riverside
Average Family Size in Riverside is 2.9 People.
What is the Average Household Size in Riverside
Average Household Size in Riverside is 2.3 People.
What is Per Capita Income in Riverside?
Per Capita income in Riverside is $30,853.
What is the Median Family Income in Riverside?
Median Family Income in Riverside is $71,414.
What is the Median Household income in Riverside?
Median Household Income in Riverside is $56,232.
What is Income or Wage Gap in Riverside?
Income or Wage Gap in Riverside is 40.5%.
Women in Riverside earn 59.5 cents for every dollar earned by a man.
What is Inequality or Gini Index in Riverside?
Inequality or Gini Index in Riverside is 0.40.
How Large is the Labor Force in Riverside?
There are 12,831 People in the Labor Forcein in Riverside.
What is the Percentage of People in the Labor Force in Riverside?
66.5% of People are in the Labor Force in Riverside.
What is the Unemployment Rate in Riverside?
Unemployment Rate in Riverside is 4.1%.