West Carrollton, OH
West Carrollton Map

West Carrollton Overview
13,060
TOTAL POPULATION
6,778
MALE POPULATION
6,282
FEMALE POPULATION
107.90
MALES / 100 FEMALES
92.68
FEMALES / 100 MALES
37.0
MEDIAN AGE
2.8
AVG FAMILY SIZE
2.1
AVG HOUSEHOLD SIZE
$31,827
PER CAPITA INCOME
$76,033
AVG FAMILY INCOME
$54,861
AVG HOUSEHOLD INCOME
25.6%
WAGE / INCOME GAP [ % ]
74.4¢/ $1
WAGE / INCOME GAP [ $ ]
$9,405
FAMILY INCOME DEFICIT
0.41
INEQUALITY / GINI INDEX
7,119
LABOR FORCE [ PEOPLE ]
67.3%
PERCENT IN LABOR FORCE
5.1%
UNEMPLOYMENT RATE
West Carrollton Area Codes
Race in West Carrollton
The most populous races in West Carrollton are White / Caucasian (10,138 | 77.6%), Black / African American (1,870 | 14.3%), and Two or more Races (737 | 5.6%).

| Race | # Population | % Population |
| Asian | 165 | 1.3% |
| Black / African American | 1,870 | 14.3% |
| Hawaiian / Pacific | 0 | 0.0% |
| Hispanic or Latino | 515 | 3.9% |
| Native / Alaskan | 19 | 0.2% |
| White / Caucasian | 10,138 | 77.6% |
| Two or more Races | 737 | 5.6% |
| Some other Race | 131 | 1.0% |
| Total | 13,060 | 100.0% |
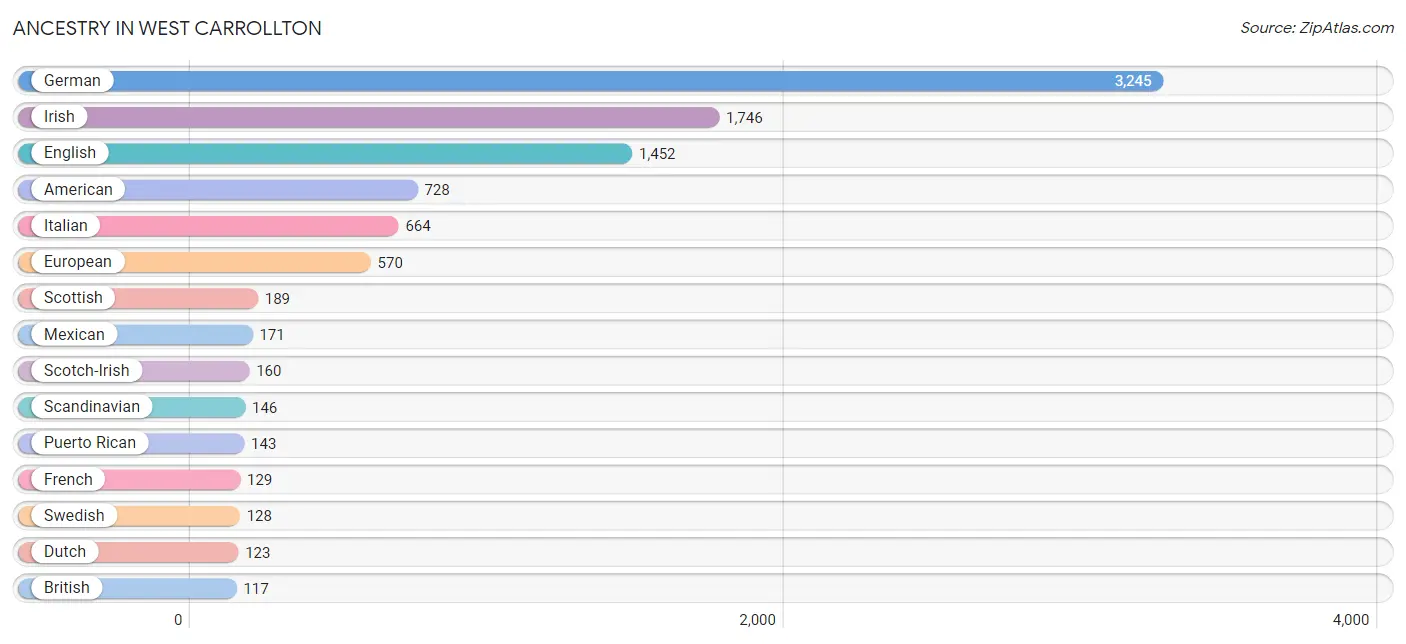
Ancestry in West Carrollton
The most populous ancestries reported in West Carrollton are German (3,245 | 24.8%), Irish (1,746 | 13.4%), English (1,452 | 11.1%), American (728 | 5.6%), and Italian (664 | 5.1%), together accounting for 60.0% of all West Carrollton residents.
| Ancestry | # Population | % Population |
| African | 74 | 0.6% |
| Albanian | 12 | 0.1% |
| American | 728 | 5.6% |
| Arab | 18 | 0.1% |
| Austrian | 28 | 0.2% |
| Bhutanese | 43 | 0.3% |
| British | 117 | 0.9% |
| Burmese | 71 | 0.5% |
| Canadian | 16 | 0.1% |
| Central American | 109 | 0.8% |
| Central American Indian | 13 | 0.1% |
| Cherokee | 30 | 0.2% |
| Colombian | 24 | 0.2% |
| Cuban | 18 | 0.1% |
| Czechoslovakian | 14 | 0.1% |
| Dominican | 15 | 0.1% |
| Dutch | 123 | 0.9% |
| Eastern European | 20 | 0.2% |
| Ecuadorian | 11 | 0.1% |
| English | 1,452 | 11.1% |
| European | 570 | 4.4% |
| Finnish | 14 | 0.1% |
| French | 129 | 1.0% |
| French Canadian | 35 | 0.3% |
| German | 3,245 | 24.8% |
| Greek | 28 | 0.2% |
| Honduran | 38 | 0.3% |
| Hungarian | 9 | 0.1% |
| Indian (Asian) | 84 | 0.6% |
| Irish | 1,746 | 13.4% |
| Italian | 664 | 5.1% |
| Korean | 15 | 0.1% |
| Latvian | 15 | 0.1% |
| Lebanese | 18 | 0.1% |
| Lithuanian | 105 | 0.8% |
| Mexican | 171 | 1.3% |
| Nigerian | 39 | 0.3% |
| Norwegian | 113 | 0.9% |
| Panamanian | 8 | 0.1% |
| Pennsylvania German | 22 | 0.2% |
| Polish | 41 | 0.3% |
| Puerto Rican | 143 | 1.1% |
| Romanian | 24 | 0.2% |
| Russian | 13 | 0.1% |
| Salvadoran | 63 | 0.5% |
| Scandinavian | 146 | 1.1% |
| Scotch-Irish | 160 | 1.2% |
| Scottish | 189 | 1.5% |
| Slavic | 16 | 0.1% |
| Slovene | 13 | 0.1% |
| South American | 35 | 0.3% |
| Spaniard | 14 | 0.1% |
| Sri Lankan | 23 | 0.2% |
| Subsaharan African | 113 | 0.9% |
| Swedish | 128 | 1.0% |
| Swiss | 9 | 0.1% |
| Welsh | 45 | 0.3% | View All 57 Rows |
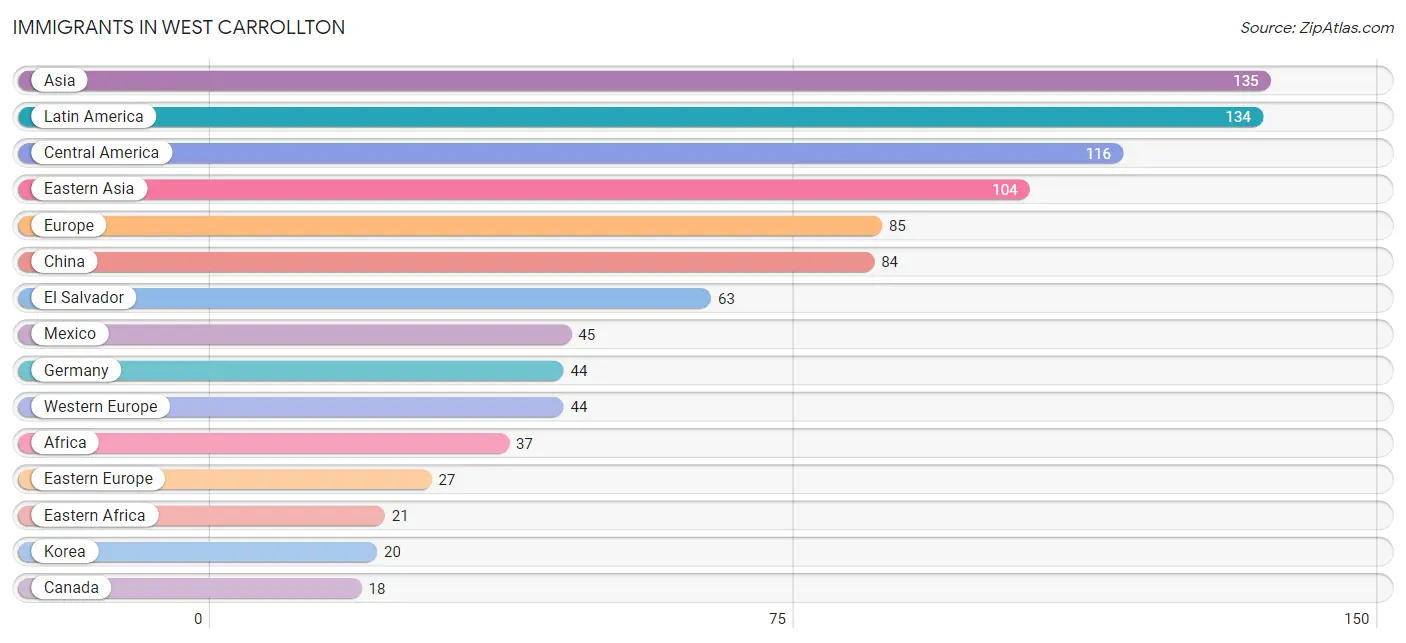
Immigrants in West Carrollton
The most numerous immigrant groups reported in West Carrollton came from Asia (135 | 1.0%), Latin America (134 | 1.0%), Central America (116 | 0.9%), Eastern Asia (104 | 0.8%), and Europe (85 | 0.6%), together accounting for 4.4% of all West Carrollton residents.
| Immigration Origin | # Population | % Population |
| Africa | 37 | 0.3% |
| Albania | 12 | 0.1% |
| Asia | 135 | 1.0% |
| Canada | 18 | 0.1% |
| Caribbean | 18 | 0.1% |
| Central America | 116 | 0.9% |
| China | 84 | 0.6% |
| Cuba | 18 | 0.1% |
| Eastern Africa | 21 | 0.2% |
| Eastern Asia | 104 | 0.8% |
| Eastern Europe | 27 | 0.2% |
| El Salvador | 63 | 0.5% |
| Europe | 85 | 0.6% |
| Germany | 44 | 0.3% |
| Ghana | 16 | 0.1% |
| India | 13 | 0.1% |
| Korea | 20 | 0.2% |
| Latin America | 134 | 1.0% |
| Latvia | 15 | 0.1% |
| Mexico | 45 | 0.3% |
| Panama | 8 | 0.1% |
| South Central Asia | 13 | 0.1% |
| South Eastern Asia | 18 | 0.1% |
| Southern Europe | 14 | 0.1% |
| Spain | 14 | 0.1% |
| Vietnam | 18 | 0.1% |
| Western Africa | 16 | 0.1% |
| Western Europe | 44 | 0.3% | View All 28 Rows |
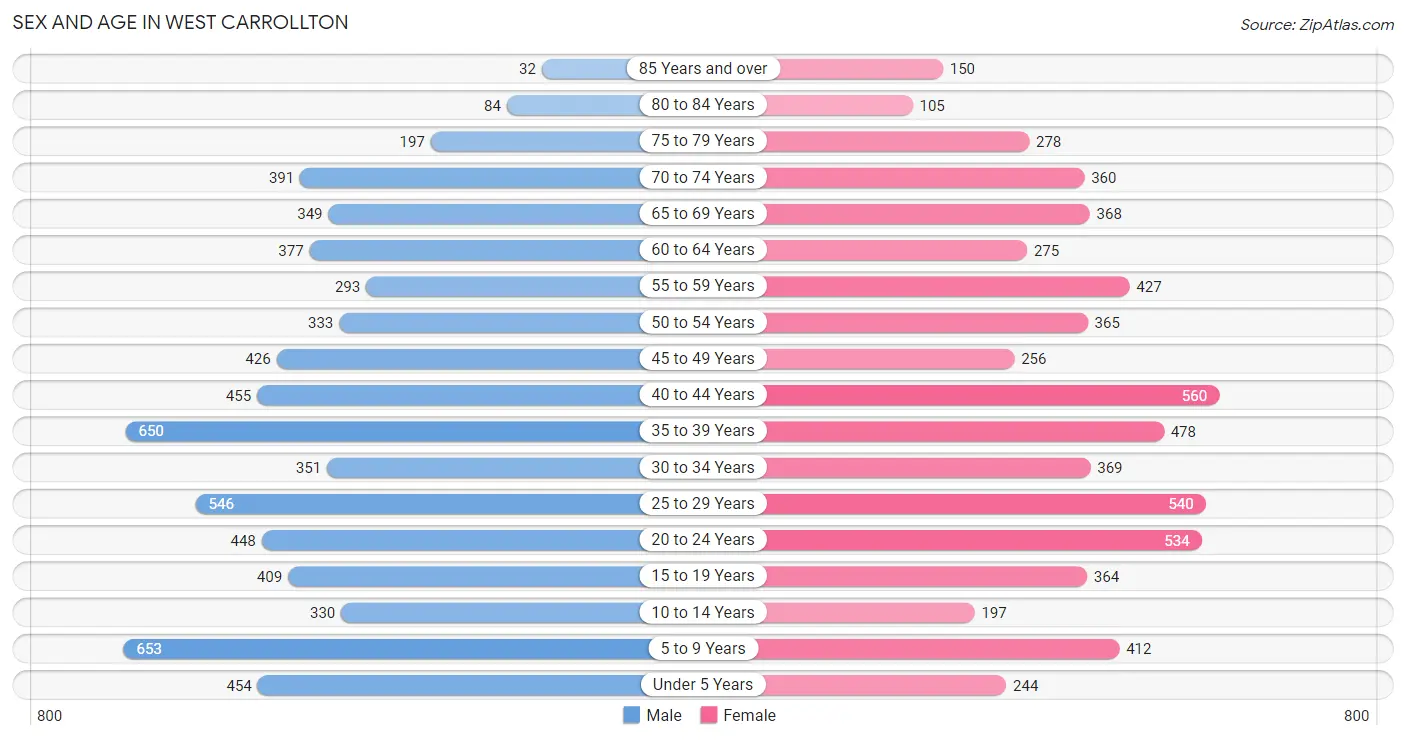
Sex and Age in West Carrollton
Sex and Age in West Carrollton
The most populous age groups in West Carrollton are 5 to 9 Years (653 | 9.6%) for men and 40 to 44 Years (560 | 8.9%) for women.
| Age Bracket | Male | Female |
| Under 5 Years | 454 (6.7%) | 244 (3.9%) |
| 5 to 9 Years | 653 (9.6%) | 412 (6.6%) |
| 10 to 14 Years | 330 (4.9%) | 197 (3.1%) |
| 15 to 19 Years | 409 (6.0%) | 364 (5.8%) |
| 20 to 24 Years | 448 (6.6%) | 534 (8.5%) |
| 25 to 29 Years | 546 (8.1%) | 540 (8.6%) |
| 30 to 34 Years | 351 (5.2%) | 369 (5.9%) |
| 35 to 39 Years | 650 (9.6%) | 478 (7.6%) |
| 40 to 44 Years | 455 (6.7%) | 560 (8.9%) |
| 45 to 49 Years | 426 (6.3%) | 256 (4.1%) |
| 50 to 54 Years | 333 (4.9%) | 365 (5.8%) |
| 55 to 59 Years | 293 (4.3%) | 427 (6.8%) |
| 60 to 64 Years | 377 (5.6%) | 275 (4.4%) |
| 65 to 69 Years | 349 (5.1%) | 368 (5.9%) |
| 70 to 74 Years | 391 (5.8%) | 360 (5.7%) |
| 75 to 79 Years | 197 (2.9%) | 278 (4.4%) |
| 80 to 84 Years | 84 (1.2%) | 105 (1.7%) |
| 85 Years and over | 32 (0.5%) | 150 (2.4%) |
| Total | 6,778 (100.0%) | 6,282 (100.0%) |
Families and Households in West Carrollton
Median Family Size in West Carrollton
The median family size in West Carrollton is 2.81 persons per family, with single female/mother families (604 | 19.7%) accounting for the largest median family size of 3.04 persons per family. On the other hand, single male/father families (363 | 11.8%) represent the smallest median family size with 2.64 persons per family.

| Family Type | # Families | Family Size |
| Married-Couple | 2,101 (68.5%) | 2.78 |
| Single Male/Father | 363 (11.8%) | 2.64 |
| Single Female/Mother | 604 (19.7%) | 3.04 |
| Total Families | 3,068 (100.0%) | 2.81 |
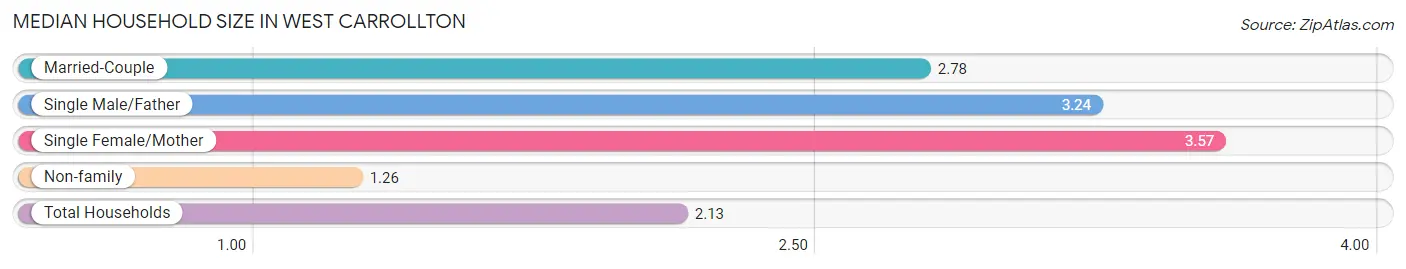
Median Household Size in West Carrollton
The median household size in West Carrollton is 2.13 persons per household, with single female/mother households (604 | 10.0%) accounting for the largest median household size of 3.57 persons per household. non-family households (3,003 | 49.5%) represent the smallest median household size with 1.26 persons per household.
| Household Type | # Households | Household Size |
| Married-Couple | 2,101 (34.6%) | 2.78 |
| Single Male/Father | 363 (6.0%) | 3.24 |
| Single Female/Mother | 604 (10.0%) | 3.57 |
| Non-family | 3,003 (49.5%) | 1.26 |
| Total Households | 6,071 (100.0%) | 2.13 |
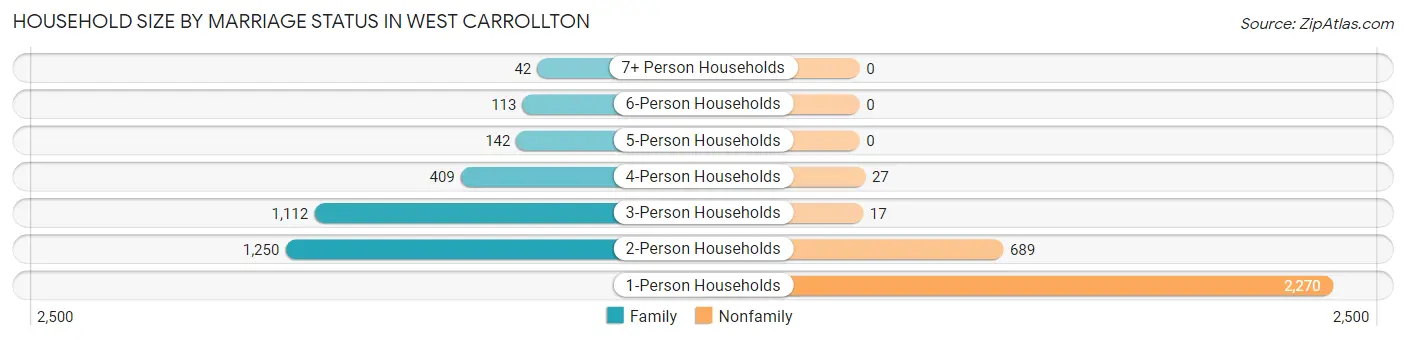
Household Size by Marriage Status in West Carrollton
Out of a total of 6,071 households in West Carrollton, 3,068 (50.5%) are family households, while 3,003 (49.5%) are nonfamily households. The most numerous type of family households are 2-person households, comprising 1,250, and the most common type of nonfamily households are 1-person households, comprising 2,270.
| Household Size | Family Households | Nonfamily Households |
| 1-Person Households | - | 2,270 (37.4%) |
| 2-Person Households | 1,250 (20.6%) | 689 (11.4%) |
| 3-Person Households | 1,112 (18.3%) | 17 (0.3%) |
| 4-Person Households | 409 (6.7%) | 27 (0.4%) |
| 5-Person Households | 142 (2.3%) | 0 (0.0%) |
| 6-Person Households | 113 (1.9%) | 0 (0.0%) |
| 7+ Person Households | 42 (0.7%) | 0 (0.0%) |
| Total | 3,068 (50.5%) | 3,003 (49.5%) |
Female Fertility in West Carrollton
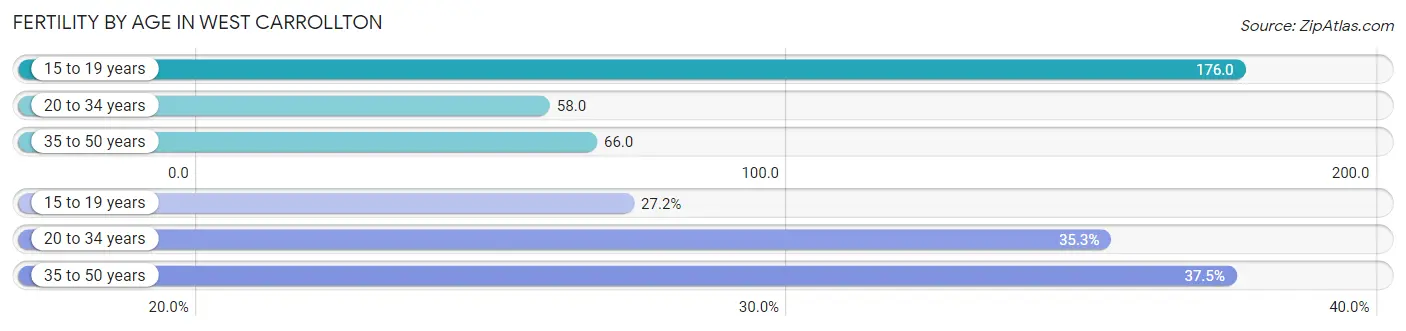
Fertility by Age in West Carrollton
Average fertility rate in West Carrollton is 75.0 births per 1,000 women. Women in the age bracket of 15 to 19 years have the highest fertility rate with 176.0 births per 1,000 women. Women in the age bracket of 35 to 50 years acount for 37.4% of all women with births.
| Age Bracket | Women with Births | Births / 1,000 Women |
| 15 to 19 years | 64 (27.2%) | 176.0 |
| 20 to 34 years | 83 (35.3%) | 58.0 |
| 35 to 50 years | 88 (37.4%) | 66.0 |
| Total | 235 (100.0%) | 75.0 |
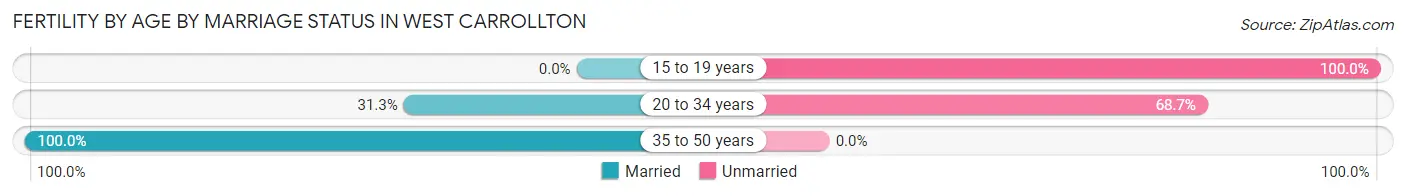
Fertility by Age by Marriage Status in West Carrollton
48.5% of women with births (235) in West Carrollton are married. The highest percentage of unmarried women with births falls into 15 to 19 years age bracket with 100.0% of them unmarried at the time of birth, while the lowest percentage of unmarried women with births belong to 35 to 50 years age bracket with 0.0% of them unmarried.
| Age Bracket | Married | Unmarried |
| 15 to 19 years | 0 (0.0%) | 64 (100.0%) |
| 20 to 34 years | 26 (31.3%) | 57 (68.7%) |
| 35 to 50 years | 88 (100.0%) | 0 (0.0%) |
| Total | 114 (48.5%) | 121 (51.5%) |
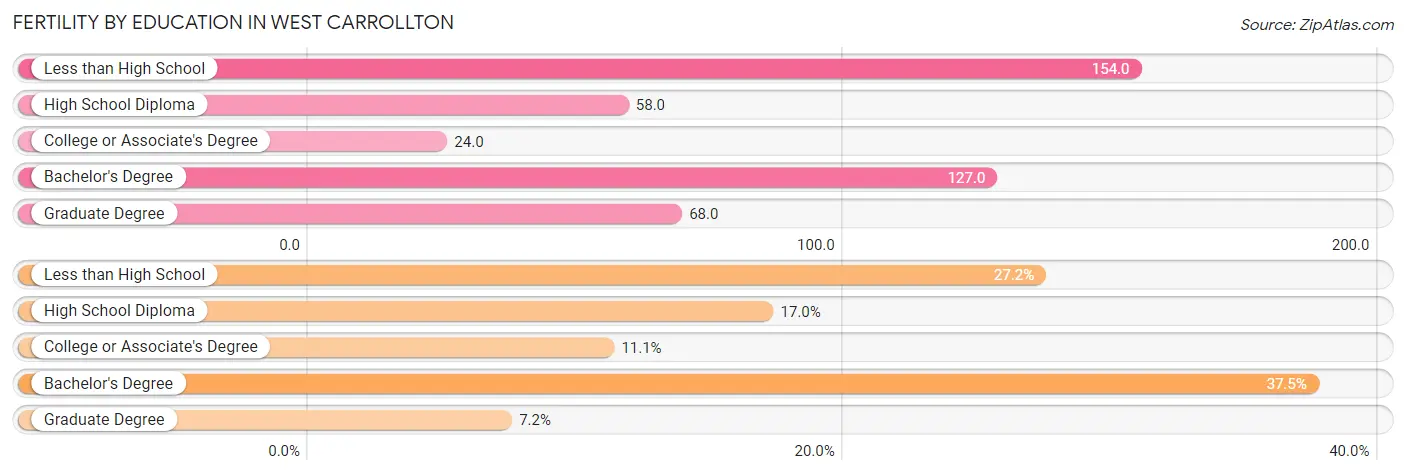
Fertility by Education in West Carrollton
Average fertility rate in West Carrollton is 75.0 births per 1,000 women. Women with the education attainment of less than high school have the highest fertility rate of 154.0 births per 1,000 women, while women with the education attainment of college or associate's degree have the lowest fertility at 24.0 births per 1,000 women. Women with the education attainment of bachelor's degree represent 37.4% of all women with births.
| Educational Attainment | Women with Births | Births / 1,000 Women |
| Less than High School | 64 (27.2%) | 154.0 |
| High School Diploma | 40 (17.0%) | 58.0 |
| College or Associate's Degree | 26 (11.1%) | 24.0 |
| Bachelor's Degree | 88 (37.4%) | 127.0 |
| Graduate Degree | 17 (7.2%) | 68.0 |
| Total | 235 (100.0%) | 75.0 |
Fertility by Education by Marriage Status in West Carrollton
51.5% of women with births in West Carrollton are unmarried. Women with the educational attainment of college or associate's degree are most likely to be married with 100.0% of them married at childbirth, while women with the educational attainment of less than high school are least likely to be married with 100.0% of them unmarried at childbirth.
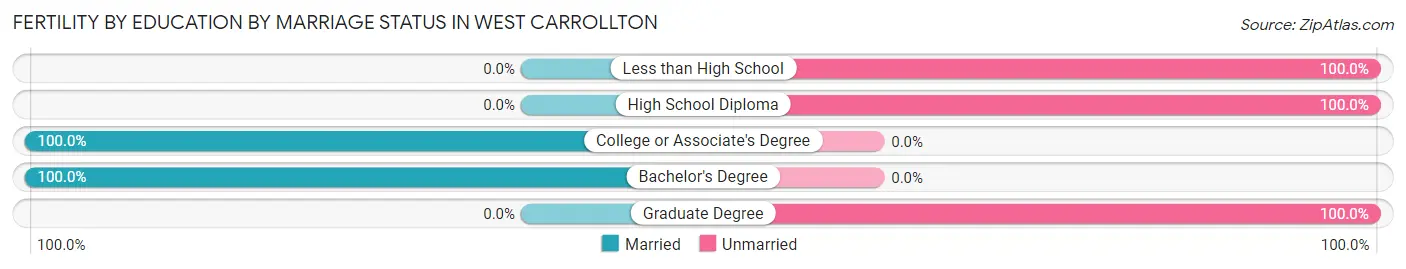
| Educational Attainment | Married | Unmarried |
| Less than High School | 0 (0.0%) | 64 (100.0%) |
| High School Diploma | 0 (0.0%) | 40 (100.0%) |
| College or Associate's Degree | 26 (100.0%) | 0 (0.0%) |
| Bachelor's Degree | 88 (100.0%) | 0 (0.0%) |
| Graduate Degree | 0 (0.0%) | 17 (100.0%) |
| Total | 114 (48.5%) | 121 (51.5%) |
Income in West Carrollton
Income Overview in West Carrollton
Per Capita Income in West Carrollton is $31,827, while median incomes of families and households are $76,033 and $54,861 respectively.
| Characteristic | Number | Measure |
| Per Capita Income | 13,060 | $31,827 |
| Median Family Income | 3,068 | $76,033 |
| Mean Family Income | 3,068 | $84,300 |
| Median Household Income | 6,071 | $54,861 |
| Mean Household Income | 6,071 | $69,010 |
| Income Deficit | 3,068 | $9,405 |
| Wage / Income Gap (%) | 13,060 | 25.60% |
| Wage / Income Gap ($) | 13,060 | 74.40¢ per $1 |
| Gini / Inequality Index | 13,060 | 0.41 |
Earnings by Sex in West Carrollton
Average Earnings in West Carrollton are $41,540, $46,037 for men and $34,250 for women, a difference of 25.6%.
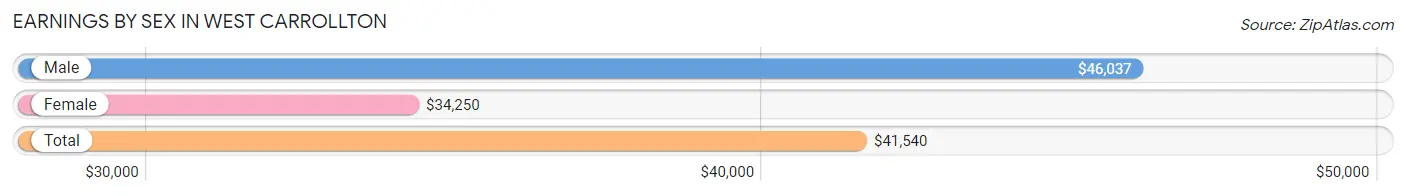
| Sex | Number | Average Earnings |
| Male | 3,807 (53.4%) | $46,037 |
| Female | 3,326 (46.6%) | $34,250 |
| Total | 7,133 (100.0%) | $41,540 |
Earnings by Sex by Income Bracket in West Carrollton
The most common earnings brackets in West Carrollton are $45,000 to $49,999 for men (550 | 14.4%) and $30,000 to $34,999 for women (359 | 10.8%).
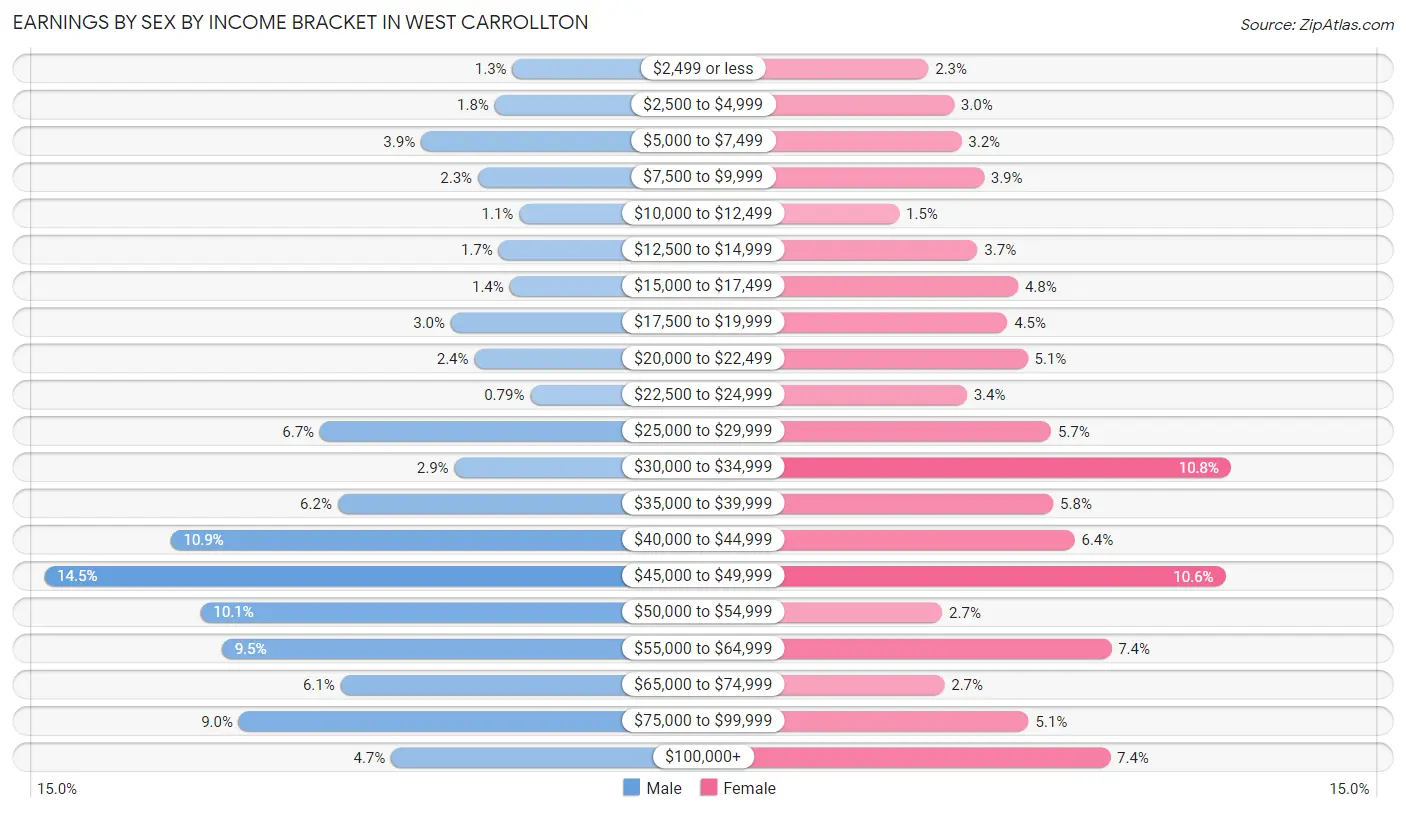
| Income | Male | Female |
| $2,499 or less | 49 (1.3%) | 76 (2.3%) |
| $2,500 to $4,999 | 68 (1.8%) | 100 (3.0%) |
| $5,000 to $7,499 | 147 (3.9%) | 107 (3.2%) |
| $7,500 to $9,999 | 86 (2.3%) | 128 (3.8%) |
| $10,000 to $12,499 | 42 (1.1%) | 49 (1.5%) |
| $12,500 to $14,999 | 64 (1.7%) | 122 (3.7%) |
| $15,000 to $17,499 | 52 (1.4%) | 160 (4.8%) |
| $17,500 to $19,999 | 115 (3.0%) | 150 (4.5%) |
| $20,000 to $22,499 | 90 (2.4%) | 169 (5.1%) |
| $22,500 to $24,999 | 30 (0.8%) | 112 (3.4%) |
| $25,000 to $29,999 | 255 (6.7%) | 191 (5.7%) |
| $30,000 to $34,999 | 111 (2.9%) | 359 (10.8%) |
| $35,000 to $39,999 | 236 (6.2%) | 193 (5.8%) |
| $40,000 to $44,999 | 415 (10.9%) | 213 (6.4%) |
| $45,000 to $49,999 | 550 (14.4%) | 354 (10.6%) |
| $50,000 to $54,999 | 383 (10.1%) | 89 (2.7%) |
| $55,000 to $64,999 | 360 (9.5%) | 247 (7.4%) |
| $65,000 to $74,999 | 233 (6.1%) | 91 (2.7%) |
| $75,000 to $99,999 | 342 (9.0%) | 170 (5.1%) |
| $100,000+ | 179 (4.7%) | 246 (7.4%) |
| Total | 3,807 (100.0%) | 3,326 (100.0%) |
Earnings by Sex by Educational Attainment in West Carrollton
Average earnings in West Carrollton are $47,064 for men and $38,682 for women, a difference of 17.8%. Men with an educational attainment of graduate degree enjoy the highest average annual earnings of $74,557, while those with high school diploma education earn the least with $45,591. Women with an educational attainment of bachelor's degree earn the most with the average annual earnings of $64,496, while those with college or associate's degree education have the smallest earnings of $30,741.
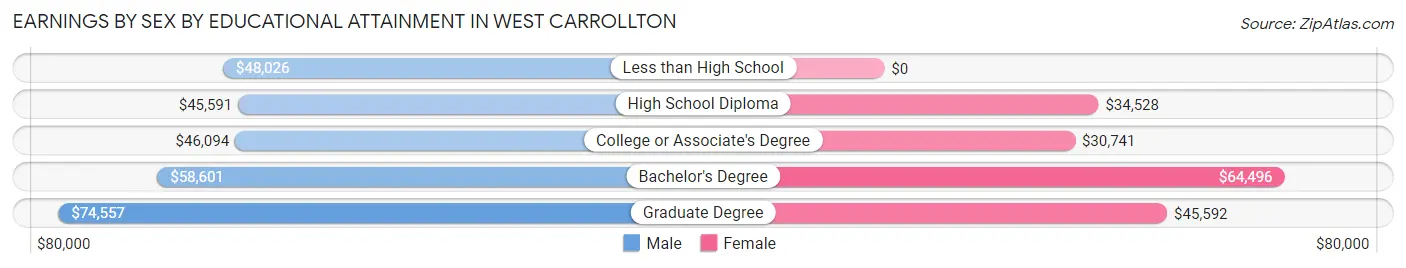
| Educational Attainment | Male Income | Female Income |
| Less than High School | $48,026 | $0 |
| High School Diploma | $45,591 | $34,528 |
| College or Associate's Degree | $46,094 | $30,741 |
| Bachelor's Degree | $58,601 | $64,496 |
| Graduate Degree | $74,557 | $45,592 |
| Total | $47,064 | $38,682 |
Family Income in West Carrollton
Family Income Brackets in West Carrollton
According to the West Carrollton family income data, there are 598 families falling into the $75,000 to $99,999 income range, which is the most common income bracket and makes up 19.5% of all families. Conversely, the $10,000 to $14,999 income bracket is the least frequent group with only 46 families (1.5%) belonging to this category.
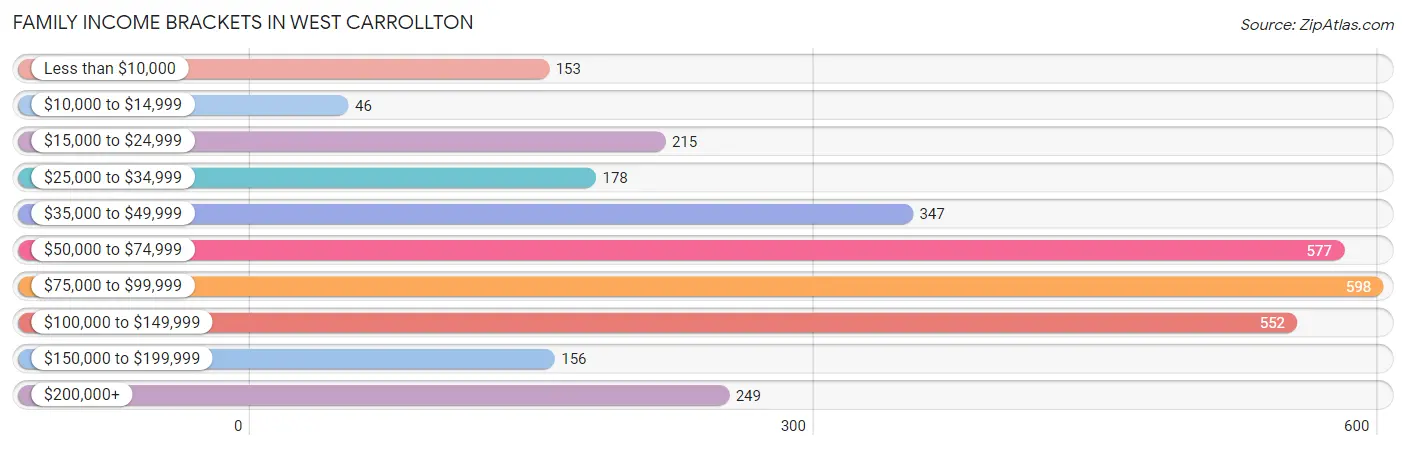
| Income Bracket | # Families | % Families |
| Less than $10,000 | 153 | 5.0% |
| $10,000 to $14,999 | 46 | 1.5% |
| $15,000 to $24,999 | 215 | 7.0% |
| $25,000 to $34,999 | 178 | 5.8% |
| $35,000 to $49,999 | 347 | 11.3% |
| $50,000 to $74,999 | 577 | 18.8% |
| $75,000 to $99,999 | 598 | 19.5% |
| $100,000 to $149,999 | 552 | 18.0% |
| $150,000 to $199,999 | 156 | 5.1% |
| $200,000+ | 249 | 8.1% |
Family Income by Famaliy Size in West Carrollton
3-person families (977 | 31.8%) account for the highest median family income in West Carrollton with $97,765 per family, while 3-person families (977 | 31.8%) have the highest median income of $32,588 per family member.
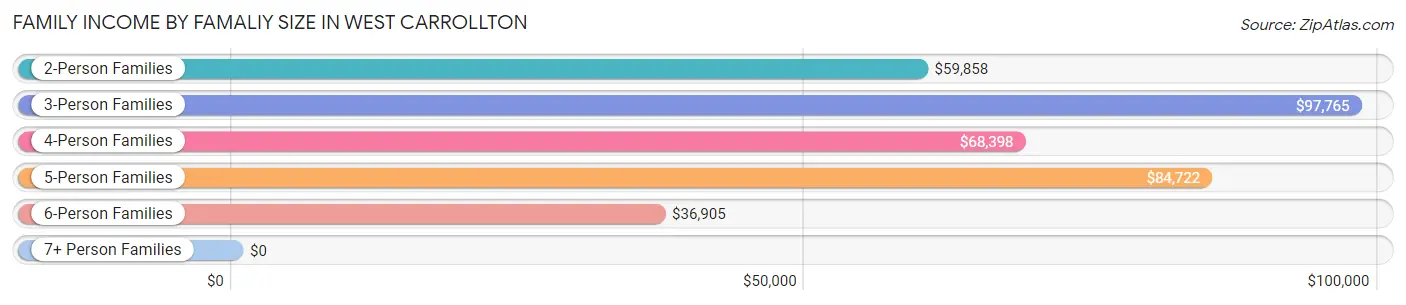
| Income Bracket | # Families | Median Income |
| 2-Person Families | 1,492 (48.6%) | $59,858 |
| 3-Person Families | 977 (31.8%) | $97,765 |
| 4-Person Families | 373 (12.2%) | $68,398 |
| 5-Person Families | 162 (5.3%) | $84,722 |
| 6-Person Families | 64 (2.1%) | $36,905 |
| 7+ Person Families | 0 (0.0%) | $0 |
| Total | 3,068 (100.0%) | $76,033 |
Family Income by Number of Earners in West Carrollton
The median family income in West Carrollton is $76,033, with families comprising 2 earners (1,320) having the highest median family income of $100,389, while families with no earners (440) have the lowest median family income of $31,932, accounting for 43.0% and 14.3% of families, respectively.
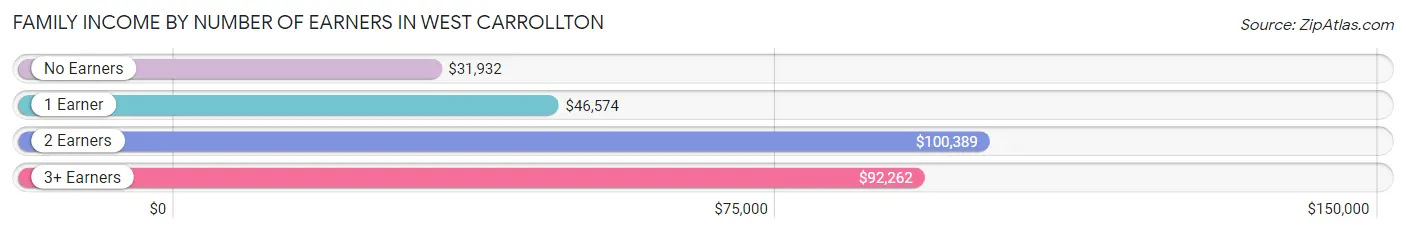
| Number of Earners | # Families | Median Income |
| No Earners | 440 (14.3%) | $31,932 |
| 1 Earner | 1,022 (33.3%) | $46,574 |
| 2 Earners | 1,320 (43.0%) | $100,389 |
| 3+ Earners | 286 (9.3%) | $92,262 |
| Total | 3,068 (100.0%) | $76,033 |
Household Income in West Carrollton
Household Income Brackets in West Carrollton
With 1,269 households falling in the category, the $50,000 to $74,999 income range is the most frequent in West Carrollton, accounting for 20.9% of all households. In contrast, only 158 households (2.6%) fall into the $150,000 to $199,999 income bracket, making it the least populous group.
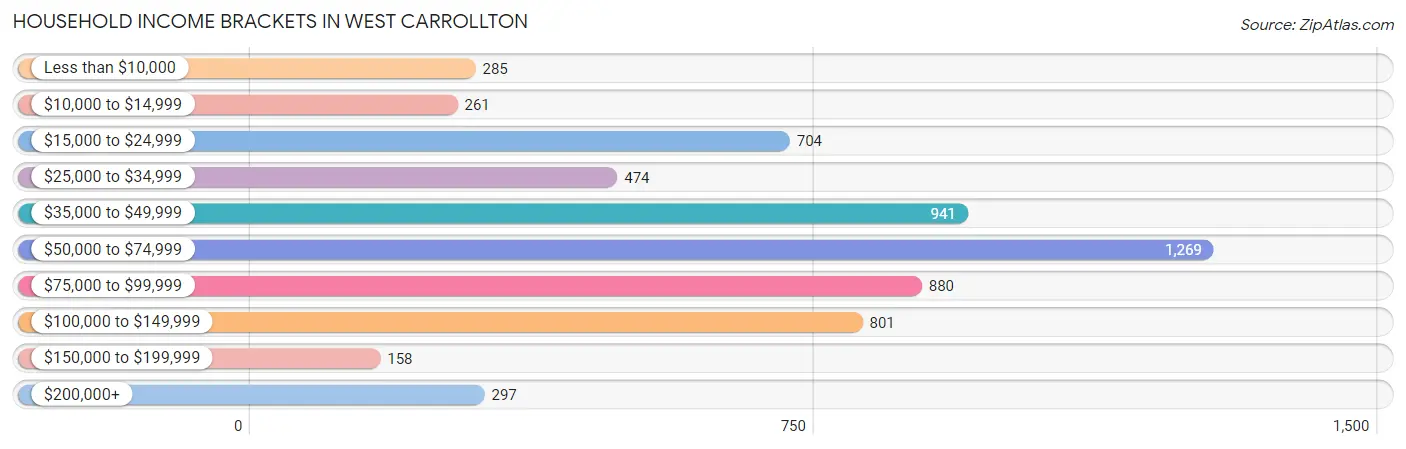
| Income Bracket | # Households | % Households |
| Less than $10,000 | 285 | 4.7% |
| $10,000 to $14,999 | 261 | 4.3% |
| $15,000 to $24,999 | 704 | 11.6% |
| $25,000 to $34,999 | 474 | 7.8% |
| $35,000 to $49,999 | 941 | 15.5% |
| $50,000 to $74,999 | 1,269 | 20.9% |
| $75,000 to $99,999 | 880 | 14.5% |
| $100,000 to $149,999 | 801 | 13.2% |
| $150,000 to $199,999 | 158 | 2.6% |
| $200,000+ | 297 | 4.9% |
Household Income by Householder Age in West Carrollton
The median household income in West Carrollton is $54,861, with the highest median household income of $78,048 found in the 25 to 44 years age bracket for the primary householder. A total of 2,253 households (37.1%) fall into this category. Meanwhile, the 65+ years age bracket for the primary householder has the lowest median household income of $29,613, with 1,676 households (27.6%) in this group.
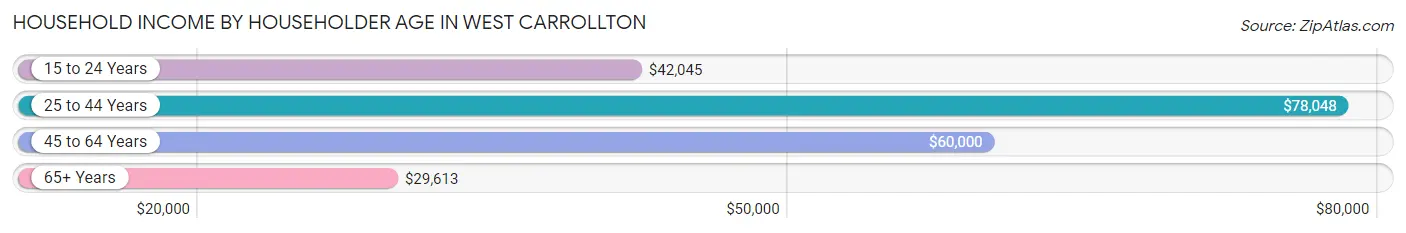
| Income Bracket | # Households | Median Income |
| 15 to 24 Years | 572 (9.4%) | $42,045 |
| 25 to 44 Years | 2,253 (37.1%) | $78,048 |
| 45 to 64 Years | 1,570 (25.9%) | $60,000 |
| 65+ Years | 1,676 (27.6%) | $29,613 |
| Total | 6,071 (100.0%) | $54,861 |
Poverty in West Carrollton
Income Below Poverty by Sex and Age in West Carrollton
With 16.6% poverty level for males and 16.1% for females among the residents of West Carrollton, under 5 year old males and 55 to 64 year old females are the most vulnerable to poverty, with 205 males (50.6%) and 228 females (32.5%) in their respective age groups living below the poverty level.
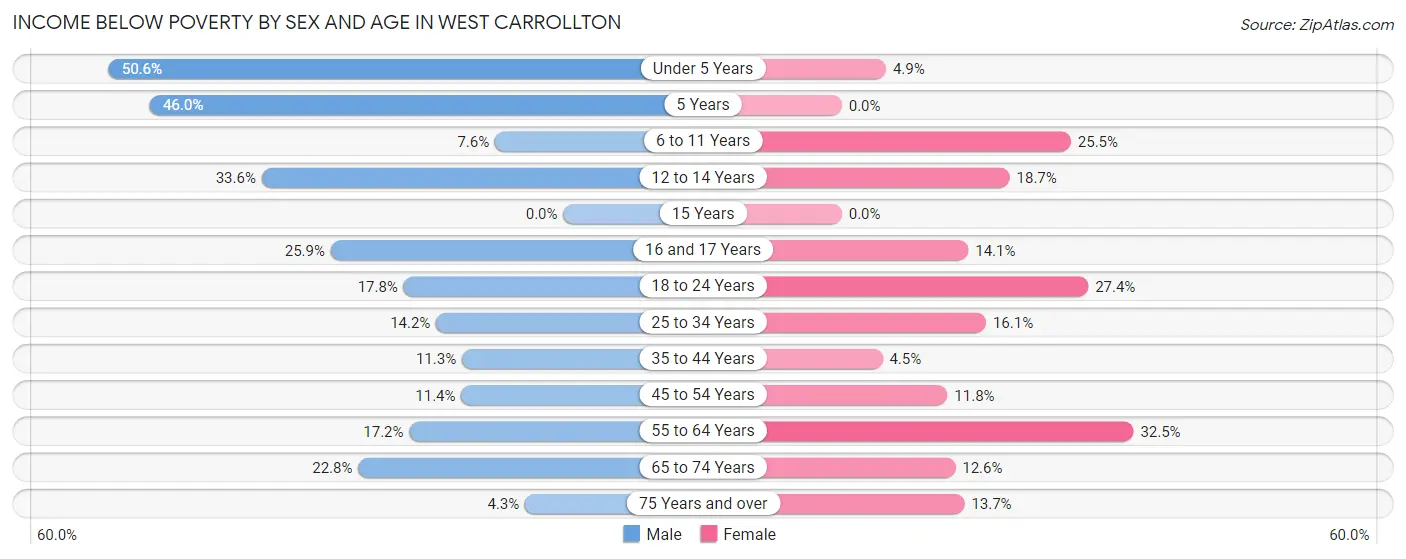
| Age Bracket | Male | Female |
| Under 5 Years | 205 (50.6%) | 12 (4.9%) |
| 5 Years | 29 (46.0%) | 0 (0.0%) |
| 6 to 11 Years | 58 (7.6%) | 100 (25.5%) |
| 12 to 14 Years | 44 (33.6%) | 20 (18.7%) |
| 15 Years | 0 (0.0%) | 0 (0.0%) |
| 16 and 17 Years | 36 (25.9%) | 21 (14.1%) |
| 18 to 24 Years | 101 (17.8%) | 194 (27.4%) |
| 25 to 34 Years | 127 (14.2%) | 146 (16.1%) |
| 35 to 44 Years | 124 (11.3%) | 47 (4.5%) |
| 45 to 54 Years | 85 (11.4%) | 73 (11.8%) |
| 55 to 64 Years | 113 (17.2%) | 228 (32.5%) |
| 65 to 74 Years | 169 (22.8%) | 92 (12.6%) |
| 75 Years and over | 12 (4.3%) | 69 (13.7%) |
| Total | 1,103 (16.6%) | 1,002 (16.1%) |
Income Above Poverty by Sex and Age in West Carrollton
According to the poverty statistics in West Carrollton, males aged 15 years and females aged 5 years are the age groups that are most secure financially, with 100.0% of males and 100.0% of females in these age groups living above the poverty line.
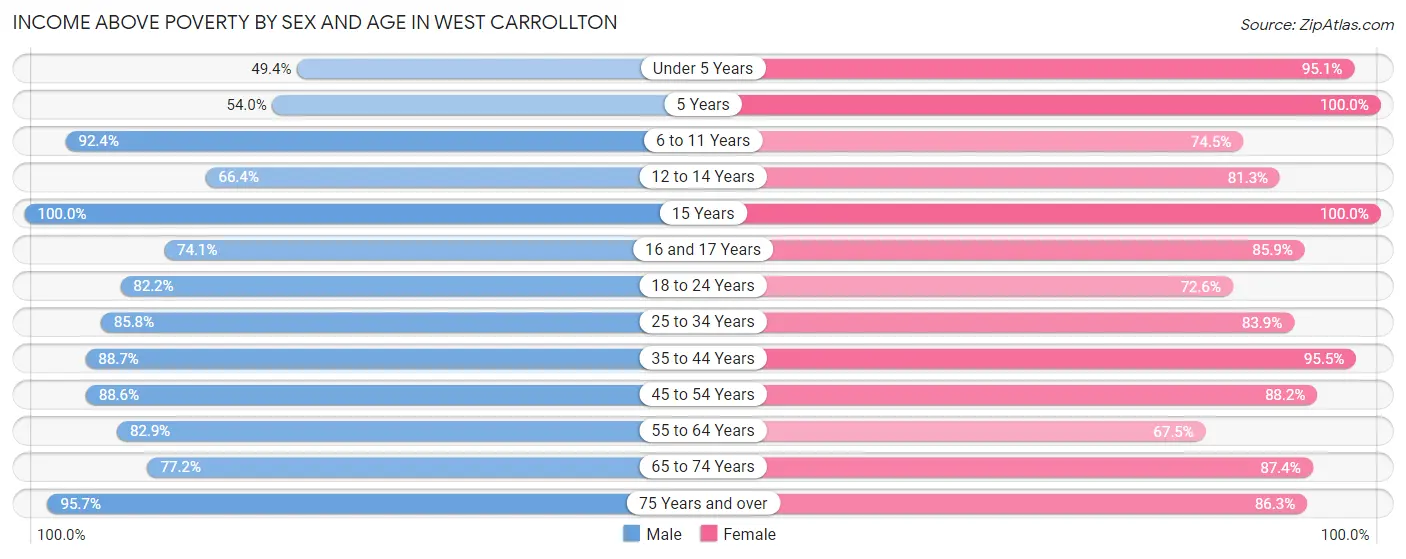
| Age Bracket | Male | Female |
| Under 5 Years | 200 (49.4%) | 232 (95.1%) |
| 5 Years | 34 (54.0%) | 83 (100.0%) |
| 6 to 11 Years | 704 (92.4%) | 292 (74.5%) |
| 12 to 14 Years | 87 (66.4%) | 87 (81.3%) |
| 15 Years | 150 (100.0%) | 42 (100.0%) |
| 16 and 17 Years | 103 (74.1%) | 128 (85.9%) |
| 18 to 24 Years | 467 (82.2%) | 513 (72.6%) |
| 25 to 34 Years | 770 (85.8%) | 763 (83.9%) |
| 35 to 44 Years | 974 (88.7%) | 991 (95.5%) |
| 45 to 54 Years | 663 (88.6%) | 548 (88.2%) |
| 55 to 64 Years | 546 (82.9%) | 474 (67.5%) |
| 65 to 74 Years | 571 (77.2%) | 636 (87.4%) |
| 75 Years and over | 270 (95.7%) | 436 (86.3%) |
| Total | 5,539 (83.4%) | 5,225 (83.9%) |
Income Below Poverty Among Married-Couple Families in West Carrollton
The poverty statistics for married-couple families in West Carrollton show that 2.3% or 49 of the total 2,101 families live below the poverty line. Families with 1 or 2 children have the highest poverty rate of 2.6%, comprising of 20 families. On the other hand, families with 3 or 4 children have the lowest poverty rate of 0.0%, which includes 0 families.
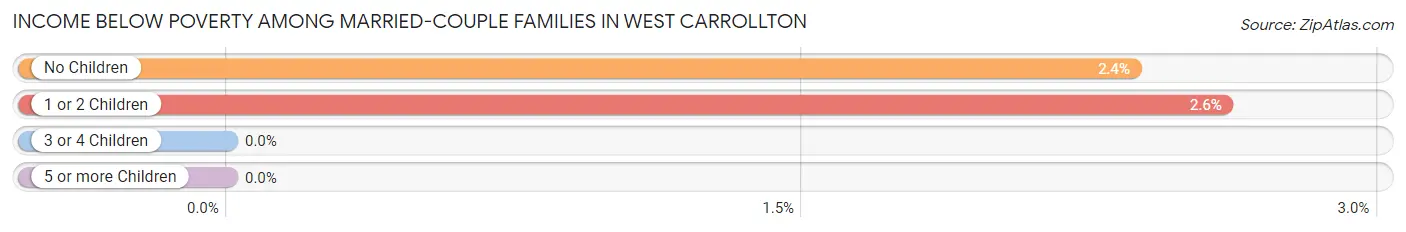
| Children | Above Poverty | Below Poverty |
| No Children | 1,202 (97.6%) | 29 (2.4%) |
| 1 or 2 Children | 748 (97.4%) | 20 (2.6%) |
| 3 or 4 Children | 102 (100.0%) | 0 (0.0%) |
| 5 or more Children | 0 (0.0%) | 0 (0.0%) |
| Total | 2,052 (97.7%) | 49 (2.3%) |
Income Below Poverty Among Single-Parent Households in West Carrollton
According to the poverty data in West Carrollton, 54.3% or 197 single-father households and 28.6% or 173 single-mother households are living below the poverty line. Among single-father households, those with 3 or 4 children have the highest poverty rate, with 42 households (100.0%) experiencing poverty. Likewise, among single-mother households, those with 1 or 2 children have the highest poverty rate, with 153 households (41.2%) falling below the poverty line.
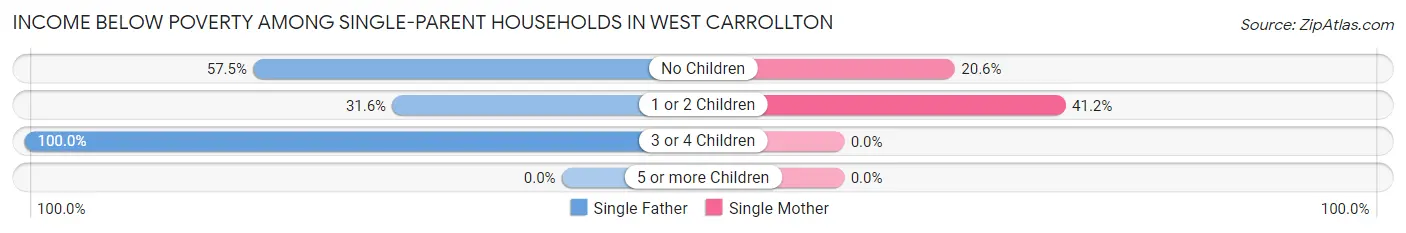
| Children | Single Father | Single Mother |
| No Children | 119 (57.5%) | 20 (20.6%) |
| 1 or 2 Children | 36 (31.6%) | 153 (41.2%) |
| 3 or 4 Children | 42 (100.0%) | 0 (0.0%) |
| 5 or more Children | 0 (0.0%) | 0 (0.0%) |
| Total | 197 (54.3%) | 173 (28.6%) |
Income Below Poverty Among Married-Couple vs Single-Parent Households in West Carrollton
The poverty data for West Carrollton shows that 49 of the married-couple family households (2.3%) and 370 of the single-parent households (38.3%) are living below the poverty level. Within the married-couple family households, those with 1 or 2 children have the highest poverty rate, with 20 households (2.6%) falling below the poverty line. Among the single-parent households, those with no children have the highest poverty rate, with 139 household (45.7%) living below poverty.
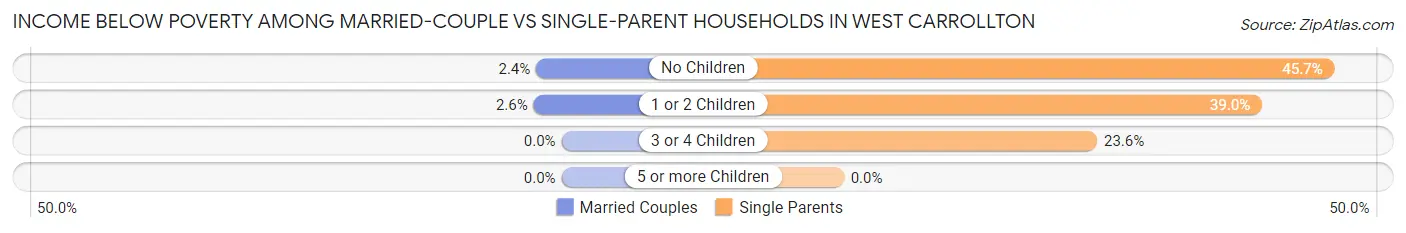
| Children | Married-Couple Families | Single-Parent Households |
| No Children | 29 (2.4%) | 139 (45.7%) |
| 1 or 2 Children | 20 (2.6%) | 189 (39.0%) |
| 3 or 4 Children | 0 (0.0%) | 42 (23.6%) |
| 5 or more Children | 0 (0.0%) | 0 (0.0%) |
| Total | 49 (2.3%) | 370 (38.3%) |
Employment Characteristics in West Carrollton
Employment by Class of Employer in West Carrollton
Among the 6,550 employed individuals in West Carrollton, private company employees (4,779 | 73.0%), not-for-profit organizations (823 | 12.6%), and local government employees (294 | 4.5%) make up the most common classes of employment.
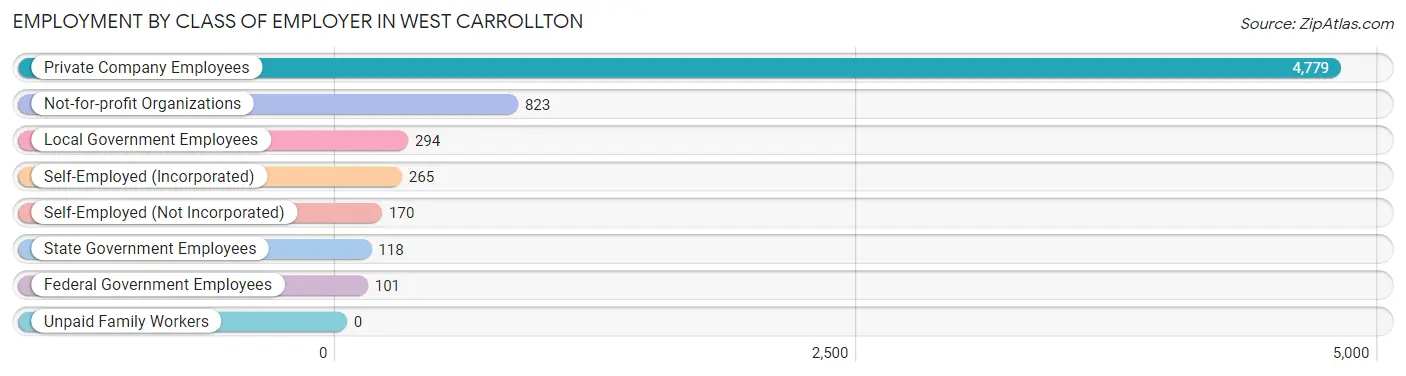
| Employer Class | # Employees | % Employees |
| Private Company Employees | 4,779 | 73.0% |
| Self-Employed (Incorporated) | 265 | 4.1% |
| Self-Employed (Not Incorporated) | 170 | 2.6% |
| Not-for-profit Organizations | 823 | 12.6% |
| Local Government Employees | 294 | 4.5% |
| State Government Employees | 118 | 1.8% |
| Federal Government Employees | 101 | 1.5% |
| Unpaid Family Workers | 0 | 0.0% |
| Total | 6,550 | 100.0% |
Employment Status by Age in West Carrollton
According to the labor force statistics for West Carrollton, out of the total population over 16 years of age (10,578), 67.3% or 7,119 individuals are in the labor force, with 5.1% or 363 of them unemployed. The age group with the highest labor force participation rate is 35 to 44 years, with 93.0% or 1,993 individuals in the labor force. Within the labor force, the 16 to 19 years age range has the highest percentage of unemployed individuals, with 33.2% or 124 of them being unemployed.
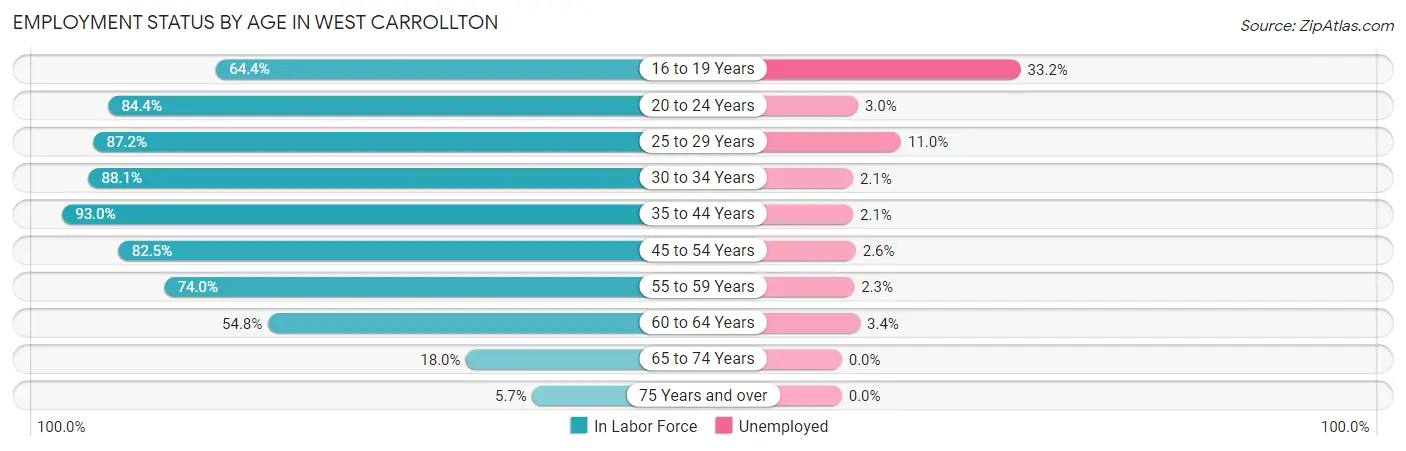
| Age Bracket | In Labor Force | Unemployed |
| 16 to 19 Years | 374 (64.4%) | 124 (33.2%) |
| 20 to 24 Years | 829 (84.4%) | 25 (3.0%) |
| 25 to 29 Years | 947 (87.2%) | 104 (11.0%) |
| 30 to 34 Years | 634 (88.1%) | 13 (2.1%) |
| 35 to 44 Years | 1,993 (93.0%) | 42 (2.1%) |
| 45 to 54 Years | 1,138 (82.5%) | 30 (2.6%) |
| 55 to 59 Years | 533 (74.0%) | 12 (2.3%) |
| 60 to 64 Years | 357 (54.8%) | 12 (3.4%) |
| 65 to 74 Years | 264 (18.0%) | 0 (0.0%) |
| 75 Years and over | 48 (5.7%) | 0 (0.0%) |
| Total | 7,119 (67.3%) | 363 (5.1%) |
Employment Status by Educational Attainment in West Carrollton
According to labor force statistics for West Carrollton, 83.6% of individuals (5,602) out of the total population between 25 and 64 years of age (6,701) are in the labor force, with 3.8% or 213 of them being unemployed. The group with the highest labor force participation rate are those with the educational attainment of bachelor's degree or higher, with 96.6% or 1,451 individuals in the labor force. Within the labor force, individuals with college / associate degree education have the highest percentage of unemployment, with 5.1% or 97 of them being unemployed.
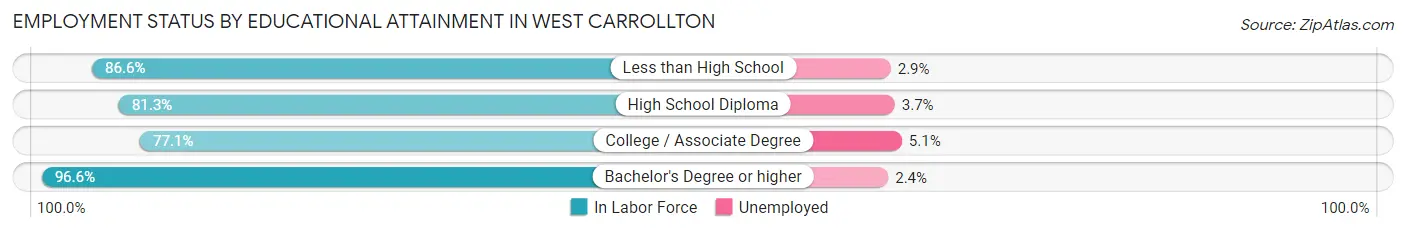
| Educational Attainment | In Labor Force | Unemployed |
| Less than High School | 453 (86.6%) | 15 (2.9%) |
| High School Diploma | 1,794 (81.3%) | 82 (3.7%) |
| College / Associate Degree | 1,904 (77.1%) | 126 (5.1%) |
| Bachelor's Degree or higher | 1,451 (96.6%) | 36 (2.4%) |
| Total | 5,602 (83.6%) | 255 (3.8%) |
Employment Occupations by Sex in West Carrollton
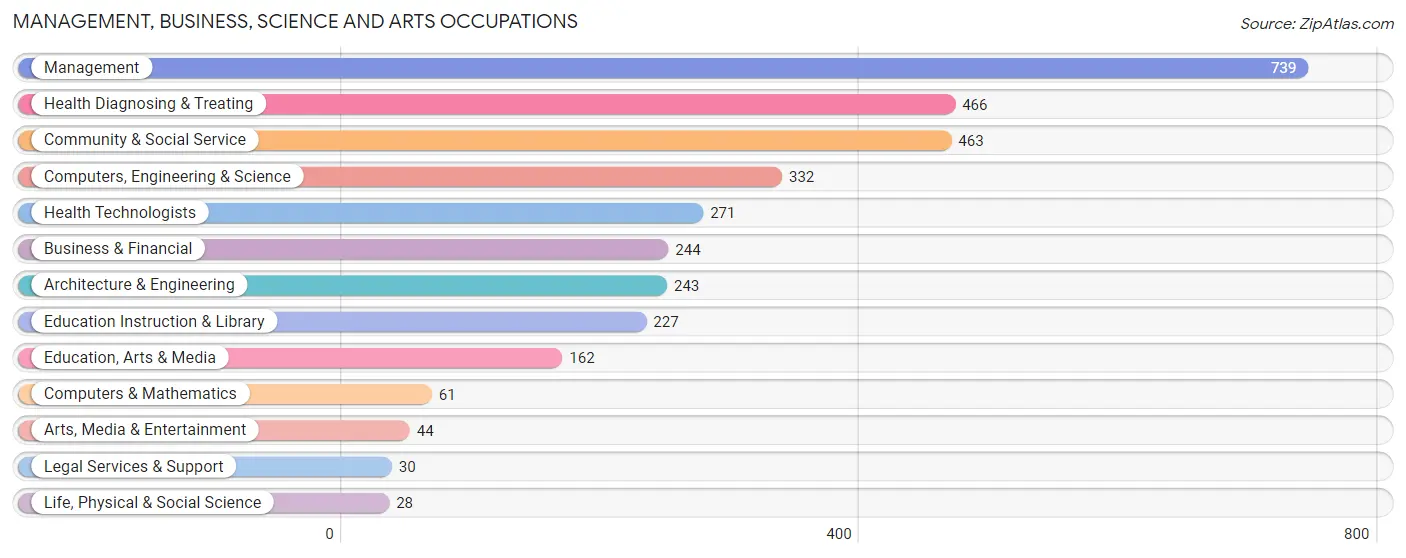
Management, Business, Science and Arts Occupations
The most common Management, Business, Science and Arts occupations in West Carrollton are Management (739 | 10.9%), Health Diagnosing & Treating (466 | 6.9%), Community & Social Service (463 | 6.9%), Computers, Engineering & Science (332 | 4.9%), and Health Technologists (271 | 4.0%).
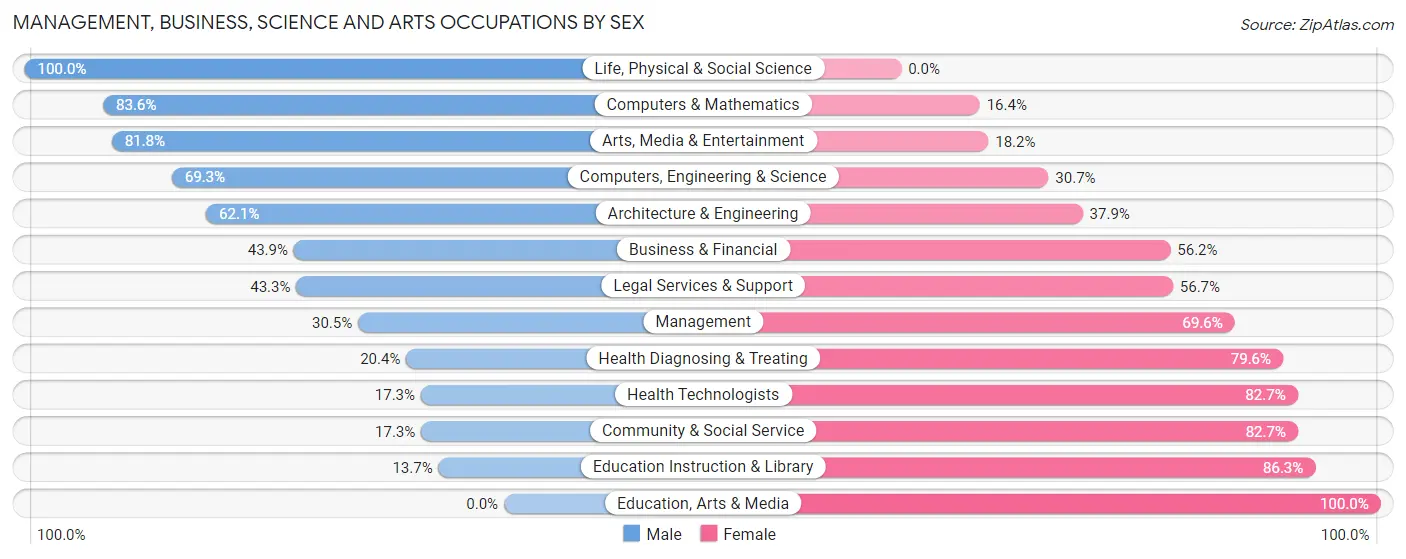
Management, Business, Science and Arts Occupations by Sex
Within the Management, Business, Science and Arts occupations in West Carrollton, the most male-oriented occupations are Life, Physical & Social Science (100.0%), Computers & Mathematics (83.6%), and Arts, Media & Entertainment (81.8%), while the most female-oriented occupations are Education, Arts & Media (100.0%), Education Instruction & Library (86.3%), and Community & Social Service (82.7%).
| Occupation | Male | Female |
| Management | 225 (30.4%) | 514 (69.6%) |
| Business & Financial | 107 (43.9%) | 137 (56.1%) |
| Computers, Engineering & Science | 230 (69.3%) | 102 (30.7%) |
| Computers & Mathematics | 51 (83.6%) | 10 (16.4%) |
| Architecture & Engineering | 151 (62.1%) | 92 (37.9%) |
| Life, Physical & Social Science | 28 (100.0%) | 0 (0.0%) |
| Community & Social Service | 80 (17.3%) | 383 (82.7%) |
| Education, Arts & Media | 0 (0.0%) | 162 (100.0%) |
| Legal Services & Support | 13 (43.3%) | 17 (56.7%) |
| Education Instruction & Library | 31 (13.7%) | 196 (86.3%) |
| Arts, Media & Entertainment | 36 (81.8%) | 8 (18.2%) |
| Health Diagnosing & Treating | 95 (20.4%) | 371 (79.6%) |
| Health Technologists | 47 (17.3%) | 224 (82.7%) |
| Total (Category) | 737 (32.8%) | 1,507 (67.2%) |
| Total (Overall) | 3,595 (53.2%) | 3,161 (46.8%) |
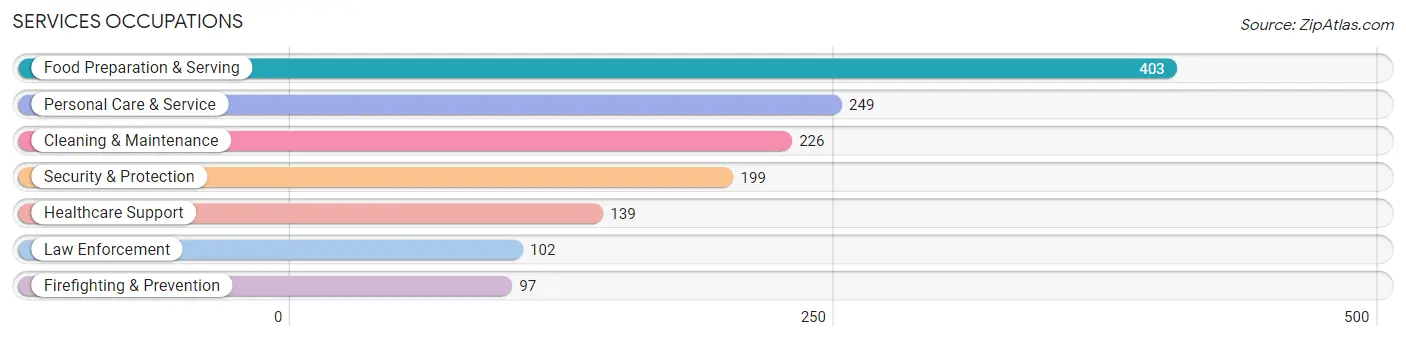
Services Occupations
The most common Services occupations in West Carrollton are Food Preparation & Serving (403 | 6.0%), Personal Care & Service (249 | 3.7%), Cleaning & Maintenance (226 | 3.4%), Security & Protection (199 | 2.9%), and Healthcare Support (139 | 2.1%).
Services Occupations by Sex
Within the Services occupations in West Carrollton, the most male-oriented occupations are Firefighting & Prevention (100.0%), Security & Protection (98.5%), and Law Enforcement (97.1%), while the most female-oriented occupations are Healthcare Support (86.3%), Personal Care & Service (83.9%), and Food Preparation & Serving (71.5%).
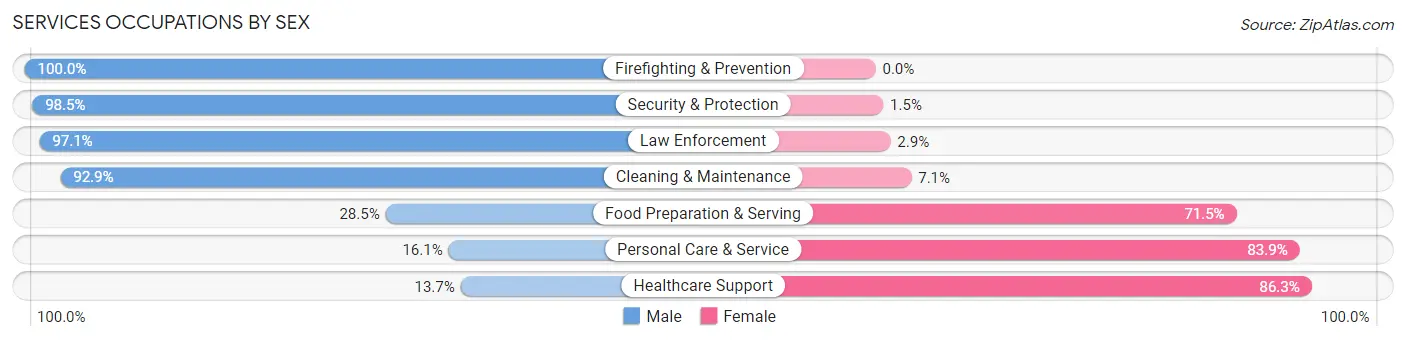
| Occupation | Male | Female |
| Healthcare Support | 19 (13.7%) | 120 (86.3%) |
| Security & Protection | 196 (98.5%) | 3 (1.5%) |
| Firefighting & Prevention | 97 (100.0%) | 0 (0.0%) |
| Law Enforcement | 99 (97.1%) | 3 (2.9%) |
| Food Preparation & Serving | 115 (28.5%) | 288 (71.5%) |
| Cleaning & Maintenance | 210 (92.9%) | 16 (7.1%) |
| Personal Care & Service | 40 (16.1%) | 209 (83.9%) |
| Total (Category) | 580 (47.7%) | 636 (52.3%) |
| Total (Overall) | 3,595 (53.2%) | 3,161 (46.8%) |
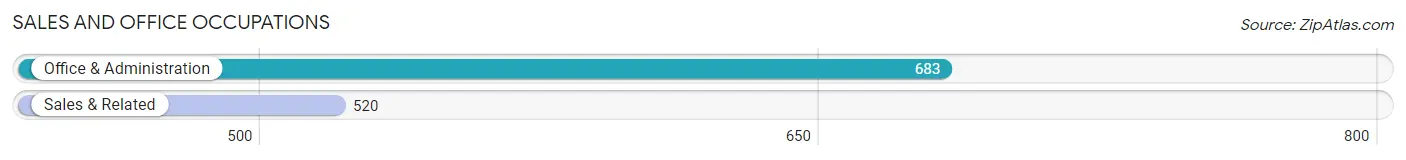
Sales and Office Occupations
The most common Sales and Office occupations in West Carrollton are Office & Administration (683 | 10.1%), and Sales & Related (520 | 7.7%).
Sales and Office Occupations by Sex
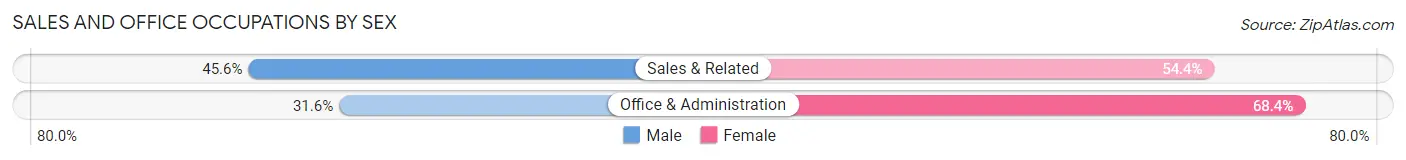
| Occupation | Male | Female |
| Sales & Related | 237 (45.6%) | 283 (54.4%) |
| Office & Administration | 216 (31.6%) | 467 (68.4%) |
| Total (Category) | 453 (37.7%) | 750 (62.3%) |
| Total (Overall) | 3,595 (53.2%) | 3,161 (46.8%) |
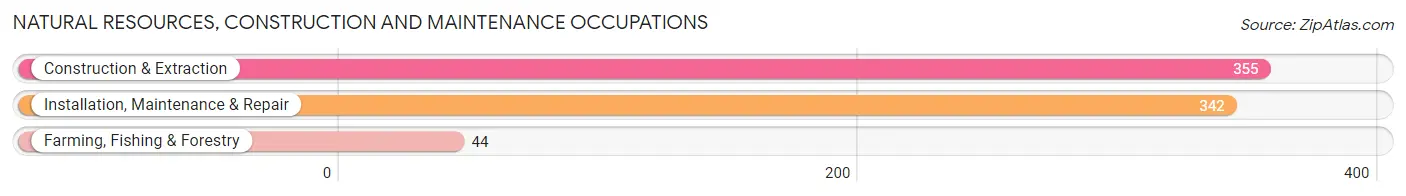
Natural Resources, Construction and Maintenance Occupations
The most common Natural Resources, Construction and Maintenance occupations in West Carrollton are Construction & Extraction (355 | 5.2%), Installation, Maintenance & Repair (342 | 5.1%), and Farming, Fishing & Forestry (44 | 0.6%).
Natural Resources, Construction and Maintenance Occupations by Sex
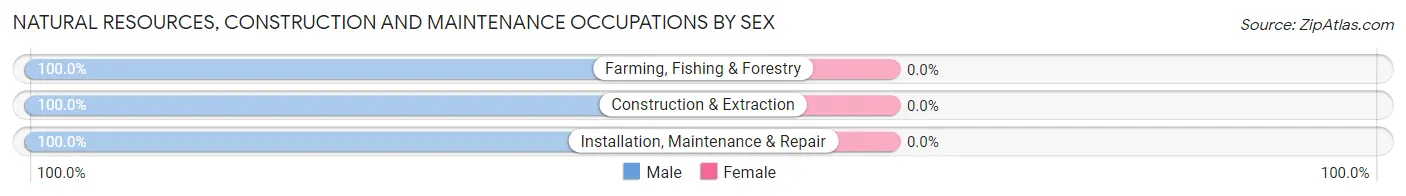
| Occupation | Male | Female |
| Farming, Fishing & Forestry | 44 (100.0%) | 0 (0.0%) |
| Construction & Extraction | 355 (100.0%) | 0 (0.0%) |
| Installation, Maintenance & Repair | 342 (100.0%) | 0 (0.0%) |
| Total (Category) | 741 (100.0%) | 0 (0.0%) |
| Total (Overall) | 3,595 (53.2%) | 3,161 (46.8%) |
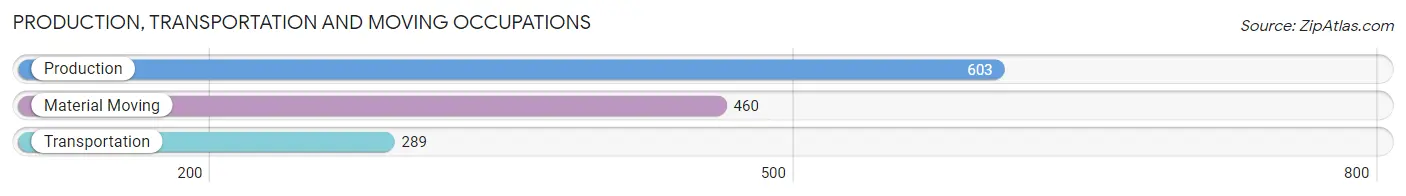
Production, Transportation and Moving Occupations
The most common Production, Transportation and Moving occupations in West Carrollton are Production (603 | 8.9%), Material Moving (460 | 6.8%), and Transportation (289 | 4.3%).
Production, Transportation and Moving Occupations by Sex
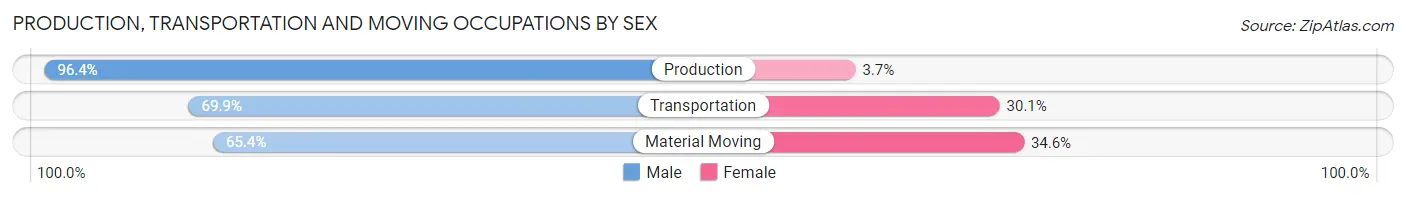
| Occupation | Male | Female |
| Production | 581 (96.4%) | 22 (3.6%) |
| Transportation | 202 (69.9%) | 87 (30.1%) |
| Material Moving | 301 (65.4%) | 159 (34.6%) |
| Total (Category) | 1,084 (80.2%) | 268 (19.8%) |
| Total (Overall) | 3,595 (53.2%) | 3,161 (46.8%) |
Employment Industries by Sex in West Carrollton
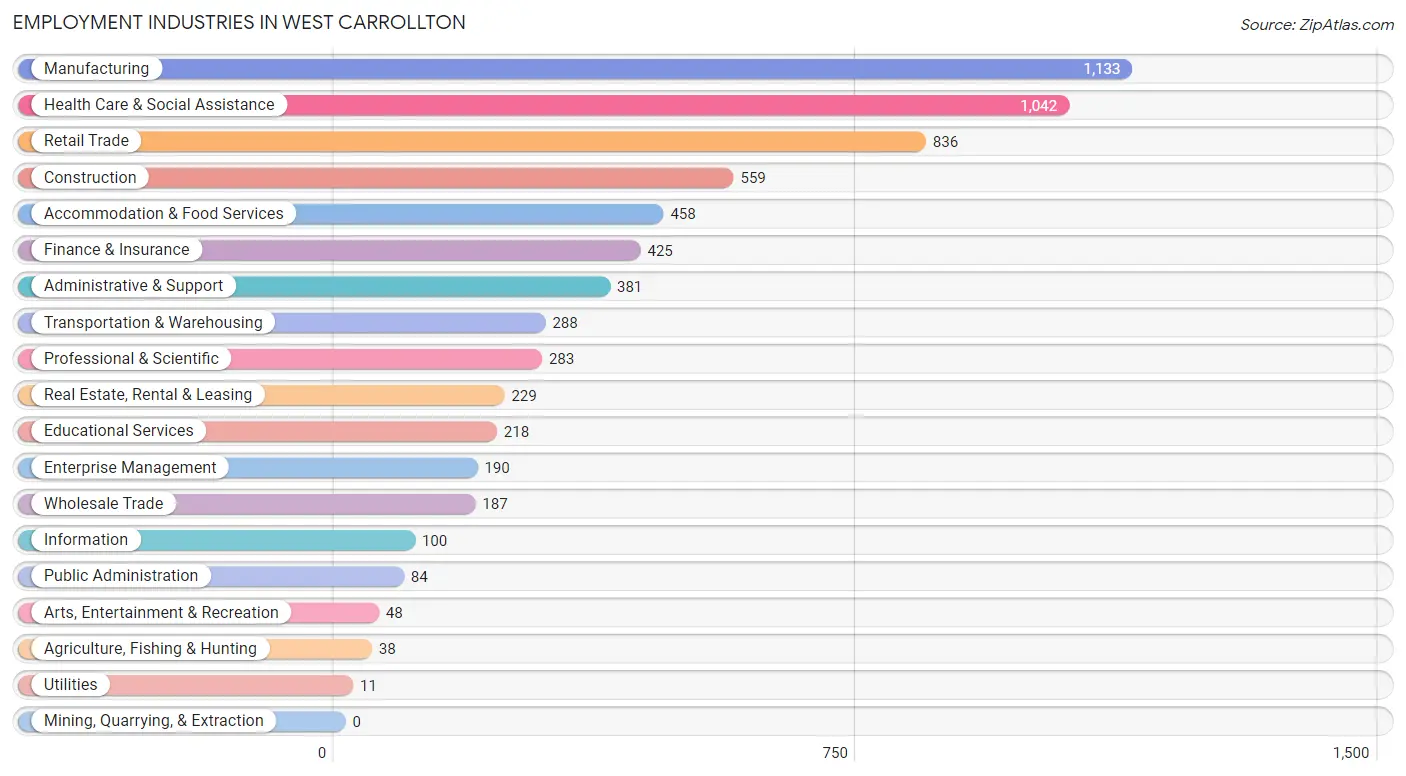
Employment Industries in West Carrollton
The major employment industries in West Carrollton include Manufacturing (1,133 | 16.8%), Health Care & Social Assistance (1,042 | 15.4%), Retail Trade (836 | 12.4%), Construction (559 | 8.3%), and Accommodation & Food Services (458 | 6.8%).
Employment Industries by Sex in West Carrollton
The West Carrollton industries that see more men than women are Agriculture, Fishing & Hunting (100.0%), Utilities (100.0%), and Arts, Entertainment & Recreation (100.0%), whereas the industries that tend to have a higher number of women are Enterprise Management (100.0%), Health Care & Social Assistance (87.4%), and Accommodation & Food Services (69.0%).
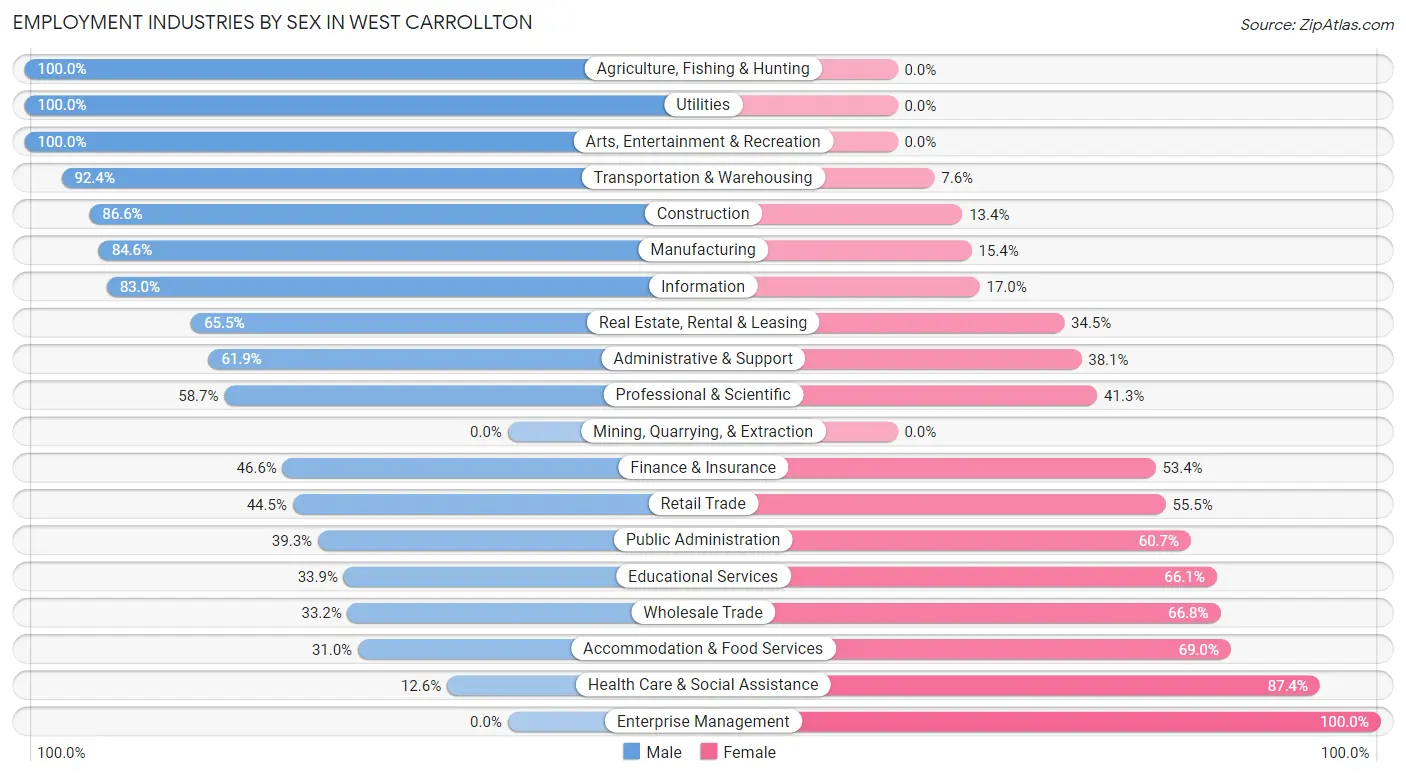
| Industry | Male | Female |
| Agriculture, Fishing & Hunting | 38 (100.0%) | 0 (0.0%) |
| Mining, Quarrying, & Extraction | 0 (0.0%) | 0 (0.0%) |
| Construction | 484 (86.6%) | 75 (13.4%) |
| Manufacturing | 959 (84.6%) | 174 (15.4%) |
| Wholesale Trade | 62 (33.2%) | 125 (66.8%) |
| Retail Trade | 372 (44.5%) | 464 (55.5%) |
| Transportation & Warehousing | 266 (92.4%) | 22 (7.6%) |
| Utilities | 11 (100.0%) | 0 (0.0%) |
| Information | 83 (83.0%) | 17 (17.0%) |
| Finance & Insurance | 198 (46.6%) | 227 (53.4%) |
| Real Estate, Rental & Leasing | 150 (65.5%) | 79 (34.5%) |
| Professional & Scientific | 166 (58.7%) | 117 (41.3%) |
| Enterprise Management | 0 (0.0%) | 190 (100.0%) |
| Administrative & Support | 236 (61.9%) | 145 (38.1%) |
| Educational Services | 74 (33.9%) | 144 (66.1%) |
| Health Care & Social Assistance | 131 (12.6%) | 911 (87.4%) |
| Arts, Entertainment & Recreation | 48 (100.0%) | 0 (0.0%) |
| Accommodation & Food Services | 142 (31.0%) | 316 (69.0%) |
| Public Administration | 33 (39.3%) | 51 (60.7%) |
| Total | 3,595 (53.2%) | 3,161 (46.8%) |
Education in West Carrollton
School Enrollment in West Carrollton
The most common levels of schooling among the 2,657 students in West Carrollton are elementary school (767 | 28.9%), high school (501 | 18.9%), and college / undergraduate (453 | 17.1%).
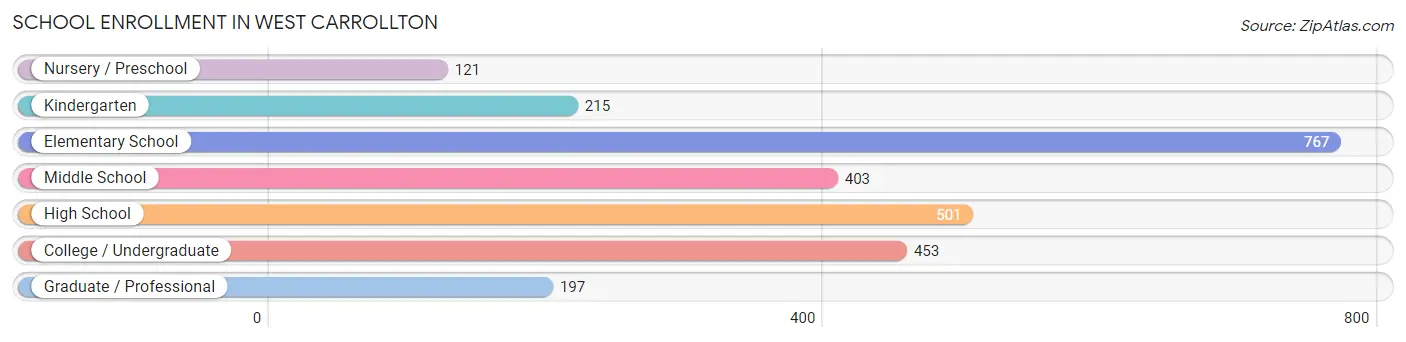
| School Level | # Students | % Students |
| Nursery / Preschool | 121 | 4.5% |
| Kindergarten | 215 | 8.1% |
| Elementary School | 767 | 28.9% |
| Middle School | 403 | 15.2% |
| High School | 501 | 18.9% |
| College / Undergraduate | 453 | 17.1% |
| Graduate / Professional | 197 | 7.4% |
| Total | 2,657 | 100.0% |
School Enrollment by Age by Funding Source in West Carrollton
Out of a total of 2,657 students who are enrolled in schools in West Carrollton, 258 (9.7%) attend a private institution, while the remaining 2,399 (90.3%) are enrolled in public schools. The age group of 5 to 9 year old has the highest likelihood of being enrolled in private schools, with 158 (16.9% in the age bracket) enrolled. Conversely, the age group of 3 to 4 year olds has the lowest likelihood of being enrolled in a private school, with 55 (100.0% in the age bracket) attending a public institution.
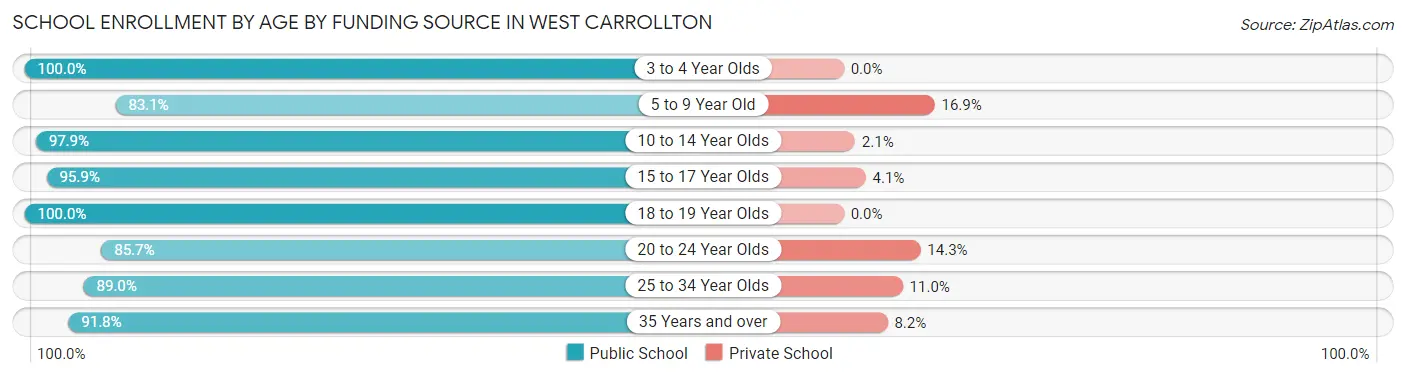
| Age Bracket | Public School | Private School |
| 3 to 4 Year Olds | 55 (100.0%) | 0 (0.0%) |
| 5 to 9 Year Old | 775 (83.1%) | 158 (16.9%) |
| 10 to 14 Year Olds | 516 (97.9%) | 11 (2.1%) |
| 15 to 17 Year Olds | 400 (95.9%) | 17 (4.1%) |
| 18 to 19 Year Olds | 135 (100.0%) | 0 (0.0%) |
| 20 to 24 Year Olds | 258 (85.7%) | 43 (14.3%) |
| 25 to 34 Year Olds | 170 (89.0%) | 21 (11.0%) |
| 35 Years and over | 90 (91.8%) | 8 (8.2%) |
| Total | 2,399 (90.3%) | 258 (9.7%) |
Educational Attainment by Field of Study in West Carrollton
Business (752 | 33.0%), arts & humanities (280 | 12.3%), science & technology (242 | 10.6%), education (214 | 9.4%), and bio, nature & agricultural (158 | 6.9%) are the most common fields of study among 2,276 individuals in West Carrollton who have obtained a bachelor's degree or higher.
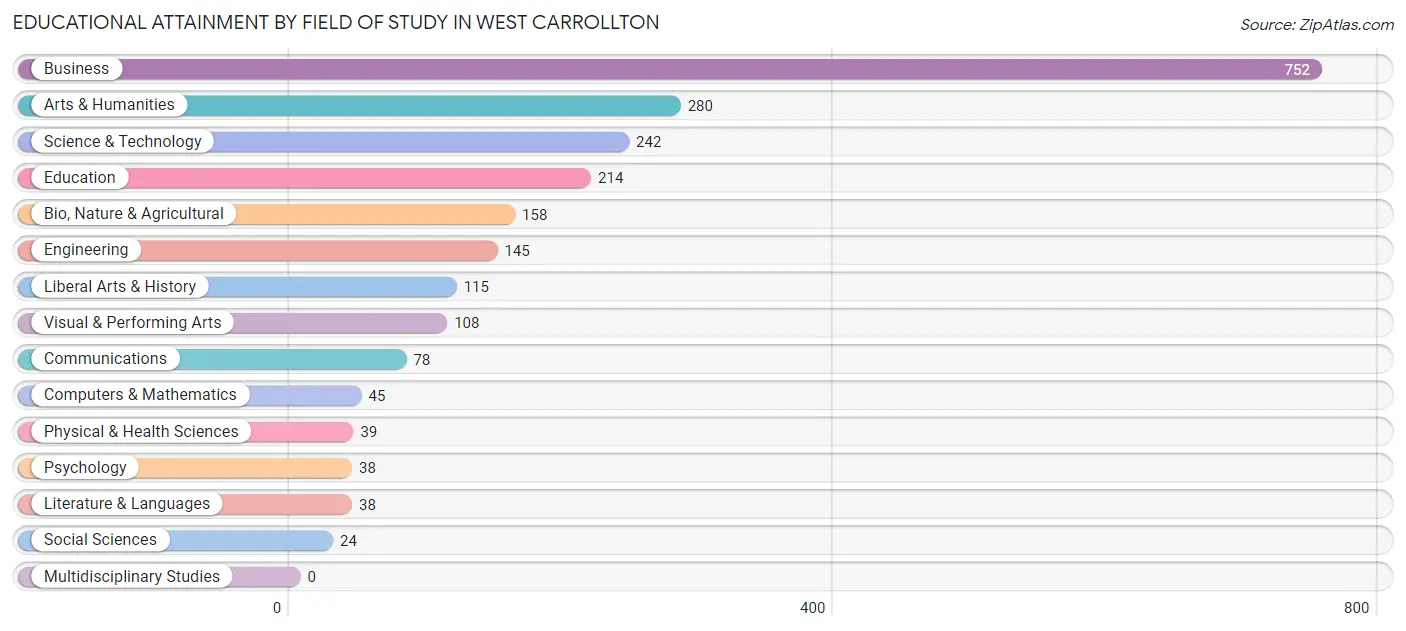
| Field of Study | # Graduates | % Graduates |
| Computers & Mathematics | 45 | 2.0% |
| Bio, Nature & Agricultural | 158 | 6.9% |
| Physical & Health Sciences | 39 | 1.7% |
| Psychology | 38 | 1.7% |
| Social Sciences | 24 | 1.1% |
| Engineering | 145 | 6.4% |
| Multidisciplinary Studies | 0 | 0.0% |
| Science & Technology | 242 | 10.6% |
| Business | 752 | 33.0% |
| Education | 214 | 9.4% |
| Literature & Languages | 38 | 1.7% |
| Liberal Arts & History | 115 | 5.1% |
| Visual & Performing Arts | 108 | 4.8% |
| Communications | 78 | 3.4% |
| Arts & Humanities | 280 | 12.3% |
| Total | 2,276 | 100.0% |
Transportation & Commute in West Carrollton
Vehicle Availability by Sex in West Carrollton
The most prevalent vehicle ownership categories in West Carrollton are males with 2 vehicles (1,593, accounting for 46.0%) and females with 2 vehicles (1,503, making up 51.8%).
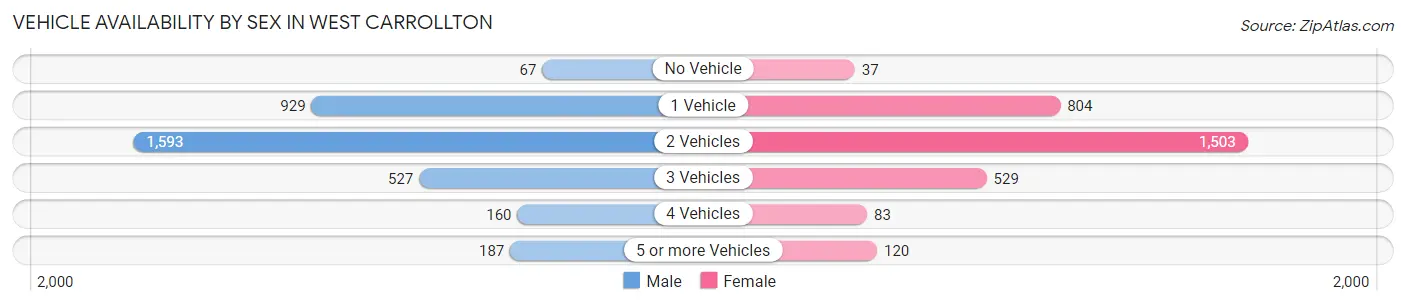
| Vehicles Available | Male | Female |
| No Vehicle | 67 (1.9%) | 37 (1.2%) |
| 1 Vehicle | 929 (26.8%) | 804 (26.1%) |
| 2 Vehicles | 1,593 (46.0%) | 1,503 (48.9%) |
| 3 Vehicles | 527 (15.2%) | 529 (17.2%) |
| 4 Vehicles | 160 (4.6%) | 83 (2.7%) |
| 5 or more Vehicles | 187 (5.4%) | 120 (3.9%) |
| Total | 3,463 (100.0%) | 3,076 (100.0%) |
Commute Time in West Carrollton
The most frequently occuring commute durations in West Carrollton are 15 to 19 minutes (1,098 commuters, 19.2%), 10 to 14 minutes (983 commuters, 17.2%), and 20 to 24 minutes (688 commuters, 12.1%).
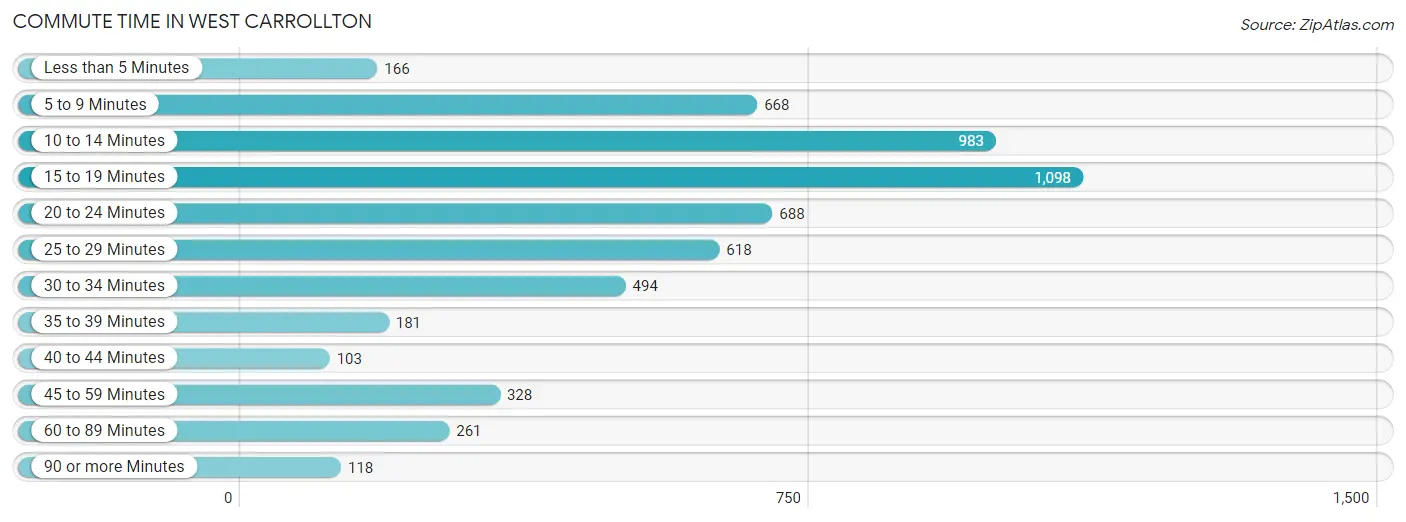
| Commute Time | # Commuters | % Commuters |
| Less than 5 Minutes | 166 | 2.9% |
| 5 to 9 Minutes | 668 | 11.7% |
| 10 to 14 Minutes | 983 | 17.2% |
| 15 to 19 Minutes | 1,098 | 19.2% |
| 20 to 24 Minutes | 688 | 12.1% |
| 25 to 29 Minutes | 618 | 10.8% |
| 30 to 34 Minutes | 494 | 8.7% |
| 35 to 39 Minutes | 181 | 3.2% |
| 40 to 44 Minutes | 103 | 1.8% |
| 45 to 59 Minutes | 328 | 5.8% |
| 60 to 89 Minutes | 261 | 4.6% |
| 90 or more Minutes | 118 | 2.1% |
Commute Time by Sex in West Carrollton
The most common commute times in West Carrollton are 25 to 29 minutes (485 commuters, 15.3%) for males and 15 to 19 minutes (695 commuters, 27.3%) for females.
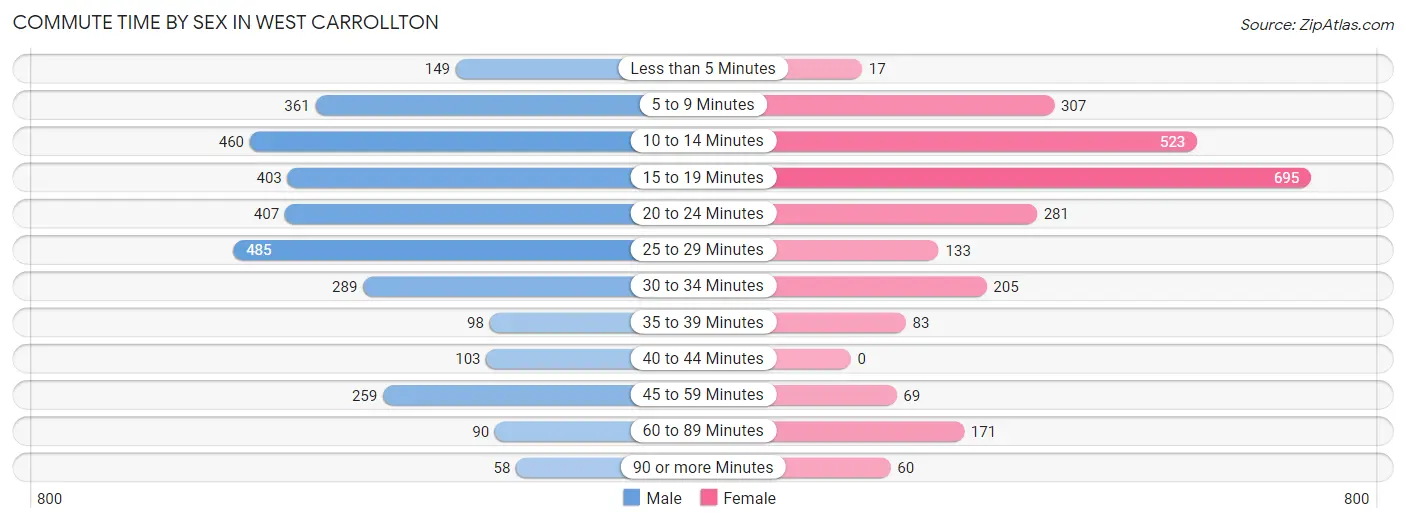
| Commute Time | Male | Female |
| Less than 5 Minutes | 149 (4.7%) | 17 (0.7%) |
| 5 to 9 Minutes | 361 (11.4%) | 307 (12.1%) |
| 10 to 14 Minutes | 460 (14.5%) | 523 (20.6%) |
| 15 to 19 Minutes | 403 (12.8%) | 695 (27.3%) |
| 20 to 24 Minutes | 407 (12.9%) | 281 (11.1%) |
| 25 to 29 Minutes | 485 (15.3%) | 133 (5.2%) |
| 30 to 34 Minutes | 289 (9.1%) | 205 (8.1%) |
| 35 to 39 Minutes | 98 (3.1%) | 83 (3.3%) |
| 40 to 44 Minutes | 103 (3.3%) | 0 (0.0%) |
| 45 to 59 Minutes | 259 (8.2%) | 69 (2.7%) |
| 60 to 89 Minutes | 90 (2.9%) | 171 (6.7%) |
| 90 or more Minutes | 58 (1.8%) | 60 (2.4%) |
Time of Departure to Work by Sex in West Carrollton
The most frequent times of departure to work in West Carrollton are 6:30 AM to 6:59 AM (571, 18.1%) for males and 6:30 AM to 6:59 AM (398, 15.6%) for females.
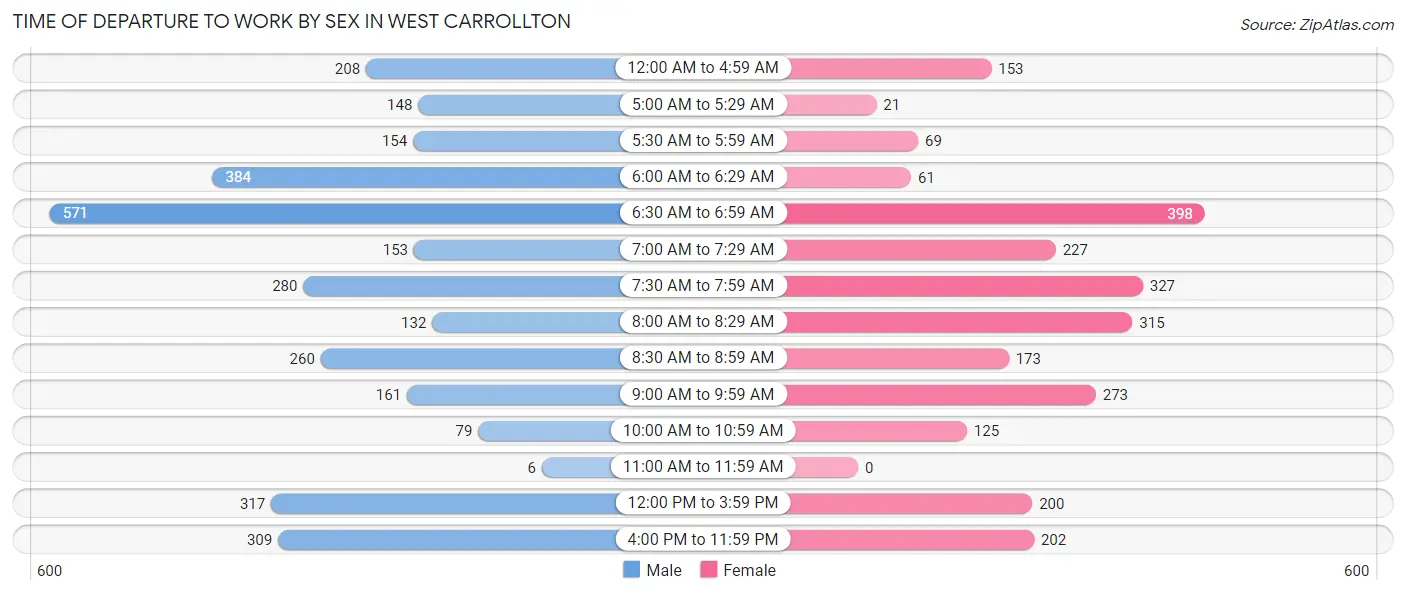
| Time of Departure | Male | Female |
| 12:00 AM to 4:59 AM | 208 (6.6%) | 153 (6.0%) |
| 5:00 AM to 5:29 AM | 148 (4.7%) | 21 (0.8%) |
| 5:30 AM to 5:59 AM | 154 (4.9%) | 69 (2.7%) |
| 6:00 AM to 6:29 AM | 384 (12.1%) | 61 (2.4%) |
| 6:30 AM to 6:59 AM | 571 (18.1%) | 398 (15.6%) |
| 7:00 AM to 7:29 AM | 153 (4.8%) | 227 (8.9%) |
| 7:30 AM to 7:59 AM | 280 (8.9%) | 327 (12.9%) |
| 8:00 AM to 8:29 AM | 132 (4.2%) | 315 (12.4%) |
| 8:30 AM to 8:59 AM | 260 (8.2%) | 173 (6.8%) |
| 9:00 AM to 9:59 AM | 161 (5.1%) | 273 (10.7%) |
| 10:00 AM to 10:59 AM | 79 (2.5%) | 125 (4.9%) |
| 11:00 AM to 11:59 AM | 6 (0.2%) | 0 (0.0%) |
| 12:00 PM to 3:59 PM | 317 (10.0%) | 200 (7.9%) |
| 4:00 PM to 11:59 PM | 309 (9.8%) | 202 (7.9%) |
| Total | 3,162 (100.0%) | 2,544 (100.0%) |
Housing Occupancy in West Carrollton
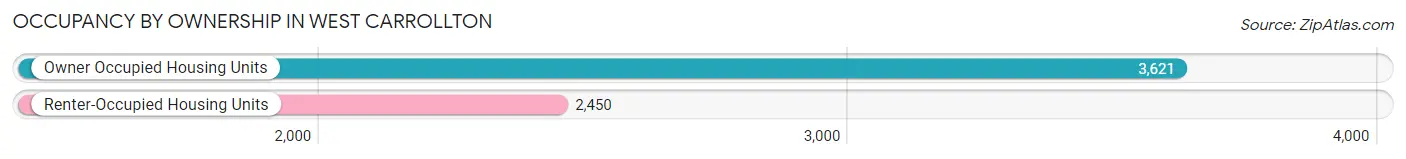
Occupancy by Ownership in West Carrollton
Of the total 6,071 dwellings in West Carrollton, owner-occupied units account for 3,621 (59.6%), while renter-occupied units make up 2,450 (40.4%).
| Occupancy | # Housing Units | % Housing Units |
| Owner Occupied Housing Units | 3,621 | 59.6% |
| Renter-Occupied Housing Units | 2,450 | 40.4% |
| Total Occupied Housing Units | 6,071 | 100.0% |
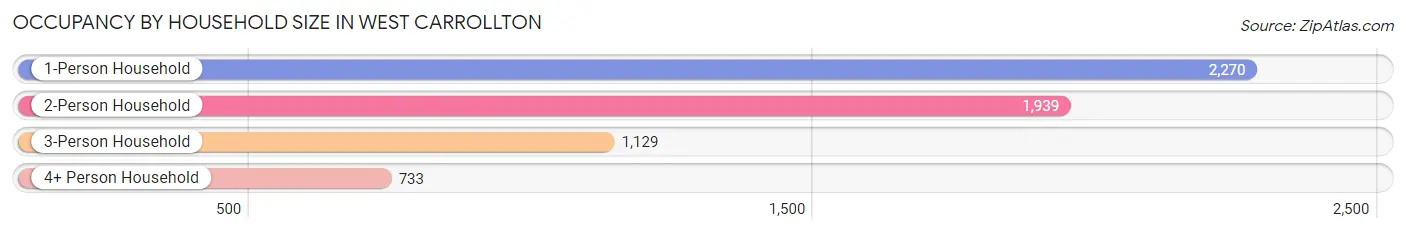
Occupancy by Household Size in West Carrollton
| Household Size | # Housing Units | % Housing Units |
| 1-Person Household | 2,270 | 37.4% |
| 2-Person Household | 1,939 | 31.9% |
| 3-Person Household | 1,129 | 18.6% |
| 4+ Person Household | 733 | 12.1% |
| Total Housing Units | 6,071 | 100.0% |
Occupancy by Ownership by Household Size in West Carrollton
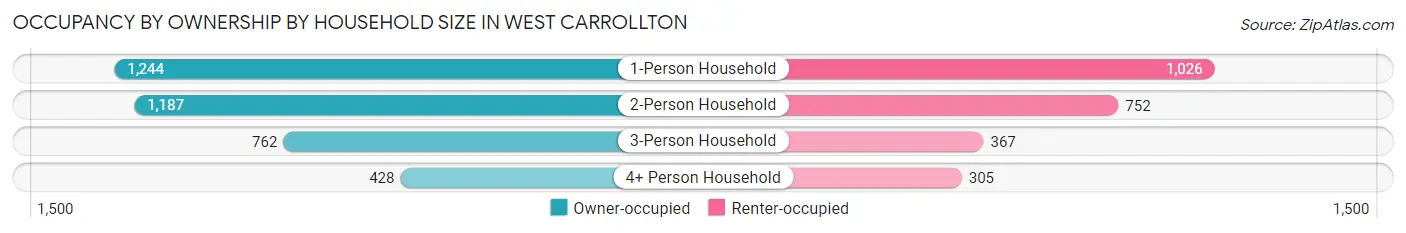
| Household Size | Owner-occupied | Renter-occupied |
| 1-Person Household | 1,244 (54.8%) | 1,026 (45.2%) |
| 2-Person Household | 1,187 (61.2%) | 752 (38.8%) |
| 3-Person Household | 762 (67.5%) | 367 (32.5%) |
| 4+ Person Household | 428 (58.4%) | 305 (41.6%) |
| Total Housing Units | 3,621 (59.6%) | 2,450 (40.4%) |
Occupancy by Educational Attainment in West Carrollton
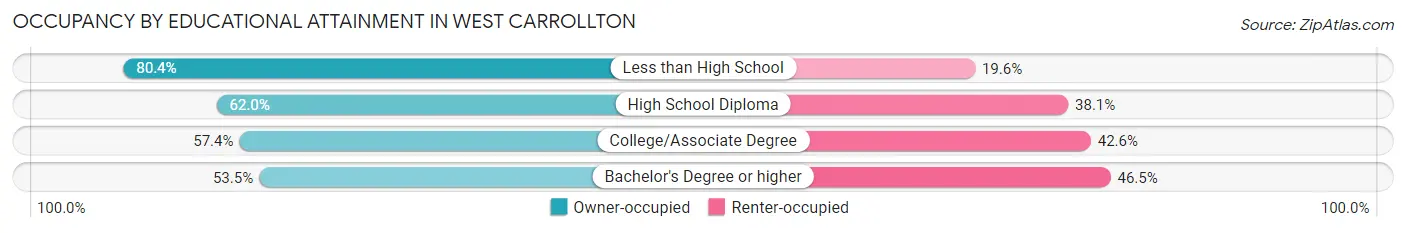
| Household Size | Owner-occupied | Renter-occupied |
| Less than High School | 394 (80.4%) | 96 (19.6%) |
| High School Diploma | 1,151 (62.0%) | 707 (38.1%) |
| College/Associate Degree | 1,220 (57.4%) | 904 (42.6%) |
| Bachelor's Degree or higher | 856 (53.5%) | 743 (46.5%) |
Occupancy by Age of Householder in West Carrollton
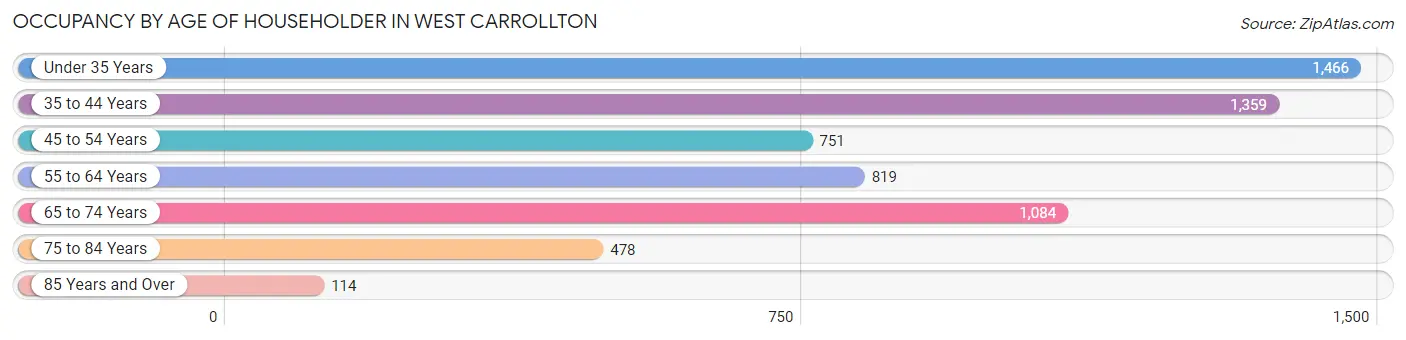
| Age Bracket | # Households | % Households |
| Under 35 Years | 1,466 | 24.1% |
| 35 to 44 Years | 1,359 | 22.4% |
| 45 to 54 Years | 751 | 12.4% |
| 55 to 64 Years | 819 | 13.5% |
| 65 to 74 Years | 1,084 | 17.9% |
| 75 to 84 Years | 478 | 7.9% |
| 85 Years and Over | 114 | 1.9% |
| Total | 6,071 | 100.0% |
Housing Finances in West Carrollton
Median Income by Occupancy in West Carrollton
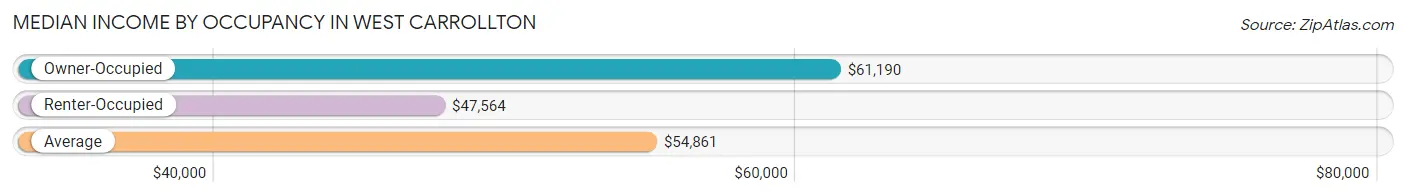
| Occupancy Type | # Households | Median Income |
| Owner-Occupied | 3,621 (59.6%) | $61,190 |
| Renter-Occupied | 2,450 (40.4%) | $47,564 |
| Average | 6,071 (100.0%) | $54,861 |
Occupancy by Householder Income Bracket in West Carrollton
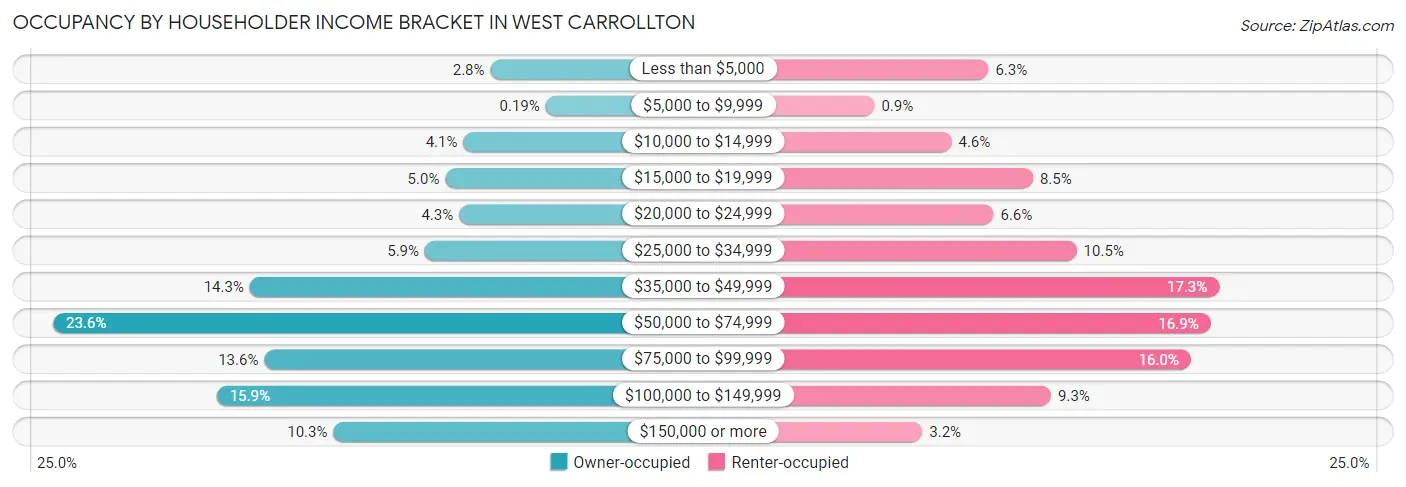
| Income Bracket | Owner-occupied | Renter-occupied |
| Less than $5,000 | 102 (2.8%) | 155 (6.3%) |
| $5,000 to $9,999 | 7 (0.2%) | 22 (0.9%) |
| $10,000 to $14,999 | 149 (4.1%) | 112 (4.6%) |
| $15,000 to $19,999 | 180 (5.0%) | 207 (8.5%) |
| $20,000 to $24,999 | 156 (4.3%) | 161 (6.6%) |
| $25,000 to $34,999 | 215 (5.9%) | 258 (10.5%) |
| $35,000 to $49,999 | 517 (14.3%) | 424 (17.3%) |
| $50,000 to $74,999 | 856 (23.6%) | 414 (16.9%) |
| $75,000 to $99,999 | 492 (13.6%) | 391 (16.0%) |
| $100,000 to $149,999 | 574 (15.9%) | 228 (9.3%) |
| $150,000 or more | 373 (10.3%) | 78 (3.2%) |
| Total | 3,621 (100.0%) | 2,450 (100.0%) |
Monthly Housing Cost Tiers in West Carrollton
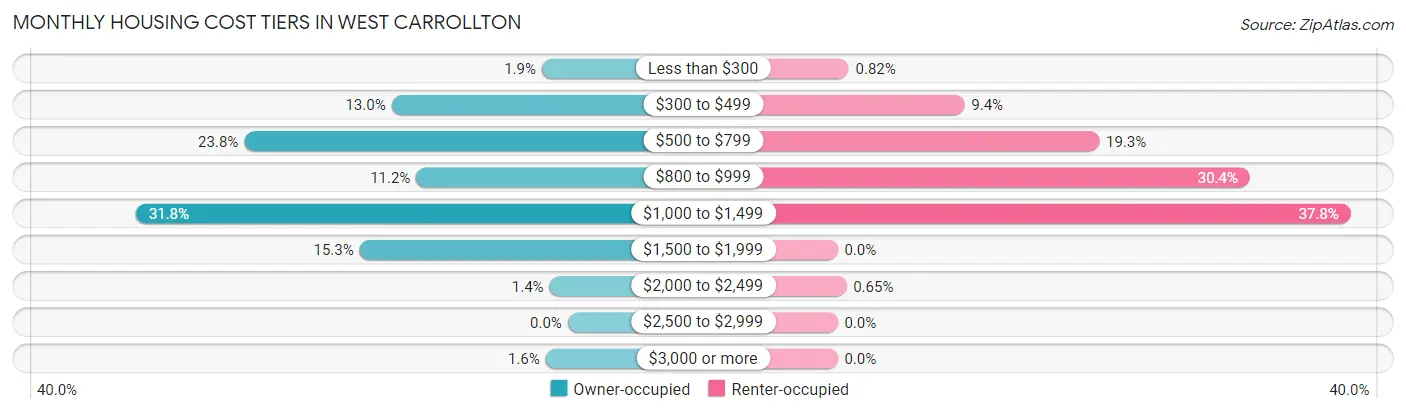
| Monthly Cost | Owner-occupied | Renter-occupied |
| Less than $300 | 69 (1.9%) | 20 (0.8%) |
| $300 to $499 | 470 (13.0%) | 229 (9.3%) |
| $500 to $799 | 863 (23.8%) | 472 (19.3%) |
| $800 to $999 | 404 (11.2%) | 744 (30.4%) |
| $1,000 to $1,499 | 1,152 (31.8%) | 926 (37.8%) |
| $1,500 to $1,999 | 555 (15.3%) | 0 (0.0%) |
| $2,000 to $2,499 | 49 (1.3%) | 16 (0.6%) |
| $2,500 to $2,999 | 0 (0.0%) | 0 (0.0%) |
| $3,000 or more | 59 (1.6%) | 0 (0.0%) |
| Total | 3,621 (100.0%) | 2,450 (100.0%) |
Physical Housing Characteristics in West Carrollton
Housing Structures in West Carrollton
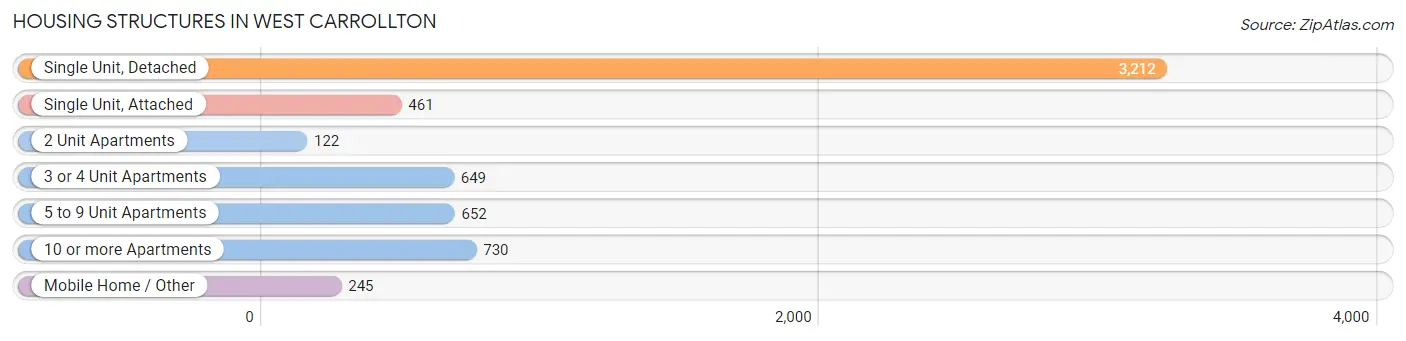
| Structure Type | # Housing Units | % Housing Units |
| Single Unit, Detached | 3,212 | 52.9% |
| Single Unit, Attached | 461 | 7.6% |
| 2 Unit Apartments | 122 | 2.0% |
| 3 or 4 Unit Apartments | 649 | 10.7% |
| 5 to 9 Unit Apartments | 652 | 10.7% |
| 10 or more Apartments | 730 | 12.0% |
| Mobile Home / Other | 245 | 4.0% |
| Total | 6,071 | 100.0% |
Housing Structures by Occupancy in West Carrollton

| Structure Type | Owner-occupied | Renter-occupied |
| Single Unit, Detached | 2,666 (83.0%) | 546 (17.0%) |
| Single Unit, Attached | 305 (66.2%) | 156 (33.8%) |
| 2 Unit Apartments | 0 (0.0%) | 122 (100.0%) |
| 3 or 4 Unit Apartments | 166 (25.6%) | 483 (74.4%) |
| 5 to 9 Unit Apartments | 286 (43.9%) | 366 (56.1%) |
| 10 or more Apartments | 47 (6.4%) | 683 (93.6%) |
| Mobile Home / Other | 151 (61.6%) | 94 (38.4%) |
| Total | 3,621 (59.6%) | 2,450 (40.4%) |
Housing Structures by Number of Rooms in West Carrollton
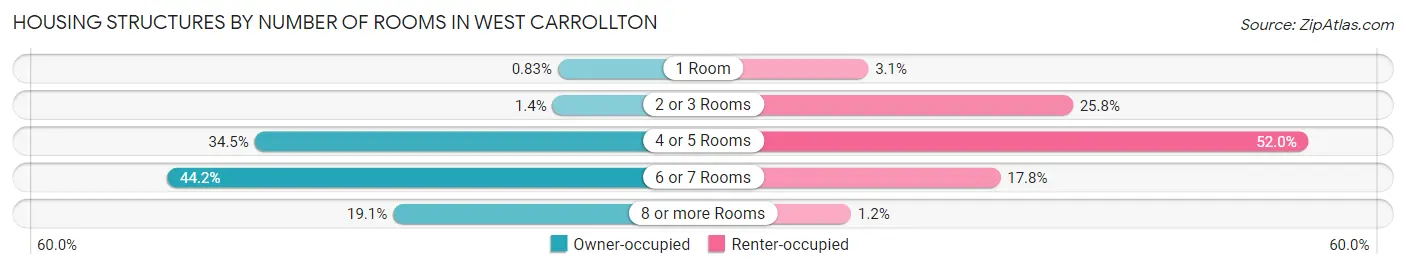
| Number of Rooms | Owner-occupied | Renter-occupied |
| 1 Room | 30 (0.8%) | 77 (3.1%) |
| 2 or 3 Rooms | 51 (1.4%) | 633 (25.8%) |
| 4 or 5 Rooms | 1,248 (34.5%) | 1,274 (52.0%) |
| 6 or 7 Rooms | 1,600 (44.2%) | 436 (17.8%) |
| 8 or more Rooms | 692 (19.1%) | 30 (1.2%) |
| Total | 3,621 (100.0%) | 2,450 (100.0%) |
Housing Structure by Heating Type in West Carrollton
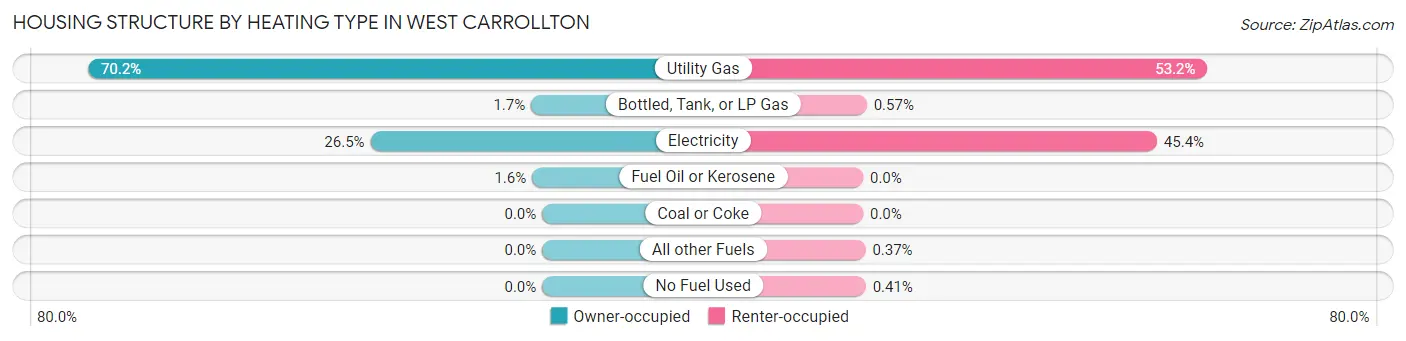
| Heating Type | Owner-occupied | Renter-occupied |
| Utility Gas | 2,542 (70.2%) | 1,304 (53.2%) |
| Bottled, Tank, or LP Gas | 62 (1.7%) | 14 (0.6%) |
| Electricity | 961 (26.5%) | 1,113 (45.4%) |
| Fuel Oil or Kerosene | 56 (1.5%) | 0 (0.0%) |
| Coal or Coke | 0 (0.0%) | 0 (0.0%) |
| All other Fuels | 0 (0.0%) | 9 (0.4%) |
| No Fuel Used | 0 (0.0%) | 10 (0.4%) |
| Total | 3,621 (100.0%) | 2,450 (100.0%) |
Household Vehicle Usage in West Carrollton
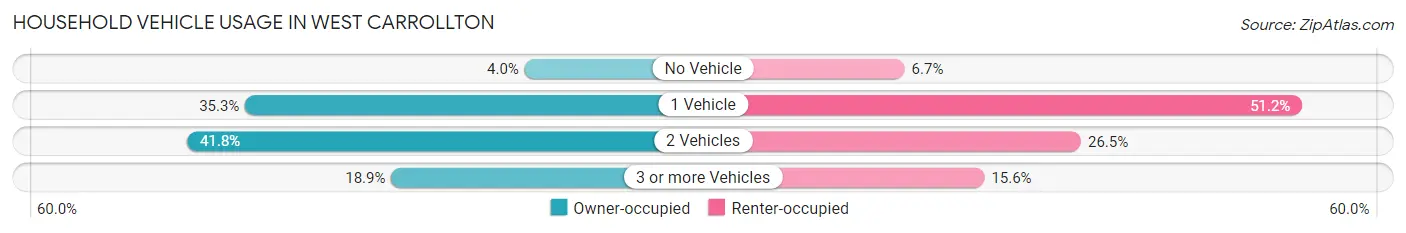
| Vehicles per Household | Owner-occupied | Renter-occupied |
| No Vehicle | 144 (4.0%) | 164 (6.7%) |
| 1 Vehicle | 1,278 (35.3%) | 1,255 (51.2%) |
| 2 Vehicles | 1,514 (41.8%) | 648 (26.5%) |
| 3 or more Vehicles | 685 (18.9%) | 383 (15.6%) |
| Total | 3,621 (100.0%) | 2,450 (100.0%) |
Real Estate & Mortgages in West Carrollton
Real Estate and Mortgage Overview in West Carrollton
| Characteristic | Without Mortgage | With Mortgage |
| Housing Units | 1,249 | 2,372 |
| Median Property Value | $110,000 | $132,200 |
| Median Household Income | $47,079 | $316 |
| Monthly Housing Costs | $531 | $59 |
| Real Estate Taxes | $2,330 | $144 |
Property Value by Mortgage Status in West Carrollton
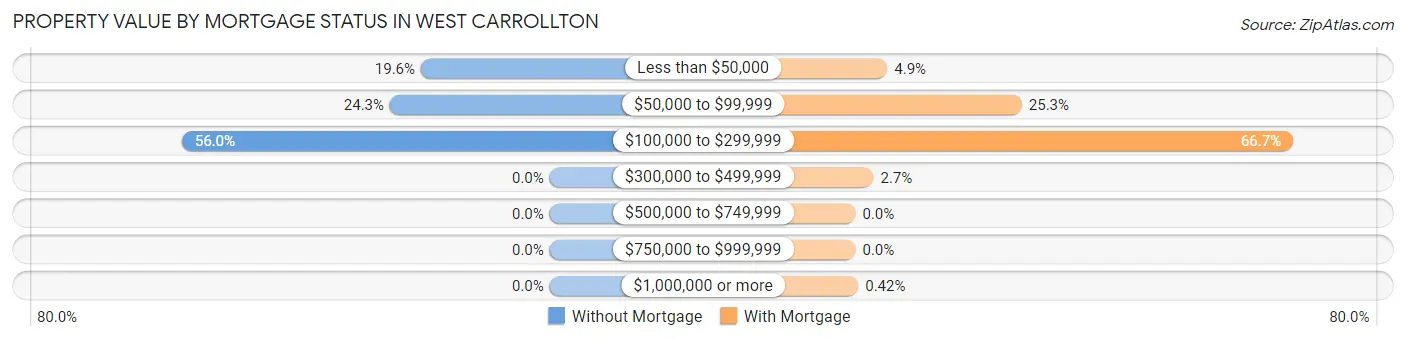
| Property Value | Without Mortgage | With Mortgage |
| Less than $50,000 | 245 (19.6%) | 115 (4.9%) |
| $50,000 to $99,999 | 304 (24.3%) | 601 (25.3%) |
| $100,000 to $299,999 | 700 (56.0%) | 1,581 (66.6%) |
| $300,000 to $499,999 | 0 (0.0%) | 65 (2.7%) |
| $500,000 to $749,999 | 0 (0.0%) | 0 (0.0%) |
| $750,000 to $999,999 | 0 (0.0%) | 0 (0.0%) |
| $1,000,000 or more | 0 (0.0%) | 10 (0.4%) |
| Total | 1,249 (100.0%) | 2,372 (100.0%) |
Household Income by Mortgage Status in West Carrollton
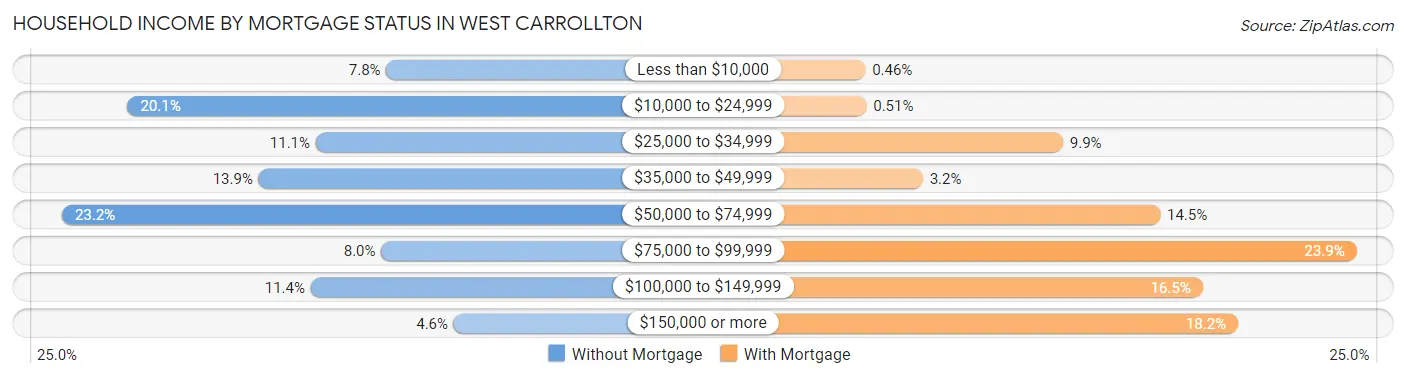
| Household Income | Without Mortgage | With Mortgage |
| Less than $10,000 | 97 (7.8%) | 11 (0.5%) |
| $10,000 to $24,999 | 251 (20.1%) | 12 (0.5%) |
| $25,000 to $34,999 | 139 (11.1%) | 234 (9.9%) |
| $35,000 to $49,999 | 173 (13.9%) | 76 (3.2%) |
| $50,000 to $74,999 | 290 (23.2%) | 344 (14.5%) |
| $75,000 to $99,999 | 100 (8.0%) | 566 (23.9%) |
| $100,000 to $149,999 | 142 (11.4%) | 392 (16.5%) |
| $150,000 or more | 57 (4.6%) | 432 (18.2%) |
| Total | 1,249 (100.0%) | 2,372 (100.0%) |
Property Value to Household Income Ratio in West Carrollton
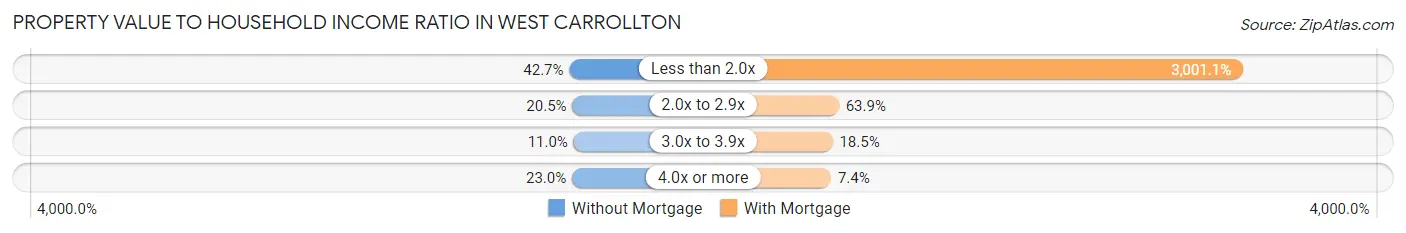
| Value-to-Income Ratio | Without Mortgage | With Mortgage |
| Less than 2.0x | 533 (42.7%) | 71,186 (3,001.1%) |
| 2.0x to 2.9x | 256 (20.5%) | 1,516 (63.9%) |
| 3.0x to 3.9x | 137 (11.0%) | 438 (18.5%) |
| 4.0x or more | 287 (23.0%) | 175 (7.4%) |
| Total | 1,249 (100.0%) | 2,372 (100.0%) |
Real Estate Taxes by Mortgage Status in West Carrollton
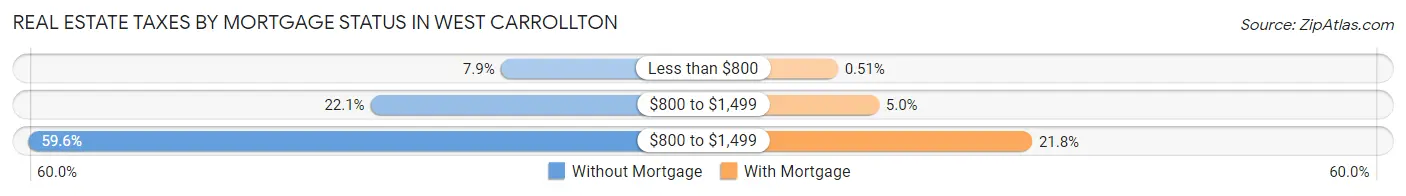
| Property Taxes | Without Mortgage | With Mortgage |
| Less than $800 | 98 (7.9%) | 12 (0.5%) |
| $800 to $1,499 | 276 (22.1%) | 119 (5.0%) |
| $800 to $1,499 | 744 (59.6%) | 517 (21.8%) |
| Total | 1,249 (100.0%) | 2,372 (100.0%) |
Health & Disability in West Carrollton
Health Insurance Coverage by Age in West Carrollton
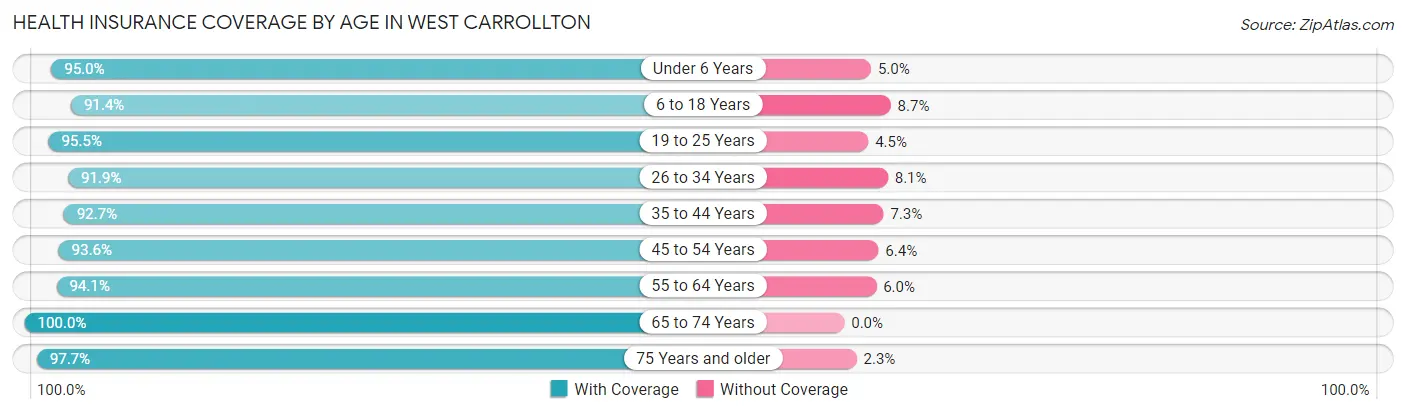
| Age Bracket | With Coverage | Without Coverage |
| Under 6 Years | 802 (95.0%) | 42 (5.0%) |
| 6 to 18 Years | 1,912 (91.3%) | 181 (8.6%) |
| 19 to 25 Years | 1,158 (95.5%) | 54 (4.5%) |
| 26 to 34 Years | 1,564 (91.9%) | 138 (8.1%) |
| 35 to 44 Years | 1,980 (92.7%) | 156 (7.3%) |
| 45 to 54 Years | 1,282 (93.6%) | 87 (6.4%) |
| 55 to 64 Years | 1,280 (94.1%) | 81 (5.9%) |
| 65 to 74 Years | 1,468 (100.0%) | 0 (0.0%) |
| 75 Years and older | 769 (97.7%) | 18 (2.3%) |
| Total | 12,215 (94.2%) | 757 (5.8%) |
Health Insurance Coverage by Citizenship Status in West Carrollton
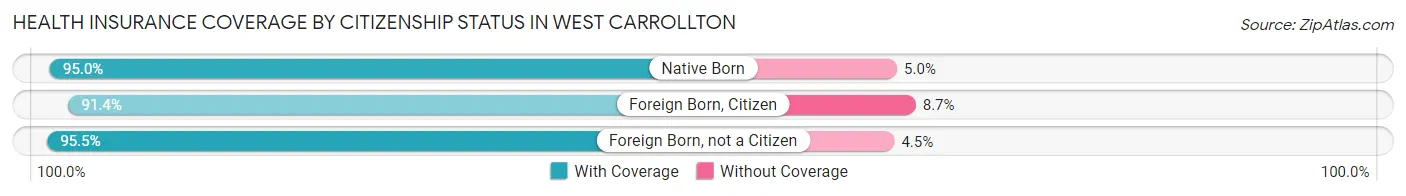
| Citizenship Status | With Coverage | Without Coverage |
| Native Born | 802 (95.0%) | 42 (5.0%) |
| Foreign Born, Citizen | 1,912 (91.3%) | 181 (8.6%) |
| Foreign Born, not a Citizen | 1,158 (95.5%) | 54 (4.5%) |
Health Insurance Coverage by Household Income in West Carrollton
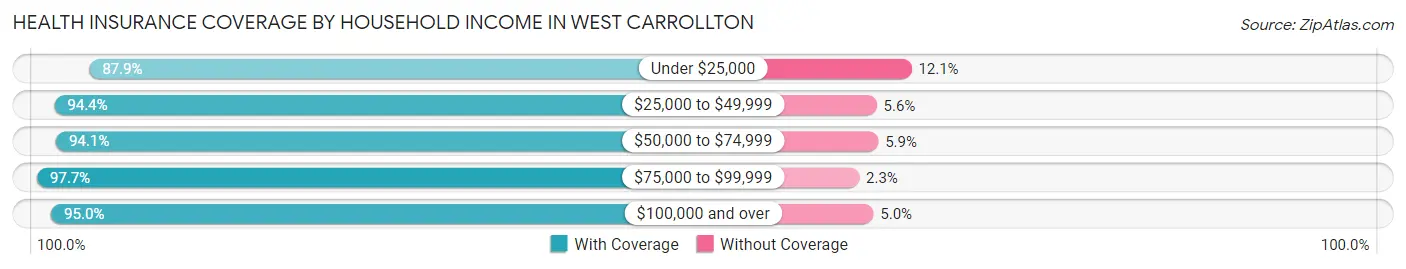
| Household Income | With Coverage | Without Coverage |
| Under $25,000 | 1,626 (87.9%) | 224 (12.1%) |
| $25,000 to $49,999 | 2,082 (94.4%) | 123 (5.6%) |
| $50,000 to $74,999 | 2,891 (94.1%) | 181 (5.9%) |
| $75,000 to $99,999 | 2,239 (97.7%) | 53 (2.3%) |
| $100,000 and over | 3,358 (95.0%) | 176 (5.0%) |
Public vs Private Health Insurance Coverage by Age in West Carrollton
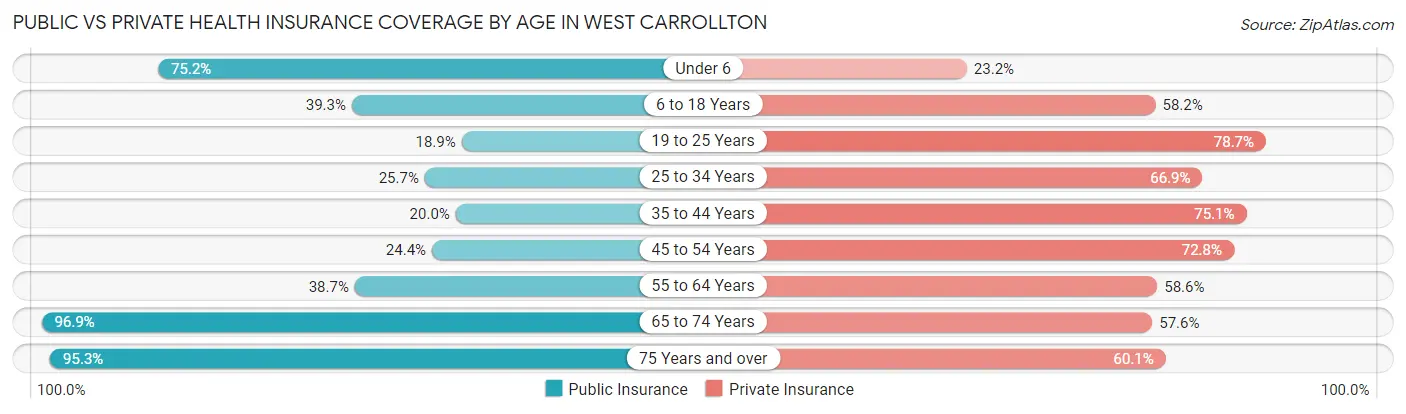
| Age Bracket | Public Insurance | Private Insurance |
| Under 6 | 635 (75.2%) | 196 (23.2%) |
| 6 to 18 Years | 822 (39.3%) | 1,219 (58.2%) |
| 19 to 25 Years | 229 (18.9%) | 954 (78.7%) |
| 25 to 34 Years | 438 (25.7%) | 1,139 (66.9%) |
| 35 to 44 Years | 427 (20.0%) | 1,604 (75.1%) |
| 45 to 54 Years | 334 (24.4%) | 996 (72.8%) |
| 55 to 64 Years | 527 (38.7%) | 797 (58.6%) |
| 65 to 74 Years | 1,422 (96.9%) | 846 (57.6%) |
| 75 Years and over | 750 (95.3%) | 473 (60.1%) |
| Total | 5,584 (43.0%) | 8,224 (63.4%) |
Disability Status by Sex by Age in West Carrollton
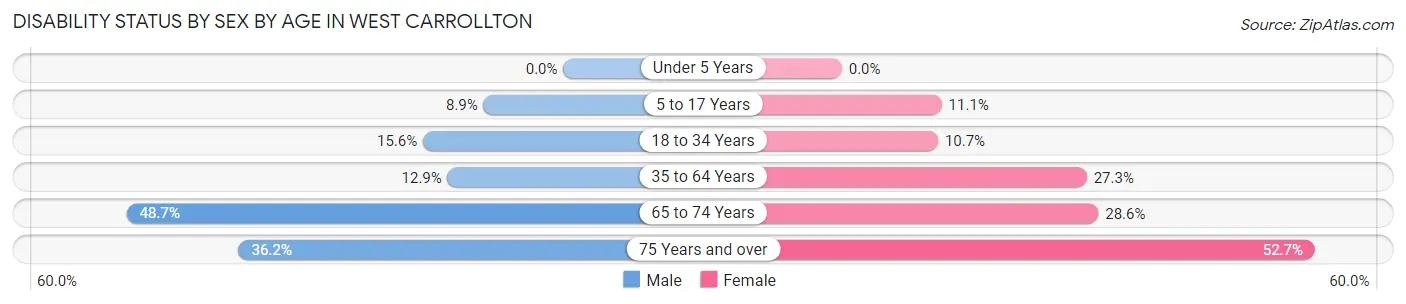
| Age Bracket | Male | Female |
| Under 5 Years | 0 (0.0%) | 0 (0.0%) |
| 5 to 17 Years | 113 (8.9%) | 89 (11.1%) |
| 18 to 34 Years | 229 (15.6%) | 173 (10.7%) |
| 35 to 64 Years | 323 (12.9%) | 644 (27.3%) |
| 65 to 74 Years | 360 (48.6%) | 208 (28.6%) |
| 75 Years and over | 102 (36.2%) | 266 (52.7%) |
Disability Class by Sex by Age in West Carrollton
Disability Class: Hearing Difficulty
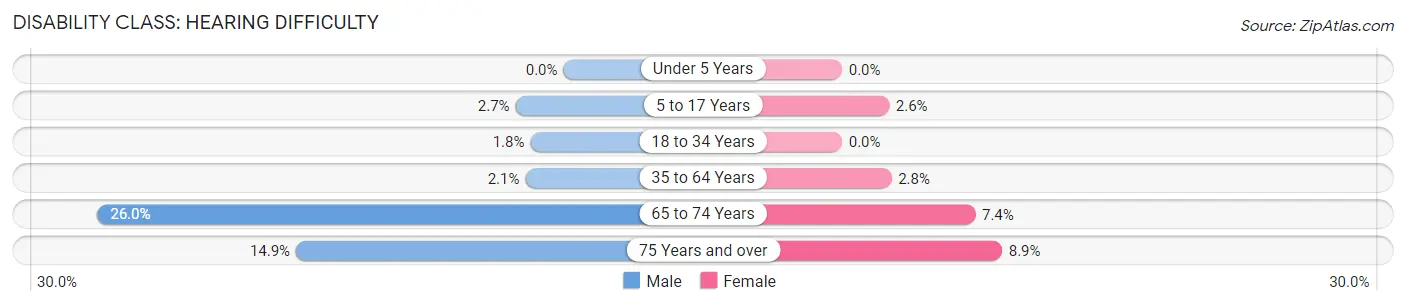
| Age Bracket | Male | Female |
| Under 5 Years | 0 (0.0%) | 0 (0.0%) |
| 5 to 17 Years | 34 (2.7%) | 21 (2.6%) |
| 18 to 34 Years | 27 (1.8%) | 0 (0.0%) |
| 35 to 64 Years | 53 (2.1%) | 65 (2.8%) |
| 65 to 74 Years | 192 (26.0%) | 54 (7.4%) |
| 75 Years and over | 42 (14.9%) | 45 (8.9%) |
Disability Class: Vision Difficulty
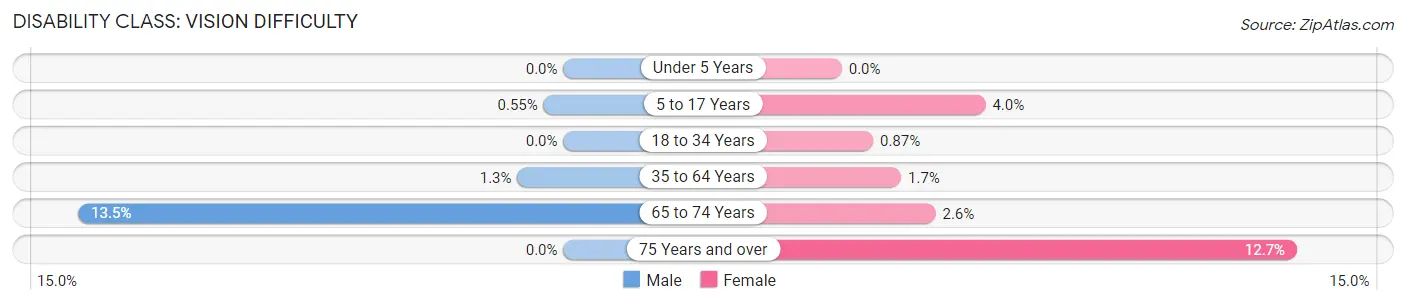
| Age Bracket | Male | Female |
| Under 5 Years | 0 (0.0%) | 0 (0.0%) |
| 5 to 17 Years | 7 (0.5%) | 32 (4.0%) |
| 18 to 34 Years | 0 (0.0%) | 14 (0.9%) |
| 35 to 64 Years | 32 (1.3%) | 39 (1.7%) |
| 65 to 74 Years | 100 (13.5%) | 19 (2.6%) |
| 75 Years and over | 0 (0.0%) | 64 (12.7%) |
Disability Class: Cognitive Difficulty
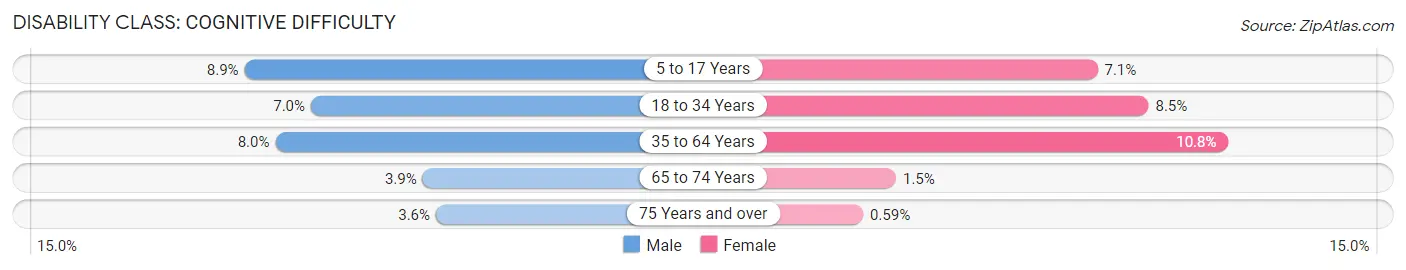
| Age Bracket | Male | Female |
| 5 to 17 Years | 113 (8.9%) | 57 (7.1%) |
| 18 to 34 Years | 103 (7.0%) | 138 (8.5%) |
| 35 to 64 Years | 201 (8.0%) | 254 (10.8%) |
| 65 to 74 Years | 29 (3.9%) | 11 (1.5%) |
| 75 Years and over | 10 (3.5%) | 3 (0.6%) |
Disability Class: Ambulatory Difficulty
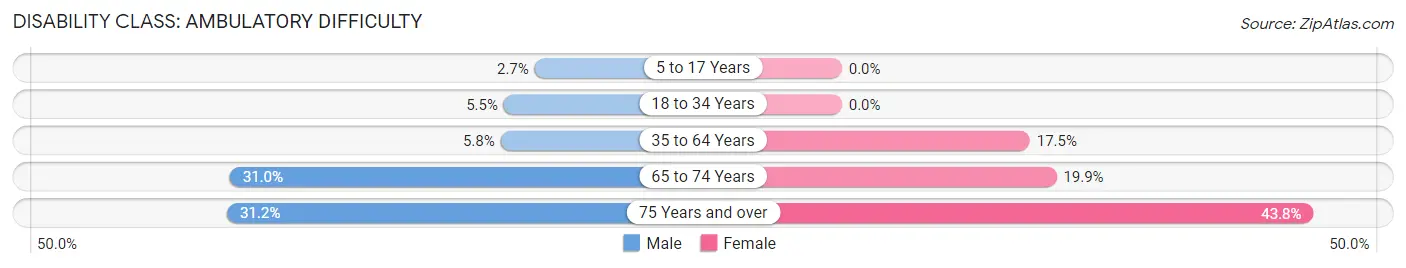
| Age Bracket | Male | Female |
| 5 to 17 Years | 34 (2.7%) | 0 (0.0%) |
| 18 to 34 Years | 81 (5.5%) | 0 (0.0%) |
| 35 to 64 Years | 146 (5.8%) | 412 (17.4%) |
| 65 to 74 Years | 229 (30.9%) | 145 (19.9%) |
| 75 Years and over | 88 (31.2%) | 221 (43.8%) |
Disability Class: Self-Care Difficulty
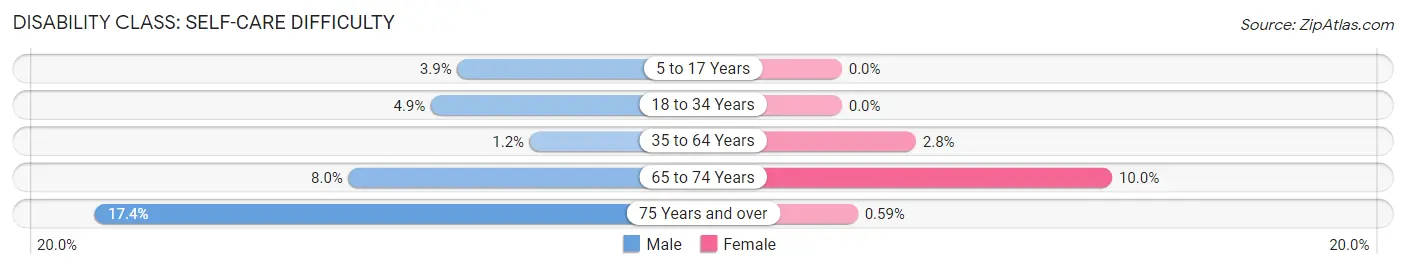
| Age Bracket | Male | Female |
| 5 to 17 Years | 50 (3.9%) | 0 (0.0%) |
| 18 to 34 Years | 72 (4.9%) | 0 (0.0%) |
| 35 to 64 Years | 31 (1.2%) | 65 (2.8%) |
| 65 to 74 Years | 59 (8.0%) | 73 (10.0%) |
| 75 Years and over | 49 (17.4%) | 3 (0.6%) |
Technology Access in West Carrollton
Computing Device Access in West Carrollton
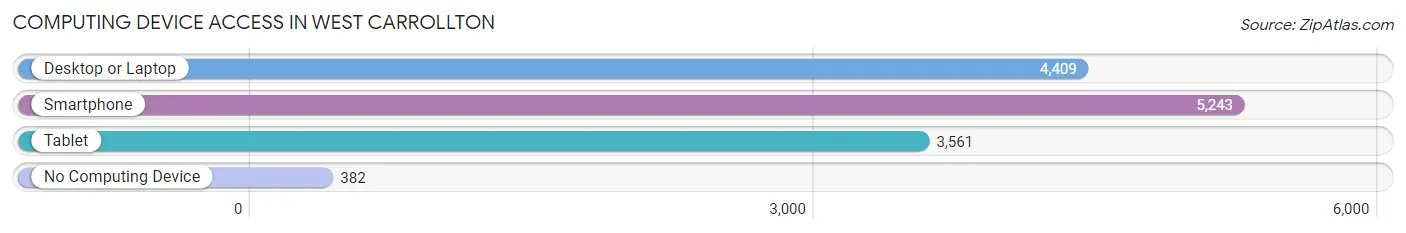
| Device Type | # Households | % Households |
| Desktop or Laptop | 4,409 | 72.6% |
| Smartphone | 5,243 | 86.4% |
| Tablet | 3,561 | 58.7% |
| No Computing Device | 382 | 6.3% |
| Total | 6,071 | 100.0% |
Internet Access in West Carrollton
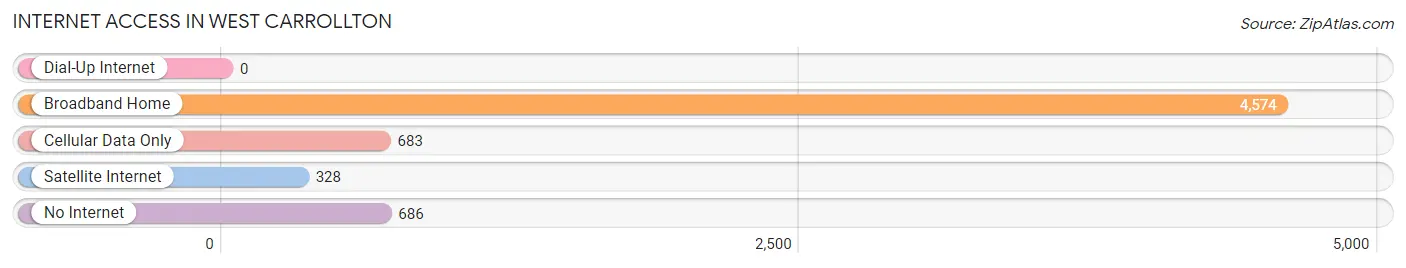
| Internet Type | # Households | % Households |
| Dial-Up Internet | 0 | 0.0% |
| Broadband Home | 4,574 | 75.3% |
| Cellular Data Only | 683 | 11.3% |
| Satellite Internet | 328 | 5.4% |
| No Internet | 686 | 11.3% |
| Total | 6,071 | 100.0% |
West Carrollton Summary
History
West Carrollton, Ohio is a city located in Montgomery County, Ohio. It is a suburb of Dayton and is part of the Dayton Metropolitan Statistical Area. The city was founded in 1817 and was originally known as Carrollton. The name was changed to West Carrollton in 1867 to distinguish it from the nearby city of Carrollton.
The city was originally settled by Quakers who had migrated from North Carolina. The Quakers were attracted to the area due to its fertile soil and abundant natural resources. The city was incorporated in 1867 and was primarily an agricultural community. The city was home to several mills and factories, including a paper mill, a flour mill, and a sawmill.
The city experienced a period of growth in the late 19th and early 20th centuries. The population increased from 1,000 in 1880 to 4,000 in 1910. The city was home to several businesses, including a brewery, a canning factory, and a brickyard.
The city experienced a period of decline in the mid-20th century. The population decreased from 4,000 in 1910 to 3,000 in 1950. The city was hit hard by the Great Depression and the decline of the manufacturing industry. The city experienced a period of revitalization in the late 20th century. The population increased from 3,000 in 1950 to 8,000 in 2000.
Geography
West Carrollton is located in Montgomery County, Ohio. It is situated on the Great Miami River, approximately 10 miles north of Dayton. The city has a total area of 4.3 square miles, all of which is land. The city is located in the Miami Valley region of Ohio.
The city has a humid continental climate, with hot summers and cold winters. The average temperature in July is 79°F and the average temperature in January is 28°F. The average annual precipitation is 40 inches.
Economy
West Carrollton is a suburb of Dayton and is part of the Dayton Metropolitan Statistical Area. The city is home to several businesses, including manufacturing, retail, and healthcare. The city is home to several large employers, including the Dayton International Airport, the Dayton VA Medical Center, and the University of Dayton.
The city is also home to several small businesses, including restaurants, shops, and service providers. The city is home to several parks and recreational facilities, including the West Carrollton City Park and the West Carrollton Recreation Center.
Demographics
West Carrollton is a city in Montgomery County, Ohio. The city has a population of 8,000, according to the 2010 census. The population is approximately 50% white, 25% African American, and 25% Hispanic. The median household income is $41,000 and the median home value is $125,000. The city has a poverty rate of 15%.
The city is served by the West Carrollton City School District. The district has four elementary schools, one middle school, and one high school. The city is also home to several private schools, including St. Christopher Catholic School and West Carrollton Christian Academy.
Common Questions
What is the Total Population of West Carrollton?
Total Population of West Carrollton is 13,060.
What is the Total Male Population of West Carrollton?
Total Male Population of West Carrollton is 6,778.
What is the Total Female Population of West Carrollton?
Total Female Population of West Carrollton is 6,282.
What is the Ratio of Males per 100 Females in West Carrollton?
There are 107.90 Males per 100 Females in West Carrollton.
What is the Ratio of Females per 100 Males in West Carrollton?
There are 92.68 Females per 100 Males in West Carrollton.
What is the Median Population Age in West Carrollton?
Median Population Age in West Carrollton is 37.0 Years.
What is the Average Family Size in West Carrollton
Average Family Size in West Carrollton is 2.8 People.
What is the Average Household Size in West Carrollton
Average Household Size in West Carrollton is 2.1 People.
What is Per Capita Income in West Carrollton?
Per Capita income in West Carrollton is $31,827.
What is the Median Family Income in West Carrollton?
Median Family Income in West Carrollton is $76,033.
What is the Median Household income in West Carrollton?
Median Household Income in West Carrollton is $54,861.
What is Income or Wage Gap in West Carrollton?
Income or Wage Gap in West Carrollton is 25.6%.
Women in West Carrollton earn 74.4 cents for every dollar earned by a man.
What is Family Income Deficit in West Carrollton?
Family Income Deficit in West Carrollton is $9,405.
Families that are below poverty line in West Carrollton earn $9,405 less on average than the poverty threshold level.
What is Inequality or Gini Index in West Carrollton?
Inequality or Gini Index in West Carrollton is 0.41.
How Large is the Labor Force in West Carrollton?
There are 7,119 People in the Labor Forcein in West Carrollton.
What is the Percentage of People in the Labor Force in West Carrollton?
67.3% of People are in the Labor Force in West Carrollton.
What is the Unemployment Rate in West Carrollton?
Unemployment Rate in West Carrollton is 5.1%.