Glouster, OH
Glouster Map
Glouster Overview
1,559
TOTAL POPULATION
745
MALE POPULATION
814
FEMALE POPULATION
91.52
MALES / 100 FEMALES
109.26
FEMALES / 100 MALES
40.0
MEDIAN AGE
3.2
AVG FAMILY SIZE
2.5
AVG HOUSEHOLD SIZE
$20,018
PER CAPITA INCOME
$43,214
AVG FAMILY INCOME
$36,905
AVG HOUSEHOLD INCOME
19.9%
WAGE / INCOME GAP [ % ]
80.1¢/ $1
WAGE / INCOME GAP [ $ ]
0.40
INEQUALITY / GINI INDEX
565
LABOR FORCE [ PEOPLE ]
47.6%
PERCENT IN LABOR FORCE
4.6%
UNEMPLOYMENT RATE
Glouster Zip Codes
Glouster Area Codes
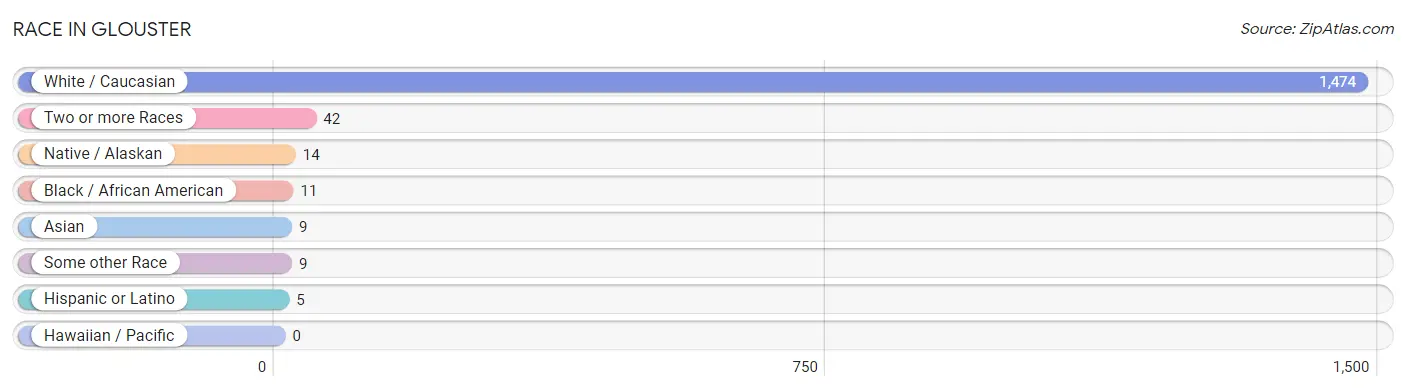
Race in Glouster
The most populous races in Glouster are White / Caucasian (1,474 | 94.6%), Two or more Races (42 | 2.7%), and Native / Alaskan (14 | 0.9%).
| Race | # Population | % Population |
| Asian | 9 | 0.6% |
| Black / African American | 11 | 0.7% |
| Hawaiian / Pacific | 0 | 0.0% |
| Hispanic or Latino | 5 | 0.3% |
| Native / Alaskan | 14 | 0.9% |
| White / Caucasian | 1,474 | 94.6% |
| Two or more Races | 42 | 2.7% |
| Some other Race | 9 | 0.6% |
| Total | 1,559 | 100.0% |
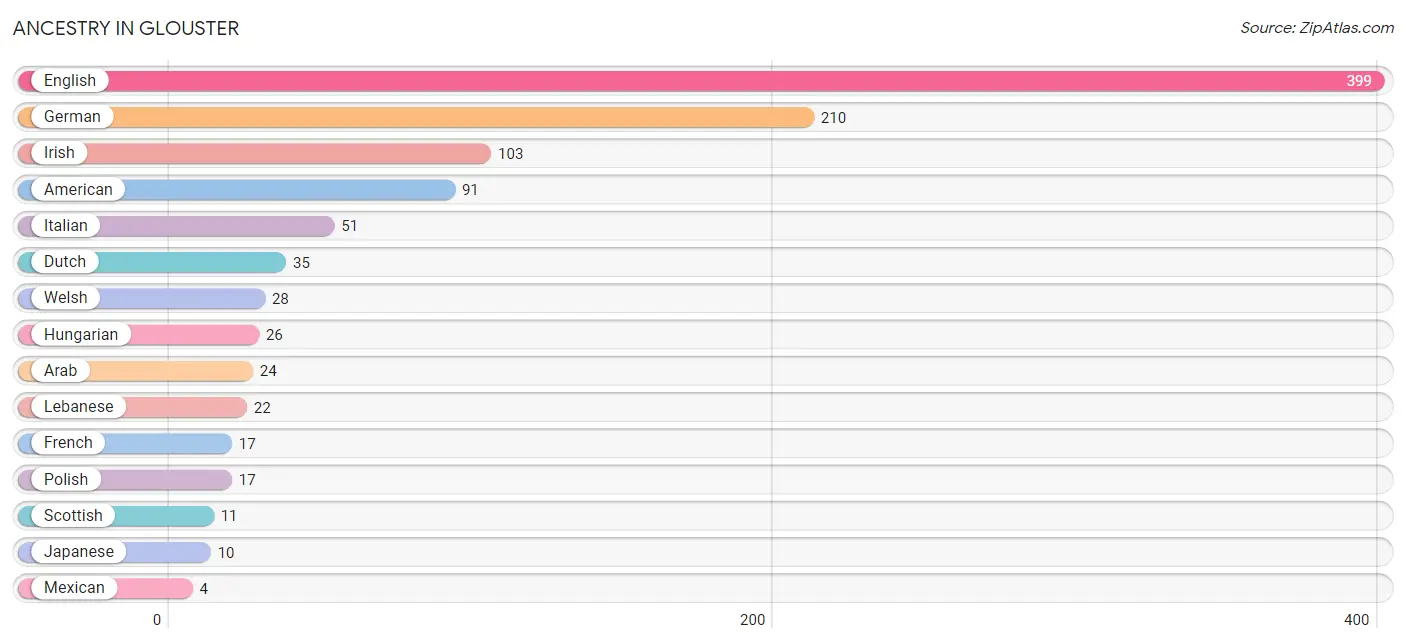
Ancestry in Glouster
The most populous ancestries reported in Glouster are English (399 | 25.6%), German (210 | 13.5%), Irish (103 | 6.6%), American (91 | 5.8%), and Italian (51 | 3.3%), together accounting for 54.8% of all Glouster residents.
| Ancestry | # Population | % Population |
| American | 91 | 5.8% |
| Arab | 24 | 1.5% |
| Canadian | 2 | 0.1% |
| Central American | 1 | 0.1% |
| Dutch | 35 | 2.2% |
| English | 399 | 25.6% |
| European | 2 | 0.1% |
| French | 17 | 1.1% |
| German | 210 | 13.5% |
| Greek | 2 | 0.1% |
| Hungarian | 26 | 1.7% |
| Irish | 103 | 6.6% |
| Italian | 51 | 3.3% |
| Japanese | 10 | 0.6% |
| Lebanese | 22 | 1.4% |
| Mexican | 4 | 0.3% |
| Polish | 17 | 1.1% |
| Russian | 2 | 0.1% |
| Salvadoran | 1 | 0.1% |
| Scottish | 11 | 0.7% |
| Slovak | 3 | 0.2% |
| Sri Lankan | 4 | 0.3% |
| Syrian | 2 | 0.1% |
| Welsh | 28 | 1.8% | View All 24 Rows |
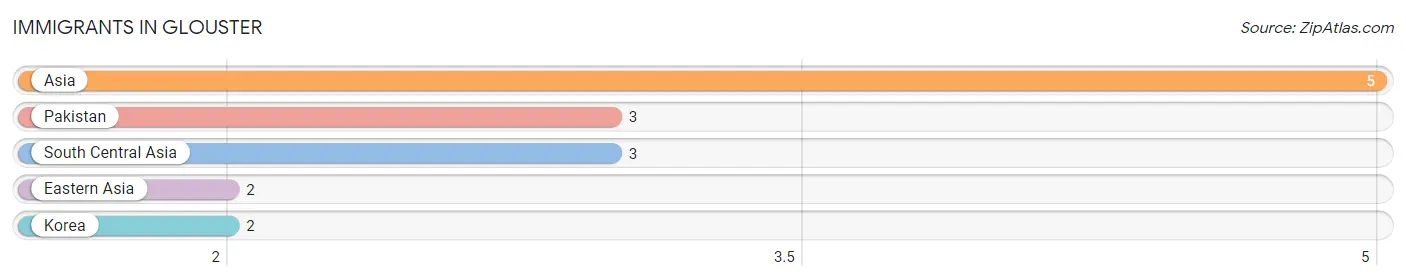
Immigrants in Glouster
The most numerous immigrant groups reported in Glouster came from Asia (5 | 0.3%), Pakistan (3 | 0.2%), South Central Asia (3 | 0.2%), Eastern Asia (2 | 0.1%), and Korea (2 | 0.1%), together accounting for 1.0% of all Glouster residents.
| Immigration Origin | # Population | % Population |
| Asia | 5 | 0.3% |
| Eastern Asia | 2 | 0.1% |
| Korea | 2 | 0.1% |
| Pakistan | 3 | 0.2% |
| South Central Asia | 3 | 0.2% | View All 5 Rows |
Sex and Age in Glouster
Sex and Age in Glouster
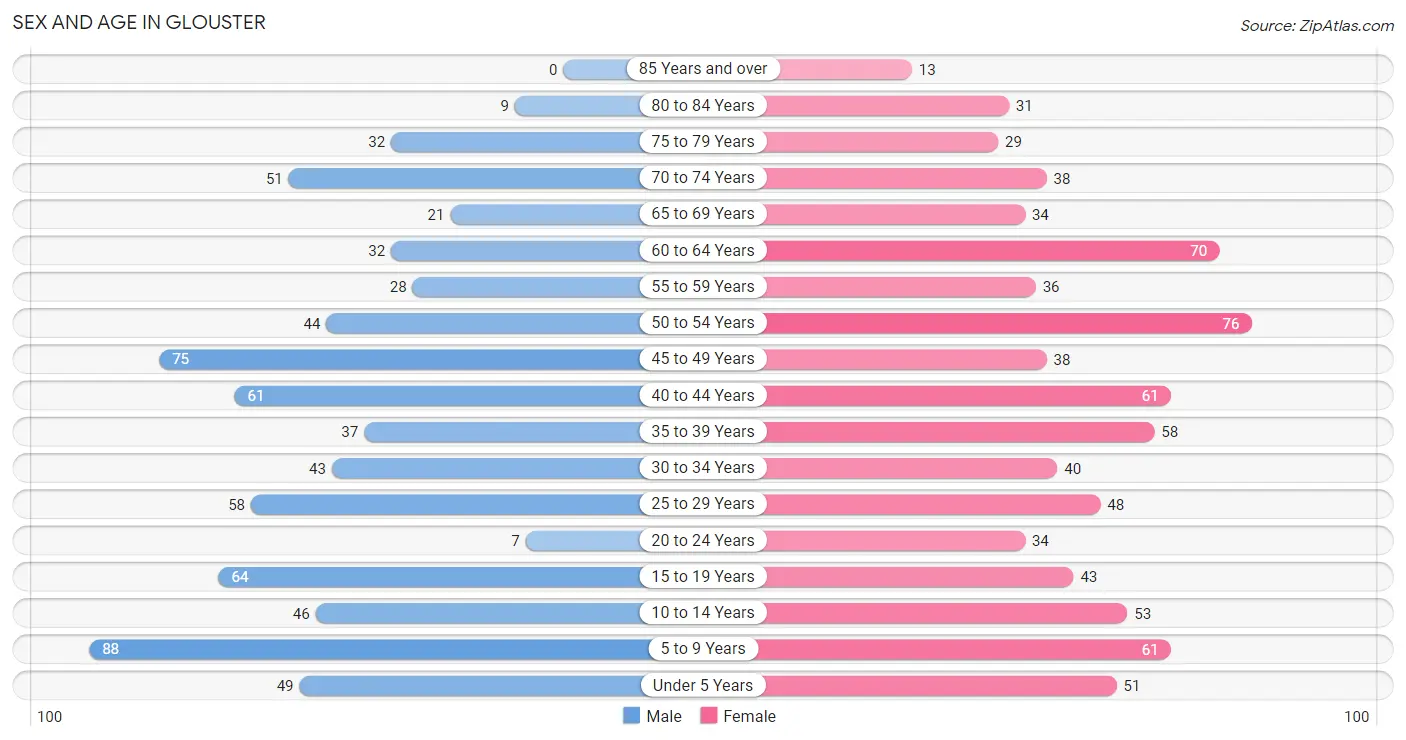
The most populous age groups in Glouster are 5 to 9 Years (88 | 11.8%) for men and 50 to 54 Years (76 | 9.3%) for women.
| Age Bracket | Male | Female |
| Under 5 Years | 49 (6.6%) | 51 (6.3%) |
| 5 to 9 Years | 88 (11.8%) | 61 (7.5%) |
| 10 to 14 Years | 46 (6.2%) | 53 (6.5%) |
| 15 to 19 Years | 64 (8.6%) | 43 (5.3%) |
| 20 to 24 Years | 7 (0.9%) | 34 (4.2%) |
| 25 to 29 Years | 58 (7.8%) | 48 (5.9%) |
| 30 to 34 Years | 43 (5.8%) | 40 (4.9%) |
| 35 to 39 Years | 37 (5.0%) | 58 (7.1%) |
| 40 to 44 Years | 61 (8.2%) | 61 (7.5%) |
| 45 to 49 Years | 75 (10.1%) | 38 (4.7%) |
| 50 to 54 Years | 44 (5.9%) | 76 (9.3%) |
| 55 to 59 Years | 28 (3.8%) | 36 (4.4%) |
| 60 to 64 Years | 32 (4.3%) | 70 (8.6%) |
| 65 to 69 Years | 21 (2.8%) | 34 (4.2%) |
| 70 to 74 Years | 51 (6.9%) | 38 (4.7%) |
| 75 to 79 Years | 32 (4.3%) | 29 (3.6%) |
| 80 to 84 Years | 9 (1.2%) | 31 (3.8%) |
| 85 Years and over | 0 (0.0%) | 13 (1.6%) |
| Total | 745 (100.0%) | 814 (100.0%) |
Families and Households in Glouster
Median Family Size in Glouster
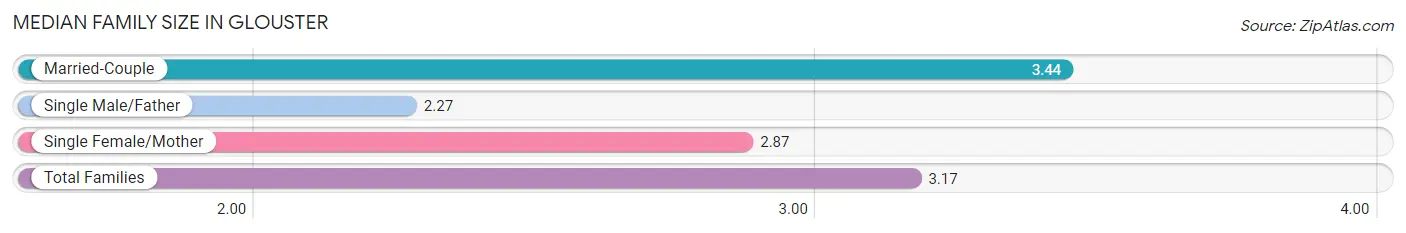
The median family size in Glouster is 3.17 persons per family, with married-couple families (237 | 62.4%) accounting for the largest median family size of 3.44 persons per family. On the other hand, single male/father families (37 | 9.7%) represent the smallest median family size with 2.27 persons per family.
| Family Type | # Families | Family Size |
| Married-Couple | 237 (62.4%) | 3.44 |
| Single Male/Father | 37 (9.7%) | 2.27 |
| Single Female/Mother | 106 (27.9%) | 2.87 |
| Total Families | 380 (100.0%) | 3.17 |
Median Household Size in Glouster
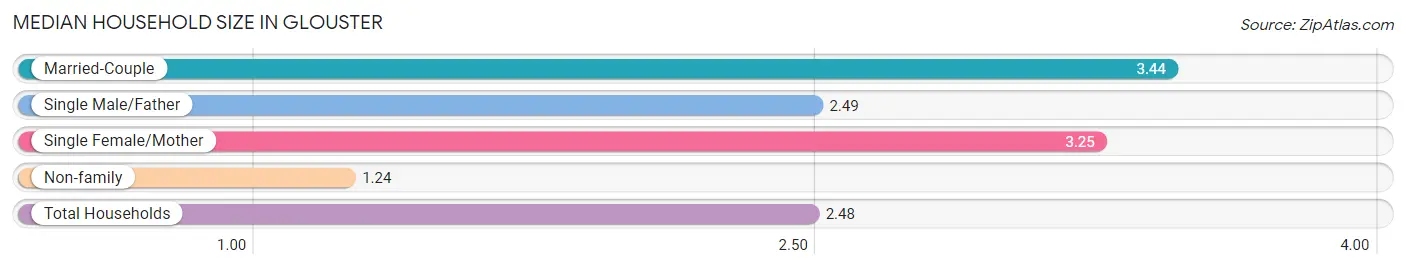
The median household size in Glouster is 2.48 persons per household, with married-couple households (237 | 37.7%) accounting for the largest median household size of 3.44 persons per household. non-family households (248 | 39.5%) represent the smallest median household size with 1.24 persons per household.
| Household Type | # Households | Household Size |
| Married-Couple | 237 (37.7%) | 3.44 |
| Single Male/Father | 37 (5.9%) | 2.49 |
| Single Female/Mother | 106 (16.9%) | 3.25 |
| Non-family | 248 (39.5%) | 1.24 |
| Total Households | 628 (100.0%) | 2.48 |
Household Size by Marriage Status in Glouster
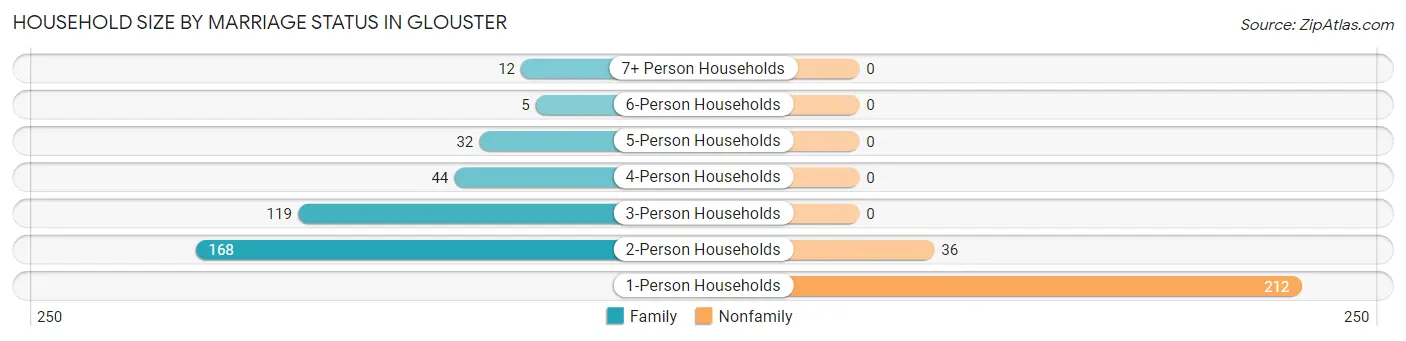
Out of a total of 628 households in Glouster, 380 (60.5%) are family households, while 248 (39.5%) are nonfamily households. The most numerous type of family households are 2-person households, comprising 168, and the most common type of nonfamily households are 1-person households, comprising 212.
| Household Size | Family Households | Nonfamily Households |
| 1-Person Households | - | 212 (33.8%) |
| 2-Person Households | 168 (26.8%) | 36 (5.7%) |
| 3-Person Households | 119 (19.0%) | 0 (0.0%) |
| 4-Person Households | 44 (7.0%) | 0 (0.0%) |
| 5-Person Households | 32 (5.1%) | 0 (0.0%) |
| 6-Person Households | 5 (0.8%) | 0 (0.0%) |
| 7+ Person Households | 12 (1.9%) | 0 (0.0%) |
| Total | 380 (60.5%) | 248 (39.5%) |
Female Fertility in Glouster
Fertility by Age in Glouster
Average fertility rate in Glouster is 103.0 births per 1,000 women. Women in the age bracket of 20 to 34 years have the highest fertility rate with 287.0 births per 1,000 women. Women in the age bracket of 20 to 34 years acount for 100.0% of all women with births.
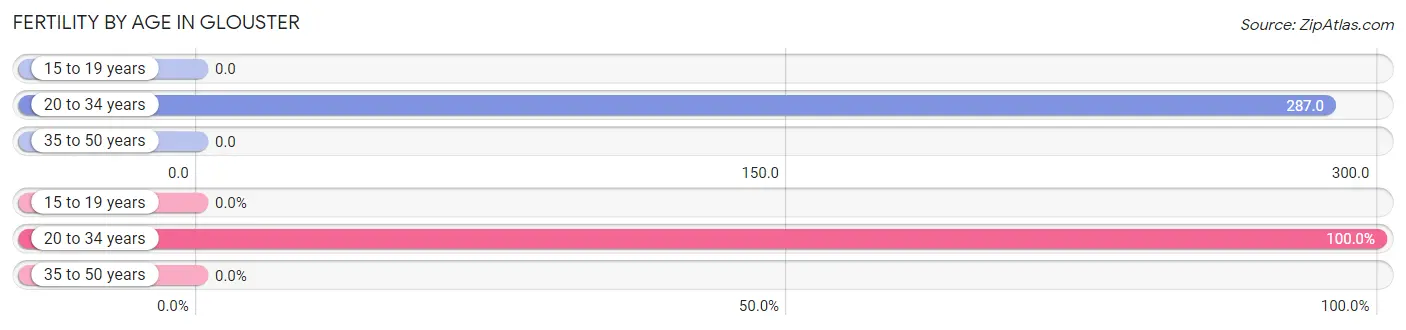
| Age Bracket | Women with Births | Births / 1,000 Women |
| 15 to 19 years | 0 (0.0%) | 0.0 |
| 20 to 34 years | 35 (100.0%) | 287.0 |
| 35 to 50 years | 0 (0.0%) | 0.0 |
| Total | 35 (100.0%) | 103.0 |
Fertility by Age by Marriage Status in Glouster
74.3% of women with births (35) in Glouster are married. The highest percentage of unmarried women with births falls into 20 to 34 years age bracket with 25.7% of them unmarried at the time of birth, while the lowest percentage of unmarried women with births belong to 20 to 34 years age bracket with 25.7% of them unmarried.
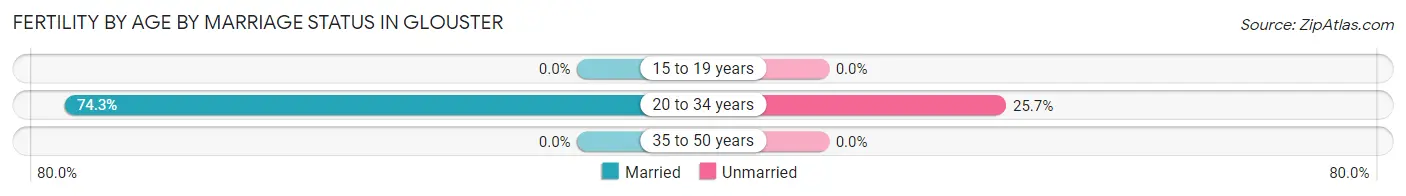
| Age Bracket | Married | Unmarried |
| 15 to 19 years | 0 (0.0%) | 0 (0.0%) |
| 20 to 34 years | 26 (74.3%) | 9 (25.7%) |
| 35 to 50 years | 0 (0.0%) | 0 (0.0%) |
| Total | 26 (74.3%) | 9 (25.7%) |
Fertility by Education in Glouster
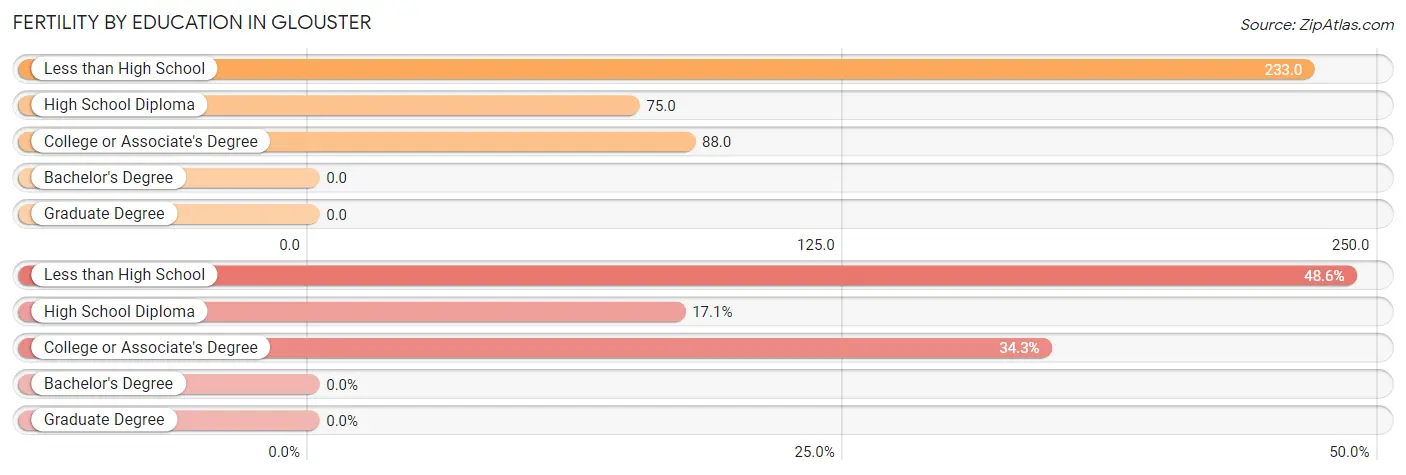
| Educational Attainment | Women with Births | Births / 1,000 Women |
| Less than High School | 17 (48.6%) | 233.0 |
| High School Diploma | 6 (17.1%) | 75.0 |
| College or Associate's Degree | 12 (34.3%) | 88.0 |
| Bachelor's Degree | 0 (0.0%) | 0.0 |
| Graduate Degree | 0 (0.0%) | 0.0 |
| Total | 35 (100.0%) | 103.0 |
Fertility by Education by Marriage Status in Glouster
25.7% of women with births in Glouster are unmarried. Women with the educational attainment of college or associate's degree are most likely to be married with 100.0% of them married at childbirth, while women with the educational attainment of less than high school are least likely to be married with 41.2% of them unmarried at childbirth.
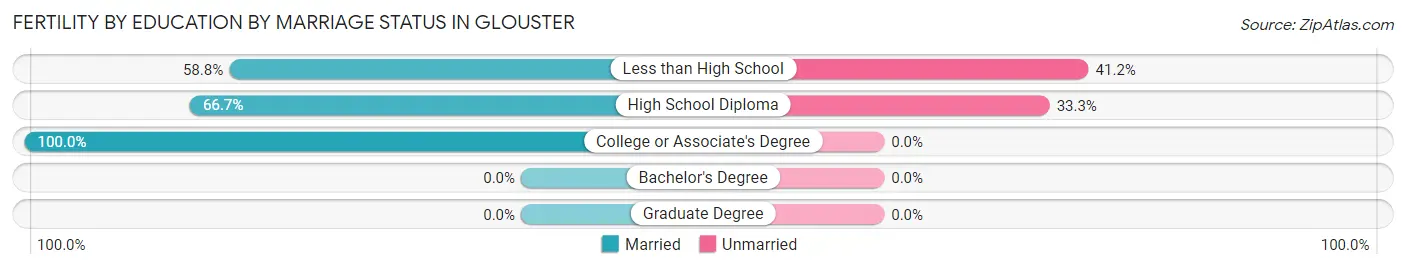
| Educational Attainment | Married | Unmarried |
| Less than High School | 10 (58.8%) | 7 (41.2%) |
| High School Diploma | 4 (66.7%) | 2 (33.3%) |
| College or Associate's Degree | 12 (100.0%) | 0 (0.0%) |
| Bachelor's Degree | 0 (0.0%) | 0 (0.0%) |
| Graduate Degree | 0 (0.0%) | 0 (0.0%) |
| Total | 26 (74.3%) | 9 (25.7%) |
Income in Glouster
Income Overview in Glouster
Per Capita Income in Glouster is $20,018, while median incomes of families and households are $43,214 and $36,905 respectively.
| Characteristic | Number | Measure |
| Per Capita Income | 1,559 | $20,018 |
| Median Family Income | 380 | $43,214 |
| Mean Family Income | 380 | $54,469 |
| Median Household Income | 628 | $36,905 |
| Mean Household Income | 628 | $46,677 |
| Income Deficit | 380 | $0 |
| Wage / Income Gap (%) | 1,559 | 19.94% |
| Wage / Income Gap ($) | 1,559 | 80.06¢ per $1 |
| Gini / Inequality Index | 1,559 | 0.40 |
Earnings by Sex in Glouster
Average Earnings in Glouster are $35,313, $42,045 for men and $33,661 for women, a difference of 19.9%.
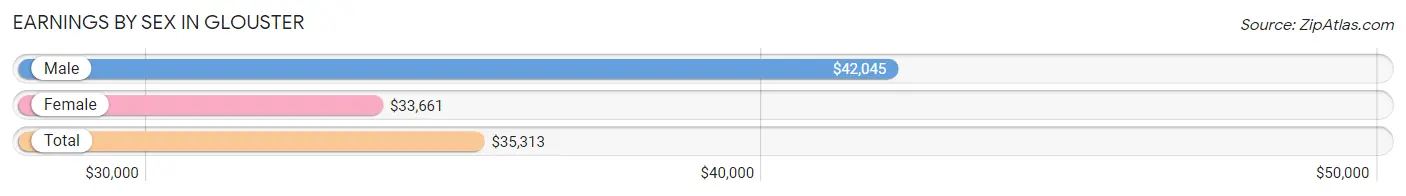
| Sex | Number | Average Earnings |
| Male | 276 (47.5%) | $42,045 |
| Female | 305 (52.5%) | $33,661 |
| Total | 581 (100.0%) | $35,313 |
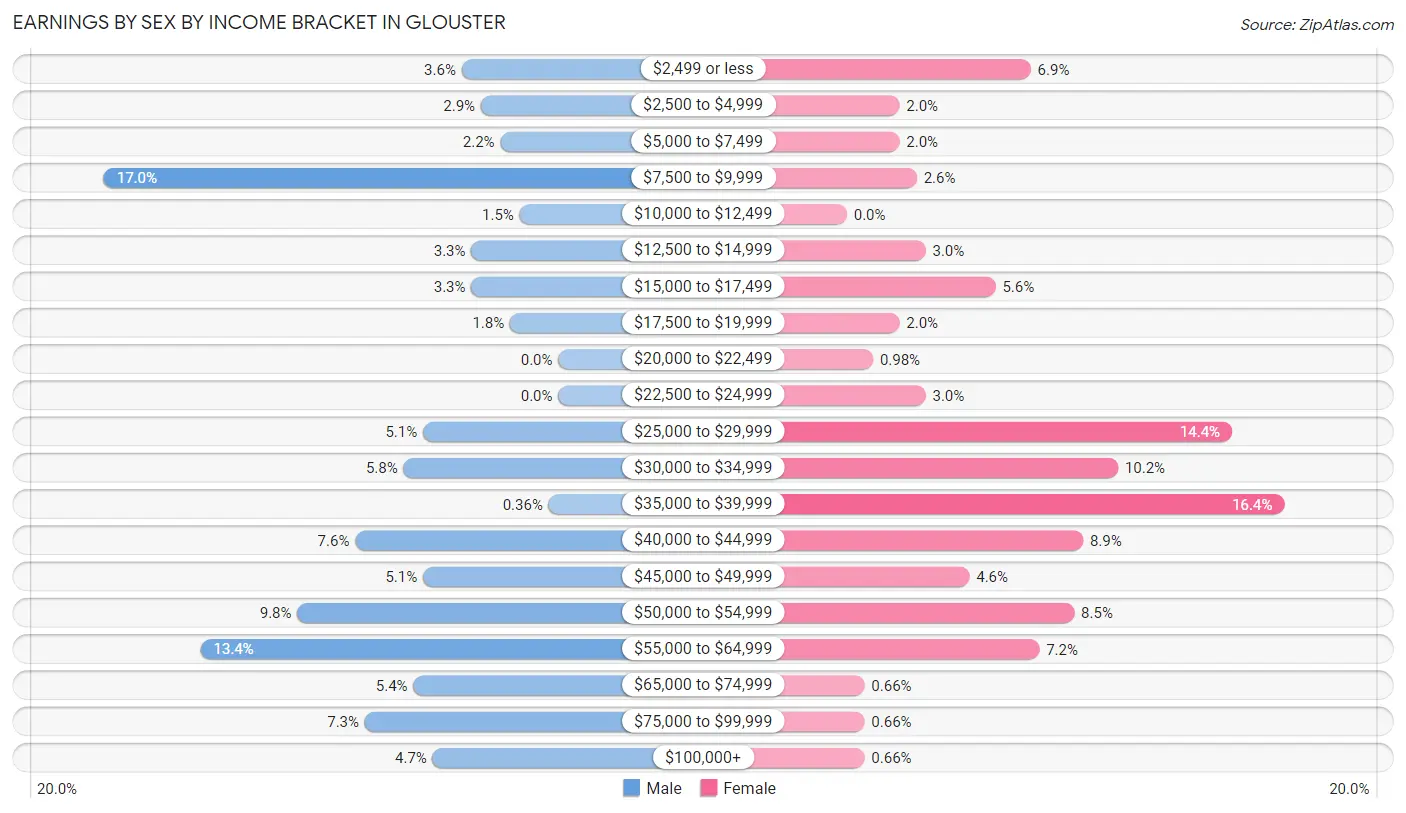
Earnings by Sex by Income Bracket in Glouster
The most common earnings brackets in Glouster are $7,500 to $9,999 for men (47 | 17.0%) and $35,000 to $39,999 for women (50 | 16.4%).
| Income | Male | Female |
| $2,499 or less | 10 (3.6%) | 21 (6.9%) |
| $2,500 to $4,999 | 8 (2.9%) | 6 (2.0%) |
| $5,000 to $7,499 | 6 (2.2%) | 6 (2.0%) |
| $7,500 to $9,999 | 47 (17.0%) | 8 (2.6%) |
| $10,000 to $12,499 | 4 (1.5%) | 0 (0.0%) |
| $12,500 to $14,999 | 9 (3.3%) | 9 (2.9%) |
| $15,000 to $17,499 | 9 (3.3%) | 17 (5.6%) |
| $17,500 to $19,999 | 5 (1.8%) | 6 (2.0%) |
| $20,000 to $22,499 | 0 (0.0%) | 3 (1.0%) |
| $22,500 to $24,999 | 0 (0.0%) | 9 (2.9%) |
| $25,000 to $29,999 | 14 (5.1%) | 44 (14.4%) |
| $30,000 to $34,999 | 16 (5.8%) | 31 (10.2%) |
| $35,000 to $39,999 | 1 (0.4%) | 50 (16.4%) |
| $40,000 to $44,999 | 21 (7.6%) | 27 (8.8%) |
| $45,000 to $49,999 | 14 (5.1%) | 14 (4.6%) |
| $50,000 to $54,999 | 27 (9.8%) | 26 (8.5%) |
| $55,000 to $64,999 | 37 (13.4%) | 22 (7.2%) |
| $65,000 to $74,999 | 15 (5.4%) | 2 (0.7%) |
| $75,000 to $99,999 | 20 (7.2%) | 2 (0.7%) |
| $100,000+ | 13 (4.7%) | 2 (0.7%) |
| Total | 276 (100.0%) | 305 (100.0%) |
Earnings by Sex by Educational Attainment in Glouster
Average earnings in Glouster are $44,500 for men and $36,118 for women, a difference of 18.8%. Men with an educational attainment of bachelor's degree enjoy the highest average annual earnings of $100,481, while those with less than high school education earn the least with $11,875. Women with an educational attainment of graduate degree earn the most with the average annual earnings of $39,766, while those with high school diploma education have the smallest earnings of $26,563.
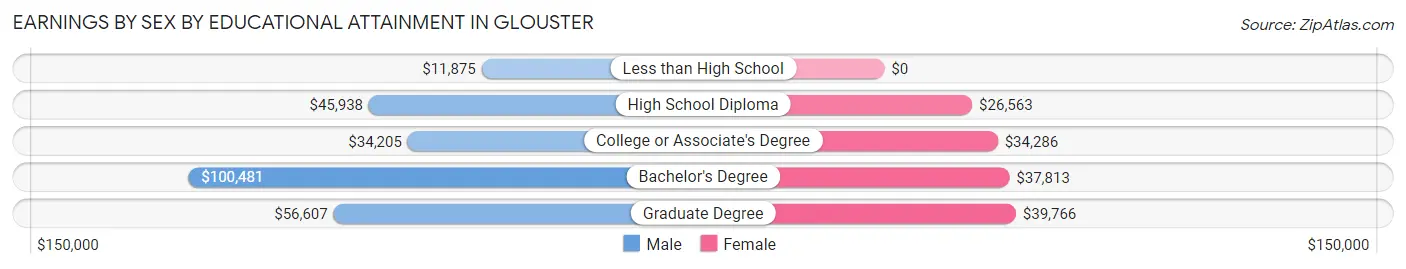
| Educational Attainment | Male Income | Female Income |
| Less than High School | $11,875 | $0 |
| High School Diploma | $45,938 | $26,563 |
| College or Associate's Degree | $34,205 | $34,286 |
| Bachelor's Degree | $100,481 | $37,813 |
| Graduate Degree | $56,607 | $39,766 |
| Total | $44,500 | $36,118 |
Family Income in Glouster
Family Income Brackets in Glouster
According to the Glouster family income data, there are 89 families falling into the $35,000 to $49,999 income range, which is the most common income bracket and makes up 23.4% of all families.
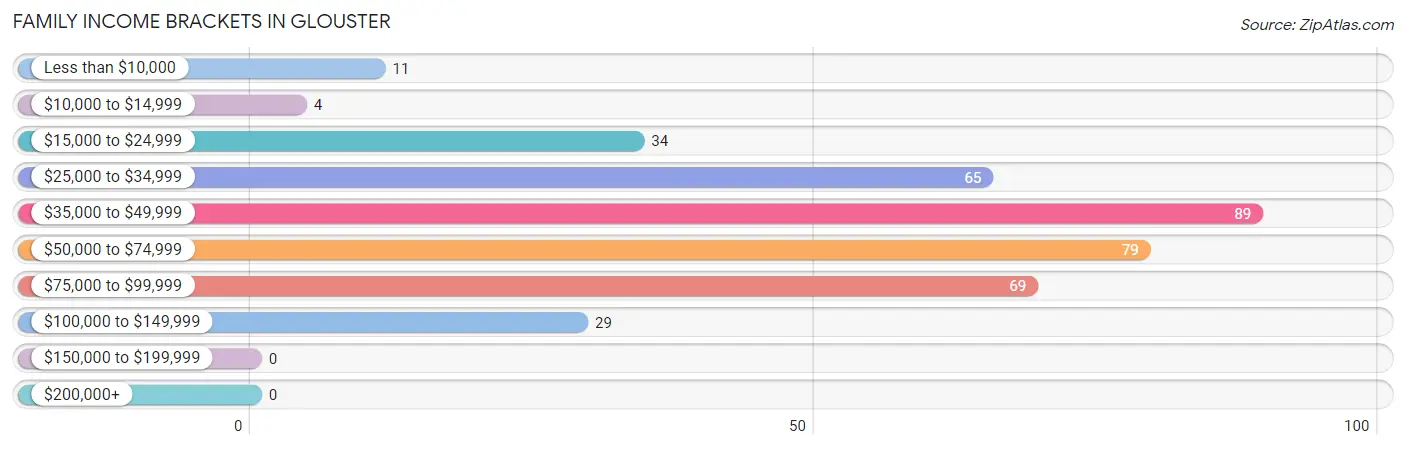
| Income Bracket | # Families | % Families |
| Less than $10,000 | 11 | 2.9% |
| $10,000 to $14,999 | 4 | 1.1% |
| $15,000 to $24,999 | 34 | 8.9% |
| $25,000 to $34,999 | 65 | 17.1% |
| $35,000 to $49,999 | 89 | 23.4% |
| $50,000 to $74,999 | 79 | 20.8% |
| $75,000 to $99,999 | 69 | 18.2% |
| $100,000 to $149,999 | 29 | 7.6% |
| $150,000 to $199,999 | 0 | 0.0% |
| $200,000+ | 0 | 0.0% |
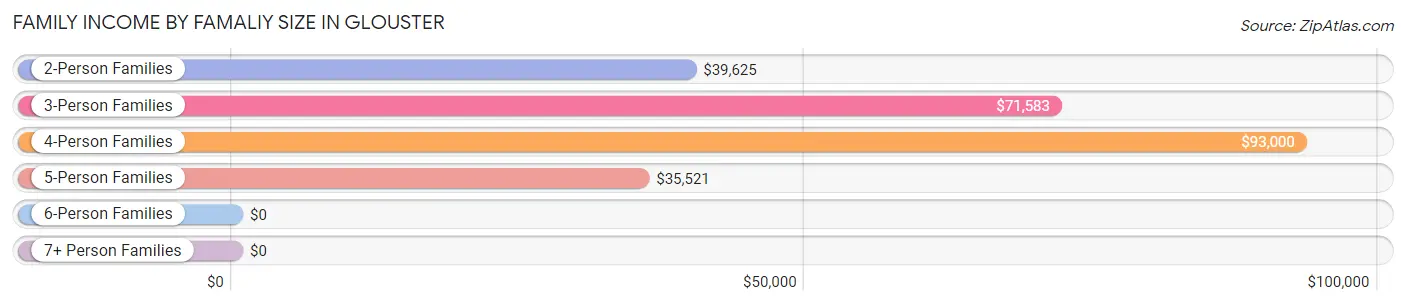
Family Income by Famaliy Size in Glouster
4-person families (40 | 10.5%) account for the highest median family income in Glouster with $93,000 per family, while 3-person families (101 | 26.6%) have the highest median income of $23,861 per family member.
| Income Bracket | # Families | Median Income |
| 2-Person Families | 197 (51.8%) | $39,625 |
| 3-Person Families | 101 (26.6%) | $71,583 |
| 4-Person Families | 40 (10.5%) | $93,000 |
| 5-Person Families | 25 (6.6%) | $35,521 |
| 6-Person Families | 5 (1.3%) | $0 |
| 7+ Person Families | 12 (3.2%) | $0 |
| Total | 380 (100.0%) | $43,214 |
Family Income by Number of Earners in Glouster
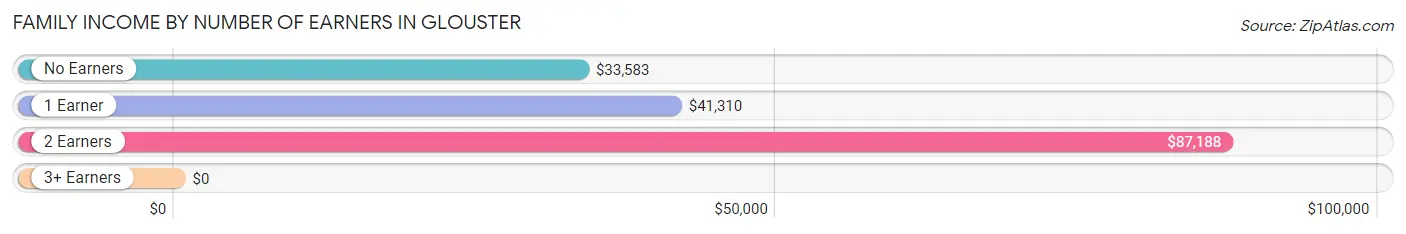
| Number of Earners | # Families | Median Income |
| No Earners | 89 (23.4%) | $33,583 |
| 1 Earner | 178 (46.8%) | $41,310 |
| 2 Earners | 113 (29.7%) | $87,188 |
| 3+ Earners | 0 (0.0%) | $0 |
| Total | 380 (100.0%) | $43,214 |
Household Income in Glouster
Household Income Brackets in Glouster
With 121 households falling in the category, the $25,000 to $34,999 income range is the most frequent in Glouster, accounting for 19.3% of all households.
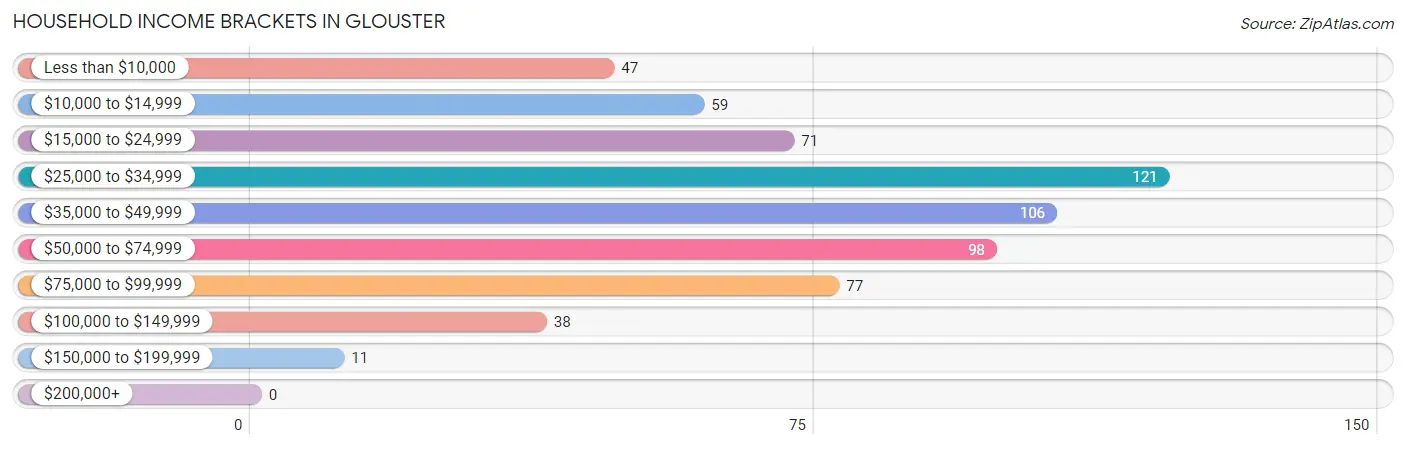
| Income Bracket | # Households | % Households |
| Less than $10,000 | 47 | 7.5% |
| $10,000 to $14,999 | 59 | 9.4% |
| $15,000 to $24,999 | 71 | 11.3% |
| $25,000 to $34,999 | 121 | 19.3% |
| $35,000 to $49,999 | 106 | 16.9% |
| $50,000 to $74,999 | 98 | 15.6% |
| $75,000 to $99,999 | 77 | 12.3% |
| $100,000 to $149,999 | 38 | 6.1% |
| $150,000 to $199,999 | 11 | 1.8% |
| $200,000+ | 0 | 0.0% |
Household Income by Householder Age in Glouster
The median household income in Glouster is $36,905, with the highest median household income of $41,250 found in the 25 to 44 years age bracket for the primary householder. A total of 190 households (30.2%) fall into this category. Meanwhile, the 15 to 24 years age bracket for the primary householder has the lowest median household income of $0, with 19 households (3.0%) in this group.
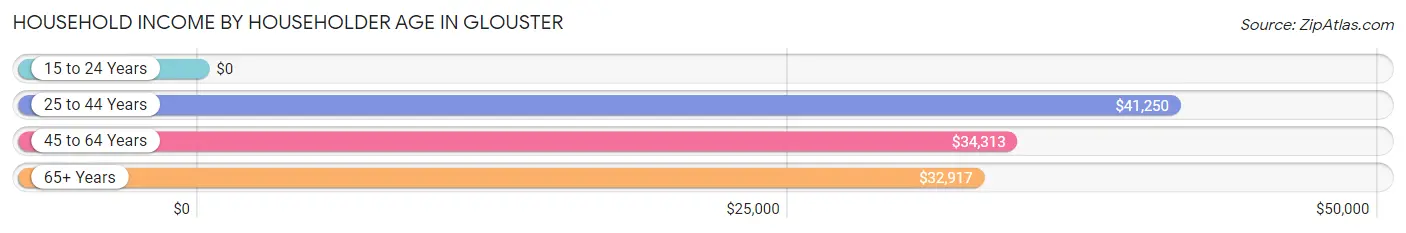
| Income Bracket | # Households | Median Income |
| 15 to 24 Years | 19 (3.0%) | $0 |
| 25 to 44 Years | 190 (30.2%) | $41,250 |
| 45 to 64 Years | 237 (37.7%) | $34,313 |
| 65+ Years | 182 (29.0%) | $32,917 |
| Total | 628 (100.0%) | $36,905 |
Poverty in Glouster
Income Below Poverty by Sex and Age in Glouster
With 29.7% poverty level for males and 26.3% for females among the residents of Glouster, 25 to 34 year old males and 12 to 14 year old females are the most vulnerable to poverty, with 65 males (64.4%) and 14 females (100.0%) in their respective age groups living below the poverty level.
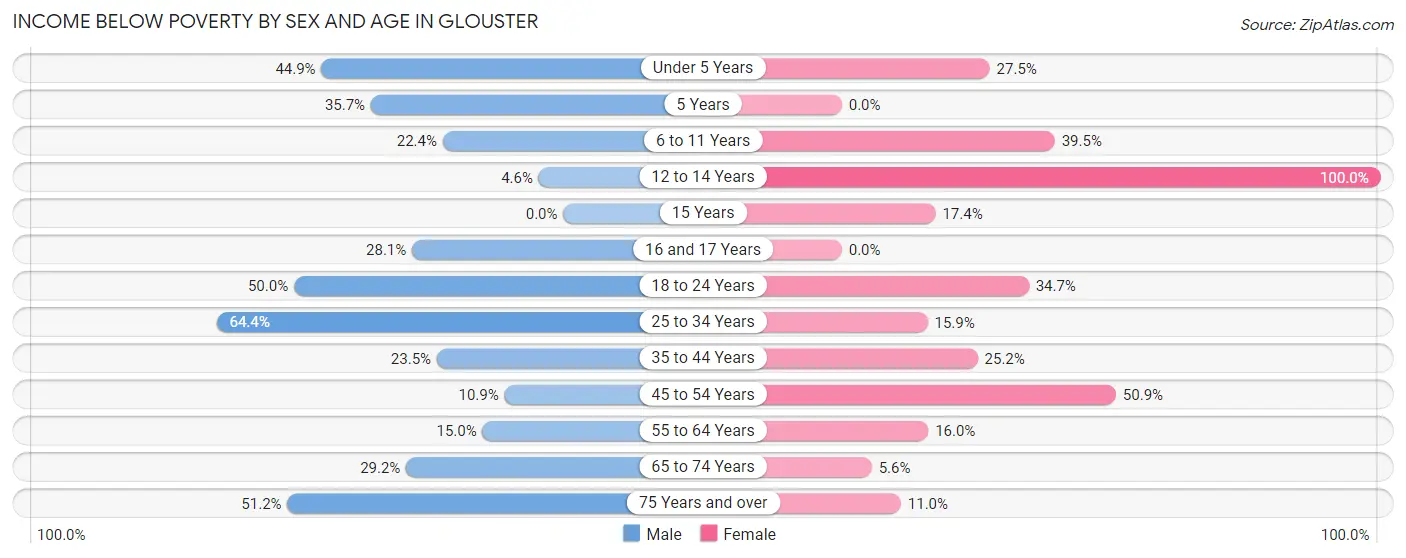
| Age Bracket | Male | Female |
| Under 5 Years | 22 (44.9%) | 14 (27.5%) |
| 5 Years | 5 (35.7%) | 0 (0.0%) |
| 6 to 11 Years | 17 (22.4%) | 34 (39.5%) |
| 12 to 14 Years | 2 (4.5%) | 14 (100.0%) |
| 15 Years | 0 (0.0%) | 4 (17.4%) |
| 16 and 17 Years | 16 (28.1%) | 0 (0.0%) |
| 18 to 24 Years | 7 (50.0%) | 17 (34.7%) |
| 25 to 34 Years | 65 (64.4%) | 14 (15.9%) |
| 35 to 44 Years | 23 (23.5%) | 30 (25.2%) |
| 45 to 54 Years | 13 (10.9%) | 58 (50.9%) |
| 55 to 64 Years | 9 (15.0%) | 17 (16.0%) |
| 65 to 74 Years | 21 (29.2%) | 4 (5.6%) |
| 75 Years and over | 21 (51.2%) | 8 (11.0%) |
| Total | 221 (29.7%) | 214 (26.3%) |
Income Above Poverty by Sex and Age in Glouster
According to the poverty statistics in Glouster, males aged 12 to 14 years and females aged 5 years are the age groups that are most secure financially, with 95.5% of males and 100.0% of females in these age groups living above the poverty line.
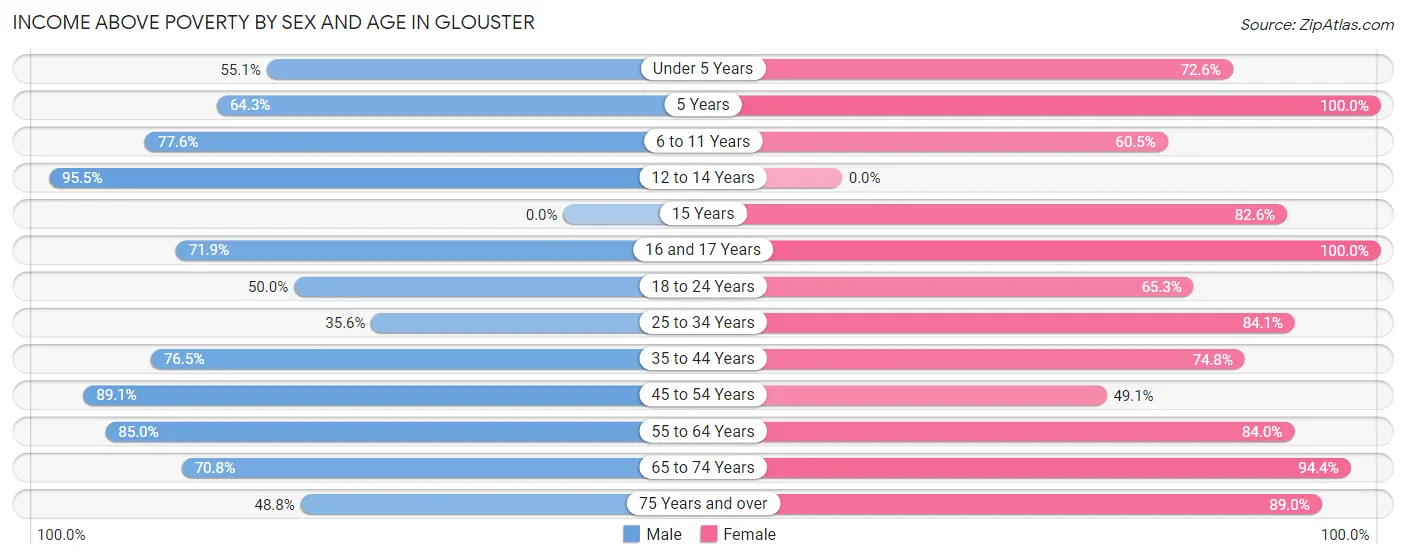
| Age Bracket | Male | Female |
| Under 5 Years | 27 (55.1%) | 37 (72.6%) |
| 5 Years | 9 (64.3%) | 14 (100.0%) |
| 6 to 11 Years | 59 (77.6%) | 52 (60.5%) |
| 12 to 14 Years | 42 (95.5%) | 0 (0.0%) |
| 15 Years | 0 (0.0%) | 19 (82.6%) |
| 16 and 17 Years | 41 (71.9%) | 5 (100.0%) |
| 18 to 24 Years | 7 (50.0%) | 32 (65.3%) |
| 25 to 34 Years | 36 (35.6%) | 74 (84.1%) |
| 35 to 44 Years | 75 (76.5%) | 89 (74.8%) |
| 45 to 54 Years | 106 (89.1%) | 56 (49.1%) |
| 55 to 64 Years | 51 (85.0%) | 89 (84.0%) |
| 65 to 74 Years | 51 (70.8%) | 68 (94.4%) |
| 75 Years and over | 20 (48.8%) | 65 (89.0%) |
| Total | 524 (70.3%) | 600 (73.7%) |
Income Below Poverty Among Married-Couple Families in Glouster
The poverty statistics for married-couple families in Glouster show that 15.6% or 37 of the total 237 families live below the poverty line. Families with 5 or more children have the highest poverty rate of 100.0%, comprising of 12 families. On the other hand, families with 1 or 2 children have the lowest poverty rate of 0.0%, which includes 0 families.
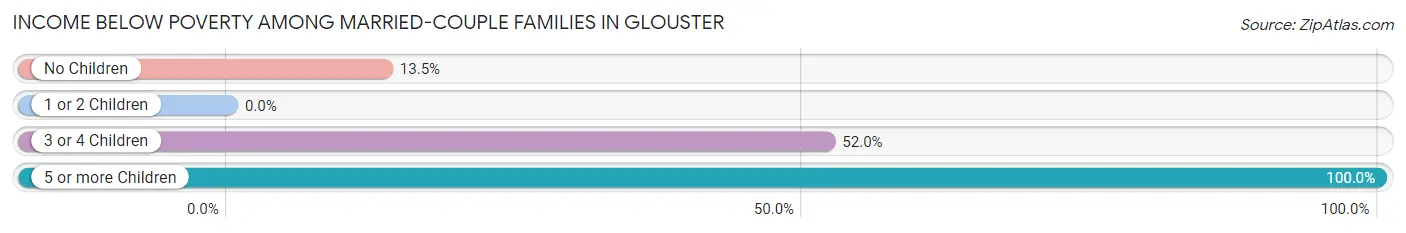
| Children | Above Poverty | Below Poverty |
| No Children | 77 (86.5%) | 12 (13.5%) |
| 1 or 2 Children | 111 (100.0%) | 0 (0.0%) |
| 3 or 4 Children | 12 (48.0%) | 13 (52.0%) |
| 5 or more Children | 0 (0.0%) | 12 (100.0%) |
| Total | 200 (84.4%) | 37 (15.6%) |
Income Below Poverty Among Single-Parent Households in Glouster
According to the poverty data in Glouster, 24.3% or 9 single-father households and 14.1% or 15 single-mother households are living below the poverty line. Among single-father households, those with 1 or 2 children have the highest poverty rate, with 9 households (28.1%) experiencing poverty. Likewise, among single-mother households, those with 3 or 4 children have the highest poverty rate, with 2 households (22.2%) falling below the poverty line.
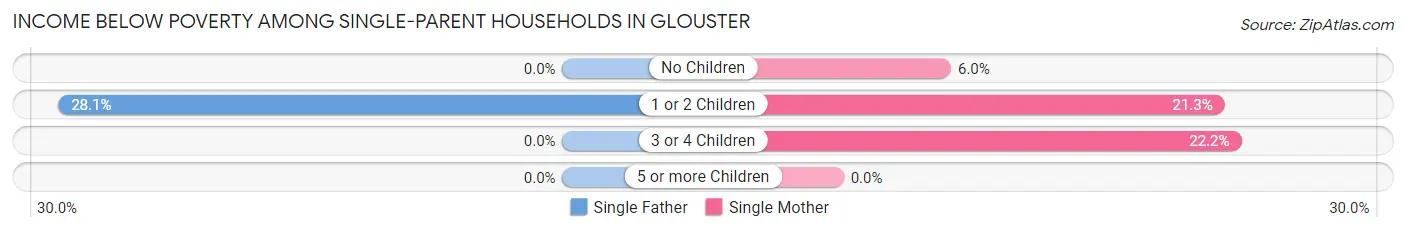
| Children | Single Father | Single Mother |
| No Children | 0 (0.0%) | 3 (6.0%) |
| 1 or 2 Children | 9 (28.1%) | 10 (21.3%) |
| 3 or 4 Children | 0 (0.0%) | 2 (22.2%) |
| 5 or more Children | 0 (0.0%) | 0 (0.0%) |
| Total | 9 (24.3%) | 15 (14.1%) |
Income Below Poverty Among Married-Couple vs Single-Parent Households in Glouster
The poverty data for Glouster shows that 37 of the married-couple family households (15.6%) and 24 of the single-parent households (16.8%) are living below the poverty level. Within the married-couple family households, those with 5 or more children have the highest poverty rate, with 12 households (100.0%) falling below the poverty line. Among the single-parent households, those with 1 or 2 children have the highest poverty rate, with 19 household (24.0%) living below poverty.
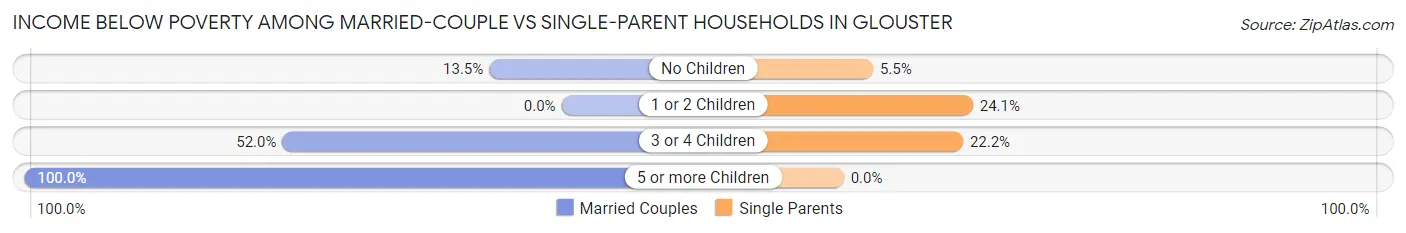
| Children | Married-Couple Families | Single-Parent Households |
| No Children | 12 (13.5%) | 3 (5.4%) |
| 1 or 2 Children | 0 (0.0%) | 19 (24.0%) |
| 3 or 4 Children | 13 (52.0%) | 2 (22.2%) |
| 5 or more Children | 12 (100.0%) | 0 (0.0%) |
| Total | 37 (15.6%) | 24 (16.8%) |
Employment Characteristics in Glouster
Employment by Class of Employer in Glouster
Among the 519 employed individuals in Glouster, private company employees (307 | 59.2%), not-for-profit organizations (78 | 15.0%), and local government employees (50 | 9.6%) make up the most common classes of employment.
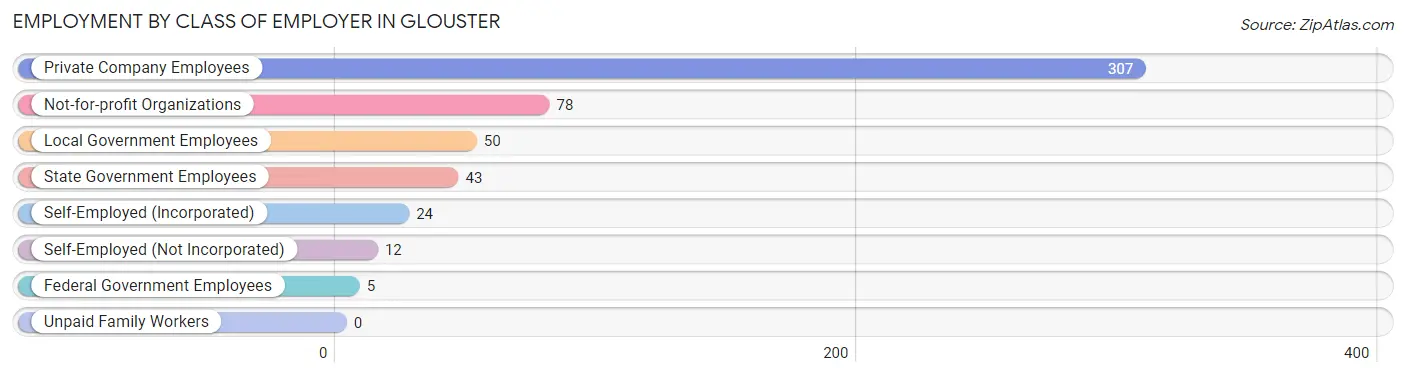
| Employer Class | # Employees | % Employees |
| Private Company Employees | 307 | 59.2% |
| Self-Employed (Incorporated) | 24 | 4.6% |
| Self-Employed (Not Incorporated) | 12 | 2.3% |
| Not-for-profit Organizations | 78 | 15.0% |
| Local Government Employees | 50 | 9.6% |
| State Government Employees | 43 | 8.3% |
| Federal Government Employees | 5 | 1.0% |
| Unpaid Family Workers | 0 | 0.0% |
| Total | 519 | 100.0% |
Employment Status by Age in Glouster
According to the labor force statistics for Glouster, out of the total population over 16 years of age (1,188), 47.6% or 565 individuals are in the labor force, with 4.6% or 26 of them unemployed. The age group with the highest labor force participation rate is 25 to 29 years, with 85.8% or 91 individuals in the labor force. Within the labor force, the 25 to 29 years age range has the highest percentage of unemployed individuals, with 17.6% or 16 of them being unemployed.
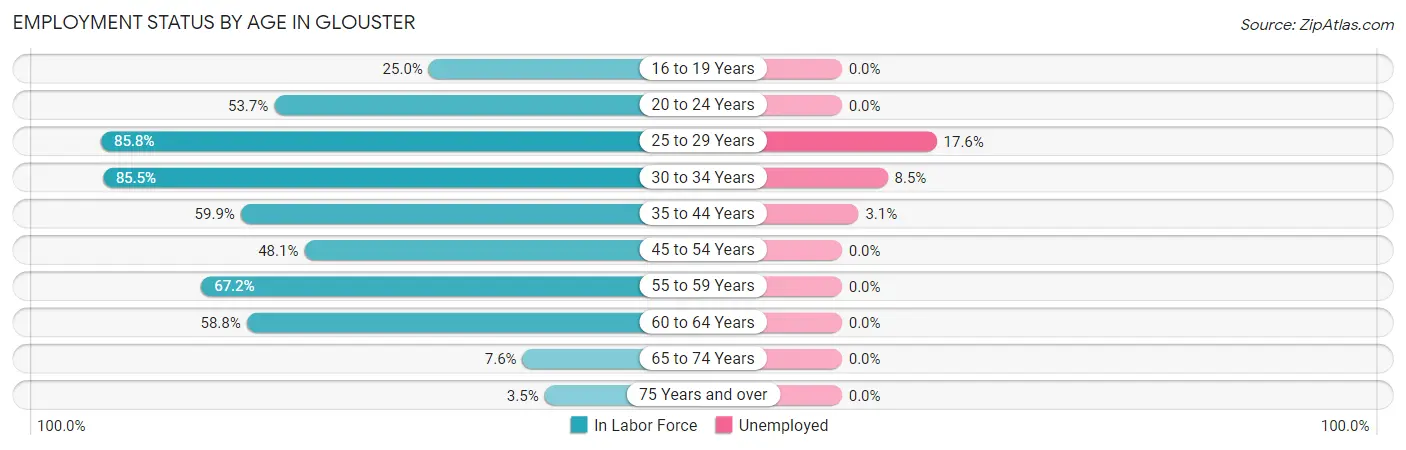
| Age Bracket | In Labor Force | Unemployed |
| 16 to 19 Years | 21 (25.0%) | 0 (0.0%) |
| 20 to 24 Years | 22 (53.7%) | 0 (0.0%) |
| 25 to 29 Years | 91 (85.8%) | 16 (17.6%) |
| 30 to 34 Years | 71 (85.5%) | 6 (8.5%) |
| 35 to 44 Years | 130 (59.9%) | 4 (3.1%) |
| 45 to 54 Years | 112 (48.1%) | 0 (0.0%) |
| 55 to 59 Years | 43 (67.2%) | 0 (0.0%) |
| 60 to 64 Years | 60 (58.8%) | 0 (0.0%) |
| 65 to 74 Years | 11 (7.6%) | 0 (0.0%) |
| 75 Years and over | 4 (3.5%) | 0 (0.0%) |
| Total | 565 (47.6%) | 26 (4.6%) |
Employment Status by Educational Attainment in Glouster
According to labor force statistics for Glouster, 63.0% of individuals (507) out of the total population between 25 and 64 years of age (805) are in the labor force, with 5.1% or 26 of them being unemployed. The group with the highest labor force participation rate are those with the educational attainment of bachelor's degree or higher, with 86.7% or 91 individuals in the labor force. Within the labor force, individuals with bachelor's degree or higher education have the highest percentage of unemployment, with 14.3% or 13 of them being unemployed.
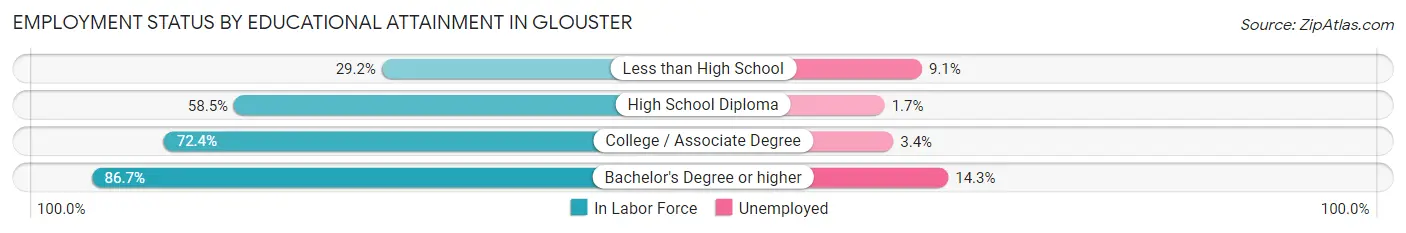
| Educational Attainment | In Labor Force | Unemployed |
| Less than High School | 33 (29.2%) | 10 (9.1%) |
| High School Diploma | 176 (58.5%) | 5 (1.7%) |
| College / Associate Degree | 207 (72.4%) | 10 (3.4%) |
| Bachelor's Degree or higher | 91 (86.7%) | 15 (14.3%) |
| Total | 507 (63.0%) | 41 (5.1%) |
Employment Occupations by Sex in Glouster
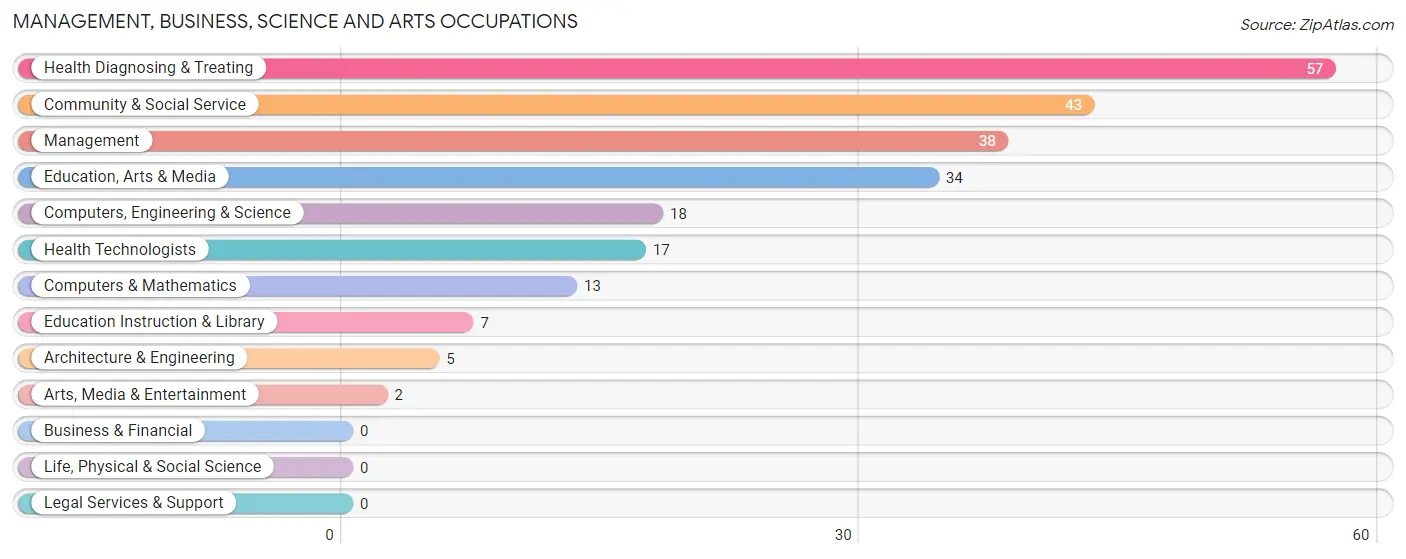
Management, Business, Science and Arts Occupations
The most common Management, Business, Science and Arts occupations in Glouster are Health Diagnosing & Treating (57 | 10.6%), Community & Social Service (43 | 8.0%), Management (38 | 7.0%), Education, Arts & Media (34 | 6.3%), and Computers, Engineering & Science (18 | 3.3%).
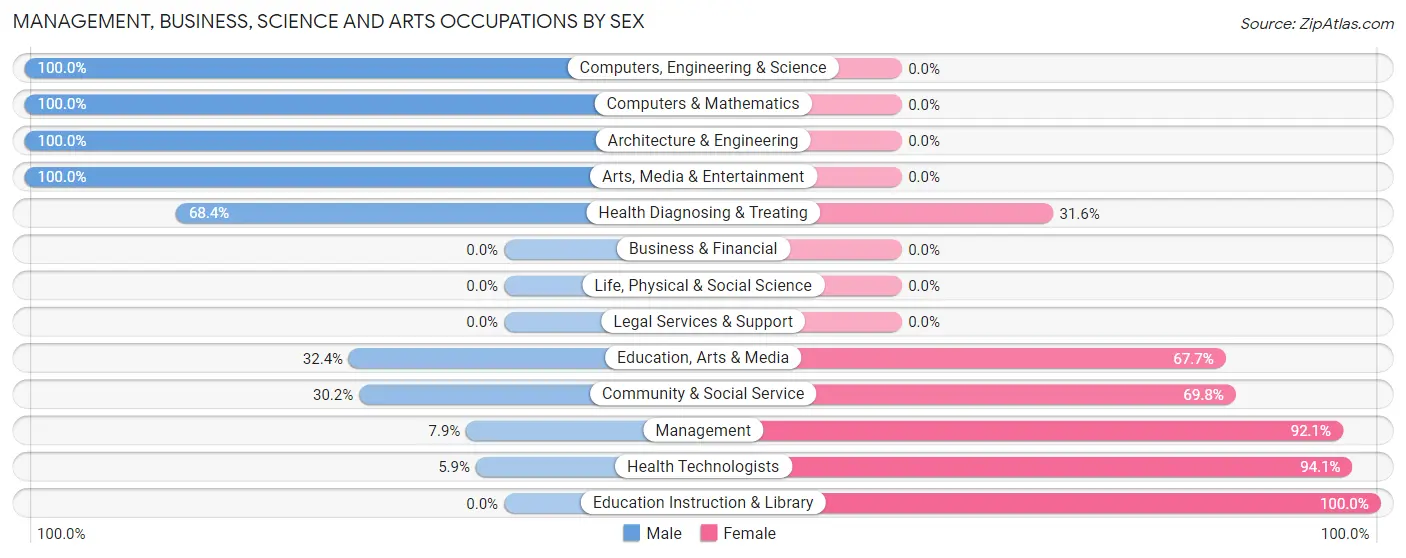
Management, Business, Science and Arts Occupations by Sex
Within the Management, Business, Science and Arts occupations in Glouster, the most male-oriented occupations are Computers, Engineering & Science (100.0%), Computers & Mathematics (100.0%), and Architecture & Engineering (100.0%), while the most female-oriented occupations are Education Instruction & Library (100.0%), Health Technologists (94.1%), and Management (92.1%).
| Occupation | Male | Female |
| Management | 3 (7.9%) | 35 (92.1%) |
| Business & Financial | 0 (0.0%) | 0 (0.0%) |
| Computers, Engineering & Science | 18 (100.0%) | 0 (0.0%) |
| Computers & Mathematics | 13 (100.0%) | 0 (0.0%) |
| Architecture & Engineering | 5 (100.0%) | 0 (0.0%) |
| Life, Physical & Social Science | 0 (0.0%) | 0 (0.0%) |
| Community & Social Service | 13 (30.2%) | 30 (69.8%) |
| Education, Arts & Media | 11 (32.4%) | 23 (67.6%) |
| Legal Services & Support | 0 (0.0%) | 0 (0.0%) |
| Education Instruction & Library | 0 (0.0%) | 7 (100.0%) |
| Arts, Media & Entertainment | 2 (100.0%) | 0 (0.0%) |
| Health Diagnosing & Treating | 39 (68.4%) | 18 (31.6%) |
| Health Technologists | 1 (5.9%) | 16 (94.1%) |
| Total (Category) | 73 (46.8%) | 83 (53.2%) |
| Total (Overall) | 263 (48.8%) | 276 (51.2%) |
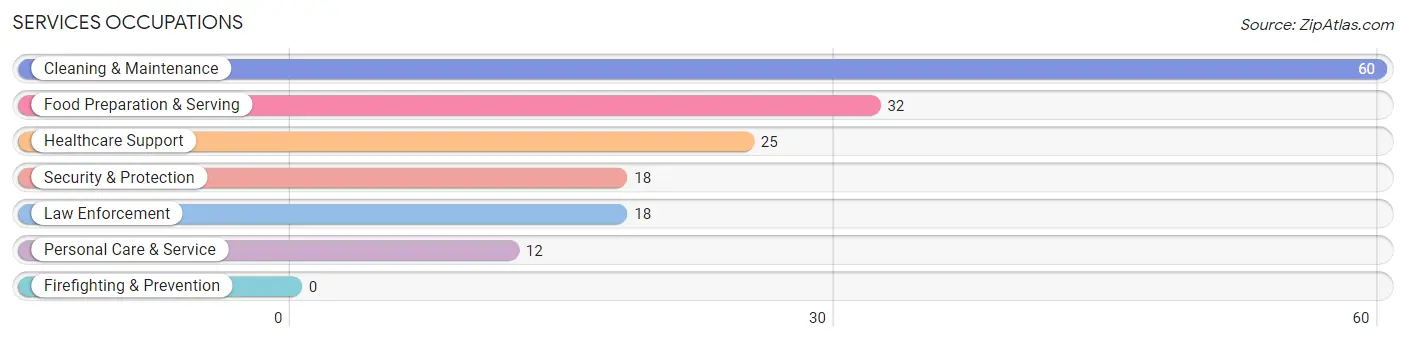
Services Occupations
The most common Services occupations in Glouster are Cleaning & Maintenance (60 | 11.1%), Food Preparation & Serving (32 | 5.9%), Healthcare Support (25 | 4.6%), Security & Protection (18 | 3.3%), and Law Enforcement (18 | 3.3%).
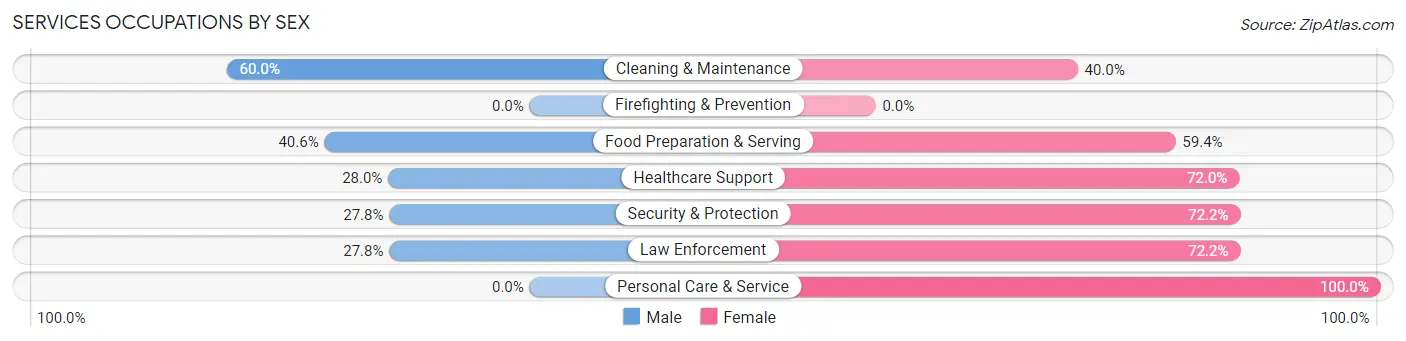
Services Occupations by Sex
Within the Services occupations in Glouster, the most male-oriented occupations are Cleaning & Maintenance (60.0%), Food Preparation & Serving (40.6%), and Healthcare Support (28.0%), while the most female-oriented occupations are Personal Care & Service (100.0%), Security & Protection (72.2%), and Law Enforcement (72.2%).
| Occupation | Male | Female |
| Healthcare Support | 7 (28.0%) | 18 (72.0%) |
| Security & Protection | 5 (27.8%) | 13 (72.2%) |
| Firefighting & Prevention | 0 (0.0%) | 0 (0.0%) |
| Law Enforcement | 5 (27.8%) | 13 (72.2%) |
| Food Preparation & Serving | 13 (40.6%) | 19 (59.4%) |
| Cleaning & Maintenance | 36 (60.0%) | 24 (40.0%) |
| Personal Care & Service | 0 (0.0%) | 12 (100.0%) |
| Total (Category) | 61 (41.5%) | 86 (58.5%) |
| Total (Overall) | 263 (48.8%) | 276 (51.2%) |
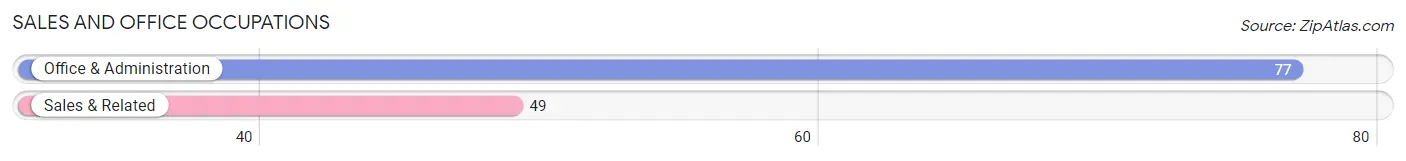
Sales and Office Occupations
The most common Sales and Office occupations in Glouster are Office & Administration (77 | 14.3%), and Sales & Related (49 | 9.1%).
Sales and Office Occupations by Sex
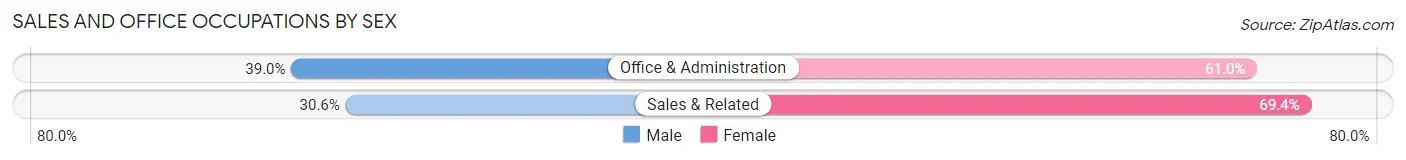
| Occupation | Male | Female |
| Sales & Related | 15 (30.6%) | 34 (69.4%) |
| Office & Administration | 30 (39.0%) | 47 (61.0%) |
| Total (Category) | 45 (35.7%) | 81 (64.3%) |
| Total (Overall) | 263 (48.8%) | 276 (51.2%) |
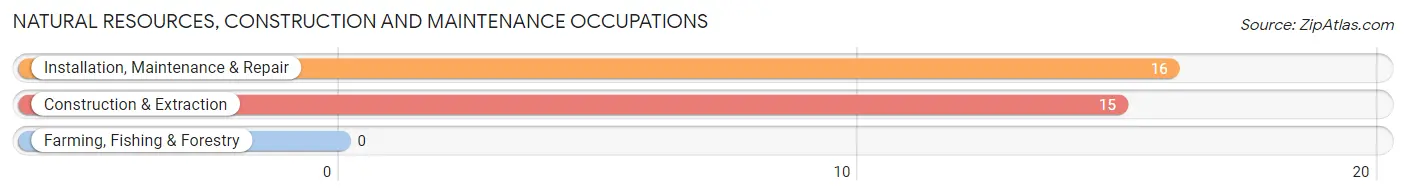
Natural Resources, Construction and Maintenance Occupations
The most common Natural Resources, Construction and Maintenance occupations in Glouster are Installation, Maintenance & Repair (16 | 3.0%), and Construction & Extraction (15 | 2.8%).
Natural Resources, Construction and Maintenance Occupations by Sex
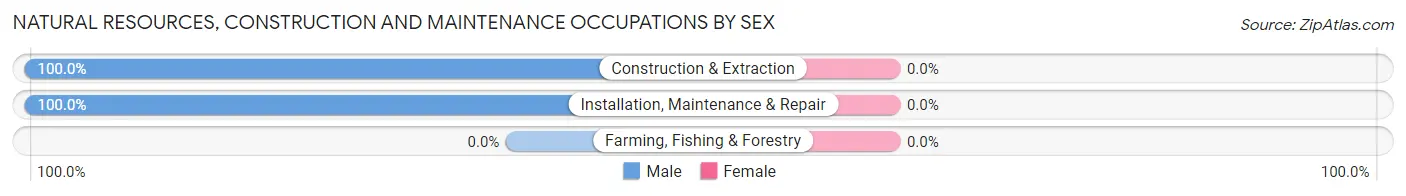
| Occupation | Male | Female |
| Farming, Fishing & Forestry | 0 (0.0%) | 0 (0.0%) |
| Construction & Extraction | 15 (100.0%) | 0 (0.0%) |
| Installation, Maintenance & Repair | 16 (100.0%) | 0 (0.0%) |
| Total (Category) | 31 (100.0%) | 0 (0.0%) |
| Total (Overall) | 263 (48.8%) | 276 (51.2%) |
Production, Transportation and Moving Occupations
The most common Production, Transportation and Moving occupations in Glouster are Production (31 | 5.8%), Transportation (24 | 4.4%), and Material Moving (24 | 4.4%).
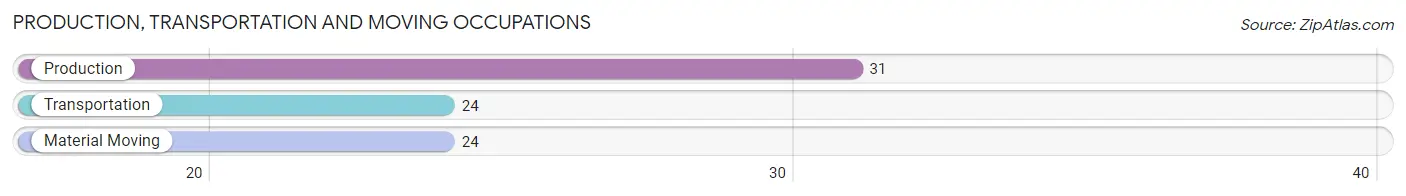
Production, Transportation and Moving Occupations by Sex
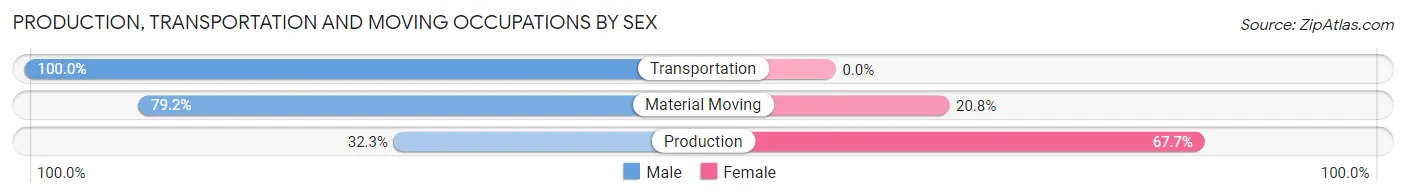
| Occupation | Male | Female |
| Production | 10 (32.3%) | 21 (67.7%) |
| Transportation | 24 (100.0%) | 0 (0.0%) |
| Material Moving | 19 (79.2%) | 5 (20.8%) |
| Total (Category) | 53 (67.1%) | 26 (32.9%) |
| Total (Overall) | 263 (48.8%) | 276 (51.2%) |
Employment Industries by Sex in Glouster
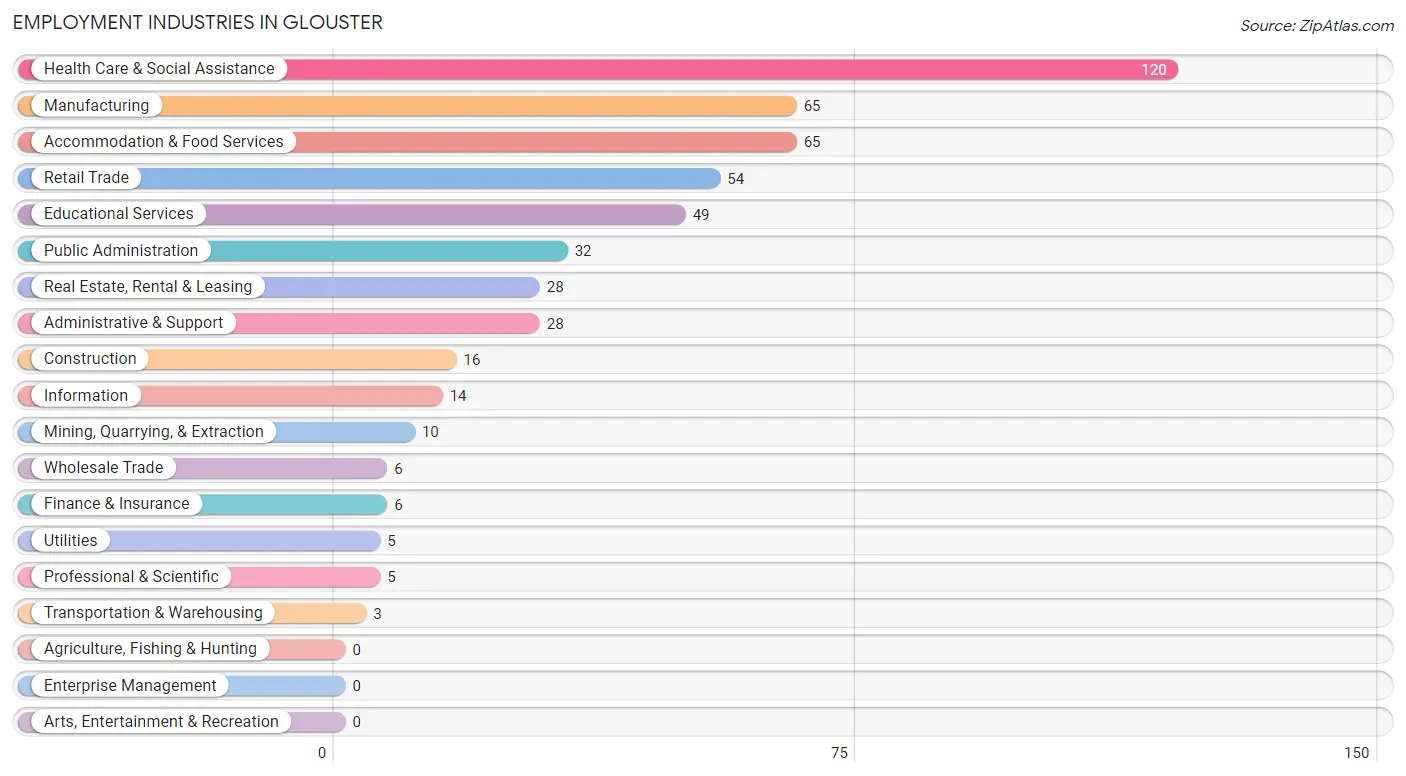
Employment Industries in Glouster
The major employment industries in Glouster include Health Care & Social Assistance (120 | 22.3%), Manufacturing (65 | 12.1%), Accommodation & Food Services (65 | 12.1%), Retail Trade (54 | 10.0%), and Educational Services (49 | 9.1%).
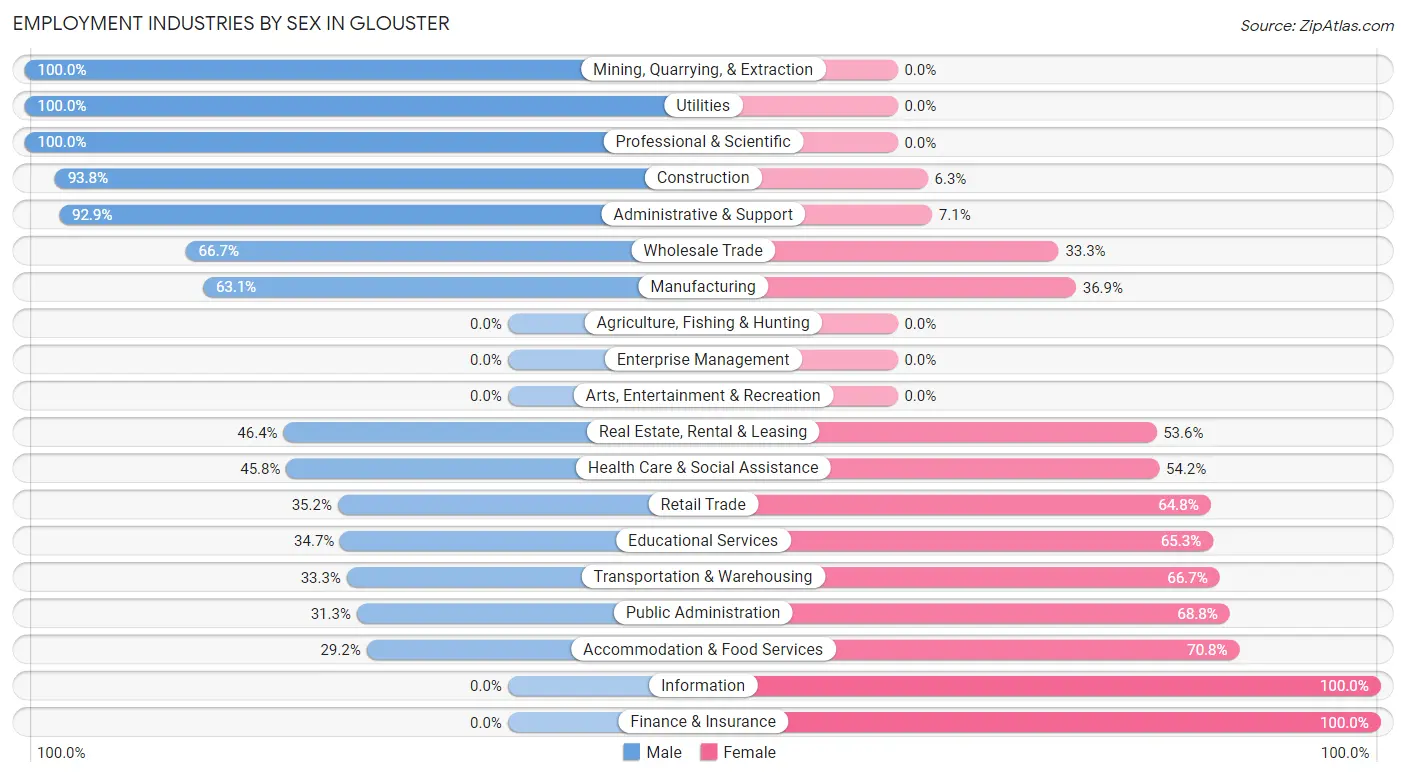
Employment Industries by Sex in Glouster
The Glouster industries that see more men than women are Mining, Quarrying, & Extraction (100.0%), Utilities (100.0%), and Professional & Scientific (100.0%), whereas the industries that tend to have a higher number of women are Information (100.0%), Finance & Insurance (100.0%), and Accommodation & Food Services (70.8%).
| Industry | Male | Female |
| Agriculture, Fishing & Hunting | 0 (0.0%) | 0 (0.0%) |
| Mining, Quarrying, & Extraction | 10 (100.0%) | 0 (0.0%) |
| Construction | 15 (93.8%) | 1 (6.2%) |
| Manufacturing | 41 (63.1%) | 24 (36.9%) |
| Wholesale Trade | 4 (66.7%) | 2 (33.3%) |
| Retail Trade | 19 (35.2%) | 35 (64.8%) |
| Transportation & Warehousing | 1 (33.3%) | 2 (66.7%) |
| Utilities | 5 (100.0%) | 0 (0.0%) |
| Information | 0 (0.0%) | 14 (100.0%) |
| Finance & Insurance | 0 (0.0%) | 6 (100.0%) |
| Real Estate, Rental & Leasing | 13 (46.4%) | 15 (53.6%) |
| Professional & Scientific | 5 (100.0%) | 0 (0.0%) |
| Enterprise Management | 0 (0.0%) | 0 (0.0%) |
| Administrative & Support | 26 (92.9%) | 2 (7.1%) |
| Educational Services | 17 (34.7%) | 32 (65.3%) |
| Health Care & Social Assistance | 55 (45.8%) | 65 (54.2%) |
| Arts, Entertainment & Recreation | 0 (0.0%) | 0 (0.0%) |
| Accommodation & Food Services | 19 (29.2%) | 46 (70.8%) |
| Public Administration | 10 (31.2%) | 22 (68.8%) |
| Total | 263 (48.8%) | 276 (51.2%) |
Education in Glouster
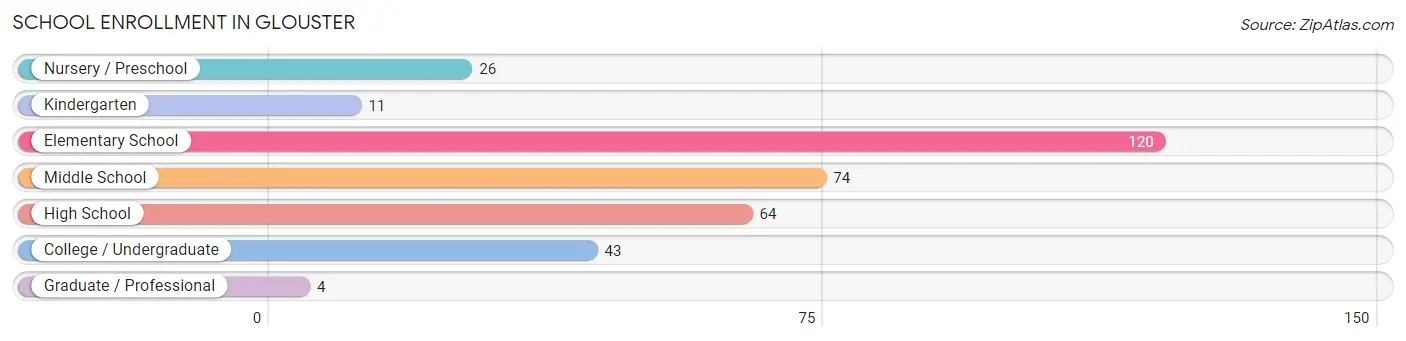
School Enrollment in Glouster
The most common levels of schooling among the 342 students in Glouster are elementary school (120 | 35.1%), middle school (74 | 21.6%), and high school (64 | 18.7%).
| School Level | # Students | % Students |
| Nursery / Preschool | 26 | 7.6% |
| Kindergarten | 11 | 3.2% |
| Elementary School | 120 | 35.1% |
| Middle School | 74 | 21.6% |
| High School | 64 | 18.7% |
| College / Undergraduate | 43 | 12.6% |
| Graduate / Professional | 4 | 1.2% |
| Total | 342 | 100.0% |
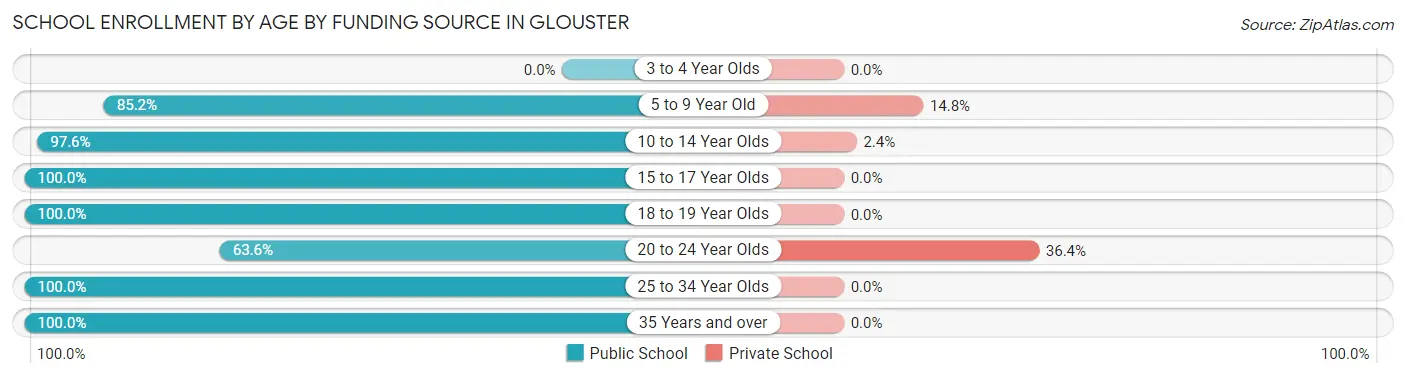
School Enrollment by Age by Funding Source in Glouster
Out of a total of 342 students who are enrolled in schools in Glouster, 28 (8.2%) attend a private institution, while the remaining 314 (91.8%) are enrolled in public schools. The age group of 20 to 24 year olds has the highest likelihood of being enrolled in private schools, with 4 (36.4% in the age bracket) enrolled. Conversely, the age group of 15 to 17 year olds has the lowest likelihood of being enrolled in a private school, with 62 (100.0% in the age bracket) attending a public institution.
| Age Bracket | Public School | Private School |
| 3 to 4 Year Olds | 0 (0.0%) | 0 (0.0%) |
| 5 to 9 Year Old | 127 (85.2%) | 22 (14.8%) |
| 10 to 14 Year Olds | 82 (97.6%) | 2 (2.4%) |
| 15 to 17 Year Olds | 62 (100.0%) | 0 (0.0%) |
| 18 to 19 Year Olds | 5 (100.0%) | 0 (0.0%) |
| 20 to 24 Year Olds | 7 (63.6%) | 4 (36.4%) |
| 25 to 34 Year Olds | 6 (100.0%) | 0 (0.0%) |
| 35 Years and over | 25 (100.0%) | 0 (0.0%) |
| Total | 314 (91.8%) | 28 (8.2%) |
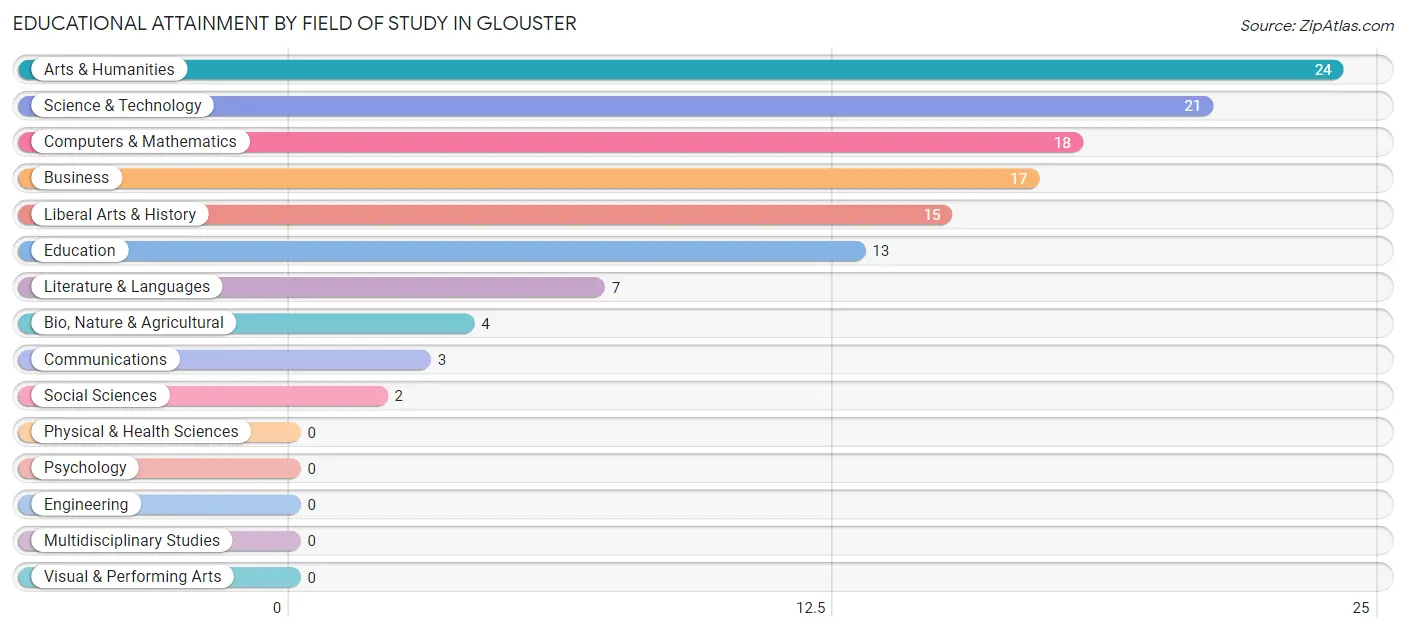
Educational Attainment by Field of Study in Glouster
Arts & humanities (24 | 19.4%), science & technology (21 | 16.9%), computers & mathematics (18 | 14.5%), business (17 | 13.7%), and liberal arts & history (15 | 12.1%) are the most common fields of study among 124 individuals in Glouster who have obtained a bachelor's degree or higher.
| Field of Study | # Graduates | % Graduates |
| Computers & Mathematics | 18 | 14.5% |
| Bio, Nature & Agricultural | 4 | 3.2% |
| Physical & Health Sciences | 0 | 0.0% |
| Psychology | 0 | 0.0% |
| Social Sciences | 2 | 1.6% |
| Engineering | 0 | 0.0% |
| Multidisciplinary Studies | 0 | 0.0% |
| Science & Technology | 21 | 16.9% |
| Business | 17 | 13.7% |
| Education | 13 | 10.5% |
| Literature & Languages | 7 | 5.7% |
| Liberal Arts & History | 15 | 12.1% |
| Visual & Performing Arts | 0 | 0.0% |
| Communications | 3 | 2.4% |
| Arts & Humanities | 24 | 19.4% |
| Total | 124 | 100.0% |
Transportation & Commute in Glouster
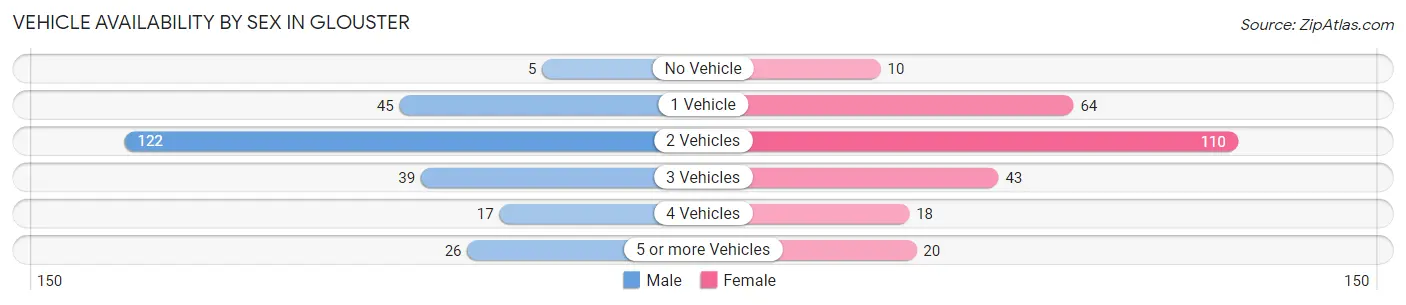
Vehicle Availability by Sex in Glouster
The most prevalent vehicle ownership categories in Glouster are males with 2 vehicles (122, accounting for 48.0%) and females with 2 vehicles (110, making up 46.0%).
| Vehicles Available | Male | Female |
| No Vehicle | 5 (2.0%) | 10 (3.8%) |
| 1 Vehicle | 45 (17.7%) | 64 (24.1%) |
| 2 Vehicles | 122 (48.0%) | 110 (41.5%) |
| 3 Vehicles | 39 (15.3%) | 43 (16.2%) |
| 4 Vehicles | 17 (6.7%) | 18 (6.8%) |
| 5 or more Vehicles | 26 (10.2%) | 20 (7.5%) |
| Total | 254 (100.0%) | 265 (100.0%) |
Commute Time in Glouster
The most frequently occuring commute durations in Glouster are 5 to 9 minutes (90 commuters, 18.5%), 25 to 29 minutes (67 commuters, 13.8%), and 30 to 34 minutes (61 commuters, 12.5%).
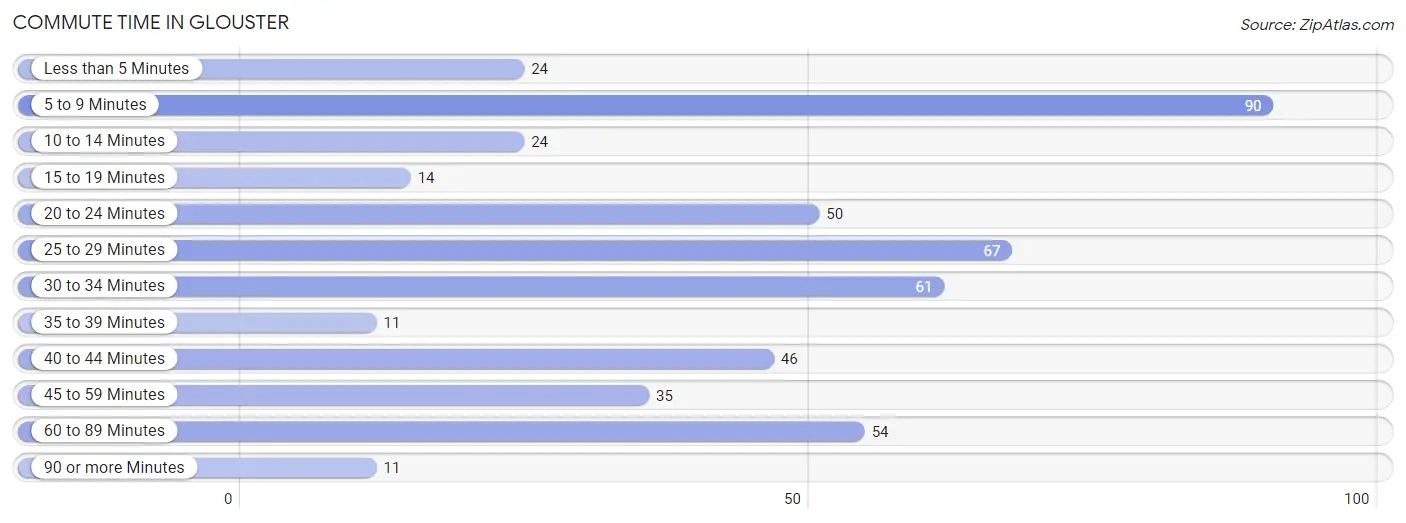
| Commute Time | # Commuters | % Commuters |
| Less than 5 Minutes | 24 | 4.9% |
| 5 to 9 Minutes | 90 | 18.5% |
| 10 to 14 Minutes | 24 | 4.9% |
| 15 to 19 Minutes | 14 | 2.9% |
| 20 to 24 Minutes | 50 | 10.3% |
| 25 to 29 Minutes | 67 | 13.8% |
| 30 to 34 Minutes | 61 | 12.5% |
| 35 to 39 Minutes | 11 | 2.3% |
| 40 to 44 Minutes | 46 | 9.5% |
| 45 to 59 Minutes | 35 | 7.2% |
| 60 to 89 Minutes | 54 | 11.1% |
| 90 or more Minutes | 11 | 2.3% |
Commute Time by Sex in Glouster
The most common commute times in Glouster are 5 to 9 minutes (56 commuters, 23.5%) for males and 25 to 29 minutes (53 commuters, 21.3%) for females.
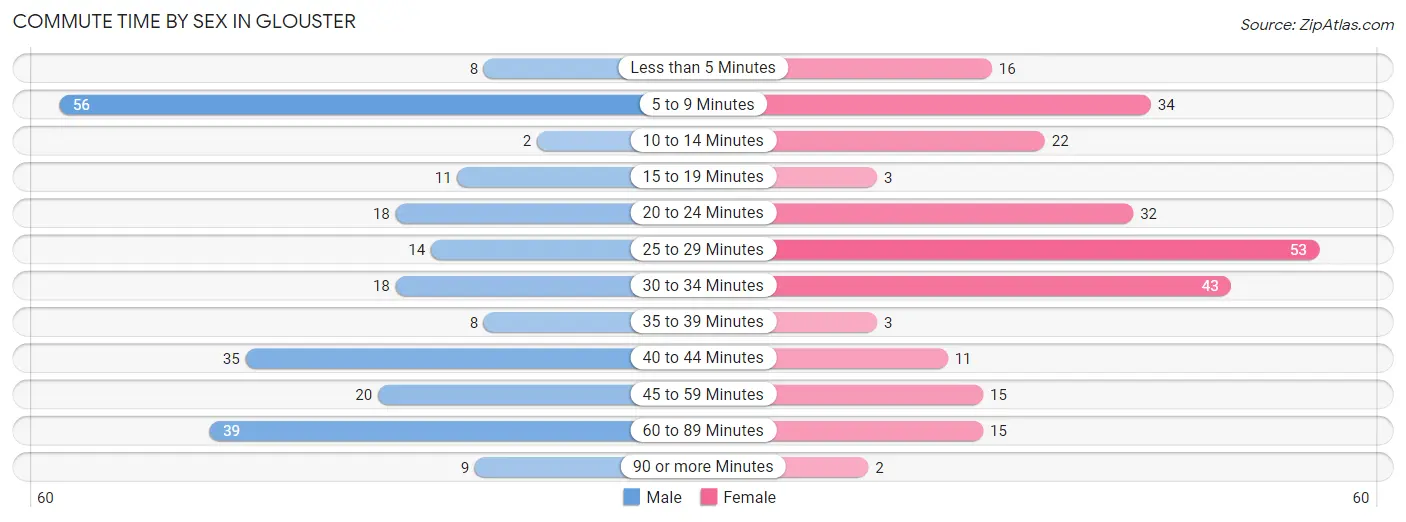
| Commute Time | Male | Female |
| Less than 5 Minutes | 8 (3.4%) | 16 (6.4%) |
| 5 to 9 Minutes | 56 (23.5%) | 34 (13.7%) |
| 10 to 14 Minutes | 2 (0.8%) | 22 (8.8%) |
| 15 to 19 Minutes | 11 (4.6%) | 3 (1.2%) |
| 20 to 24 Minutes | 18 (7.6%) | 32 (12.9%) |
| 25 to 29 Minutes | 14 (5.9%) | 53 (21.3%) |
| 30 to 34 Minutes | 18 (7.6%) | 43 (17.3%) |
| 35 to 39 Minutes | 8 (3.4%) | 3 (1.2%) |
| 40 to 44 Minutes | 35 (14.7%) | 11 (4.4%) |
| 45 to 59 Minutes | 20 (8.4%) | 15 (6.0%) |
| 60 to 89 Minutes | 39 (16.4%) | 15 (6.0%) |
| 90 or more Minutes | 9 (3.8%) | 2 (0.8%) |
Time of Departure to Work by Sex in Glouster
The most frequent times of departure to work in Glouster are 6:00 AM to 6:29 AM (43, 18.1%) for males and 8:30 AM to 8:59 AM (42, 16.9%) for females.
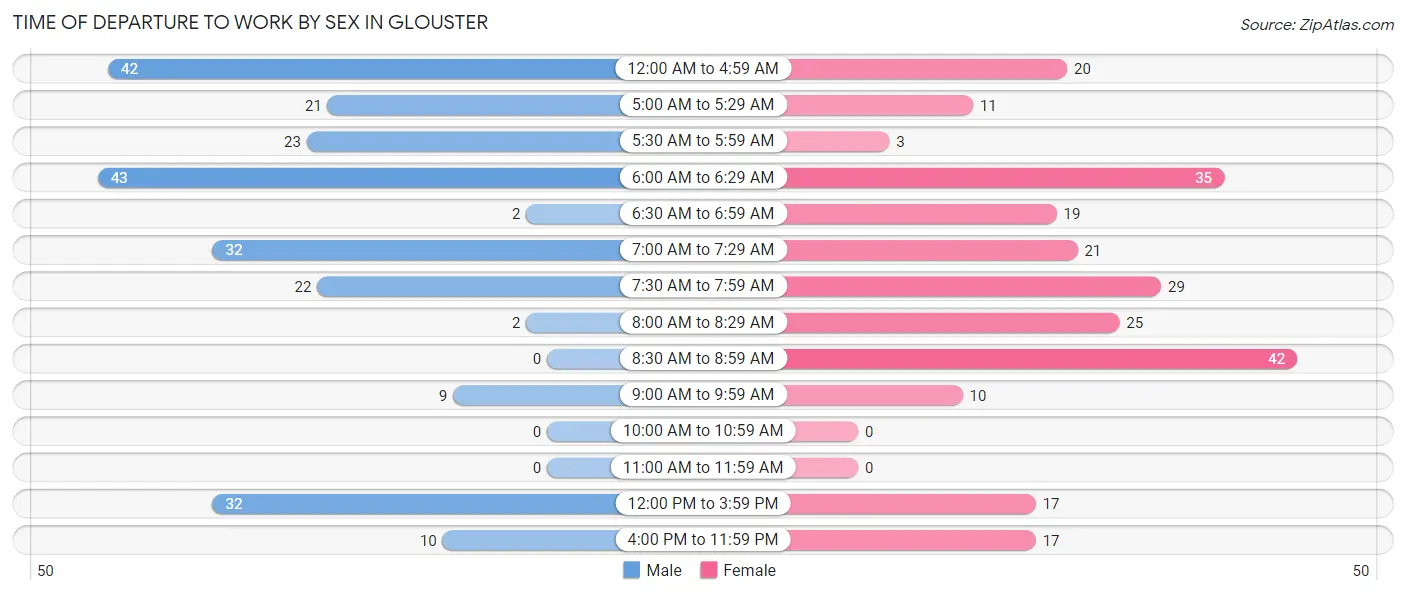
| Time of Departure | Male | Female |
| 12:00 AM to 4:59 AM | 42 (17.6%) | 20 (8.0%) |
| 5:00 AM to 5:29 AM | 21 (8.8%) | 11 (4.4%) |
| 5:30 AM to 5:59 AM | 23 (9.7%) | 3 (1.2%) |
| 6:00 AM to 6:29 AM | 43 (18.1%) | 35 (14.1%) |
| 6:30 AM to 6:59 AM | 2 (0.8%) | 19 (7.6%) |
| 7:00 AM to 7:29 AM | 32 (13.5%) | 21 (8.4%) |
| 7:30 AM to 7:59 AM | 22 (9.2%) | 29 (11.7%) |
| 8:00 AM to 8:29 AM | 2 (0.8%) | 25 (10.0%) |
| 8:30 AM to 8:59 AM | 0 (0.0%) | 42 (16.9%) |
| 9:00 AM to 9:59 AM | 9 (3.8%) | 10 (4.0%) |
| 10:00 AM to 10:59 AM | 0 (0.0%) | 0 (0.0%) |
| 11:00 AM to 11:59 AM | 0 (0.0%) | 0 (0.0%) |
| 12:00 PM to 3:59 PM | 32 (13.5%) | 17 (6.8%) |
| 4:00 PM to 11:59 PM | 10 (4.2%) | 17 (6.8%) |
| Total | 238 (100.0%) | 249 (100.0%) |
Housing Occupancy in Glouster
Occupancy by Ownership in Glouster
Of the total 628 dwellings in Glouster, owner-occupied units account for 420 (66.9%), while renter-occupied units make up 208 (33.1%).
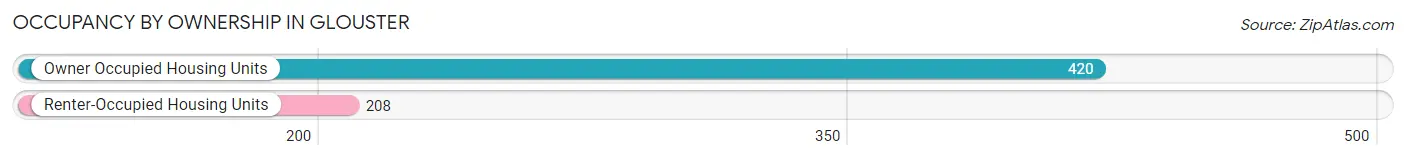
| Occupancy | # Housing Units | % Housing Units |
| Owner Occupied Housing Units | 420 | 66.9% |
| Renter-Occupied Housing Units | 208 | 33.1% |
| Total Occupied Housing Units | 628 | 100.0% |
Occupancy by Household Size in Glouster
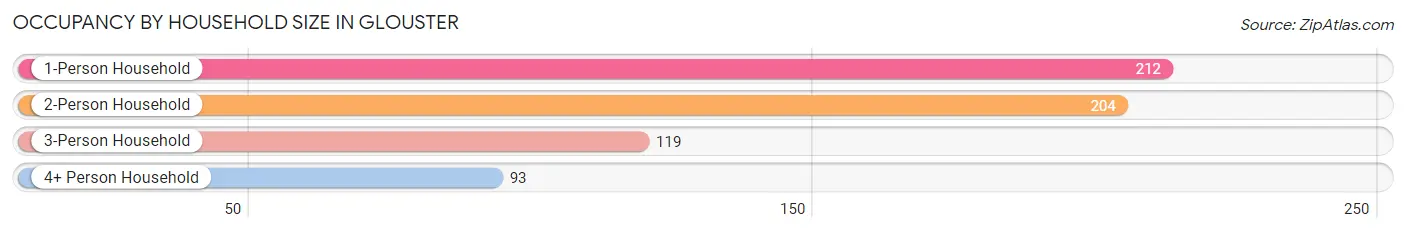
| Household Size | # Housing Units | % Housing Units |
| 1-Person Household | 212 | 33.8% |
| 2-Person Household | 204 | 32.5% |
| 3-Person Household | 119 | 19.0% |
| 4+ Person Household | 93 | 14.8% |
| Total Housing Units | 628 | 100.0% |
Occupancy by Ownership by Household Size in Glouster
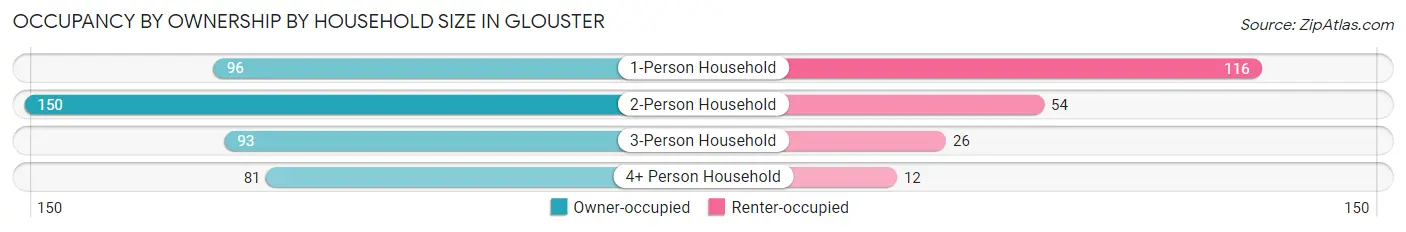
| Household Size | Owner-occupied | Renter-occupied |
| 1-Person Household | 96 (45.3%) | 116 (54.7%) |
| 2-Person Household | 150 (73.5%) | 54 (26.5%) |
| 3-Person Household | 93 (78.1%) | 26 (21.8%) |
| 4+ Person Household | 81 (87.1%) | 12 (12.9%) |
| Total Housing Units | 420 (66.9%) | 208 (33.1%) |
Occupancy by Educational Attainment in Glouster
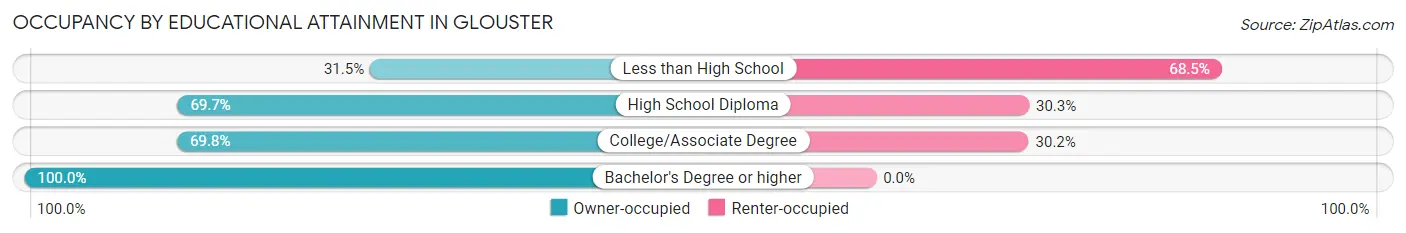
| Household Size | Owner-occupied | Renter-occupied |
| Less than High School | 29 (31.5%) | 63 (68.5%) |
| High School Diploma | 177 (69.7%) | 77 (30.3%) |
| College/Associate Degree | 157 (69.8%) | 68 (30.2%) |
| Bachelor's Degree or higher | 57 (100.0%) | 0 (0.0%) |
Occupancy by Age of Householder in Glouster
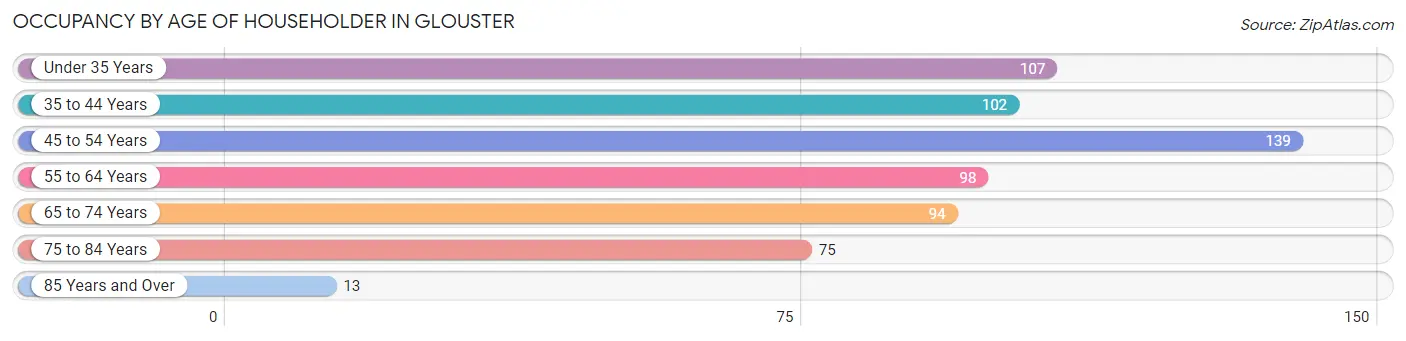
| Age Bracket | # Households | % Households |
| Under 35 Years | 107 | 17.0% |
| 35 to 44 Years | 102 | 16.2% |
| 45 to 54 Years | 139 | 22.1% |
| 55 to 64 Years | 98 | 15.6% |
| 65 to 74 Years | 94 | 15.0% |
| 75 to 84 Years | 75 | 11.9% |
| 85 Years and Over | 13 | 2.1% |
| Total | 628 | 100.0% |
Housing Finances in Glouster
Median Income by Occupancy in Glouster
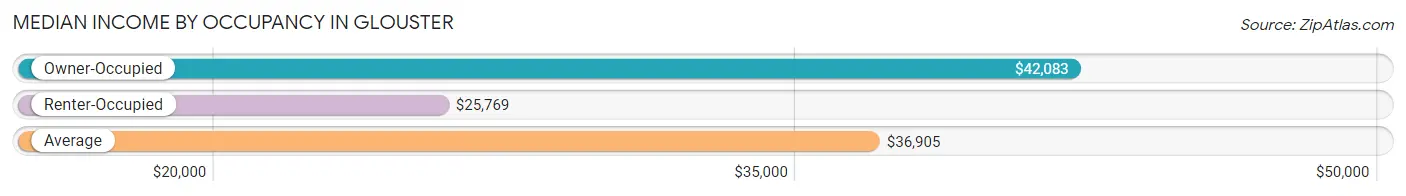
| Occupancy Type | # Households | Median Income |
| Owner-Occupied | 420 (66.9%) | $42,083 |
| Renter-Occupied | 208 (33.1%) | $25,769 |
| Average | 628 (100.0%) | $36,905 |
Occupancy by Householder Income Bracket in Glouster
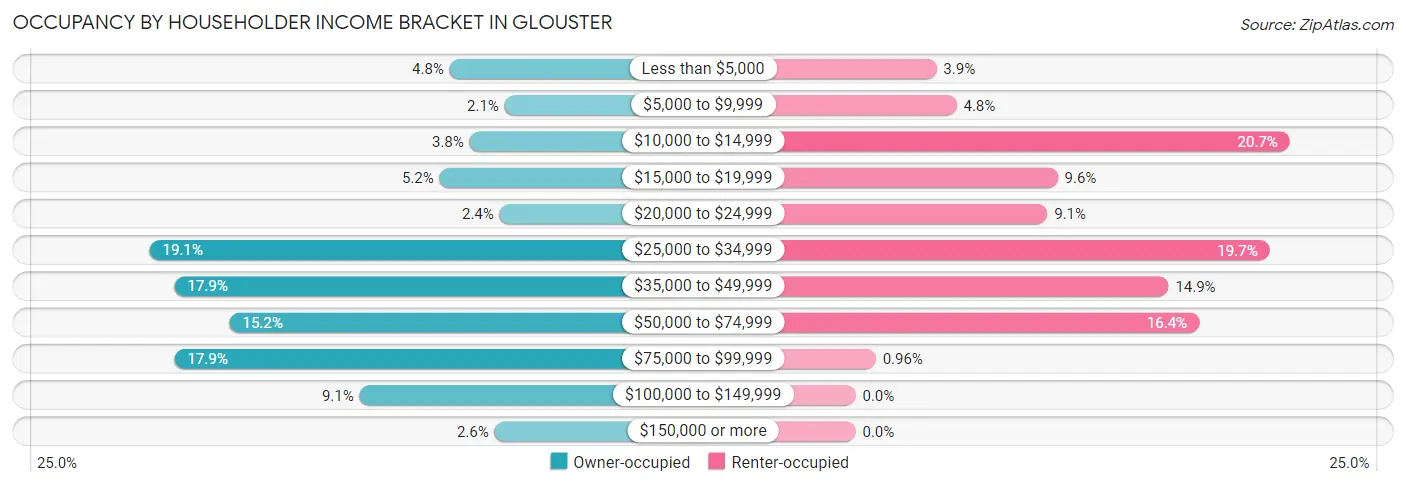
| Income Bracket | Owner-occupied | Renter-occupied |
| Less than $5,000 | 20 (4.8%) | 8 (3.8%) |
| $5,000 to $9,999 | 9 (2.1%) | 10 (4.8%) |
| $10,000 to $14,999 | 16 (3.8%) | 43 (20.7%) |
| $15,000 to $19,999 | 22 (5.2%) | 20 (9.6%) |
| $20,000 to $24,999 | 10 (2.4%) | 19 (9.1%) |
| $25,000 to $34,999 | 80 (19.1%) | 41 (19.7%) |
| $35,000 to $49,999 | 75 (17.9%) | 31 (14.9%) |
| $50,000 to $74,999 | 64 (15.2%) | 34 (16.4%) |
| $75,000 to $99,999 | 75 (17.9%) | 2 (1.0%) |
| $100,000 to $149,999 | 38 (9.0%) | 0 (0.0%) |
| $150,000 or more | 11 (2.6%) | 0 (0.0%) |
| Total | 420 (100.0%) | 208 (100.0%) |
Monthly Housing Cost Tiers in Glouster
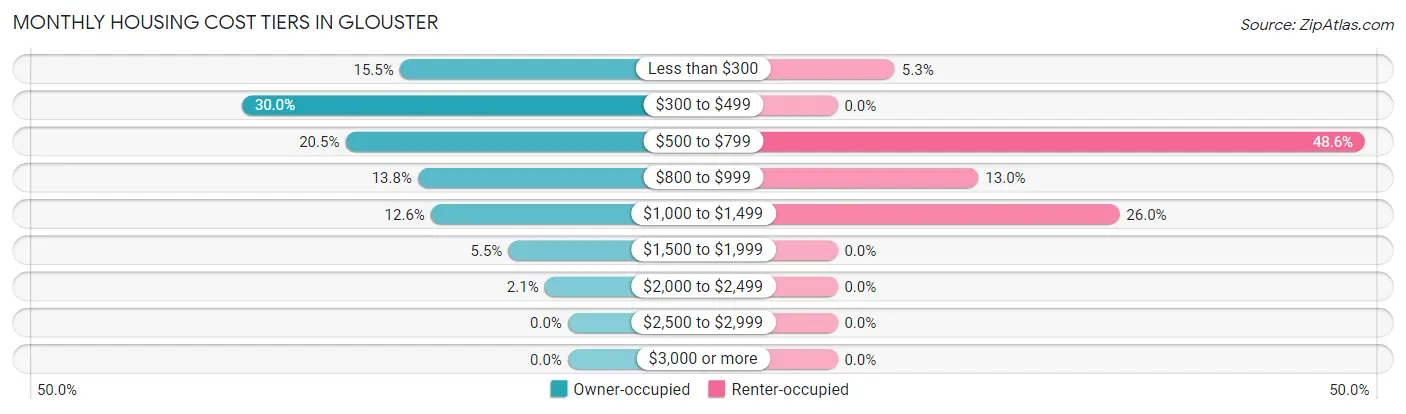
| Monthly Cost | Owner-occupied | Renter-occupied |
| Less than $300 | 65 (15.5%) | 11 (5.3%) |
| $300 to $499 | 126 (30.0%) | 0 (0.0%) |
| $500 to $799 | 86 (20.5%) | 101 (48.6%) |
| $800 to $999 | 58 (13.8%) | 27 (13.0%) |
| $1,000 to $1,499 | 53 (12.6%) | 54 (26.0%) |
| $1,500 to $1,999 | 23 (5.5%) | 0 (0.0%) |
| $2,000 to $2,499 | 9 (2.1%) | 0 (0.0%) |
| $2,500 to $2,999 | 0 (0.0%) | 0 (0.0%) |
| $3,000 or more | 0 (0.0%) | 0 (0.0%) |
| Total | 420 (100.0%) | 208 (100.0%) |
Physical Housing Characteristics in Glouster
Housing Structures in Glouster
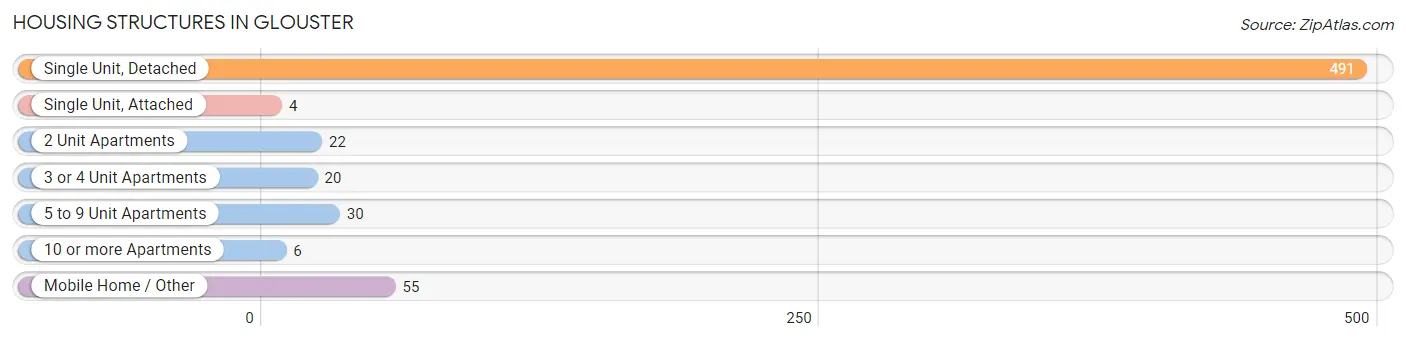
| Structure Type | # Housing Units | % Housing Units |
| Single Unit, Detached | 491 | 78.2% |
| Single Unit, Attached | 4 | 0.6% |
| 2 Unit Apartments | 22 | 3.5% |
| 3 or 4 Unit Apartments | 20 | 3.2% |
| 5 to 9 Unit Apartments | 30 | 4.8% |
| 10 or more Apartments | 6 | 1.0% |
| Mobile Home / Other | 55 | 8.8% |
| Total | 628 | 100.0% |
Housing Structures by Occupancy in Glouster
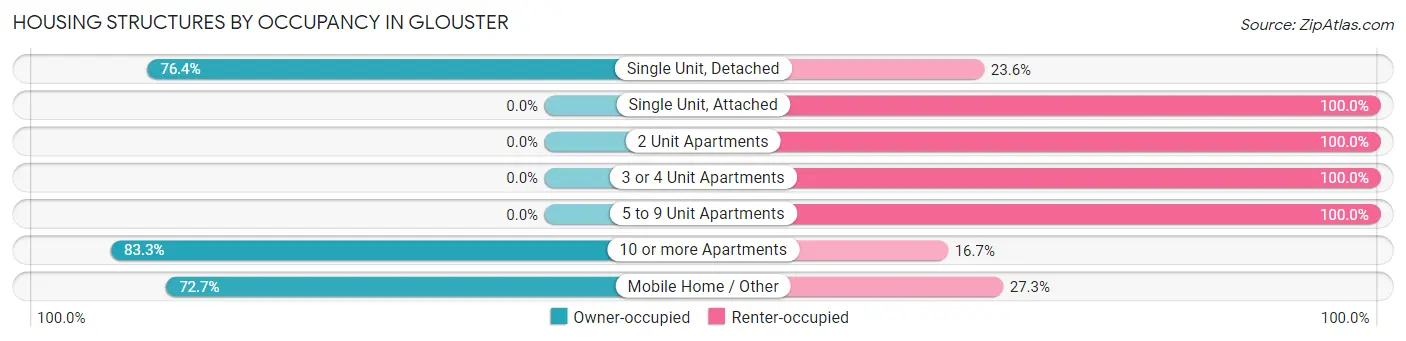
| Structure Type | Owner-occupied | Renter-occupied |
| Single Unit, Detached | 375 (76.4%) | 116 (23.6%) |
| Single Unit, Attached | 0 (0.0%) | 4 (100.0%) |
| 2 Unit Apartments | 0 (0.0%) | 22 (100.0%) |
| 3 or 4 Unit Apartments | 0 (0.0%) | 20 (100.0%) |
| 5 to 9 Unit Apartments | 0 (0.0%) | 30 (100.0%) |
| 10 or more Apartments | 5 (83.3%) | 1 (16.7%) |
| Mobile Home / Other | 40 (72.7%) | 15 (27.3%) |
| Total | 420 (66.9%) | 208 (33.1%) |
Housing Structures by Number of Rooms in Glouster
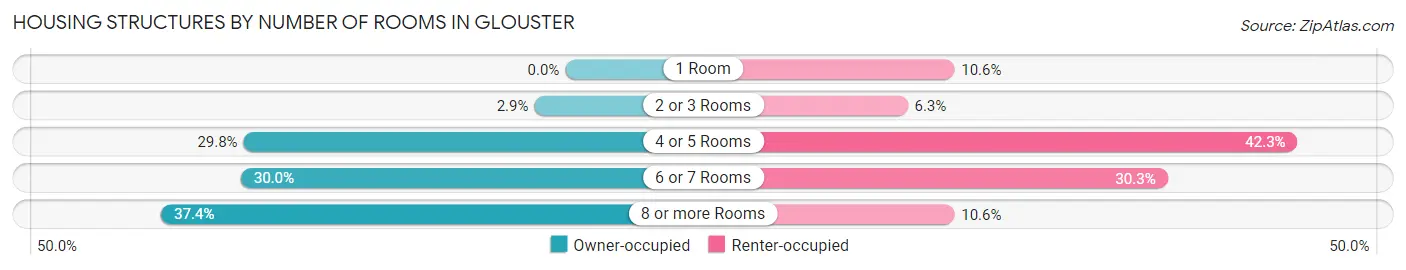
| Number of Rooms | Owner-occupied | Renter-occupied |
| 1 Room | 0 (0.0%) | 22 (10.6%) |
| 2 or 3 Rooms | 12 (2.9%) | 13 (6.2%) |
| 4 or 5 Rooms | 125 (29.8%) | 88 (42.3%) |
| 6 or 7 Rooms | 126 (30.0%) | 63 (30.3%) |
| 8 or more Rooms | 157 (37.4%) | 22 (10.6%) |
| Total | 420 (100.0%) | 208 (100.0%) |
Housing Structure by Heating Type in Glouster
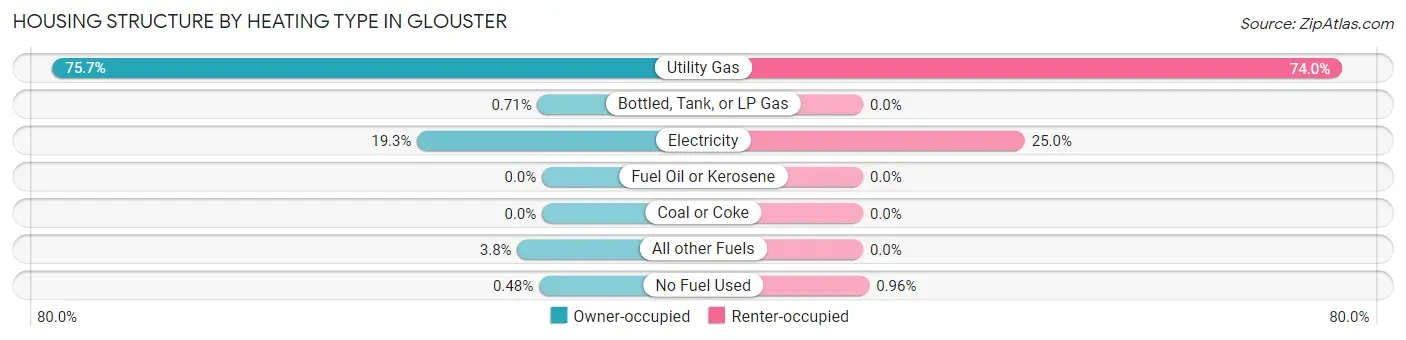
| Heating Type | Owner-occupied | Renter-occupied |
| Utility Gas | 318 (75.7%) | 154 (74.0%) |
| Bottled, Tank, or LP Gas | 3 (0.7%) | 0 (0.0%) |
| Electricity | 81 (19.3%) | 52 (25.0%) |
| Fuel Oil or Kerosene | 0 (0.0%) | 0 (0.0%) |
| Coal or Coke | 0 (0.0%) | 0 (0.0%) |
| All other Fuels | 16 (3.8%) | 0 (0.0%) |
| No Fuel Used | 2 (0.5%) | 2 (1.0%) |
| Total | 420 (100.0%) | 208 (100.0%) |
Household Vehicle Usage in Glouster
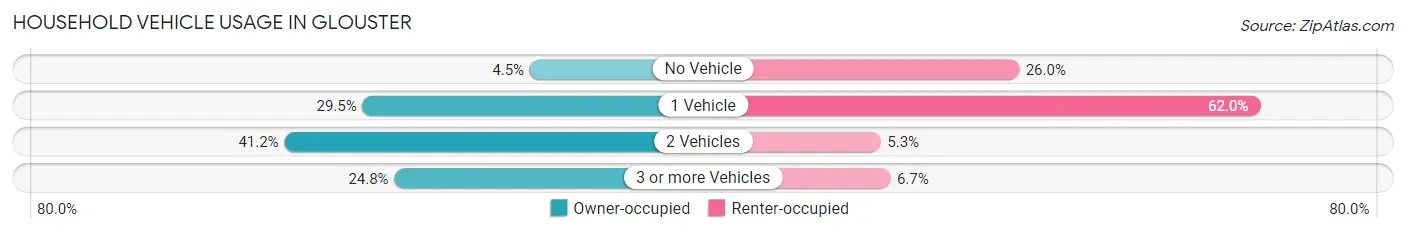
| Vehicles per Household | Owner-occupied | Renter-occupied |
| No Vehicle | 19 (4.5%) | 54 (26.0%) |
| 1 Vehicle | 124 (29.5%) | 129 (62.0%) |
| 2 Vehicles | 173 (41.2%) | 11 (5.3%) |
| 3 or more Vehicles | 104 (24.8%) | 14 (6.7%) |
| Total | 420 (100.0%) | 208 (100.0%) |
Real Estate & Mortgages in Glouster
Real Estate and Mortgage Overview in Glouster
| Characteristic | Without Mortgage | With Mortgage |
| Housing Units | 260 | 160 |
| Median Property Value | $56,800 | $87,200 |
| Median Household Income | $36,923 | $0 |
| Monthly Housing Costs | $412 | $0 |
| Real Estate Taxes | $906 | $5 |
Property Value by Mortgage Status in Glouster
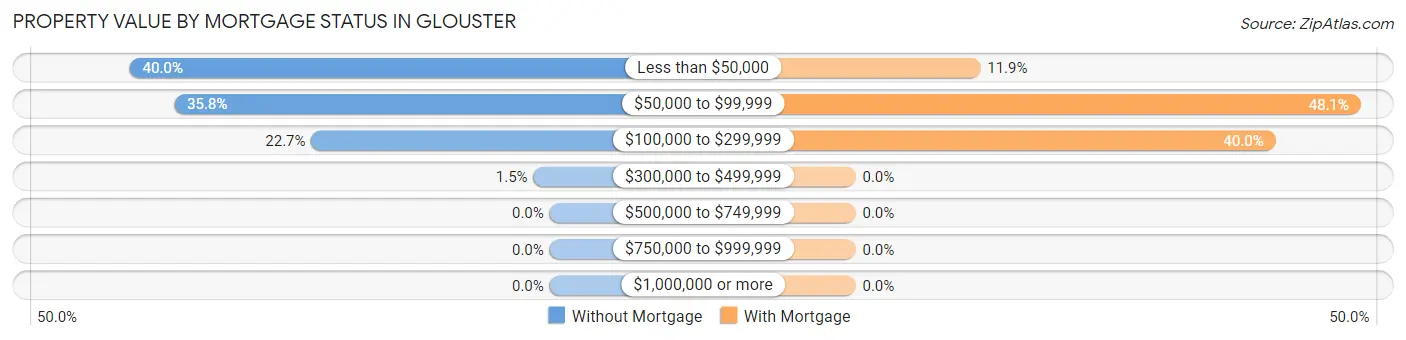
| Property Value | Without Mortgage | With Mortgage |
| Less than $50,000 | 104 (40.0%) | 19 (11.9%) |
| $50,000 to $99,999 | 93 (35.8%) | 77 (48.1%) |
| $100,000 to $299,999 | 59 (22.7%) | 64 (40.0%) |
| $300,000 to $499,999 | 4 (1.5%) | 0 (0.0%) |
| $500,000 to $749,999 | 0 (0.0%) | 0 (0.0%) |
| $750,000 to $999,999 | 0 (0.0%) | 0 (0.0%) |
| $1,000,000 or more | 0 (0.0%) | 0 (0.0%) |
| Total | 260 (100.0%) | 160 (100.0%) |
Household Income by Mortgage Status in Glouster
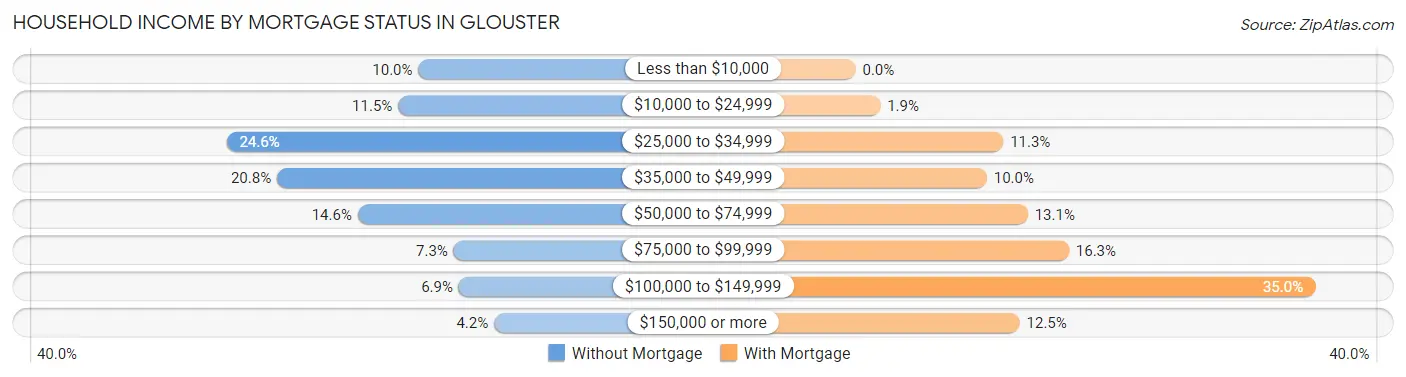
| Household Income | Without Mortgage | With Mortgage |
| Less than $10,000 | 26 (10.0%) | 0 (0.0%) |
| $10,000 to $24,999 | 30 (11.5%) | 3 (1.9%) |
| $25,000 to $34,999 | 64 (24.6%) | 18 (11.3%) |
| $35,000 to $49,999 | 54 (20.8%) | 16 (10.0%) |
| $50,000 to $74,999 | 38 (14.6%) | 21 (13.1%) |
| $75,000 to $99,999 | 19 (7.3%) | 26 (16.3%) |
| $100,000 to $149,999 | 18 (6.9%) | 56 (35.0%) |
| $150,000 or more | 11 (4.2%) | 20 (12.5%) |
| Total | 260 (100.0%) | 160 (100.0%) |
Property Value to Household Income Ratio in Glouster
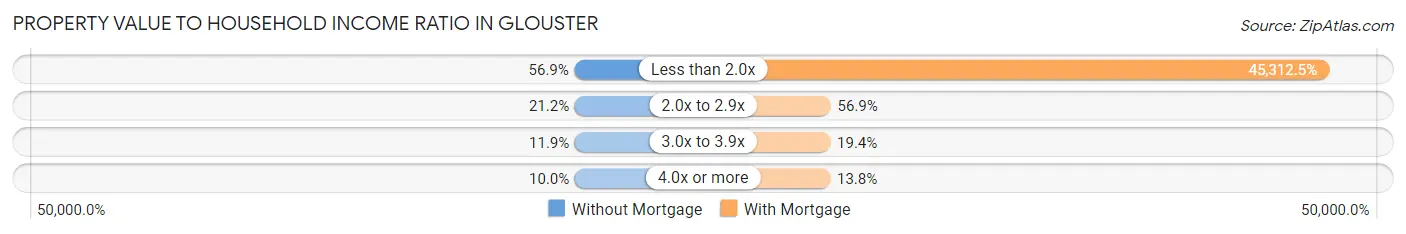
| Value-to-Income Ratio | Without Mortgage | With Mortgage |
| Less than 2.0x | 148 (56.9%) | 72,500 (45,312.5%) |
| 2.0x to 2.9x | 55 (21.1%) | 91 (56.9%) |
| 3.0x to 3.9x | 31 (11.9%) | 31 (19.4%) |
| 4.0x or more | 26 (10.0%) | 22 (13.8%) |
| Total | 260 (100.0%) | 160 (100.0%) |
Real Estate Taxes by Mortgage Status in Glouster
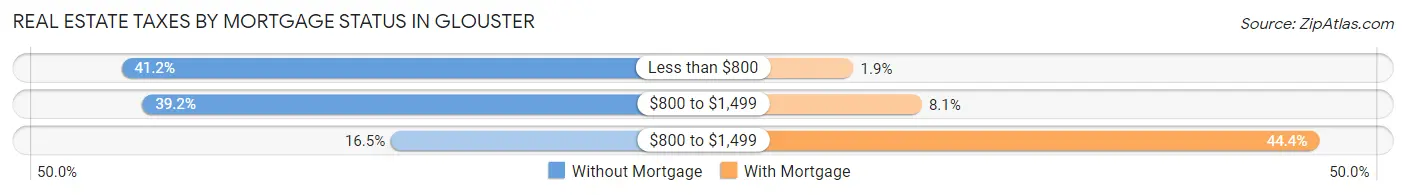
| Property Taxes | Without Mortgage | With Mortgage |
| Less than $800 | 107 (41.1%) | 3 (1.9%) |
| $800 to $1,499 | 102 (39.2%) | 13 (8.1%) |
| $800 to $1,499 | 43 (16.5%) | 71 (44.4%) |
| Total | 260 (100.0%) | 160 (100.0%) |
Health & Disability in Glouster
Health Insurance Coverage by Age in Glouster
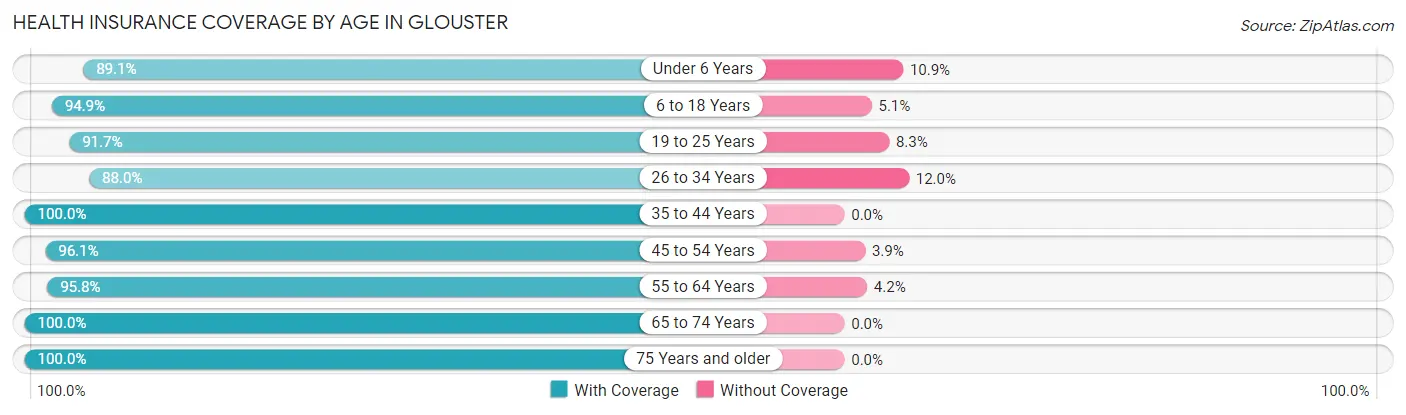
| Age Bracket | With Coverage | Without Coverage |
| Under 6 Years | 114 (89.1%) | 14 (10.9%) |
| 6 to 18 Years | 299 (94.9%) | 16 (5.1%) |
| 19 to 25 Years | 77 (91.7%) | 7 (8.3%) |
| 26 to 34 Years | 139 (88.0%) | 19 (12.0%) |
| 35 to 44 Years | 217 (100.0%) | 0 (0.0%) |
| 45 to 54 Years | 224 (96.1%) | 9 (3.9%) |
| 55 to 64 Years | 159 (95.8%) | 7 (4.2%) |
| 65 to 74 Years | 144 (100.0%) | 0 (0.0%) |
| 75 Years and older | 114 (100.0%) | 0 (0.0%) |
| Total | 1,487 (95.4%) | 72 (4.6%) |
Health Insurance Coverage by Citizenship Status in Glouster
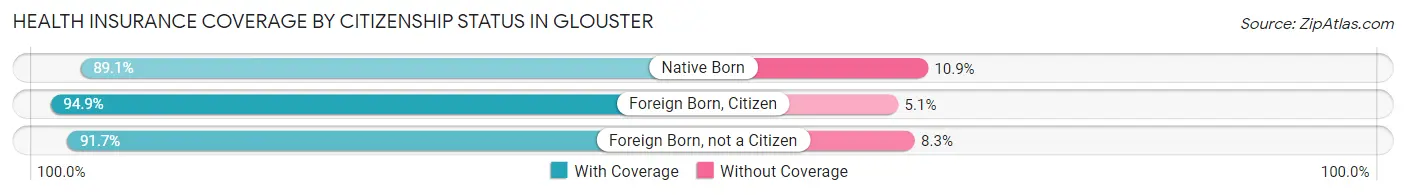
| Citizenship Status | With Coverage | Without Coverage |
| Native Born | 114 (89.1%) | 14 (10.9%) |
| Foreign Born, Citizen | 299 (94.9%) | 16 (5.1%) |
| Foreign Born, not a Citizen | 77 (91.7%) | 7 (8.3%) |
Health Insurance Coverage by Household Income in Glouster
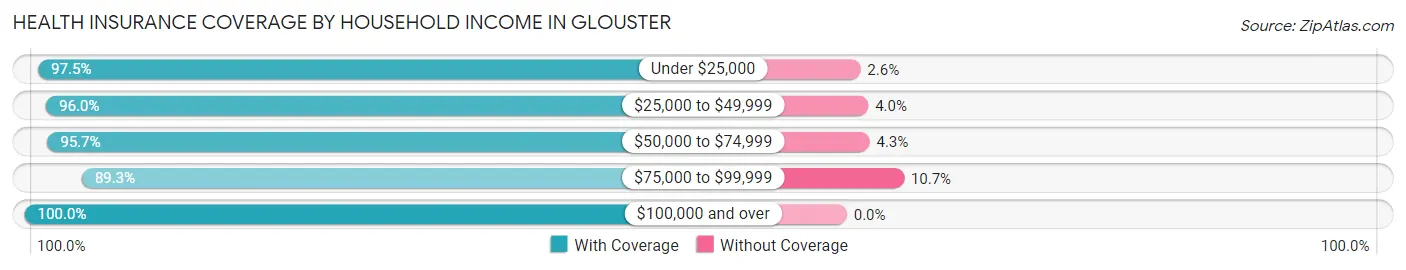
| Household Income | With Coverage | Without Coverage |
| Under $25,000 | 267 (97.5%) | 7 (2.5%) |
| $25,000 to $49,999 | 573 (96.0%) | 24 (4.0%) |
| $50,000 to $74,999 | 247 (95.7%) | 11 (4.3%) |
| $75,000 to $99,999 | 250 (89.3%) | 30 (10.7%) |
| $100,000 and over | 150 (100.0%) | 0 (0.0%) |
Public vs Private Health Insurance Coverage by Age in Glouster
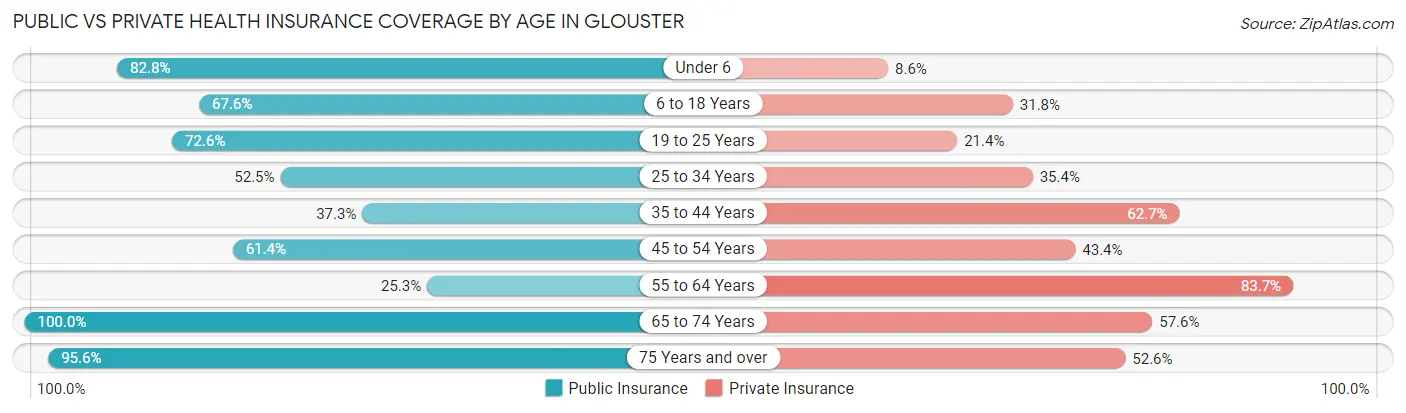
| Age Bracket | Public Insurance | Private Insurance |
| Under 6 | 106 (82.8%) | 11 (8.6%) |
| 6 to 18 Years | 213 (67.6%) | 100 (31.8%) |
| 19 to 25 Years | 61 (72.6%) | 18 (21.4%) |
| 25 to 34 Years | 83 (52.5%) | 56 (35.4%) |
| 35 to 44 Years | 81 (37.3%) | 136 (62.7%) |
| 45 to 54 Years | 143 (61.4%) | 101 (43.3%) |
| 55 to 64 Years | 42 (25.3%) | 139 (83.7%) |
| 65 to 74 Years | 144 (100.0%) | 83 (57.6%) |
| 75 Years and over | 109 (95.6%) | 60 (52.6%) |
| Total | 982 (63.0%) | 704 (45.2%) |
Disability Status by Sex by Age in Glouster
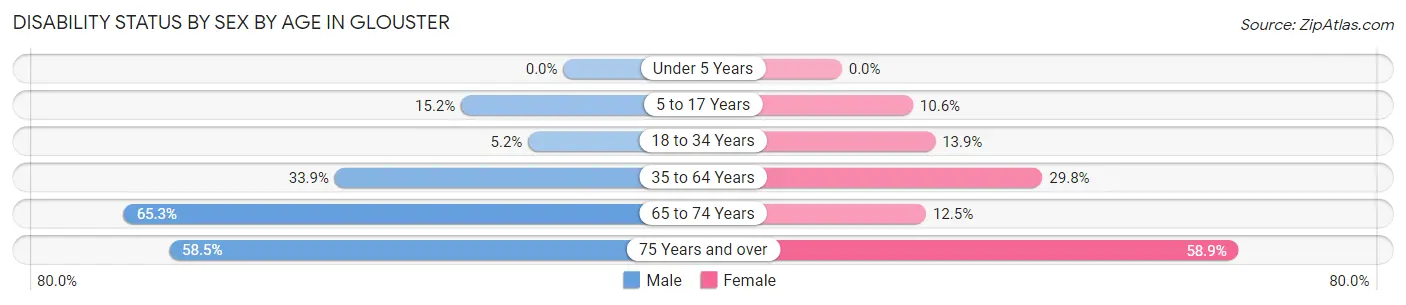
| Age Bracket | Male | Female |
| Under 5 Years | 0 (0.0%) | 0 (0.0%) |
| 5 to 17 Years | 29 (15.2%) | 15 (10.6%) |
| 18 to 34 Years | 6 (5.2%) | 19 (13.9%) |
| 35 to 64 Years | 94 (33.9%) | 101 (29.8%) |
| 65 to 74 Years | 47 (65.3%) | 9 (12.5%) |
| 75 Years and over | 24 (58.5%) | 43 (58.9%) |
Disability Class by Sex by Age in Glouster
Disability Class: Hearing Difficulty
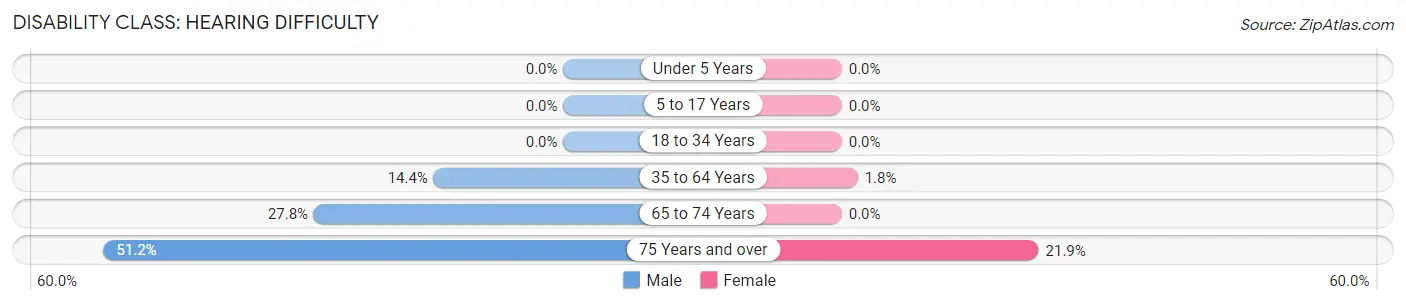
| Age Bracket | Male | Female |
| Under 5 Years | 0 (0.0%) | 0 (0.0%) |
| 5 to 17 Years | 0 (0.0%) | 0 (0.0%) |
| 18 to 34 Years | 0 (0.0%) | 0 (0.0%) |
| 35 to 64 Years | 40 (14.4%) | 6 (1.8%) |
| 65 to 74 Years | 20 (27.8%) | 0 (0.0%) |
| 75 Years and over | 21 (51.2%) | 16 (21.9%) |
Disability Class: Vision Difficulty
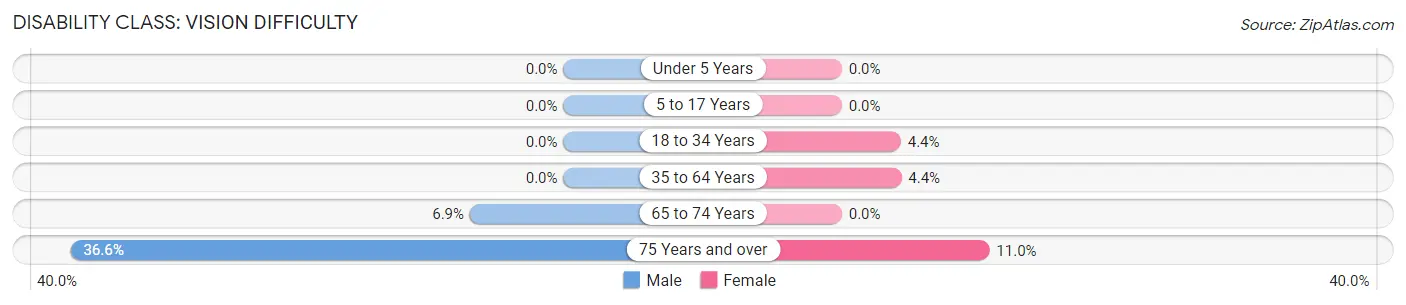
| Age Bracket | Male | Female |
| Under 5 Years | 0 (0.0%) | 0 (0.0%) |
| 5 to 17 Years | 0 (0.0%) | 0 (0.0%) |
| 18 to 34 Years | 0 (0.0%) | 6 (4.4%) |
| 35 to 64 Years | 0 (0.0%) | 15 (4.4%) |
| 65 to 74 Years | 5 (6.9%) | 0 (0.0%) |
| 75 Years and over | 15 (36.6%) | 8 (11.0%) |
Disability Class: Cognitive Difficulty
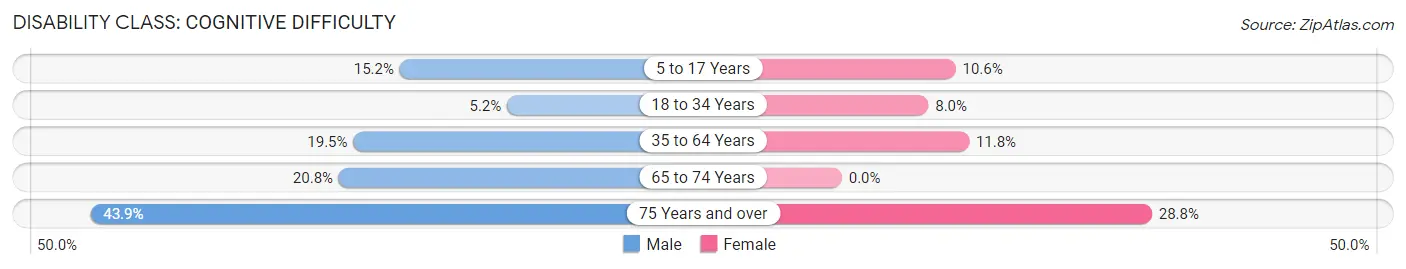
| Age Bracket | Male | Female |
| 5 to 17 Years | 29 (15.2%) | 15 (10.6%) |
| 18 to 34 Years | 6 (5.2%) | 11 (8.0%) |
| 35 to 64 Years | 54 (19.5%) | 40 (11.8%) |
| 65 to 74 Years | 15 (20.8%) | 0 (0.0%) |
| 75 Years and over | 18 (43.9%) | 21 (28.8%) |
Disability Class: Ambulatory Difficulty
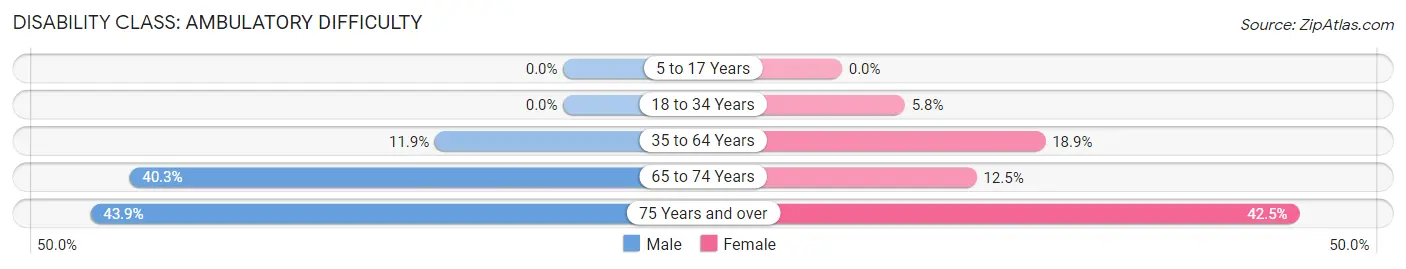
| Age Bracket | Male | Female |
| 5 to 17 Years | 0 (0.0%) | 0 (0.0%) |
| 18 to 34 Years | 0 (0.0%) | 8 (5.8%) |
| 35 to 64 Years | 33 (11.9%) | 64 (18.9%) |
| 65 to 74 Years | 29 (40.3%) | 9 (12.5%) |
| 75 Years and over | 18 (43.9%) | 31 (42.5%) |
Disability Class: Self-Care Difficulty
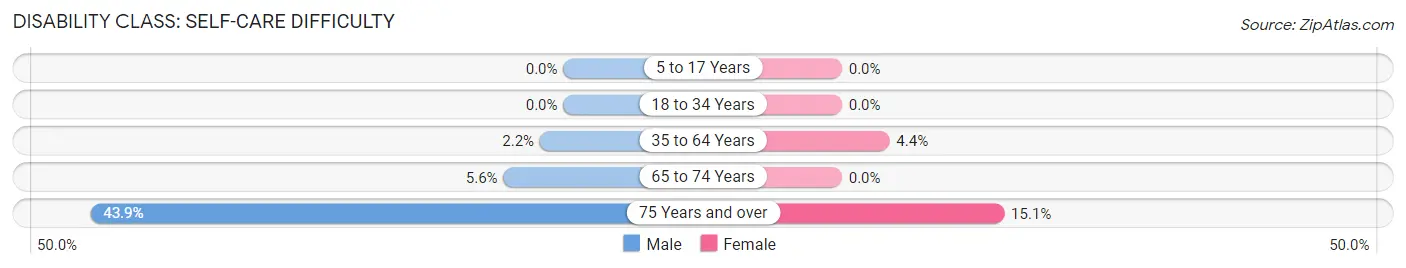
| Age Bracket | Male | Female |
| 5 to 17 Years | 0 (0.0%) | 0 (0.0%) |
| 18 to 34 Years | 0 (0.0%) | 0 (0.0%) |
| 35 to 64 Years | 6 (2.2%) | 15 (4.4%) |
| 65 to 74 Years | 4 (5.6%) | 0 (0.0%) |
| 75 Years and over | 18 (43.9%) | 11 (15.1%) |
Technology Access in Glouster
Computing Device Access in Glouster
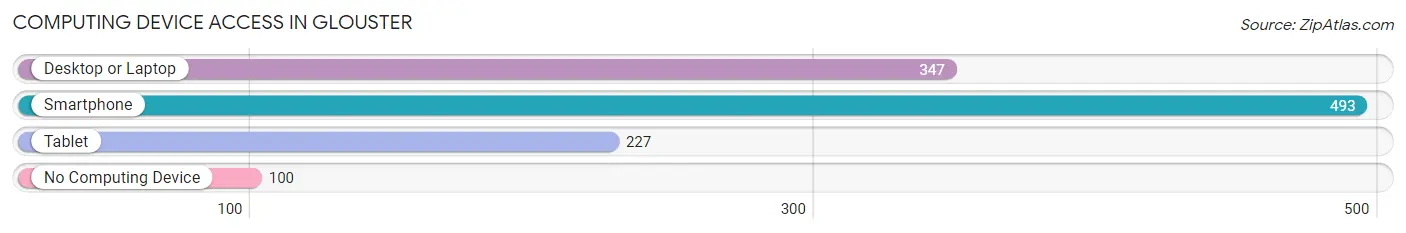
| Device Type | # Households | % Households |
| Desktop or Laptop | 347 | 55.2% |
| Smartphone | 493 | 78.5% |
| Tablet | 227 | 36.1% |
| No Computing Device | 100 | 15.9% |
| Total | 628 | 100.0% |
Internet Access in Glouster
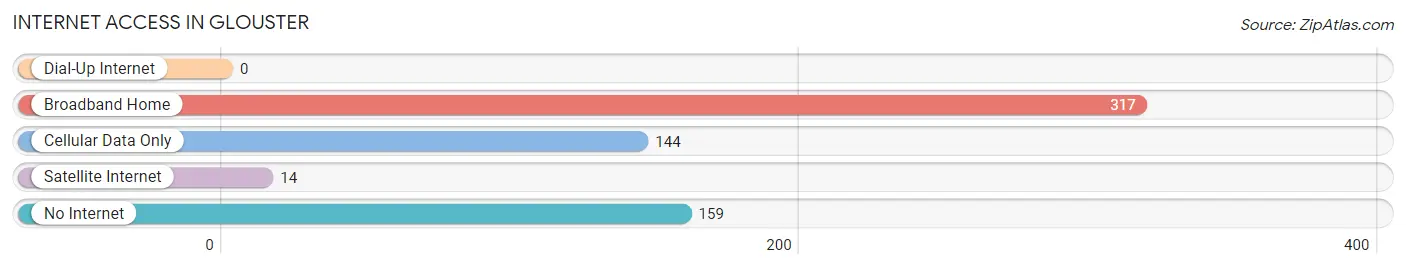
| Internet Type | # Households | % Households |
| Dial-Up Internet | 0 | 0.0% |
| Broadband Home | 317 | 50.5% |
| Cellular Data Only | 144 | 22.9% |
| Satellite Internet | 14 | 2.2% |
| No Internet | 159 | 25.3% |
| Total | 628 | 100.0% |
Glouster Summary
Glouster is a small village located in Athens County, Ohio. It is situated in the Appalachian foothills of southeastern Ohio, approximately 50 miles southeast of Columbus. The village has a population of approximately 1,800 people and is the county seat of Athens County.
Geography
Glouster is located in the Appalachian foothills of southeastern Ohio, approximately 50 miles southeast of Columbus. The village is situated in a valley between two hills, with the Hocking River running through the center of the village. The village is surrounded by rolling hills and farmland, with the Appalachian Mountains visible in the distance. The village is located in a temperate climate, with hot summers and cold winters.
History
Glouster was founded in 1805 by a group of settlers from Pennsylvania. The village was named after the Gloucester Township in Pennsylvania, where many of the settlers had come from. The village was originally a farming community, with the main crops being corn, wheat, and oats. In 1815, the village was incorporated and the first post office was established.
In the late 19th century, the village began to grow and develop. The railroad was extended to the village in 1881, and the first bank was established in 1883. The village also became a center for the coal mining industry, with several mines opening in the area.
Economy
The economy of Glouster is largely based on agriculture and coal mining. The village is home to several farms, which produce corn, wheat, oats, and other crops. The coal mining industry is also a major employer in the village, with several mines located in the area.
In addition to agriculture and coal mining, the village also has several small businesses, including restaurants, shops, and other services. The village also has a small tourism industry, with several attractions in the area, including the Hocking River, the Appalachian Mountains, and the nearby Wayne National Forest.
Demographics
As of the 2010 census, the population of Glouster was 1,817. The racial makeup of the village was 97.3% White, 0.7% African American, 0.2% Native American, 0.2% Asian, 0.1% Pacific Islander, 0.3% from other races, and 1.3% from two or more races. Hispanic or Latino of any race were 1.2% of the population.
The median household income in Glouster was $37,917, and the median family income was $45,938. The per capita income for the village was $17,945. About 11.3% of families and 14.2% of the population were below the poverty line, including 18.2% of those under age 18 and 8.2% of those age 65 or over.
Conclusion
Glouster is a small village located in Athens County, Ohio. It is situated in the Appalachian foothills of southeastern Ohio, approximately 50 miles southeast of Columbus. The village has a population of approximately 1,800 people and is the county seat of Athens County. The economy of Glouster is largely based on agriculture and coal mining, with several farms and mines located in the area. The village also has several small businesses, including restaurants, shops, and other services. The racial makeup of the village is predominantly White, with a small percentage of African American, Native American, Asian, and Pacific Islander residents. The median household income in Glouster is $37,917, and the median family income is $45,938.
Common Questions
What is the Total Population of Glouster?
Total Population of Glouster is 1,559.
What is the Total Male Population of Glouster?
Total Male Population of Glouster is 745.
What is the Total Female Population of Glouster?
Total Female Population of Glouster is 814.
What is the Ratio of Males per 100 Females in Glouster?
There are 91.52 Males per 100 Females in Glouster.
What is the Ratio of Females per 100 Males in Glouster?
There are 109.26 Females per 100 Males in Glouster.
What is the Median Population Age in Glouster?
Median Population Age in Glouster is 40.0 Years.
What is the Average Family Size in Glouster
Average Family Size in Glouster is 3.2 People.
What is the Average Household Size in Glouster
Average Household Size in Glouster is 2.5 People.
What is Per Capita Income in Glouster?
Per Capita income in Glouster is $20,018.
What is the Median Family Income in Glouster?
Median Family Income in Glouster is $43,214.
What is the Median Household income in Glouster?
Median Household Income in Glouster is $36,905.
What is Income or Wage Gap in Glouster?
Income or Wage Gap in Glouster is 19.9%.
Women in Glouster earn 80.1 cents for every dollar earned by a man.
What is Inequality or Gini Index in Glouster?
Inequality or Gini Index in Glouster is 0.40.
How Large is the Labor Force in Glouster?
There are 565 People in the Labor Forcein in Glouster.
What is the Percentage of People in the Labor Force in Glouster?
47.6% of People are in the Labor Force in Glouster.
What is the Unemployment Rate in Glouster?
Unemployment Rate in Glouster is 4.6%.