Mayfield, OH
Mayfield Map
Mayfield Overview
3,344
TOTAL POPULATION
1,586
MALE POPULATION
1,758
FEMALE POPULATION
90.22
MALES / 100 FEMALES
110.84
FEMALES / 100 MALES
48.7
MEDIAN AGE
2.9
AVG FAMILY SIZE
2.4
AVG HOUSEHOLD SIZE
$55,271
PER CAPITA INCOME
$141,314
AVG FAMILY INCOME
$104,940
AVG HOUSEHOLD INCOME
26.2%
WAGE / INCOME GAP [ % ]
73.8¢/ $1
WAGE / INCOME GAP [ $ ]
0.40
INEQUALITY / GINI INDEX
1,965
LABOR FORCE [ PEOPLE ]
68.8%
PERCENT IN LABOR FORCE
8.2%
UNEMPLOYMENT RATE
Mayfield Area Codes
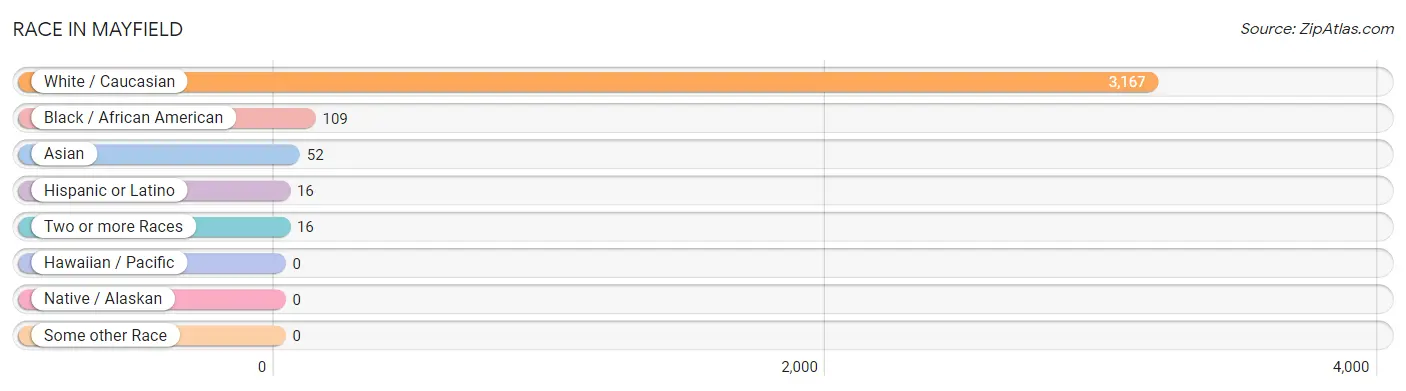
Race in Mayfield
The most populous races in Mayfield are White / Caucasian (3,167 | 94.7%), Black / African American (109 | 3.3%), and Asian (52 | 1.6%).
| Race | # Population | % Population |
| Asian | 52 | 1.6% |
| Black / African American | 109 | 3.3% |
| Hawaiian / Pacific | 0 | 0.0% |
| Hispanic or Latino | 16 | 0.5% |
| Native / Alaskan | 0 | 0.0% |
| White / Caucasian | 3,167 | 94.7% |
| Two or more Races | 16 | 0.5% |
| Some other Race | 0 | 0.0% |
| Total | 3,344 | 100.0% |
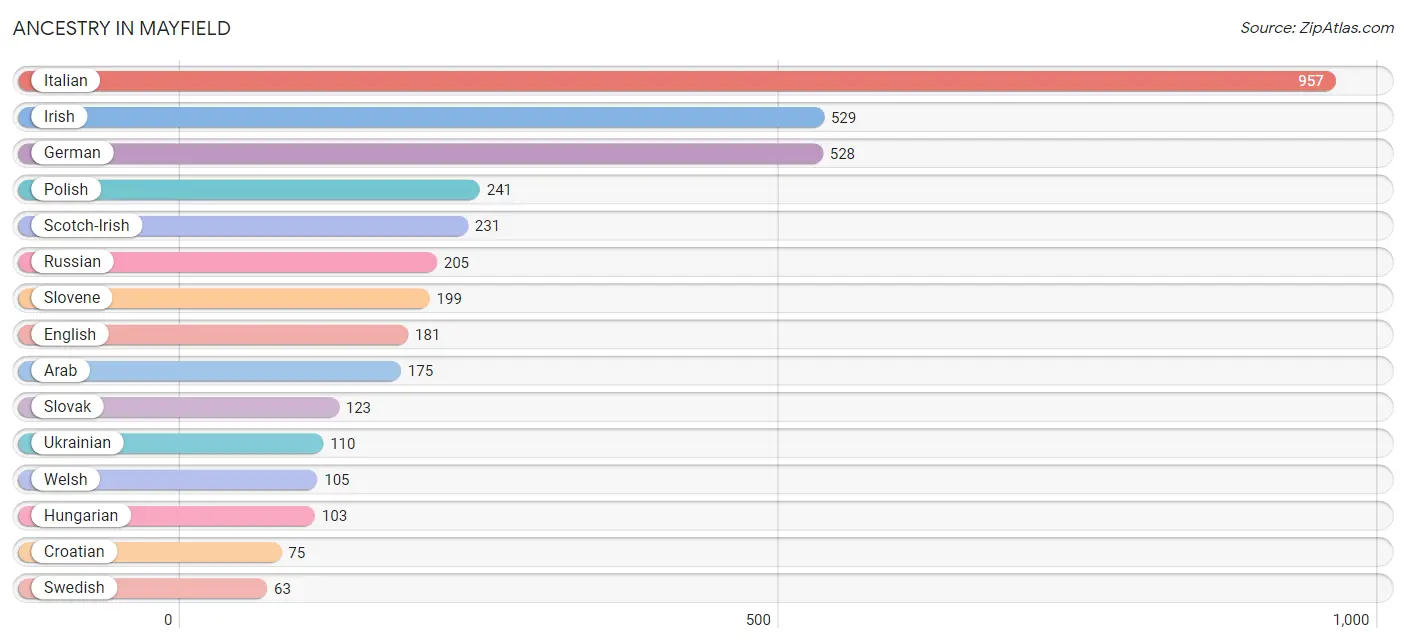
Ancestry in Mayfield
The most populous ancestries reported in Mayfield are Italian (957 | 28.6%), Irish (529 | 15.8%), German (528 | 15.8%), Polish (241 | 7.2%), and Scotch-Irish (231 | 6.9%), together accounting for 74.4% of all Mayfield residents.
| Ancestry | # Population | % Population |
| African | 12 | 0.4% |
| American | 36 | 1.1% |
| Arab | 175 | 5.2% |
| Armenian | 8 | 0.2% |
| Austrian | 51 | 1.5% |
| Burmese | 19 | 0.6% |
| Cherokee | 13 | 0.4% |
| Croatian | 75 | 2.2% |
| Czech | 49 | 1.5% |
| Czechoslovakian | 14 | 0.4% |
| Danish | 11 | 0.3% |
| Eastern European | 8 | 0.2% |
| English | 181 | 5.4% |
| European | 19 | 0.6% |
| Finnish | 7 | 0.2% |
| French | 30 | 0.9% |
| German | 528 | 15.8% |
| Greek | 23 | 0.7% |
| Hungarian | 103 | 3.1% |
| Irish | 529 | 15.8% |
| Italian | 957 | 28.6% |
| Korean | 23 | 0.7% |
| Lebanese | 18 | 0.5% |
| Lithuanian | 41 | 1.2% |
| Mexican | 6 | 0.2% |
| Polish | 241 | 7.2% |
| Puerto Rican | 10 | 0.3% |
| Romanian | 24 | 0.7% |
| Russian | 205 | 6.1% |
| Scotch-Irish | 231 | 6.9% |
| Scottish | 39 | 1.2% |
| Slovak | 123 | 3.7% |
| Slovene | 199 | 5.9% |
| Subsaharan African | 12 | 0.4% |
| Swedish | 63 | 1.9% |
| Swiss | 11 | 0.3% |
| Thai | 10 | 0.3% |
| Ukrainian | 110 | 3.3% |
| Welsh | 105 | 3.1% | View All 39 Rows |
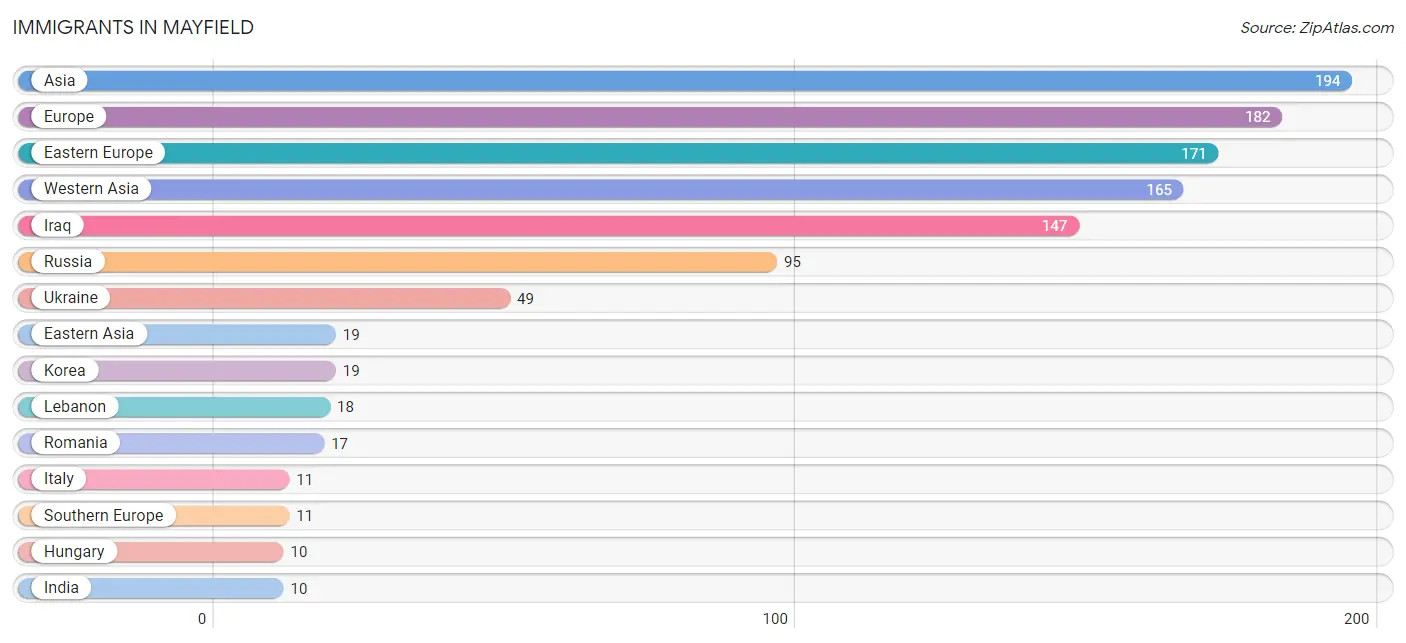
Immigrants in Mayfield
The most numerous immigrant groups reported in Mayfield came from Asia (194 | 5.8%), Europe (182 | 5.4%), Eastern Europe (171 | 5.1%), Western Asia (165 | 4.9%), and Iraq (147 | 4.4%), together accounting for 25.7% of all Mayfield residents.
| Immigration Origin | # Population | % Population |
| Asia | 194 | 5.8% |
| Eastern Asia | 19 | 0.6% |
| Eastern Europe | 171 | 5.1% |
| Europe | 182 | 5.4% |
| Hungary | 10 | 0.3% |
| India | 10 | 0.3% |
| Iraq | 147 | 4.4% |
| Italy | 11 | 0.3% |
| Korea | 19 | 0.6% |
| Lebanon | 18 | 0.5% |
| Romania | 17 | 0.5% |
| Russia | 95 | 2.8% |
| South Central Asia | 10 | 0.3% |
| Southern Europe | 11 | 0.3% |
| Ukraine | 49 | 1.5% |
| Western Asia | 165 | 4.9% | View All 16 Rows |
Sex and Age in Mayfield
Sex and Age in Mayfield
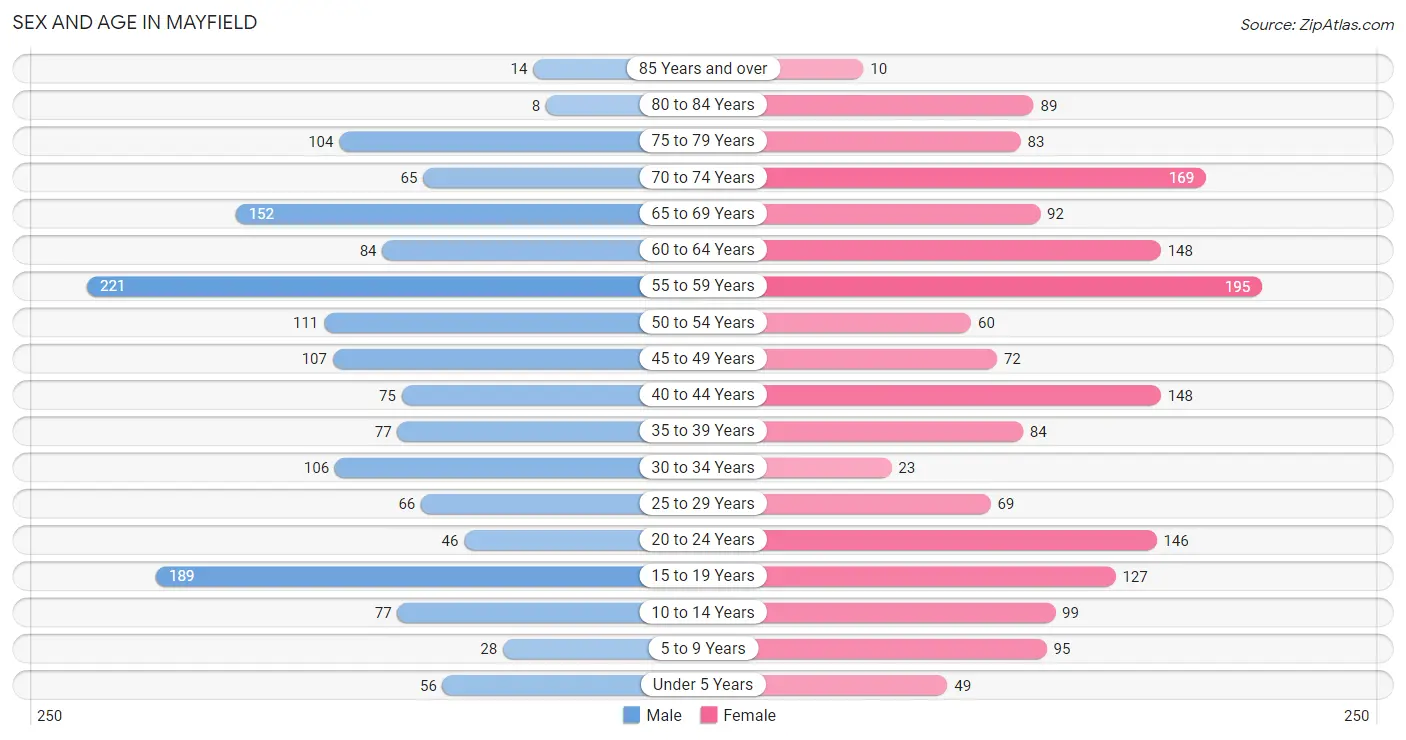
The most populous age groups in Mayfield are 55 to 59 Years (221 | 13.9%) for men and 55 to 59 Years (195 | 11.1%) for women.
| Age Bracket | Male | Female |
| Under 5 Years | 56 (3.5%) | 49 (2.8%) |
| 5 to 9 Years | 28 (1.8%) | 95 (5.4%) |
| 10 to 14 Years | 77 (4.9%) | 99 (5.6%) |
| 15 to 19 Years | 189 (11.9%) | 127 (7.2%) |
| 20 to 24 Years | 46 (2.9%) | 146 (8.3%) |
| 25 to 29 Years | 66 (4.2%) | 69 (3.9%) |
| 30 to 34 Years | 106 (6.7%) | 23 (1.3%) |
| 35 to 39 Years | 77 (4.9%) | 84 (4.8%) |
| 40 to 44 Years | 75 (4.7%) | 148 (8.4%) |
| 45 to 49 Years | 107 (6.8%) | 72 (4.1%) |
| 50 to 54 Years | 111 (7.0%) | 60 (3.4%) |
| 55 to 59 Years | 221 (13.9%) | 195 (11.1%) |
| 60 to 64 Years | 84 (5.3%) | 148 (8.4%) |
| 65 to 69 Years | 152 (9.6%) | 92 (5.2%) |
| 70 to 74 Years | 65 (4.1%) | 169 (9.6%) |
| 75 to 79 Years | 104 (6.6%) | 83 (4.7%) |
| 80 to 84 Years | 8 (0.5%) | 89 (5.1%) |
| 85 Years and over | 14 (0.9%) | 10 (0.6%) |
| Total | 1,586 (100.0%) | 1,758 (100.0%) |
Families and Households in Mayfield
Median Family Size in Mayfield
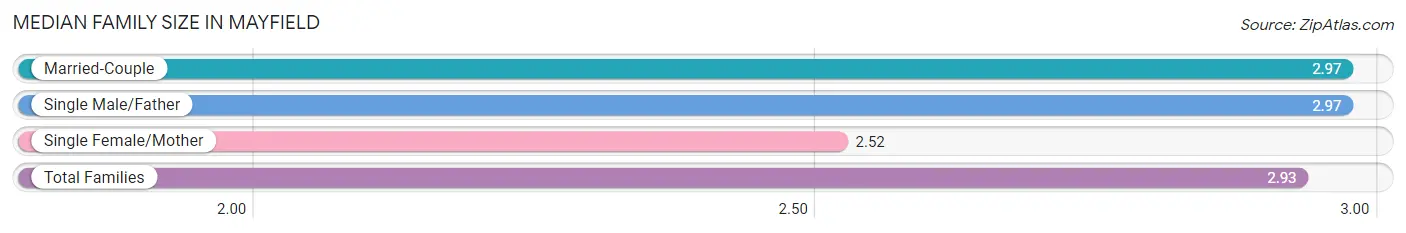
The median family size in Mayfield is 2.93 persons per family, with married-couple families (797 | 84.5%) accounting for the largest median family size of 2.97 persons per family. On the other hand, single female/mother families (83 | 8.8%) represent the smallest median family size with 2.52 persons per family.
| Family Type | # Families | Family Size |
| Married-Couple | 797 (84.5%) | 2.97 |
| Single Male/Father | 63 (6.7%) | 2.97 |
| Single Female/Mother | 83 (8.8%) | 2.52 |
| Total Families | 943 (100.0%) | 2.93 |
Median Household Size in Mayfield
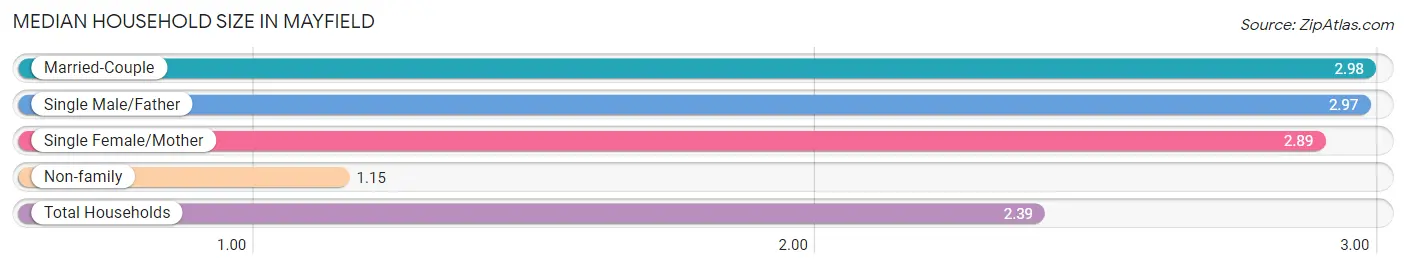
The median household size in Mayfield is 2.39 persons per household, with married-couple households (797 | 57.6%) accounting for the largest median household size of 2.98 persons per household. non-family households (442 | 31.9%) represent the smallest median household size with 1.15 persons per household.
| Household Type | # Households | Household Size |
| Married-Couple | 797 (57.6%) | 2.98 |
| Single Male/Father | 63 (4.5%) | 2.97 |
| Single Female/Mother | 83 (6.0%) | 2.89 |
| Non-family | 442 (31.9%) | 1.15 |
| Total Households | 1,385 (100.0%) | 2.39 |
Household Size by Marriage Status in Mayfield
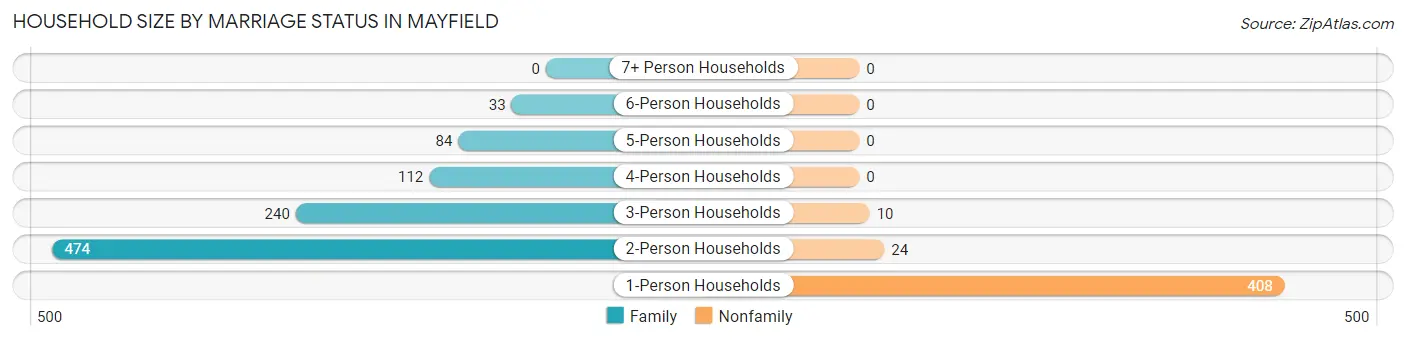
Out of a total of 1,385 households in Mayfield, 943 (68.1%) are family households, while 442 (31.9%) are nonfamily households. The most numerous type of family households are 2-person households, comprising 474, and the most common type of nonfamily households are 1-person households, comprising 408.
| Household Size | Family Households | Nonfamily Households |
| 1-Person Households | - | 408 (29.5%) |
| 2-Person Households | 474 (34.2%) | 24 (1.7%) |
| 3-Person Households | 240 (17.3%) | 10 (0.7%) |
| 4-Person Households | 112 (8.1%) | 0 (0.0%) |
| 5-Person Households | 84 (6.1%) | 0 (0.0%) |
| 6-Person Households | 33 (2.4%) | 0 (0.0%) |
| 7+ Person Households | 0 (0.0%) | 0 (0.0%) |
| Total | 943 (68.1%) | 442 (31.9%) |
Female Fertility in Mayfield
Fertility by Age in Mayfield
Average fertility rate in Mayfield is 32.0 births per 1,000 women. Women in the age bracket of 20 to 34 years have the highest fertility rate with 63.0 births per 1,000 women. Women in the age bracket of 20 to 34 years acount for 68.2% of all women with births.
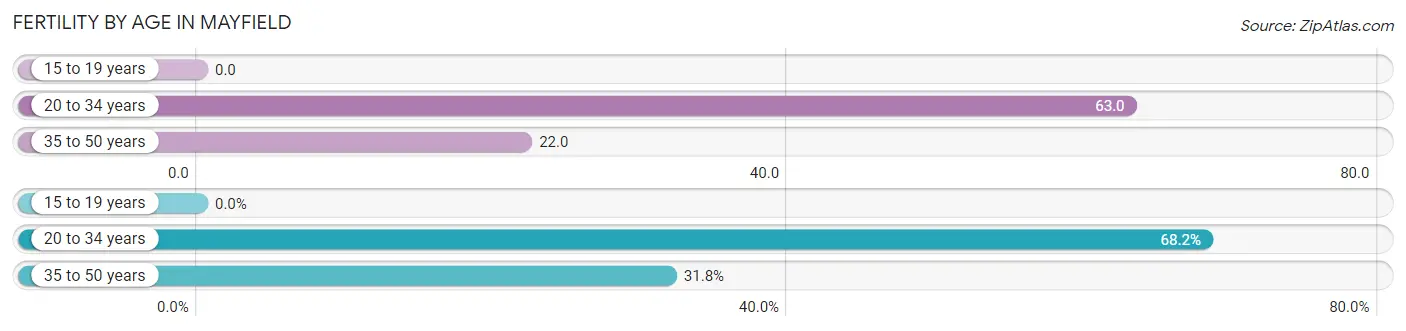
| Age Bracket | Women with Births | Births / 1,000 Women |
| 15 to 19 years | 0 (0.0%) | 0.0 |
| 20 to 34 years | 15 (68.2%) | 63.0 |
| 35 to 50 years | 7 (31.8%) | 22.0 |
| Total | 22 (100.0%) | 32.0 |
Fertility by Age by Marriage Status in Mayfield
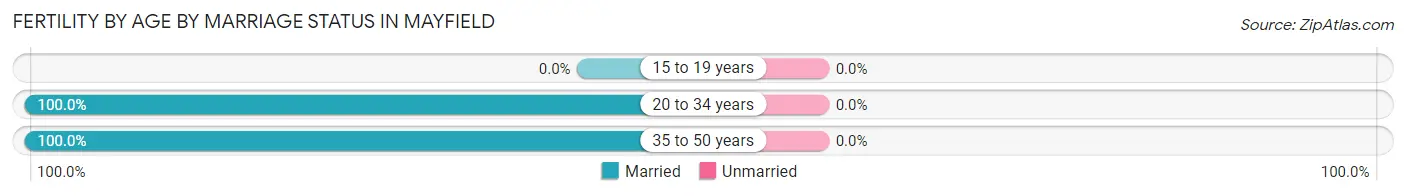
| Age Bracket | Married | Unmarried |
| 15 to 19 years | 0 (0.0%) | 0 (0.0%) |
| 20 to 34 years | 15 (100.0%) | 0 (0.0%) |
| 35 to 50 years | 7 (100.0%) | 0 (0.0%) |
| Total | 22 (100.0%) | 0 (0.0%) |
Fertility by Education in Mayfield
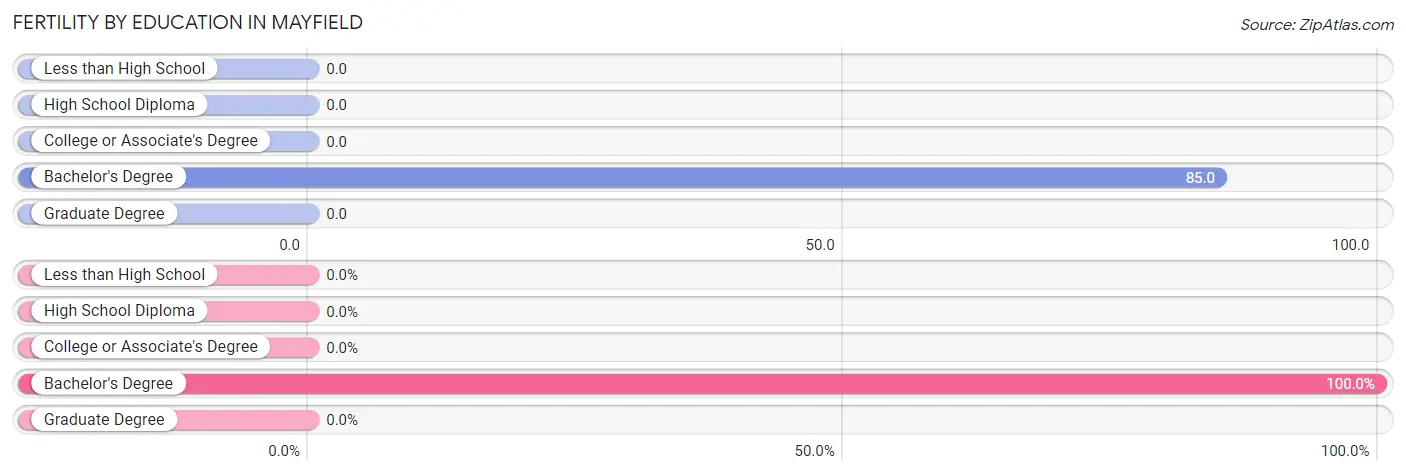
| Educational Attainment | Women with Births | Births / 1,000 Women |
| Less than High School | 0 (0.0%) | 0.0 |
| High School Diploma | 0 (0.0%) | 0.0 |
| College or Associate's Degree | 0 (0.0%) | 0.0 |
| Bachelor's Degree | 22 (100.0%) | 85.0 |
| Graduate Degree | 0 (0.0%) | 0.0 |
| Total | 22 (100.0%) | 32.0 |
Fertility by Education by Marriage Status in Mayfield
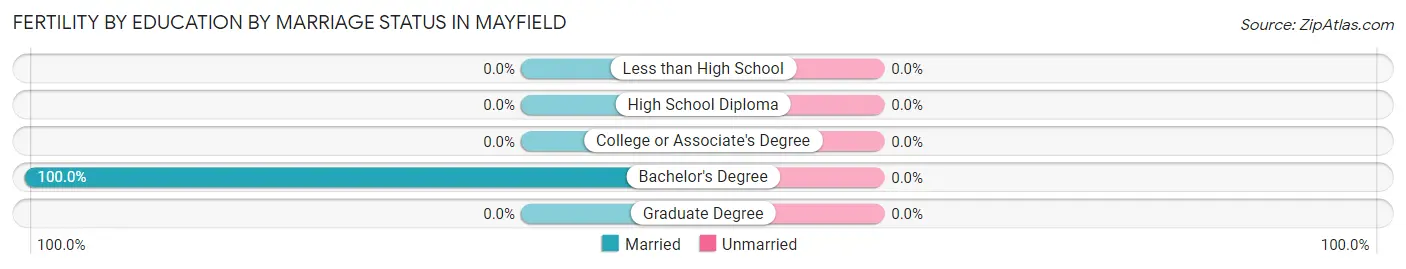
| Educational Attainment | Married | Unmarried |
| Less than High School | 0 (0.0%) | 0 (0.0%) |
| High School Diploma | 0 (0.0%) | 0 (0.0%) |
| College or Associate's Degree | 0 (0.0%) | 0 (0.0%) |
| Bachelor's Degree | 22 (100.0%) | 0 (0.0%) |
| Graduate Degree | 0 (0.0%) | 0 (0.0%) |
| Total | 22 (100.0%) | 0 (0.0%) |
Income in Mayfield
Income Overview in Mayfield
Per Capita Income in Mayfield is $55,271, while median incomes of families and households are $141,314 and $104,940 respectively.
| Characteristic | Number | Measure |
| Per Capita Income | 3,344 | $55,271 |
| Median Family Income | 943 | $141,314 |
| Mean Family Income | 943 | $153,555 |
| Median Household Income | 1,385 | $104,940 |
| Mean Household Income | 1,385 | $127,960 |
| Income Deficit | 943 | $0 |
| Wage / Income Gap (%) | 3,344 | 26.19% |
| Wage / Income Gap ($) | 3,344 | 73.81¢ per $1 |
| Gini / Inequality Index | 3,344 | 0.40 |
Earnings by Sex in Mayfield
Average Earnings in Mayfield are $55,093, $64,000 for men and $47,241 for women, a difference of 26.2%.
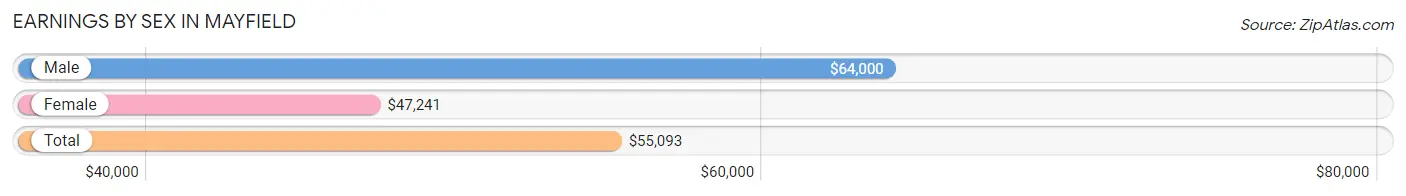
| Sex | Number | Average Earnings |
| Male | 1,050 (51.7%) | $64,000 |
| Female | 980 (48.3%) | $47,241 |
| Total | 2,030 (100.0%) | $55,093 |
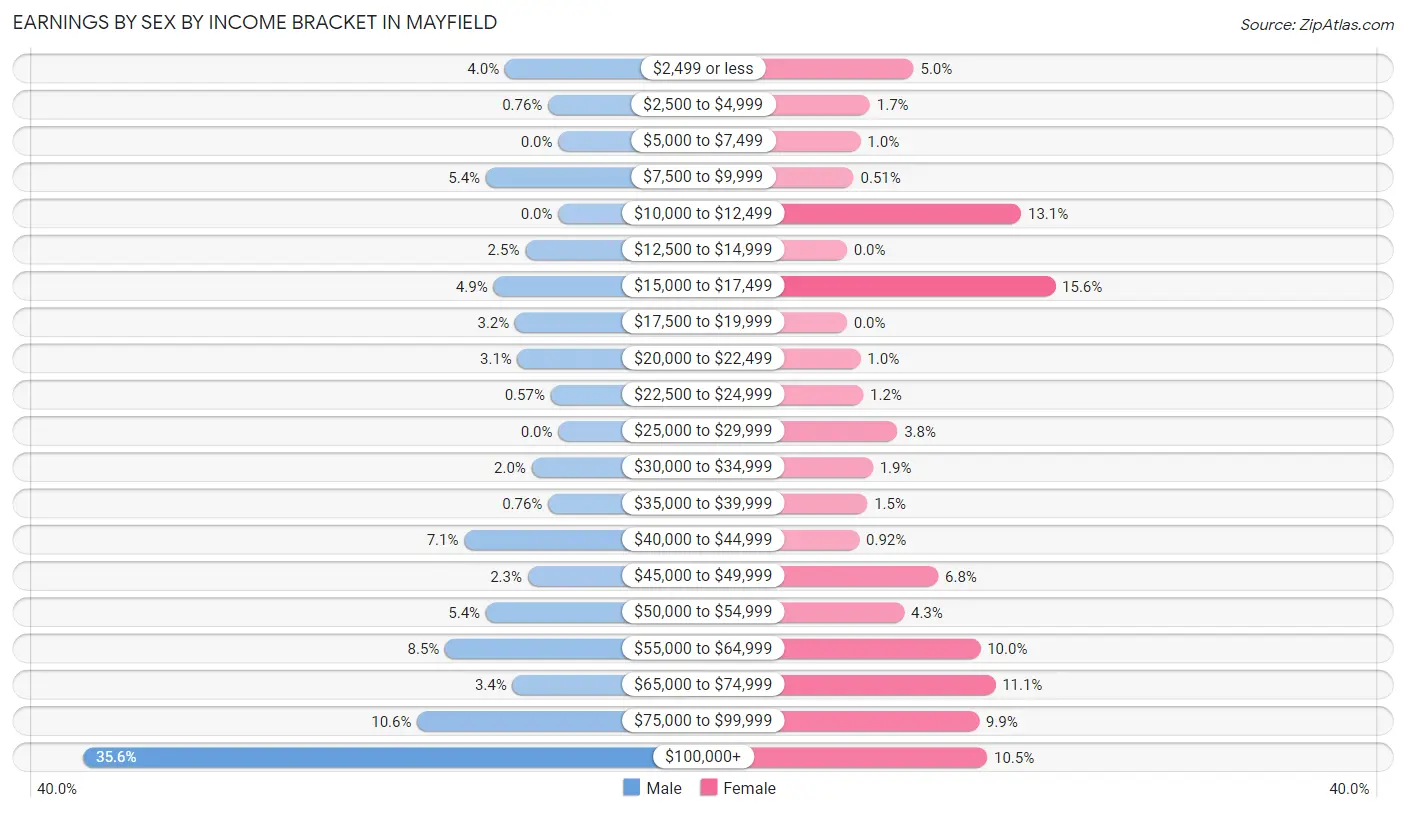
Earnings by Sex by Income Bracket in Mayfield
The most common earnings brackets in Mayfield are $100,000+ for men (374 | 35.6%) and $15,000 to $17,499 for women (153 | 15.6%).
| Income | Male | Female |
| $2,499 or less | 42 (4.0%) | 49 (5.0%) |
| $2,500 to $4,999 | 8 (0.8%) | 17 (1.7%) |
| $5,000 to $7,499 | 0 (0.0%) | 10 (1.0%) |
| $7,500 to $9,999 | 57 (5.4%) | 5 (0.5%) |
| $10,000 to $12,499 | 0 (0.0%) | 128 (13.1%) |
| $12,500 to $14,999 | 26 (2.5%) | 0 (0.0%) |
| $15,000 to $17,499 | 51 (4.9%) | 153 (15.6%) |
| $17,500 to $19,999 | 34 (3.2%) | 0 (0.0%) |
| $20,000 to $22,499 | 32 (3.0%) | 10 (1.0%) |
| $22,500 to $24,999 | 6 (0.6%) | 12 (1.2%) |
| $25,000 to $29,999 | 0 (0.0%) | 37 (3.8%) |
| $30,000 to $34,999 | 21 (2.0%) | 19 (1.9%) |
| $35,000 to $39,999 | 8 (0.8%) | 15 (1.5%) |
| $40,000 to $44,999 | 74 (7.0%) | 9 (0.9%) |
| $45,000 to $49,999 | 24 (2.3%) | 67 (6.8%) |
| $50,000 to $54,999 | 57 (5.4%) | 42 (4.3%) |
| $55,000 to $64,999 | 89 (8.5%) | 98 (10.0%) |
| $65,000 to $74,999 | 36 (3.4%) | 109 (11.1%) |
| $75,000 to $99,999 | 111 (10.6%) | 97 (9.9%) |
| $100,000+ | 374 (35.6%) | 103 (10.5%) |
| Total | 1,050 (100.0%) | 980 (100.0%) |
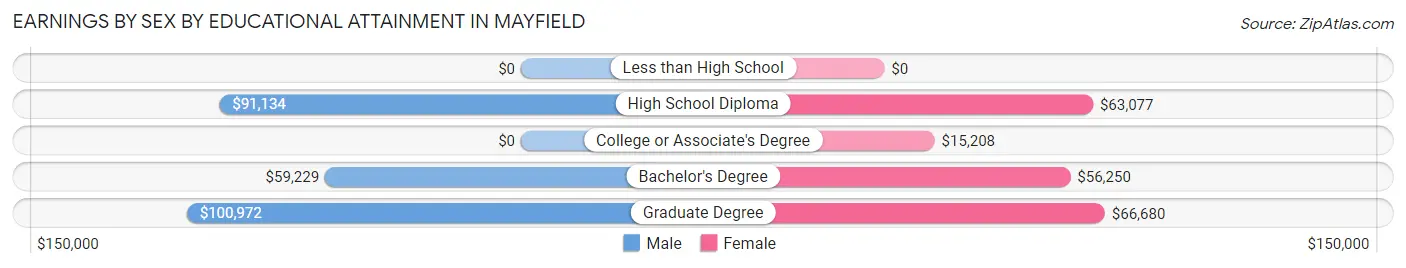
Earnings by Sex by Educational Attainment in Mayfield
Average earnings in Mayfield are $81,042 for men and $55,000 for women, a difference of 32.1%. Men with an educational attainment of graduate degree enjoy the highest average annual earnings of $100,972, while those with bachelor's degree education earn the least with $59,229. Women with an educational attainment of graduate degree earn the most with the average annual earnings of $66,680, while those with college or associate's degree education have the smallest earnings of $15,208.
| Educational Attainment | Male Income | Female Income |
| Less than High School | - | - |
| High School Diploma | $91,134 | $63,077 |
| College or Associate's Degree | - | - |
| Bachelor's Degree | $59,229 | $56,250 |
| Graduate Degree | $100,972 | $66,680 |
| Total | $81,042 | $55,000 |
Family Income in Mayfield
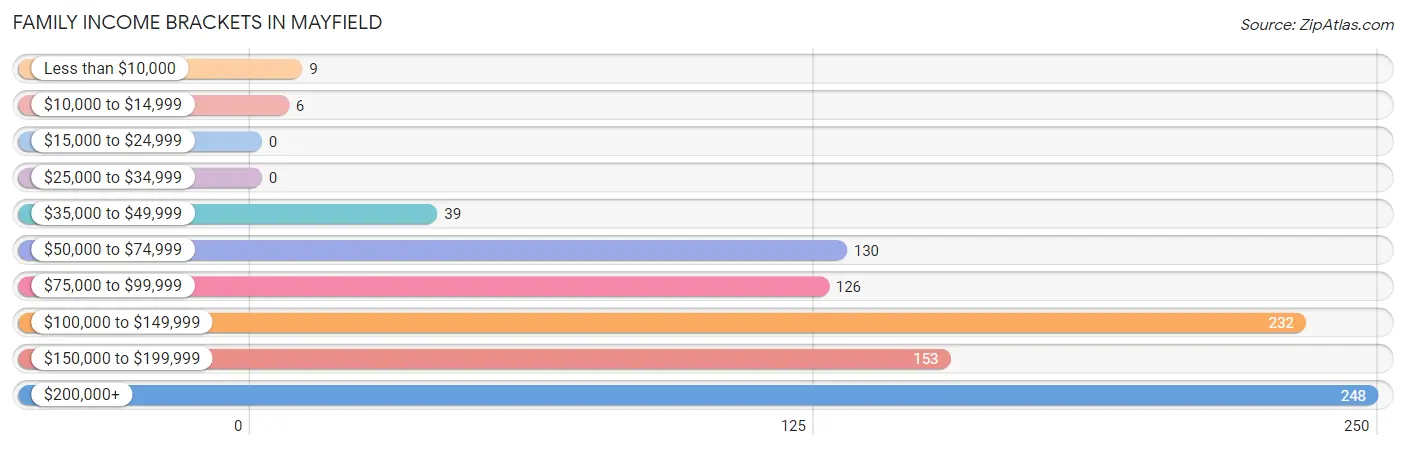
Family Income Brackets in Mayfield
According to the Mayfield family income data, there are 248 families falling into the $200,000+ income range, which is the most common income bracket and makes up 26.3% of all families.
| Income Bracket | # Families | % Families |
| Less than $10,000 | 9 | 1.0% |
| $10,000 to $14,999 | 6 | 0.6% |
| $15,000 to $24,999 | 0 | 0.0% |
| $25,000 to $34,999 | 0 | 0.0% |
| $35,000 to $49,999 | 39 | 4.1% |
| $50,000 to $74,999 | 130 | 13.8% |
| $75,000 to $99,999 | 126 | 13.4% |
| $100,000 to $149,999 | 232 | 24.6% |
| $150,000 to $199,999 | 153 | 16.2% |
| $200,000+ | 248 | 26.3% |
Family Income by Famaliy Size in Mayfield
5-person families (73 | 7.7%) account for the highest median family income in Mayfield with $250,001 per family, while 3-person families (247 | 26.2%) have the highest median income of $82,125 per family member.
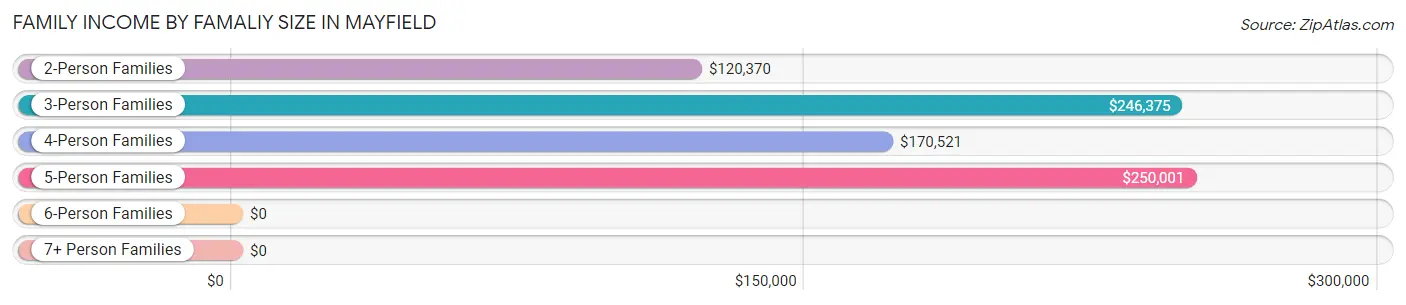
| Income Bracket | # Families | Median Income |
| 2-Person Families | 484 (51.3%) | $120,370 |
| 3-Person Families | 247 (26.2%) | $246,375 |
| 4-Person Families | 106 (11.2%) | $170,521 |
| 5-Person Families | 73 (7.7%) | $250,001 |
| 6-Person Families | 33 (3.5%) | $0 |
| 7+ Person Families | 0 (0.0%) | $0 |
| Total | 943 (100.0%) | $141,314 |
Family Income by Number of Earners in Mayfield
The median family income in Mayfield is $141,314, with families comprising 3+ earners (189) having the highest median family income of $250,001, while families with 1 earner (174) have the lowest median family income of $97,328, accounting for 20.0% and 18.4% of families, respectively.
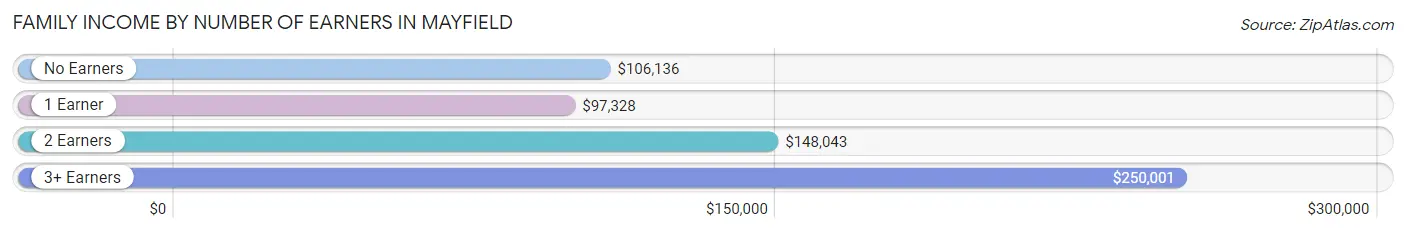
| Number of Earners | # Families | Median Income |
| No Earners | 124 (13.2%) | $106,136 |
| 1 Earner | 174 (18.4%) | $97,328 |
| 2 Earners | 456 (48.4%) | $148,043 |
| 3+ Earners | 189 (20.0%) | $250,001 |
| Total | 943 (100.0%) | $141,314 |
Household Income in Mayfield
Household Income Brackets in Mayfield
With 270 households falling in the category, the $200,000+ income range is the most frequent in Mayfield, accounting for 19.5% of all households. In contrast, only 25 households (1.8%) fall into the $10,000 to $14,999 income bracket, making it the least populous group.
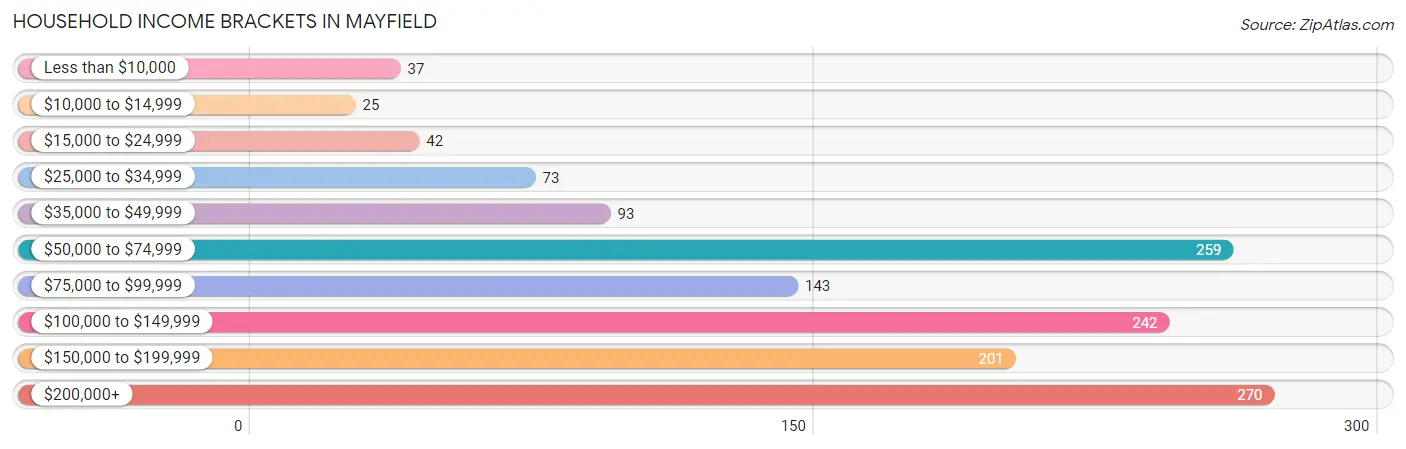
| Income Bracket | # Households | % Households |
| Less than $10,000 | 37 | 2.7% |
| $10,000 to $14,999 | 25 | 1.8% |
| $15,000 to $24,999 | 42 | 3.0% |
| $25,000 to $34,999 | 73 | 5.3% |
| $35,000 to $49,999 | 93 | 6.7% |
| $50,000 to $74,999 | 259 | 18.7% |
| $75,000 to $99,999 | 143 | 10.3% |
| $100,000 to $149,999 | 242 | 17.5% |
| $150,000 to $199,999 | 201 | 14.5% |
| $200,000+ | 270 | 19.5% |
Household Income by Householder Age in Mayfield
The median household income in Mayfield is $104,940, with the highest median household income of $159,191 found in the 45 to 64 years age bracket for the primary householder. A total of 577 households (41.7%) fall into this category. Meanwhile, the 15 to 24 years age bracket for the primary householder has the lowest median household income of $0, with 10 households (0.7%) in this group.
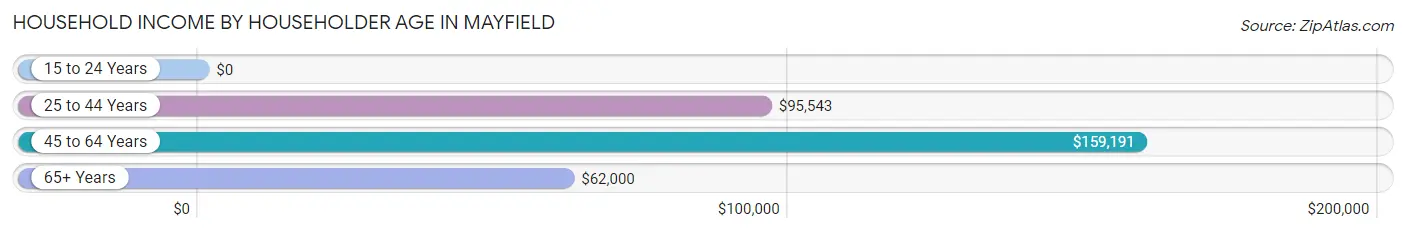
| Income Bracket | # Households | Median Income |
| 15 to 24 Years | 10 (0.7%) | $0 |
| 25 to 44 Years | 308 (22.2%) | $95,543 |
| 45 to 64 Years | 577 (41.7%) | $159,191 |
| 65+ Years | 490 (35.4%) | $62,000 |
| Total | 1,385 (100.0%) | $104,940 |
Poverty in Mayfield
Income Below Poverty by Sex and Age in Mayfield
With 6.1% poverty level for males and 2.9% for females among the residents of Mayfield, 25 to 34 year old males and 15 year old females are the most vulnerable to poverty, with 48 males (27.9%) and 6 females (15.8%) in their respective age groups living below the poverty level.
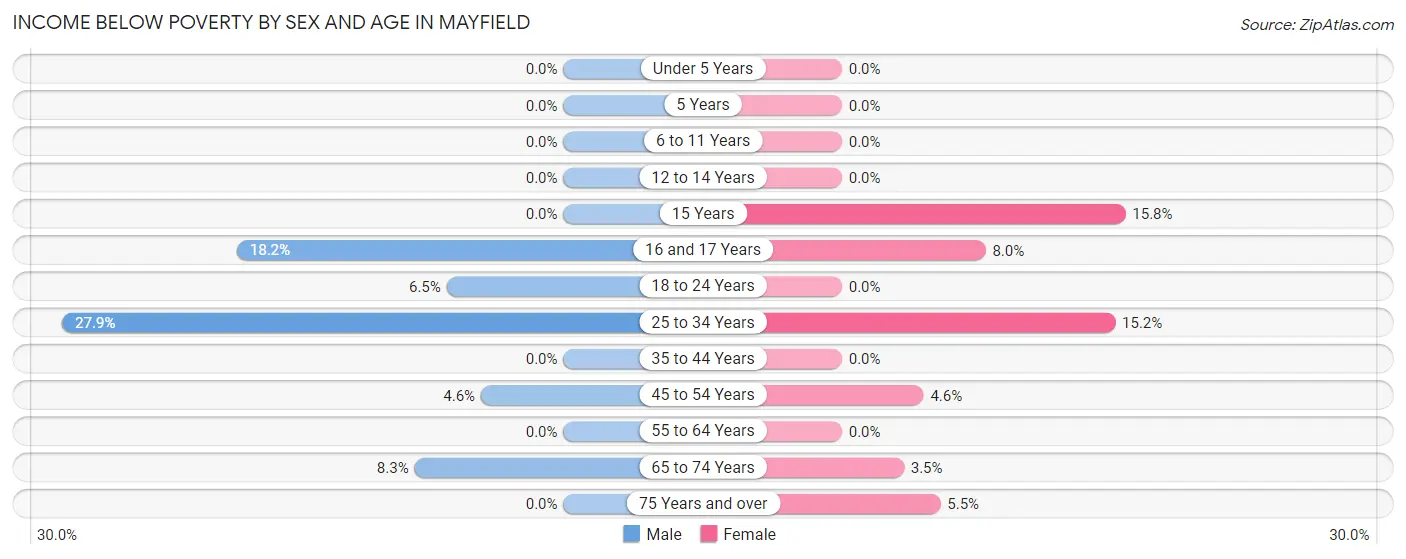
| Age Bracket | Male | Female |
| Under 5 Years | 0 (0.0%) | 0 (0.0%) |
| 5 Years | 0 (0.0%) | 0 (0.0%) |
| 6 to 11 Years | 0 (0.0%) | 0 (0.0%) |
| 12 to 14 Years | 0 (0.0%) | 0 (0.0%) |
| 15 Years | 0 (0.0%) | 6 (15.8%) |
| 16 and 17 Years | 12 (18.2%) | 6 (8.0%) |
| 18 to 24 Years | 8 (6.5%) | 0 (0.0%) |
| 25 to 34 Years | 48 (27.9%) | 14 (15.2%) |
| 35 to 44 Years | 0 (0.0%) | 0 (0.0%) |
| 45 to 54 Years | 10 (4.6%) | 6 (4.5%) |
| 55 to 64 Years | 0 (0.0%) | 0 (0.0%) |
| 65 to 74 Years | 18 (8.3%) | 9 (3.5%) |
| 75 Years and over | 0 (0.0%) | 10 (5.5%) |
| Total | 96 (6.1%) | 51 (2.9%) |
Income Above Poverty by Sex and Age in Mayfield
According to the poverty statistics in Mayfield, males aged under 5 years and females aged under 5 years are the age groups that are most secure financially, with 100.0% of males and 100.0% of females in these age groups living above the poverty line.
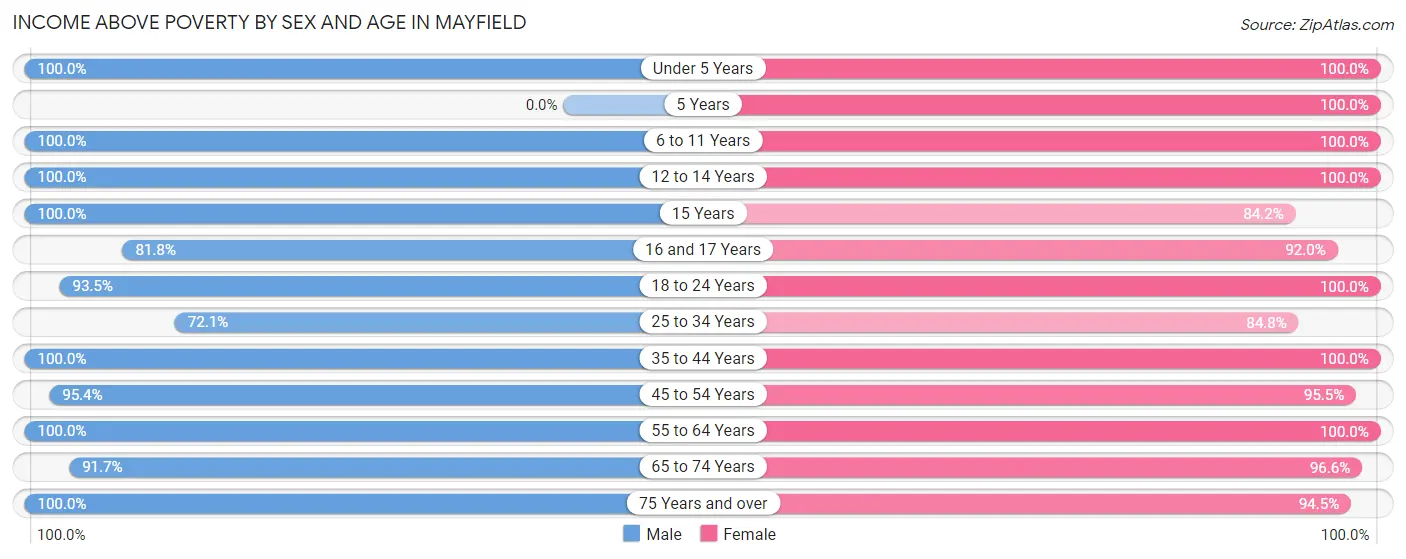
| Age Bracket | Male | Female |
| Under 5 Years | 56 (100.0%) | 49 (100.0%) |
| 5 Years | 0 (0.0%) | 40 (100.0%) |
| 6 to 11 Years | 44 (100.0%) | 86 (100.0%) |
| 12 to 14 Years | 61 (100.0%) | 68 (100.0%) |
| 15 Years | 46 (100.0%) | 32 (84.2%) |
| 16 and 17 Years | 54 (81.8%) | 69 (92.0%) |
| 18 to 24 Years | 115 (93.5%) | 160 (100.0%) |
| 25 to 34 Years | 124 (72.1%) | 78 (84.8%) |
| 35 to 44 Years | 152 (100.0%) | 232 (100.0%) |
| 45 to 54 Years | 208 (95.4%) | 126 (95.5%) |
| 55 to 64 Years | 295 (100.0%) | 343 (100.0%) |
| 65 to 74 Years | 199 (91.7%) | 252 (96.6%) |
| 75 Years and over | 126 (100.0%) | 172 (94.5%) |
| Total | 1,480 (93.9%) | 1,707 (97.1%) |
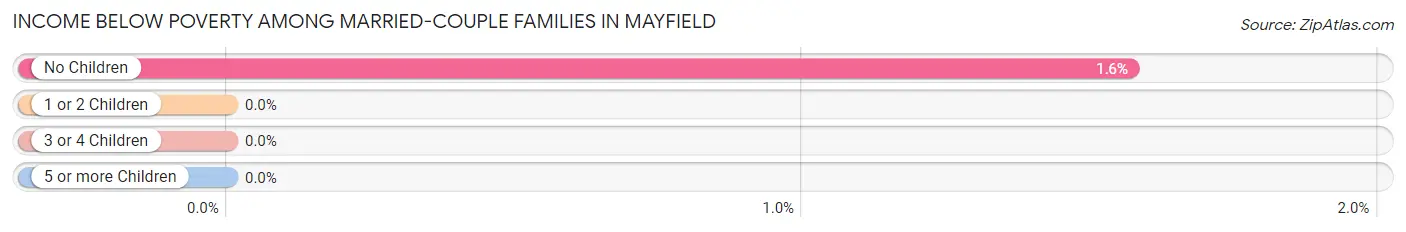
Income Below Poverty Among Married-Couple Families in Mayfield
The poverty statistics for married-couple families in Mayfield show that 1.1% or 9 of the total 797 families live below the poverty line. Families with no children have the highest poverty rate of 1.6%, comprising of 9 families. On the other hand, families with 1 or 2 children have the lowest poverty rate of 0.0%, which includes 0 families.
| Children | Above Poverty | Below Poverty |
| No Children | 564 (98.4%) | 9 (1.6%) |
| 1 or 2 Children | 151 (100.0%) | 0 (0.0%) |
| 3 or 4 Children | 73 (100.0%) | 0 (0.0%) |
| 5 or more Children | 0 (0.0%) | 0 (0.0%) |
| Total | 788 (98.9%) | 9 (1.1%) |
Income Below Poverty Among Single-Parent Households in Mayfield
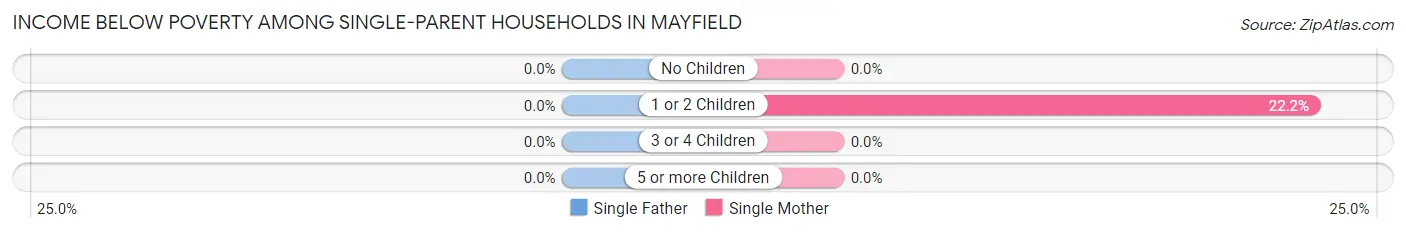
| Children | Single Father | Single Mother |
| No Children | 0 (0.0%) | 0 (0.0%) |
| 1 or 2 Children | 0 (0.0%) | 6 (22.2%) |
| 3 or 4 Children | 0 (0.0%) | 0 (0.0%) |
| 5 or more Children | 0 (0.0%) | 0 (0.0%) |
| Total | 0 (0.0%) | 6 (7.2%) |
Income Below Poverty Among Married-Couple vs Single-Parent Households in Mayfield
The poverty data for Mayfield shows that 9 of the married-couple family households (1.1%) and 6 of the single-parent households (4.1%) are living below the poverty level. Within the married-couple family households, those with no children have the highest poverty rate, with 9 households (1.6%) falling below the poverty line. Among the single-parent households, those with 1 or 2 children have the highest poverty rate, with 6 household (7.5%) living below poverty.
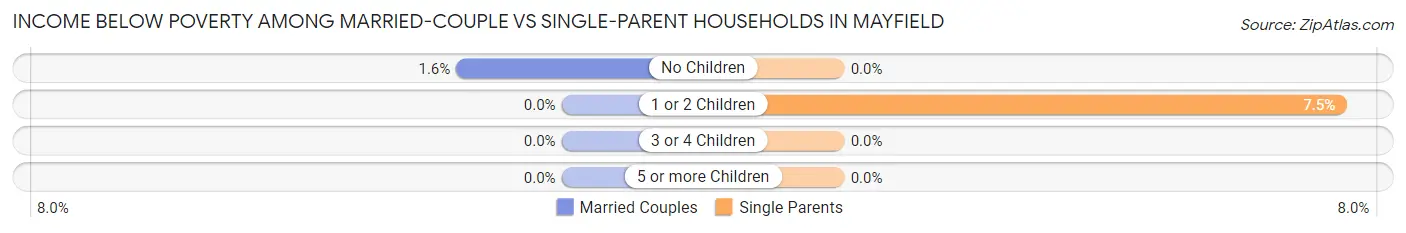
| Children | Married-Couple Families | Single-Parent Households |
| No Children | 9 (1.6%) | 0 (0.0%) |
| 1 or 2 Children | 0 (0.0%) | 6 (7.5%) |
| 3 or 4 Children | 0 (0.0%) | 0 (0.0%) |
| 5 or more Children | 0 (0.0%) | 0 (0.0%) |
| Total | 9 (1.1%) | 6 (4.1%) |
Employment Characteristics in Mayfield
Employment by Class of Employer in Mayfield
Among the 1,803 employed individuals in Mayfield, private company employees (1,194 | 66.2%), not-for-profit organizations (232 | 12.9%), and local government employees (124 | 6.9%) make up the most common classes of employment.
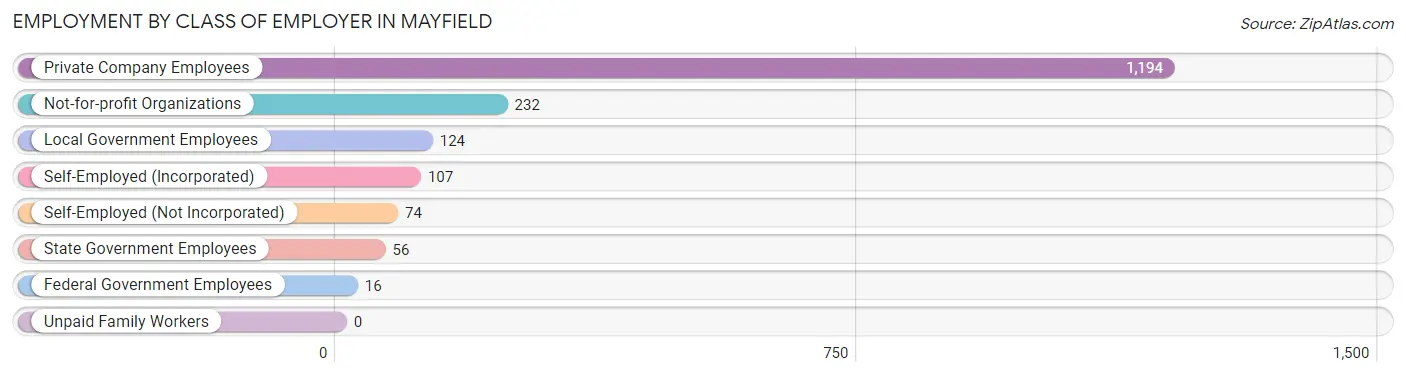
| Employer Class | # Employees | % Employees |
| Private Company Employees | 1,194 | 66.2% |
| Self-Employed (Incorporated) | 107 | 5.9% |
| Self-Employed (Not Incorporated) | 74 | 4.1% |
| Not-for-profit Organizations | 232 | 12.9% |
| Local Government Employees | 124 | 6.9% |
| State Government Employees | 56 | 3.1% |
| Federal Government Employees | 16 | 0.9% |
| Unpaid Family Workers | 0 | 0.0% |
| Total | 1,803 | 100.0% |
Employment Status by Age in Mayfield
According to the labor force statistics for Mayfield, out of the total population over 16 years of age (2,856), 68.8% or 1,965 individuals are in the labor force, with 8.2% or 161 of them unemployed. The age group with the highest labor force participation rate is 55 to 59 years, with 98.1% or 408 individuals in the labor force. Within the labor force, the 55 to 59 years age range has the highest percentage of unemployed individuals, with 25.7% or 105 of them being unemployed.
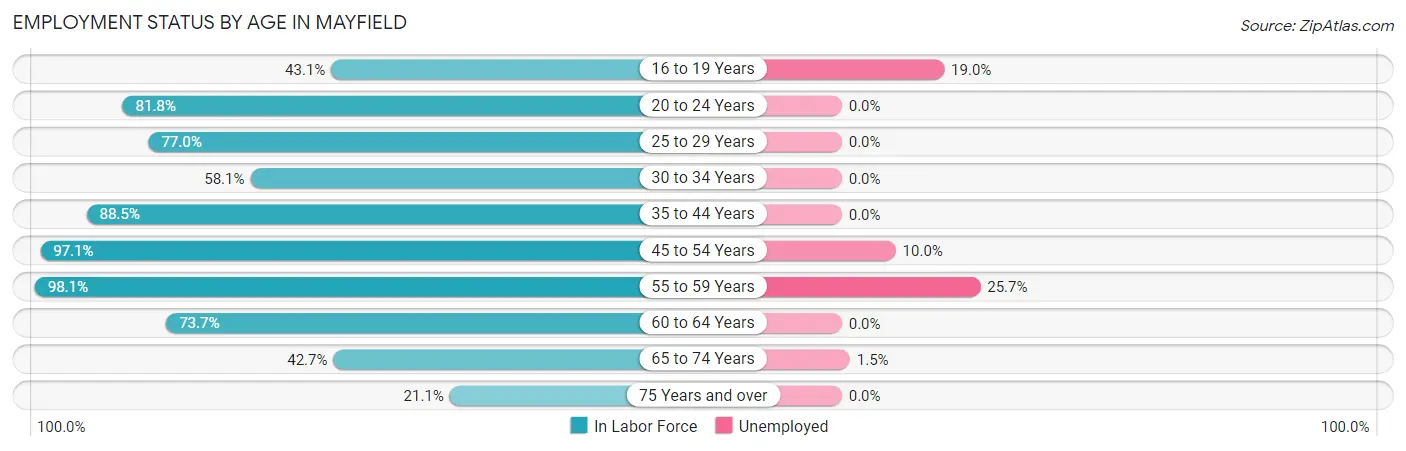
| Age Bracket | In Labor Force | Unemployed |
| 16 to 19 Years | 100 (43.1%) | 19 (19.0%) |
| 20 to 24 Years | 157 (81.8%) | 0 (0.0%) |
| 25 to 29 Years | 104 (77.0%) | 0 (0.0%) |
| 30 to 34 Years | 75 (58.1%) | 0 (0.0%) |
| 35 to 44 Years | 340 (88.5%) | 0 (0.0%) |
| 45 to 54 Years | 340 (97.1%) | 34 (10.0%) |
| 55 to 59 Years | 408 (98.1%) | 105 (25.7%) |
| 60 to 64 Years | 171 (73.7%) | 0 (0.0%) |
| 65 to 74 Years | 204 (42.7%) | 3 (1.5%) |
| 75 Years and over | 65 (21.1%) | 0 (0.0%) |
| Total | 1,965 (68.8%) | 161 (8.2%) |
Employment Status by Educational Attainment in Mayfield
According to labor force statistics for Mayfield, 87.4% of individuals (1,439) out of the total population between 25 and 64 years of age (1,646) are in the labor force, with 9.7% or 140 of them being unemployed. The group with the highest labor force participation rate are those with the educational attainment of college / associate degree, with 90.5% or 389 individuals in the labor force. Within the labor force, individuals with college / associate degree education have the highest percentage of unemployment, with 27.0% or 105 of them being unemployed.
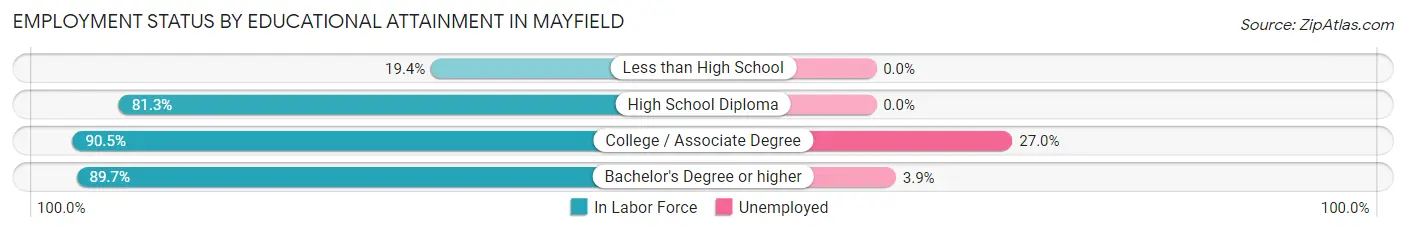
| Educational Attainment | In Labor Force | Unemployed |
| Less than High School | 7 (19.4%) | 0 (0.0%) |
| High School Diploma | 161 (81.3%) | 0 (0.0%) |
| College / Associate Degree | 389 (90.5%) | 116 (27.0%) |
| Bachelor's Degree or higher | 881 (89.7%) | 38 (3.9%) |
| Total | 1,439 (87.4%) | 160 (9.7%) |
Employment Occupations by Sex in Mayfield
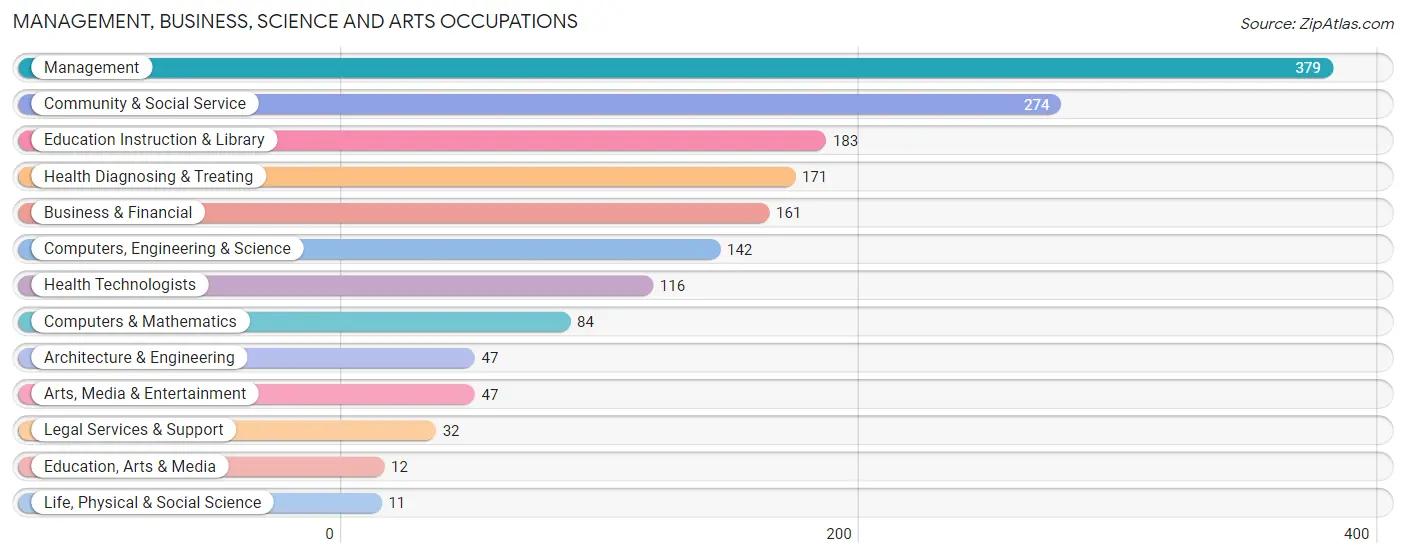
Management, Business, Science and Arts Occupations
The most common Management, Business, Science and Arts occupations in Mayfield are Management (379 | 21.0%), Community & Social Service (274 | 15.2%), Education Instruction & Library (183 | 10.2%), Health Diagnosing & Treating (171 | 9.5%), and Business & Financial (161 | 8.9%).
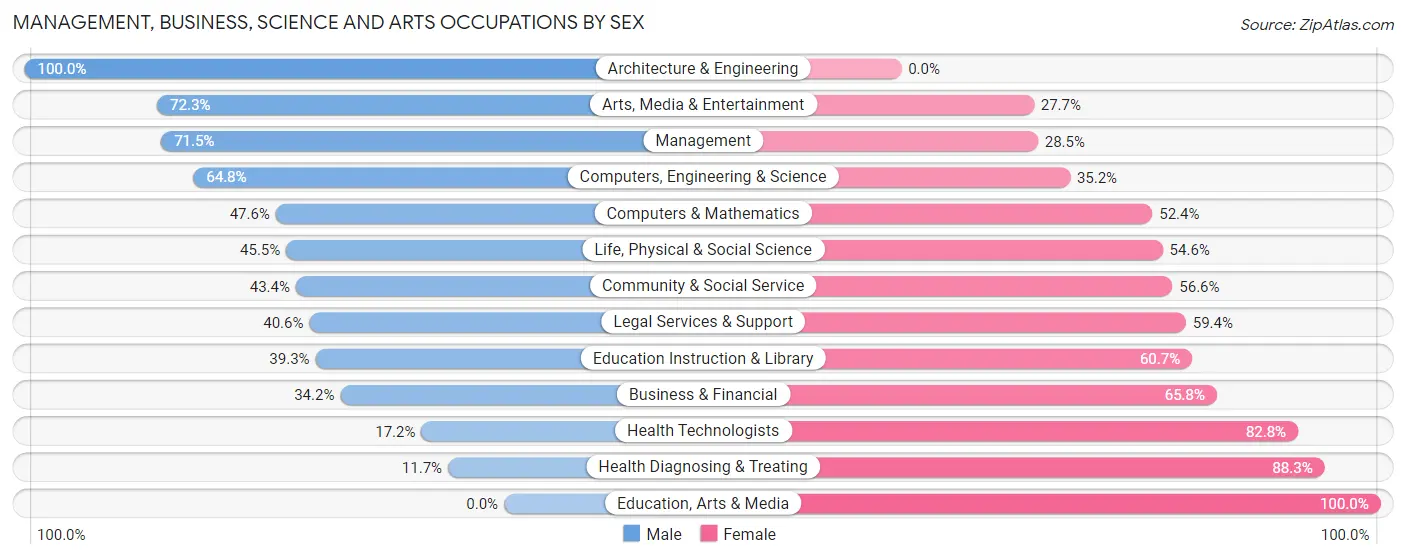
Management, Business, Science and Arts Occupations by Sex
Within the Management, Business, Science and Arts occupations in Mayfield, the most male-oriented occupations are Architecture & Engineering (100.0%), Arts, Media & Entertainment (72.3%), and Management (71.5%), while the most female-oriented occupations are Education, Arts & Media (100.0%), Health Diagnosing & Treating (88.3%), and Health Technologists (82.8%).
| Occupation | Male | Female |
| Management | 271 (71.5%) | 108 (28.5%) |
| Business & Financial | 55 (34.2%) | 106 (65.8%) |
| Computers, Engineering & Science | 92 (64.8%) | 50 (35.2%) |
| Computers & Mathematics | 40 (47.6%) | 44 (52.4%) |
| Architecture & Engineering | 47 (100.0%) | 0 (0.0%) |
| Life, Physical & Social Science | 5 (45.5%) | 6 (54.5%) |
| Community & Social Service | 119 (43.4%) | 155 (56.6%) |
| Education, Arts & Media | 0 (0.0%) | 12 (100.0%) |
| Legal Services & Support | 13 (40.6%) | 19 (59.4%) |
| Education Instruction & Library | 72 (39.3%) | 111 (60.7%) |
| Arts, Media & Entertainment | 34 (72.3%) | 13 (27.7%) |
| Health Diagnosing & Treating | 20 (11.7%) | 151 (88.3%) |
| Health Technologists | 20 (17.2%) | 96 (82.8%) |
| Total (Category) | 557 (49.4%) | 570 (50.6%) |
| Total (Overall) | 943 (52.3%) | 860 (47.7%) |
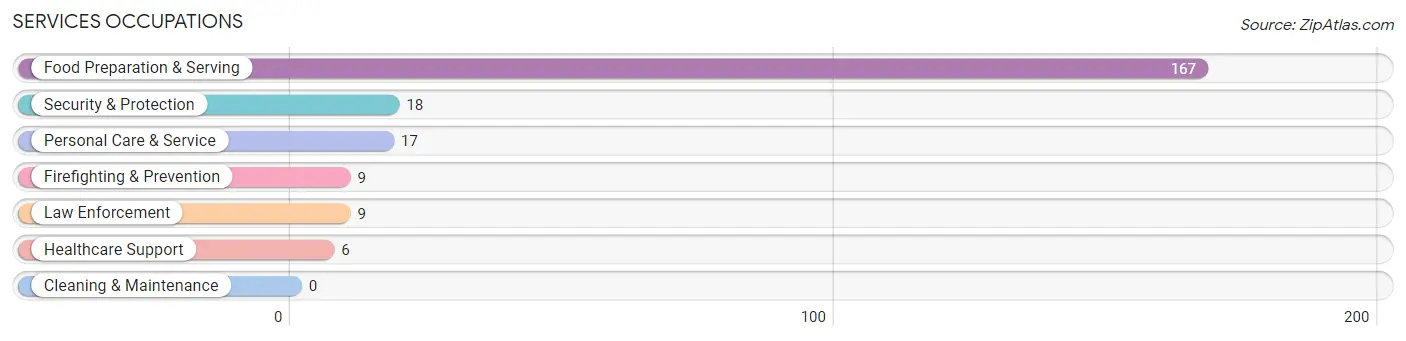
Services Occupations
The most common Services occupations in Mayfield are Food Preparation & Serving (167 | 9.3%), Security & Protection (18 | 1.0%), Personal Care & Service (17 | 0.9%), Firefighting & Prevention (9 | 0.5%), and Law Enforcement (9 | 0.5%).
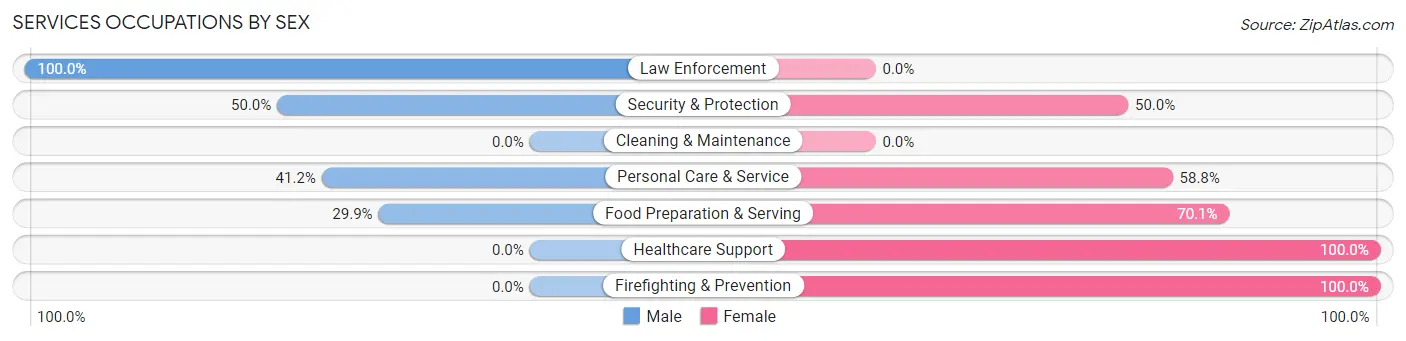
Services Occupations by Sex
Within the Services occupations in Mayfield, the most male-oriented occupations are Law Enforcement (100.0%), Security & Protection (50.0%), and Personal Care & Service (41.2%), while the most female-oriented occupations are Healthcare Support (100.0%), Firefighting & Prevention (100.0%), and Food Preparation & Serving (70.1%).
| Occupation | Male | Female |
| Healthcare Support | 0 (0.0%) | 6 (100.0%) |
| Security & Protection | 9 (50.0%) | 9 (50.0%) |
| Firefighting & Prevention | 0 (0.0%) | 9 (100.0%) |
| Law Enforcement | 9 (100.0%) | 0 (0.0%) |
| Food Preparation & Serving | 50 (29.9%) | 117 (70.1%) |
| Cleaning & Maintenance | 0 (0.0%) | 0 (0.0%) |
| Personal Care & Service | 7 (41.2%) | 10 (58.8%) |
| Total (Category) | 66 (31.7%) | 142 (68.3%) |
| Total (Overall) | 943 (52.3%) | 860 (47.7%) |
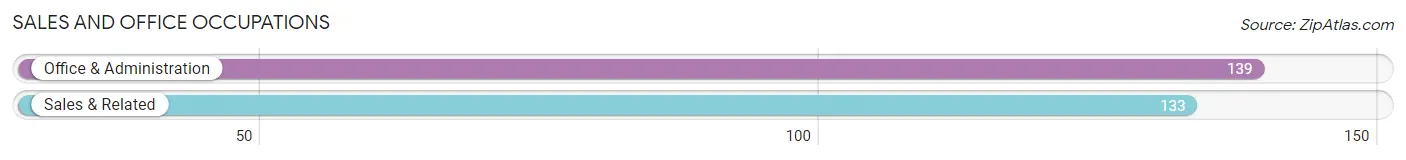
Sales and Office Occupations
The most common Sales and Office occupations in Mayfield are Office & Administration (139 | 7.7%), and Sales & Related (133 | 7.4%).
Sales and Office Occupations by Sex
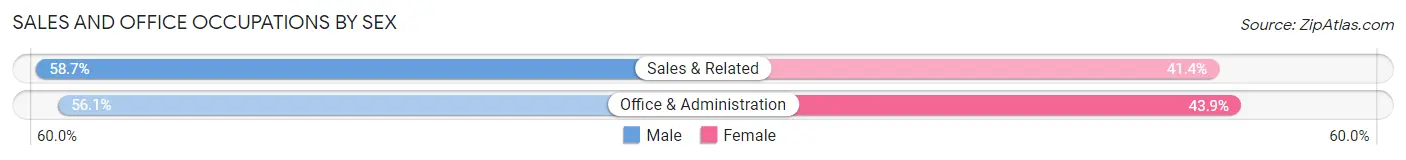
| Occupation | Male | Female |
| Sales & Related | 78 (58.7%) | 55 (41.3%) |
| Office & Administration | 78 (56.1%) | 61 (43.9%) |
| Total (Category) | 156 (57.4%) | 116 (42.6%) |
| Total (Overall) | 943 (52.3%) | 860 (47.7%) |
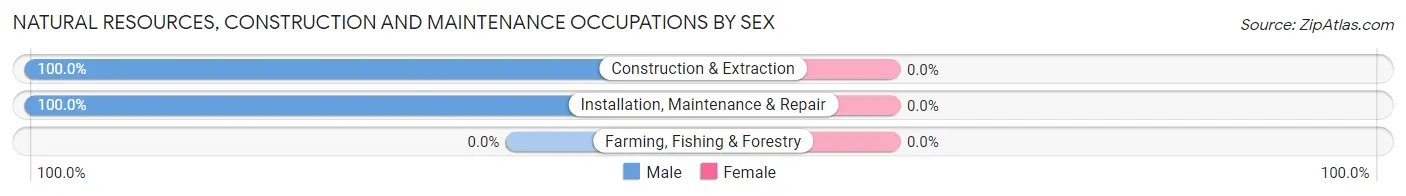
Natural Resources, Construction and Maintenance Occupations
The most common Natural Resources, Construction and Maintenance occupations in Mayfield are Construction & Extraction (67 | 3.7%), and Installation, Maintenance & Repair (26 | 1.4%).

Natural Resources, Construction and Maintenance Occupations by Sex
| Occupation | Male | Female |
| Farming, Fishing & Forestry | 0 (0.0%) | 0 (0.0%) |
| Construction & Extraction | 67 (100.0%) | 0 (0.0%) |
| Installation, Maintenance & Repair | 26 (100.0%) | 0 (0.0%) |
| Total (Category) | 93 (100.0%) | 0 (0.0%) |
| Total (Overall) | 943 (52.3%) | 860 (47.7%) |
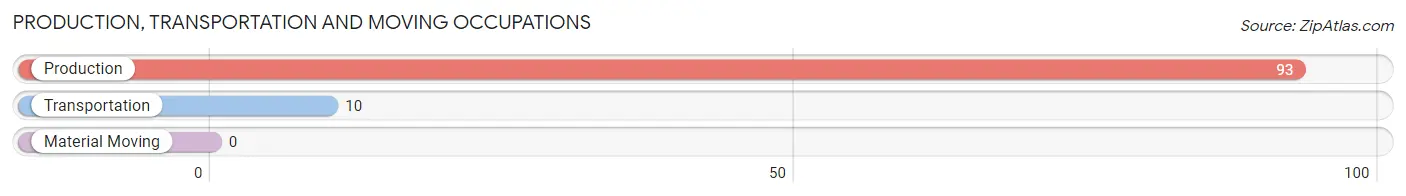
Production, Transportation and Moving Occupations
The most common Production, Transportation and Moving occupations in Mayfield are Production (93 | 5.2%), and Transportation (10 | 0.5%).
Production, Transportation and Moving Occupations by Sex
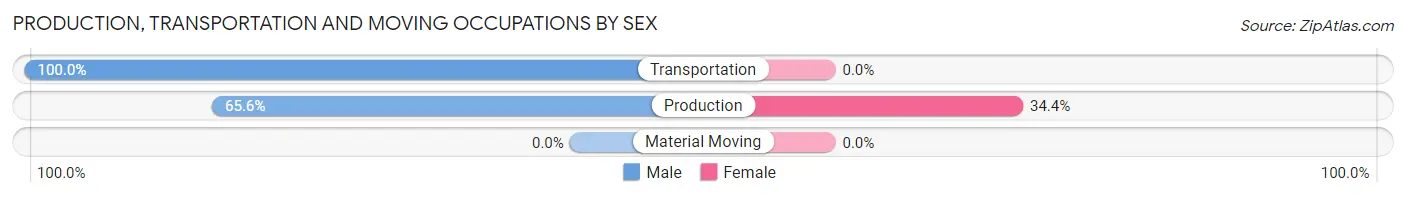
| Occupation | Male | Female |
| Production | 61 (65.6%) | 32 (34.4%) |
| Transportation | 10 (100.0%) | 0 (0.0%) |
| Material Moving | 0 (0.0%) | 0 (0.0%) |
| Total (Category) | 71 (68.9%) | 32 (31.1%) |
| Total (Overall) | 943 (52.3%) | 860 (47.7%) |
Employment Industries by Sex in Mayfield
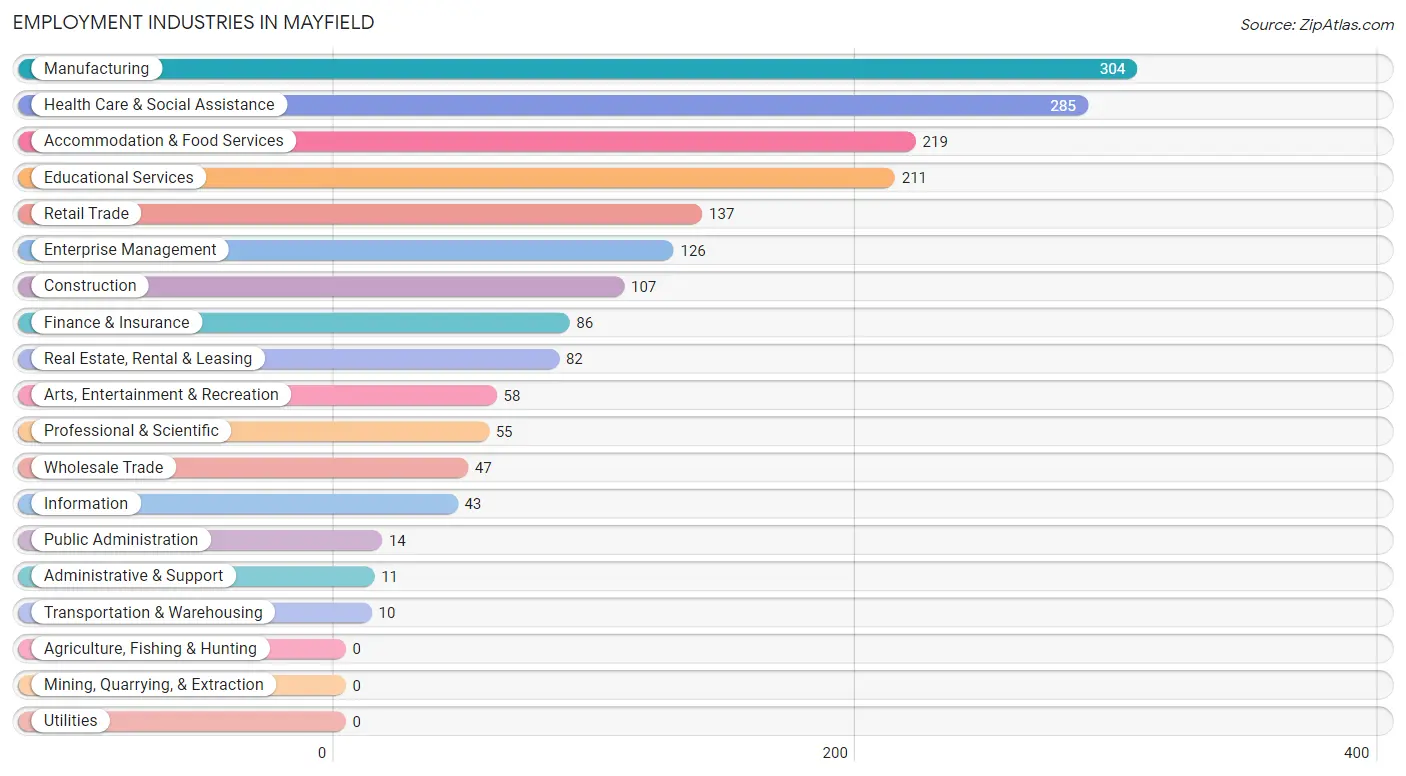
Employment Industries in Mayfield
The major employment industries in Mayfield include Manufacturing (304 | 16.9%), Health Care & Social Assistance (285 | 15.8%), Accommodation & Food Services (219 | 12.1%), Educational Services (211 | 11.7%), and Retail Trade (137 | 7.6%).
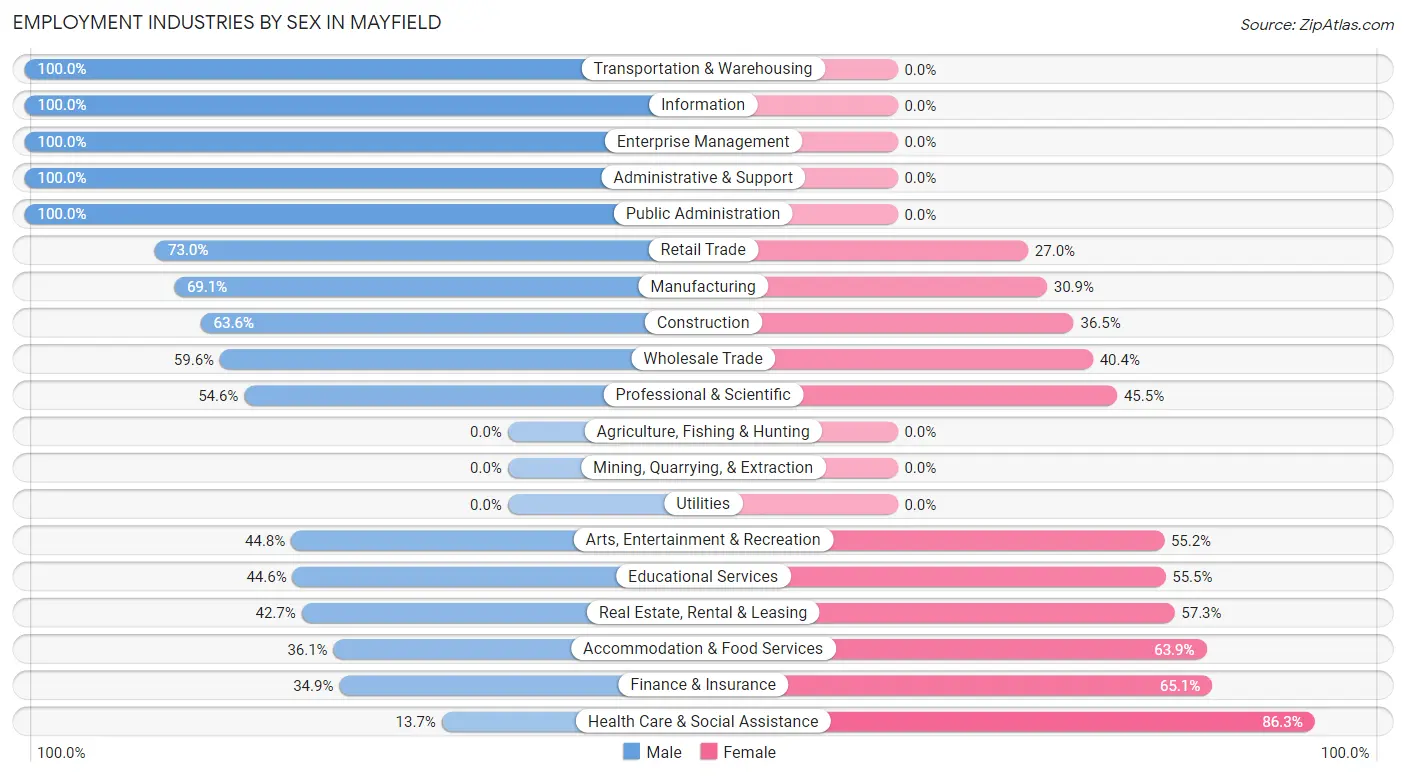
Employment Industries by Sex in Mayfield
The Mayfield industries that see more men than women are Transportation & Warehousing (100.0%), Information (100.0%), and Enterprise Management (100.0%), whereas the industries that tend to have a higher number of women are Health Care & Social Assistance (86.3%), Finance & Insurance (65.1%), and Accommodation & Food Services (63.9%).
| Industry | Male | Female |
| Agriculture, Fishing & Hunting | 0 (0.0%) | 0 (0.0%) |
| Mining, Quarrying, & Extraction | 0 (0.0%) | 0 (0.0%) |
| Construction | 68 (63.5%) | 39 (36.4%) |
| Manufacturing | 210 (69.1%) | 94 (30.9%) |
| Wholesale Trade | 28 (59.6%) | 19 (40.4%) |
| Retail Trade | 100 (73.0%) | 37 (27.0%) |
| Transportation & Warehousing | 10 (100.0%) | 0 (0.0%) |
| Utilities | 0 (0.0%) | 0 (0.0%) |
| Information | 43 (100.0%) | 0 (0.0%) |
| Finance & Insurance | 30 (34.9%) | 56 (65.1%) |
| Real Estate, Rental & Leasing | 35 (42.7%) | 47 (57.3%) |
| Professional & Scientific | 30 (54.5%) | 25 (45.5%) |
| Enterprise Management | 126 (100.0%) | 0 (0.0%) |
| Administrative & Support | 11 (100.0%) | 0 (0.0%) |
| Educational Services | 94 (44.6%) | 117 (55.4%) |
| Health Care & Social Assistance | 39 (13.7%) | 246 (86.3%) |
| Arts, Entertainment & Recreation | 26 (44.8%) | 32 (55.2%) |
| Accommodation & Food Services | 79 (36.1%) | 140 (63.9%) |
| Public Administration | 14 (100.0%) | 0 (0.0%) |
| Total | 943 (52.3%) | 860 (47.7%) |
Education in Mayfield
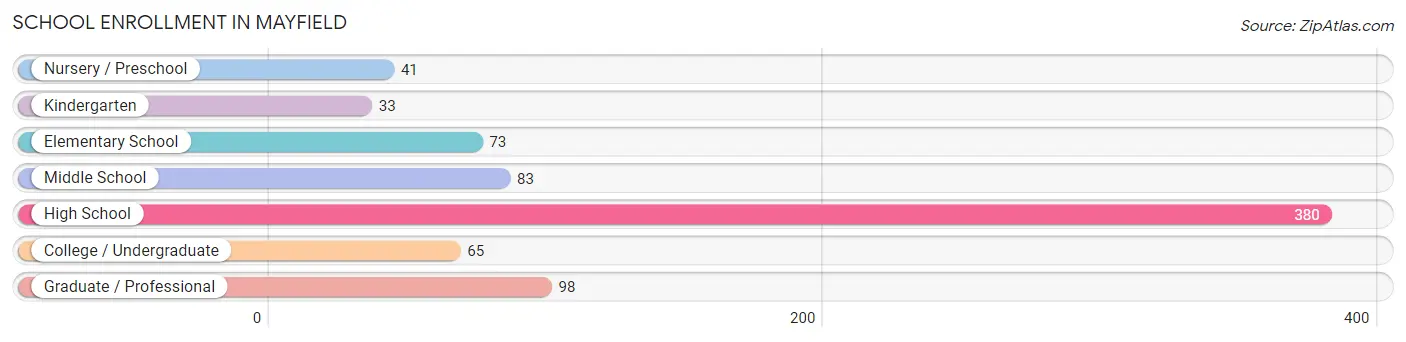
School Enrollment in Mayfield
The most common levels of schooling among the 773 students in Mayfield are high school (380 | 49.2%), graduate / professional (98 | 12.7%), and middle school (83 | 10.7%).
| School Level | # Students | % Students |
| Nursery / Preschool | 41 | 5.3% |
| Kindergarten | 33 | 4.3% |
| Elementary School | 73 | 9.4% |
| Middle School | 83 | 10.7% |
| High School | 380 | 49.2% |
| College / Undergraduate | 65 | 8.4% |
| Graduate / Professional | 98 | 12.7% |
| Total | 773 | 100.0% |
School Enrollment by Age by Funding Source in Mayfield
Out of a total of 773 students who are enrolled in schools in Mayfield, 177 (22.9%) attend a private institution, while the remaining 596 (77.1%) are enrolled in public schools. The age group of 3 to 4 year olds has the highest likelihood of being enrolled in private schools, with 13 (100.0% in the age bracket) enrolled. Conversely, the age group of 10 to 14 year olds has the lowest likelihood of being enrolled in a private school, with 167 (100.0% in the age bracket) attending a public institution.
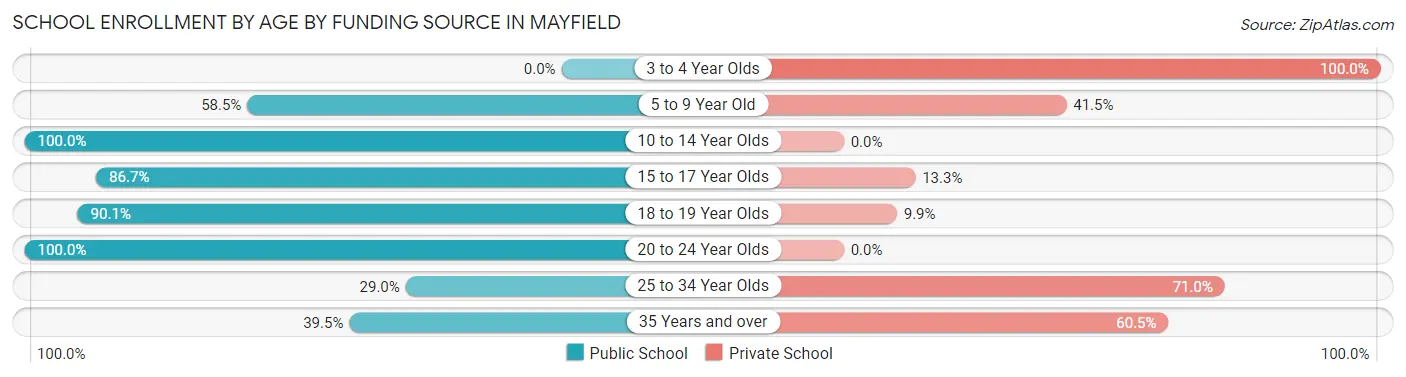
| Age Bracket | Public School | Private School |
| 3 to 4 Year Olds | 0 (0.0%) | 13 (100.0%) |
| 5 to 9 Year Old | 72 (58.5%) | 51 (41.5%) |
| 10 to 14 Year Olds | 167 (100.0%) | 0 (0.0%) |
| 15 to 17 Year Olds | 195 (86.7%) | 30 (13.3%) |
| 18 to 19 Year Olds | 82 (90.1%) | 9 (9.9%) |
| 20 to 24 Year Olds | 37 (100.0%) | 0 (0.0%) |
| 25 to 34 Year Olds | 9 (29.0%) | 22 (71.0%) |
| 35 Years and over | 34 (39.5%) | 52 (60.5%) |
| Total | 596 (77.1%) | 177 (22.9%) |
Educational Attainment by Field of Study in Mayfield
Business (265 | 18.8%), education (189 | 13.4%), science & technology (174 | 12.4%), engineering (160 | 11.4%), and visual & performing arts (116 | 8.2%) are the most common fields of study among 1,408 individuals in Mayfield who have obtained a bachelor's degree or higher.
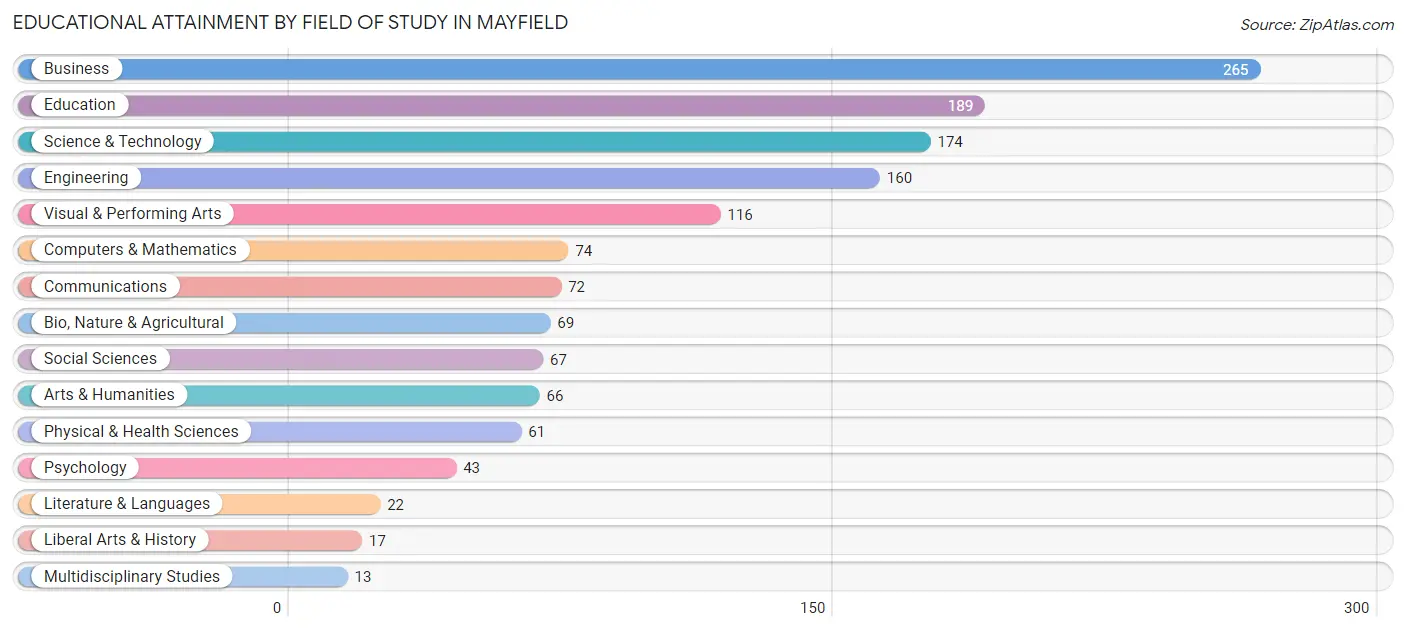
| Field of Study | # Graduates | % Graduates |
| Computers & Mathematics | 74 | 5.3% |
| Bio, Nature & Agricultural | 69 | 4.9% |
| Physical & Health Sciences | 61 | 4.3% |
| Psychology | 43 | 3.0% |
| Social Sciences | 67 | 4.8% |
| Engineering | 160 | 11.4% |
| Multidisciplinary Studies | 13 | 0.9% |
| Science & Technology | 174 | 12.4% |
| Business | 265 | 18.8% |
| Education | 189 | 13.4% |
| Literature & Languages | 22 | 1.6% |
| Liberal Arts & History | 17 | 1.2% |
| Visual & Performing Arts | 116 | 8.2% |
| Communications | 72 | 5.1% |
| Arts & Humanities | 66 | 4.7% |
| Total | 1,408 | 100.0% |
Transportation & Commute in Mayfield
Vehicle Availability by Sex in Mayfield
The most prevalent vehicle ownership categories in Mayfield are males with 2 vehicles (359, accounting for 38.1%) and females with 2 vehicles (380, making up 41.7%).
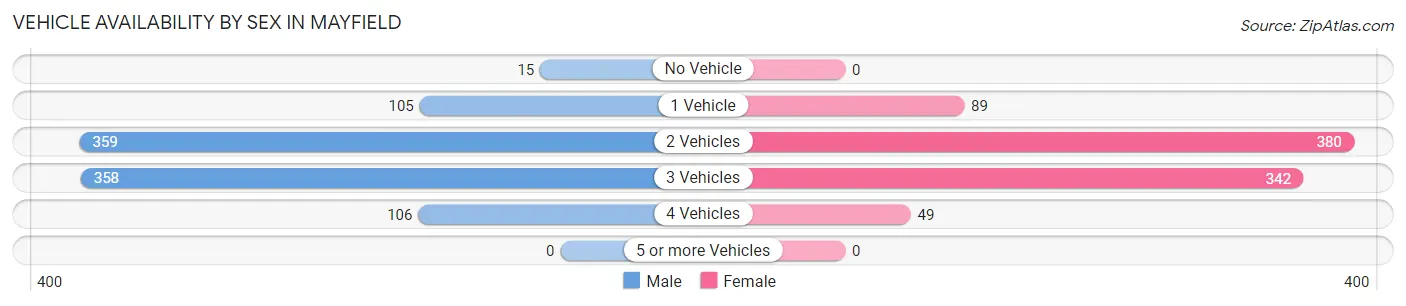
| Vehicles Available | Male | Female |
| No Vehicle | 15 (1.6%) | 0 (0.0%) |
| 1 Vehicle | 105 (11.1%) | 89 (10.3%) |
| 2 Vehicles | 359 (38.1%) | 380 (44.2%) |
| 3 Vehicles | 358 (38.0%) | 342 (39.8%) |
| 4 Vehicles | 106 (11.2%) | 49 (5.7%) |
| 5 or more Vehicles | 0 (0.0%) | 0 (0.0%) |
| Total | 943 (100.0%) | 860 (100.0%) |
Commute Time in Mayfield
The most frequently occuring commute durations in Mayfield are 15 to 19 minutes (314 commuters, 20.3%), 10 to 14 minutes (287 commuters, 18.6%), and 20 to 24 minutes (265 commuters, 17.2%).
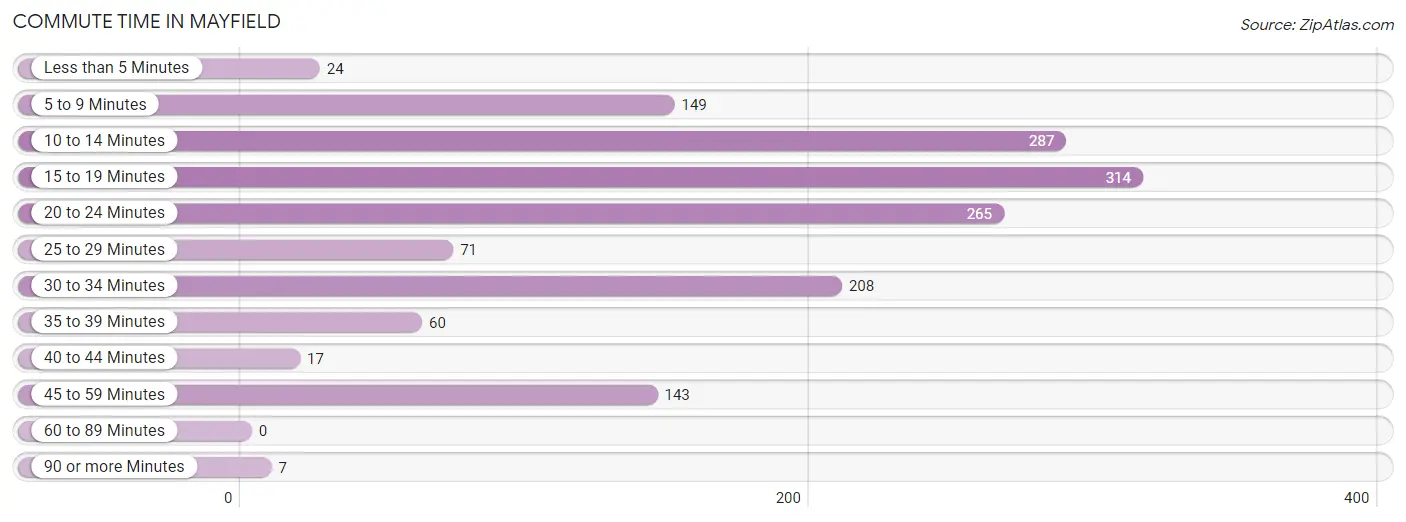
| Commute Time | # Commuters | % Commuters |
| Less than 5 Minutes | 24 | 1.5% |
| 5 to 9 Minutes | 149 | 9.6% |
| 10 to 14 Minutes | 287 | 18.6% |
| 15 to 19 Minutes | 314 | 20.3% |
| 20 to 24 Minutes | 265 | 17.2% |
| 25 to 29 Minutes | 71 | 4.6% |
| 30 to 34 Minutes | 208 | 13.5% |
| 35 to 39 Minutes | 60 | 3.9% |
| 40 to 44 Minutes | 17 | 1.1% |
| 45 to 59 Minutes | 143 | 9.3% |
| 60 to 89 Minutes | 0 | 0.0% |
| 90 or more Minutes | 7 | 0.4% |
Commute Time by Sex in Mayfield
The most common commute times in Mayfield are 10 to 14 minutes (179 commuters, 22.8%) for males and 15 to 19 minutes (207 commuters, 27.2%) for females.
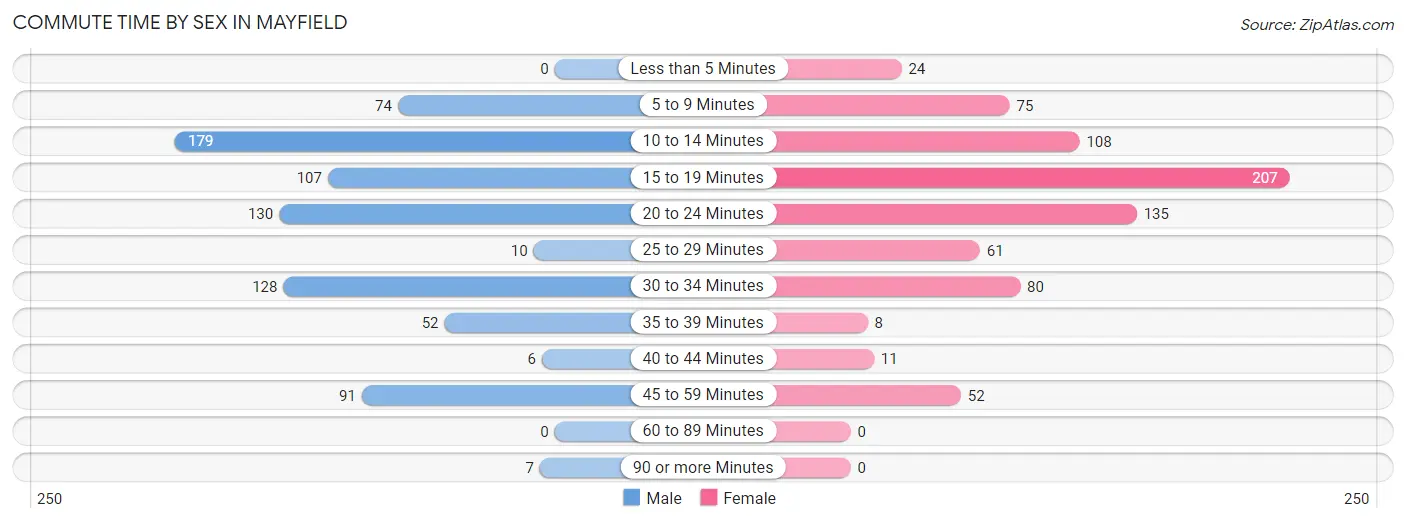
| Commute Time | Male | Female |
| Less than 5 Minutes | 0 (0.0%) | 24 (3.2%) |
| 5 to 9 Minutes | 74 (9.4%) | 75 (9.9%) |
| 10 to 14 Minutes | 179 (22.8%) | 108 (14.2%) |
| 15 to 19 Minutes | 107 (13.7%) | 207 (27.2%) |
| 20 to 24 Minutes | 130 (16.6%) | 135 (17.7%) |
| 25 to 29 Minutes | 10 (1.3%) | 61 (8.0%) |
| 30 to 34 Minutes | 128 (16.3%) | 80 (10.5%) |
| 35 to 39 Minutes | 52 (6.6%) | 8 (1.1%) |
| 40 to 44 Minutes | 6 (0.8%) | 11 (1.5%) |
| 45 to 59 Minutes | 91 (11.6%) | 52 (6.8%) |
| 60 to 89 Minutes | 0 (0.0%) | 0 (0.0%) |
| 90 or more Minutes | 7 (0.9%) | 0 (0.0%) |
Time of Departure to Work by Sex in Mayfield
The most frequent times of departure to work in Mayfield are 7:30 AM to 7:59 AM (178, 22.7%) for males and 7:00 AM to 7:29 AM (204, 26.8%) for females.
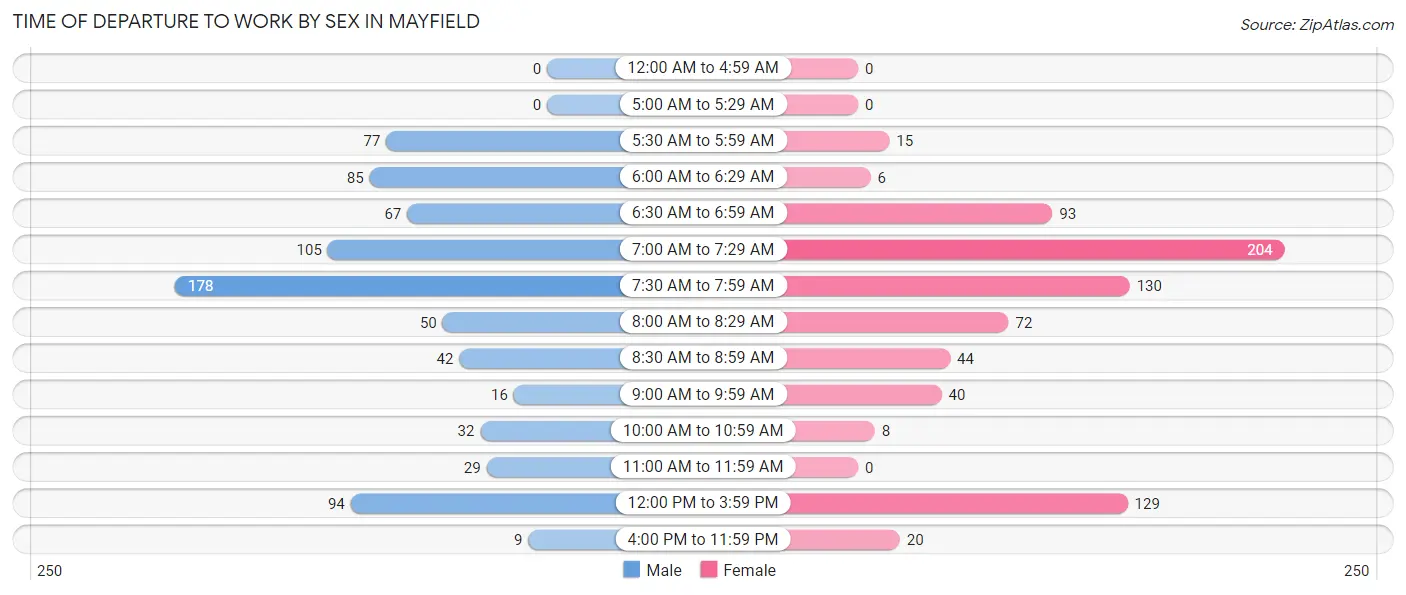
| Time of Departure | Male | Female |
| 12:00 AM to 4:59 AM | 0 (0.0%) | 0 (0.0%) |
| 5:00 AM to 5:29 AM | 0 (0.0%) | 0 (0.0%) |
| 5:30 AM to 5:59 AM | 77 (9.8%) | 15 (2.0%) |
| 6:00 AM to 6:29 AM | 85 (10.8%) | 6 (0.8%) |
| 6:30 AM to 6:59 AM | 67 (8.6%) | 93 (12.2%) |
| 7:00 AM to 7:29 AM | 105 (13.4%) | 204 (26.8%) |
| 7:30 AM to 7:59 AM | 178 (22.7%) | 130 (17.1%) |
| 8:00 AM to 8:29 AM | 50 (6.4%) | 72 (9.5%) |
| 8:30 AM to 8:59 AM | 42 (5.4%) | 44 (5.8%) |
| 9:00 AM to 9:59 AM | 16 (2.0%) | 40 (5.3%) |
| 10:00 AM to 10:59 AM | 32 (4.1%) | 8 (1.1%) |
| 11:00 AM to 11:59 AM | 29 (3.7%) | 0 (0.0%) |
| 12:00 PM to 3:59 PM | 94 (12.0%) | 129 (17.0%) |
| 4:00 PM to 11:59 PM | 9 (1.1%) | 20 (2.6%) |
| Total | 784 (100.0%) | 761 (100.0%) |
Housing Occupancy in Mayfield
Occupancy by Ownership in Mayfield
Of the total 1,385 dwellings in Mayfield, owner-occupied units account for 1,095 (79.1%), while renter-occupied units make up 290 (20.9%).
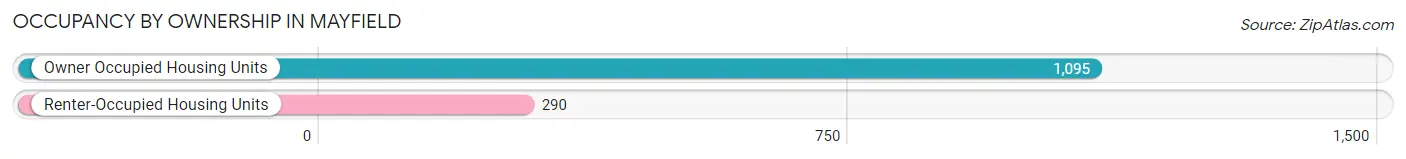
| Occupancy | # Housing Units | % Housing Units |
| Owner Occupied Housing Units | 1,095 | 79.1% |
| Renter-Occupied Housing Units | 290 | 20.9% |
| Total Occupied Housing Units | 1,385 | 100.0% |
Occupancy by Household Size in Mayfield
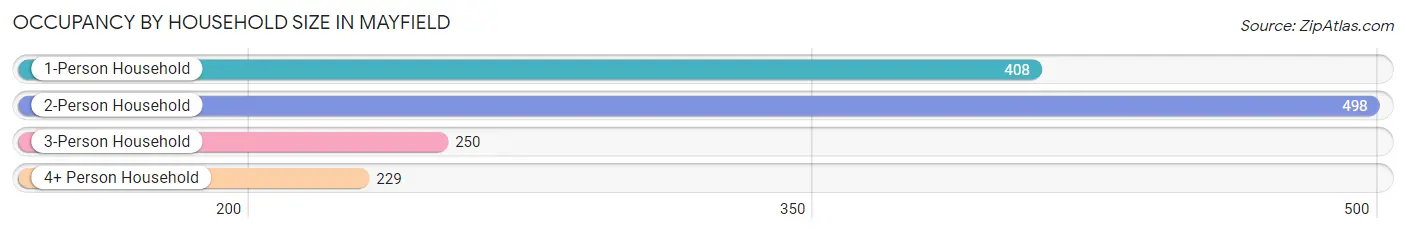
| Household Size | # Housing Units | % Housing Units |
| 1-Person Household | 408 | 29.5% |
| 2-Person Household | 498 | 36.0% |
| 3-Person Household | 250 | 18.0% |
| 4+ Person Household | 229 | 16.5% |
| Total Housing Units | 1,385 | 100.0% |
Occupancy by Ownership by Household Size in Mayfield
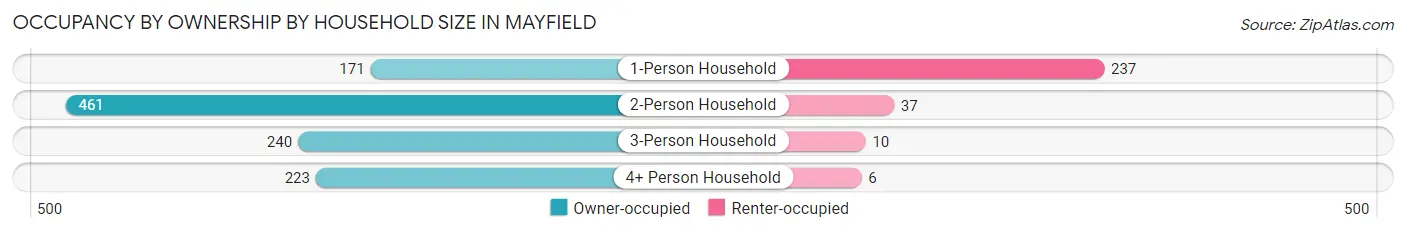
| Household Size | Owner-occupied | Renter-occupied |
| 1-Person Household | 171 (41.9%) | 237 (58.1%) |
| 2-Person Household | 461 (92.6%) | 37 (7.4%) |
| 3-Person Household | 240 (96.0%) | 10 (4.0%) |
| 4+ Person Household | 223 (97.4%) | 6 (2.6%) |
| Total Housing Units | 1,095 (79.1%) | 290 (20.9%) |
Occupancy by Educational Attainment in Mayfield
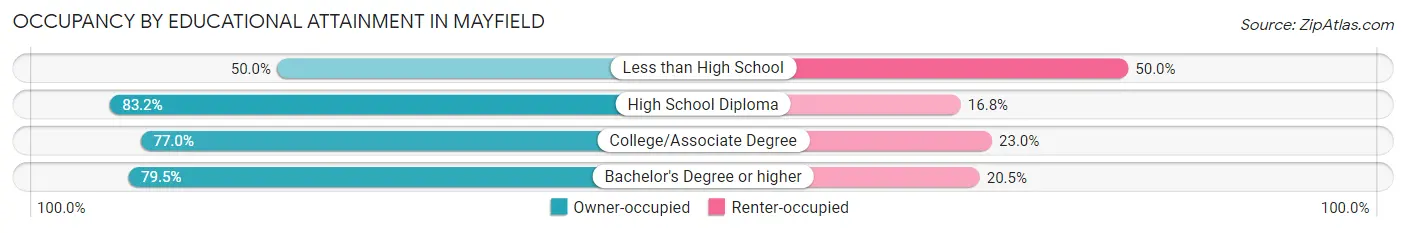
| Household Size | Owner-occupied | Renter-occupied |
| Less than High School | 10 (50.0%) | 10 (50.0%) |
| High School Diploma | 213 (83.2%) | 43 (16.8%) |
| College/Associate Degree | 288 (77.0%) | 86 (23.0%) |
| Bachelor's Degree or higher | 584 (79.5%) | 151 (20.5%) |
Occupancy by Age of Householder in Mayfield
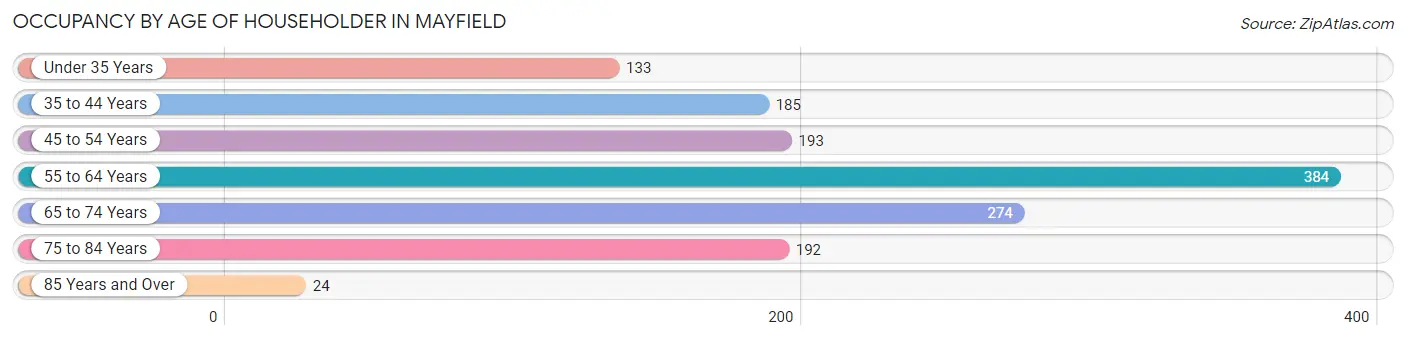
| Age Bracket | # Households | % Households |
| Under 35 Years | 133 | 9.6% |
| 35 to 44 Years | 185 | 13.4% |
| 45 to 54 Years | 193 | 13.9% |
| 55 to 64 Years | 384 | 27.7% |
| 65 to 74 Years | 274 | 19.8% |
| 75 to 84 Years | 192 | 13.9% |
| 85 Years and Over | 24 | 1.7% |
| Total | 1,385 | 100.0% |
Housing Finances in Mayfield
Median Income by Occupancy in Mayfield
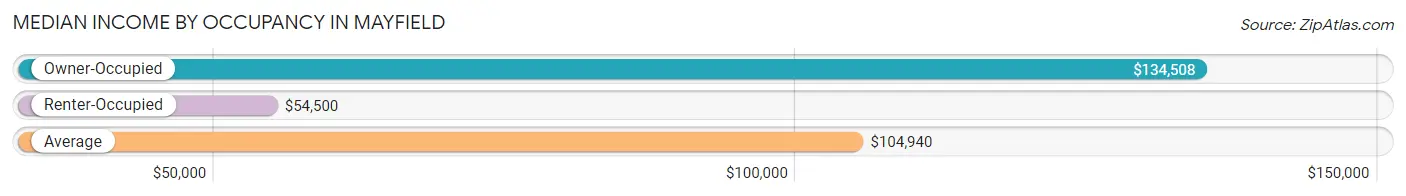
| Occupancy Type | # Households | Median Income |
| Owner-Occupied | 1,095 (79.1%) | $134,508 |
| Renter-Occupied | 290 (20.9%) | $54,500 |
| Average | 1,385 (100.0%) | $104,940 |
Occupancy by Householder Income Bracket in Mayfield
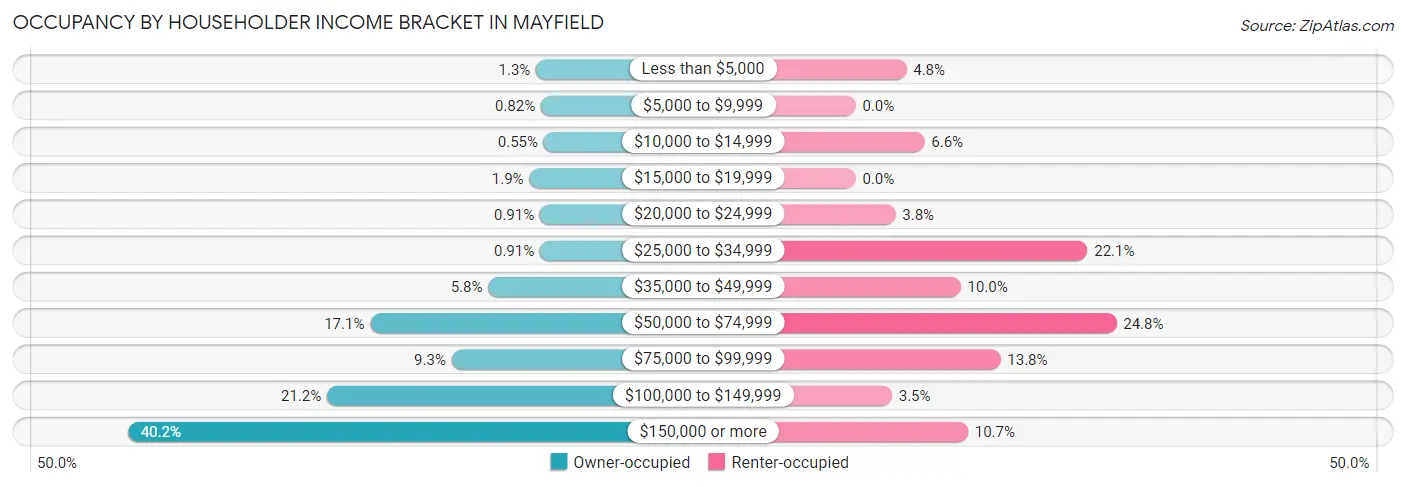
| Income Bracket | Owner-occupied | Renter-occupied |
| Less than $5,000 | 14 (1.3%) | 14 (4.8%) |
| $5,000 to $9,999 | 9 (0.8%) | 0 (0.0%) |
| $10,000 to $14,999 | 6 (0.5%) | 19 (6.6%) |
| $15,000 to $19,999 | 21 (1.9%) | 0 (0.0%) |
| $20,000 to $24,999 | 10 (0.9%) | 11 (3.8%) |
| $25,000 to $34,999 | 10 (0.9%) | 64 (22.1%) |
| $35,000 to $49,999 | 64 (5.8%) | 29 (10.0%) |
| $50,000 to $74,999 | 187 (17.1%) | 72 (24.8%) |
| $75,000 to $99,999 | 102 (9.3%) | 40 (13.8%) |
| $100,000 to $149,999 | 232 (21.2%) | 10 (3.5%) |
| $150,000 or more | 440 (40.2%) | 31 (10.7%) |
| Total | 1,095 (100.0%) | 290 (100.0%) |
Monthly Housing Cost Tiers in Mayfield
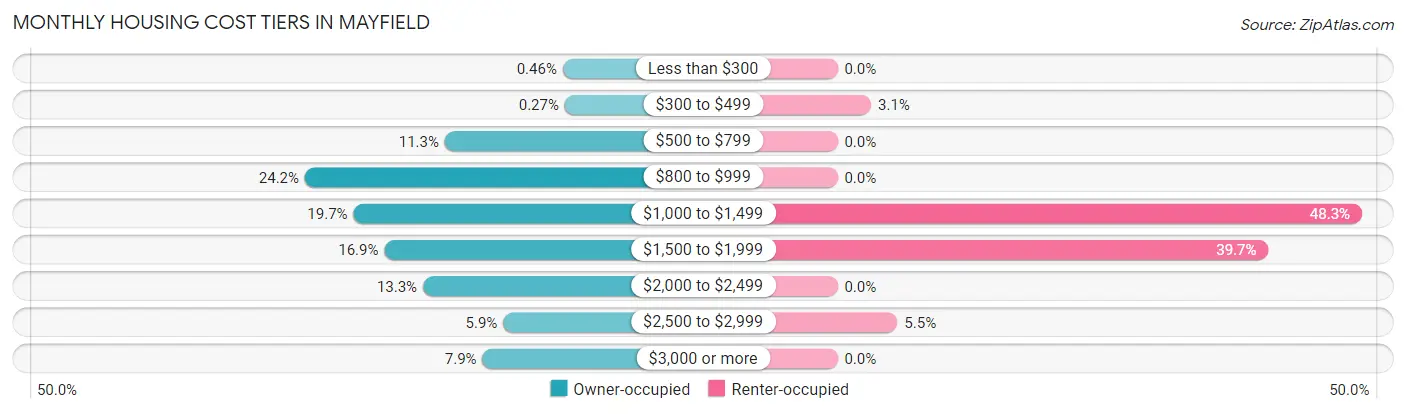
| Monthly Cost | Owner-occupied | Renter-occupied |
| Less than $300 | 5 (0.5%) | 0 (0.0%) |
| $300 to $499 | 3 (0.3%) | 9 (3.1%) |
| $500 to $799 | 124 (11.3%) | 0 (0.0%) |
| $800 to $999 | 265 (24.2%) | 0 (0.0%) |
| $1,000 to $1,499 | 216 (19.7%) | 140 (48.3%) |
| $1,500 to $1,999 | 185 (16.9%) | 115 (39.7%) |
| $2,000 to $2,499 | 146 (13.3%) | 0 (0.0%) |
| $2,500 to $2,999 | 65 (5.9%) | 16 (5.5%) |
| $3,000 or more | 86 (7.9%) | 0 (0.0%) |
| Total | 1,095 (100.0%) | 290 (100.0%) |
Physical Housing Characteristics in Mayfield
Housing Structures in Mayfield
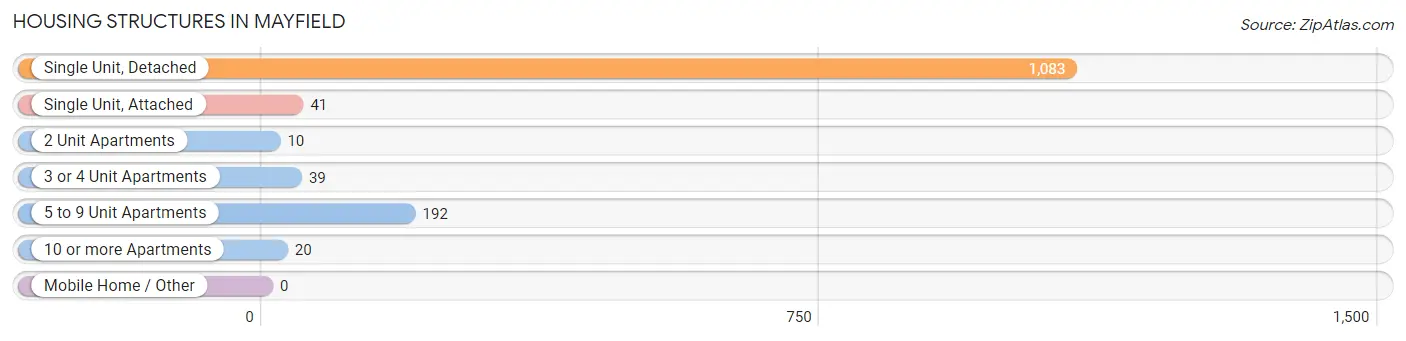
| Structure Type | # Housing Units | % Housing Units |
| Single Unit, Detached | 1,083 | 78.2% |
| Single Unit, Attached | 41 | 3.0% |
| 2 Unit Apartments | 10 | 0.7% |
| 3 or 4 Unit Apartments | 39 | 2.8% |
| 5 to 9 Unit Apartments | 192 | 13.9% |
| 10 or more Apartments | 20 | 1.4% |
| Mobile Home / Other | 0 | 0.0% |
| Total | 1,385 | 100.0% |
Housing Structures by Occupancy in Mayfield
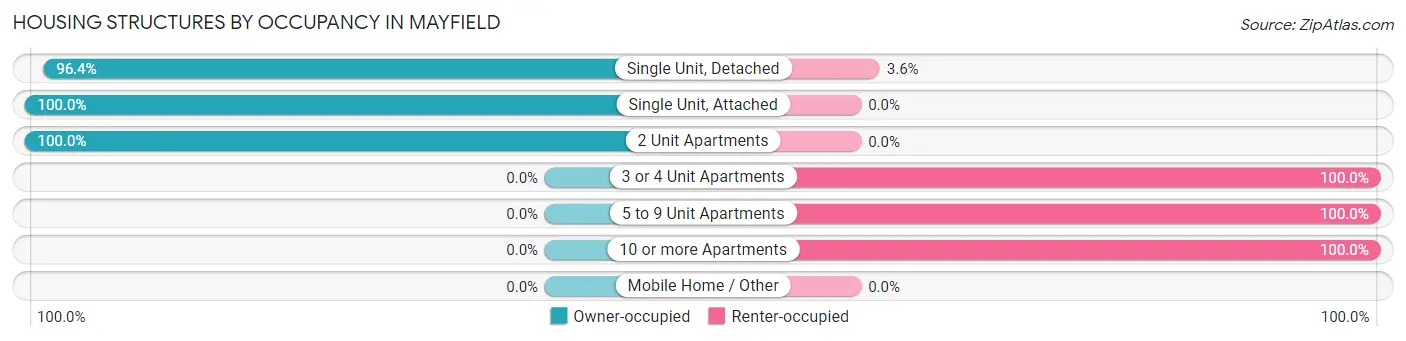
| Structure Type | Owner-occupied | Renter-occupied |
| Single Unit, Detached | 1,044 (96.4%) | 39 (3.6%) |
| Single Unit, Attached | 41 (100.0%) | 0 (0.0%) |
| 2 Unit Apartments | 10 (100.0%) | 0 (0.0%) |
| 3 or 4 Unit Apartments | 0 (0.0%) | 39 (100.0%) |
| 5 to 9 Unit Apartments | 0 (0.0%) | 192 (100.0%) |
| 10 or more Apartments | 0 (0.0%) | 20 (100.0%) |
| Mobile Home / Other | 0 (0.0%) | 0 (0.0%) |
| Total | 1,095 (79.1%) | 290 (20.9%) |
Housing Structures by Number of Rooms in Mayfield
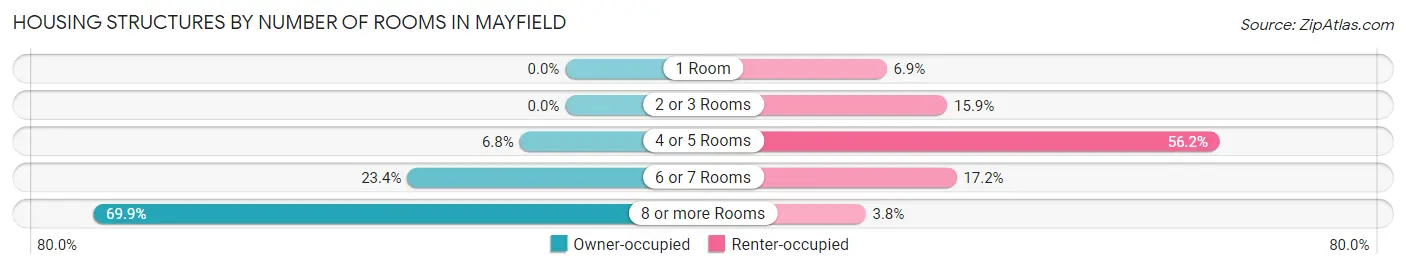
| Number of Rooms | Owner-occupied | Renter-occupied |
| 1 Room | 0 (0.0%) | 20 (6.9%) |
| 2 or 3 Rooms | 0 (0.0%) | 46 (15.9%) |
| 4 or 5 Rooms | 74 (6.8%) | 163 (56.2%) |
| 6 or 7 Rooms | 256 (23.4%) | 50 (17.2%) |
| 8 or more Rooms | 765 (69.9%) | 11 (3.8%) |
| Total | 1,095 (100.0%) | 290 (100.0%) |
Housing Structure by Heating Type in Mayfield
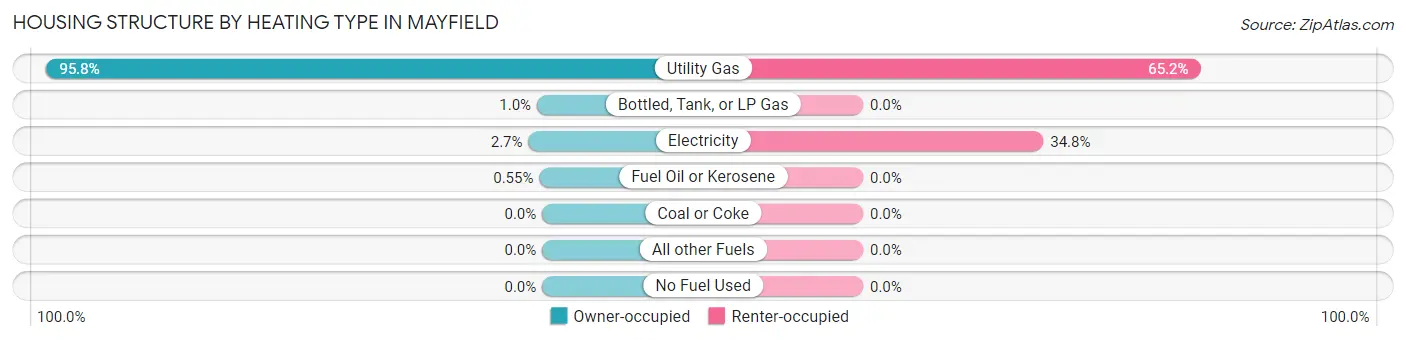
| Heating Type | Owner-occupied | Renter-occupied |
| Utility Gas | 1,049 (95.8%) | 189 (65.2%) |
| Bottled, Tank, or LP Gas | 11 (1.0%) | 0 (0.0%) |
| Electricity | 29 (2.6%) | 101 (34.8%) |
| Fuel Oil or Kerosene | 6 (0.5%) | 0 (0.0%) |
| Coal or Coke | 0 (0.0%) | 0 (0.0%) |
| All other Fuels | 0 (0.0%) | 0 (0.0%) |
| No Fuel Used | 0 (0.0%) | 0 (0.0%) |
| Total | 1,095 (100.0%) | 290 (100.0%) |
Household Vehicle Usage in Mayfield
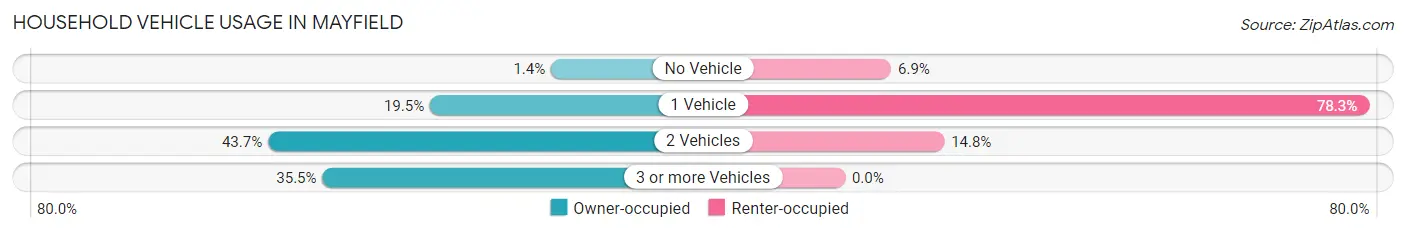
| Vehicles per Household | Owner-occupied | Renter-occupied |
| No Vehicle | 15 (1.4%) | 20 (6.9%) |
| 1 Vehicle | 213 (19.5%) | 227 (78.3%) |
| 2 Vehicles | 478 (43.6%) | 43 (14.8%) |
| 3 or more Vehicles | 389 (35.5%) | 0 (0.0%) |
| Total | 1,095 (100.0%) | 290 (100.0%) |
Real Estate & Mortgages in Mayfield
Real Estate and Mortgage Overview in Mayfield
| Characteristic | Without Mortgage | With Mortgage |
| Housing Units | 552 | 543 |
| Median Property Value | $282,400 | $269,700 |
| Median Household Income | $132,803 | $235 |
| Monthly Housing Costs | $933 | $86 |
| Real Estate Taxes | $6,559 | $9 |
Property Value by Mortgage Status in Mayfield
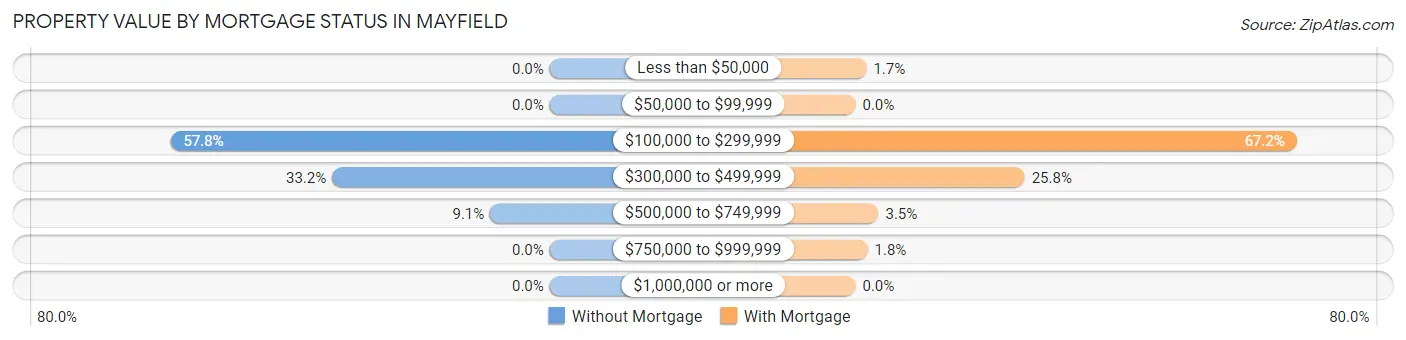
| Property Value | Without Mortgage | With Mortgage |
| Less than $50,000 | 0 (0.0%) | 9 (1.7%) |
| $50,000 to $99,999 | 0 (0.0%) | 0 (0.0%) |
| $100,000 to $299,999 | 319 (57.8%) | 365 (67.2%) |
| $300,000 to $499,999 | 183 (33.2%) | 140 (25.8%) |
| $500,000 to $749,999 | 50 (9.1%) | 19 (3.5%) |
| $750,000 to $999,999 | 0 (0.0%) | 10 (1.8%) |
| $1,000,000 or more | 0 (0.0%) | 0 (0.0%) |
| Total | 552 (100.0%) | 543 (100.0%) |
Household Income by Mortgage Status in Mayfield
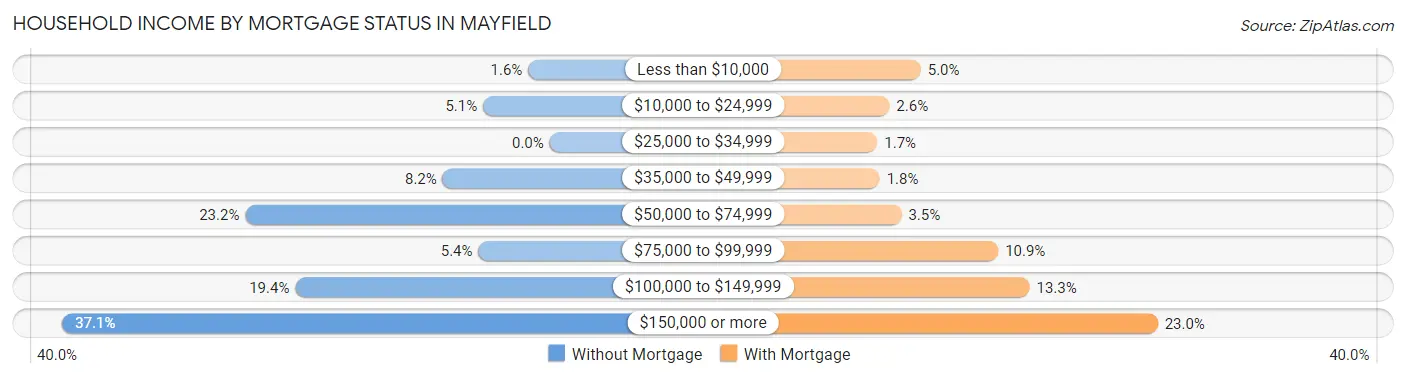
| Household Income | Without Mortgage | With Mortgage |
| Less than $10,000 | 9 (1.6%) | 27 (5.0%) |
| $10,000 to $24,999 | 28 (5.1%) | 14 (2.6%) |
| $25,000 to $34,999 | 0 (0.0%) | 9 (1.7%) |
| $35,000 to $49,999 | 45 (8.2%) | 10 (1.8%) |
| $50,000 to $74,999 | 128 (23.2%) | 19 (3.5%) |
| $75,000 to $99,999 | 30 (5.4%) | 59 (10.9%) |
| $100,000 to $149,999 | 107 (19.4%) | 72 (13.3%) |
| $150,000 or more | 205 (37.1%) | 125 (23.0%) |
| Total | 552 (100.0%) | 543 (100.0%) |
Property Value to Household Income Ratio in Mayfield
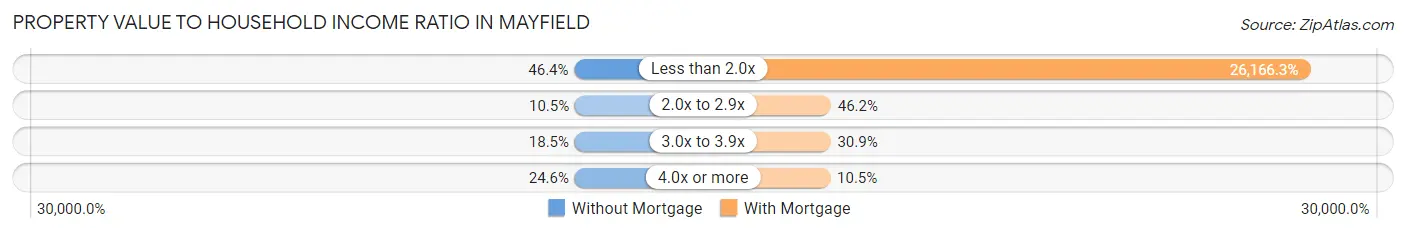
| Value-to-Income Ratio | Without Mortgage | With Mortgage |
| Less than 2.0x | 256 (46.4%) | 142,083 (26,166.3%) |
| 2.0x to 2.9x | 58 (10.5%) | 251 (46.2%) |
| 3.0x to 3.9x | 102 (18.5%) | 168 (30.9%) |
| 4.0x or more | 136 (24.6%) | 57 (10.5%) |
| Total | 552 (100.0%) | 543 (100.0%) |
Real Estate Taxes by Mortgage Status in Mayfield
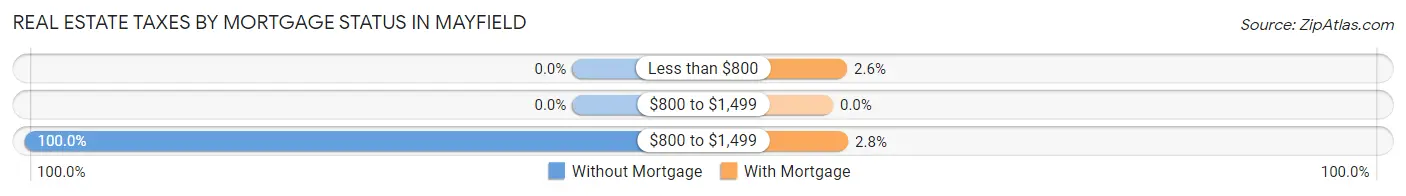
| Property Taxes | Without Mortgage | With Mortgage |
| Less than $800 | 0 (0.0%) | 14 (2.6%) |
| $800 to $1,499 | 0 (0.0%) | 0 (0.0%) |
| $800 to $1,499 | 552 (100.0%) | 15 (2.8%) |
| Total | 552 (100.0%) | 543 (100.0%) |
Health & Disability in Mayfield
Health Insurance Coverage by Age in Mayfield
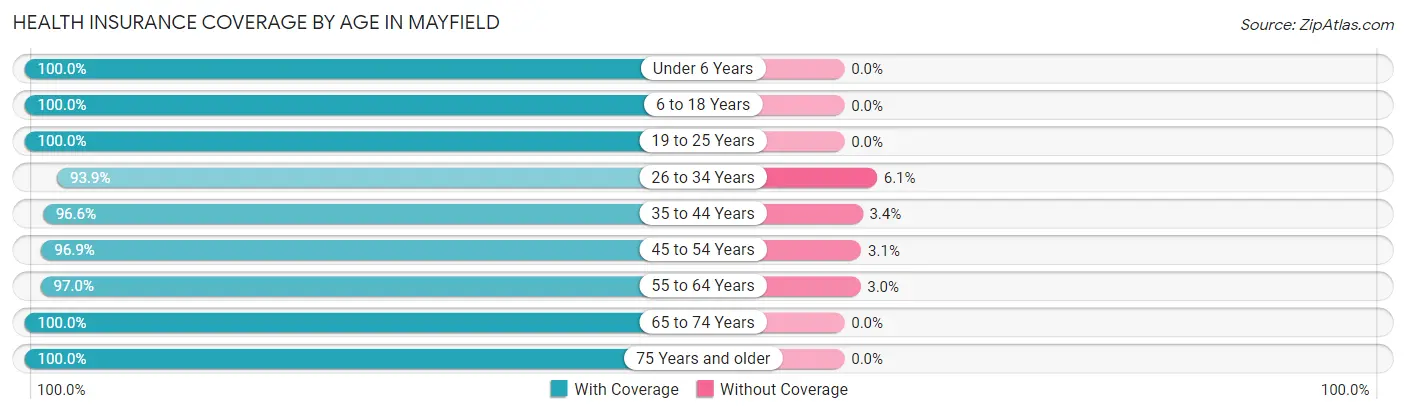
| Age Bracket | With Coverage | Without Coverage |
| Under 6 Years | 145 (100.0%) | 0 (0.0%) |
| 6 to 18 Years | 566 (100.0%) | 0 (0.0%) |
| 19 to 25 Years | 234 (100.0%) | 0 (0.0%) |
| 26 to 34 Years | 217 (93.9%) | 14 (6.1%) |
| 35 to 44 Years | 371 (96.6%) | 13 (3.4%) |
| 45 to 54 Years | 339 (96.9%) | 11 (3.1%) |
| 55 to 64 Years | 619 (97.0%) | 19 (3.0%) |
| 65 to 74 Years | 478 (100.0%) | 0 (0.0%) |
| 75 Years and older | 308 (100.0%) | 0 (0.0%) |
| Total | 3,277 (98.3%) | 57 (1.7%) |
Health Insurance Coverage by Citizenship Status in Mayfield
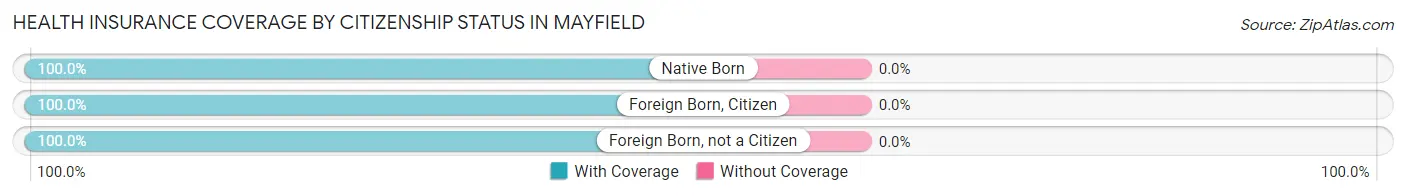
| Citizenship Status | With Coverage | Without Coverage |
| Native Born | 145 (100.0%) | 0 (0.0%) |
| Foreign Born, Citizen | 566 (100.0%) | 0 (0.0%) |
| Foreign Born, not a Citizen | 234 (100.0%) | 0 (0.0%) |
Health Insurance Coverage by Household Income in Mayfield
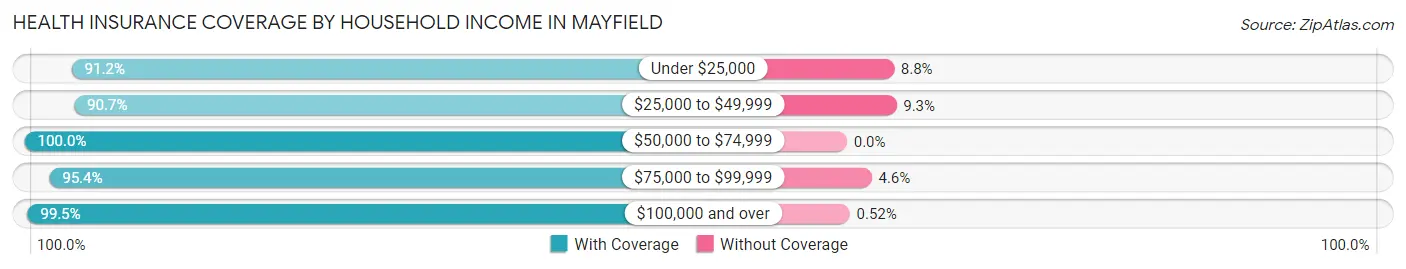
| Household Income | With Coverage | Without Coverage |
| Under $25,000 | 145 (91.2%) | 14 (8.8%) |
| $25,000 to $49,999 | 186 (90.7%) | 19 (9.3%) |
| $50,000 to $74,999 | 553 (100.0%) | 0 (0.0%) |
| $75,000 to $99,999 | 268 (95.4%) | 13 (4.6%) |
| $100,000 and over | 2,103 (99.5%) | 11 (0.5%) |
Public vs Private Health Insurance Coverage by Age in Mayfield
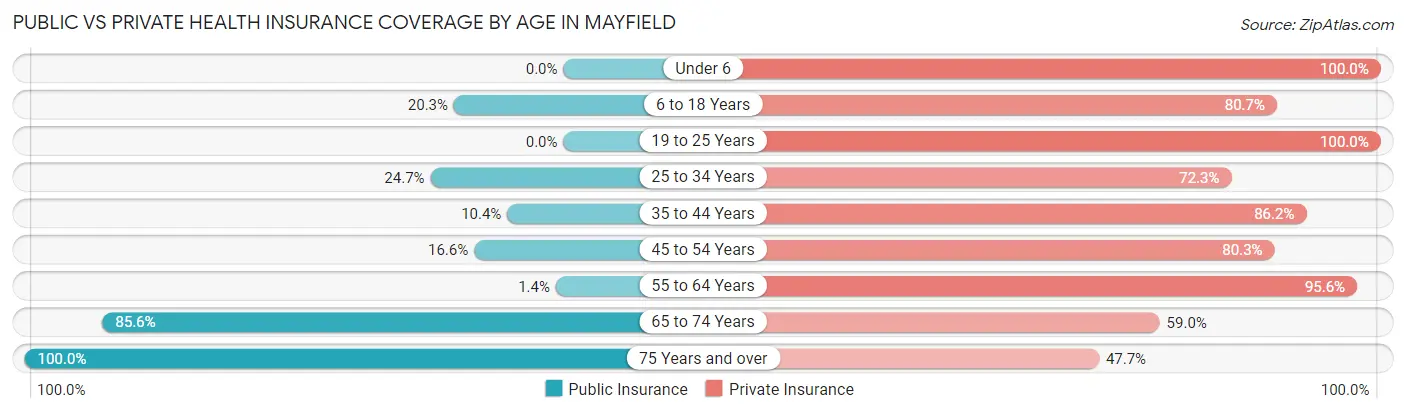
| Age Bracket | Public Insurance | Private Insurance |
| Under 6 | 0 (0.0%) | 145 (100.0%) |
| 6 to 18 Years | 115 (20.3%) | 457 (80.7%) |
| 19 to 25 Years | 0 (0.0%) | 234 (100.0%) |
| 25 to 34 Years | 57 (24.7%) | 167 (72.3%) |
| 35 to 44 Years | 40 (10.4%) | 331 (86.2%) |
| 45 to 54 Years | 58 (16.6%) | 281 (80.3%) |
| 55 to 64 Years | 9 (1.4%) | 610 (95.6%) |
| 65 to 74 Years | 409 (85.6%) | 282 (59.0%) |
| 75 Years and over | 308 (100.0%) | 147 (47.7%) |
| Total | 996 (29.9%) | 2,654 (79.6%) |
Disability Status by Sex by Age in Mayfield
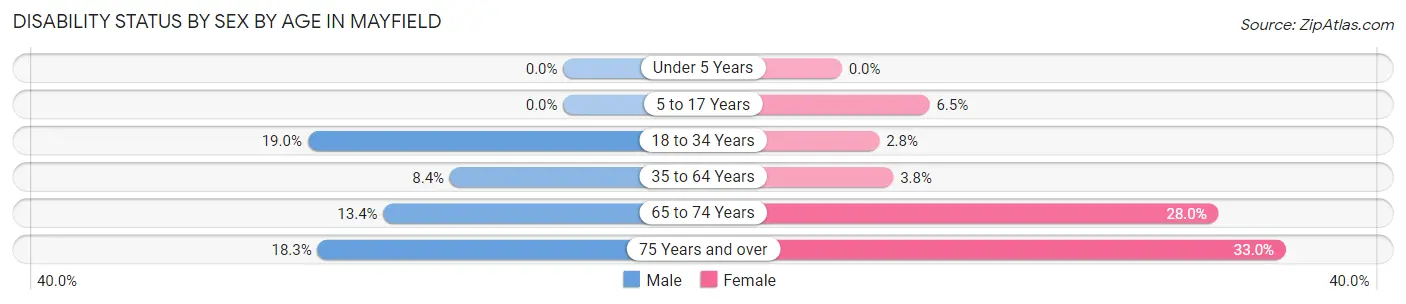
| Age Bracket | Male | Female |
| Under 5 Years | 0 (0.0%) | 0 (0.0%) |
| 5 to 17 Years | 0 (0.0%) | 20 (6.5%) |
| 18 to 34 Years | 56 (19.0%) | 7 (2.8%) |
| 35 to 64 Years | 56 (8.4%) | 27 (3.8%) |
| 65 to 74 Years | 29 (13.4%) | 73 (28.0%) |
| 75 Years and over | 23 (18.2%) | 60 (33.0%) |
Disability Class by Sex by Age in Mayfield
Disability Class: Hearing Difficulty
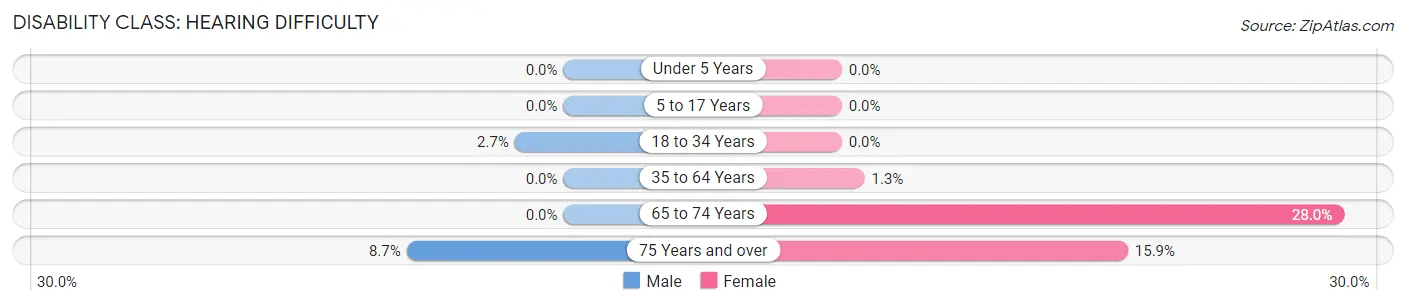
| Age Bracket | Male | Female |
| Under 5 Years | 0 (0.0%) | 0 (0.0%) |
| 5 to 17 Years | 0 (0.0%) | 0 (0.0%) |
| 18 to 34 Years | 8 (2.7%) | 0 (0.0%) |
| 35 to 64 Years | 0 (0.0%) | 9 (1.3%) |
| 65 to 74 Years | 0 (0.0%) | 73 (28.0%) |
| 75 Years and over | 11 (8.7%) | 29 (15.9%) |
Disability Class: Vision Difficulty
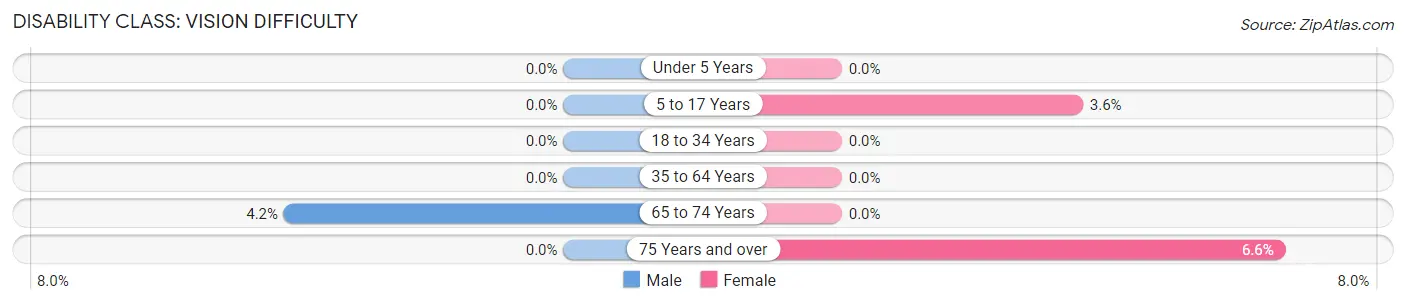
| Age Bracket | Male | Female |
| Under 5 Years | 0 (0.0%) | 0 (0.0%) |
| 5 to 17 Years | 0 (0.0%) | 11 (3.6%) |
| 18 to 34 Years | 0 (0.0%) | 0 (0.0%) |
| 35 to 64 Years | 0 (0.0%) | 0 (0.0%) |
| 65 to 74 Years | 9 (4.2%) | 0 (0.0%) |
| 75 Years and over | 0 (0.0%) | 12 (6.6%) |
Disability Class: Cognitive Difficulty
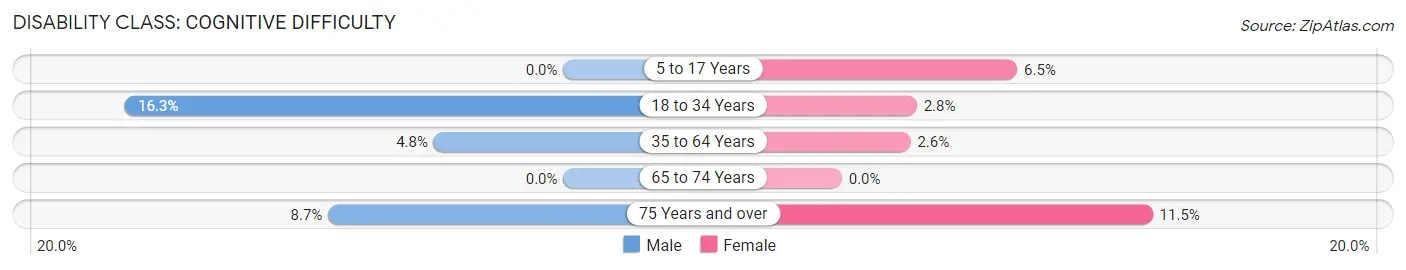
| Age Bracket | Male | Female |
| 5 to 17 Years | 0 (0.0%) | 20 (6.5%) |
| 18 to 34 Years | 48 (16.3%) | 7 (2.8%) |
| 35 to 64 Years | 32 (4.8%) | 18 (2.5%) |
| 65 to 74 Years | 0 (0.0%) | 0 (0.0%) |
| 75 Years and over | 11 (8.7%) | 21 (11.5%) |
Disability Class: Ambulatory Difficulty
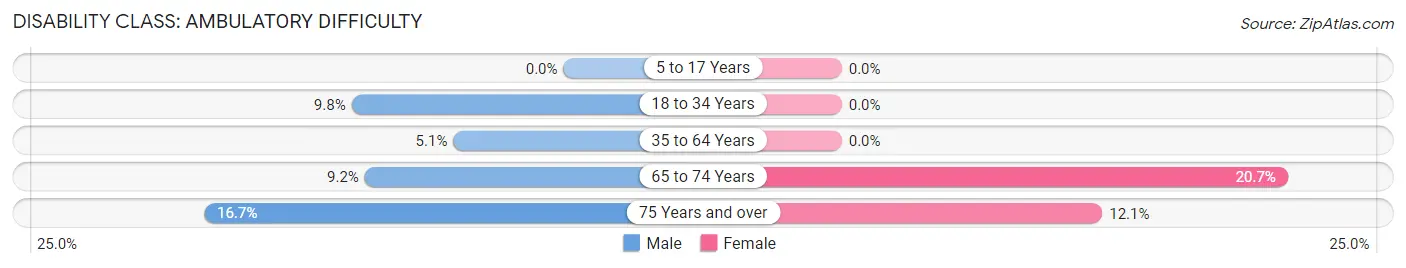
| Age Bracket | Male | Female |
| 5 to 17 Years | 0 (0.0%) | 0 (0.0%) |
| 18 to 34 Years | 29 (9.8%) | 0 (0.0%) |
| 35 to 64 Years | 34 (5.1%) | 0 (0.0%) |
| 65 to 74 Years | 20 (9.2%) | 54 (20.7%) |
| 75 Years and over | 21 (16.7%) | 22 (12.1%) |
Disability Class: Self-Care Difficulty
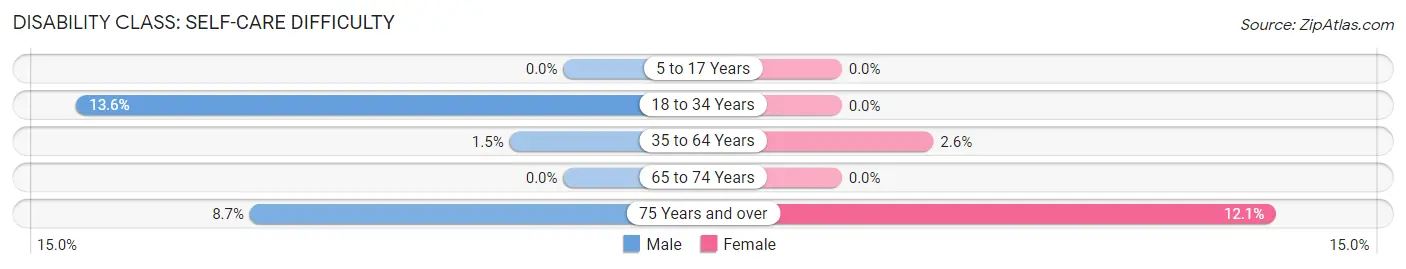
| Age Bracket | Male | Female |
| 5 to 17 Years | 0 (0.0%) | 0 (0.0%) |
| 18 to 34 Years | 40 (13.6%) | 0 (0.0%) |
| 35 to 64 Years | 10 (1.5%) | 18 (2.5%) |
| 65 to 74 Years | 0 (0.0%) | 0 (0.0%) |
| 75 Years and over | 11 (8.7%) | 22 (12.1%) |
Technology Access in Mayfield
Computing Device Access in Mayfield
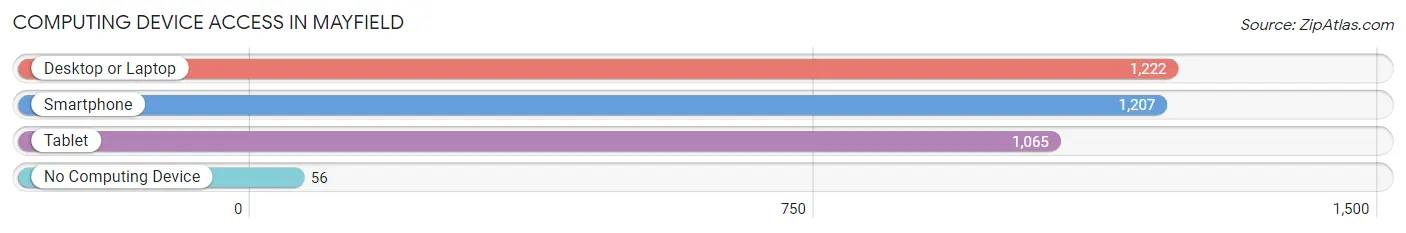
| Device Type | # Households | % Households |
| Desktop or Laptop | 1,222 | 88.2% |
| Smartphone | 1,207 | 87.2% |
| Tablet | 1,065 | 76.9% |
| No Computing Device | 56 | 4.0% |
| Total | 1,385 | 100.0% |
Internet Access in Mayfield
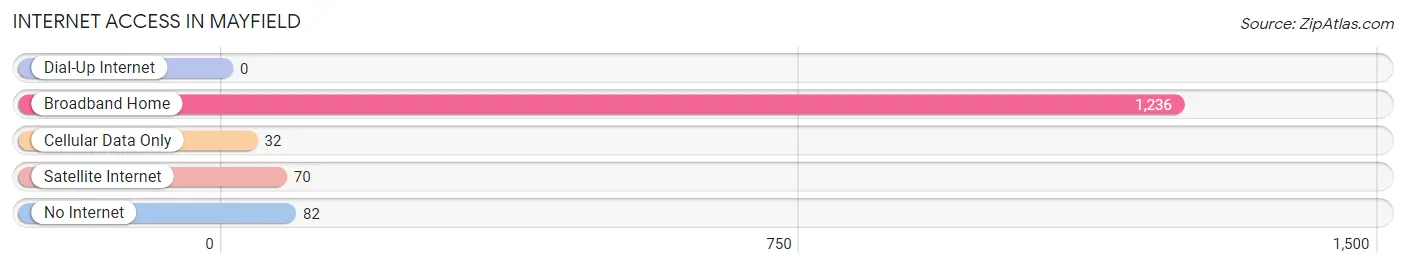
| Internet Type | # Households | % Households |
| Dial-Up Internet | 0 | 0.0% |
| Broadband Home | 1,236 | 89.2% |
| Cellular Data Only | 32 | 2.3% |
| Satellite Internet | 70 | 5.1% |
| No Internet | 82 | 5.9% |
| Total | 1,385 | 100.0% |
Mayfield Summary
Mayfield, Ohio is a small city located in Cuyahoga County, Ohio. It is part of the Greater Cleveland metropolitan area and is located about 10 miles east of downtown Cleveland. The city has a population of approximately 8,000 people and is known for its small-town charm and close-knit community.
History
Mayfield was founded in 1815 by a group of settlers from Connecticut. The town was named after the Mayfield family, who were among the first settlers. The town was originally a farming community, but it soon developed into a small industrial center. In the late 19th century, the town was home to several factories, including a paper mill, a brickyard, and a sawmill.
In the early 20th century, Mayfield experienced a period of growth and development. The town was incorporated in 1921 and the population grew to over 4,000 by the 1930s. During this time, the town was home to several businesses, including a bank, a movie theater, and a variety of stores.
Geography
Mayfield is located in Cuyahoga County, Ohio. It is situated on the east side of the Cuyahoga River, about 10 miles east of downtown Cleveland. The city covers an area of about 2.5 square miles and is bordered by the cities of Cleveland Heights, Euclid, and South Euclid.
The terrain of Mayfield is mostly flat, with some rolling hills in the northern part of the city. The city is home to several parks, including Mayfield Park, which features a playground, a walking path, and a pond.
Economy
Mayfield’s economy is largely based on the service industry. The city is home to several restaurants, retail stores, and other businesses. The city is also home to several medical facilities, including the Cleveland Clinic and University Hospitals.
The city is also home to several manufacturing companies, including a paper mill, a brickyard, and a sawmill. The city is also home to several small businesses, including a bakery, a florist, and a furniture store.
Demographics
As of the 2010 census, the population of Mayfield was 8,000. The racial makeup of the city was 79.3% White, 14.2% African American, 0.3% Native American, 1.2% Asian, and 4.9% from other races. The median household income was $45,000 and the median family income was $51,000.
Mayfield is a diverse city with a variety of cultures and backgrounds. The city is home to a large number of immigrants, including those from Mexico, India, and China. The city is also home to a large number of religious organizations, including churches, synagogues, and mosques.
Mayfield is a small city with a close-knit community. The city is known for its small-town charm and its friendly atmosphere. The city is home to several parks, businesses, and other attractions, making it a great place to live and work.
Common Questions
What is the Total Population of Mayfield?
Total Population of Mayfield is 3,344.
What is the Total Male Population of Mayfield?
Total Male Population of Mayfield is 1,586.
What is the Total Female Population of Mayfield?
Total Female Population of Mayfield is 1,758.
What is the Ratio of Males per 100 Females in Mayfield?
There are 90.22 Males per 100 Females in Mayfield.
What is the Ratio of Females per 100 Males in Mayfield?
There are 110.84 Females per 100 Males in Mayfield.
What is the Median Population Age in Mayfield?
Median Population Age in Mayfield is 48.7 Years.
What is the Average Family Size in Mayfield
Average Family Size in Mayfield is 2.9 People.
What is the Average Household Size in Mayfield
Average Household Size in Mayfield is 2.4 People.
What is Per Capita Income in Mayfield?
Per Capita income in Mayfield is $55,271.
What is the Median Family Income in Mayfield?
Median Family Income in Mayfield is $141,314.
What is the Median Household income in Mayfield?
Median Household Income in Mayfield is $104,940.
What is Income or Wage Gap in Mayfield?
Income or Wage Gap in Mayfield is 26.2%.
Women in Mayfield earn 73.8 cents for every dollar earned by a man.
What is Inequality or Gini Index in Mayfield?
Inequality or Gini Index in Mayfield is 0.40.
How Large is the Labor Force in Mayfield?
There are 1,965 People in the Labor Forcein in Mayfield.
What is the Percentage of People in the Labor Force in Mayfield?
68.8% of People are in the Labor Force in Mayfield.
What is the Unemployment Rate in Mayfield?
Unemployment Rate in Mayfield is 8.2%.