Wildwood, NJ
Wildwood Map
Wildwood Overview
5,164
TOTAL POPULATION
2,529
MALE POPULATION
2,635
FEMALE POPULATION
95.98
MALES / 100 FEMALES
104.19
FEMALES / 100 MALES
47.6
MEDIAN AGE
2.5
AVG FAMILY SIZE
2.1
AVG HOUSEHOLD SIZE
$43,732
PER CAPITA INCOME
$68,222
AVG FAMILY INCOME
$49,131
AVG HOUSEHOLD INCOME
19.3%
WAGE / INCOME GAP [ % ]
80.7¢/ $1
WAGE / INCOME GAP [ $ ]
$10,596
FAMILY INCOME DEFICIT
0.55
INEQUALITY / GINI INDEX
2,520
LABOR FORCE [ PEOPLE ]
58.5%
PERCENT IN LABOR FORCE
9.2%
UNEMPLOYMENT RATE
Wildwood Zip Codes
Wildwood Area Codes
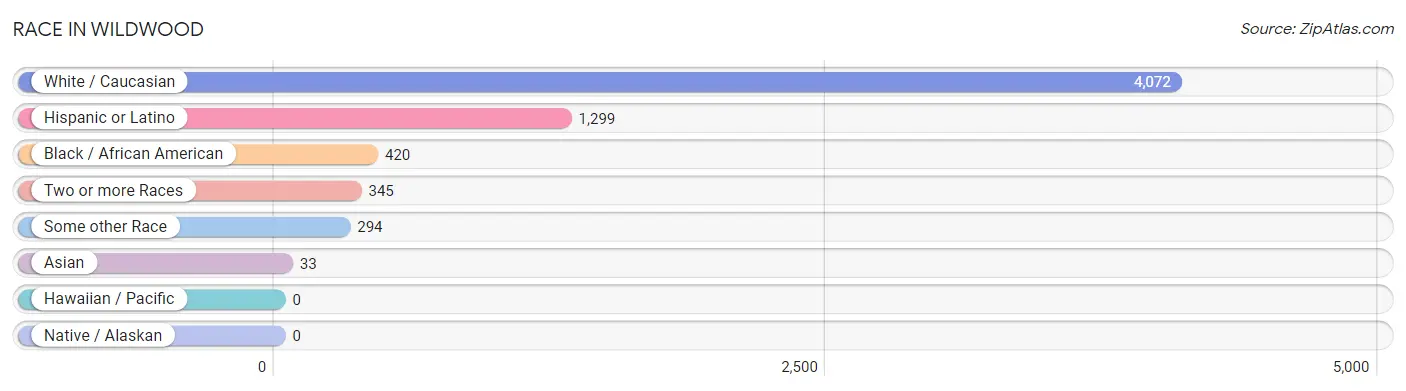
Race in Wildwood
The most populous races in Wildwood are White / Caucasian (4,072 | 78.8%), Hispanic or Latino (1,299 | 25.2%), and Black / African American (420 | 8.1%).
| Race | # Population | % Population |
| Asian | 33 | 0.6% |
| Black / African American | 420 | 8.1% |
| Hawaiian / Pacific | 0 | 0.0% |
| Hispanic or Latino | 1,299 | 25.2% |
| Native / Alaskan | 0 | 0.0% |
| White / Caucasian | 4,072 | 78.8% |
| Two or more Races | 345 | 6.7% |
| Some other Race | 294 | 5.7% |
| Total | 5,164 | 100.0% |
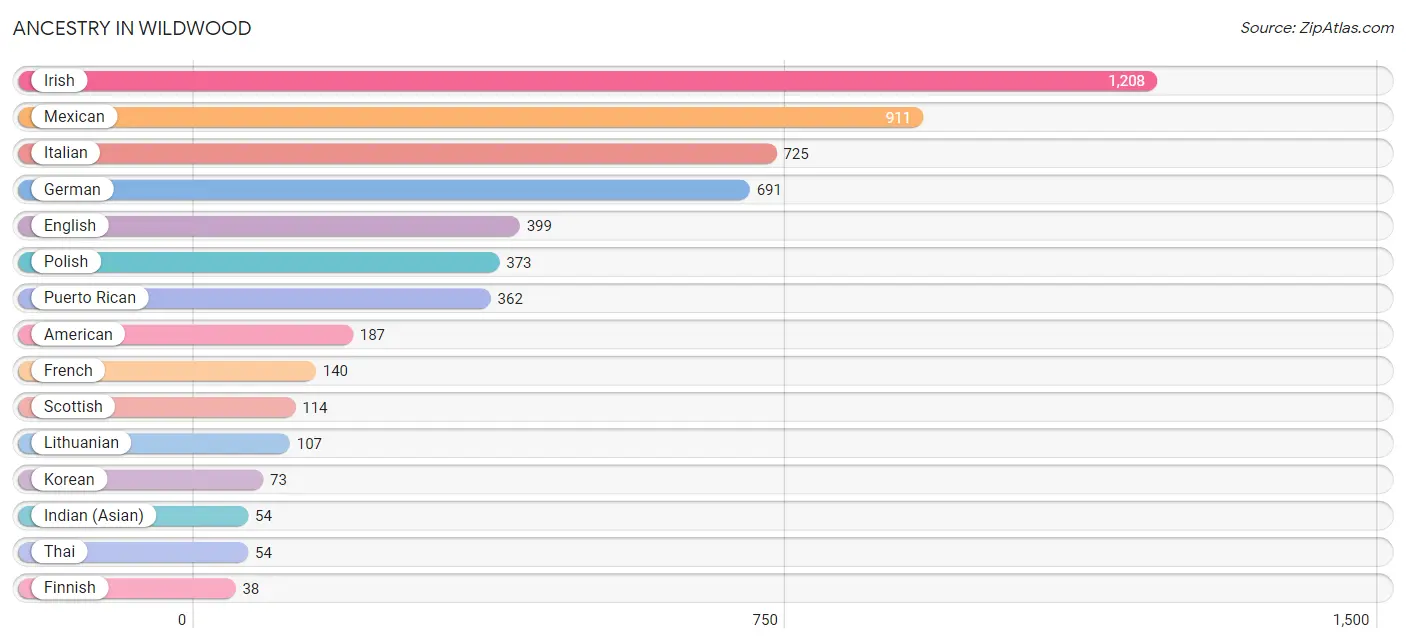
Ancestry in Wildwood
The most populous ancestries reported in Wildwood are Irish (1,208 | 23.4%), Mexican (911 | 17.6%), Italian (725 | 14.0%), German (691 | 13.4%), and English (399 | 7.7%), together accounting for 76.2% of all Wildwood residents.
| Ancestry | # Population | % Population |
| African | 19 | 0.4% |
| American | 187 | 3.6% |
| Austrian | 22 | 0.4% |
| Dutch | 27 | 0.5% |
| Eastern European | 12 | 0.2% |
| English | 399 | 7.7% |
| Finnish | 38 | 0.7% |
| French | 140 | 2.7% |
| German | 691 | 13.4% |
| Greek | 24 | 0.5% |
| Hungarian | 17 | 0.3% |
| Indian (Asian) | 54 | 1.1% |
| Irish | 1,208 | 23.4% |
| Italian | 725 | 14.0% |
| Korean | 73 | 1.4% |
| Lithuanian | 107 | 2.1% |
| Mexican | 911 | 17.6% |
| Northern European | 11 | 0.2% |
| Norwegian | 38 | 0.7% |
| Polish | 373 | 7.2% |
| Puerto Rican | 362 | 7.0% |
| Romanian | 29 | 0.6% |
| Scottish | 114 | 2.2% |
| Slovak | 17 | 0.3% |
| Subsaharan African | 19 | 0.4% |
| Swedish | 11 | 0.2% |
| Thai | 54 | 1.1% |
| Vietnamese | 14 | 0.3% | View All 28 Rows |
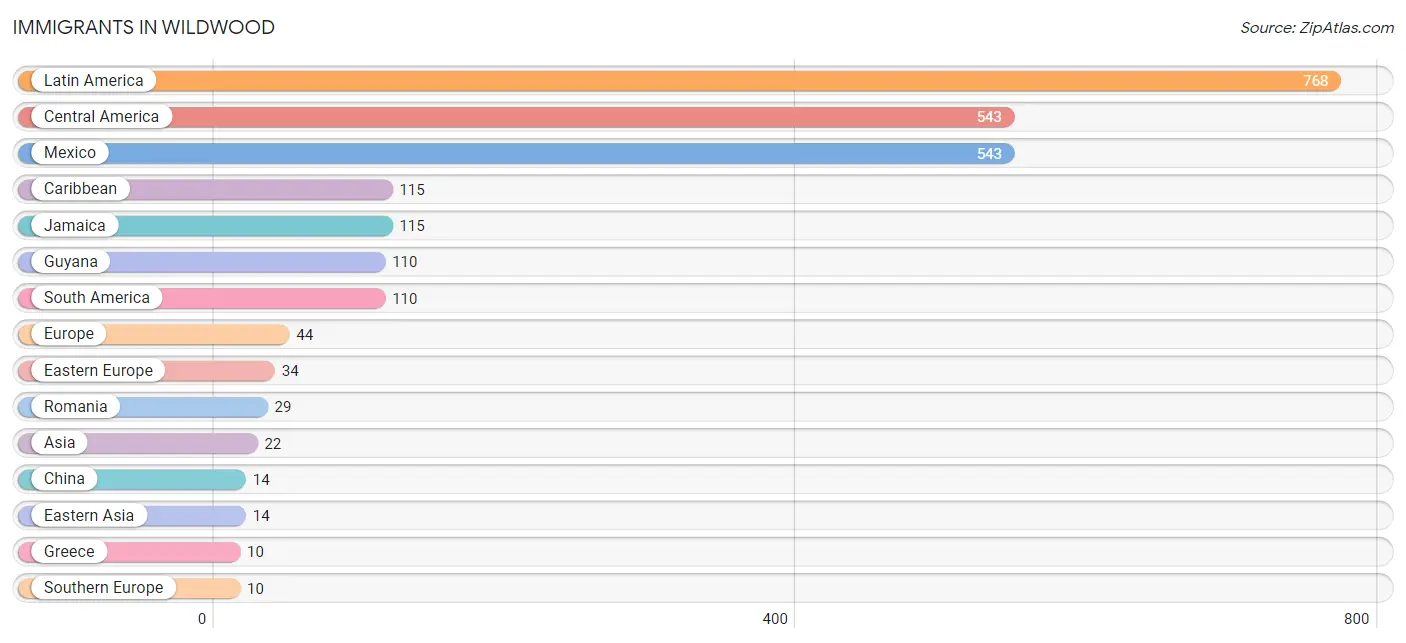
Immigrants in Wildwood
The most numerous immigrant groups reported in Wildwood came from Latin America (768 | 14.9%), Central America (543 | 10.5%), Mexico (543 | 10.5%), Caribbean (115 | 2.2%), and Jamaica (115 | 2.2%), together accounting for 40.4% of all Wildwood residents.
| Immigration Origin | # Population | % Population |
| Asia | 22 | 0.4% |
| Caribbean | 115 | 2.2% |
| Central America | 543 | 10.5% |
| China | 14 | 0.3% |
| Eastern Asia | 14 | 0.3% |
| Eastern Europe | 34 | 0.7% |
| Europe | 44 | 0.9% |
| Greece | 10 | 0.2% |
| Guyana | 110 | 2.1% |
| Jamaica | 115 | 2.2% |
| Latin America | 768 | 14.9% |
| Mexico | 543 | 10.5% |
| Philippines | 8 | 0.2% |
| Poland | 5 | 0.1% |
| Romania | 29 | 0.6% |
| South America | 110 | 2.1% |
| South Eastern Asia | 8 | 0.2% |
| Southern Europe | 10 | 0.2% | View All 18 Rows |
Sex and Age in Wildwood
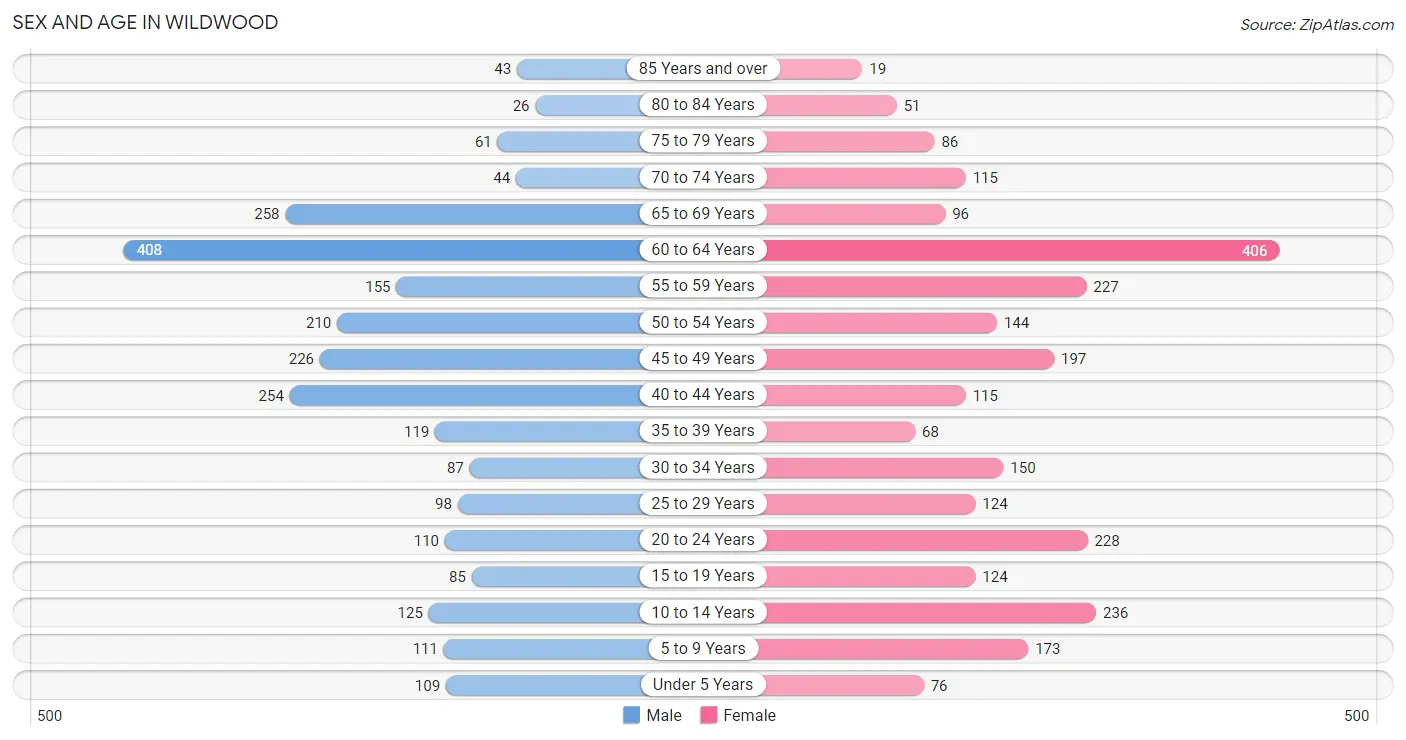
Sex and Age in Wildwood
The most populous age groups in Wildwood are 60 to 64 Years (408 | 16.1%) for men and 60 to 64 Years (406 | 15.4%) for women.
| Age Bracket | Male | Female |
| Under 5 Years | 109 (4.3%) | 76 (2.9%) |
| 5 to 9 Years | 111 (4.4%) | 173 (6.6%) |
| 10 to 14 Years | 125 (4.9%) | 236 (9.0%) |
| 15 to 19 Years | 85 (3.4%) | 124 (4.7%) |
| 20 to 24 Years | 110 (4.3%) | 228 (8.6%) |
| 25 to 29 Years | 98 (3.9%) | 124 (4.7%) |
| 30 to 34 Years | 87 (3.4%) | 150 (5.7%) |
| 35 to 39 Years | 119 (4.7%) | 68 (2.6%) |
| 40 to 44 Years | 254 (10.0%) | 115 (4.4%) |
| 45 to 49 Years | 226 (8.9%) | 197 (7.5%) |
| 50 to 54 Years | 210 (8.3%) | 144 (5.5%) |
| 55 to 59 Years | 155 (6.1%) | 227 (8.6%) |
| 60 to 64 Years | 408 (16.1%) | 406 (15.4%) |
| 65 to 69 Years | 258 (10.2%) | 96 (3.6%) |
| 70 to 74 Years | 44 (1.7%) | 115 (4.4%) |
| 75 to 79 Years | 61 (2.4%) | 86 (3.3%) |
| 80 to 84 Years | 26 (1.0%) | 51 (1.9%) |
| 85 Years and over | 43 (1.7%) | 19 (0.7%) |
| Total | 2,529 (100.0%) | 2,635 (100.0%) |
Families and Households in Wildwood
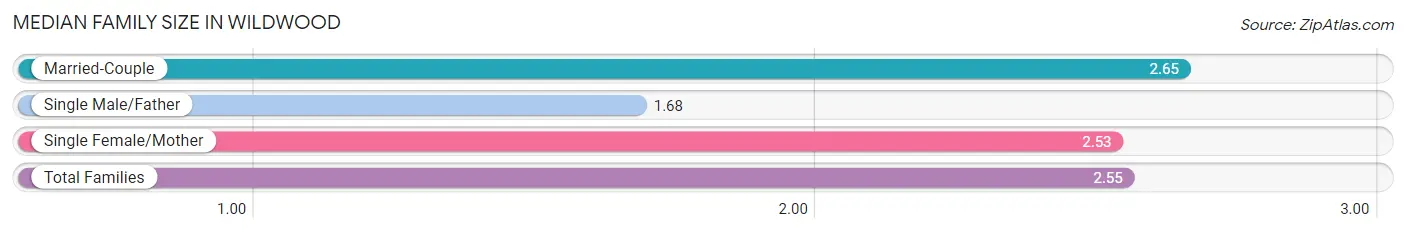
Median Family Size in Wildwood
The median family size in Wildwood is 2.55 persons per family, with married-couple families (1,085 | 71.2%) accounting for the largest median family size of 2.65 persons per family. On the other hand, single male/father families (105 | 6.9%) represent the smallest median family size with 1.68 persons per family.
| Family Type | # Families | Family Size |
| Married-Couple | 1,085 (71.2%) | 2.65 |
| Single Male/Father | 105 (6.9%) | 1.68 |
| Single Female/Mother | 333 (21.9%) | 2.53 |
| Total Families | 1,523 (100.0%) | 2.55 |
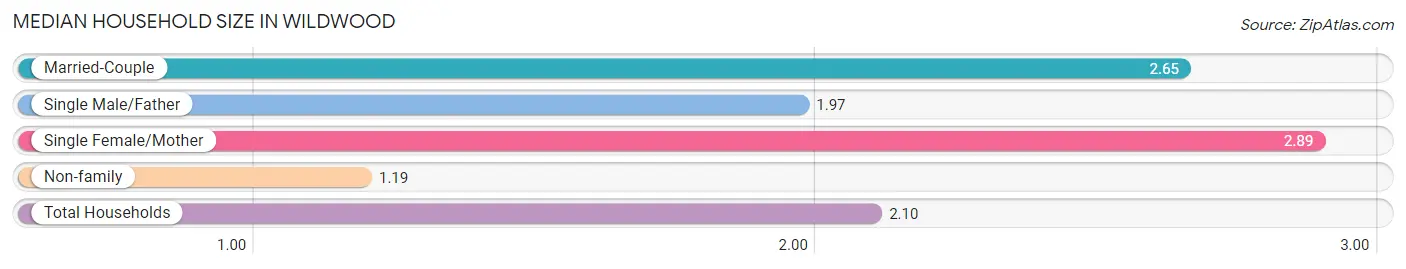
Median Household Size in Wildwood
The median household size in Wildwood is 2.10 persons per household, with single female/mother households (333 | 13.5%) accounting for the largest median household size of 2.89 persons per household. non-family households (938 | 38.1%) represent the smallest median household size with 1.19 persons per household.
| Household Type | # Households | Household Size |
| Married-Couple | 1,085 (44.1%) | 2.65 |
| Single Male/Father | 105 (4.3%) | 1.97 |
| Single Female/Mother | 333 (13.5%) | 2.89 |
| Non-family | 938 (38.1%) | 1.19 |
| Total Households | 2,461 (100.0%) | 2.10 |
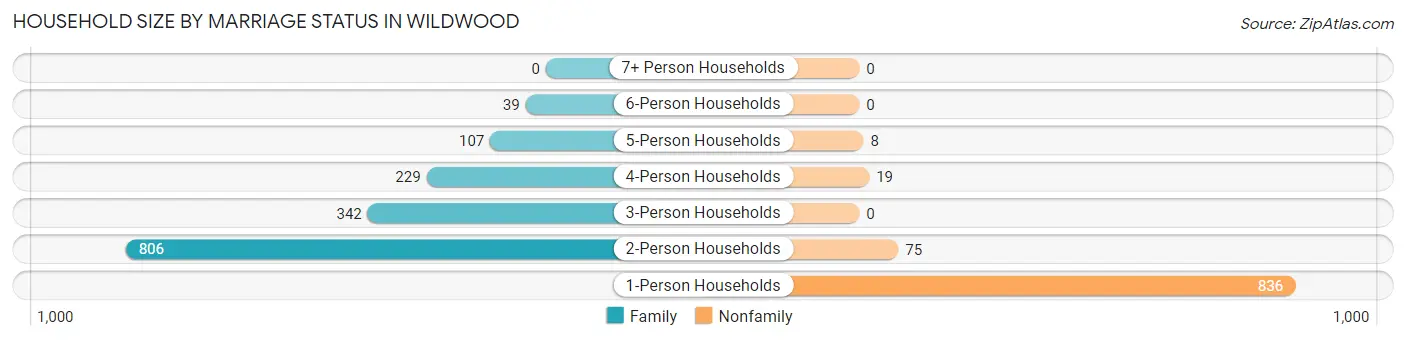
Household Size by Marriage Status in Wildwood
Out of a total of 2,461 households in Wildwood, 1,523 (61.9%) are family households, while 938 (38.1%) are nonfamily households. The most numerous type of family households are 2-person households, comprising 806, and the most common type of nonfamily households are 1-person households, comprising 836.
| Household Size | Family Households | Nonfamily Households |
| 1-Person Households | - | 836 (34.0%) |
| 2-Person Households | 806 (32.8%) | 75 (3.0%) |
| 3-Person Households | 342 (13.9%) | 0 (0.0%) |
| 4-Person Households | 229 (9.3%) | 19 (0.8%) |
| 5-Person Households | 107 (4.3%) | 8 (0.3%) |
| 6-Person Households | 39 (1.6%) | 0 (0.0%) |
| 7+ Person Households | 0 (0.0%) | 0 (0.0%) |
| Total | 1,523 (61.9%) | 938 (38.1%) |
Female Fertility in Wildwood
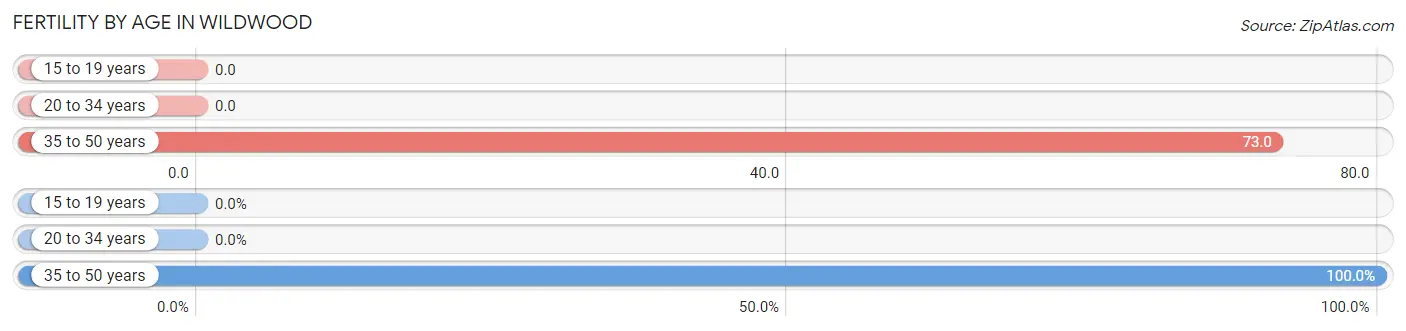
Fertility by Age in Wildwood
Average fertility rate in Wildwood is 30.0 births per 1,000 women. Women in the age bracket of 35 to 50 years have the highest fertility rate with 73.0 births per 1,000 women. Women in the age bracket of 35 to 50 years acount for 100.0% of all women with births.
| Age Bracket | Women with Births | Births / 1,000 Women |
| 15 to 19 years | 0 (0.0%) | 0.0 |
| 20 to 34 years | 0 (0.0%) | 0.0 |
| 35 to 50 years | 31 (100.0%) | 73.0 |
| Total | 31 (100.0%) | 30.0 |
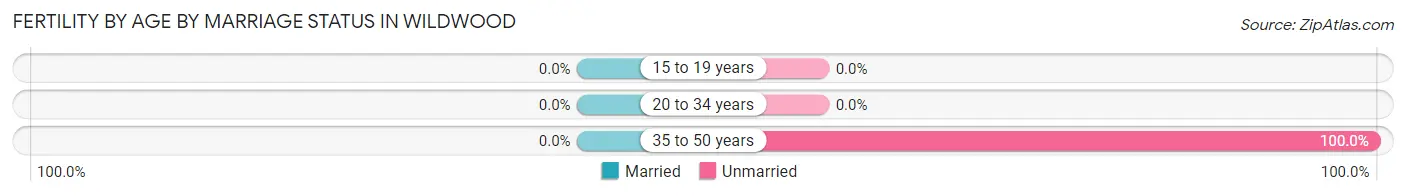
Fertility by Age by Marriage Status in Wildwood
| Age Bracket | Married | Unmarried |
| 15 to 19 years | 0 (0.0%) | 0 (0.0%) |
| 20 to 34 years | 0 (0.0%) | 0 (0.0%) |
| 35 to 50 years | 0 (0.0%) | 31 (100.0%) |
| Total | 0 (0.0%) | 31 (100.0%) |
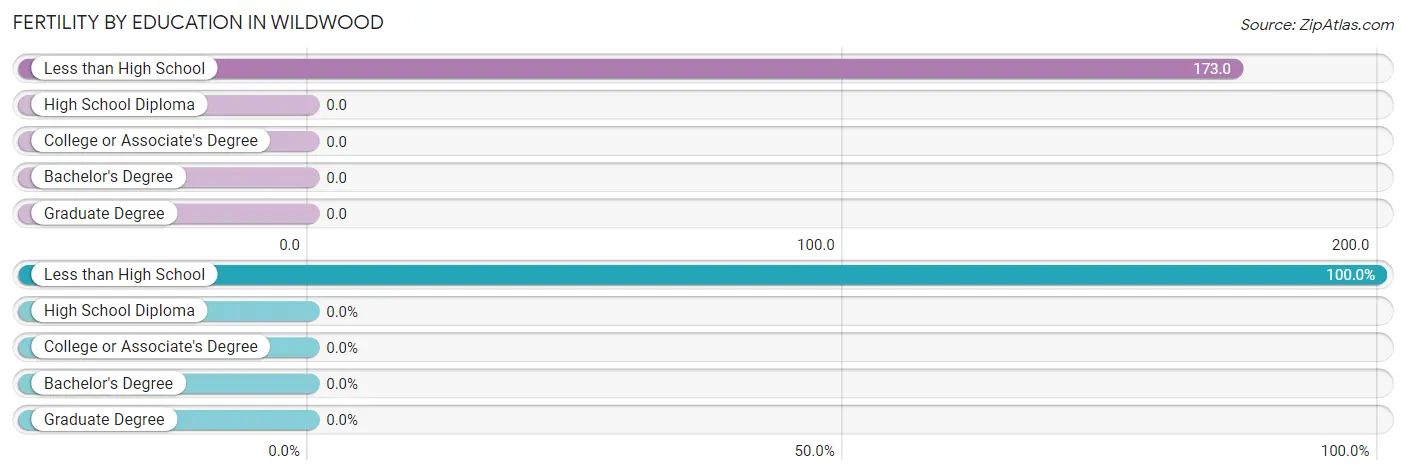
Fertility by Education in Wildwood
| Educational Attainment | Women with Births | Births / 1,000 Women |
| Less than High School | 31 (100.0%) | 173.0 |
| High School Diploma | 0 (0.0%) | 0.0 |
| College or Associate's Degree | 0 (0.0%) | 0.0 |
| Bachelor's Degree | 0 (0.0%) | 0.0 |
| Graduate Degree | 0 (0.0%) | 0.0 |
| Total | 31 (100.0%) | 30.0 |
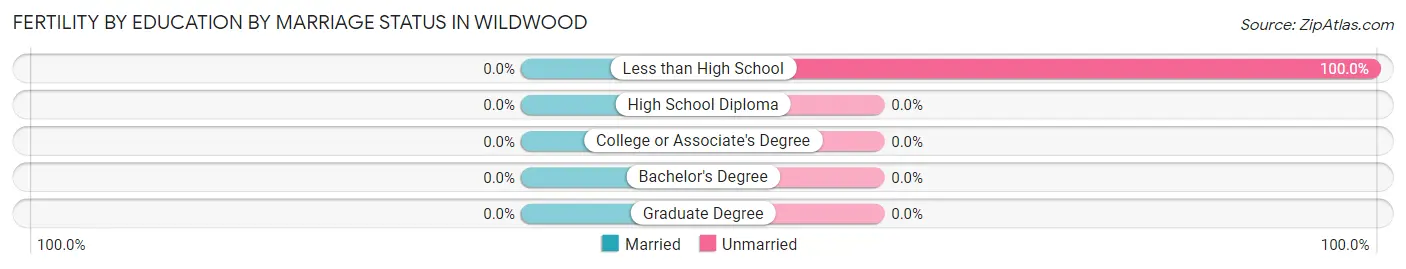
Fertility by Education by Marriage Status in Wildwood
| Educational Attainment | Married | Unmarried |
| Less than High School | 0 (0.0%) | 31 (100.0%) |
| High School Diploma | 0 (0.0%) | 0 (0.0%) |
| College or Associate's Degree | 0 (0.0%) | 0 (0.0%) |
| Bachelor's Degree | 0 (0.0%) | 0 (0.0%) |
| Graduate Degree | 0 (0.0%) | 0 (0.0%) |
| Total | 0 (0.0%) | 31 (100.0%) |
Income in Wildwood
Income Overview in Wildwood
Per Capita Income in Wildwood is $43,732, while median incomes of families and households are $68,222 and $49,131 respectively.
| Characteristic | Number | Measure |
| Per Capita Income | 5,164 | $43,732 |
| Median Family Income | 1,523 | $68,222 |
| Mean Family Income | 1,523 | $117,593 |
| Median Household Income | 2,461 | $49,131 |
| Mean Household Income | 2,461 | $92,179 |
| Income Deficit | 1,523 | $10,596 |
| Wage / Income Gap (%) | 5,164 | 19.33% |
| Wage / Income Gap ($) | 5,164 | 80.67¢ per $1 |
| Gini / Inequality Index | 5,164 | 0.55 |
Earnings by Sex in Wildwood
Average Earnings in Wildwood are $40,124, $42,108 for men and $33,968 for women, a difference of 19.3%.
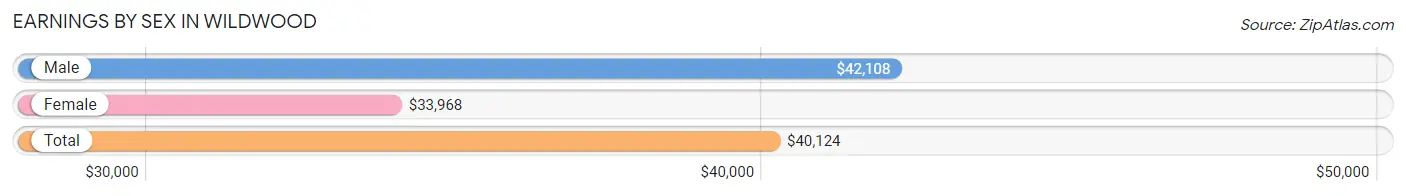
| Sex | Number | Average Earnings |
| Male | 1,505 (53.9%) | $42,108 |
| Female | 1,287 (46.1%) | $33,968 |
| Total | 2,792 (100.0%) | $40,124 |
Earnings by Sex by Income Bracket in Wildwood
The most common earnings brackets in Wildwood are $100,000+ for men (317 | 21.1%) and $75,000 to $99,999 for women (241 | 18.7%).
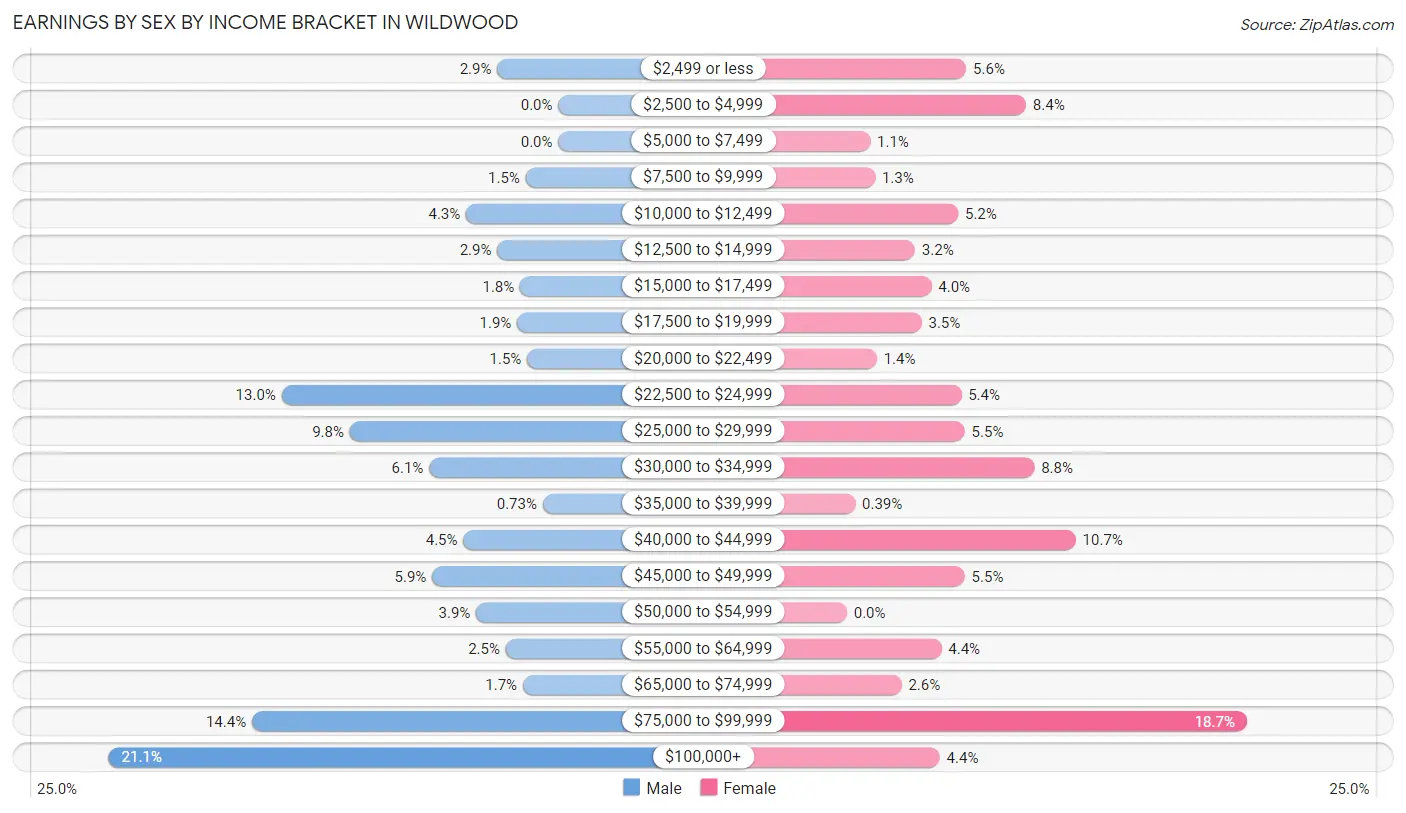
| Income | Male | Female |
| $2,499 or less | 43 (2.9%) | 72 (5.6%) |
| $2,500 to $4,999 | 0 (0.0%) | 108 (8.4%) |
| $5,000 to $7,499 | 0 (0.0%) | 14 (1.1%) |
| $7,500 to $9,999 | 23 (1.5%) | 17 (1.3%) |
| $10,000 to $12,499 | 65 (4.3%) | 67 (5.2%) |
| $12,500 to $14,999 | 43 (2.9%) | 41 (3.2%) |
| $15,000 to $17,499 | 27 (1.8%) | 51 (4.0%) |
| $17,500 to $19,999 | 29 (1.9%) | 45 (3.5%) |
| $20,000 to $22,499 | 22 (1.5%) | 18 (1.4%) |
| $22,500 to $24,999 | 195 (13.0%) | 69 (5.4%) |
| $25,000 to $29,999 | 147 (9.8%) | 71 (5.5%) |
| $30,000 to $34,999 | 91 (6.0%) | 113 (8.8%) |
| $35,000 to $39,999 | 11 (0.7%) | 5 (0.4%) |
| $40,000 to $44,999 | 67 (4.4%) | 138 (10.7%) |
| $45,000 to $49,999 | 89 (5.9%) | 71 (5.5%) |
| $50,000 to $54,999 | 58 (3.8%) | 0 (0.0%) |
| $55,000 to $64,999 | 37 (2.5%) | 57 (4.4%) |
| $65,000 to $74,999 | 25 (1.7%) | 33 (2.6%) |
| $75,000 to $99,999 | 216 (14.3%) | 241 (18.7%) |
| $100,000+ | 317 (21.1%) | 56 (4.3%) |
| Total | 1,505 (100.0%) | 1,287 (100.0%) |
Earnings by Sex by Educational Attainment in Wildwood
Average earnings in Wildwood are $48,483 for men and $34,684 for women, a difference of 28.5%. Men with an educational attainment of bachelor's degree enjoy the highest average annual earnings of $132,750, while those with less than high school education earn the least with $29,688. Women with an educational attainment of bachelor's degree earn the most with the average annual earnings of $78,085, while those with less than high school education have the smallest earnings of $23,269.
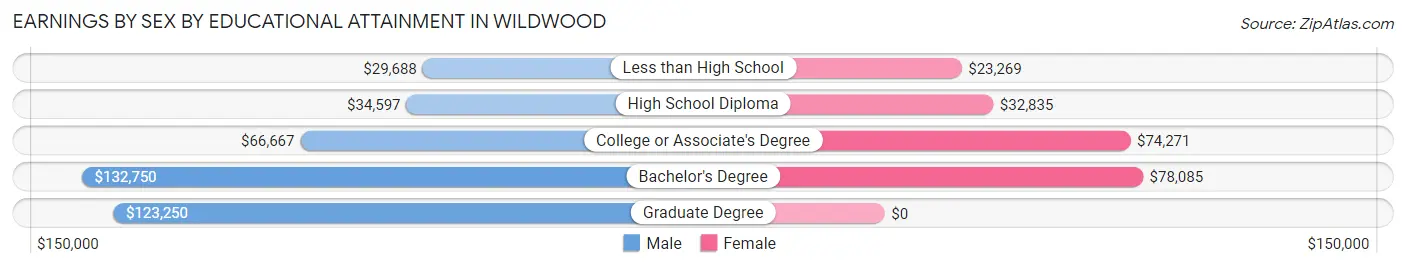
| Educational Attainment | Male Income | Female Income |
| Less than High School | $29,688 | $23,269 |
| High School Diploma | $34,597 | $32,835 |
| College or Associate's Degree | $66,667 | $74,271 |
| Bachelor's Degree | $132,750 | $78,085 |
| Graduate Degree | $123,250 | $0 |
| Total | $48,483 | $34,684 |
Family Income in Wildwood
Family Income Brackets in Wildwood
According to the Wildwood family income data, there are 308 families falling into the $35,000 to $49,999 income range, which is the most common income bracket and makes up 20.2% of all families. Conversely, the $15,000 to $24,999 income bracket is the least frequent group with only 26 families (1.7%) belonging to this category.
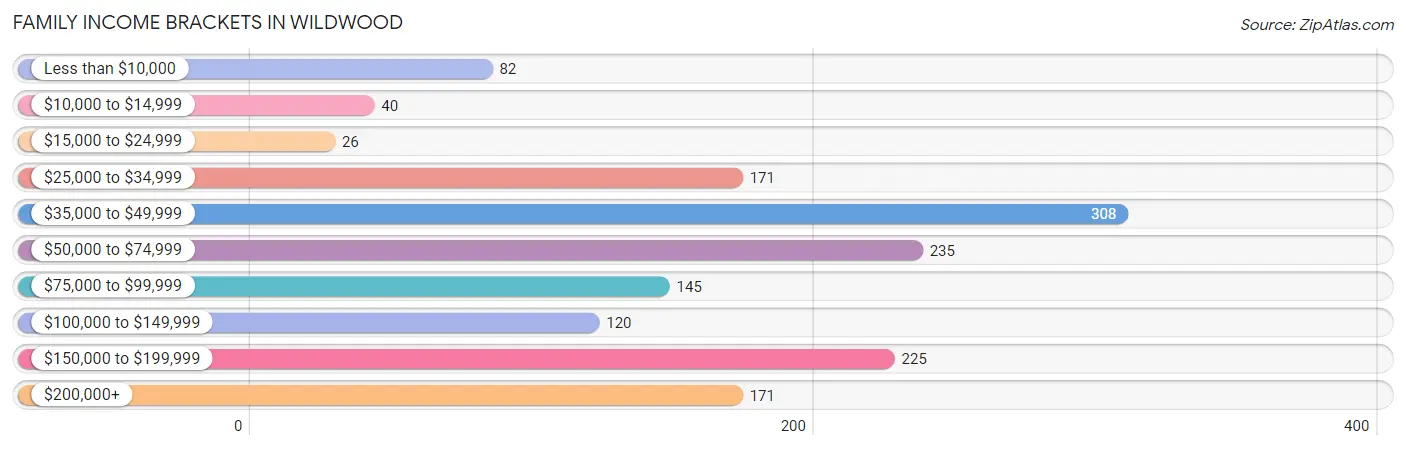
| Income Bracket | # Families | % Families |
| Less than $10,000 | 82 | 5.4% |
| $10,000 to $14,999 | 40 | 2.6% |
| $15,000 to $24,999 | 26 | 1.7% |
| $25,000 to $34,999 | 171 | 11.2% |
| $35,000 to $49,999 | 308 | 20.2% |
| $50,000 to $74,999 | 235 | 15.4% |
| $75,000 to $99,999 | 145 | 9.5% |
| $100,000 to $149,999 | 120 | 7.9% |
| $150,000 to $199,999 | 225 | 14.8% |
| $200,000+ | 171 | 11.2% |
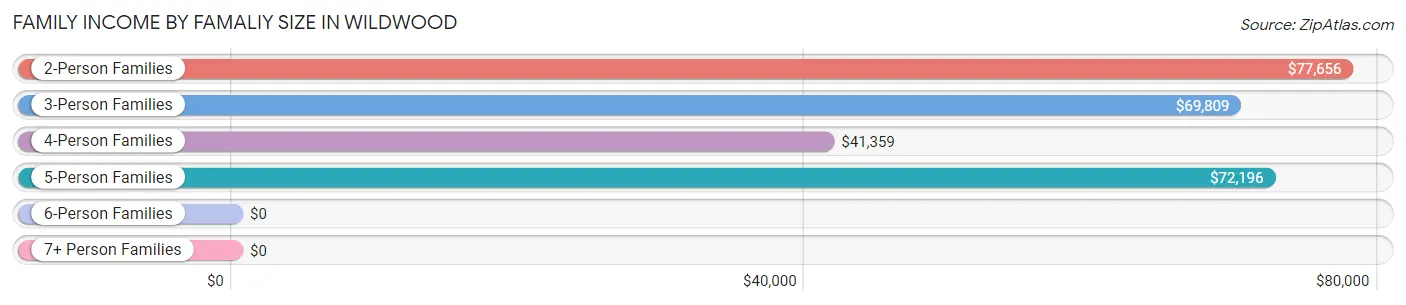
Family Income by Famaliy Size in Wildwood
2-person families (915 | 60.1%) account for the highest median family income in Wildwood with $77,656 per family, while 2-person families (915 | 60.1%) have the highest median income of $38,828 per family member.
| Income Bracket | # Families | Median Income |
| 2-Person Families | 915 (60.1%) | $77,656 |
| 3-Person Families | 253 (16.6%) | $69,809 |
| 4-Person Families | 209 (13.7%) | $41,359 |
| 5-Person Families | 107 (7.0%) | $72,196 |
| 6-Person Families | 39 (2.6%) | $0 |
| 7+ Person Families | 0 (0.0%) | $0 |
| Total | 1,523 (100.0%) | $68,222 |
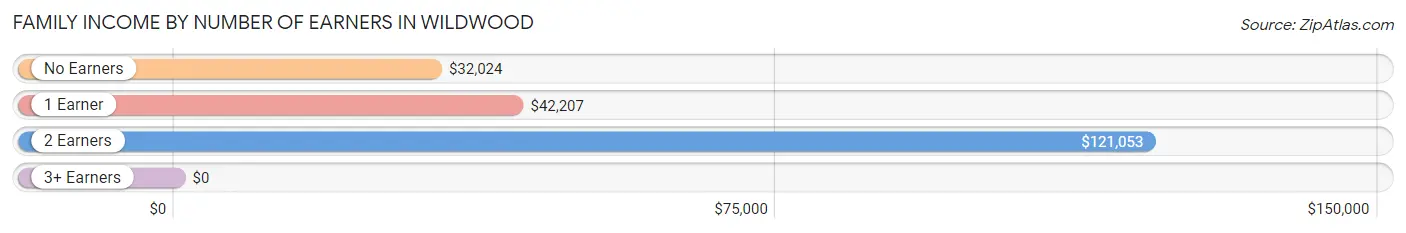
Family Income by Number of Earners in Wildwood
| Number of Earners | # Families | Median Income |
| No Earners | 248 (16.3%) | $32,024 |
| 1 Earner | 533 (35.0%) | $42,207 |
| 2 Earners | 556 (36.5%) | $121,053 |
| 3+ Earners | 186 (12.2%) | $0 |
| Total | 1,523 (100.0%) | $68,222 |
Household Income in Wildwood
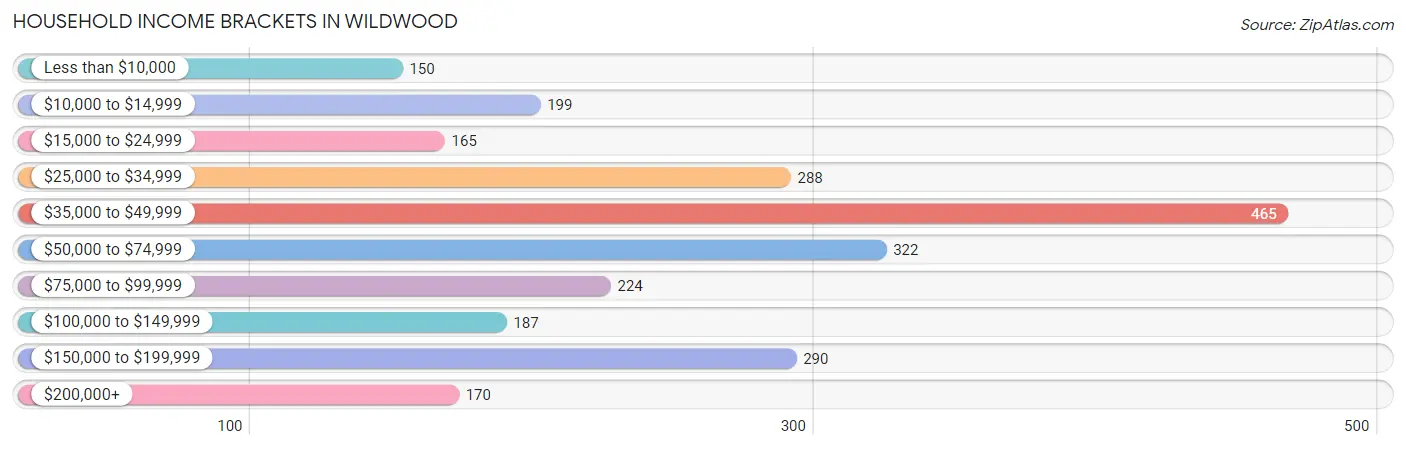
Household Income Brackets in Wildwood
With 465 households falling in the category, the $35,000 to $49,999 income range is the most frequent in Wildwood, accounting for 18.9% of all households. In contrast, only 150 households (6.1%) fall into the less than $10,000 income bracket, making it the least populous group.
| Income Bracket | # Households | % Households |
| Less than $10,000 | 150 | 6.1% |
| $10,000 to $14,999 | 199 | 8.1% |
| $15,000 to $24,999 | 165 | 6.7% |
| $25,000 to $34,999 | 288 | 11.7% |
| $35,000 to $49,999 | 465 | 18.9% |
| $50,000 to $74,999 | 322 | 13.1% |
| $75,000 to $99,999 | 224 | 9.1% |
| $100,000 to $149,999 | 187 | 7.6% |
| $150,000 to $199,999 | 290 | 11.8% |
| $200,000+ | 170 | 6.9% |
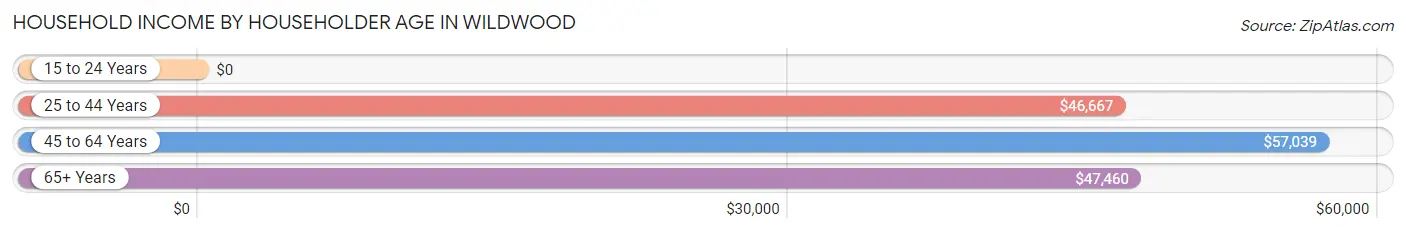
Household Income by Householder Age in Wildwood
The median household income in Wildwood is $49,131, with the highest median household income of $57,039 found in the 45 to 64 years age bracket for the primary householder. A total of 1,225 households (49.8%) fall into this category. Meanwhile, the 15 to 24 years age bracket for the primary householder has the lowest median household income of $0, with 150 households (6.1%) in this group.
| Income Bracket | # Households | Median Income |
| 15 to 24 Years | 150 (6.1%) | $0 |
| 25 to 44 Years | 536 (21.8%) | $46,667 |
| 45 to 64 Years | 1,225 (49.8%) | $57,039 |
| 65+ Years | 550 (22.4%) | $47,460 |
| Total | 2,461 (100.0%) | $49,131 |
Poverty in Wildwood
Income Below Poverty by Sex and Age in Wildwood
With 14.7% poverty level for males and 20.3% for females among the residents of Wildwood, 16 and 17 year old males and 5 year old females are the most vulnerable to poverty, with 11 males (33.3%) and 21 females (100.0%) in their respective age groups living below the poverty level.
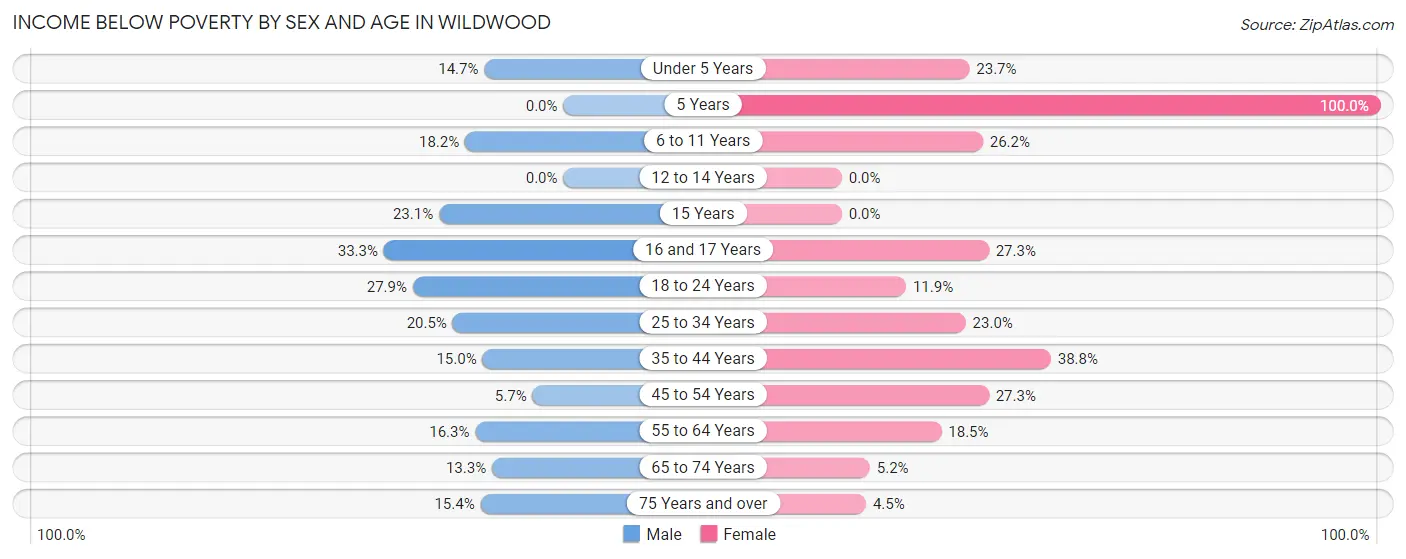
| Age Bracket | Male | Female |
| Under 5 Years | 16 (14.7%) | 18 (23.7%) |
| 5 Years | 0 (0.0%) | 21 (100.0%) |
| 6 to 11 Years | 29 (18.2%) | 84 (26.2%) |
| 12 to 14 Years | 0 (0.0%) | 0 (0.0%) |
| 15 Years | 6 (23.1%) | 0 (0.0%) |
| 16 and 17 Years | 11 (33.3%) | 9 (27.3%) |
| 18 to 24 Years | 38 (27.9%) | 38 (11.9%) |
| 25 to 34 Years | 38 (20.5%) | 63 (23.0%) |
| 35 to 44 Years | 56 (15.0%) | 71 (38.8%) |
| 45 to 54 Years | 25 (5.7%) | 93 (27.3%) |
| 55 to 64 Years | 92 (16.3%) | 117 (18.5%) |
| 65 to 74 Years | 40 (13.3%) | 11 (5.2%) |
| 75 Years and over | 20 (15.4%) | 7 (4.5%) |
| Total | 371 (14.7%) | 532 (20.3%) |
Income Above Poverty by Sex and Age in Wildwood
According to the poverty statistics in Wildwood, males aged 12 to 14 years and females aged 12 to 14 years are the age groups that are most secure financially, with 100.0% of males and 100.0% of females in these age groups living above the poverty line.
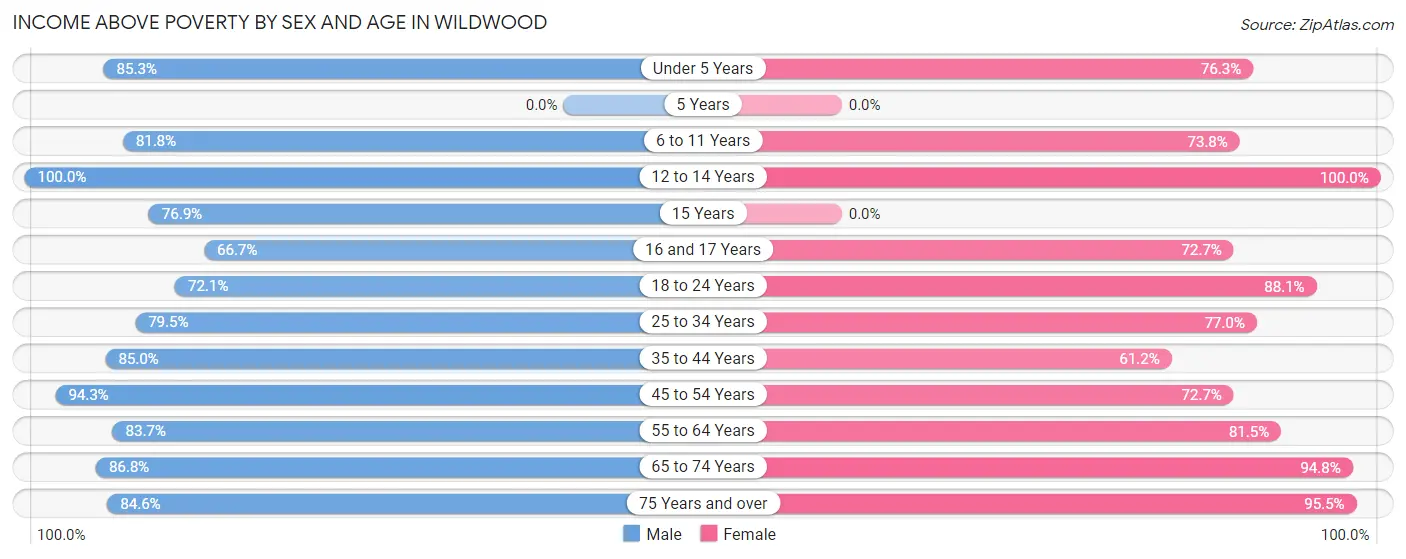
| Age Bracket | Male | Female |
| Under 5 Years | 93 (85.3%) | 58 (76.3%) |
| 5 Years | 0 (0.0%) | 0 (0.0%) |
| 6 to 11 Years | 130 (81.8%) | 237 (73.8%) |
| 12 to 14 Years | 63 (100.0%) | 58 (100.0%) |
| 15 Years | 20 (76.9%) | 0 (0.0%) |
| 16 and 17 Years | 22 (66.7%) | 24 (72.7%) |
| 18 to 24 Years | 98 (72.1%) | 281 (88.1%) |
| 25 to 34 Years | 147 (79.5%) | 211 (77.0%) |
| 35 to 44 Years | 317 (85.0%) | 112 (61.2%) |
| 45 to 54 Years | 411 (94.3%) | 248 (72.7%) |
| 55 to 64 Years | 471 (83.7%) | 516 (81.5%) |
| 65 to 74 Years | 262 (86.8%) | 200 (94.8%) |
| 75 Years and over | 110 (84.6%) | 149 (95.5%) |
| Total | 2,144 (85.3%) | 2,094 (79.7%) |
Income Below Poverty Among Married-Couple Families in Wildwood
The poverty statistics for married-couple families in Wildwood show that 3.7% or 40 of the total 1,085 families live below the poverty line. Families with 3 or 4 children have the highest poverty rate of 28.8%, comprising of 15 families. On the other hand, families with 1 or 2 children have the lowest poverty rate of 0.0%, which includes 0 families.
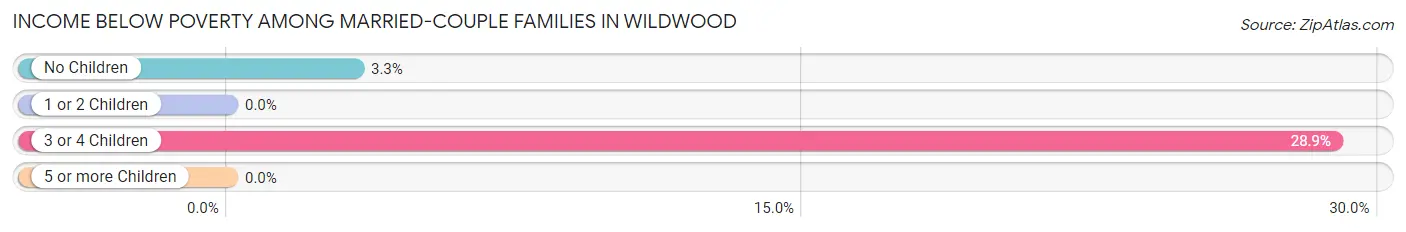
| Children | Above Poverty | Below Poverty |
| No Children | 736 (96.7%) | 25 (3.3%) |
| 1 or 2 Children | 272 (100.0%) | 0 (0.0%) |
| 3 or 4 Children | 37 (71.2%) | 15 (28.8%) |
| 5 or more Children | 0 (0.0%) | 0 (0.0%) |
| Total | 1,045 (96.3%) | 40 (3.7%) |
Income Below Poverty Among Single-Parent Households in Wildwood
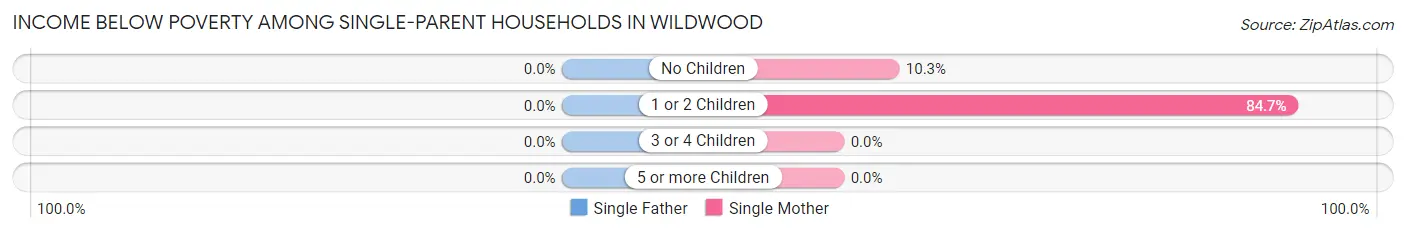
| Children | Single Father | Single Mother |
| No Children | 0 (0.0%) | 11 (10.3%) |
| 1 or 2 Children | 0 (0.0%) | 94 (84.7%) |
| 3 or 4 Children | 0 (0.0%) | 0 (0.0%) |
| 5 or more Children | 0 (0.0%) | 0 (0.0%) |
| Total | 0 (0.0%) | 105 (31.5%) |
Income Below Poverty Among Married-Couple vs Single-Parent Households in Wildwood
The poverty data for Wildwood shows that 40 of the married-couple family households (3.7%) and 105 of the single-parent households (24.0%) are living below the poverty level. Within the married-couple family households, those with 3 or 4 children have the highest poverty rate, with 15 households (28.8%) falling below the poverty line. Among the single-parent households, those with 1 or 2 children have the highest poverty rate, with 94 household (68.1%) living below poverty.
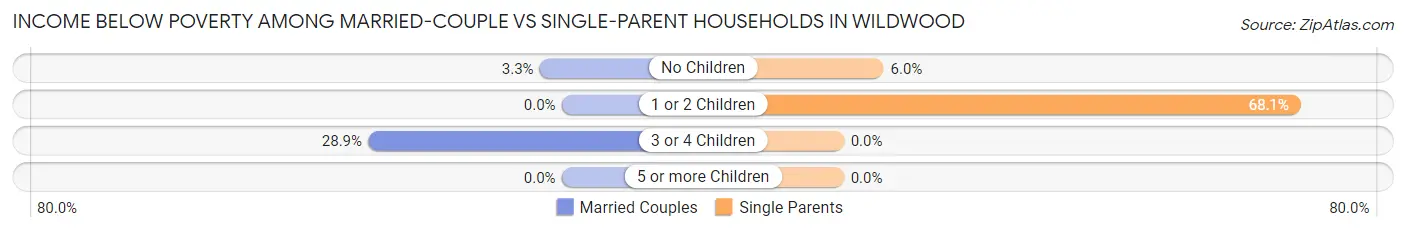
| Children | Married-Couple Families | Single-Parent Households |
| No Children | 25 (3.3%) | 11 (5.9%) |
| 1 or 2 Children | 0 (0.0%) | 94 (68.1%) |
| 3 or 4 Children | 15 (28.8%) | 0 (0.0%) |
| 5 or more Children | 0 (0.0%) | 0 (0.0%) |
| Total | 40 (3.7%) | 105 (24.0%) |
Employment Characteristics in Wildwood
Employment by Class of Employer in Wildwood
Among the 2,177 employed individuals in Wildwood, private company employees (1,551 | 71.2%), self-employed (incorporated) (142 | 6.5%), and local government employees (140 | 6.4%) make up the most common classes of employment.
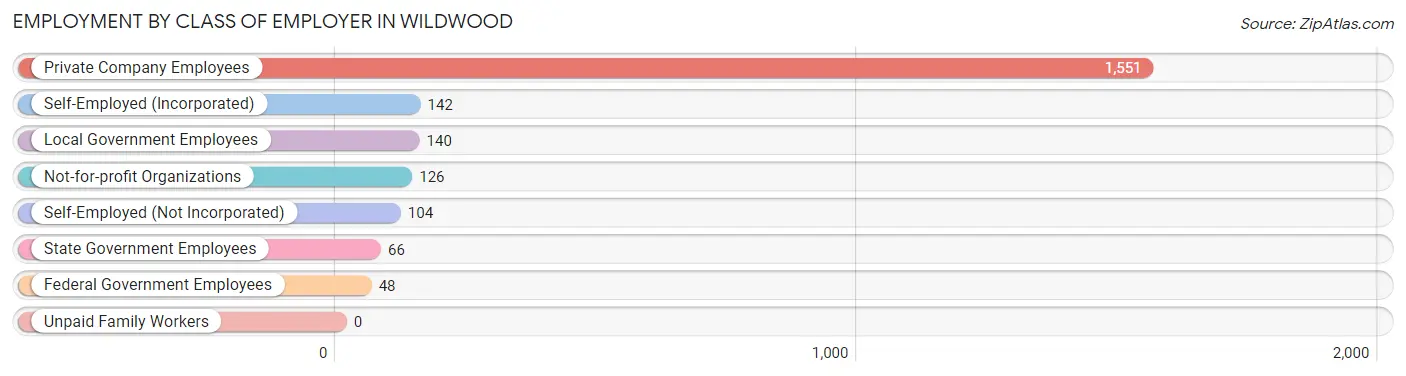
| Employer Class | # Employees | % Employees |
| Private Company Employees | 1,551 | 71.2% |
| Self-Employed (Incorporated) | 142 | 6.5% |
| Self-Employed (Not Incorporated) | 104 | 4.8% |
| Not-for-profit Organizations | 126 | 5.8% |
| Local Government Employees | 140 | 6.4% |
| State Government Employees | 66 | 3.0% |
| Federal Government Employees | 48 | 2.2% |
| Unpaid Family Workers | 0 | 0.0% |
| Total | 2,177 | 100.0% |
Employment Status by Age in Wildwood
According to the labor force statistics for Wildwood, out of the total population over 16 years of age (4,308), 58.5% or 2,520 individuals are in the labor force, with 9.2% or 232 of them unemployed. The age group with the highest labor force participation rate is 30 to 34 years, with 91.6% or 217 individuals in the labor force. Within the labor force, the 35 to 44 years age range has the highest percentage of unemployed individuals, with 27.0% or 137 of them being unemployed.
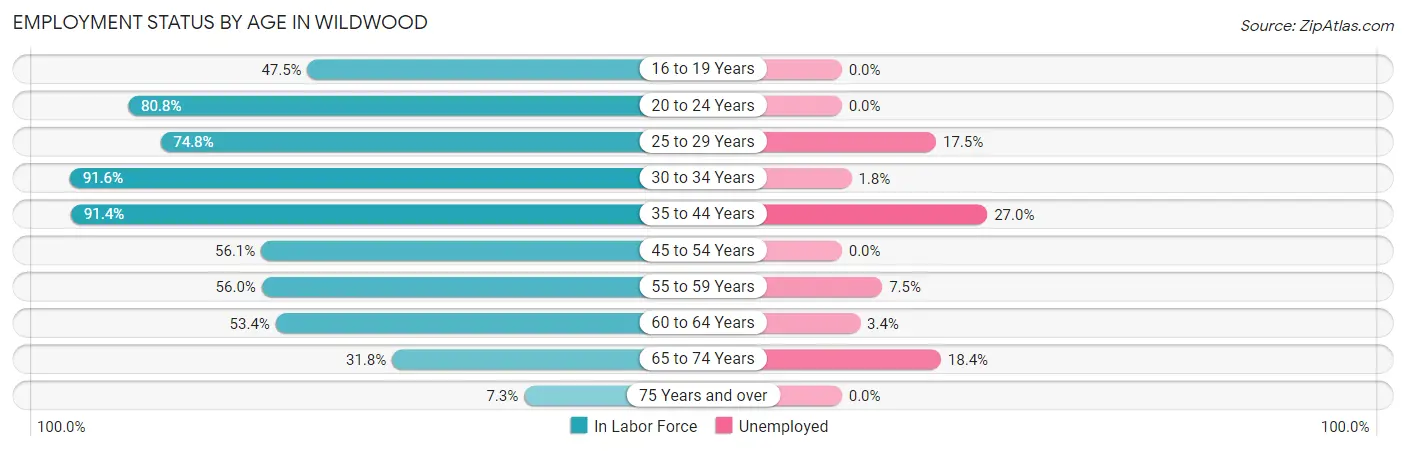
| Age Bracket | In Labor Force | Unemployed |
| 16 to 19 Years | 87 (47.5%) | 0 (0.0%) |
| 20 to 24 Years | 273 (80.8%) | 0 (0.0%) |
| 25 to 29 Years | 166 (74.8%) | 29 (17.5%) |
| 30 to 34 Years | 217 (91.6%) | 4 (1.8%) |
| 35 to 44 Years | 508 (91.4%) | 137 (27.0%) |
| 45 to 54 Years | 436 (56.1%) | 0 (0.0%) |
| 55 to 59 Years | 214 (56.0%) | 16 (7.5%) |
| 60 to 64 Years | 435 (53.4%) | 15 (3.4%) |
| 65 to 74 Years | 163 (31.8%) | 30 (18.4%) |
| 75 Years and over | 21 (7.3%) | 0 (0.0%) |
| Total | 2,520 (58.5%) | 232 (9.2%) |
Employment Status by Educational Attainment in Wildwood
According to labor force statistics for Wildwood, 66.1% of individuals (1,975) out of the total population between 25 and 64 years of age (2,988) are in the labor force, with 10.2% or 201 of them being unemployed. The group with the highest labor force participation rate are those with the educational attainment of bachelor's degree or higher, with 88.5% or 440 individuals in the labor force. Within the labor force, individuals with college / associate degree education have the highest percentage of unemployment, with 18.8% or 83 of them being unemployed.
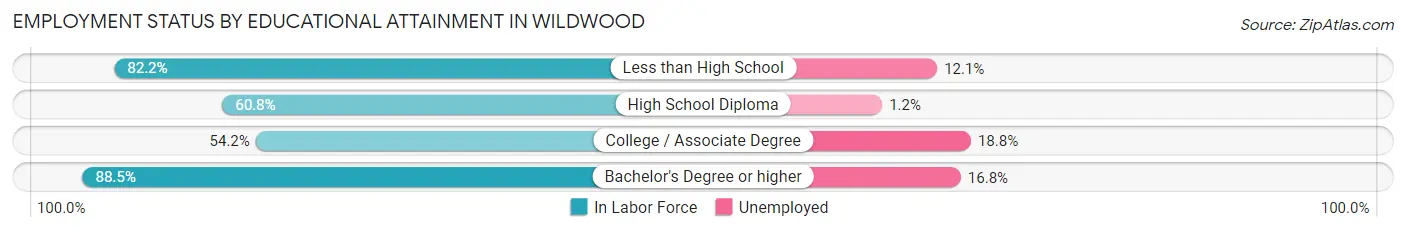
| Educational Attainment | In Labor Force | Unemployed |
| Less than High School | 286 (82.2%) | 42 (12.1%) |
| High School Diploma | 807 (60.8%) | 16 (1.2%) |
| College / Associate Degree | 442 (54.2%) | 153 (18.8%) |
| Bachelor's Degree or higher | 440 (88.5%) | 83 (16.8%) |
| Total | 1,975 (66.1%) | 305 (10.2%) |
Employment Occupations by Sex in Wildwood
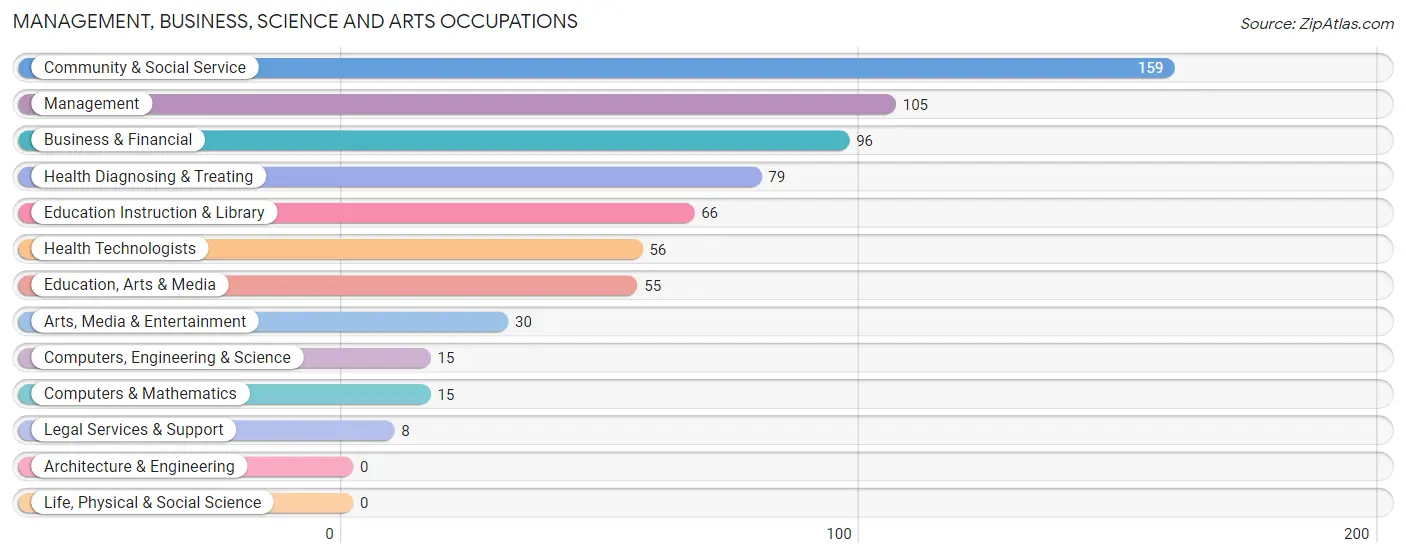
Management, Business, Science and Arts Occupations
The most common Management, Business, Science and Arts occupations in Wildwood are Community & Social Service (159 | 7.0%), Management (105 | 4.6%), Business & Financial (96 | 4.2%), Health Diagnosing & Treating (79 | 3.5%), and Education Instruction & Library (66 | 2.9%).
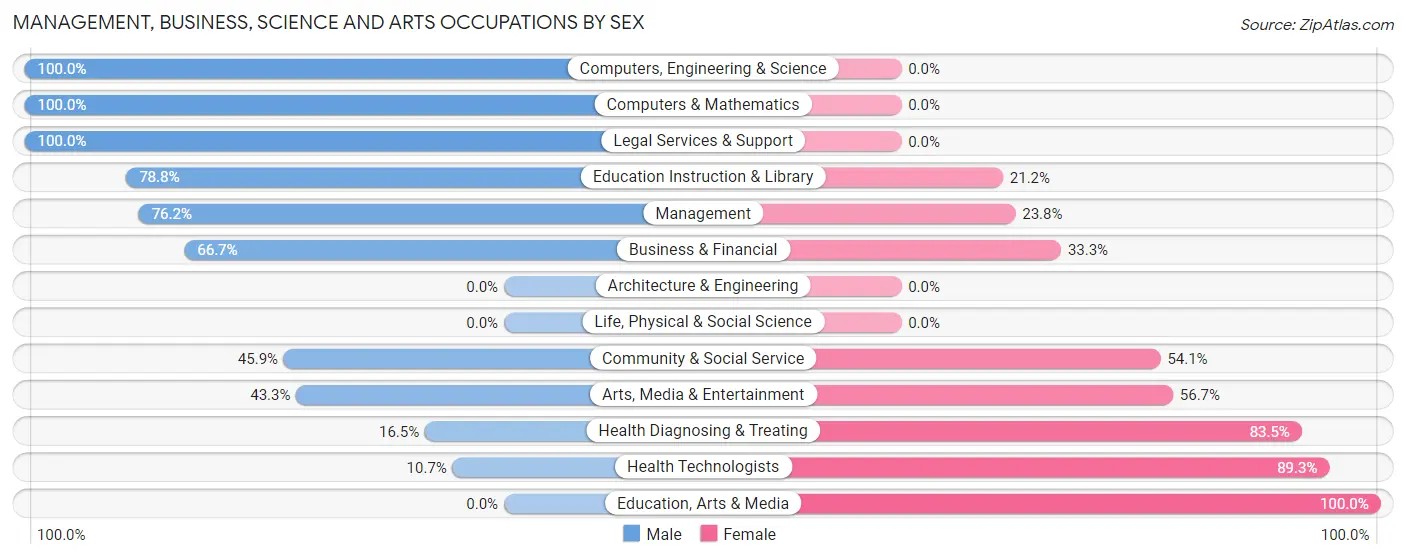
Management, Business, Science and Arts Occupations by Sex
Within the Management, Business, Science and Arts occupations in Wildwood, the most male-oriented occupations are Computers, Engineering & Science (100.0%), Computers & Mathematics (100.0%), and Legal Services & Support (100.0%), while the most female-oriented occupations are Education, Arts & Media (100.0%), Health Technologists (89.3%), and Health Diagnosing & Treating (83.5%).
| Occupation | Male | Female |
| Management | 80 (76.2%) | 25 (23.8%) |
| Business & Financial | 64 (66.7%) | 32 (33.3%) |
| Computers, Engineering & Science | 15 (100.0%) | 0 (0.0%) |
| Computers & Mathematics | 15 (100.0%) | 0 (0.0%) |
| Architecture & Engineering | 0 (0.0%) | 0 (0.0%) |
| Life, Physical & Social Science | 0 (0.0%) | 0 (0.0%) |
| Community & Social Service | 73 (45.9%) | 86 (54.1%) |
| Education, Arts & Media | 0 (0.0%) | 55 (100.0%) |
| Legal Services & Support | 8 (100.0%) | 0 (0.0%) |
| Education Instruction & Library | 52 (78.8%) | 14 (21.2%) |
| Arts, Media & Entertainment | 13 (43.3%) | 17 (56.7%) |
| Health Diagnosing & Treating | 13 (16.5%) | 66 (83.5%) |
| Health Technologists | 6 (10.7%) | 50 (89.3%) |
| Total (Category) | 245 (54.0%) | 209 (46.0%) |
| Total (Overall) | 1,215 (53.2%) | 1,068 (46.8%) |
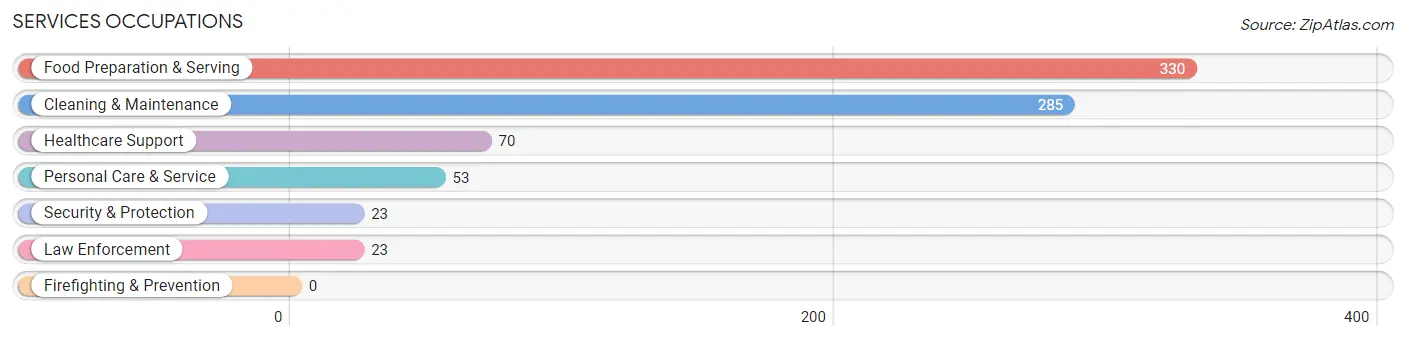
Services Occupations
The most common Services occupations in Wildwood are Food Preparation & Serving (330 | 14.4%), Cleaning & Maintenance (285 | 12.5%), Healthcare Support (70 | 3.1%), Personal Care & Service (53 | 2.3%), and Security & Protection (23 | 1.0%).
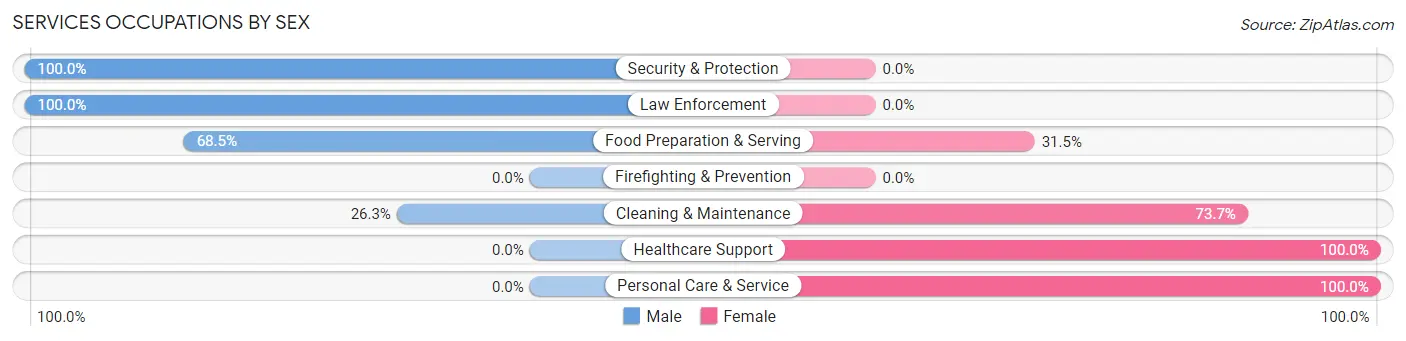
Services Occupations by Sex
Within the Services occupations in Wildwood, the most male-oriented occupations are Security & Protection (100.0%), Law Enforcement (100.0%), and Food Preparation & Serving (68.5%), while the most female-oriented occupations are Healthcare Support (100.0%), Personal Care & Service (100.0%), and Cleaning & Maintenance (73.7%).
| Occupation | Male | Female |
| Healthcare Support | 0 (0.0%) | 70 (100.0%) |
| Security & Protection | 23 (100.0%) | 0 (0.0%) |
| Firefighting & Prevention | 0 (0.0%) | 0 (0.0%) |
| Law Enforcement | 23 (100.0%) | 0 (0.0%) |
| Food Preparation & Serving | 226 (68.5%) | 104 (31.5%) |
| Cleaning & Maintenance | 75 (26.3%) | 210 (73.7%) |
| Personal Care & Service | 0 (0.0%) | 53 (100.0%) |
| Total (Category) | 324 (42.6%) | 437 (57.4%) |
| Total (Overall) | 1,215 (53.2%) | 1,068 (46.8%) |
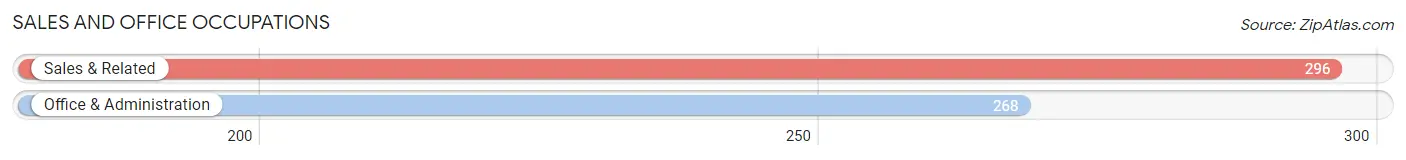
Sales and Office Occupations
The most common Sales and Office occupations in Wildwood are Sales & Related (296 | 13.0%), and Office & Administration (268 | 11.7%).
Sales and Office Occupations by Sex
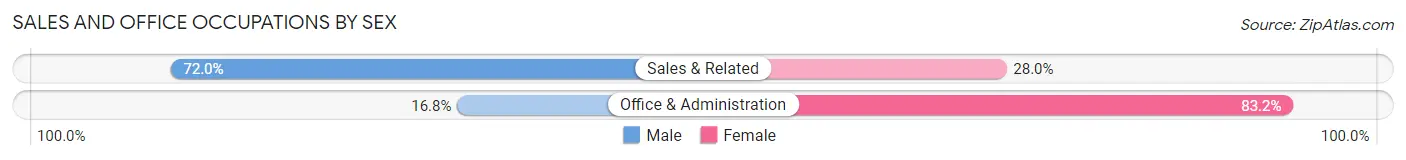
| Occupation | Male | Female |
| Sales & Related | 213 (72.0%) | 83 (28.0%) |
| Office & Administration | 45 (16.8%) | 223 (83.2%) |
| Total (Category) | 258 (45.7%) | 306 (54.3%) |
| Total (Overall) | 1,215 (53.2%) | 1,068 (46.8%) |
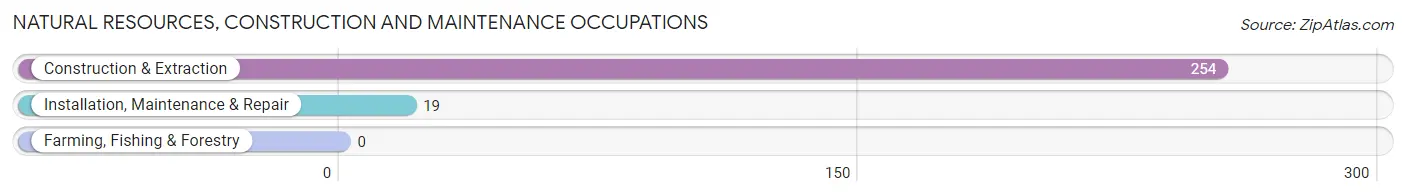
Natural Resources, Construction and Maintenance Occupations
The most common Natural Resources, Construction and Maintenance occupations in Wildwood are Construction & Extraction (254 | 11.1%), and Installation, Maintenance & Repair (19 | 0.8%).
Natural Resources, Construction and Maintenance Occupations by Sex
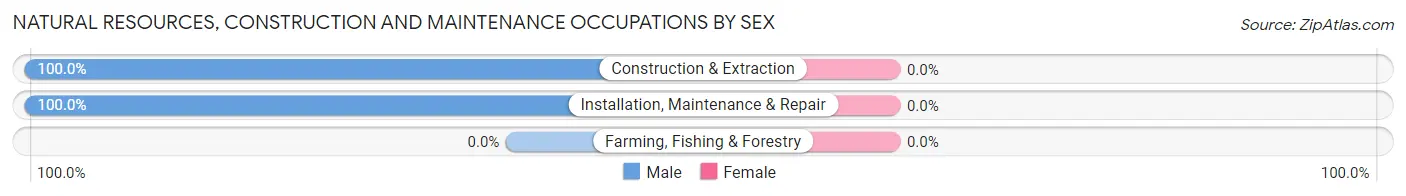
| Occupation | Male | Female |
| Farming, Fishing & Forestry | 0 (0.0%) | 0 (0.0%) |
| Construction & Extraction | 254 (100.0%) | 0 (0.0%) |
| Installation, Maintenance & Repair | 19 (100.0%) | 0 (0.0%) |
| Total (Category) | 273 (100.0%) | 0 (0.0%) |
| Total (Overall) | 1,215 (53.2%) | 1,068 (46.8%) |
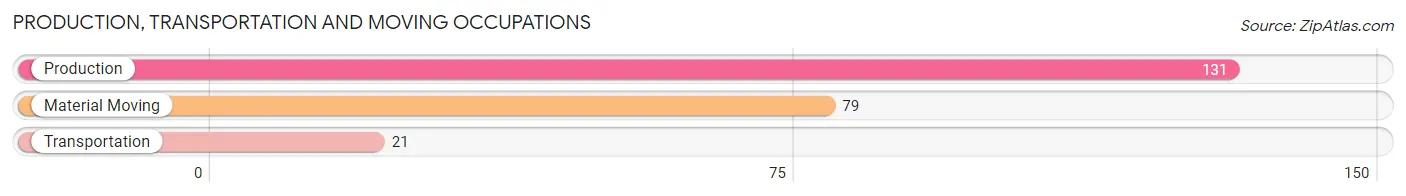
Production, Transportation and Moving Occupations
The most common Production, Transportation and Moving occupations in Wildwood are Production (131 | 5.7%), Material Moving (79 | 3.5%), and Transportation (21 | 0.9%).
Production, Transportation and Moving Occupations by Sex
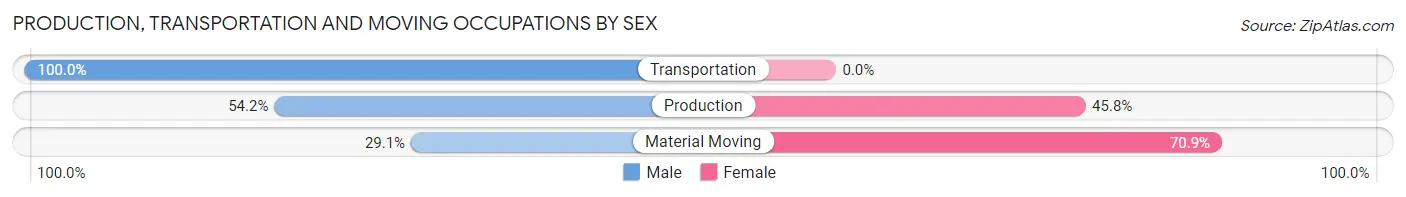
| Occupation | Male | Female |
| Production | 71 (54.2%) | 60 (45.8%) |
| Transportation | 21 (100.0%) | 0 (0.0%) |
| Material Moving | 23 (29.1%) | 56 (70.9%) |
| Total (Category) | 115 (49.8%) | 116 (50.2%) |
| Total (Overall) | 1,215 (53.2%) | 1,068 (46.8%) |
Employment Industries by Sex in Wildwood
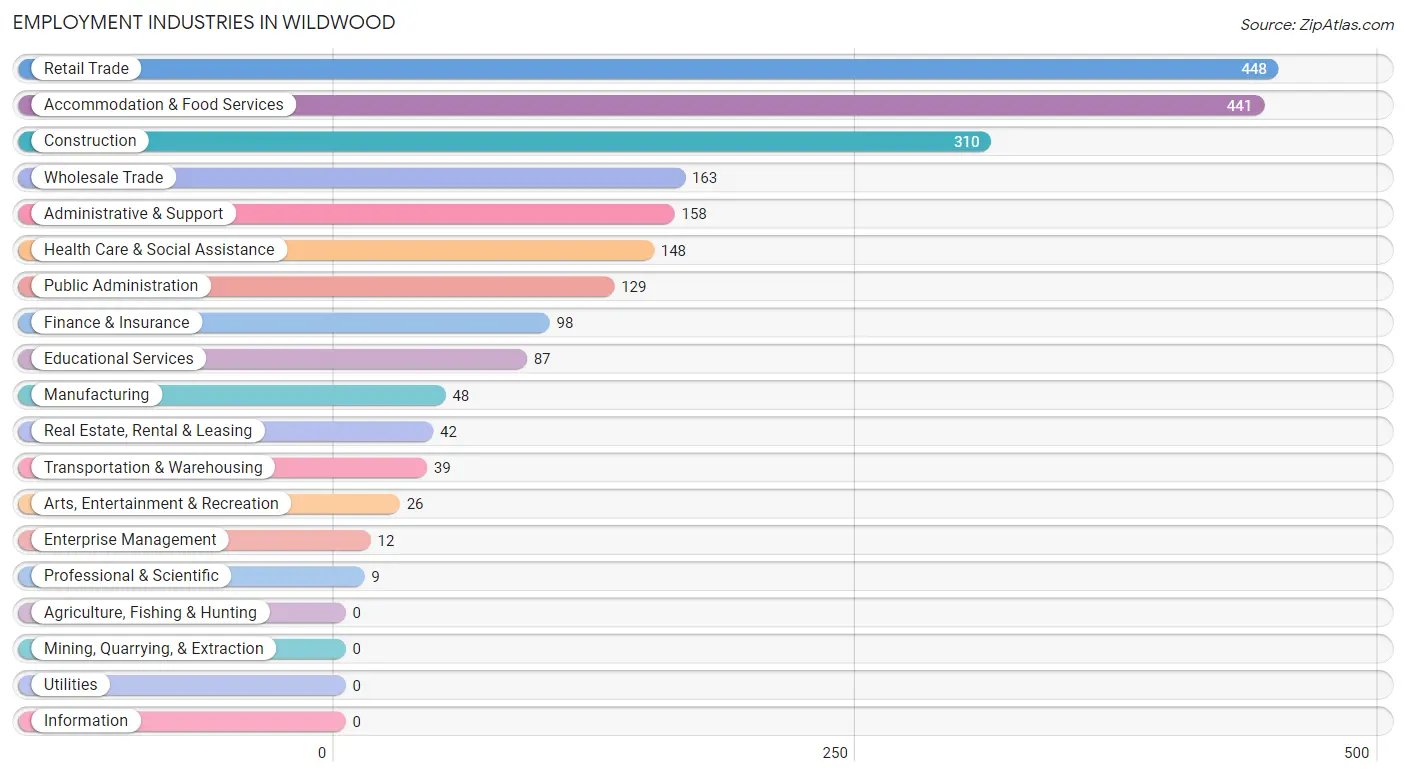
Employment Industries in Wildwood
The major employment industries in Wildwood include Retail Trade (448 | 19.6%), Accommodation & Food Services (441 | 19.3%), Construction (310 | 13.6%), Wholesale Trade (163 | 7.1%), and Administrative & Support (158 | 6.9%).
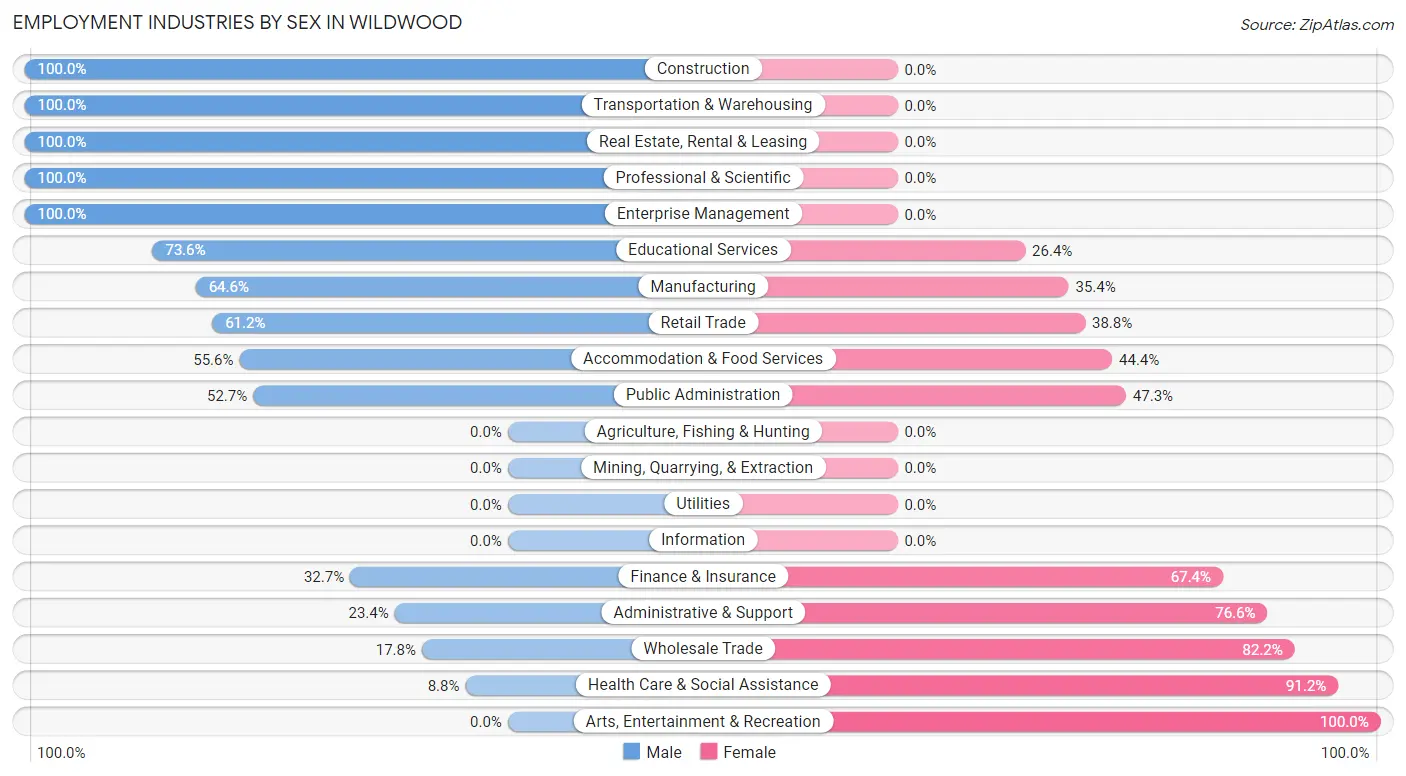
Employment Industries by Sex in Wildwood
The Wildwood industries that see more men than women are Construction (100.0%), Transportation & Warehousing (100.0%), and Real Estate, Rental & Leasing (100.0%), whereas the industries that tend to have a higher number of women are Arts, Entertainment & Recreation (100.0%), Health Care & Social Assistance (91.2%), and Wholesale Trade (82.2%).
| Industry | Male | Female |
| Agriculture, Fishing & Hunting | 0 (0.0%) | 0 (0.0%) |
| Mining, Quarrying, & Extraction | 0 (0.0%) | 0 (0.0%) |
| Construction | 310 (100.0%) | 0 (0.0%) |
| Manufacturing | 31 (64.6%) | 17 (35.4%) |
| Wholesale Trade | 29 (17.8%) | 134 (82.2%) |
| Retail Trade | 274 (61.2%) | 174 (38.8%) |
| Transportation & Warehousing | 39 (100.0%) | 0 (0.0%) |
| Utilities | 0 (0.0%) | 0 (0.0%) |
| Information | 0 (0.0%) | 0 (0.0%) |
| Finance & Insurance | 32 (32.7%) | 66 (67.3%) |
| Real Estate, Rental & Leasing | 42 (100.0%) | 0 (0.0%) |
| Professional & Scientific | 9 (100.0%) | 0 (0.0%) |
| Enterprise Management | 12 (100.0%) | 0 (0.0%) |
| Administrative & Support | 37 (23.4%) | 121 (76.6%) |
| Educational Services | 64 (73.6%) | 23 (26.4%) |
| Health Care & Social Assistance | 13 (8.8%) | 135 (91.2%) |
| Arts, Entertainment & Recreation | 0 (0.0%) | 26 (100.0%) |
| Accommodation & Food Services | 245 (55.6%) | 196 (44.4%) |
| Public Administration | 68 (52.7%) | 61 (47.3%) |
| Total | 1,215 (53.2%) | 1,068 (46.8%) |
Education in Wildwood
School Enrollment in Wildwood
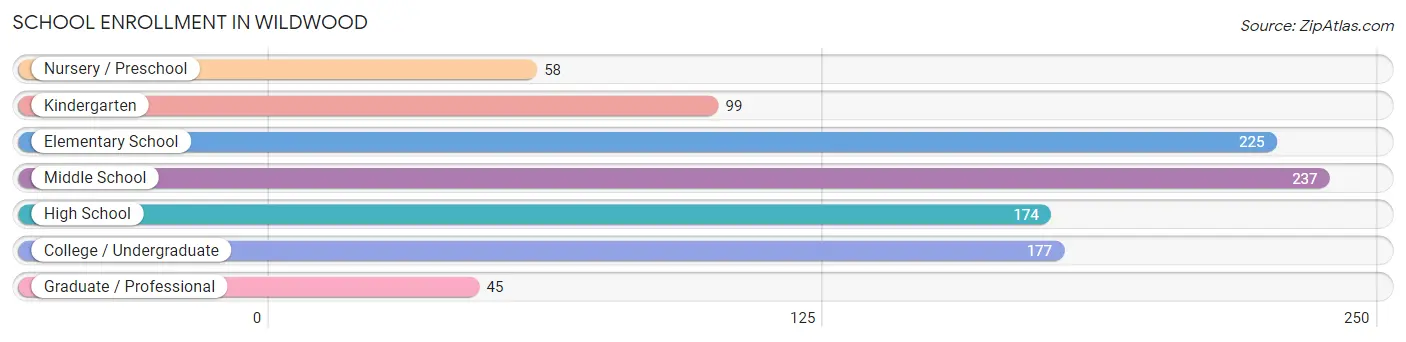
The most common levels of schooling among the 1,015 students in Wildwood are middle school (237 | 23.4%), elementary school (225 | 22.2%), and college / undergraduate (177 | 17.4%).
| School Level | # Students | % Students |
| Nursery / Preschool | 58 | 5.7% |
| Kindergarten | 99 | 9.8% |
| Elementary School | 225 | 22.2% |
| Middle School | 237 | 23.4% |
| High School | 174 | 17.1% |
| College / Undergraduate | 177 | 17.4% |
| Graduate / Professional | 45 | 4.4% |
| Total | 1,015 | 100.0% |
School Enrollment by Age by Funding Source in Wildwood
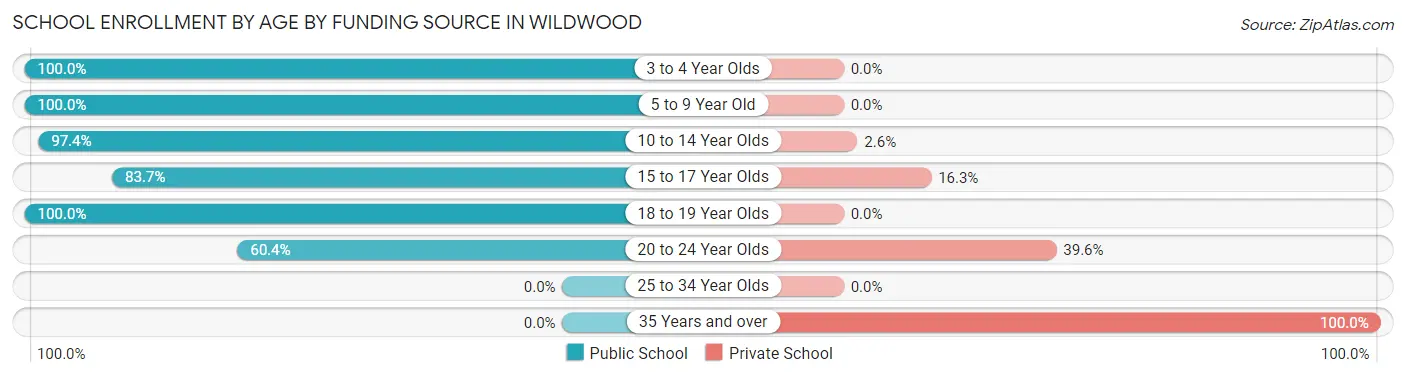
Out of a total of 1,015 students who are enrolled in schools in Wildwood, 104 (10.2%) attend a private institution, while the remaining 911 (89.8%) are enrolled in public schools. The age group of 35 years and over has the highest likelihood of being enrolled in private schools, with 17 (100.0% in the age bracket) enrolled. Conversely, the age group of 3 to 4 year olds has the lowest likelihood of being enrolled in a private school, with 58 (100.0% in the age bracket) attending a public institution.
| Age Bracket | Public School | Private School |
| 3 to 4 Year Olds | 58 (100.0%) | 0 (0.0%) |
| 5 to 9 Year Old | 259 (100.0%) | 0 (0.0%) |
| 10 to 14 Year Olds | 342 (97.4%) | 9 (2.6%) |
| 15 to 17 Year Olds | 77 (83.7%) | 15 (16.3%) |
| 18 to 19 Year Olds | 79 (100.0%) | 0 (0.0%) |
| 20 to 24 Year Olds | 96 (60.4%) | 63 (39.6%) |
| 25 to 34 Year Olds | 0 (0.0%) | 0 (0.0%) |
| 35 Years and over | 0 (0.0%) | 17 (100.0%) |
| Total | 911 (89.8%) | 104 (10.2%) |
Educational Attainment by Field of Study in Wildwood
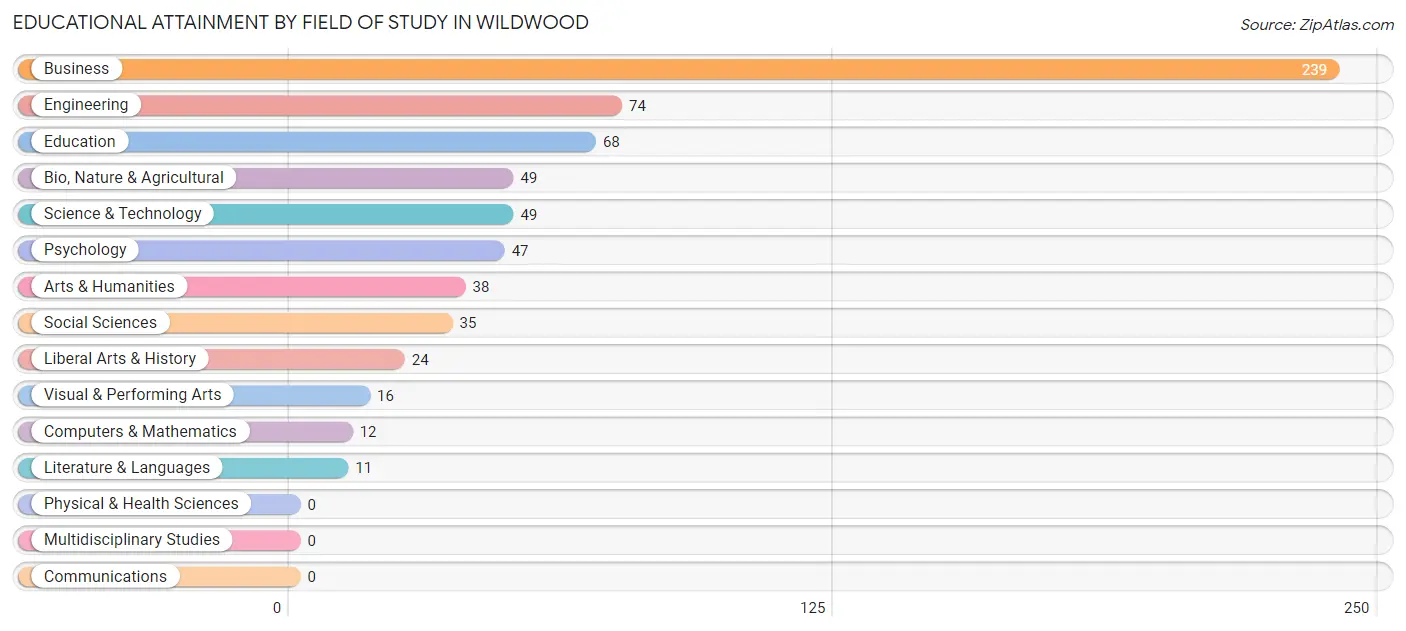
Business (239 | 36.1%), engineering (74 | 11.2%), education (68 | 10.3%), bio, nature & agricultural (49 | 7.4%), and science & technology (49 | 7.4%) are the most common fields of study among 662 individuals in Wildwood who have obtained a bachelor's degree or higher.
| Field of Study | # Graduates | % Graduates |
| Computers & Mathematics | 12 | 1.8% |
| Bio, Nature & Agricultural | 49 | 7.4% |
| Physical & Health Sciences | 0 | 0.0% |
| Psychology | 47 | 7.1% |
| Social Sciences | 35 | 5.3% |
| Engineering | 74 | 11.2% |
| Multidisciplinary Studies | 0 | 0.0% |
| Science & Technology | 49 | 7.4% |
| Business | 239 | 36.1% |
| Education | 68 | 10.3% |
| Literature & Languages | 11 | 1.7% |
| Liberal Arts & History | 24 | 3.6% |
| Visual & Performing Arts | 16 | 2.4% |
| Communications | 0 | 0.0% |
| Arts & Humanities | 38 | 5.7% |
| Total | 662 | 100.0% |
Transportation & Commute in Wildwood
Vehicle Availability by Sex in Wildwood
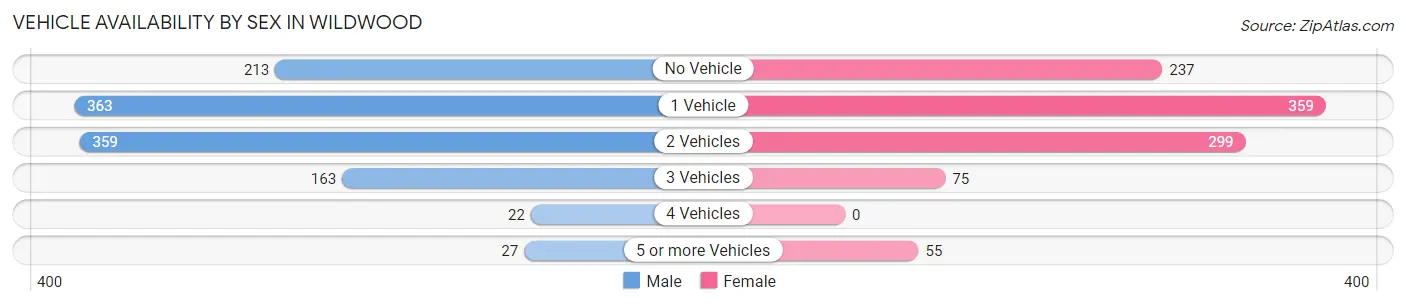
The most prevalent vehicle ownership categories in Wildwood are males with 1 vehicle (363, accounting for 31.7%) and females with 1 vehicle (359, making up 35.4%).
| Vehicles Available | Male | Female |
| No Vehicle | 213 (18.6%) | 237 (23.1%) |
| 1 Vehicle | 363 (31.7%) | 359 (35.0%) |
| 2 Vehicles | 359 (31.3%) | 299 (29.2%) |
| 3 Vehicles | 163 (14.2%) | 75 (7.3%) |
| 4 Vehicles | 22 (1.9%) | 0 (0.0%) |
| 5 or more Vehicles | 27 (2.4%) | 55 (5.4%) |
| Total | 1,147 (100.0%) | 1,025 (100.0%) |
Commute Time in Wildwood
The most frequently occuring commute durations in Wildwood are 15 to 19 minutes (562 commuters, 27.9%), 10 to 14 minutes (295 commuters, 14.7%), and 5 to 9 minutes (259 commuters, 12.9%).
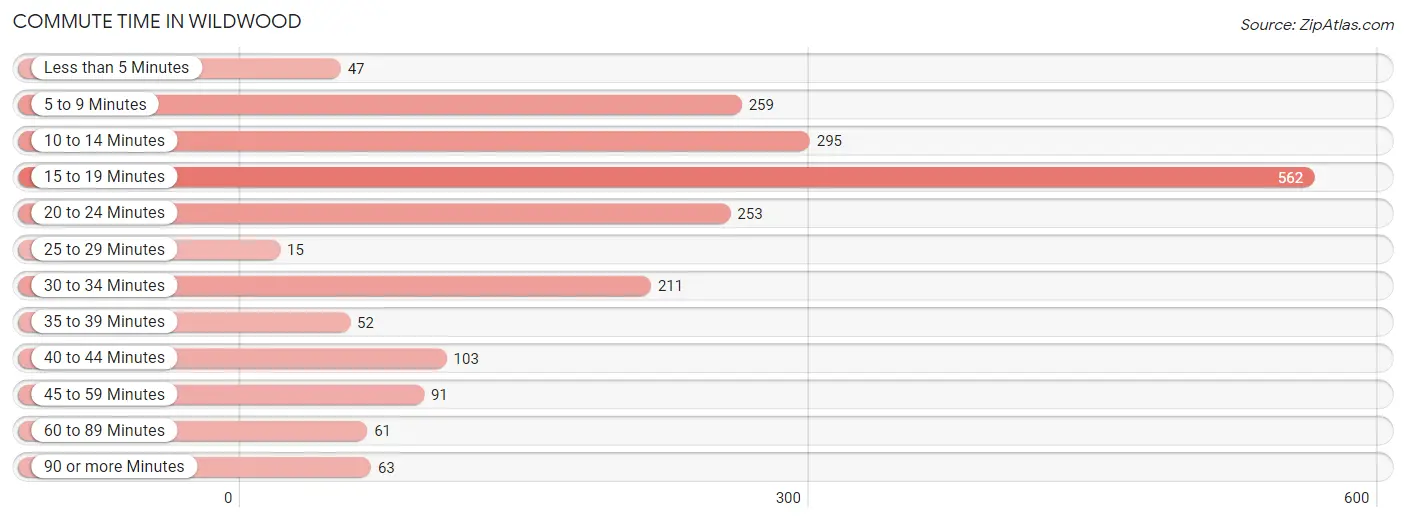
| Commute Time | # Commuters | % Commuters |
| Less than 5 Minutes | 47 | 2.3% |
| 5 to 9 Minutes | 259 | 12.9% |
| 10 to 14 Minutes | 295 | 14.7% |
| 15 to 19 Minutes | 562 | 27.9% |
| 20 to 24 Minutes | 253 | 12.6% |
| 25 to 29 Minutes | 15 | 0.7% |
| 30 to 34 Minutes | 211 | 10.5% |
| 35 to 39 Minutes | 52 | 2.6% |
| 40 to 44 Minutes | 103 | 5.1% |
| 45 to 59 Minutes | 91 | 4.5% |
| 60 to 89 Minutes | 61 | 3.0% |
| 90 or more Minutes | 63 | 3.1% |
Commute Time by Sex in Wildwood
The most common commute times in Wildwood are 10 to 14 minutes (271 commuters, 25.6%) for males and 15 to 19 minutes (375 commuters, 39.3%) for females.
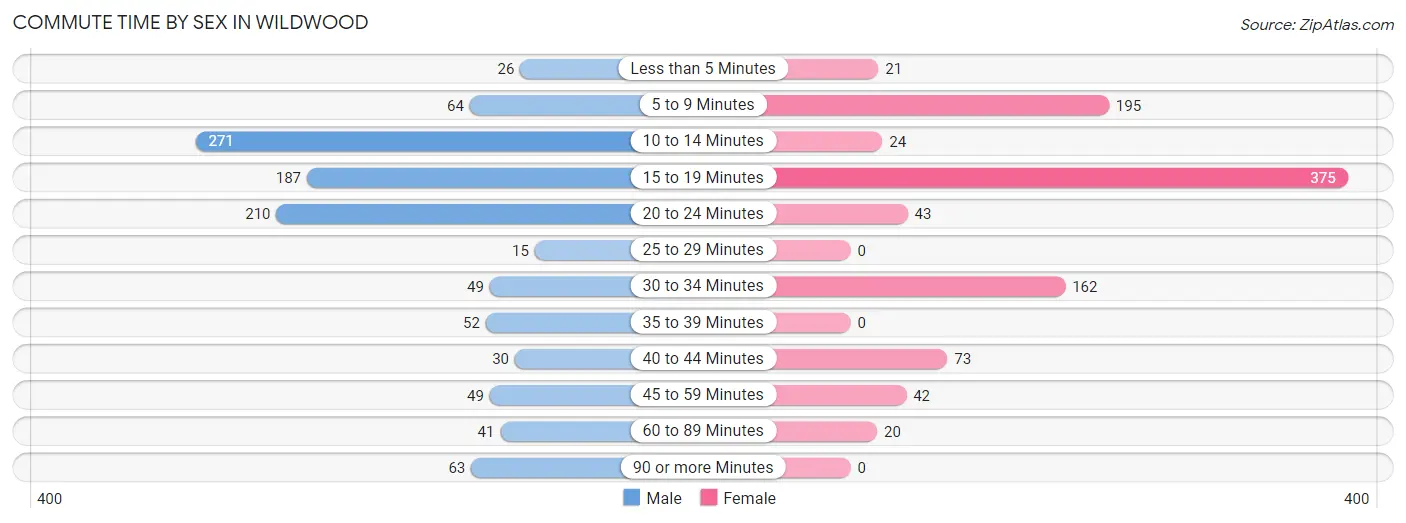
| Commute Time | Male | Female |
| Less than 5 Minutes | 26 (2.5%) | 21 (2.2%) |
| 5 to 9 Minutes | 64 (6.0%) | 195 (20.4%) |
| 10 to 14 Minutes | 271 (25.6%) | 24 (2.5%) |
| 15 to 19 Minutes | 187 (17.7%) | 375 (39.3%) |
| 20 to 24 Minutes | 210 (19.9%) | 43 (4.5%) |
| 25 to 29 Minutes | 15 (1.4%) | 0 (0.0%) |
| 30 to 34 Minutes | 49 (4.6%) | 162 (17.0%) |
| 35 to 39 Minutes | 52 (4.9%) | 0 (0.0%) |
| 40 to 44 Minutes | 30 (2.8%) | 73 (7.6%) |
| 45 to 59 Minutes | 49 (4.6%) | 42 (4.4%) |
| 60 to 89 Minutes | 41 (3.9%) | 20 (2.1%) |
| 90 or more Minutes | 63 (6.0%) | 0 (0.0%) |
Time of Departure to Work by Sex in Wildwood
The most frequent times of departure to work in Wildwood are 8:00 AM to 8:29 AM (148, 14.0%) for males and 7:30 AM to 7:59 AM (193, 20.2%) for females.
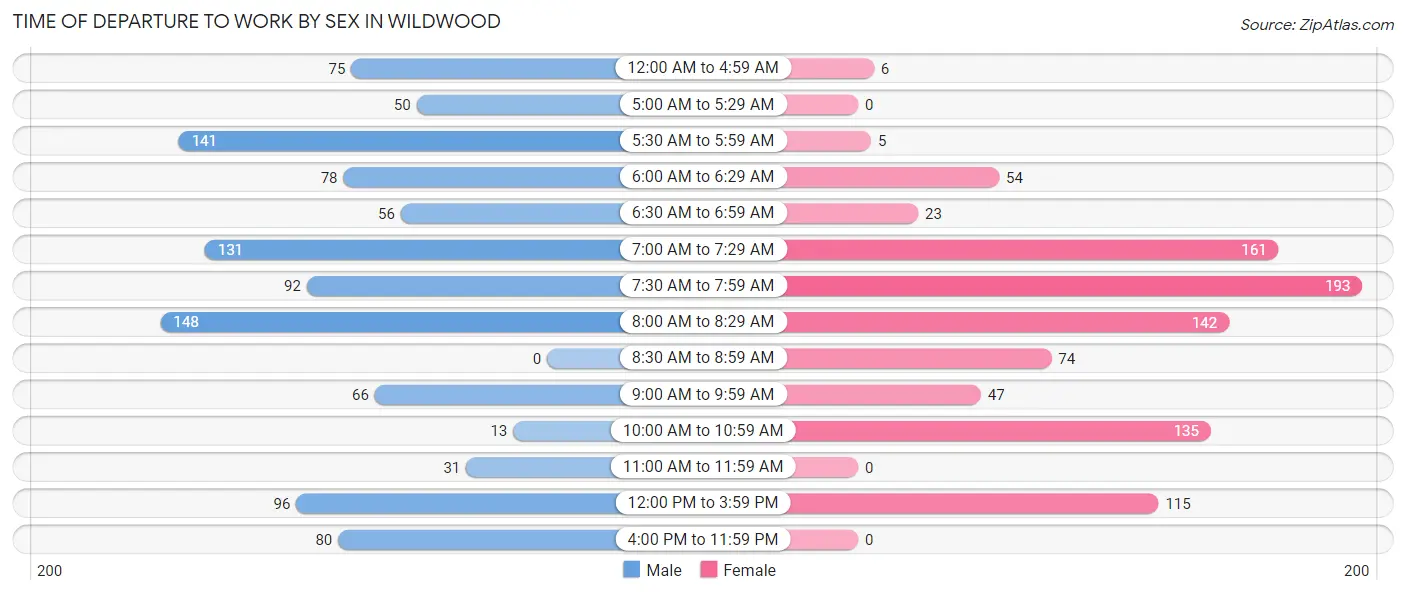
| Time of Departure | Male | Female |
| 12:00 AM to 4:59 AM | 75 (7.1%) | 6 (0.6%) |
| 5:00 AM to 5:29 AM | 50 (4.7%) | 0 (0.0%) |
| 5:30 AM to 5:59 AM | 141 (13.3%) | 5 (0.5%) |
| 6:00 AM to 6:29 AM | 78 (7.4%) | 54 (5.7%) |
| 6:30 AM to 6:59 AM | 56 (5.3%) | 23 (2.4%) |
| 7:00 AM to 7:29 AM | 131 (12.4%) | 161 (16.9%) |
| 7:30 AM to 7:59 AM | 92 (8.7%) | 193 (20.2%) |
| 8:00 AM to 8:29 AM | 148 (14.0%) | 142 (14.9%) |
| 8:30 AM to 8:59 AM | 0 (0.0%) | 74 (7.7%) |
| 9:00 AM to 9:59 AM | 66 (6.2%) | 47 (4.9%) |
| 10:00 AM to 10:59 AM | 13 (1.2%) | 135 (14.1%) |
| 11:00 AM to 11:59 AM | 31 (2.9%) | 0 (0.0%) |
| 12:00 PM to 3:59 PM | 96 (9.1%) | 115 (12.0%) |
| 4:00 PM to 11:59 PM | 80 (7.6%) | 0 (0.0%) |
| Total | 1,057 (100.0%) | 955 (100.0%) |
Housing Occupancy in Wildwood
Occupancy by Ownership in Wildwood
Of the total 2,461 dwellings in Wildwood, owner-occupied units account for 1,145 (46.5%), while renter-occupied units make up 1,316 (53.5%).
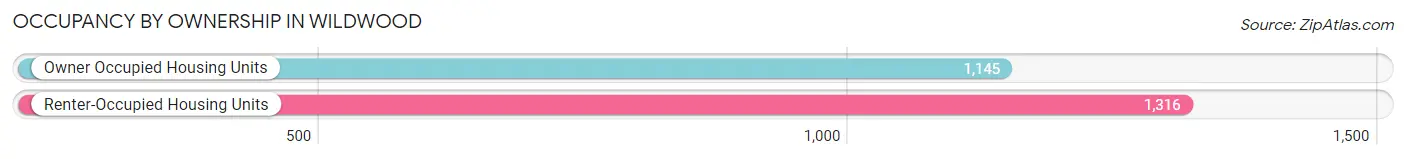
| Occupancy | # Housing Units | % Housing Units |
| Owner Occupied Housing Units | 1,145 | 46.5% |
| Renter-Occupied Housing Units | 1,316 | 53.5% |
| Total Occupied Housing Units | 2,461 | 100.0% |
Occupancy by Household Size in Wildwood
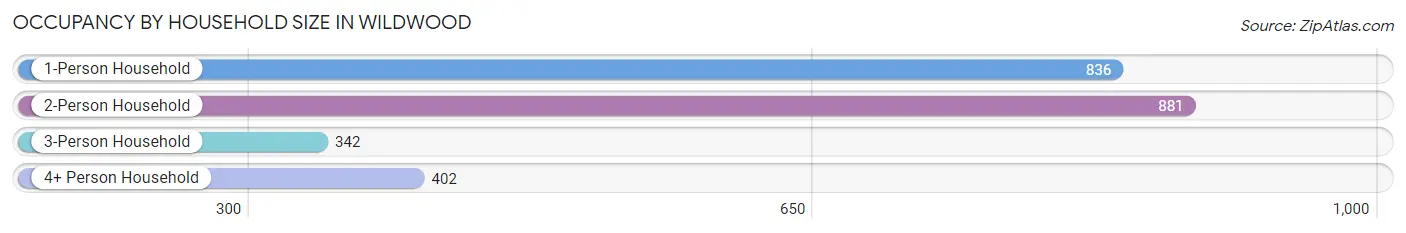
| Household Size | # Housing Units | % Housing Units |
| 1-Person Household | 836 | 34.0% |
| 2-Person Household | 881 | 35.8% |
| 3-Person Household | 342 | 13.9% |
| 4+ Person Household | 402 | 16.3% |
| Total Housing Units | 2,461 | 100.0% |
Occupancy by Ownership by Household Size in Wildwood
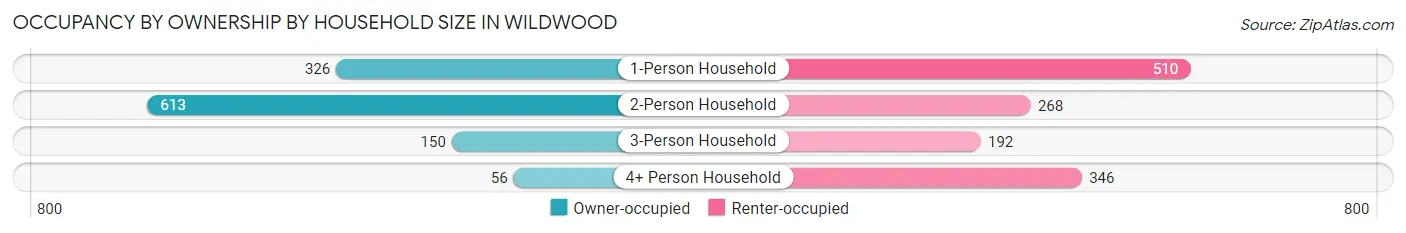
| Household Size | Owner-occupied | Renter-occupied |
| 1-Person Household | 326 (39.0%) | 510 (61.0%) |
| 2-Person Household | 613 (69.6%) | 268 (30.4%) |
| 3-Person Household | 150 (43.9%) | 192 (56.1%) |
| 4+ Person Household | 56 (13.9%) | 346 (86.1%) |
| Total Housing Units | 1,145 (46.5%) | 1,316 (53.5%) |
Occupancy by Educational Attainment in Wildwood
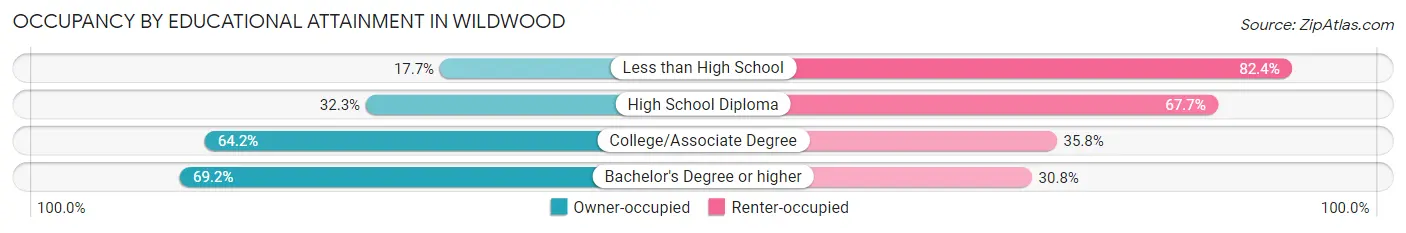
| Household Size | Owner-occupied | Renter-occupied |
| Less than High School | 36 (17.6%) | 168 (82.4%) |
| High School Diploma | 366 (32.3%) | 766 (67.7%) |
| College/Associate Degree | 458 (64.2%) | 255 (35.8%) |
| Bachelor's Degree or higher | 285 (69.2%) | 127 (30.8%) |
Occupancy by Age of Householder in Wildwood
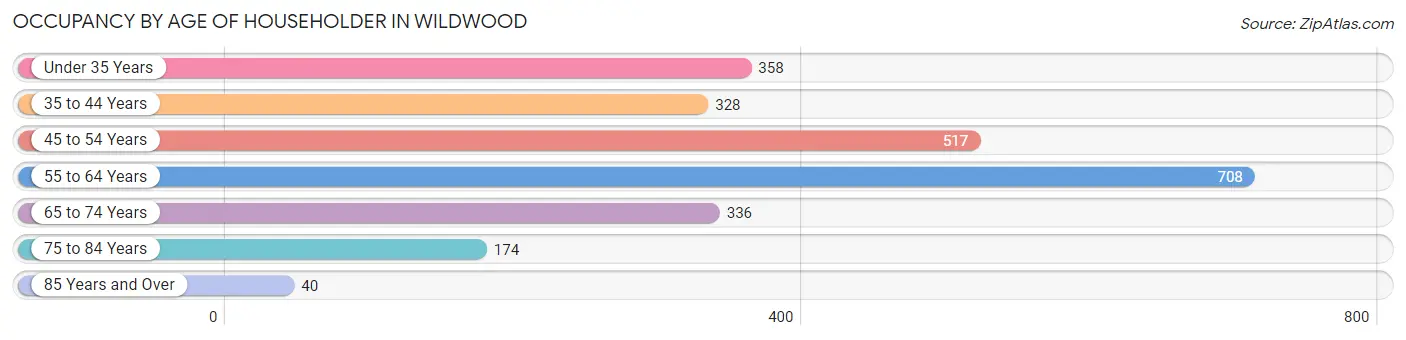
| Age Bracket | # Households | % Households |
| Under 35 Years | 358 | 14.5% |
| 35 to 44 Years | 328 | 13.3% |
| 45 to 54 Years | 517 | 21.0% |
| 55 to 64 Years | 708 | 28.8% |
| 65 to 74 Years | 336 | 13.7% |
| 75 to 84 Years | 174 | 7.1% |
| 85 Years and Over | 40 | 1.6% |
| Total | 2,461 | 100.0% |
Housing Finances in Wildwood
Median Income by Occupancy in Wildwood
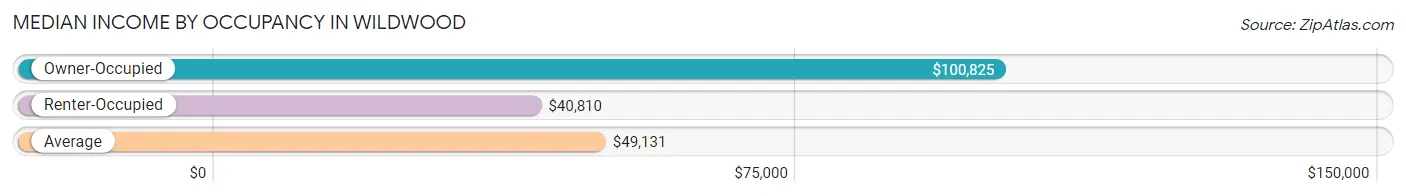
| Occupancy Type | # Households | Median Income |
| Owner-Occupied | 1,145 (46.5%) | $100,825 |
| Renter-Occupied | 1,316 (53.5%) | $40,810 |
| Average | 2,461 (100.0%) | $49,131 |
Occupancy by Householder Income Bracket in Wildwood
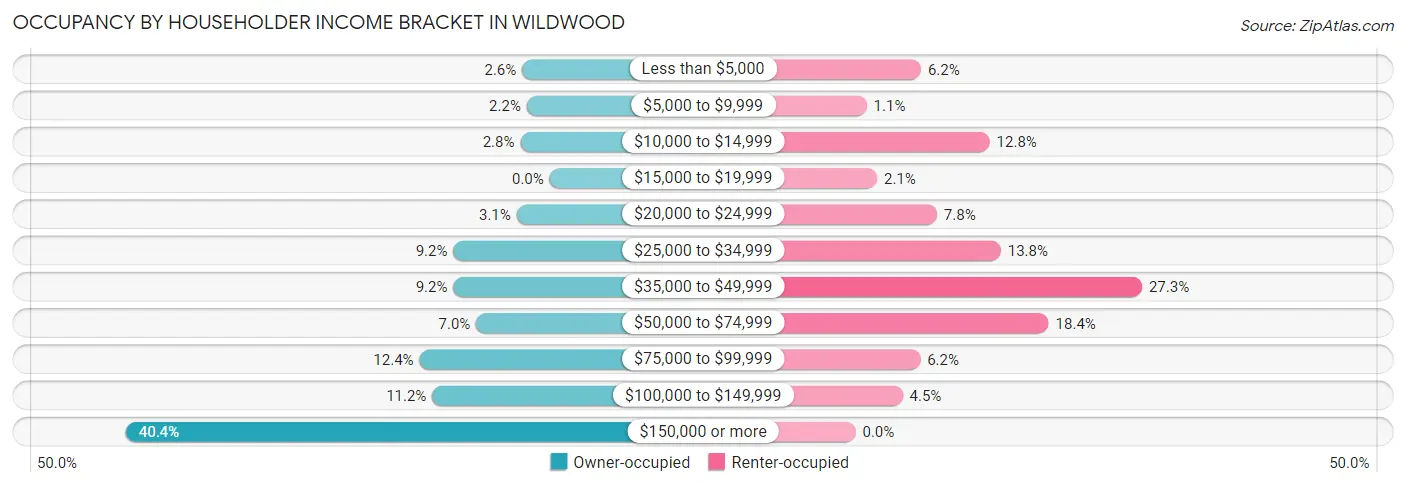
| Income Bracket | Owner-occupied | Renter-occupied |
| Less than $5,000 | 30 (2.6%) | 82 (6.2%) |
| $5,000 to $9,999 | 25 (2.2%) | 14 (1.1%) |
| $10,000 to $14,999 | 32 (2.8%) | 168 (12.8%) |
| $15,000 to $19,999 | 0 (0.0%) | 27 (2.1%) |
| $20,000 to $24,999 | 36 (3.1%) | 102 (7.7%) |
| $25,000 to $34,999 | 105 (9.2%) | 182 (13.8%) |
| $35,000 to $49,999 | 105 (9.2%) | 359 (27.3%) |
| $50,000 to $74,999 | 80 (7.0%) | 242 (18.4%) |
| $75,000 to $99,999 | 142 (12.4%) | 81 (6.2%) |
| $100,000 to $149,999 | 128 (11.2%) | 59 (4.5%) |
| $150,000 or more | 462 (40.4%) | 0 (0.0%) |
| Total | 1,145 (100.0%) | 1,316 (100.0%) |
Monthly Housing Cost Tiers in Wildwood
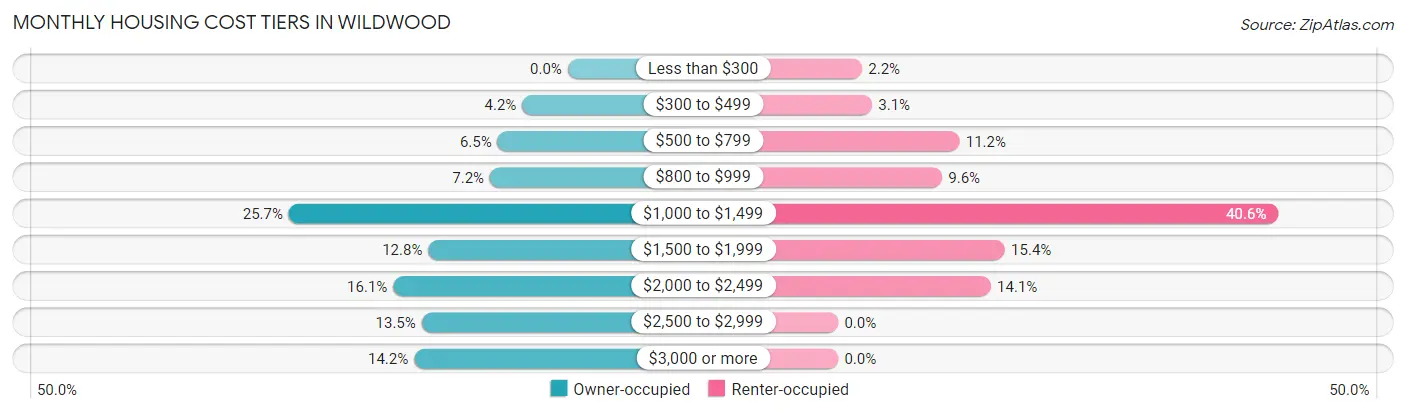
| Monthly Cost | Owner-occupied | Renter-occupied |
| Less than $300 | 0 (0.0%) | 29 (2.2%) |
| $300 to $499 | 48 (4.2%) | 41 (3.1%) |
| $500 to $799 | 74 (6.5%) | 147 (11.2%) |
| $800 to $999 | 82 (7.2%) | 126 (9.6%) |
| $1,000 to $1,499 | 294 (25.7%) | 534 (40.6%) |
| $1,500 to $1,999 | 147 (12.8%) | 202 (15.3%) |
| $2,000 to $2,499 | 184 (16.1%) | 185 (14.1%) |
| $2,500 to $2,999 | 154 (13.5%) | 0 (0.0%) |
| $3,000 or more | 162 (14.1%) | 0 (0.0%) |
| Total | 1,145 (100.0%) | 1,316 (100.0%) |
Physical Housing Characteristics in Wildwood
Housing Structures in Wildwood
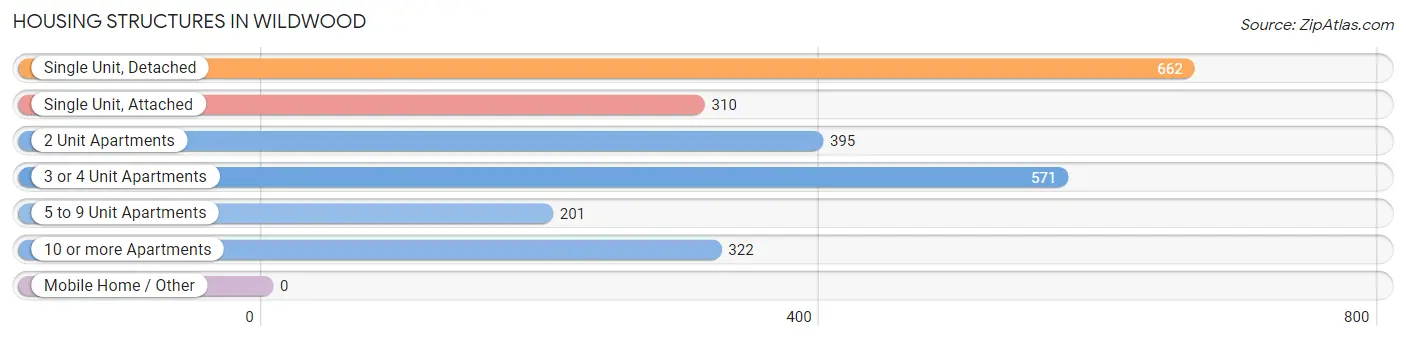
| Structure Type | # Housing Units | % Housing Units |
| Single Unit, Detached | 662 | 26.9% |
| Single Unit, Attached | 310 | 12.6% |
| 2 Unit Apartments | 395 | 16.1% |
| 3 or 4 Unit Apartments | 571 | 23.2% |
| 5 to 9 Unit Apartments | 201 | 8.2% |
| 10 or more Apartments | 322 | 13.1% |
| Mobile Home / Other | 0 | 0.0% |
| Total | 2,461 | 100.0% |
Housing Structures by Occupancy in Wildwood
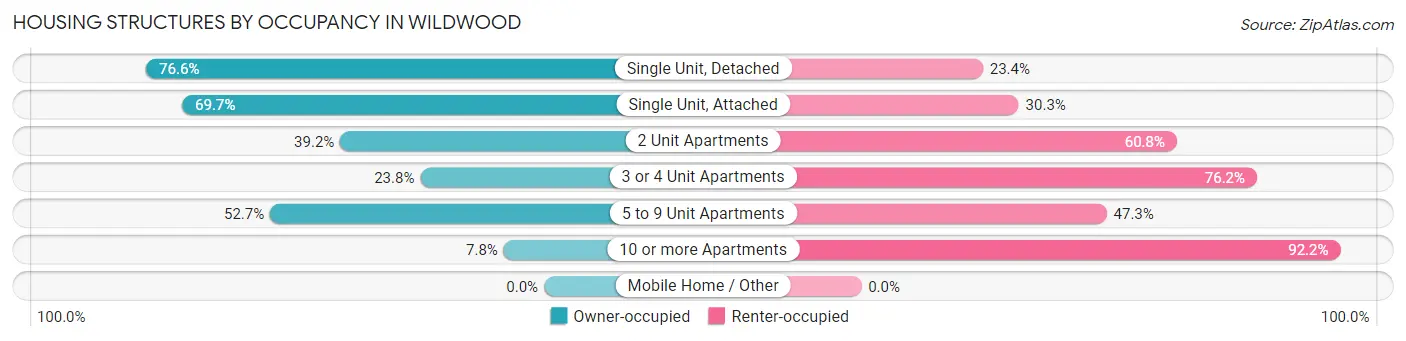
| Structure Type | Owner-occupied | Renter-occupied |
| Single Unit, Detached | 507 (76.6%) | 155 (23.4%) |
| Single Unit, Attached | 216 (69.7%) | 94 (30.3%) |
| 2 Unit Apartments | 155 (39.2%) | 240 (60.8%) |
| 3 or 4 Unit Apartments | 136 (23.8%) | 435 (76.2%) |
| 5 to 9 Unit Apartments | 106 (52.7%) | 95 (47.3%) |
| 10 or more Apartments | 25 (7.8%) | 297 (92.2%) |
| Mobile Home / Other | 0 (0.0%) | 0 (0.0%) |
| Total | 1,145 (46.5%) | 1,316 (53.5%) |
Housing Structures by Number of Rooms in Wildwood
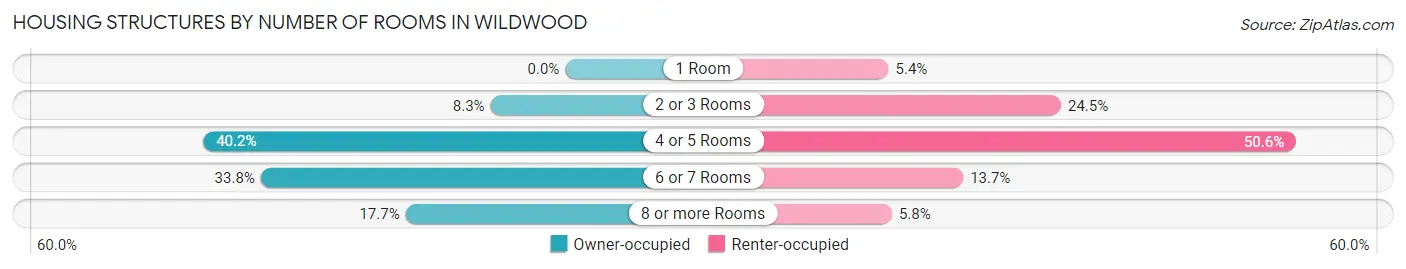
| Number of Rooms | Owner-occupied | Renter-occupied |
| 1 Room | 0 (0.0%) | 71 (5.4%) |
| 2 or 3 Rooms | 95 (8.3%) | 323 (24.5%) |
| 4 or 5 Rooms | 460 (40.2%) | 666 (50.6%) |
| 6 or 7 Rooms | 387 (33.8%) | 180 (13.7%) |
| 8 or more Rooms | 203 (17.7%) | 76 (5.8%) |
| Total | 1,145 (100.0%) | 1,316 (100.0%) |
Housing Structure by Heating Type in Wildwood
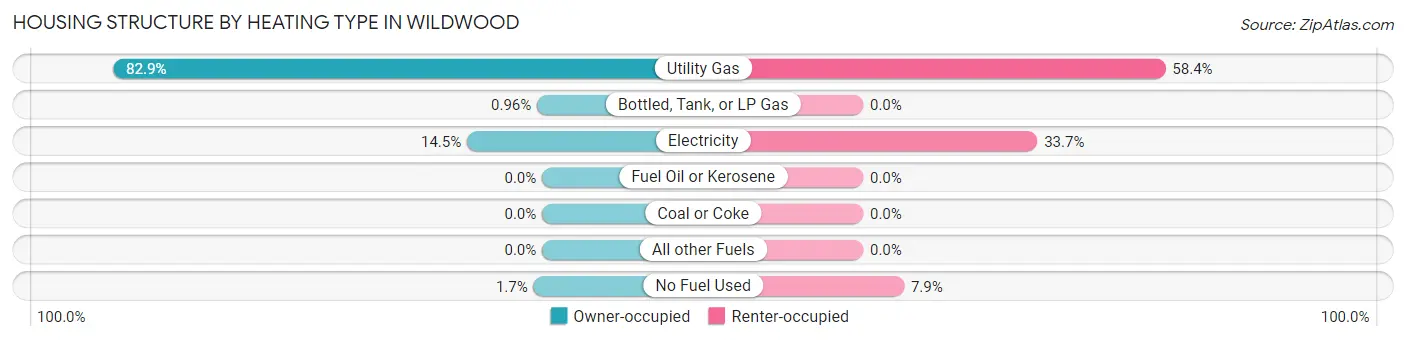
| Heating Type | Owner-occupied | Renter-occupied |
| Utility Gas | 949 (82.9%) | 769 (58.4%) |
| Bottled, Tank, or LP Gas | 11 (1.0%) | 0 (0.0%) |
| Electricity | 166 (14.5%) | 443 (33.7%) |
| Fuel Oil or Kerosene | 0 (0.0%) | 0 (0.0%) |
| Coal or Coke | 0 (0.0%) | 0 (0.0%) |
| All other Fuels | 0 (0.0%) | 0 (0.0%) |
| No Fuel Used | 19 (1.7%) | 104 (7.9%) |
| Total | 1,145 (100.0%) | 1,316 (100.0%) |
Household Vehicle Usage in Wildwood
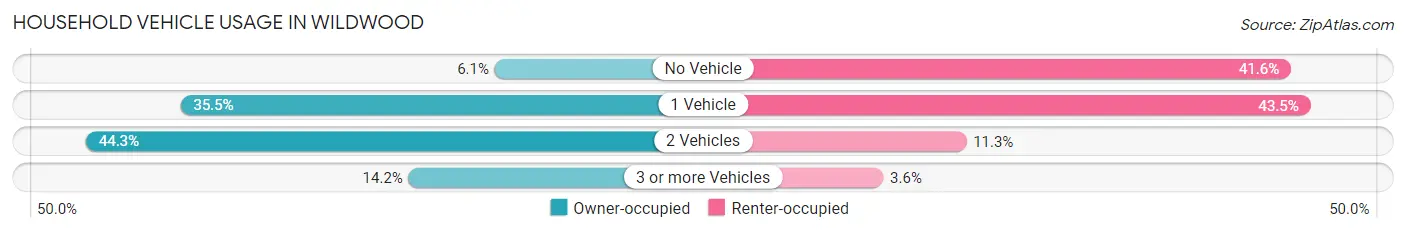
| Vehicles per Household | Owner-occupied | Renter-occupied |
| No Vehicle | 70 (6.1%) | 548 (41.6%) |
| 1 Vehicle | 406 (35.5%) | 572 (43.5%) |
| 2 Vehicles | 507 (44.3%) | 149 (11.3%) |
| 3 or more Vehicles | 162 (14.1%) | 47 (3.6%) |
| Total | 1,145 (100.0%) | 1,316 (100.0%) |
Real Estate & Mortgages in Wildwood
Real Estate and Mortgage Overview in Wildwood
| Characteristic | Without Mortgage | With Mortgage |
| Housing Units | 342 | 803 |
| Median Property Value | $309,800 | $330,300 |
| Median Household Income | $52,368 | $404 |
| Monthly Housing Costs | $880 | $162 |
| Real Estate Taxes | $6,216 | $18 |
Property Value by Mortgage Status in Wildwood
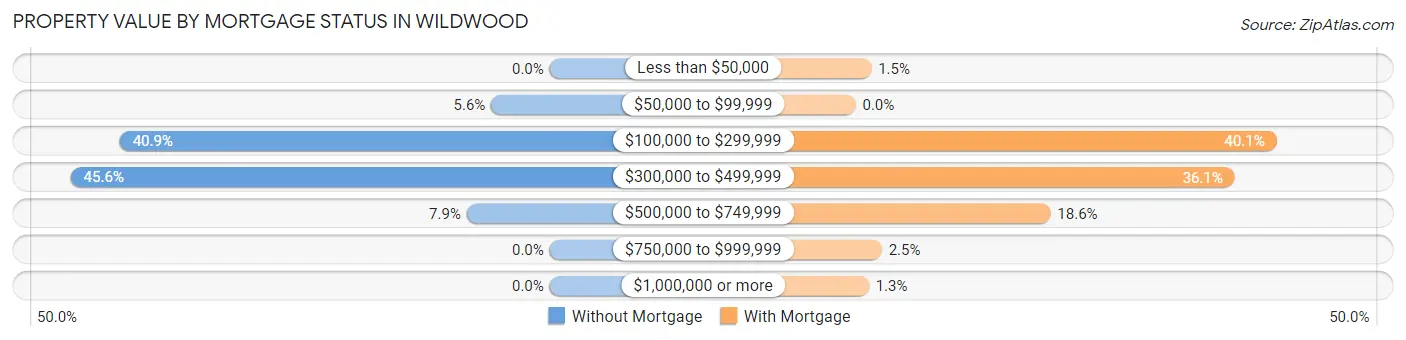
| Property Value | Without Mortgage | With Mortgage |
| Less than $50,000 | 0 (0.0%) | 12 (1.5%) |
| $50,000 to $99,999 | 19 (5.6%) | 0 (0.0%) |
| $100,000 to $299,999 | 140 (40.9%) | 322 (40.1%) |
| $300,000 to $499,999 | 156 (45.6%) | 290 (36.1%) |
| $500,000 to $749,999 | 27 (7.9%) | 149 (18.6%) |
| $750,000 to $999,999 | 0 (0.0%) | 20 (2.5%) |
| $1,000,000 or more | 0 (0.0%) | 10 (1.3%) |
| Total | 342 (100.0%) | 803 (100.0%) |
Household Income by Mortgage Status in Wildwood
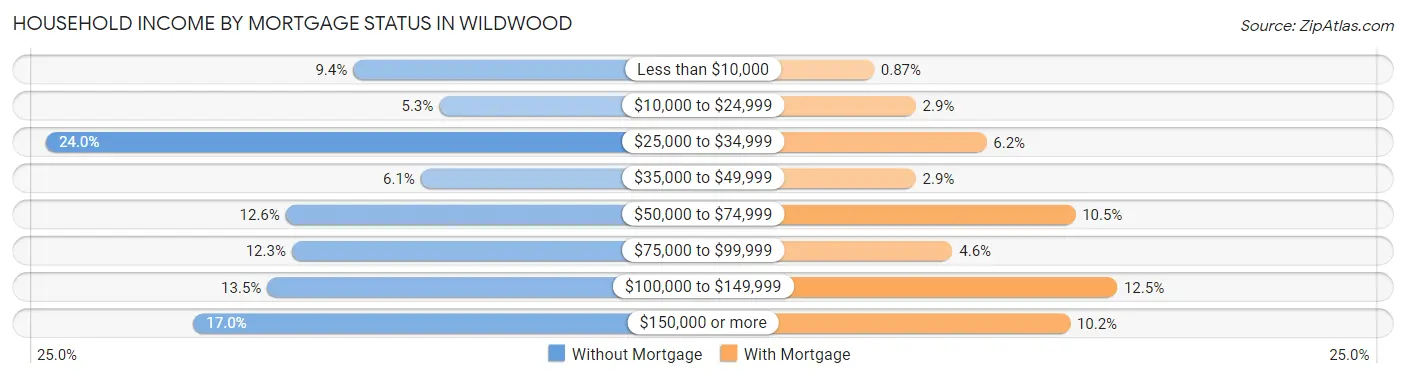
| Household Income | Without Mortgage | With Mortgage |
| Less than $10,000 | 32 (9.4%) | 7 (0.9%) |
| $10,000 to $24,999 | 18 (5.3%) | 23 (2.9%) |
| $25,000 to $34,999 | 82 (24.0%) | 50 (6.2%) |
| $35,000 to $49,999 | 21 (6.1%) | 23 (2.9%) |
| $50,000 to $74,999 | 43 (12.6%) | 84 (10.5%) |
| $75,000 to $99,999 | 42 (12.3%) | 37 (4.6%) |
| $100,000 to $149,999 | 46 (13.5%) | 100 (12.4%) |
| $150,000 or more | 58 (17.0%) | 82 (10.2%) |
| Total | 342 (100.0%) | 803 (100.0%) |
Property Value to Household Income Ratio in Wildwood
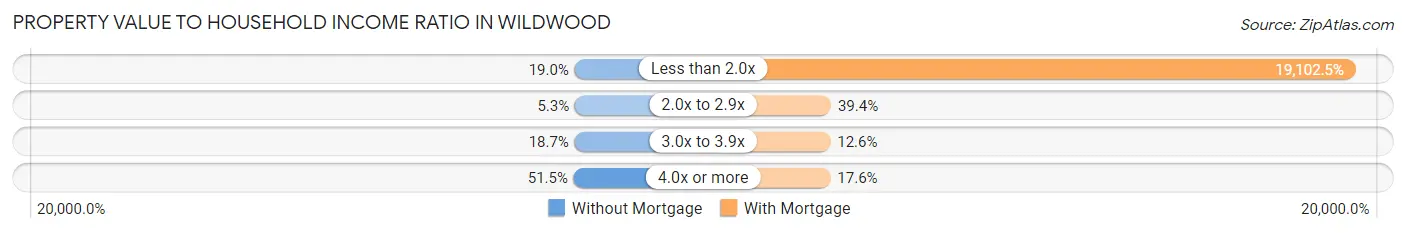
| Value-to-Income Ratio | Without Mortgage | With Mortgage |
| Less than 2.0x | 65 (19.0%) | 153,393 (19,102.5%) |
| 2.0x to 2.9x | 18 (5.3%) | 316 (39.4%) |
| 3.0x to 3.9x | 64 (18.7%) | 101 (12.6%) |
| 4.0x or more | 176 (51.5%) | 141 (17.6%) |
| Total | 342 (100.0%) | 803 (100.0%) |
Real Estate Taxes by Mortgage Status in Wildwood
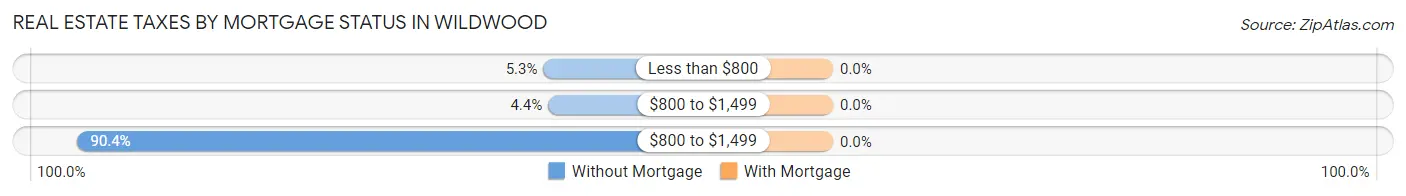
| Property Taxes | Without Mortgage | With Mortgage |
| Less than $800 | 18 (5.3%) | 0 (0.0%) |
| $800 to $1,499 | 15 (4.4%) | 0 (0.0%) |
| $800 to $1,499 | 309 (90.3%) | 0 (0.0%) |
| Total | 342 (100.0%) | 803 (100.0%) |
Health & Disability in Wildwood
Health Insurance Coverage by Age in Wildwood
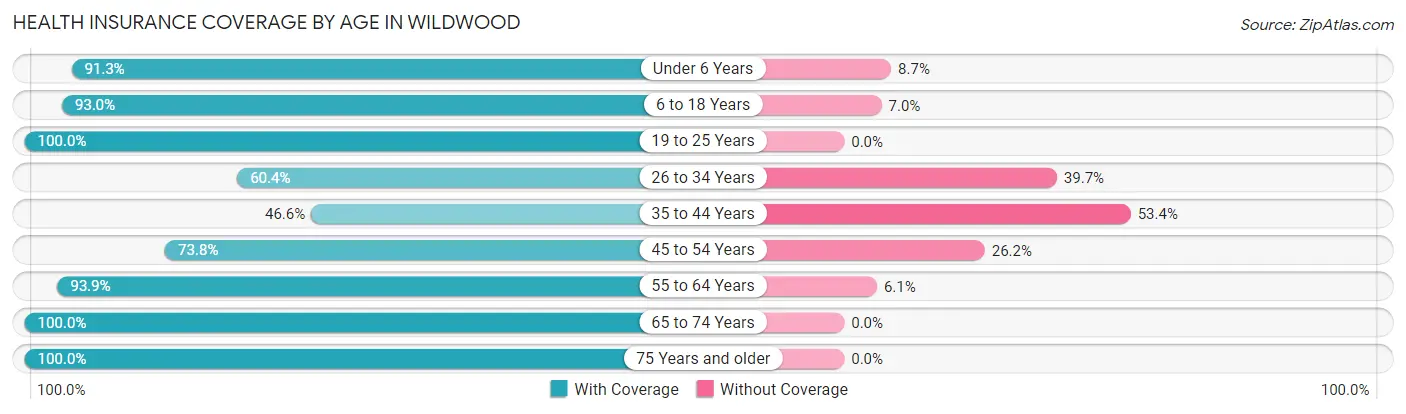
| Age Bracket | With Coverage | Without Coverage |
| Under 6 Years | 188 (91.3%) | 18 (8.7%) |
| 6 to 18 Years | 708 (93.0%) | 53 (7.0%) |
| 19 to 25 Years | 410 (100.0%) | 0 (0.0%) |
| 26 to 34 Years | 277 (60.4%) | 182 (39.7%) |
| 35 to 44 Years | 259 (46.6%) | 297 (53.4%) |
| 45 to 54 Years | 569 (73.8%) | 202 (26.2%) |
| 55 to 64 Years | 1,123 (93.9%) | 73 (6.1%) |
| 65 to 74 Years | 513 (100.0%) | 0 (0.0%) |
| 75 Years and older | 286 (100.0%) | 0 (0.0%) |
| Total | 4,333 (84.0%) | 825 (16.0%) |
Health Insurance Coverage by Citizenship Status in Wildwood

| Citizenship Status | With Coverage | Without Coverage |
| Native Born | 188 (91.3%) | 18 (8.7%) |
| Foreign Born, Citizen | 708 (93.0%) | 53 (7.0%) |
| Foreign Born, not a Citizen | 410 (100.0%) | 0 (0.0%) |
Health Insurance Coverage by Household Income in Wildwood
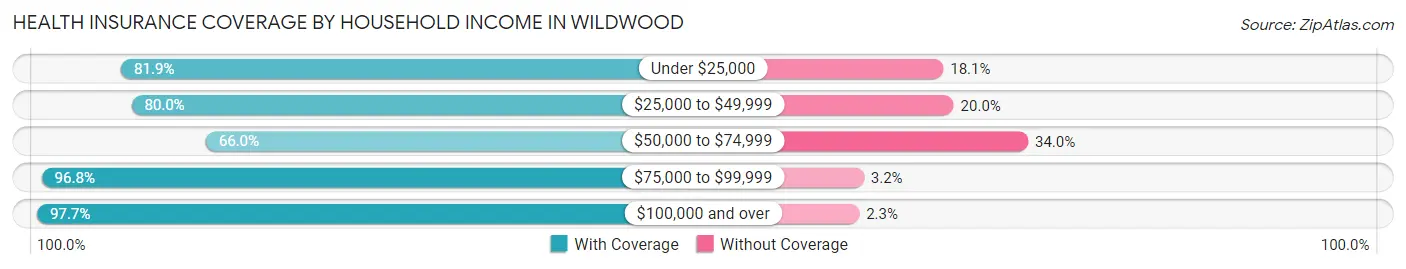
| Household Income | With Coverage | Without Coverage |
| Under $25,000 | 530 (81.9%) | 117 (18.1%) |
| $25,000 to $49,999 | 1,338 (80.0%) | 335 (20.0%) |
| $50,000 to $74,999 | 632 (66.0%) | 325 (34.0%) |
| $75,000 to $99,999 | 484 (96.8%) | 16 (3.2%) |
| $100,000 and over | 1,343 (97.7%) | 32 (2.3%) |
Public vs Private Health Insurance Coverage by Age in Wildwood
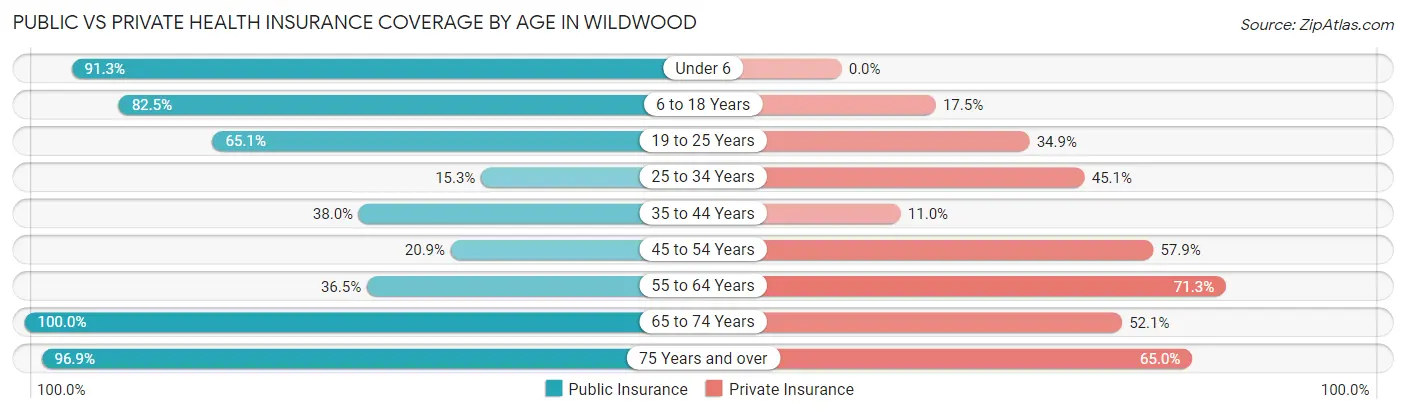
| Age Bracket | Public Insurance | Private Insurance |
| Under 6 | 188 (91.3%) | 0 (0.0%) |
| 6 to 18 Years | 628 (82.5%) | 133 (17.5%) |
| 19 to 25 Years | 267 (65.1%) | 143 (34.9%) |
| 25 to 34 Years | 70 (15.2%) | 207 (45.1%) |
| 35 to 44 Years | 211 (38.0%) | 61 (11.0%) |
| 45 to 54 Years | 161 (20.9%) | 446 (57.9%) |
| 55 to 64 Years | 436 (36.4%) | 853 (71.3%) |
| 65 to 74 Years | 513 (100.0%) | 267 (52.0%) |
| 75 Years and over | 277 (96.9%) | 186 (65.0%) |
| Total | 2,751 (53.3%) | 2,296 (44.5%) |
Disability Status by Sex by Age in Wildwood
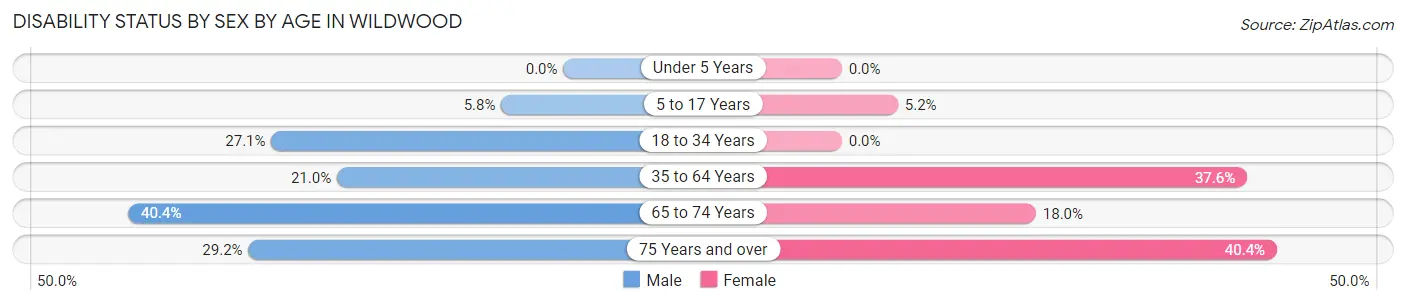
| Age Bracket | Male | Female |
| Under 5 Years | 0 (0.0%) | 0 (0.0%) |
| 5 to 17 Years | 17 (5.8%) | 23 (5.2%) |
| 18 to 34 Years | 87 (27.1%) | 0 (0.0%) |
| 35 to 64 Years | 287 (21.0%) | 435 (37.6%) |
| 65 to 74 Years | 122 (40.4%) | 38 (18.0%) |
| 75 Years and over | 38 (29.2%) | 63 (40.4%) |
Disability Class by Sex by Age in Wildwood
Disability Class: Hearing Difficulty
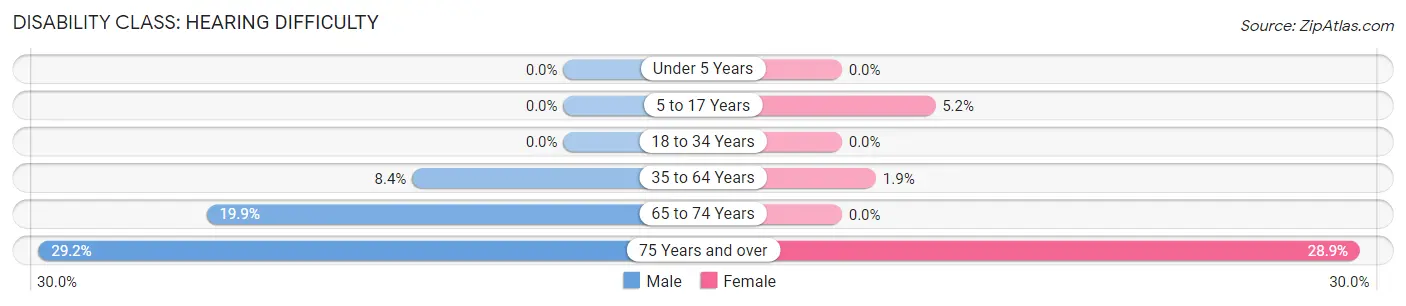
| Age Bracket | Male | Female |
| Under 5 Years | 0 (0.0%) | 0 (0.0%) |
| 5 to 17 Years | 0 (0.0%) | 23 (5.2%) |
| 18 to 34 Years | 0 (0.0%) | 0 (0.0%) |
| 35 to 64 Years | 115 (8.4%) | 22 (1.9%) |
| 65 to 74 Years | 60 (19.9%) | 0 (0.0%) |
| 75 Years and over | 38 (29.2%) | 45 (28.8%) |
Disability Class: Vision Difficulty
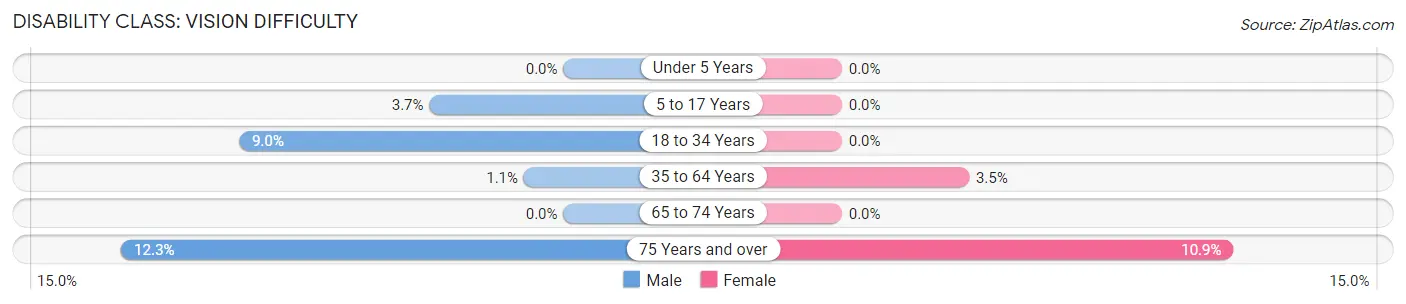
| Age Bracket | Male | Female |
| Under 5 Years | 0 (0.0%) | 0 (0.0%) |
| 5 to 17 Years | 11 (3.7%) | 0 (0.0%) |
| 18 to 34 Years | 29 (9.0%) | 0 (0.0%) |
| 35 to 64 Years | 15 (1.1%) | 41 (3.5%) |
| 65 to 74 Years | 0 (0.0%) | 0 (0.0%) |
| 75 Years and over | 16 (12.3%) | 17 (10.9%) |
Disability Class: Cognitive Difficulty
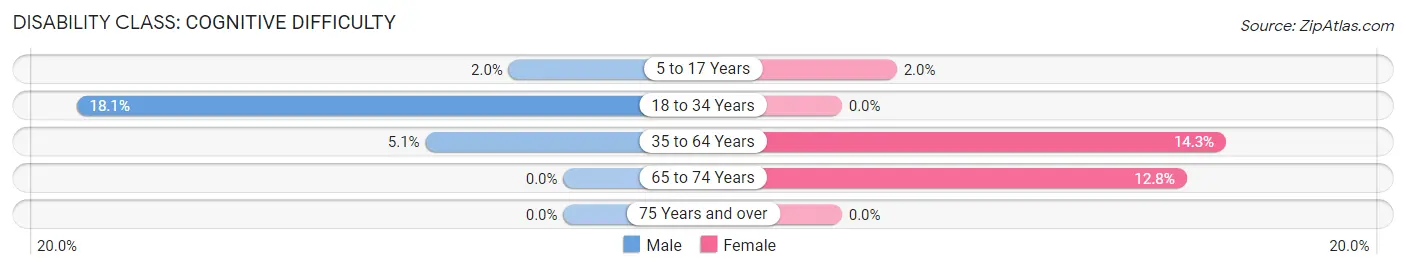
| Age Bracket | Male | Female |
| 5 to 17 Years | 6 (2.0%) | 9 (2.0%) |
| 18 to 34 Years | 58 (18.1%) | 0 (0.0%) |
| 35 to 64 Years | 70 (5.1%) | 165 (14.3%) |
| 65 to 74 Years | 0 (0.0%) | 27 (12.8%) |
| 75 Years and over | 0 (0.0%) | 0 (0.0%) |
Disability Class: Ambulatory Difficulty
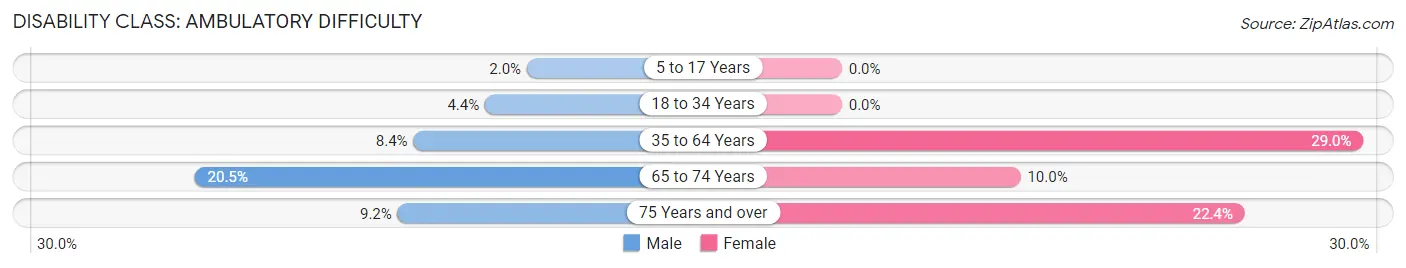
| Age Bracket | Male | Female |
| 5 to 17 Years | 6 (2.0%) | 0 (0.0%) |
| 18 to 34 Years | 14 (4.4%) | 0 (0.0%) |
| 35 to 64 Years | 114 (8.4%) | 336 (29.0%) |
| 65 to 74 Years | 62 (20.5%) | 21 (10.0%) |
| 75 Years and over | 12 (9.2%) | 35 (22.4%) |
Disability Class: Self-Care Difficulty
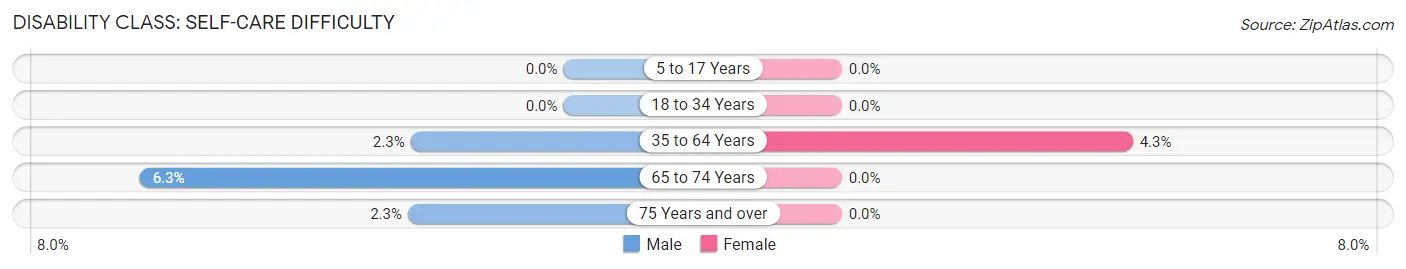
| Age Bracket | Male | Female |
| 5 to 17 Years | 0 (0.0%) | 0 (0.0%) |
| 18 to 34 Years | 0 (0.0%) | 0 (0.0%) |
| 35 to 64 Years | 31 (2.3%) | 50 (4.3%) |
| 65 to 74 Years | 19 (6.3%) | 0 (0.0%) |
| 75 Years and over | 3 (2.3%) | 0 (0.0%) |
Technology Access in Wildwood
Computing Device Access in Wildwood
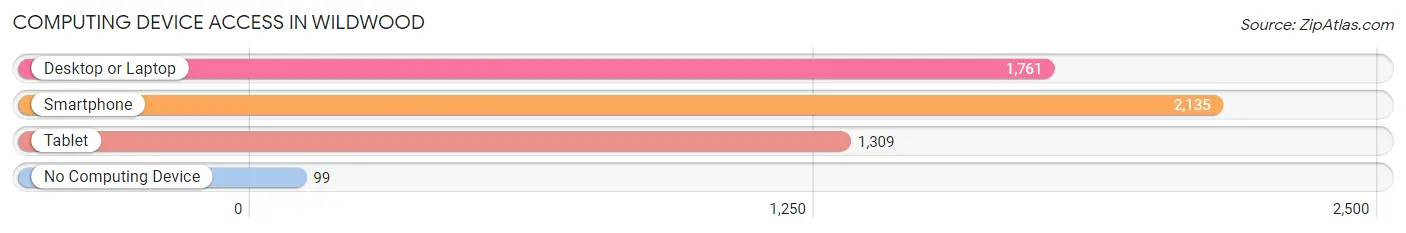
| Device Type | # Households | % Households |
| Desktop or Laptop | 1,761 | 71.6% |
| Smartphone | 2,135 | 86.8% |
| Tablet | 1,309 | 53.2% |
| No Computing Device | 99 | 4.0% |
| Total | 2,461 | 100.0% |
Internet Access in Wildwood
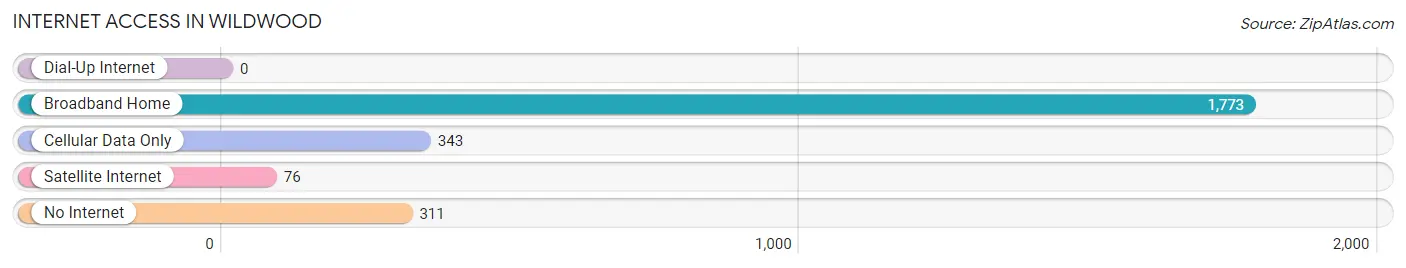
| Internet Type | # Households | % Households |
| Dial-Up Internet | 0 | 0.0% |
| Broadband Home | 1,773 | 72.0% |
| Cellular Data Only | 343 | 13.9% |
| Satellite Internet | 76 | 3.1% |
| No Internet | 311 | 12.6% |
| Total | 2,461 | 100.0% |
Wildwood Summary
Wildwood, NJ is a city located in Cape May County, New Jersey. It is situated on the Jersey Shore, approximately two hours south of New York City and one hour south of Philadelphia. The city is known for its boardwalk, amusement piers, and beaches. Wildwood is a popular summer destination for tourists from all over the country.
History
The area that is now Wildwood was first settled in the early 1700s by the Lenni Lenape Native Americans. The first European settlers arrived in the area in the late 1700s. The area was originally known as “Five Mile Beach” due to its location five miles south of Cape May. In 1874, the area was renamed “Wildwood” after the wildflowers that grew in the area.
In the late 1800s, Wildwood began to develop as a resort town. The first hotel was built in 1884 and the first boardwalk was constructed in 1895. The boardwalk quickly became a popular destination for tourists and locals alike. In the early 1900s, the area began to develop more rapidly with the construction of more hotels, restaurants, and amusement piers.
Geography
Wildwood is located in Cape May County, New Jersey. It is situated on the Jersey Shore, approximately two hours south of New York City and one hour south of Philadelphia. The city is bordered by the Atlantic Ocean to the east and the Delaware Bay to the west. The city covers an area of 4.2 square miles and has a population of 5,325 as of the 2010 census.
The city is divided into two sections: North Wildwood and Wildwood. North Wildwood is located on a barrier island and is connected to Wildwood by a bridge. The city is home to several beaches, including Wildwood Beach, North Wildwood Beach, and Wildwood Crest Beach. The city also has several parks, including Fox Park, Byrne Plaza, and Cresse Park.
Economy
Wildwood’s economy is largely driven by tourism. The city is home to several popular attractions, including the Wildwood Boardwalk, amusement piers, and beaches. The city also has several restaurants, bars, and shops. In addition, the city is home to several festivals and events throughout the year, including the Wildwood International Kite Festival and the Wildwood Music Festival.
Demographics
As of the 2010 census, Wildwood had a population of 5,325. The racial makeup of the city was 87.3% White, 5.2% African American, 0.3% Native American, 1.2% Asian, and 4.9% from other races. The median household income was $41,944 and the median family income was $50,944. The per capita income was $22,944.
Wildwood is a popular summer destination for tourists from all over the country. The city is known for its boardwalk, amusement piers, and beaches. The city has a rich history and a vibrant economy driven by tourism. The city is home to a diverse population and offers a variety of attractions and activities for visitors and locals alike.
Common Questions
What is the Total Population of Wildwood?
Total Population of Wildwood is 5,164.
What is the Total Male Population of Wildwood?
Total Male Population of Wildwood is 2,529.
What is the Total Female Population of Wildwood?
Total Female Population of Wildwood is 2,635.
What is the Ratio of Males per 100 Females in Wildwood?
There are 95.98 Males per 100 Females in Wildwood.
What is the Ratio of Females per 100 Males in Wildwood?
There are 104.19 Females per 100 Males in Wildwood.
What is the Median Population Age in Wildwood?
Median Population Age in Wildwood is 47.6 Years.
What is the Average Family Size in Wildwood
Average Family Size in Wildwood is 2.5 People.
What is the Average Household Size in Wildwood
Average Household Size in Wildwood is 2.1 People.
What is Per Capita Income in Wildwood?
Per Capita income in Wildwood is $43,732.
What is the Median Family Income in Wildwood?
Median Family Income in Wildwood is $68,222.
What is the Median Household income in Wildwood?
Median Household Income in Wildwood is $49,131.
What is Income or Wage Gap in Wildwood?
Income or Wage Gap in Wildwood is 19.3%.
Women in Wildwood earn 80.7 cents for every dollar earned by a man.
What is Family Income Deficit in Wildwood?
Family Income Deficit in Wildwood is $10,596.
Families that are below poverty line in Wildwood earn $10,596 less on average than the poverty threshold level.
What is Inequality or Gini Index in Wildwood?
Inequality or Gini Index in Wildwood is 0.55.
How Large is the Labor Force in Wildwood?
There are 2,520 People in the Labor Forcein in Wildwood.
What is the Percentage of People in the Labor Force in Wildwood?
58.5% of People are in the Labor Force in Wildwood.
What is the Unemployment Rate in Wildwood?
Unemployment Rate in Wildwood is 9.2%.