Leisuretowne, NJ
Leisuretowne Map
Leisuretowne Overview
3,211
TOTAL POPULATION
1,374
MALE POPULATION
1,837
FEMALE POPULATION
74.80
MALES / 100 FEMALES
133.70
FEMALES / 100 MALES
72.3
MEDIAN AGE
2.2
AVG FAMILY SIZE
1.6
AVG HOUSEHOLD SIZE
$43,390
PER CAPITA INCOME
$73,219
AVG FAMILY INCOME
$57,901
AVG HOUSEHOLD INCOME
0.40
INEQUALITY / GINI INDEX
725
LABOR FORCE [ PEOPLE ]
23.1%
PERCENT IN LABOR FORCE
8.1%
UNEMPLOYMENT RATE
Race in Leisuretowne
The most populous races in Leisuretowne are White / Caucasian (3,096 | 96.4%), Black / African American (87 | 2.7%), and Two or more Races (28 | 0.9%).
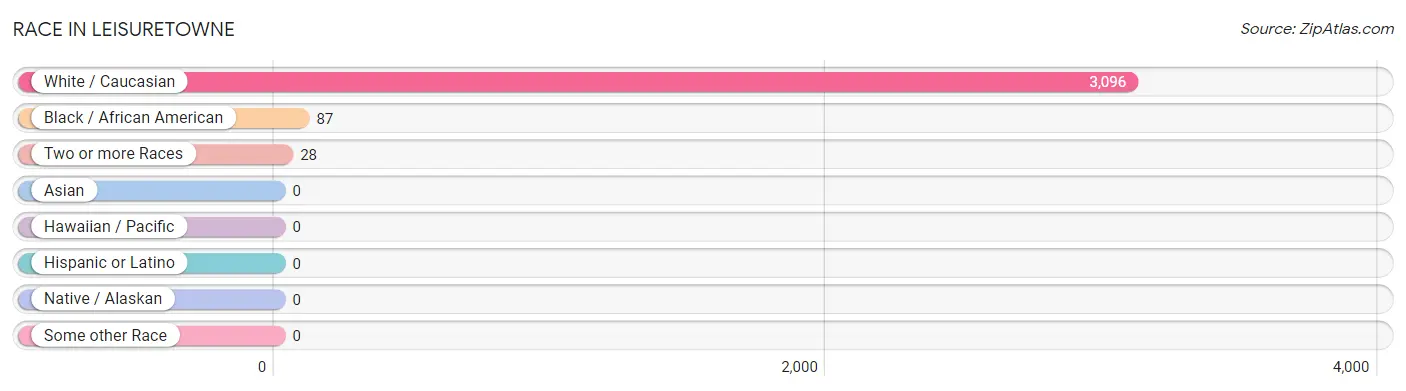
| Race | # Population | % Population |
| Asian | 0 | 0.0% |
| Black / African American | 87 | 2.7% |
| Hawaiian / Pacific | 0 | 0.0% |
| Hispanic or Latino | 0 | 0.0% |
| Native / Alaskan | 0 | 0.0% |
| White / Caucasian | 3,096 | 96.4% |
| Two or more Races | 28 | 0.9% |
| Some other Race | 0 | 0.0% |
| Total | 3,211 | 100.0% |
Ancestry in Leisuretowne
The most populous ancestries reported in Leisuretowne are Irish (986 | 30.7%), German (933 | 29.1%), English (556 | 17.3%), Italian (466 | 14.5%), and Polish (312 | 9.7%), together accounting for 101.3% of all Leisuretowne residents.
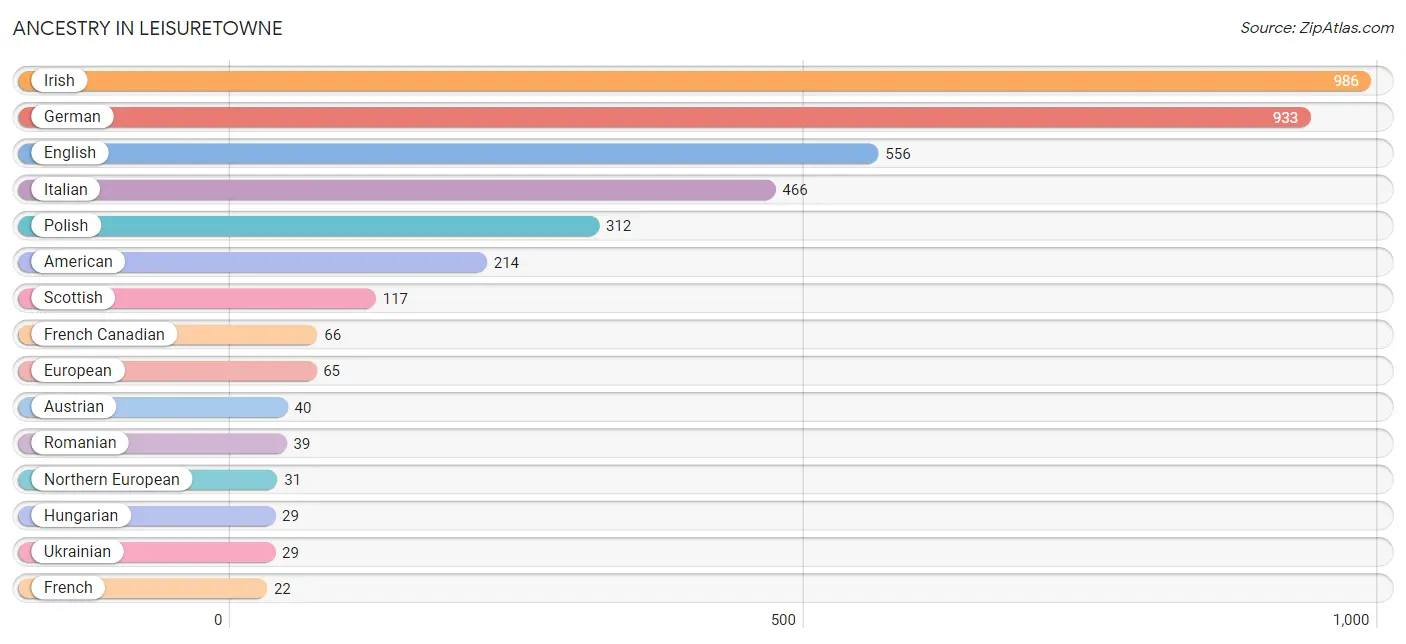
| Ancestry | # Population | % Population |
| American | 214 | 6.7% |
| Austrian | 40 | 1.3% |
| Bhutanese | 3 | 0.1% |
| British | 14 | 0.4% |
| Celtic | 15 | 0.5% |
| Czech | 14 | 0.4% |
| Dutch | 14 | 0.4% |
| English | 556 | 17.3% |
| European | 65 | 2.0% |
| Finnish | 14 | 0.4% |
| French | 22 | 0.7% |
| French Canadian | 66 | 2.1% |
| German | 933 | 29.1% |
| Hungarian | 29 | 0.9% |
| Iranian | 7 | 0.2% |
| Irish | 986 | 30.7% |
| Italian | 466 | 14.5% |
| Jamaican | 18 | 0.6% |
| Northern European | 31 | 1.0% |
| Norwegian | 12 | 0.4% |
| Polish | 312 | 9.7% |
| Romanian | 39 | 1.2% |
| Russian | 12 | 0.4% |
| Scotch-Irish | 14 | 0.4% |
| Scottish | 117 | 3.6% |
| Swiss | 14 | 0.4% |
| Ukrainian | 29 | 0.9% |
| Welsh | 15 | 0.5% | View All 28 Rows |
Immigrants in Leisuretowne
The most numerous immigrant groups reported in Leisuretowne came from Europe (37 | 1.1%), Western Europe (37 | 1.1%), Austria (23 | 0.7%), Caribbean (18 | 0.6%), and Jamaica (18 | 0.6%), together accounting for 4.1% of all Leisuretowne residents.
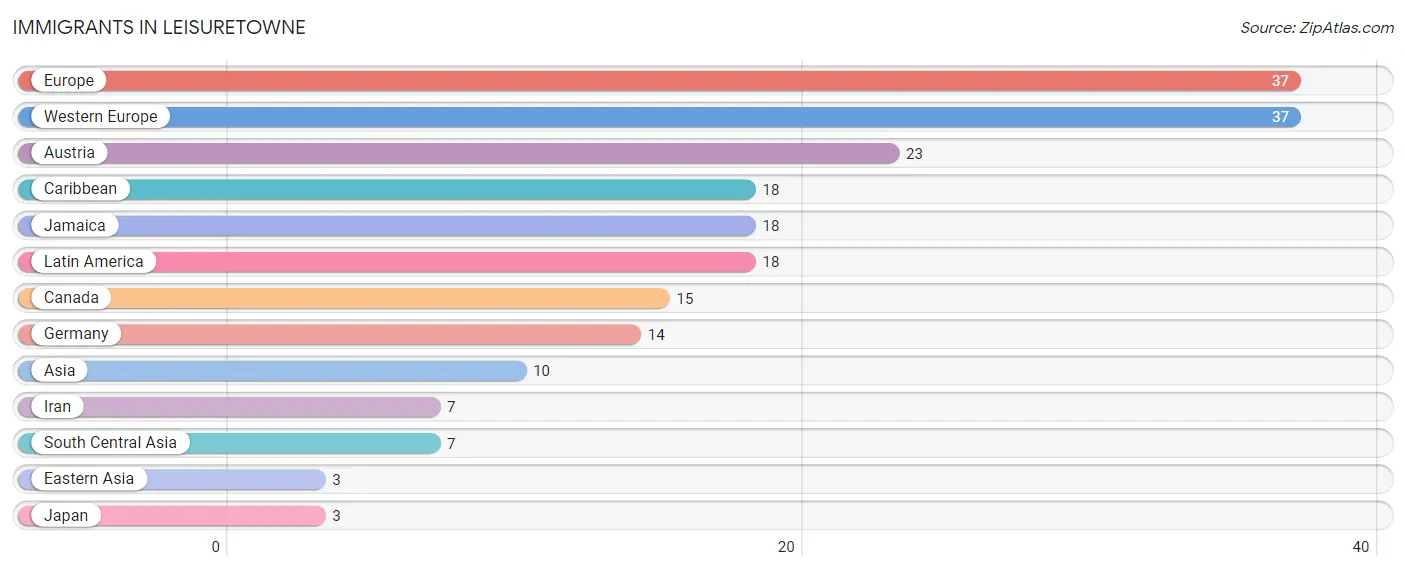
| Immigration Origin | # Population | % Population |
| Asia | 10 | 0.3% |
| Austria | 23 | 0.7% |
| Canada | 15 | 0.5% |
| Caribbean | 18 | 0.6% |
| Eastern Asia | 3 | 0.1% |
| Europe | 37 | 1.1% |
| Germany | 14 | 0.4% |
| Iran | 7 | 0.2% |
| Jamaica | 18 | 0.6% |
| Japan | 3 | 0.1% |
| Latin America | 18 | 0.6% |
| South Central Asia | 7 | 0.2% |
| Western Europe | 37 | 1.1% | View All 13 Rows |
Sex and Age in Leisuretowne
Sex and Age in Leisuretowne
The most populous age groups in Leisuretowne are 80 to 84 Years (260 | 18.9%) for men and 70 to 74 Years (396 | 21.6%) for women.
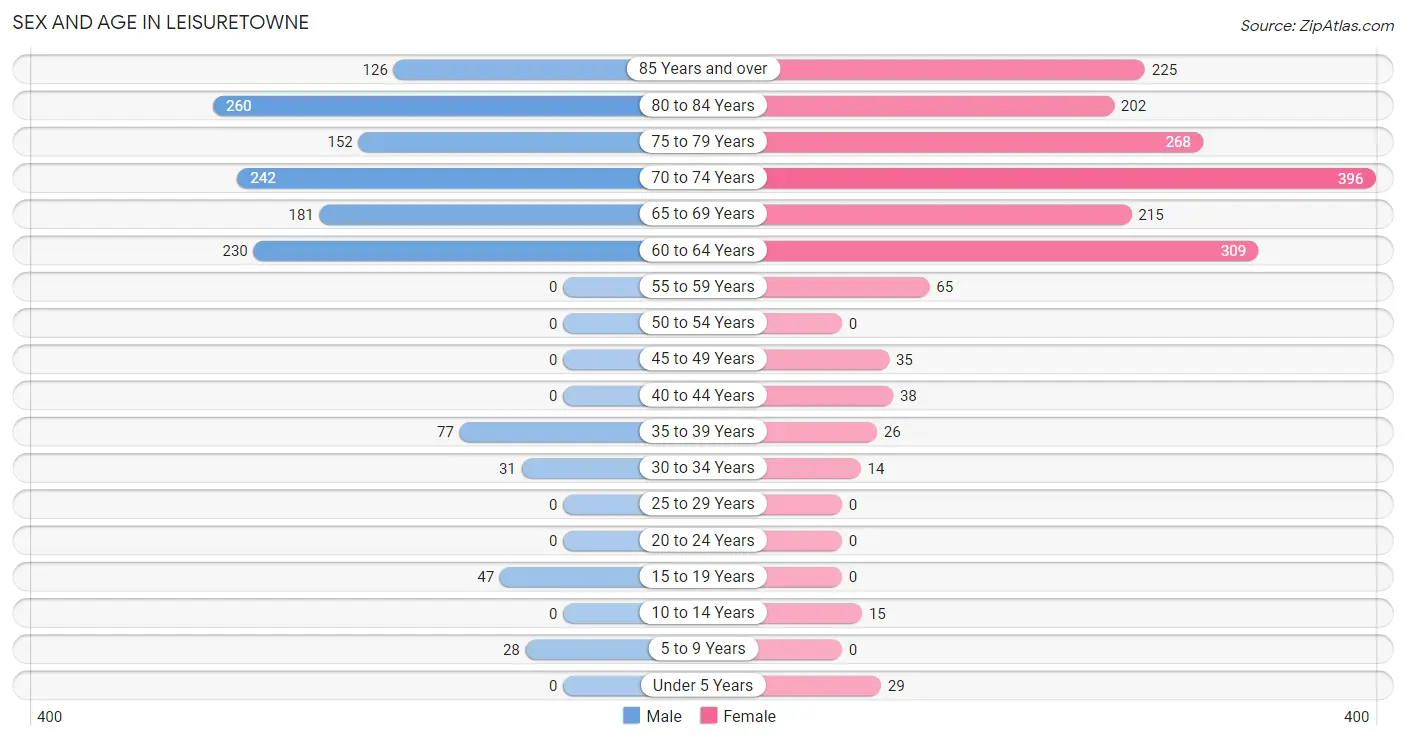
| Age Bracket | Male | Female |
| Under 5 Years | 0 (0.0%) | 29 (1.6%) |
| 5 to 9 Years | 28 (2.0%) | 0 (0.0%) |
| 10 to 14 Years | 0 (0.0%) | 15 (0.8%) |
| 15 to 19 Years | 47 (3.4%) | 0 (0.0%) |
| 20 to 24 Years | 0 (0.0%) | 0 (0.0%) |
| 25 to 29 Years | 0 (0.0%) | 0 (0.0%) |
| 30 to 34 Years | 31 (2.3%) | 14 (0.8%) |
| 35 to 39 Years | 77 (5.6%) | 26 (1.4%) |
| 40 to 44 Years | 0 (0.0%) | 38 (2.1%) |
| 45 to 49 Years | 0 (0.0%) | 35 (1.9%) |
| 50 to 54 Years | 0 (0.0%) | 0 (0.0%) |
| 55 to 59 Years | 0 (0.0%) | 65 (3.5%) |
| 60 to 64 Years | 230 (16.7%) | 309 (16.8%) |
| 65 to 69 Years | 181 (13.2%) | 215 (11.7%) |
| 70 to 74 Years | 242 (17.6%) | 396 (21.6%) |
| 75 to 79 Years | 152 (11.1%) | 268 (14.6%) |
| 80 to 84 Years | 260 (18.9%) | 202 (11.0%) |
| 85 Years and over | 126 (9.2%) | 225 (12.2%) |
| Total | 1,374 (100.0%) | 1,837 (100.0%) |
Families and Households in Leisuretowne
Median Family Size in Leisuretowne
The median family size in Leisuretowne is 2.21 persons per family, with single male/father families (11 | 1.1%) accounting for the largest median family size of 2.45 persons per family. On the other hand, single female/mother families (62 | 6.3%) represent the smallest median family size with 2.15 persons per family.
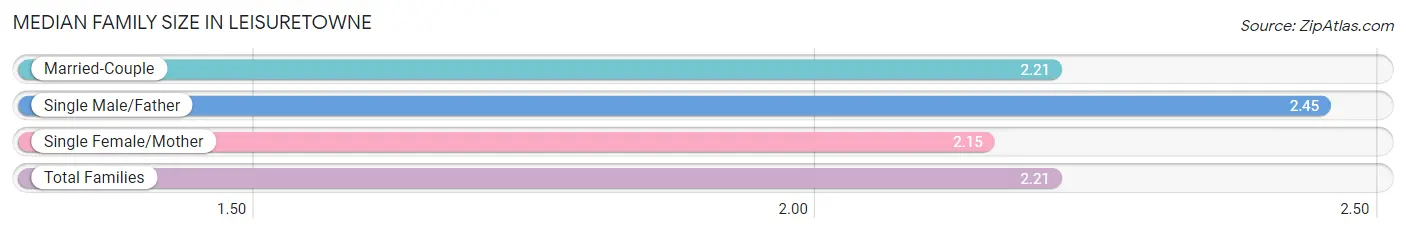
| Family Type | # Families | Family Size |
| Married-Couple | 916 (92.6%) | 2.21 |
| Single Male/Father | 11 (1.1%) | 2.45 |
| Single Female/Mother | 62 (6.3%) | 2.15 |
| Total Families | 989 (100.0%) | 2.21 |
Median Household Size in Leisuretowne
The median household size in Leisuretowne is 1.64 persons per household, with single male/father households (11 | 0.6%) accounting for the largest median household size of 2.45 persons per household. non-family households (974 | 49.6%) represent the smallest median household size with 1.05 persons per household.
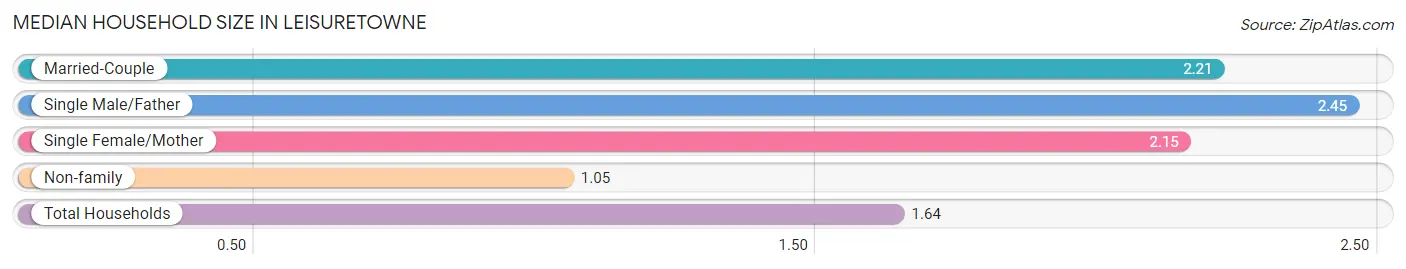
| Household Type | # Households | Household Size |
| Married-Couple | 916 (46.7%) | 2.21 |
| Single Male/Father | 11 (0.6%) | 2.45 |
| Single Female/Mother | 62 (3.2%) | 2.15 |
| Non-family | 974 (49.6%) | 1.05 |
| Total Households | 1,963 (100.0%) | 1.64 |
Household Size by Marriage Status in Leisuretowne
Out of a total of 1,963 households in Leisuretowne, 989 (50.4%) are family households, while 974 (49.6%) are nonfamily households. The most numerous type of family households are 2-person households, comprising 888, and the most common type of nonfamily households are 1-person households, comprising 928.
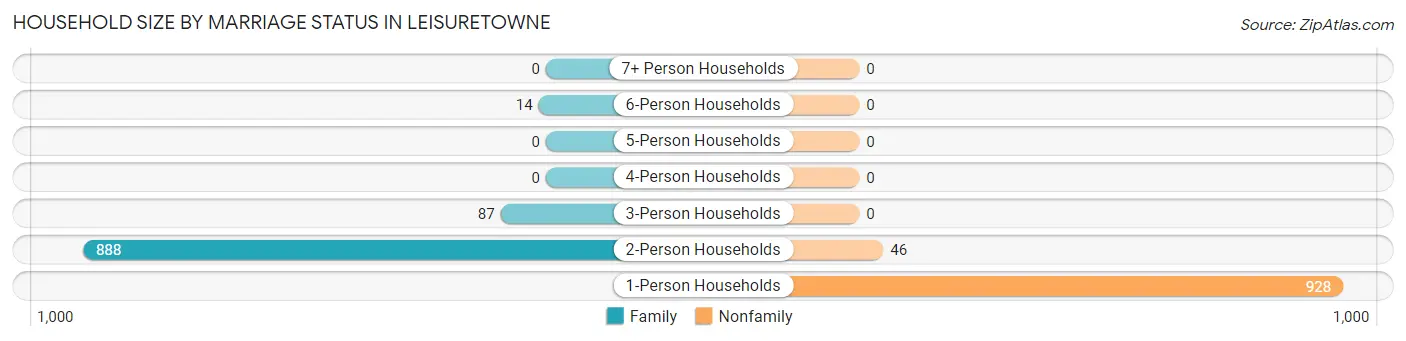
| Household Size | Family Households | Nonfamily Households |
| 1-Person Households | - | 928 (47.3%) |
| 2-Person Households | 888 (45.2%) | 46 (2.3%) |
| 3-Person Households | 87 (4.4%) | 0 (0.0%) |
| 4-Person Households | 0 (0.0%) | 0 (0.0%) |
| 5-Person Households | 0 (0.0%) | 0 (0.0%) |
| 6-Person Households | 14 (0.7%) | 0 (0.0%) |
| 7+ Person Households | 0 (0.0%) | 0 (0.0%) |
| Total | 989 (50.4%) | 974 (49.6%) |
Female Fertility in Leisuretowne
Fertility by Age in Leisuretowne
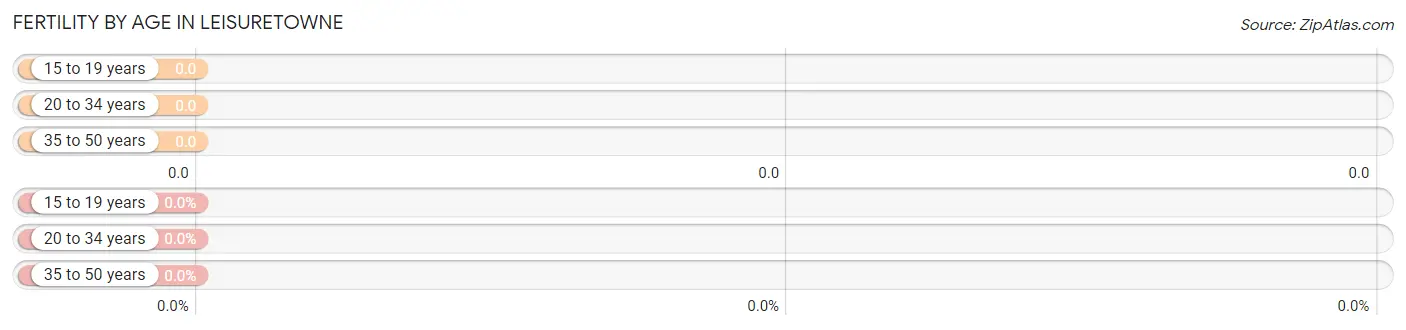
| Age Bracket | Women with Births | Births / 1,000 Women |
| 15 to 19 years | 0 (0.0%) | 0.0 |
| 20 to 34 years | 0 (0.0%) | 0.0 |
| 35 to 50 years | 0 (0.0%) | 0.0 |
| Total | 0 (0.0%) | 0.0 |
Fertility by Age by Marriage Status in Leisuretowne
| Age Bracket | Married | Unmarried |
| 15 to 19 years | 0 (0.0%) | 0 (0.0%) |
| 20 to 34 years | 0 (0.0%) | 0 (0.0%) |
| 35 to 50 years | 0 (0.0%) | 0 (0.0%) |
| Total | 0 (0.0%) | 0 (0.0%) |
Fertility by Education in Leisuretowne
| Educational Attainment | Women with Births | Births / 1,000 Women |
| Less than High School | 0 (0.0%) | 0.0 |
| High School Diploma | 0 (0.0%) | 0.0 |
| College or Associate's Degree | 0 (0.0%) | 0.0 |
| Bachelor's Degree | 0 (0.0%) | 0.0 |
| Graduate Degree | 0 (0.0%) | 0.0 |
| Total | 0 (0.0%) | 0.0 |
Fertility by Education by Marriage Status in Leisuretowne
| Educational Attainment | Married | Unmarried |
| Less than High School | 0 (0.0%) | 0 (0.0%) |
| High School Diploma | 0 (0.0%) | 0 (0.0%) |
| College or Associate's Degree | 0 (0.0%) | 0 (0.0%) |
| Bachelor's Degree | 0 (0.0%) | 0 (0.0%) |
| Graduate Degree | 0 (0.0%) | 0 (0.0%) |
| Total | 0 (0.0%) | 0 (0.0%) |
Income in Leisuretowne
Income Overview in Leisuretowne
Per Capita Income in Leisuretowne is $43,390, while median incomes of families and households are $73,219 and $57,901 respectively.
| Characteristic | Number | Measure |
| Per Capita Income | 3,211 | $43,390 |
| Median Family Income | 989 | $73,219 |
| Mean Family Income | 989 | $92,382 |
| Median Household Income | 1,963 | $57,901 |
| Mean Household Income | 1,963 | $70,320 |
| Income Deficit | 989 | $0 |
| Wage / Income Gap (%) | 3,211 | 0.00% |
| Wage / Income Gap ($) | 3,211 | 100.00¢ per $1 |
| Gini / Inequality Index | 3,211 | 0.40 |
Earnings by Sex in Leisuretowne
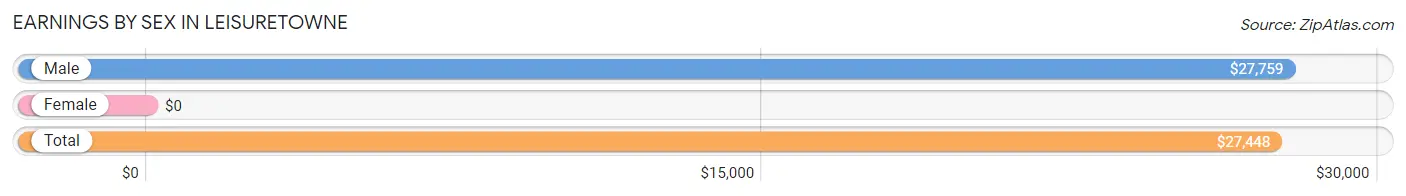
| Sex | Number | Average Earnings |
| Male | 392 (43.8%) | $27,759 |
| Female | 503 (56.2%) | $0 |
| Total | 895 (100.0%) | $27,448 |
Earnings by Sex by Income Bracket in Leisuretowne
The most common earnings brackets in Leisuretowne are $75,000 to $99,999 for men (90 | 23.0%) and $5,000 to $7,499 for women (106 | 21.1%).
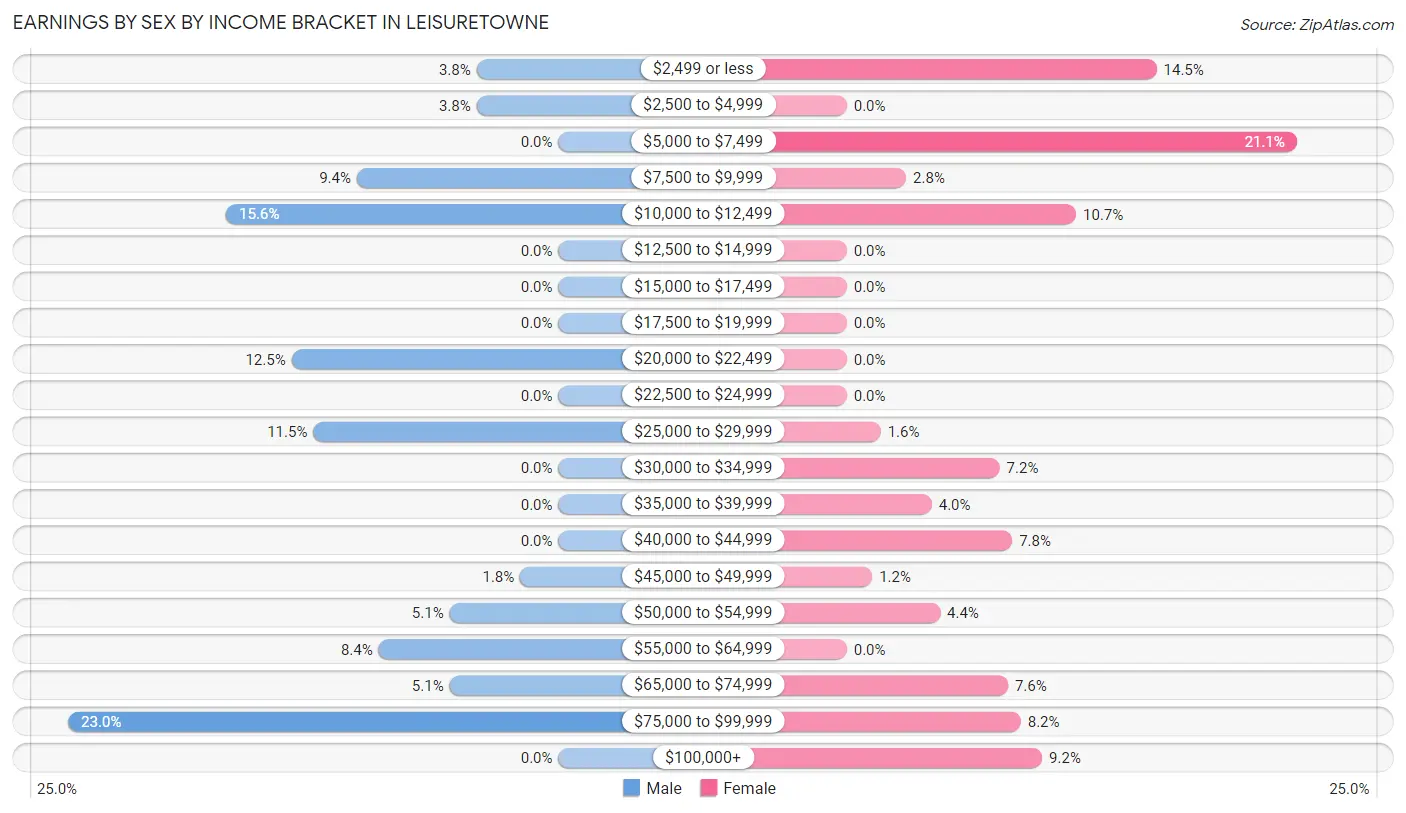
| Income | Male | Female |
| $2,499 or less | 15 (3.8%) | 73 (14.5%) |
| $2,500 to $4,999 | 15 (3.8%) | 0 (0.0%) |
| $5,000 to $7,499 | 0 (0.0%) | 106 (21.1%) |
| $7,500 to $9,999 | 37 (9.4%) | 14 (2.8%) |
| $10,000 to $12,499 | 61 (15.6%) | 54 (10.7%) |
| $12,500 to $14,999 | 0 (0.0%) | 0 (0.0%) |
| $15,000 to $17,499 | 0 (0.0%) | 0 (0.0%) |
| $17,500 to $19,999 | 0 (0.0%) | 0 (0.0%) |
| $20,000 to $22,499 | 49 (12.5%) | 0 (0.0%) |
| $22,500 to $24,999 | 0 (0.0%) | 0 (0.0%) |
| $25,000 to $29,999 | 45 (11.5%) | 8 (1.6%) |
| $30,000 to $34,999 | 0 (0.0%) | 36 (7.2%) |
| $35,000 to $39,999 | 0 (0.0%) | 20 (4.0%) |
| $40,000 to $44,999 | 0 (0.0%) | 39 (7.7%) |
| $45,000 to $49,999 | 7 (1.8%) | 6 (1.2%) |
| $50,000 to $54,999 | 20 (5.1%) | 22 (4.4%) |
| $55,000 to $64,999 | 33 (8.4%) | 0 (0.0%) |
| $65,000 to $74,999 | 20 (5.1%) | 38 (7.5%) |
| $75,000 to $99,999 | 90 (23.0%) | 41 (8.2%) |
| $100,000+ | 0 (0.0%) | 46 (9.1%) |
| Total | 392 (100.0%) | 503 (100.0%) |
Earnings by Sex by Educational Attainment in Leisuretowne
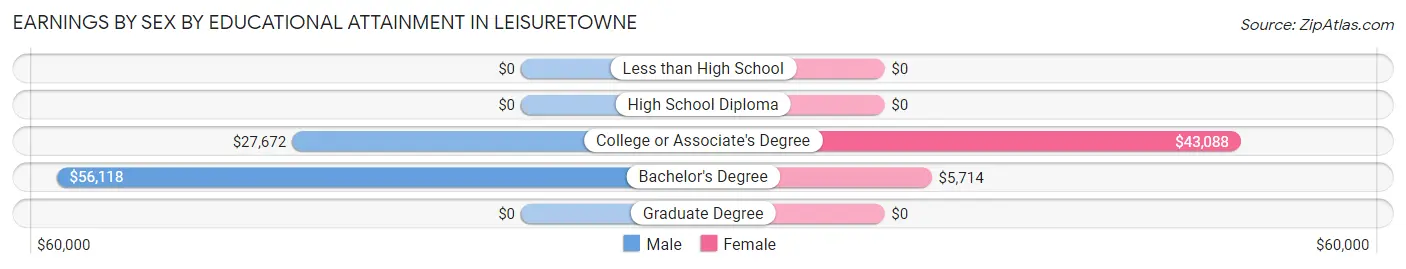
| Educational Attainment | Male Income | Female Income |
| Less than High School | - | - |
| High School Diploma | - | - |
| College or Associate's Degree | $27,672 | $43,088 |
| Bachelor's Degree | $56,118 | $5,714 |
| Graduate Degree | - | - |
| Total | - | - |
Family Income in Leisuretowne
Family Income Brackets in Leisuretowne
According to the Leisuretowne family income data, there are 312 families falling into the $50,000 to $74,999 income range, which is the most common income bracket and makes up 31.6% of all families.
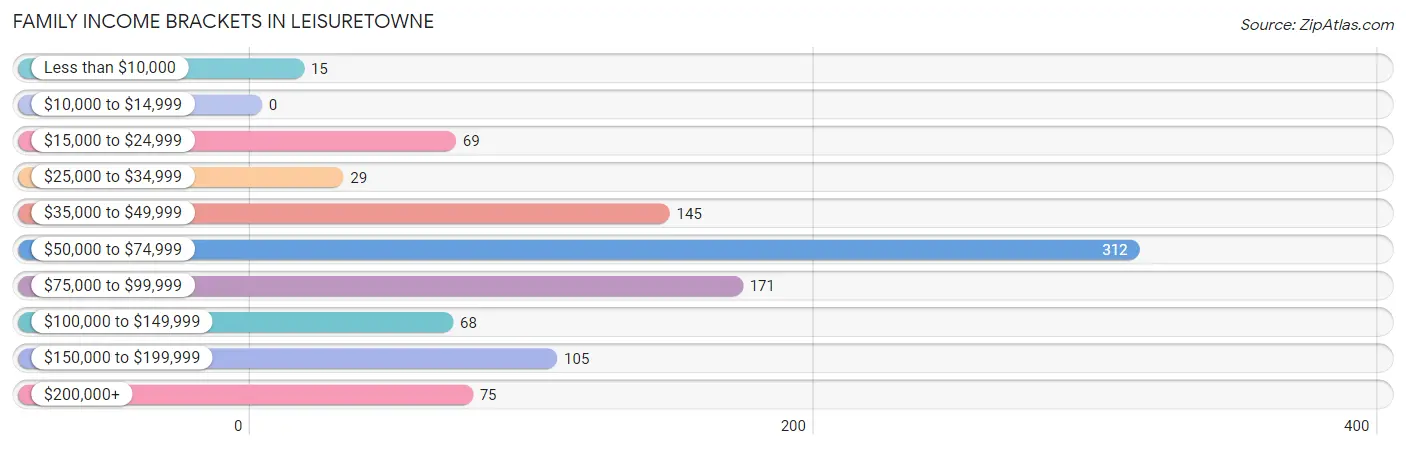
| Income Bracket | # Families | % Families |
| Less than $10,000 | 15 | 1.5% |
| $10,000 to $14,999 | 0 | 0.0% |
| $15,000 to $24,999 | 69 | 7.0% |
| $25,000 to $34,999 | 29 | 2.9% |
| $35,000 to $49,999 | 145 | 14.7% |
| $50,000 to $74,999 | 312 | 31.5% |
| $75,000 to $99,999 | 171 | 17.3% |
| $100,000 to $149,999 | 68 | 6.9% |
| $150,000 to $199,999 | 105 | 10.6% |
| $200,000+ | 75 | 7.6% |
Family Income by Famaliy Size in Leisuretowne
3-person families (87 | 8.8%) account for the highest median family income in Leisuretowne with $166,571 per family, while 3-person families (87 | 8.8%) have the highest median income of $55,524 per family member.
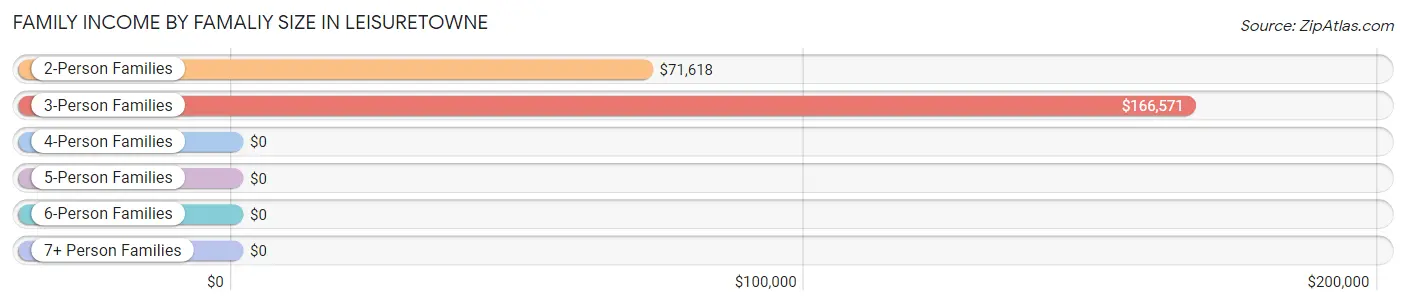
| Income Bracket | # Families | Median Income |
| 2-Person Families | 888 (89.8%) | $71,618 |
| 3-Person Families | 87 (8.8%) | $166,571 |
| 4-Person Families | 0 (0.0%) | $0 |
| 5-Person Families | 0 (0.0%) | $0 |
| 6-Person Families | 14 (1.4%) | $0 |
| 7+ Person Families | 0 (0.0%) | $0 |
| Total | 989 (100.0%) | $73,219 |
Family Income by Number of Earners in Leisuretowne
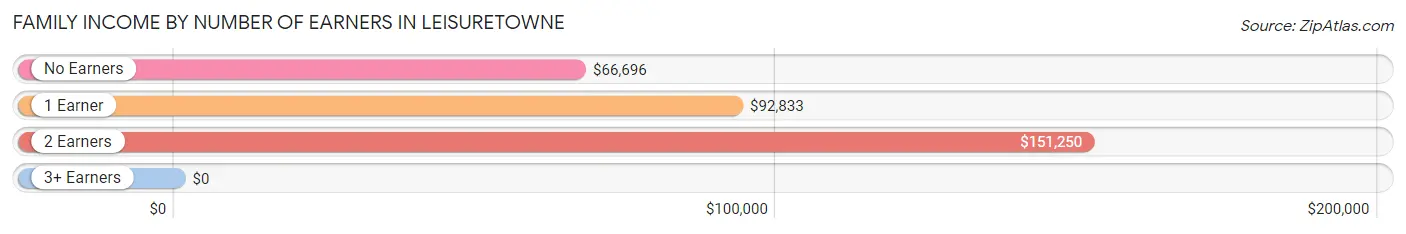
| Number of Earners | # Families | Median Income |
| No Earners | 677 (68.4%) | $66,696 |
| 1 Earner | 156 (15.8%) | $92,833 |
| 2 Earners | 117 (11.8%) | $151,250 |
| 3+ Earners | 39 (3.9%) | $0 |
| Total | 989 (100.0%) | $73,219 |
Household Income in Leisuretowne
Household Income Brackets in Leisuretowne
With 540 households falling in the category, the $50,000 to $74,999 income range is the most frequent in Leisuretowne, accounting for 27.5% of all households. In contrast, only 47 households (2.4%) fall into the less than $10,000 income bracket, making it the least populous group.
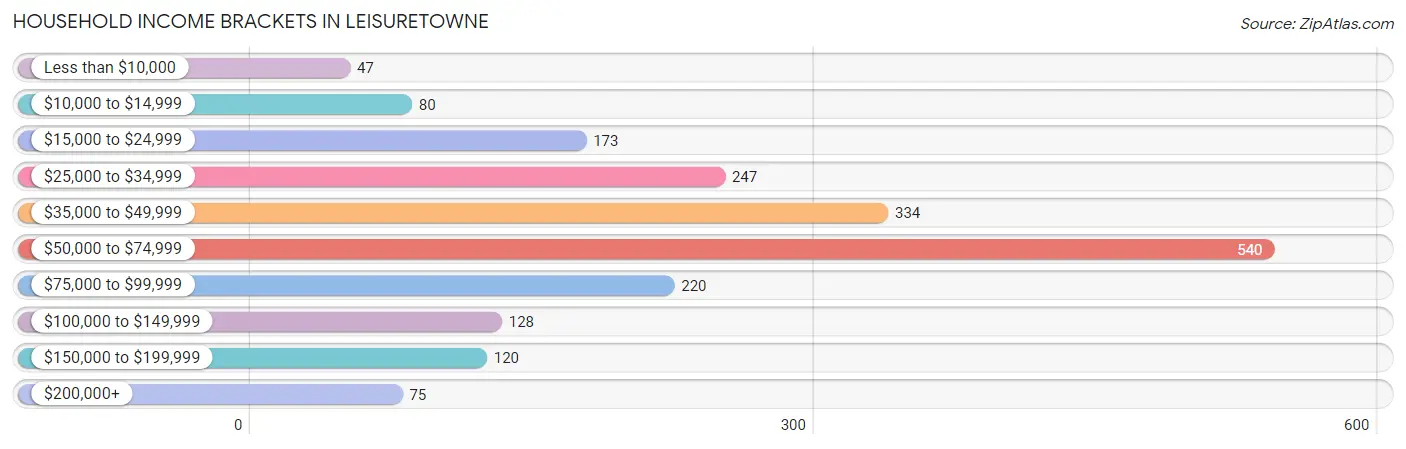
| Income Bracket | # Households | % Households |
| Less than $10,000 | 47 | 2.4% |
| $10,000 to $14,999 | 80 | 4.1% |
| $15,000 to $24,999 | 173 | 8.8% |
| $25,000 to $34,999 | 247 | 12.6% |
| $35,000 to $49,999 | 334 | 17.0% |
| $50,000 to $74,999 | 540 | 27.5% |
| $75,000 to $99,999 | 220 | 11.2% |
| $100,000 to $149,999 | 128 | 6.5% |
| $150,000 to $199,999 | 120 | 6.1% |
| $200,000+ | 75 | 3.8% |
Household Income by Householder Age in Leisuretowne
The median household income in Leisuretowne is $57,901, with the highest median household income of $65,188 found in the 45 to 64 years age bracket for the primary householder. A total of 359 households (18.3%) fall into this category.
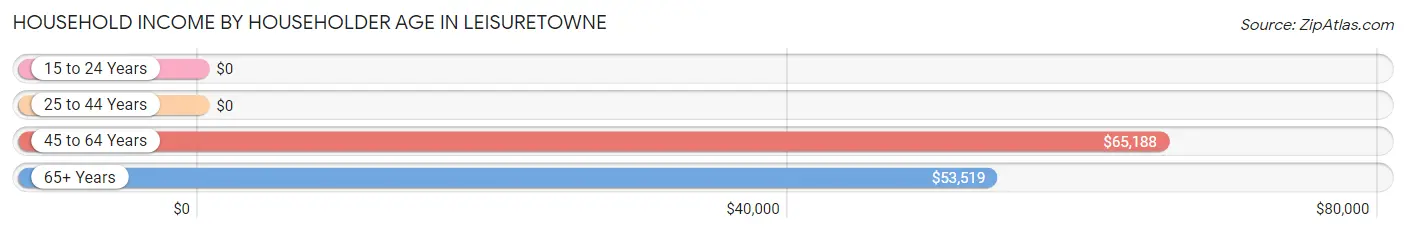
| Income Bracket | # Households | Median Income |
| 15 to 24 Years | 0 (0.0%) | $0 |
| 25 to 44 Years | 72 (3.7%) | $0 |
| 45 to 64 Years | 359 (18.3%) | $65,188 |
| 65+ Years | 1,532 (78.0%) | $53,519 |
| Total | 1,963 (100.0%) | $57,901 |
Poverty in Leisuretowne
Income Below Poverty by Sex and Age in Leisuretowne
With 4.7% poverty level for males and 9.1% for females among the residents of Leisuretowne, 25 to 34 year old males and under 5 year old females are the most vulnerable to poverty, with 17 males (54.8%) and 15 females (51.7%) in their respective age groups living below the poverty level.
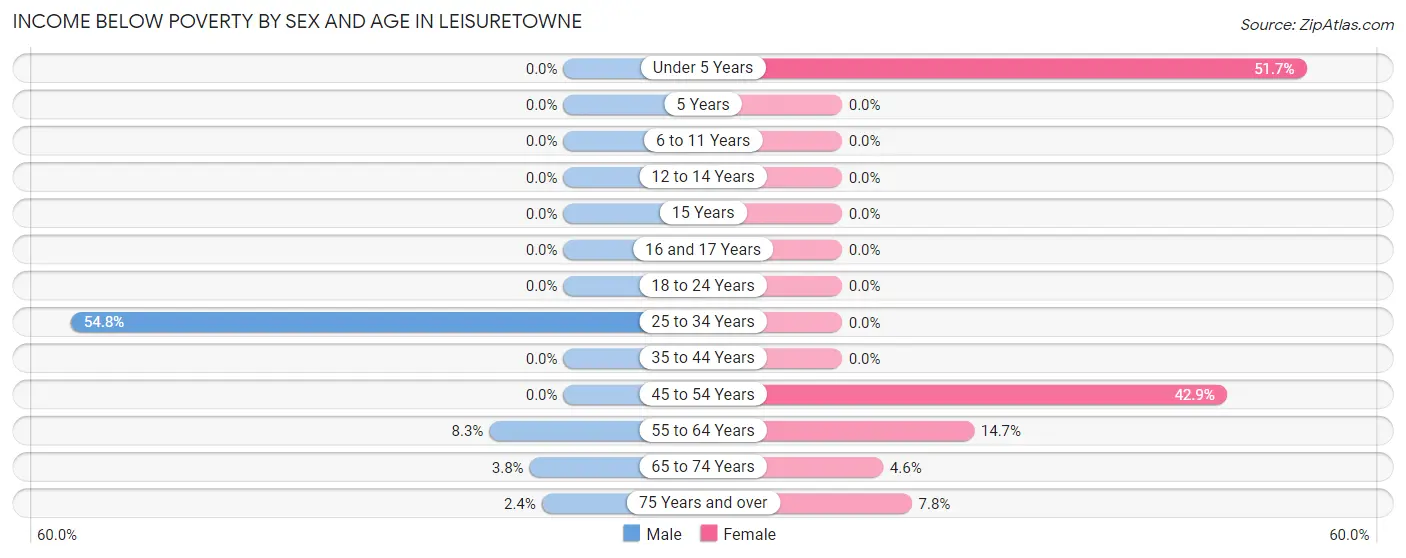
| Age Bracket | Male | Female |
| Under 5 Years | 0 (0.0%) | 15 (51.7%) |
| 5 Years | 0 (0.0%) | 0 (0.0%) |
| 6 to 11 Years | 0 (0.0%) | 0 (0.0%) |
| 12 to 14 Years | 0 (0.0%) | 0 (0.0%) |
| 15 Years | 0 (0.0%) | 0 (0.0%) |
| 16 and 17 Years | 0 (0.0%) | 0 (0.0%) |
| 18 to 24 Years | 0 (0.0%) | 0 (0.0%) |
| 25 to 34 Years | 17 (54.8%) | 0 (0.0%) |
| 35 to 44 Years | 0 (0.0%) | 0 (0.0%) |
| 45 to 54 Years | 0 (0.0%) | 15 (42.9%) |
| 55 to 64 Years | 19 (8.3%) | 55 (14.7%) |
| 65 to 74 Years | 16 (3.8%) | 28 (4.6%) |
| 75 Years and over | 13 (2.4%) | 54 (7.8%) |
| Total | 65 (4.7%) | 167 (9.1%) |
Income Above Poverty by Sex and Age in Leisuretowne
According to the poverty statistics in Leisuretowne, males aged 5 years and females aged 6 to 11 years are the age groups that are most secure financially, with 100.0% of males and 100.0% of females in these age groups living above the poverty line.
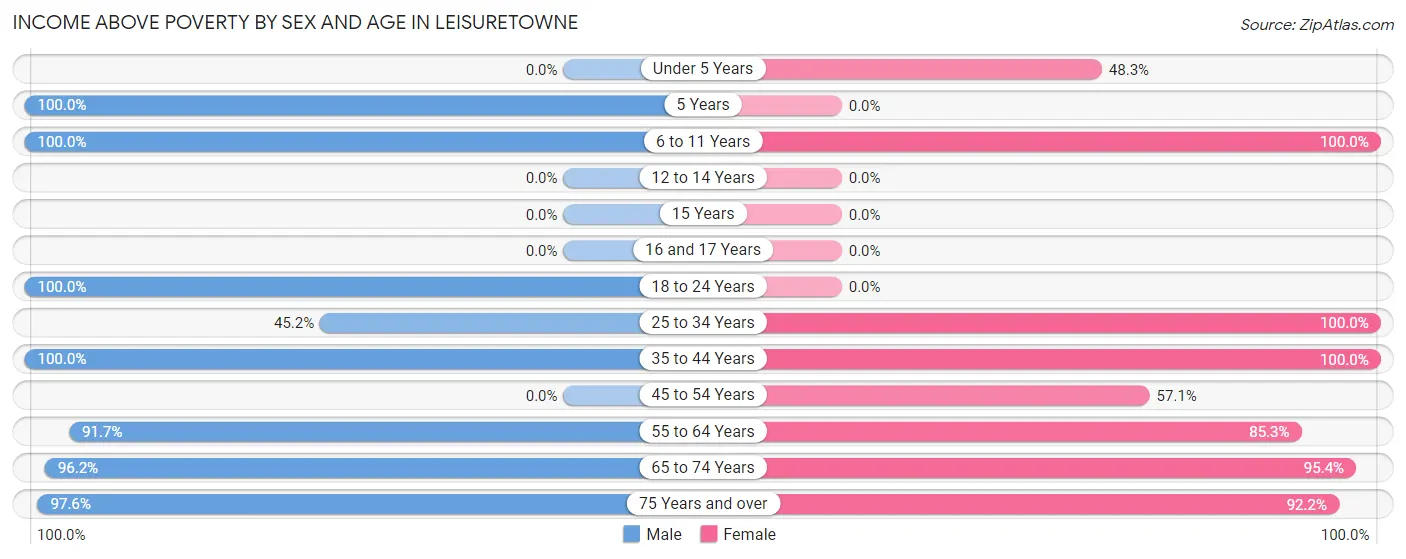
| Age Bracket | Male | Female |
| Under 5 Years | 0 (0.0%) | 14 (48.3%) |
| 5 Years | 14 (100.0%) | 0 (0.0%) |
| 6 to 11 Years | 14 (100.0%) | 15 (100.0%) |
| 12 to 14 Years | 0 (0.0%) | 0 (0.0%) |
| 15 Years | 0 (0.0%) | 0 (0.0%) |
| 16 and 17 Years | 0 (0.0%) | 0 (0.0%) |
| 18 to 24 Years | 47 (100.0%) | 0 (0.0%) |
| 25 to 34 Years | 14 (45.2%) | 14 (100.0%) |
| 35 to 44 Years | 77 (100.0%) | 64 (100.0%) |
| 45 to 54 Years | 0 (0.0%) | 20 (57.1%) |
| 55 to 64 Years | 211 (91.7%) | 319 (85.3%) |
| 65 to 74 Years | 407 (96.2%) | 583 (95.4%) |
| 75 Years and over | 525 (97.6%) | 641 (92.2%) |
| Total | 1,309 (95.3%) | 1,670 (90.9%) |
Income Below Poverty Among Married-Couple Families in Leisuretowne
The poverty statistics for married-couple families in Leisuretowne show that 3.2% or 29 of the total 916 families live below the poverty line. Families with no children have the highest poverty rate of 3.2%, comprising of 29 families. On the other hand, families with 3 or 4 children have the lowest poverty rate of 0.0%, which includes 0 families.
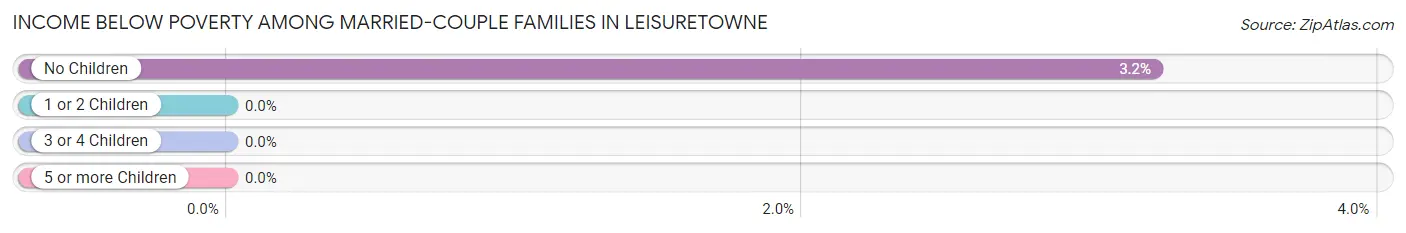
| Children | Above Poverty | Below Poverty |
| No Children | 873 (96.8%) | 29 (3.2%) |
| 1 or 2 Children | 0 (0.0%) | 0 (0.0%) |
| 3 or 4 Children | 14 (100.0%) | 0 (0.0%) |
| 5 or more Children | 0 (0.0%) | 0 (0.0%) |
| Total | 887 (96.8%) | 29 (3.2%) |
Income Below Poverty Among Single-Parent Households in Leisuretowne
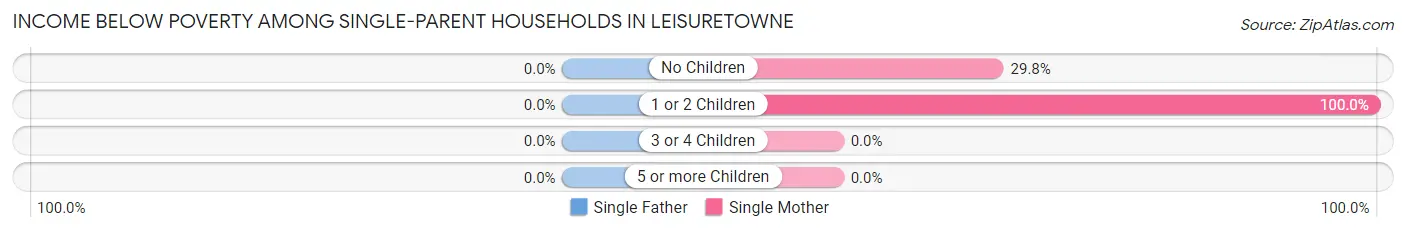
| Children | Single Father | Single Mother |
| No Children | 0 (0.0%) | 14 (29.8%) |
| 1 or 2 Children | 0 (0.0%) | 15 (100.0%) |
| 3 or 4 Children | 0 (0.0%) | 0 (0.0%) |
| 5 or more Children | 0 (0.0%) | 0 (0.0%) |
| Total | 0 (0.0%) | 29 (46.8%) |
Income Below Poverty Among Married-Couple vs Single-Parent Households in Leisuretowne
The poverty data for Leisuretowne shows that 29 of the married-couple family households (3.2%) and 29 of the single-parent households (39.7%) are living below the poverty level. Within the married-couple family households, those with no children have the highest poverty rate, with 29 households (3.2%) falling below the poverty line. Among the single-parent households, those with 1 or 2 children have the highest poverty rate, with 15 household (100.0%) living below poverty.
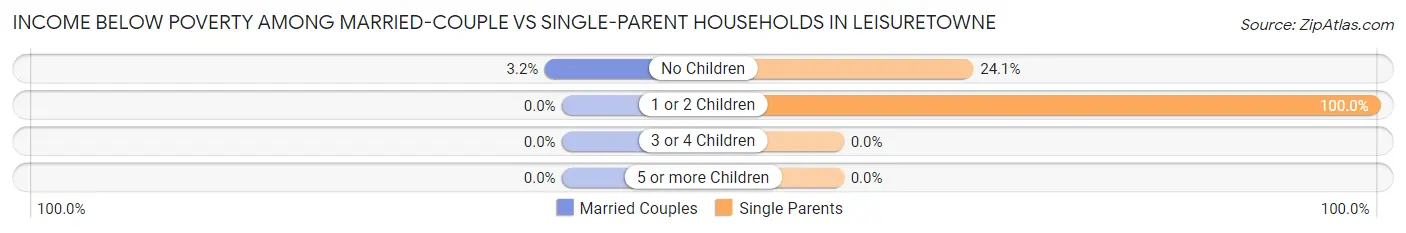
| Children | Married-Couple Families | Single-Parent Households |
| No Children | 29 (3.2%) | 14 (24.1%) |
| 1 or 2 Children | 0 (0.0%) | 15 (100.0%) |
| 3 or 4 Children | 0 (0.0%) | 0 (0.0%) |
| 5 or more Children | 0 (0.0%) | 0 (0.0%) |
| Total | 29 (3.2%) | 29 (39.7%) |
Employment Characteristics in Leisuretowne
Employment by Class of Employer in Leisuretowne
Among the 626 employed individuals in Leisuretowne, private company employees (451 | 72.0%), federal government employees (57 | 9.1%), and state government employees (38 | 6.1%) make up the most common classes of employment.
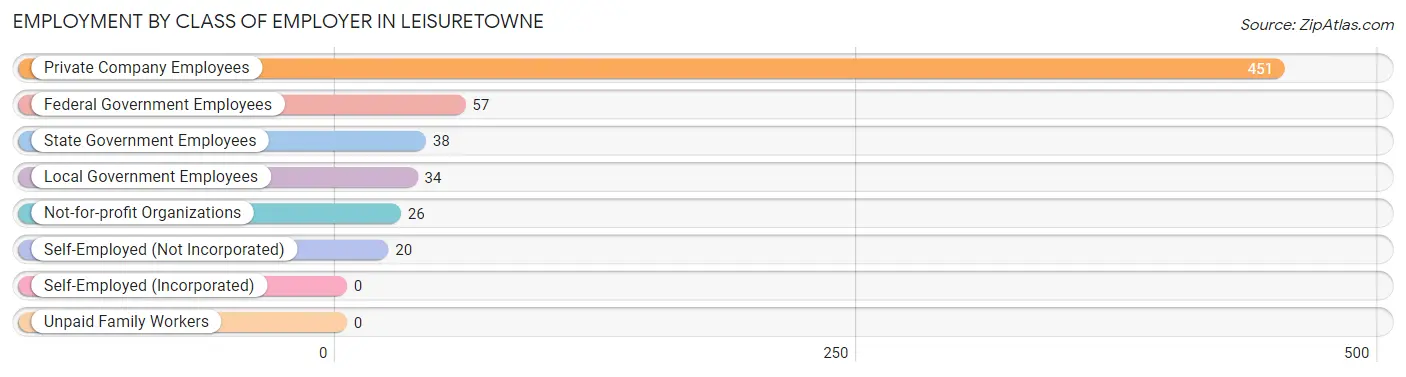
| Employer Class | # Employees | % Employees |
| Private Company Employees | 451 | 72.0% |
| Self-Employed (Incorporated) | 0 | 0.0% |
| Self-Employed (Not Incorporated) | 20 | 3.2% |
| Not-for-profit Organizations | 26 | 4.2% |
| Local Government Employees | 34 | 5.4% |
| State Government Employees | 38 | 6.1% |
| Federal Government Employees | 57 | 9.1% |
| Unpaid Family Workers | 0 | 0.0% |
| Total | 626 | 100.0% |
Employment Status by Age in Leisuretowne
According to the labor force statistics for Leisuretowne, out of the total population over 16 years of age (3,139), 23.1% or 725 individuals are in the labor force, with 8.1% or 59 of them unemployed. The age group with the highest labor force participation rate is 16 to 19 years, with 100.0% or 47 individuals in the labor force. Within the labor force, the 35 to 44 years age range has the highest percentage of unemployed individuals, with 13.5% or 18 of them being unemployed.
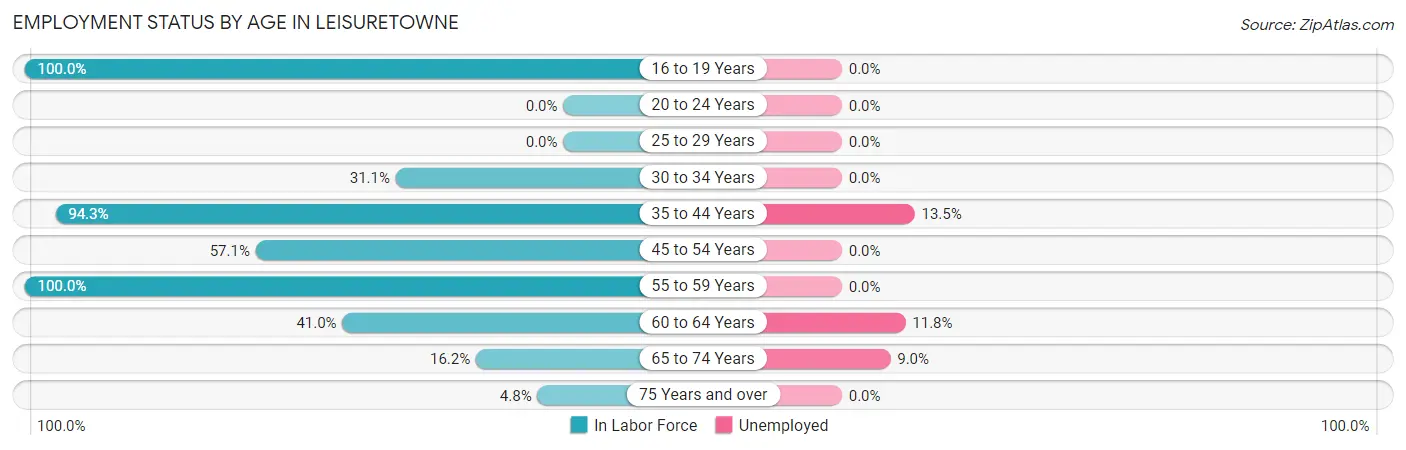
| Age Bracket | In Labor Force | Unemployed |
| 16 to 19 Years | 47 (100.0%) | 0 (0.0%) |
| 20 to 24 Years | 0 (0.0%) | 0 (0.0%) |
| 25 to 29 Years | 0 (0.0%) | 0 (0.0%) |
| 30 to 34 Years | 14 (31.1%) | 0 (0.0%) |
| 35 to 44 Years | 133 (94.3%) | 18 (13.5%) |
| 45 to 54 Years | 20 (57.1%) | 0 (0.0%) |
| 55 to 59 Years | 65 (100.0%) | 0 (0.0%) |
| 60 to 64 Years | 221 (41.0%) | 26 (11.8%) |
| 65 to 74 Years | 168 (16.2%) | 15 (9.0%) |
| 75 Years and over | 59 (4.8%) | 0 (0.0%) |
| Total | 725 (23.1%) | 59 (8.1%) |
Employment Status by Educational Attainment in Leisuretowne
According to labor force statistics for Leisuretowne, 54.9% of individuals (453) out of the total population between 25 and 64 years of age (825) are in the labor force, with 9.7% or 44 of them being unemployed. The group with the highest labor force participation rate are those with the educational attainment of college / associate degree, with 65.6% or 177 individuals in the labor force. Within the labor force, individuals with high school diploma education have the highest percentage of unemployment, with 30.1% or 44 of them being unemployed.
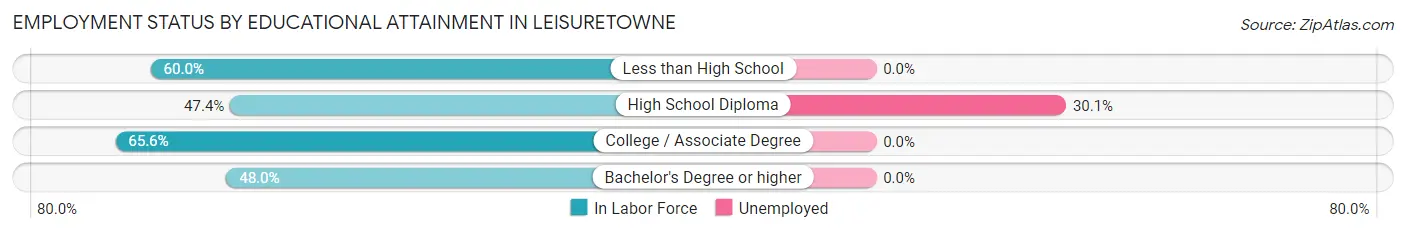
| Educational Attainment | In Labor Force | Unemployed |
| Less than High School | 57 (60.0%) | 0 (0.0%) |
| High School Diploma | 146 (47.4%) | 93 (30.1%) |
| College / Associate Degree | 177 (65.6%) | 0 (0.0%) |
| Bachelor's Degree or higher | 73 (48.0%) | 0 (0.0%) |
| Total | 453 (54.9%) | 80 (9.7%) |
Employment Occupations by Sex in Leisuretowne
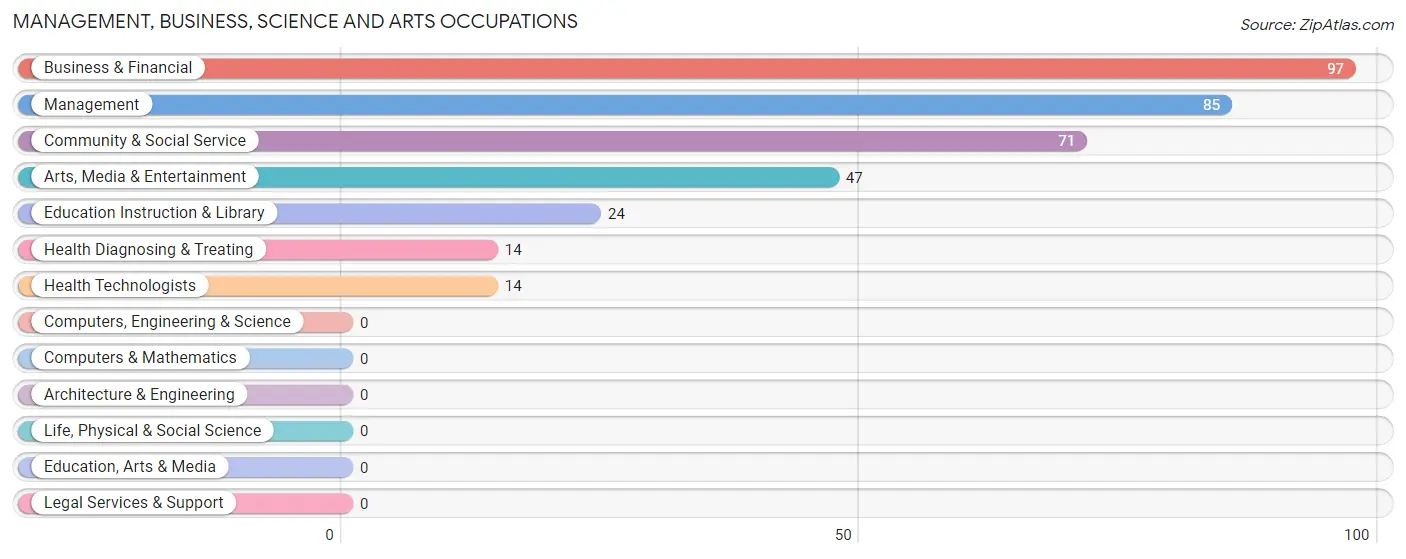
Management, Business, Science and Arts Occupations
The most common Management, Business, Science and Arts occupations in Leisuretowne are Business & Financial (97 | 14.5%), Management (85 | 12.7%), Community & Social Service (71 | 10.6%), Arts, Media & Entertainment (47 | 7.0%), and Education Instruction & Library (24 | 3.6%).
Management, Business, Science and Arts Occupations by Sex
Within the Management, Business, Science and Arts occupations in Leisuretowne, the most male-oriented occupations are Health Diagnosing & Treating (100.0%), Health Technologists (100.0%), and Education Instruction & Library (58.3%), while the most female-oriented occupations are Business & Financial (68.0%), Arts, Media & Entertainment (63.8%), and Management (60.0%).
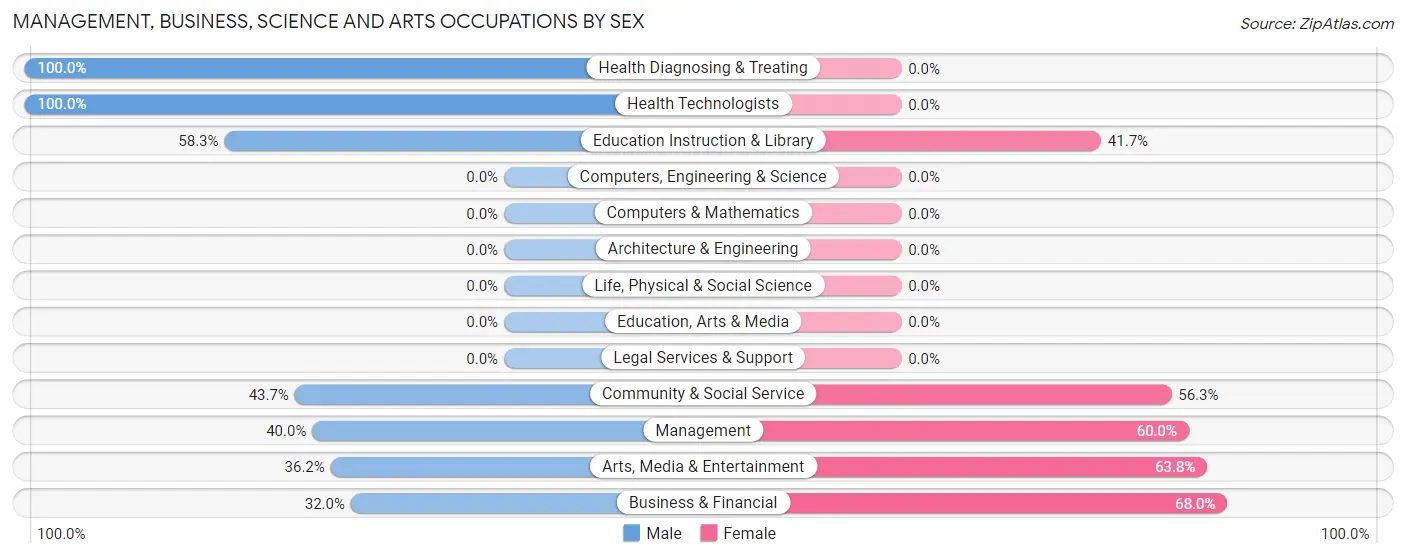
| Occupation | Male | Female |
| Management | 34 (40.0%) | 51 (60.0%) |
| Business & Financial | 31 (32.0%) | 66 (68.0%) |
| Computers, Engineering & Science | 0 (0.0%) | 0 (0.0%) |
| Computers & Mathematics | 0 (0.0%) | 0 (0.0%) |
| Architecture & Engineering | 0 (0.0%) | 0 (0.0%) |
| Life, Physical & Social Science | 0 (0.0%) | 0 (0.0%) |
| Community & Social Service | 31 (43.7%) | 40 (56.3%) |
| Education, Arts & Media | 0 (0.0%) | 0 (0.0%) |
| Legal Services & Support | 0 (0.0%) | 0 (0.0%) |
| Education Instruction & Library | 14 (58.3%) | 10 (41.7%) |
| Arts, Media & Entertainment | 17 (36.2%) | 30 (63.8%) |
| Health Diagnosing & Treating | 14 (100.0%) | 0 (0.0%) |
| Health Technologists | 14 (100.0%) | 0 (0.0%) |
| Total (Category) | 110 (41.2%) | 157 (58.8%) |
| Total (Overall) | 339 (50.8%) | 328 (49.2%) |
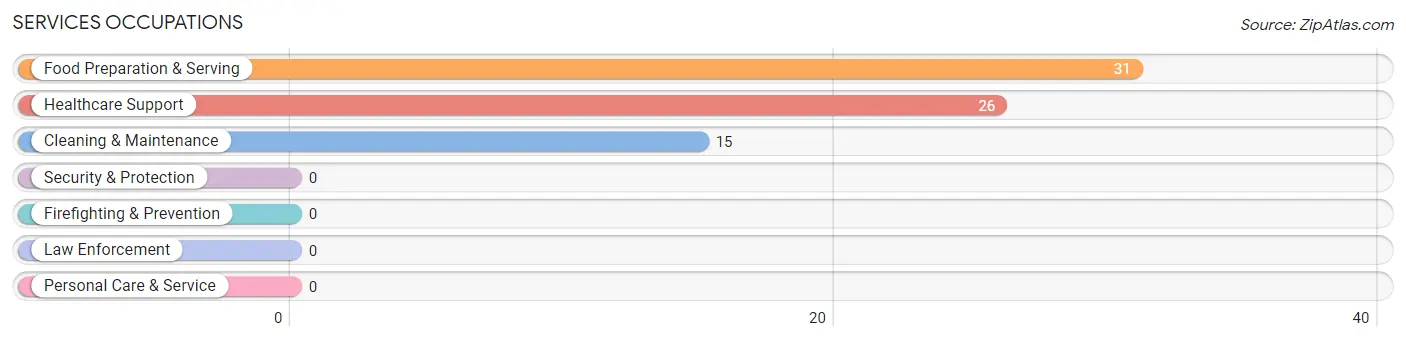
Services Occupations
The most common Services occupations in Leisuretowne are Food Preparation & Serving (31 | 4.6%), Healthcare Support (26 | 3.9%), and Cleaning & Maintenance (15 | 2.2%).
Services Occupations by Sex
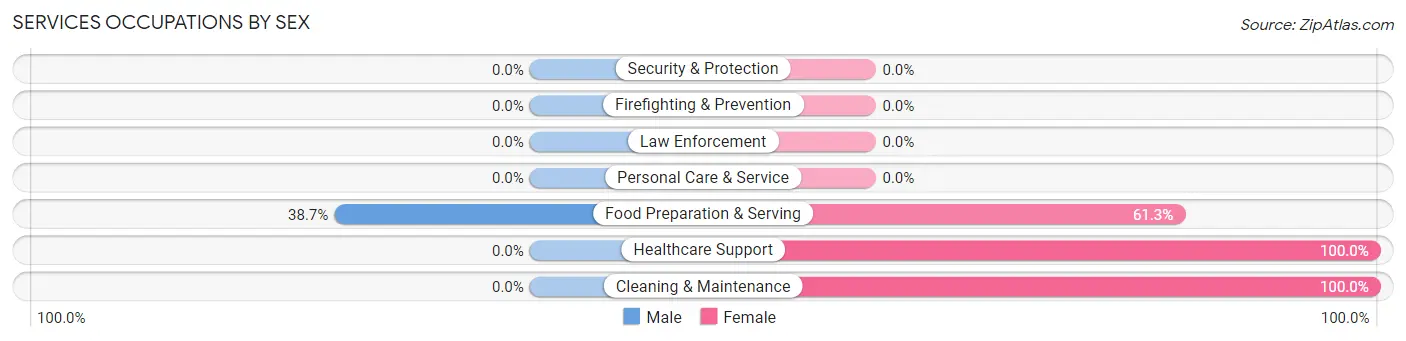
| Occupation | Male | Female |
| Healthcare Support | 0 (0.0%) | 26 (100.0%) |
| Security & Protection | 0 (0.0%) | 0 (0.0%) |
| Firefighting & Prevention | 0 (0.0%) | 0 (0.0%) |
| Law Enforcement | 0 (0.0%) | 0 (0.0%) |
| Food Preparation & Serving | 12 (38.7%) | 19 (61.3%) |
| Cleaning & Maintenance | 0 (0.0%) | 15 (100.0%) |
| Personal Care & Service | 0 (0.0%) | 0 (0.0%) |
| Total (Category) | 12 (16.7%) | 60 (83.3%) |
| Total (Overall) | 339 (50.8%) | 328 (49.2%) |
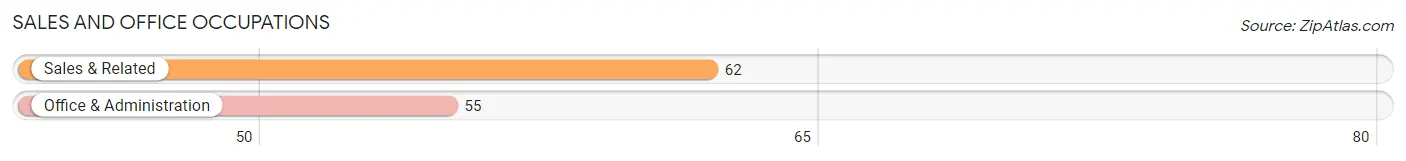
Sales and Office Occupations
The most common Sales and Office occupations in Leisuretowne are Sales & Related (62 | 9.3%), and Office & Administration (55 | 8.3%).
Sales and Office Occupations by Sex
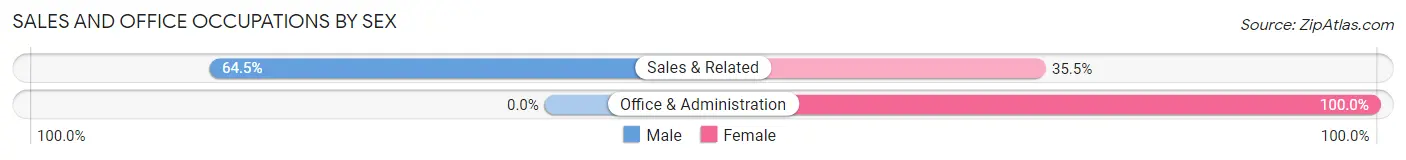
| Occupation | Male | Female |
| Sales & Related | 40 (64.5%) | 22 (35.5%) |
| Office & Administration | 0 (0.0%) | 55 (100.0%) |
| Total (Category) | 40 (34.2%) | 77 (65.8%) |
| Total (Overall) | 339 (50.8%) | 328 (49.2%) |
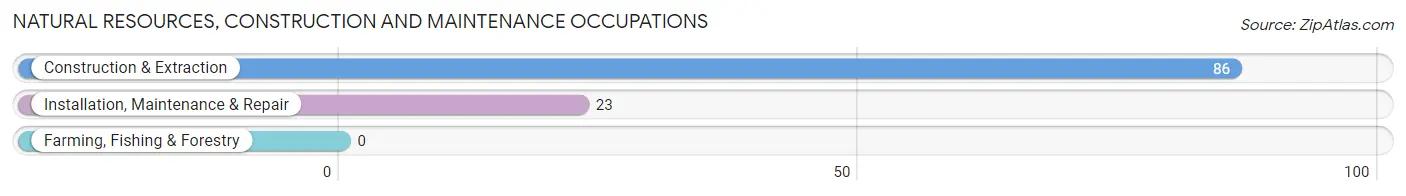
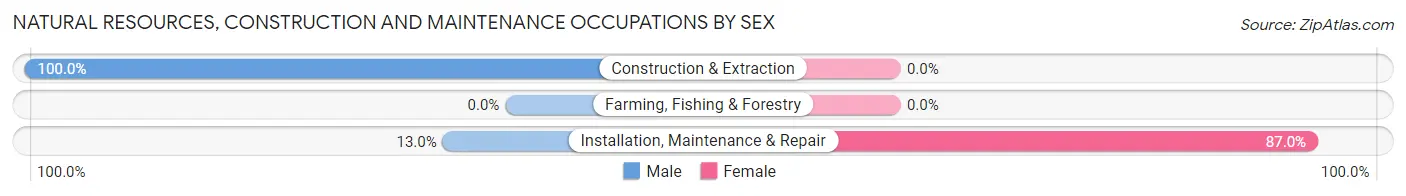
Natural Resources, Construction and Maintenance Occupations
The most common Natural Resources, Construction and Maintenance occupations in Leisuretowne are Construction & Extraction (86 | 12.9%), and Installation, Maintenance & Repair (23 | 3.5%).
Natural Resources, Construction and Maintenance Occupations by Sex
| Occupation | Male | Female |
| Farming, Fishing & Forestry | 0 (0.0%) | 0 (0.0%) |
| Construction & Extraction | 86 (100.0%) | 0 (0.0%) |
| Installation, Maintenance & Repair | 3 (13.0%) | 20 (87.0%) |
| Total (Category) | 89 (81.7%) | 20 (18.3%) |
| Total (Overall) | 339 (50.8%) | 328 (49.2%) |
Production, Transportation and Moving Occupations
The most common Production, Transportation and Moving occupations in Leisuretowne are Transportation (51 | 7.6%), Production (30 | 4.5%), and Material Moving (21 | 3.2%).
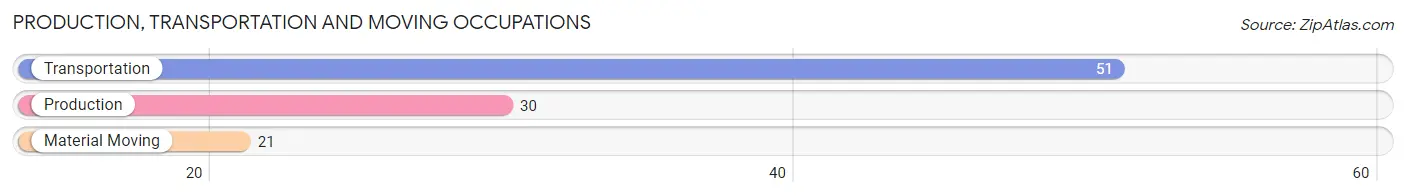
Production, Transportation and Moving Occupations by Sex
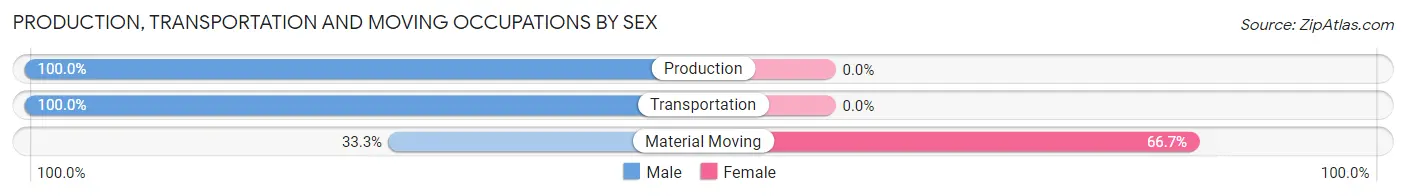
| Occupation | Male | Female |
| Production | 30 (100.0%) | 0 (0.0%) |
| Transportation | 51 (100.0%) | 0 (0.0%) |
| Material Moving | 7 (33.3%) | 14 (66.7%) |
| Total (Category) | 88 (86.3%) | 14 (13.7%) |
| Total (Overall) | 339 (50.8%) | 328 (49.2%) |
Employment Industries by Sex in Leisuretowne
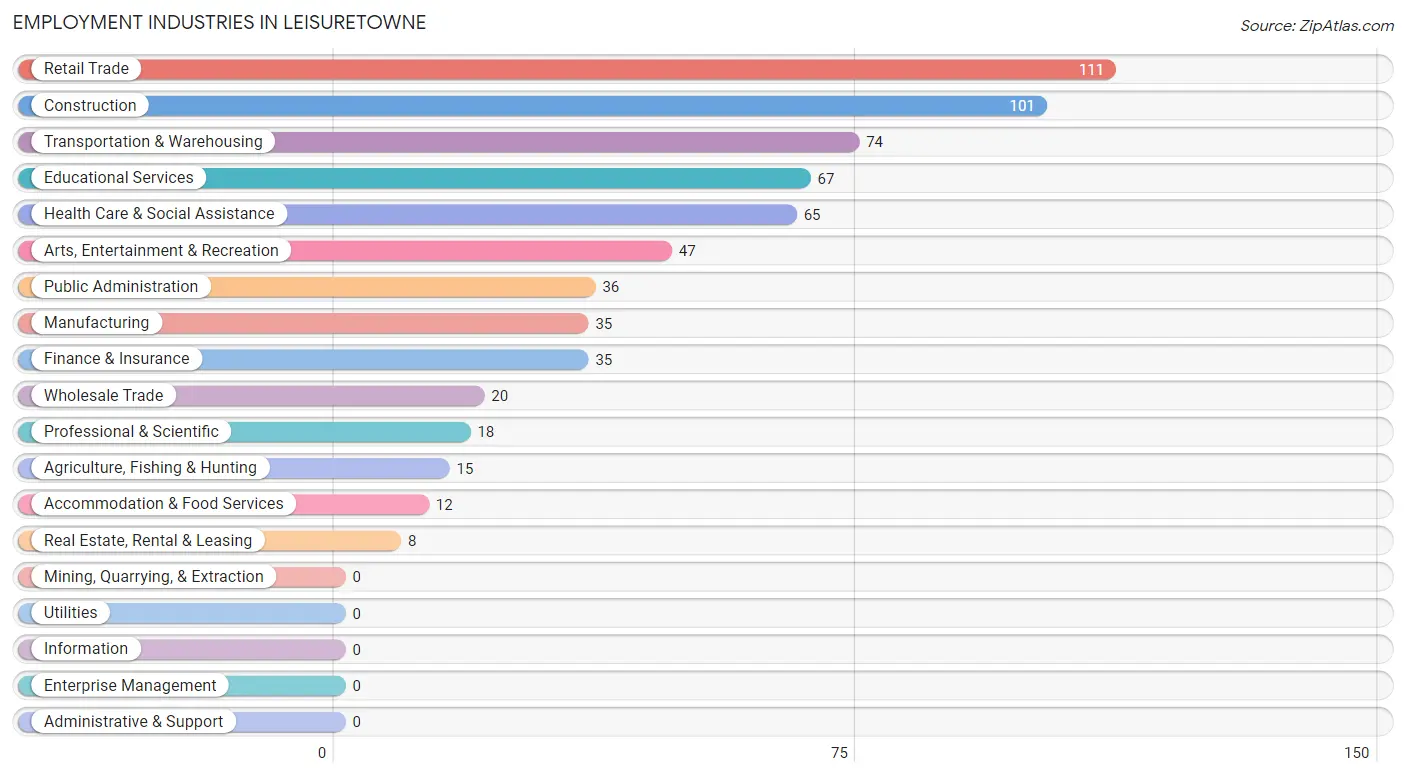
Employment Industries in Leisuretowne
The major employment industries in Leisuretowne include Retail Trade (111 | 16.6%), Construction (101 | 15.1%), Transportation & Warehousing (74 | 11.1%), Educational Services (67 | 10.0%), and Health Care & Social Assistance (65 | 9.8%).
Employment Industries by Sex in Leisuretowne
The Leisuretowne industries that see more men than women are Agriculture, Fishing & Hunting (100.0%), Construction (100.0%), and Wholesale Trade (100.0%), whereas the industries that tend to have a higher number of women are Real Estate, Rental & Leasing (100.0%), Professional & Scientific (100.0%), and Educational Services (79.1%).
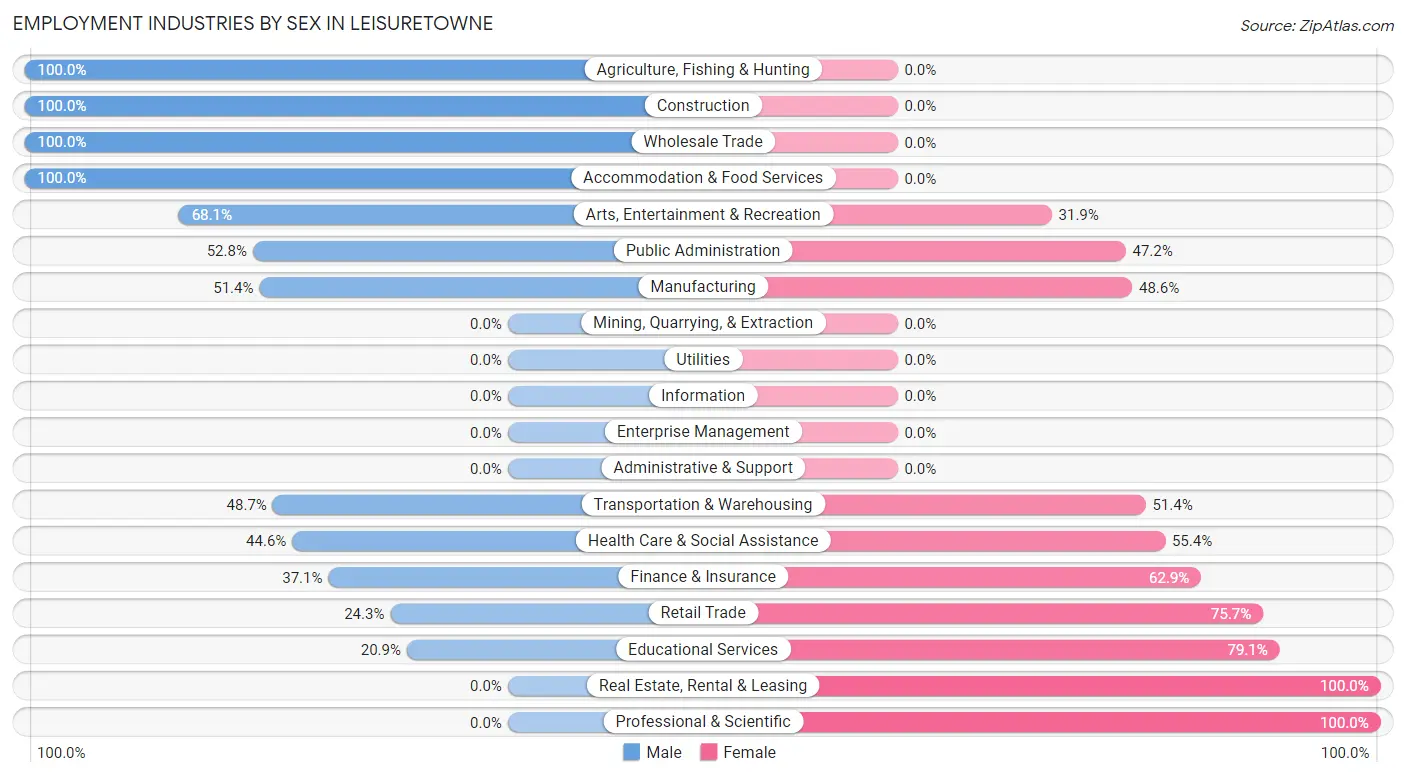
| Industry | Male | Female |
| Agriculture, Fishing & Hunting | 15 (100.0%) | 0 (0.0%) |
| Mining, Quarrying, & Extraction | 0 (0.0%) | 0 (0.0%) |
| Construction | 101 (100.0%) | 0 (0.0%) |
| Manufacturing | 18 (51.4%) | 17 (48.6%) |
| Wholesale Trade | 20 (100.0%) | 0 (0.0%) |
| Retail Trade | 27 (24.3%) | 84 (75.7%) |
| Transportation & Warehousing | 36 (48.6%) | 38 (51.3%) |
| Utilities | 0 (0.0%) | 0 (0.0%) |
| Information | 0 (0.0%) | 0 (0.0%) |
| Finance & Insurance | 13 (37.1%) | 22 (62.9%) |
| Real Estate, Rental & Leasing | 0 (0.0%) | 8 (100.0%) |
| Professional & Scientific | 0 (0.0%) | 18 (100.0%) |
| Enterprise Management | 0 (0.0%) | 0 (0.0%) |
| Administrative & Support | 0 (0.0%) | 0 (0.0%) |
| Educational Services | 14 (20.9%) | 53 (79.1%) |
| Health Care & Social Assistance | 29 (44.6%) | 36 (55.4%) |
| Arts, Entertainment & Recreation | 32 (68.1%) | 15 (31.9%) |
| Accommodation & Food Services | 12 (100.0%) | 0 (0.0%) |
| Public Administration | 19 (52.8%) | 17 (47.2%) |
| Total | 339 (50.8%) | 328 (49.2%) |
Education in Leisuretowne
School Enrollment in Leisuretowne
The most common levels of schooling among the 133 students in Leisuretowne are high school (47 | 35.3%), college / undergraduate (43 | 32.3%), and middle school (15 | 11.3%).
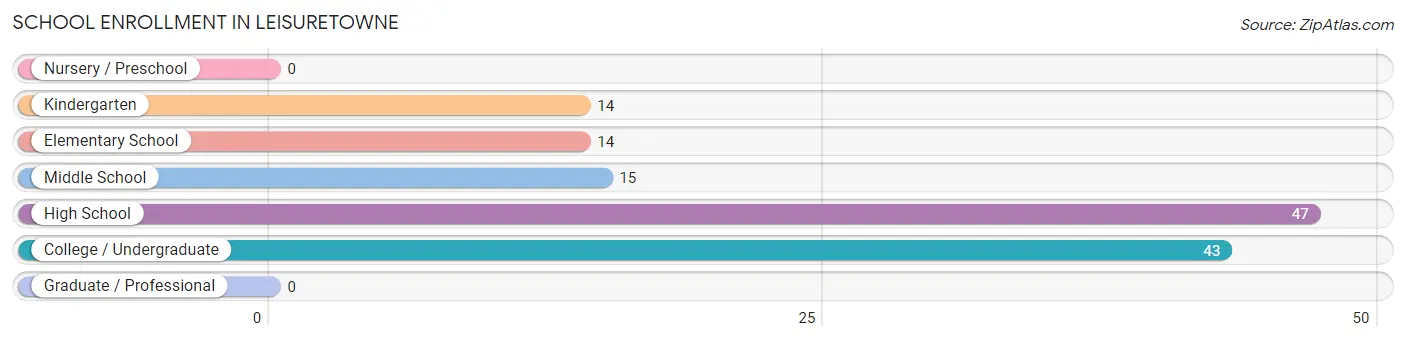
| School Level | # Students | % Students |
| Nursery / Preschool | 0 | 0.0% |
| Kindergarten | 14 | 10.5% |
| Elementary School | 14 | 10.5% |
| Middle School | 15 | 11.3% |
| High School | 47 | 35.3% |
| College / Undergraduate | 43 | 32.3% |
| Graduate / Professional | 0 | 0.0% |
| Total | 133 | 100.0% |
School Enrollment by Age by Funding Source in Leisuretowne
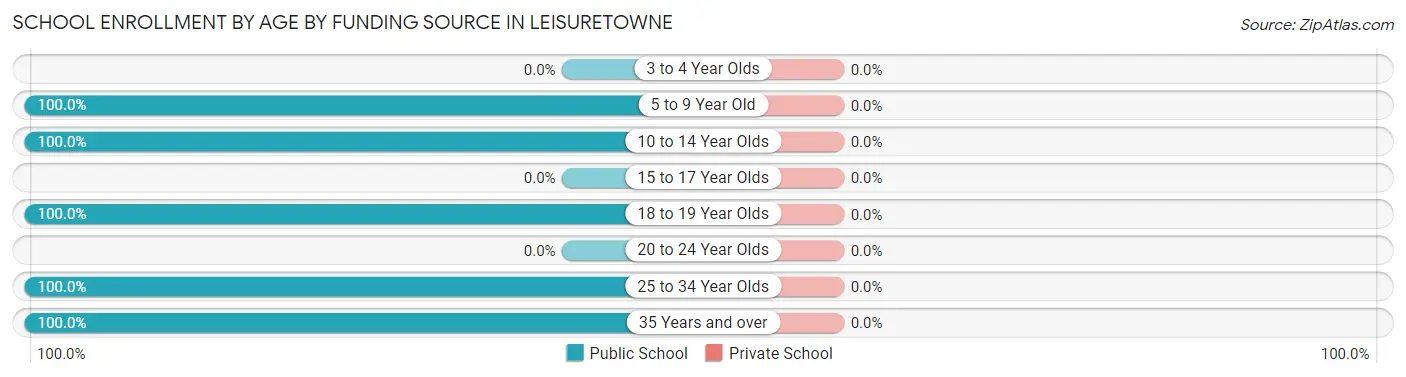
| Age Bracket | Public School | Private School |
| 3 to 4 Year Olds | 0 (0.0%) | 0 (0.0%) |
| 5 to 9 Year Old | 28 (100.0%) | 0 (0.0%) |
| 10 to 14 Year Olds | 15 (100.0%) | 0 (0.0%) |
| 15 to 17 Year Olds | 0 (0.0%) | 0 (0.0%) |
| 18 to 19 Year Olds | 47 (100.0%) | 0 (0.0%) |
| 20 to 24 Year Olds | 0 (0.0%) | 0 (0.0%) |
| 25 to 34 Year Olds | 14 (100.0%) | 0 (0.0%) |
| 35 Years and over | 29 (100.0%) | 0 (0.0%) |
| Total | 133 (100.0%) | 0 (0.0%) |
Educational Attainment by Field of Study in Leisuretowne
Business (153 | 25.7%), education (111 | 18.7%), liberal arts & history (56 | 9.4%), literature & languages (53 | 8.9%), and arts & humanities (51 | 8.6%) are the most common fields of study among 595 individuals in Leisuretowne who have obtained a bachelor's degree or higher.
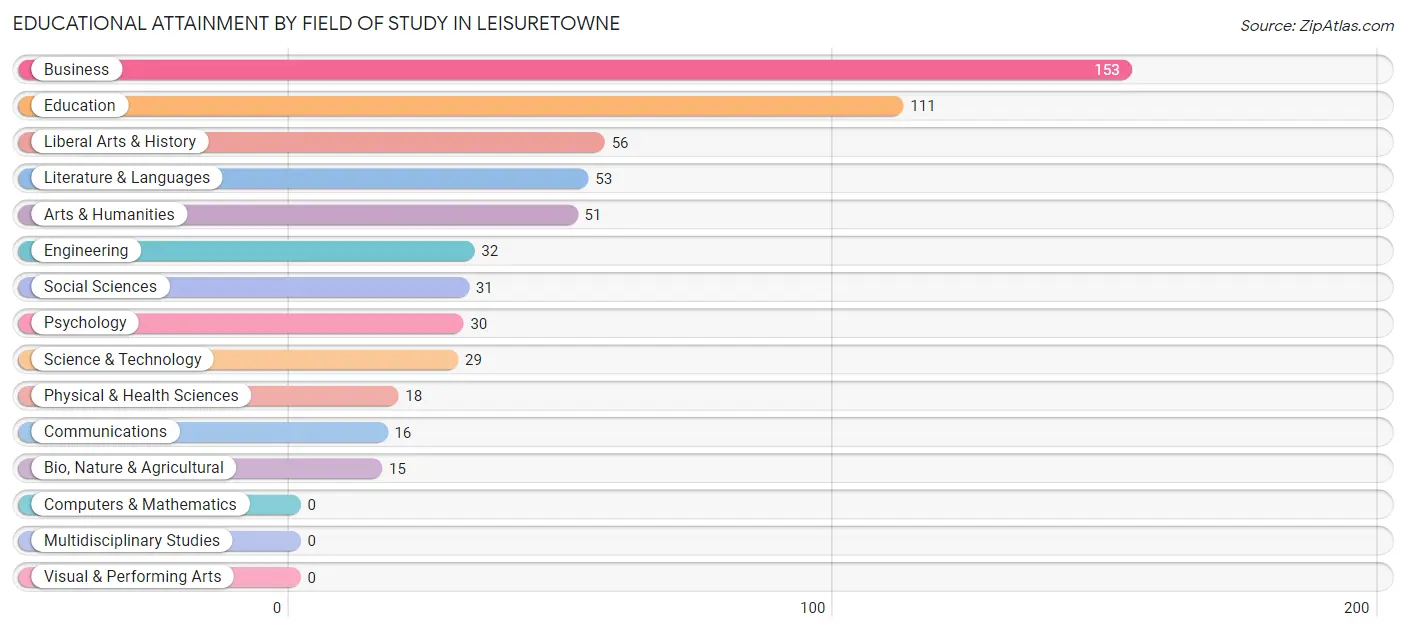
| Field of Study | # Graduates | % Graduates |
| Computers & Mathematics | 0 | 0.0% |
| Bio, Nature & Agricultural | 15 | 2.5% |
| Physical & Health Sciences | 18 | 3.0% |
| Psychology | 30 | 5.0% |
| Social Sciences | 31 | 5.2% |
| Engineering | 32 | 5.4% |
| Multidisciplinary Studies | 0 | 0.0% |
| Science & Technology | 29 | 4.9% |
| Business | 153 | 25.7% |
| Education | 111 | 18.7% |
| Literature & Languages | 53 | 8.9% |
| Liberal Arts & History | 56 | 9.4% |
| Visual & Performing Arts | 0 | 0.0% |
| Communications | 16 | 2.7% |
| Arts & Humanities | 51 | 8.6% |
| Total | 595 | 100.0% |
Transportation & Commute in Leisuretowne
Vehicle Availability by Sex in Leisuretowne
The most prevalent vehicle ownership categories in Leisuretowne are males with 2 vehicles (119, accounting for 38.3%) and females with 2 vehicles (119, making up 37.8%).
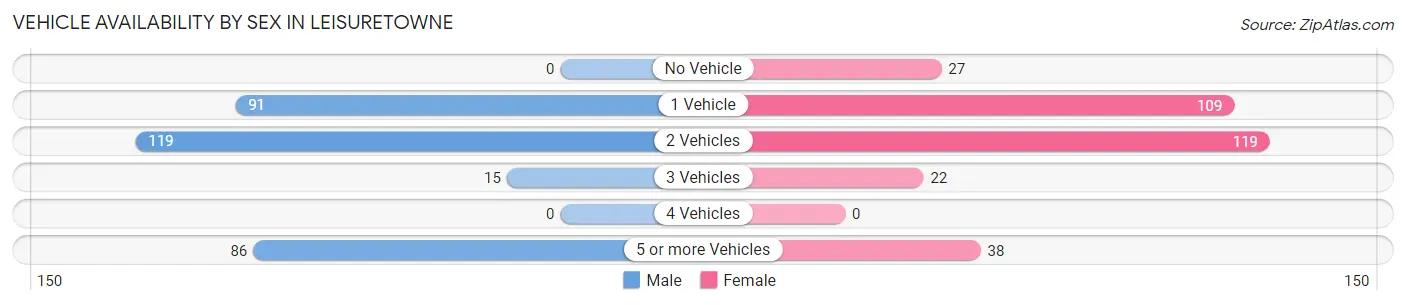
| Vehicles Available | Male | Female |
| No Vehicle | 0 (0.0%) | 27 (8.6%) |
| 1 Vehicle | 91 (29.3%) | 109 (34.6%) |
| 2 Vehicles | 119 (38.3%) | 119 (37.8%) |
| 3 Vehicles | 15 (4.8%) | 22 (7.0%) |
| 4 Vehicles | 0 (0.0%) | 0 (0.0%) |
| 5 or more Vehicles | 86 (27.7%) | 38 (12.1%) |
| Total | 311 (100.0%) | 315 (100.0%) |
Commute Time in Leisuretowne
The most frequently occuring commute durations in Leisuretowne are 15 to 19 minutes (116 commuters, 19.3%), 30 to 34 minutes (108 commuters, 18.0%), and 20 to 24 minutes (104 commuters, 17.3%).
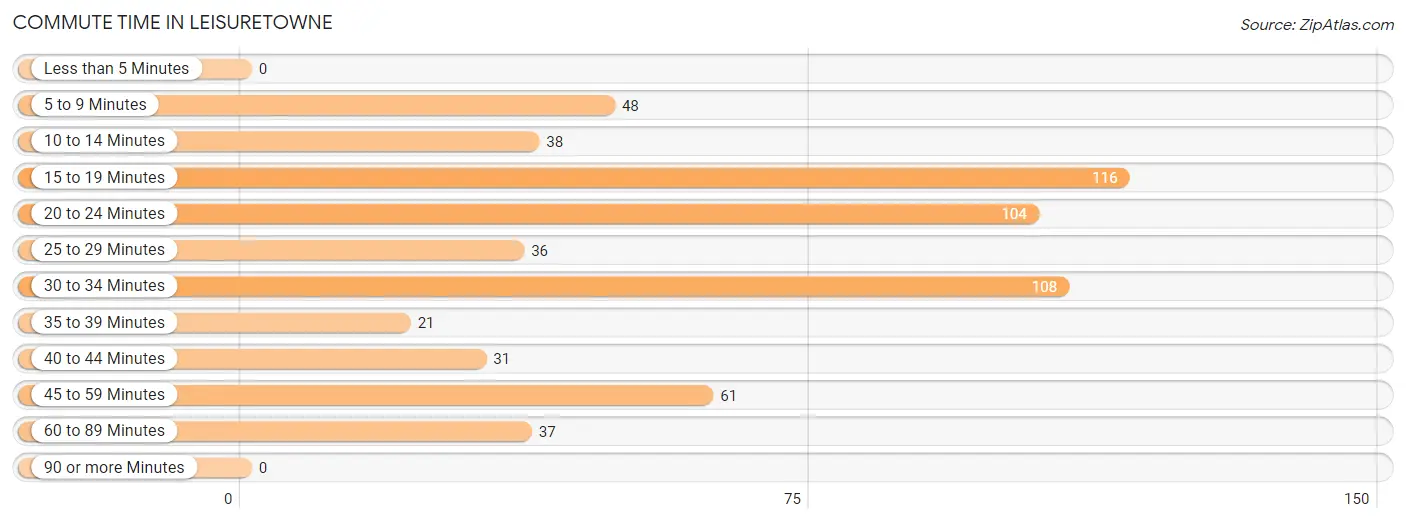
| Commute Time | # Commuters | % Commuters |
| Less than 5 Minutes | 0 | 0.0% |
| 5 to 9 Minutes | 48 | 8.0% |
| 10 to 14 Minutes | 38 | 6.3% |
| 15 to 19 Minutes | 116 | 19.3% |
| 20 to 24 Minutes | 104 | 17.3% |
| 25 to 29 Minutes | 36 | 6.0% |
| 30 to 34 Minutes | 108 | 18.0% |
| 35 to 39 Minutes | 21 | 3.5% |
| 40 to 44 Minutes | 31 | 5.2% |
| 45 to 59 Minutes | 61 | 10.2% |
| 60 to 89 Minutes | 37 | 6.2% |
| 90 or more Minutes | 0 | 0.0% |
Commute Time by Sex in Leisuretowne
The most common commute times in Leisuretowne are 20 to 24 minutes (86 commuters, 27.7%) for males and 30 to 34 minutes (86 commuters, 29.8%) for females.
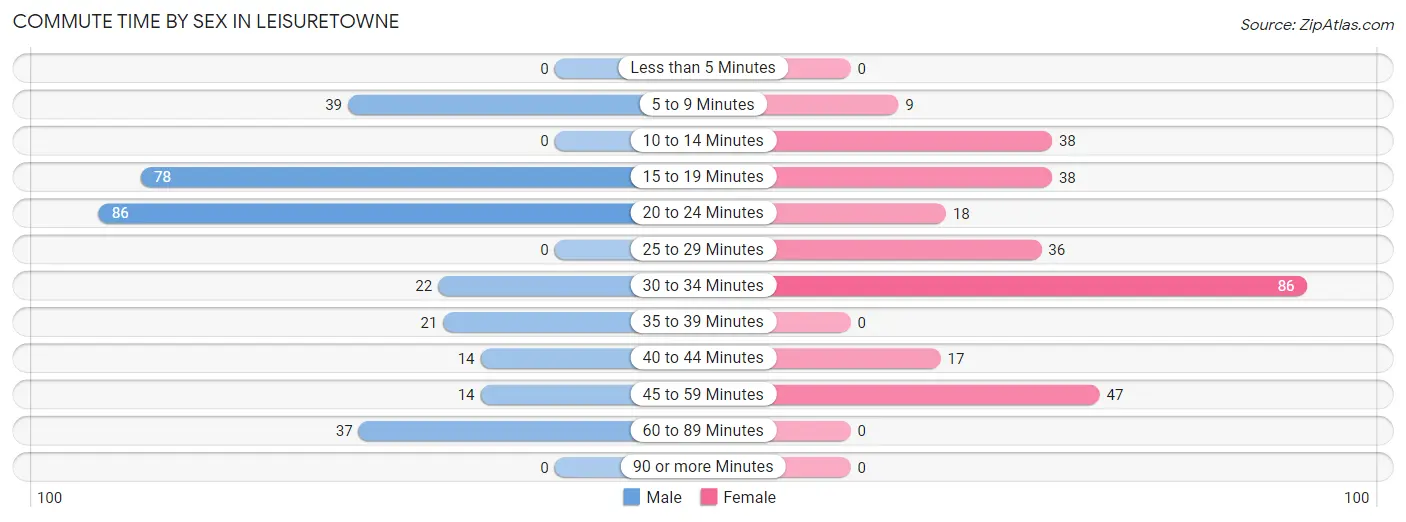
| Commute Time | Male | Female |
| Less than 5 Minutes | 0 (0.0%) | 0 (0.0%) |
| 5 to 9 Minutes | 39 (12.5%) | 9 (3.1%) |
| 10 to 14 Minutes | 0 (0.0%) | 38 (13.2%) |
| 15 to 19 Minutes | 78 (25.1%) | 38 (13.2%) |
| 20 to 24 Minutes | 86 (27.7%) | 18 (6.2%) |
| 25 to 29 Minutes | 0 (0.0%) | 36 (12.5%) |
| 30 to 34 Minutes | 22 (7.1%) | 86 (29.8%) |
| 35 to 39 Minutes | 21 (6.8%) | 0 (0.0%) |
| 40 to 44 Minutes | 14 (4.5%) | 17 (5.9%) |
| 45 to 59 Minutes | 14 (4.5%) | 47 (16.3%) |
| 60 to 89 Minutes | 37 (11.9%) | 0 (0.0%) |
| 90 or more Minutes | 0 (0.0%) | 0 (0.0%) |
Time of Departure to Work by Sex in Leisuretowne
The most frequent times of departure to work in Leisuretowne are 6:00 AM to 6:29 AM (77, 24.8%) for males and 6:00 AM to 6:29 AM (89, 30.8%) for females.
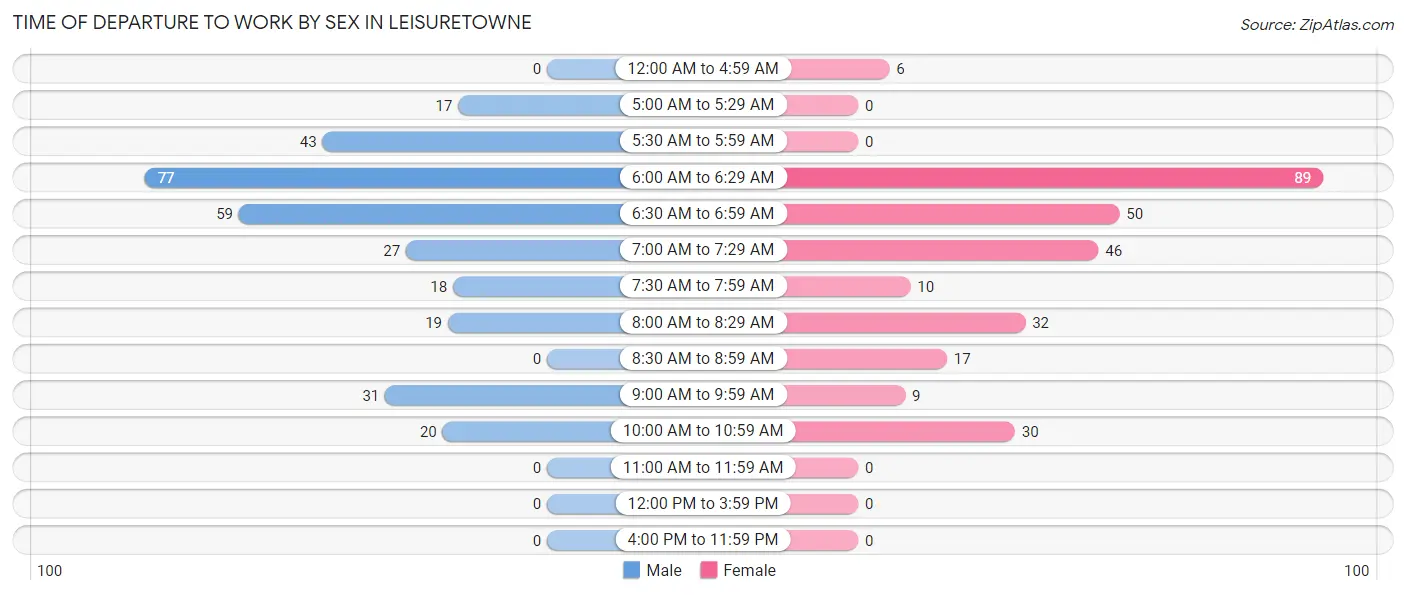
| Time of Departure | Male | Female |
| 12:00 AM to 4:59 AM | 0 (0.0%) | 6 (2.1%) |
| 5:00 AM to 5:29 AM | 17 (5.5%) | 0 (0.0%) |
| 5:30 AM to 5:59 AM | 43 (13.8%) | 0 (0.0%) |
| 6:00 AM to 6:29 AM | 77 (24.8%) | 89 (30.8%) |
| 6:30 AM to 6:59 AM | 59 (19.0%) | 50 (17.3%) |
| 7:00 AM to 7:29 AM | 27 (8.7%) | 46 (15.9%) |
| 7:30 AM to 7:59 AM | 18 (5.8%) | 10 (3.5%) |
| 8:00 AM to 8:29 AM | 19 (6.1%) | 32 (11.1%) |
| 8:30 AM to 8:59 AM | 0 (0.0%) | 17 (5.9%) |
| 9:00 AM to 9:59 AM | 31 (10.0%) | 9 (3.1%) |
| 10:00 AM to 10:59 AM | 20 (6.4%) | 30 (10.4%) |
| 11:00 AM to 11:59 AM | 0 (0.0%) | 0 (0.0%) |
| 12:00 PM to 3:59 PM | 0 (0.0%) | 0 (0.0%) |
| 4:00 PM to 11:59 PM | 0 (0.0%) | 0 (0.0%) |
| Total | 311 (100.0%) | 289 (100.0%) |
Housing Occupancy in Leisuretowne
Occupancy by Ownership in Leisuretowne
Of the total 1,963 dwellings in Leisuretowne, owner-occupied units account for 1,909 (97.3%), while renter-occupied units make up 54 (2.8%).
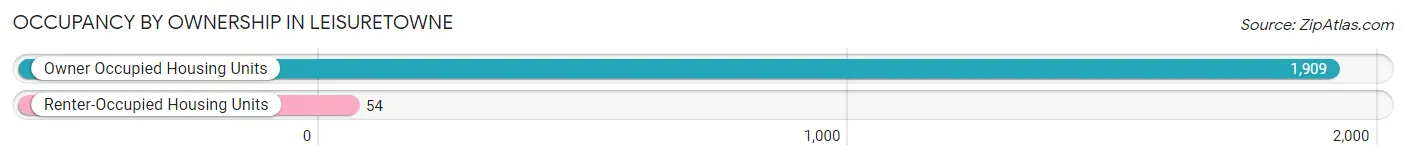
| Occupancy | # Housing Units | % Housing Units |
| Owner Occupied Housing Units | 1,909 | 97.3% |
| Renter-Occupied Housing Units | 54 | 2.8% |
| Total Occupied Housing Units | 1,963 | 100.0% |
Occupancy by Household Size in Leisuretowne
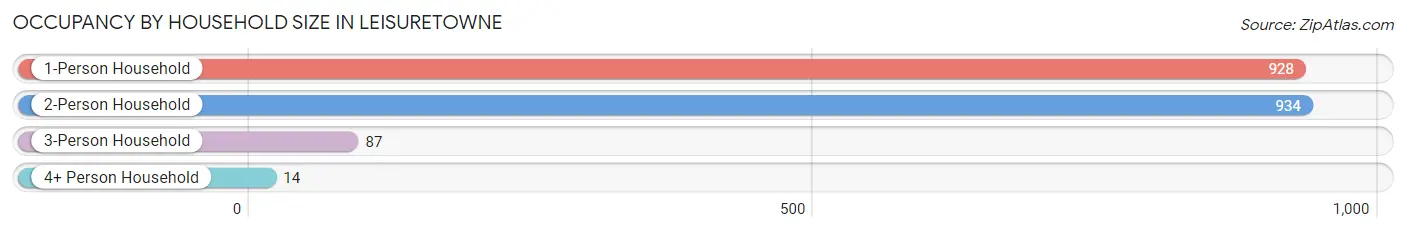
| Household Size | # Housing Units | % Housing Units |
| 1-Person Household | 928 | 47.3% |
| 2-Person Household | 934 | 47.6% |
| 3-Person Household | 87 | 4.4% |
| 4+ Person Household | 14 | 0.7% |
| Total Housing Units | 1,963 | 100.0% |
Occupancy by Ownership by Household Size in Leisuretowne
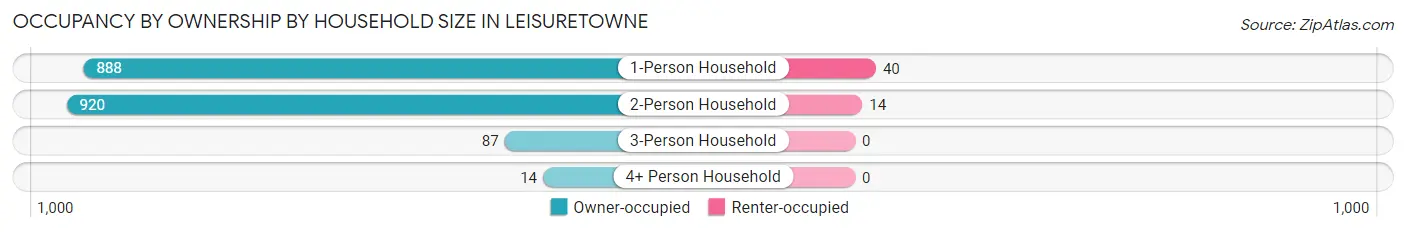
| Household Size | Owner-occupied | Renter-occupied |
| 1-Person Household | 888 (95.7%) | 40 (4.3%) |
| 2-Person Household | 920 (98.5%) | 14 (1.5%) |
| 3-Person Household | 87 (100.0%) | 0 (0.0%) |
| 4+ Person Household | 14 (100.0%) | 0 (0.0%) |
| Total Housing Units | 1,909 (97.3%) | 54 (2.8%) |
Occupancy by Educational Attainment in Leisuretowne
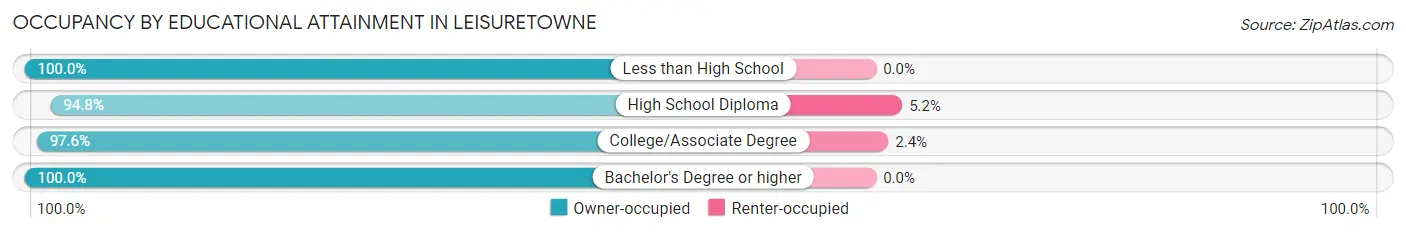
| Household Size | Owner-occupied | Renter-occupied |
| Less than High School | 147 (100.0%) | 0 (0.0%) |
| High School Diploma | 735 (94.8%) | 40 (5.2%) |
| College/Associate Degree | 567 (97.6%) | 14 (2.4%) |
| Bachelor's Degree or higher | 460 (100.0%) | 0 (0.0%) |
Occupancy by Age of Householder in Leisuretowne
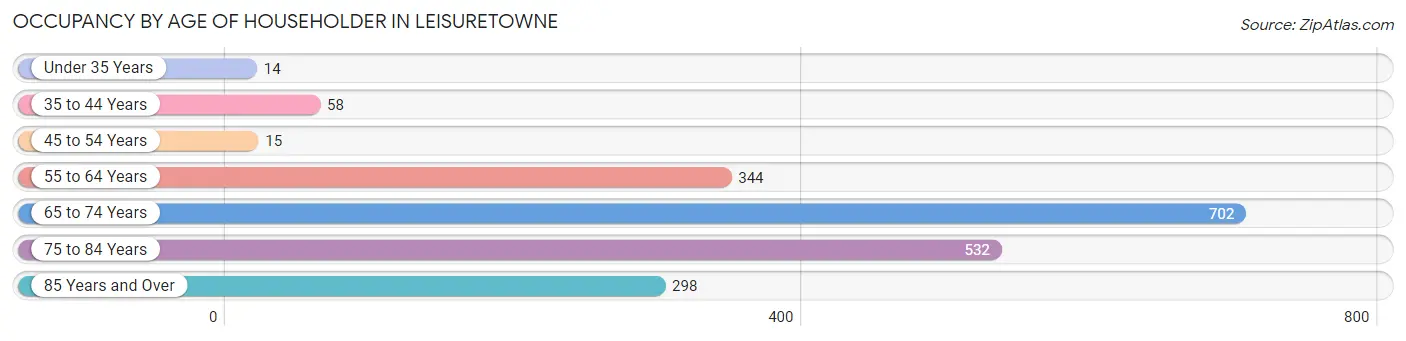
| Age Bracket | # Households | % Households |
| Under 35 Years | 14 | 0.7% |
| 35 to 44 Years | 58 | 2.9% |
| 45 to 54 Years | 15 | 0.8% |
| 55 to 64 Years | 344 | 17.5% |
| 65 to 74 Years | 702 | 35.8% |
| 75 to 84 Years | 532 | 27.1% |
| 85 Years and Over | 298 | 15.2% |
| Total | 1,963 | 100.0% |
Housing Finances in Leisuretowne
Median Income by Occupancy in Leisuretowne
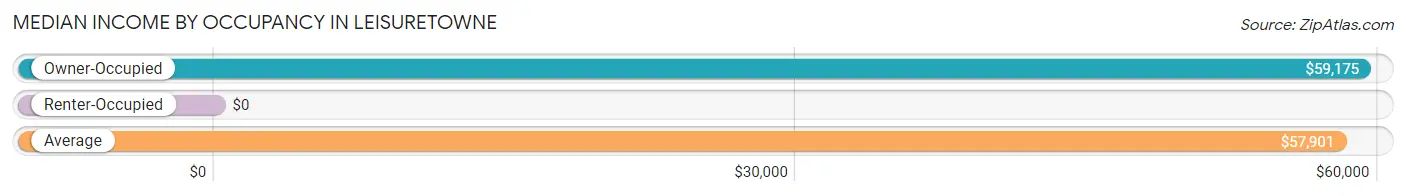
| Occupancy Type | # Households | Median Income |
| Owner-Occupied | 1,909 (97.3%) | $59,175 |
| Renter-Occupied | 54 (2.8%) | $0 |
| Average | 1,963 (100.0%) | $57,901 |
Occupancy by Householder Income Bracket in Leisuretowne
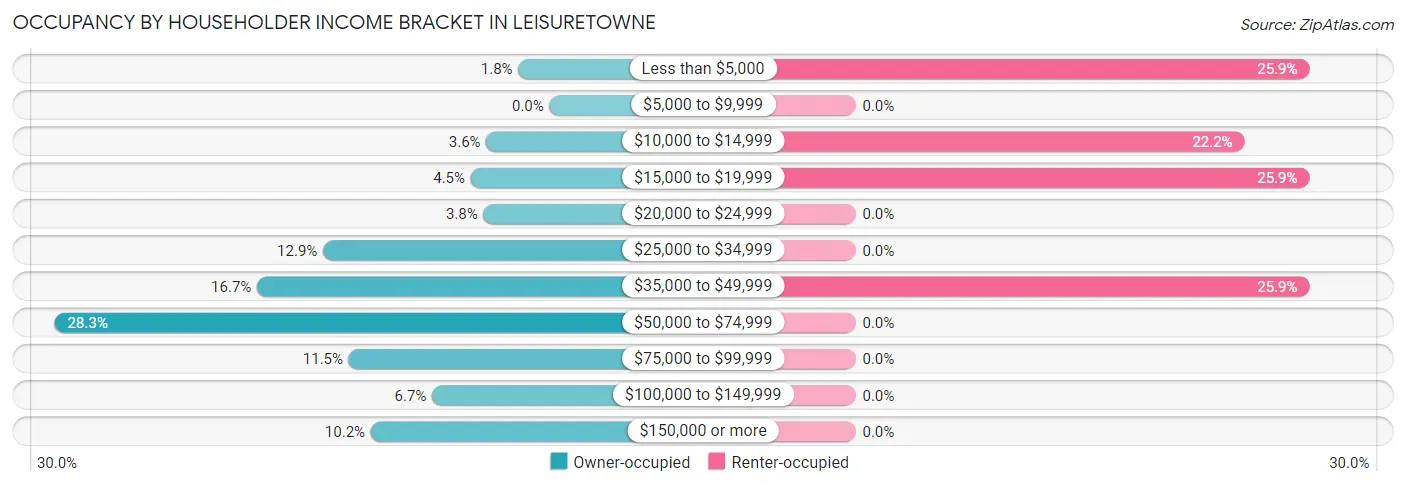
| Income Bracket | Owner-occupied | Renter-occupied |
| Less than $5,000 | 34 (1.8%) | 14 (25.9%) |
| $5,000 to $9,999 | 0 (0.0%) | 0 (0.0%) |
| $10,000 to $14,999 | 69 (3.6%) | 12 (22.2%) |
| $15,000 to $19,999 | 86 (4.5%) | 14 (25.9%) |
| $20,000 to $24,999 | 72 (3.8%) | 0 (0.0%) |
| $25,000 to $34,999 | 247 (12.9%) | 0 (0.0%) |
| $35,000 to $49,999 | 319 (16.7%) | 14 (25.9%) |
| $50,000 to $74,999 | 540 (28.3%) | 0 (0.0%) |
| $75,000 to $99,999 | 219 (11.5%) | 0 (0.0%) |
| $100,000 to $149,999 | 128 (6.7%) | 0 (0.0%) |
| $150,000 or more | 195 (10.2%) | 0 (0.0%) |
| Total | 1,909 (100.0%) | 54 (100.0%) |
Monthly Housing Cost Tiers in Leisuretowne
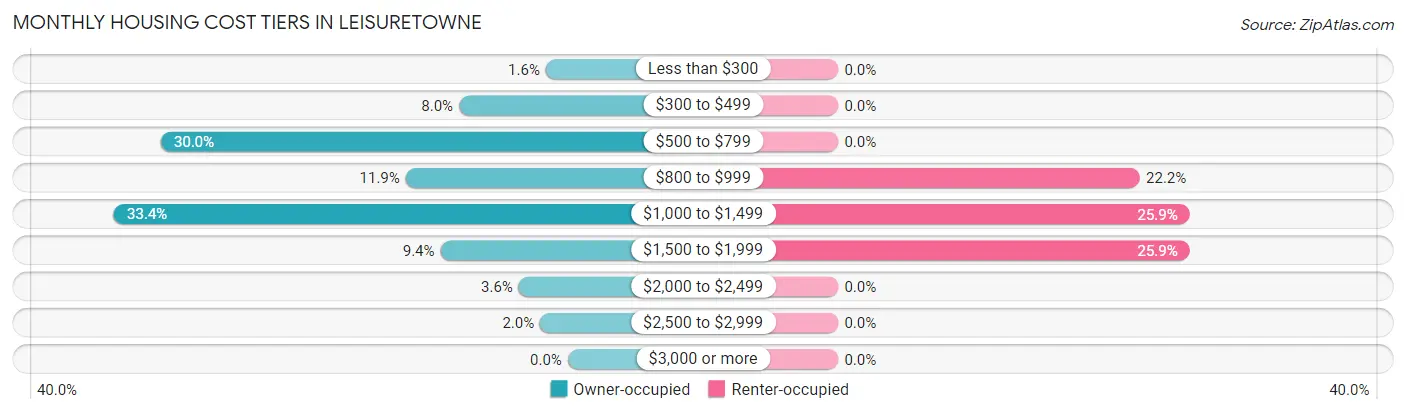
| Monthly Cost | Owner-occupied | Renter-occupied |
| Less than $300 | 31 (1.6%) | 0 (0.0%) |
| $300 to $499 | 153 (8.0%) | 0 (0.0%) |
| $500 to $799 | 572 (30.0%) | 0 (0.0%) |
| $800 to $999 | 228 (11.9%) | 12 (22.2%) |
| $1,000 to $1,499 | 638 (33.4%) | 14 (25.9%) |
| $1,500 to $1,999 | 179 (9.4%) | 14 (25.9%) |
| $2,000 to $2,499 | 69 (3.6%) | 0 (0.0%) |
| $2,500 to $2,999 | 39 (2.0%) | 0 (0.0%) |
| $3,000 or more | 0 (0.0%) | 0 (0.0%) |
| Total | 1,909 (100.0%) | 54 (100.0%) |
Physical Housing Characteristics in Leisuretowne
Housing Structures in Leisuretowne
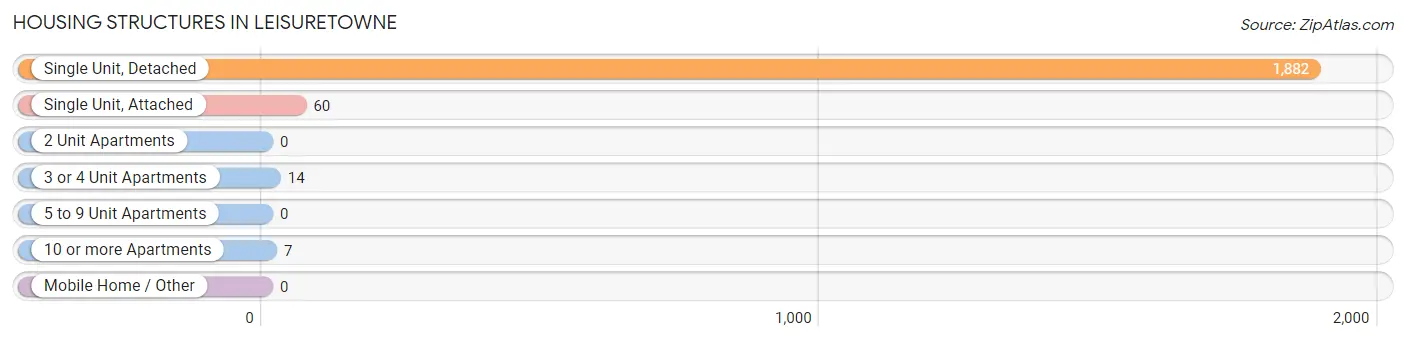
| Structure Type | # Housing Units | % Housing Units |
| Single Unit, Detached | 1,882 | 95.9% |
| Single Unit, Attached | 60 | 3.1% |
| 2 Unit Apartments | 0 | 0.0% |
| 3 or 4 Unit Apartments | 14 | 0.7% |
| 5 to 9 Unit Apartments | 0 | 0.0% |
| 10 or more Apartments | 7 | 0.4% |
| Mobile Home / Other | 0 | 0.0% |
| Total | 1,963 | 100.0% |
Housing Structures by Occupancy in Leisuretowne
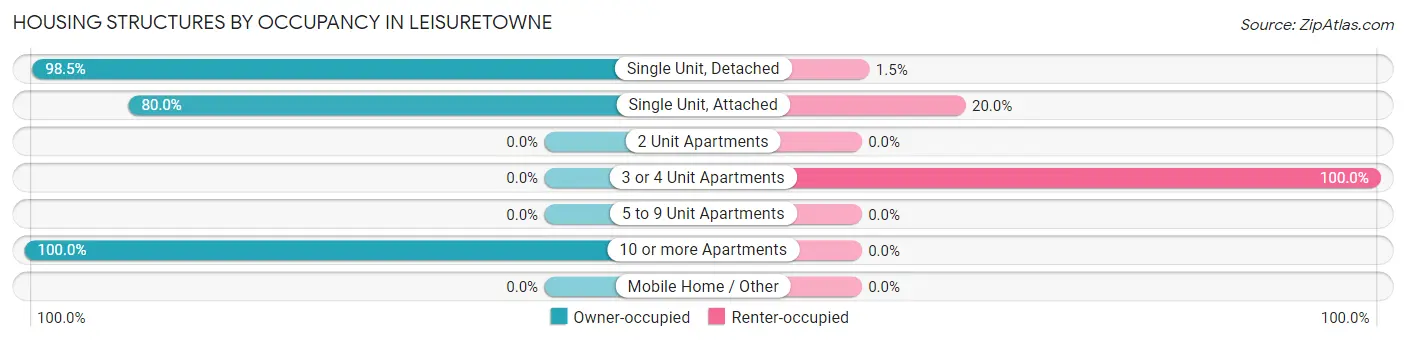
| Structure Type | Owner-occupied | Renter-occupied |
| Single Unit, Detached | 1,854 (98.5%) | 28 (1.5%) |
| Single Unit, Attached | 48 (80.0%) | 12 (20.0%) |
| 2 Unit Apartments | 0 (0.0%) | 0 (0.0%) |
| 3 or 4 Unit Apartments | 0 (0.0%) | 14 (100.0%) |
| 5 to 9 Unit Apartments | 0 (0.0%) | 0 (0.0%) |
| 10 or more Apartments | 7 (100.0%) | 0 (0.0%) |
| Mobile Home / Other | 0 (0.0%) | 0 (0.0%) |
| Total | 1,909 (97.3%) | 54 (2.8%) |
Housing Structures by Number of Rooms in Leisuretowne
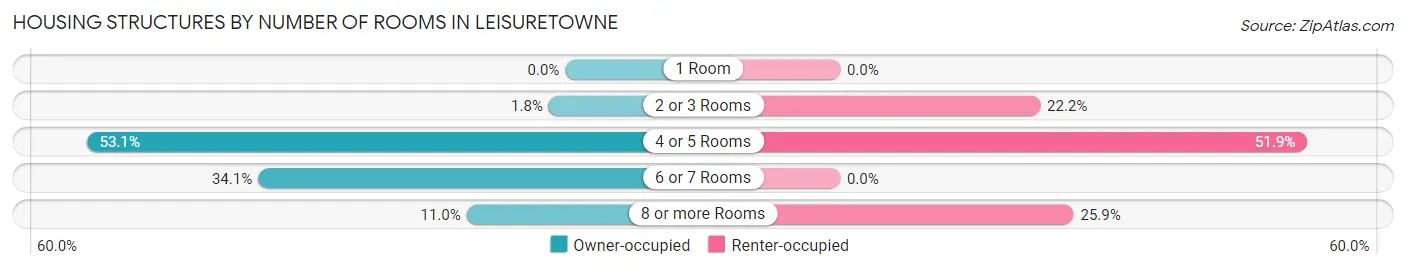
| Number of Rooms | Owner-occupied | Renter-occupied |
| 1 Room | 0 (0.0%) | 0 (0.0%) |
| 2 or 3 Rooms | 35 (1.8%) | 12 (22.2%) |
| 4 or 5 Rooms | 1,014 (53.1%) | 28 (51.8%) |
| 6 or 7 Rooms | 651 (34.1%) | 0 (0.0%) |
| 8 or more Rooms | 209 (11.0%) | 14 (25.9%) |
| Total | 1,909 (100.0%) | 54 (100.0%) |
Housing Structure by Heating Type in Leisuretowne
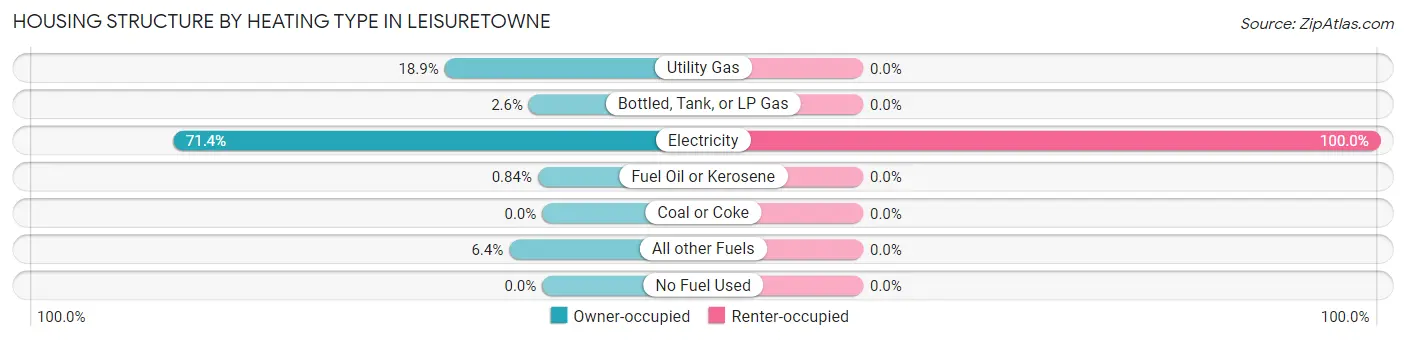
| Heating Type | Owner-occupied | Renter-occupied |
| Utility Gas | 360 (18.9%) | 0 (0.0%) |
| Bottled, Tank, or LP Gas | 49 (2.6%) | 0 (0.0%) |
| Electricity | 1,362 (71.4%) | 54 (100.0%) |
| Fuel Oil or Kerosene | 16 (0.8%) | 0 (0.0%) |
| Coal or Coke | 0 (0.0%) | 0 (0.0%) |
| All other Fuels | 122 (6.4%) | 0 (0.0%) |
| No Fuel Used | 0 (0.0%) | 0 (0.0%) |
| Total | 1,909 (100.0%) | 54 (100.0%) |
Household Vehicle Usage in Leisuretowne
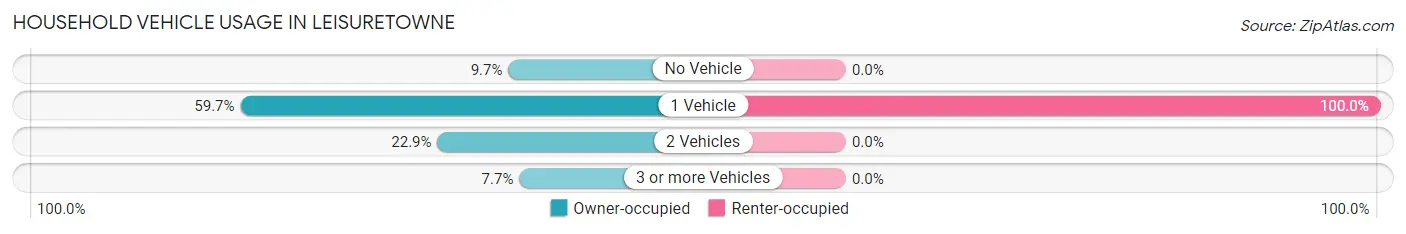
| Vehicles per Household | Owner-occupied | Renter-occupied |
| No Vehicle | 185 (9.7%) | 0 (0.0%) |
| 1 Vehicle | 1,140 (59.7%) | 54 (100.0%) |
| 2 Vehicles | 438 (22.9%) | 0 (0.0%) |
| 3 or more Vehicles | 146 (7.6%) | 0 (0.0%) |
| Total | 1,909 (100.0%) | 54 (100.0%) |
Real Estate & Mortgages in Leisuretowne
Real Estate and Mortgage Overview in Leisuretowne
| Characteristic | Without Mortgage | With Mortgage |
| Housing Units | 949 | 960 |
| Median Property Value | $210,500 | $193,900 |
| Median Household Income | $50,905 | $105 |
| Monthly Housing Costs | $707 | $0 |
| Real Estate Taxes | $3,989 | $15 |
Property Value by Mortgage Status in Leisuretowne
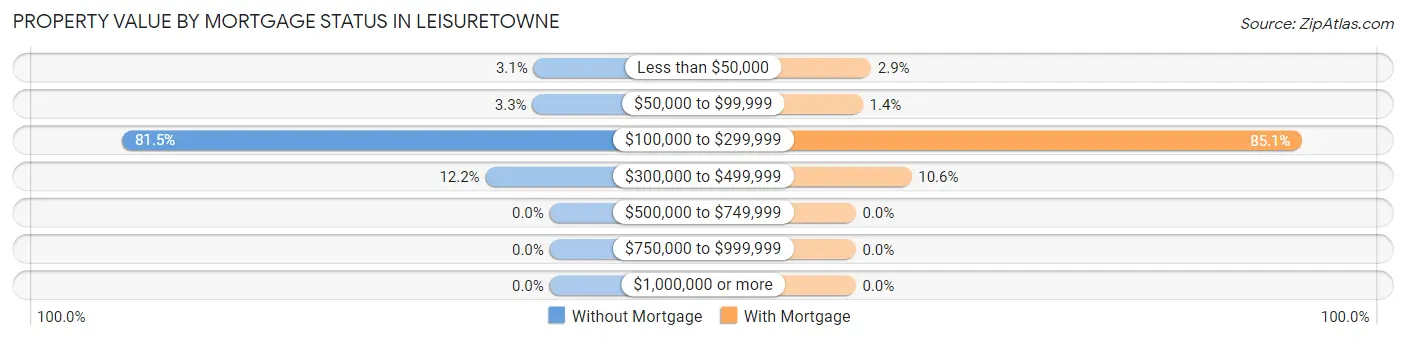
| Property Value | Without Mortgage | With Mortgage |
| Less than $50,000 | 29 (3.1%) | 28 (2.9%) |
| $50,000 to $99,999 | 31 (3.3%) | 13 (1.3%) |
| $100,000 to $299,999 | 773 (81.5%) | 817 (85.1%) |
| $300,000 to $499,999 | 116 (12.2%) | 102 (10.6%) |
| $500,000 to $749,999 | 0 (0.0%) | 0 (0.0%) |
| $750,000 to $999,999 | 0 (0.0%) | 0 (0.0%) |
| $1,000,000 or more | 0 (0.0%) | 0 (0.0%) |
| Total | 949 (100.0%) | 960 (100.0%) |
Household Income by Mortgage Status in Leisuretowne
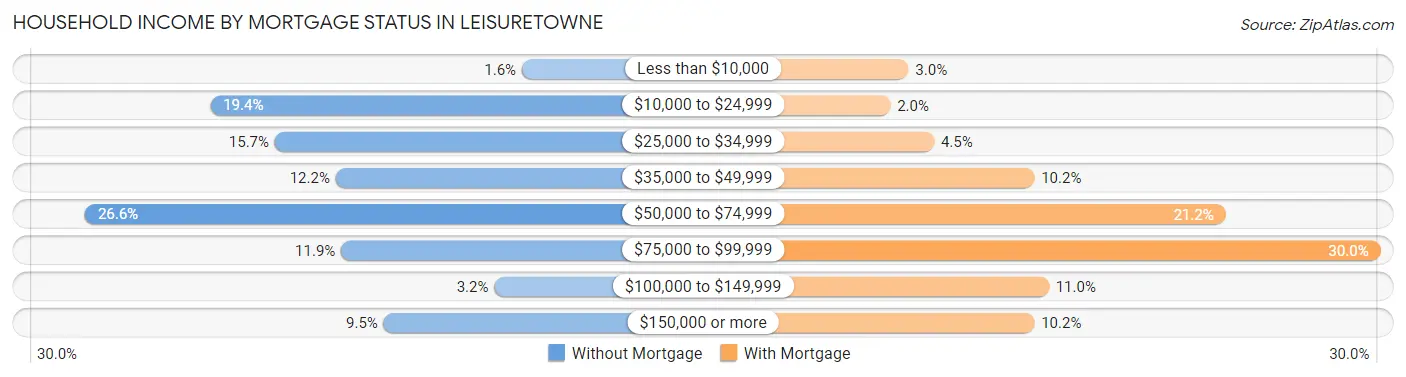
| Household Income | Without Mortgage | With Mortgage |
| Less than $10,000 | 15 (1.6%) | 29 (3.0%) |
| $10,000 to $24,999 | 184 (19.4%) | 19 (2.0%) |
| $25,000 to $34,999 | 149 (15.7%) | 43 (4.5%) |
| $35,000 to $49,999 | 116 (12.2%) | 98 (10.2%) |
| $50,000 to $74,999 | 252 (26.6%) | 203 (21.1%) |
| $75,000 to $99,999 | 113 (11.9%) | 288 (30.0%) |
| $100,000 to $149,999 | 30 (3.2%) | 106 (11.0%) |
| $150,000 or more | 90 (9.5%) | 98 (10.2%) |
| Total | 949 (100.0%) | 960 (100.0%) |
Property Value to Household Income Ratio in Leisuretowne
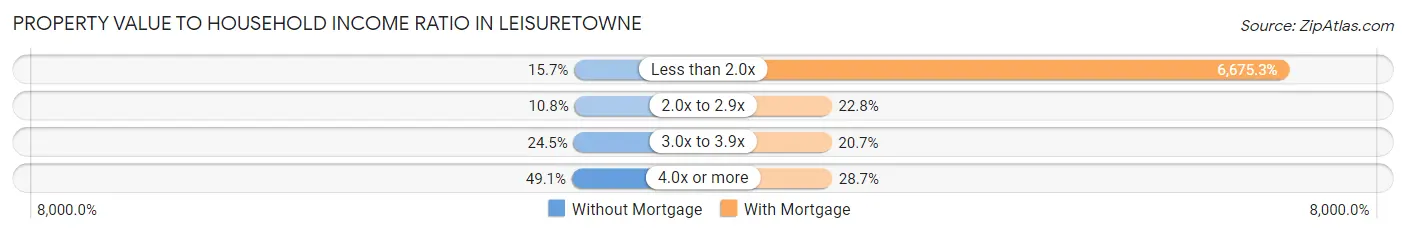
| Value-to-Income Ratio | Without Mortgage | With Mortgage |
| Less than 2.0x | 149 (15.7%) | 64,083 (6,675.3%) |
| 2.0x to 2.9x | 102 (10.7%) | 219 (22.8%) |
| 3.0x to 3.9x | 232 (24.4%) | 199 (20.7%) |
| 4.0x or more | 466 (49.1%) | 275 (28.6%) |
| Total | 949 (100.0%) | 960 (100.0%) |
Real Estate Taxes by Mortgage Status in Leisuretowne
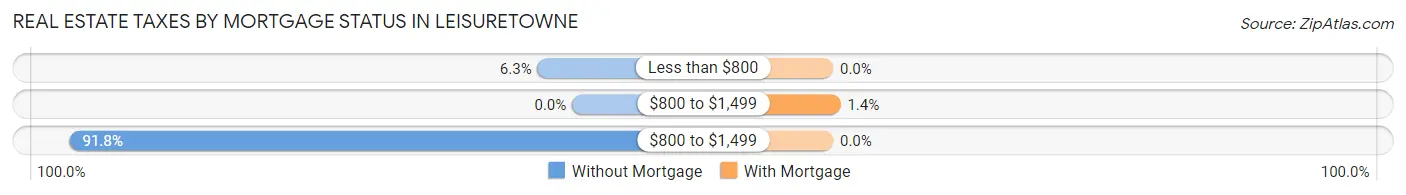
| Property Taxes | Without Mortgage | With Mortgage |
| Less than $800 | 60 (6.3%) | 0 (0.0%) |
| $800 to $1,499 | 0 (0.0%) | 13 (1.3%) |
| $800 to $1,499 | 871 (91.8%) | 0 (0.0%) |
| Total | 949 (100.0%) | 960 (100.0%) |
Health & Disability in Leisuretowne
Health Insurance Coverage by Age in Leisuretowne
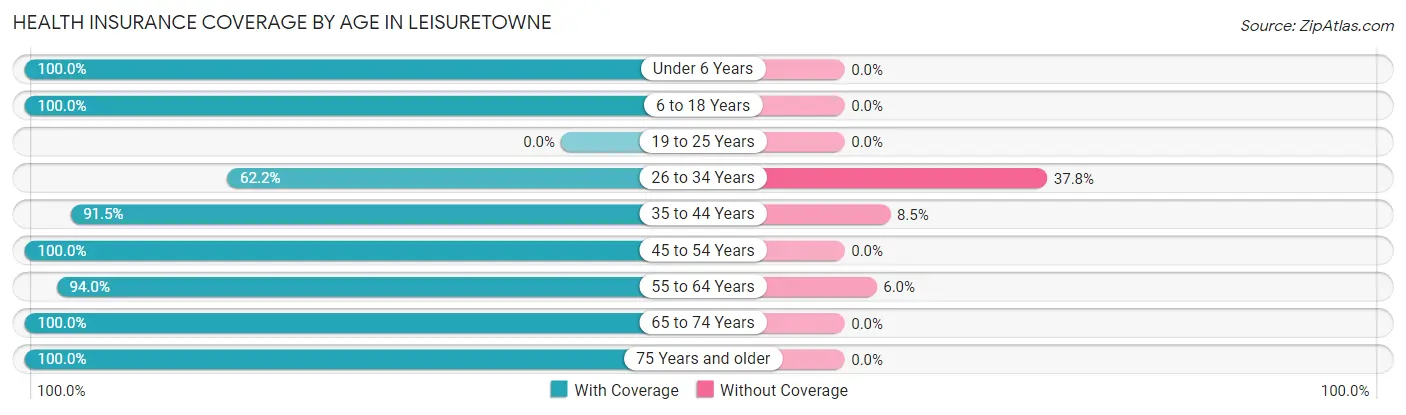
| Age Bracket | With Coverage | Without Coverage |
| Under 6 Years | 43 (100.0%) | 0 (0.0%) |
| 6 to 18 Years | 76 (100.0%) | 0 (0.0%) |
| 19 to 25 Years | 0 (0.0%) | 0 (0.0%) |
| 26 to 34 Years | 28 (62.2%) | 17 (37.8%) |
| 35 to 44 Years | 129 (91.5%) | 12 (8.5%) |
| 45 to 54 Years | 35 (100.0%) | 0 (0.0%) |
| 55 to 64 Years | 568 (94.0%) | 36 (6.0%) |
| 65 to 74 Years | 1,034 (100.0%) | 0 (0.0%) |
| 75 Years and older | 1,233 (100.0%) | 0 (0.0%) |
| Total | 3,146 (98.0%) | 65 (2.0%) |
Health Insurance Coverage by Citizenship Status in Leisuretowne
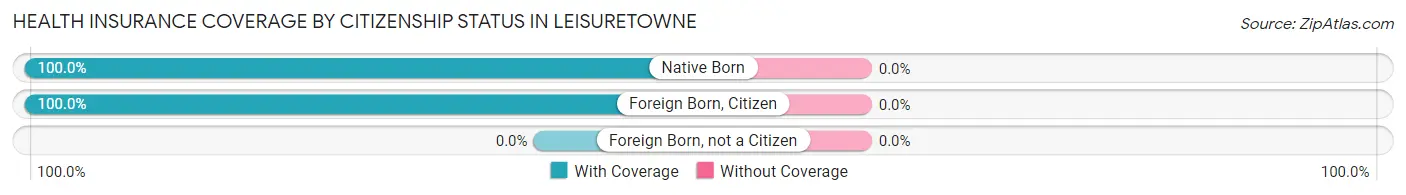
| Citizenship Status | With Coverage | Without Coverage |
| Native Born | 43 (100.0%) | 0 (0.0%) |
| Foreign Born, Citizen | 76 (100.0%) | 0 (0.0%) |
| Foreign Born, not a Citizen | 0 (0.0%) | 0 (0.0%) |
Health Insurance Coverage by Household Income in Leisuretowne
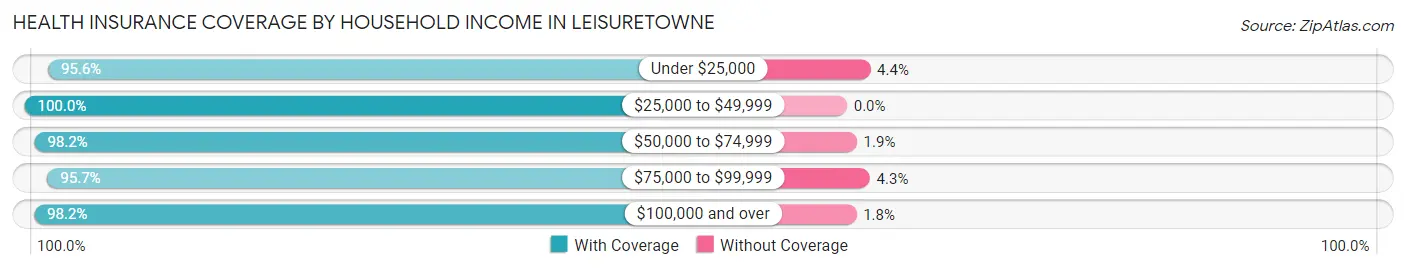
| Household Income | With Coverage | Without Coverage |
| Under $25,000 | 371 (95.6%) | 17 (4.4%) |
| $25,000 to $49,999 | 753 (100.0%) | 0 (0.0%) |
| $50,000 to $74,999 | 953 (98.2%) | 18 (1.8%) |
| $75,000 to $99,999 | 403 (95.7%) | 18 (4.3%) |
| $100,000 and over | 666 (98.2%) | 12 (1.8%) |
Public vs Private Health Insurance Coverage by Age in Leisuretowne
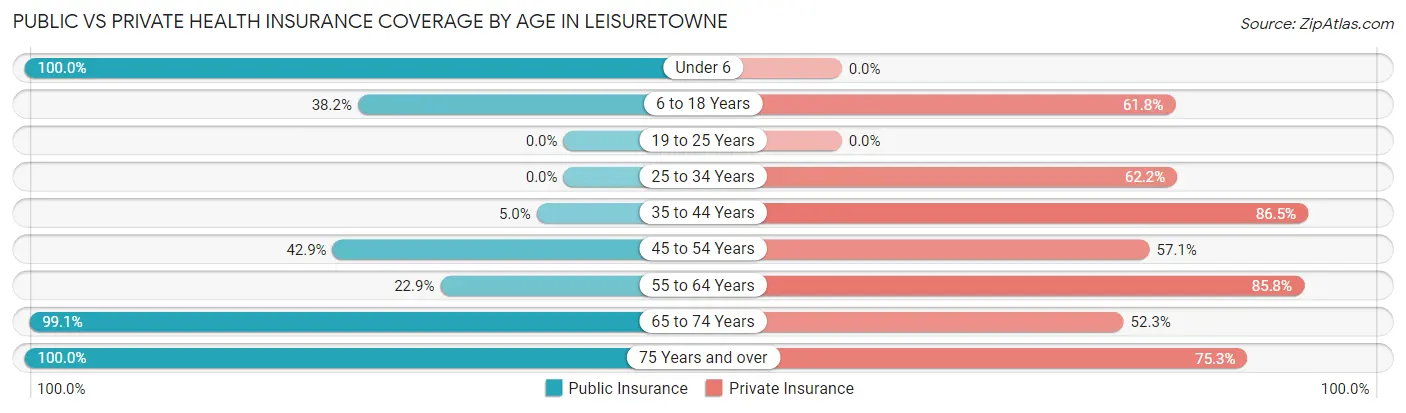
| Age Bracket | Public Insurance | Private Insurance |
| Under 6 | 43 (100.0%) | 0 (0.0%) |
| 6 to 18 Years | 29 (38.2%) | 47 (61.8%) |
| 19 to 25 Years | 0 (0.0%) | 0 (0.0%) |
| 25 to 34 Years | 0 (0.0%) | 28 (62.2%) |
| 35 to 44 Years | 7 (5.0%) | 122 (86.5%) |
| 45 to 54 Years | 15 (42.9%) | 20 (57.1%) |
| 55 to 64 Years | 138 (22.9%) | 518 (85.8%) |
| 65 to 74 Years | 1,025 (99.1%) | 541 (52.3%) |
| 75 Years and over | 1,233 (100.0%) | 928 (75.3%) |
| Total | 2,490 (77.5%) | 2,204 (68.6%) |
Disability Status by Sex by Age in Leisuretowne
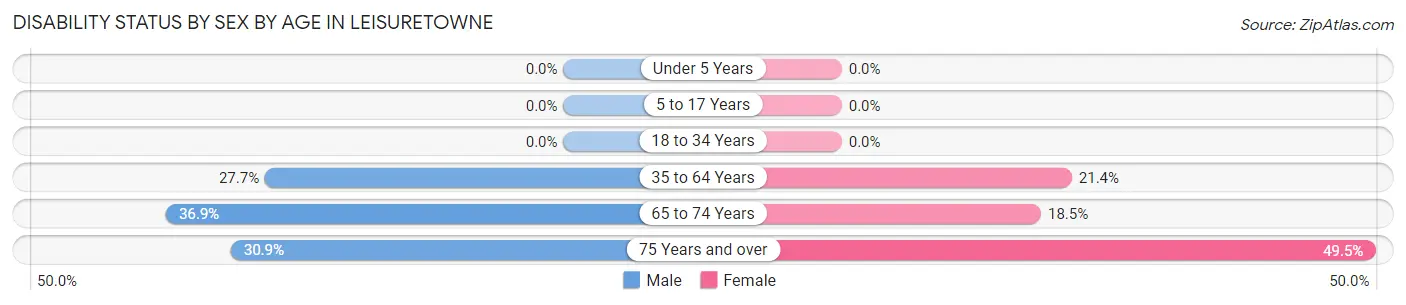
| Age Bracket | Male | Female |
| Under 5 Years | 0 (0.0%) | 0 (0.0%) |
| 5 to 17 Years | 0 (0.0%) | 0 (0.0%) |
| 18 to 34 Years | 0 (0.0%) | 0 (0.0%) |
| 35 to 64 Years | 85 (27.7%) | 101 (21.3%) |
| 65 to 74 Years | 156 (36.9%) | 113 (18.5%) |
| 75 Years and over | 166 (30.9%) | 344 (49.5%) |
Disability Class by Sex by Age in Leisuretowne
Disability Class: Hearing Difficulty
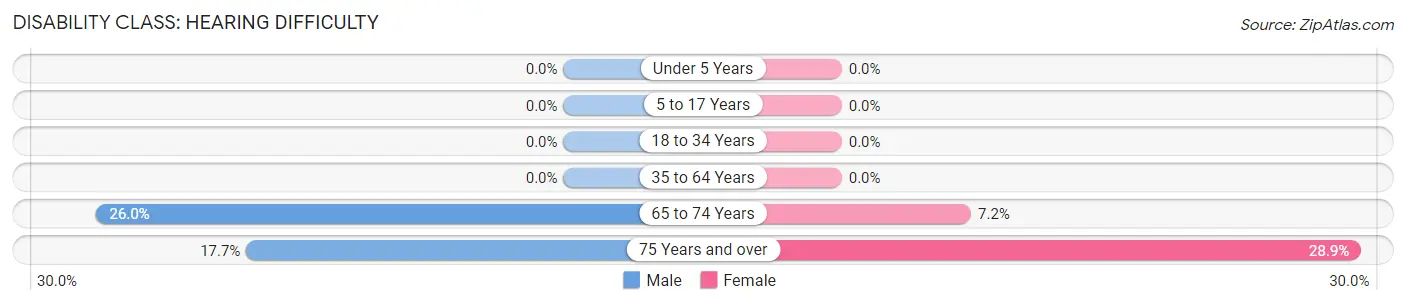
| Age Bracket | Male | Female |
| Under 5 Years | 0 (0.0%) | 0 (0.0%) |
| 5 to 17 Years | 0 (0.0%) | 0 (0.0%) |
| 18 to 34 Years | 0 (0.0%) | 0 (0.0%) |
| 35 to 64 Years | 0 (0.0%) | 0 (0.0%) |
| 65 to 74 Years | 110 (26.0%) | 44 (7.2%) |
| 75 Years and over | 95 (17.7%) | 201 (28.9%) |
Disability Class: Vision Difficulty
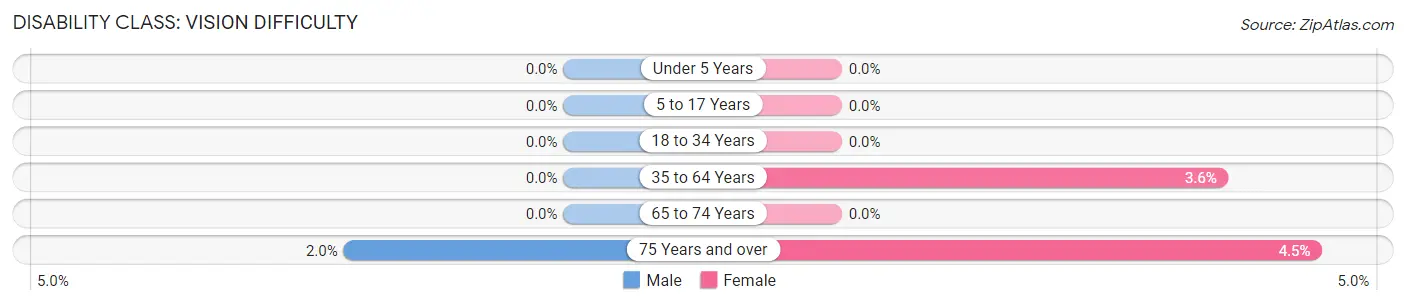
| Age Bracket | Male | Female |
| Under 5 Years | 0 (0.0%) | 0 (0.0%) |
| 5 to 17 Years | 0 (0.0%) | 0 (0.0%) |
| 18 to 34 Years | 0 (0.0%) | 0 (0.0%) |
| 35 to 64 Years | 0 (0.0%) | 17 (3.6%) |
| 65 to 74 Years | 0 (0.0%) | 0 (0.0%) |
| 75 Years and over | 11 (2.0%) | 31 (4.5%) |
Disability Class: Cognitive Difficulty
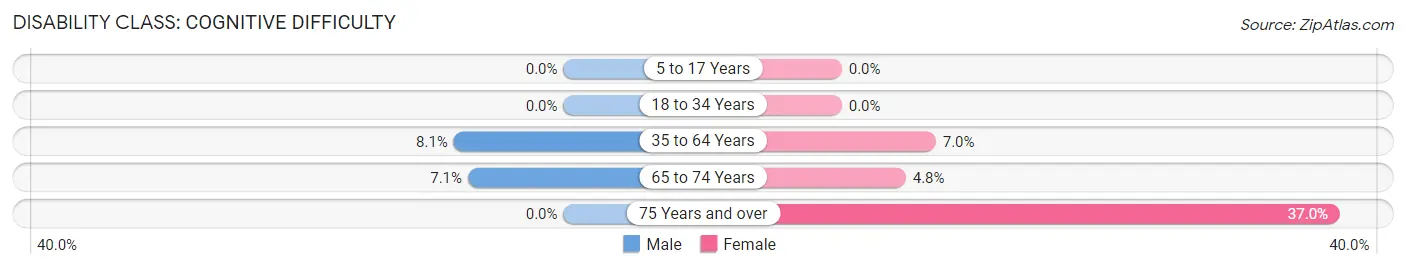
| Age Bracket | Male | Female |
| 5 to 17 Years | 0 (0.0%) | 0 (0.0%) |
| 18 to 34 Years | 0 (0.0%) | 0 (0.0%) |
| 35 to 64 Years | 25 (8.1%) | 33 (7.0%) |
| 65 to 74 Years | 30 (7.1%) | 29 (4.8%) |
| 75 Years and over | 0 (0.0%) | 257 (37.0%) |
Disability Class: Ambulatory Difficulty
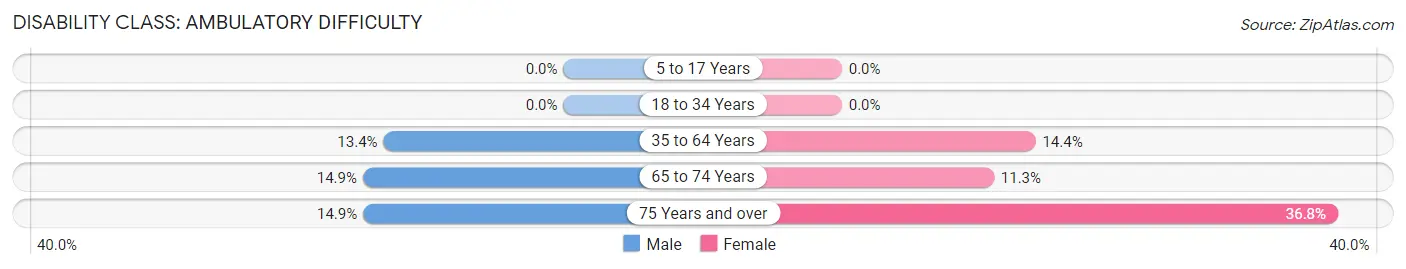
| Age Bracket | Male | Female |
| 5 to 17 Years | 0 (0.0%) | 0 (0.0%) |
| 18 to 34 Years | 0 (0.0%) | 0 (0.0%) |
| 35 to 64 Years | 41 (13.4%) | 68 (14.4%) |
| 65 to 74 Years | 63 (14.9%) | 69 (11.3%) |
| 75 Years and over | 80 (14.9%) | 256 (36.8%) |
Disability Class: Self-Care Difficulty
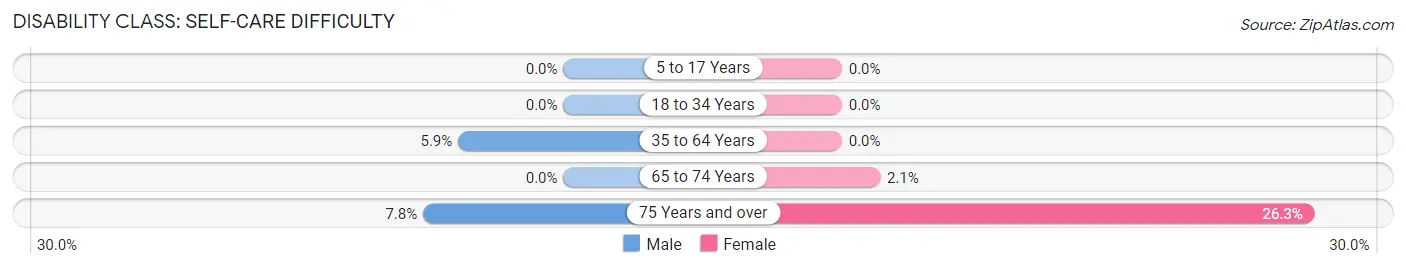
| Age Bracket | Male | Female |
| 5 to 17 Years | 0 (0.0%) | 0 (0.0%) |
| 18 to 34 Years | 0 (0.0%) | 0 (0.0%) |
| 35 to 64 Years | 18 (5.9%) | 0 (0.0%) |
| 65 to 74 Years | 0 (0.0%) | 13 (2.1%) |
| 75 Years and over | 42 (7.8%) | 183 (26.3%) |
Technology Access in Leisuretowne
Computing Device Access in Leisuretowne
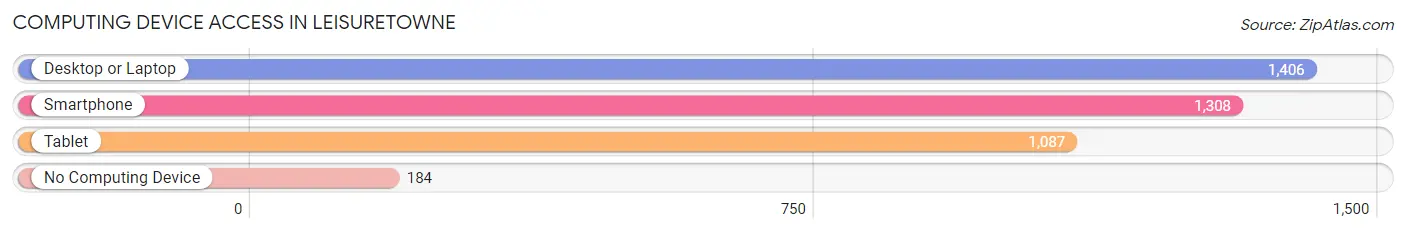
| Device Type | # Households | % Households |
| Desktop or Laptop | 1,406 | 71.6% |
| Smartphone | 1,308 | 66.6% |
| Tablet | 1,087 | 55.4% |
| No Computing Device | 184 | 9.4% |
| Total | 1,963 | 100.0% |
Internet Access in Leisuretowne
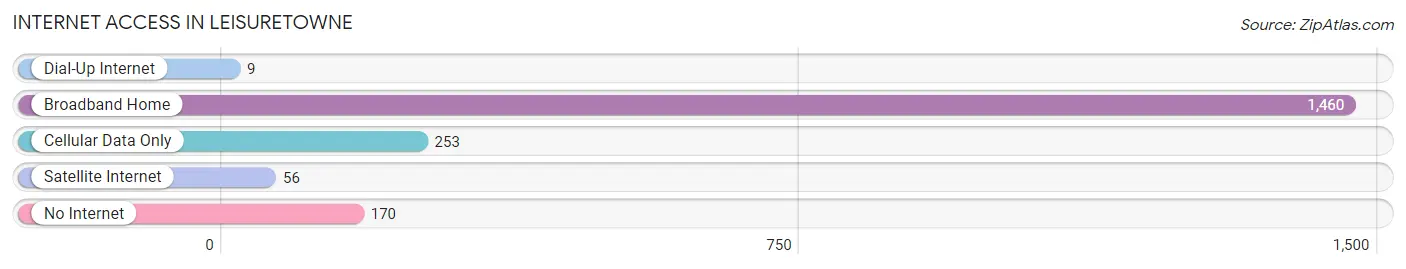
| Internet Type | # Households | % Households |
| Dial-Up Internet | 9 | 0.5% |
| Broadband Home | 1,460 | 74.4% |
| Cellular Data Only | 253 | 12.9% |
| Satellite Internet | 56 | 2.9% |
| No Internet | 170 | 8.7% |
| Total | 1,963 | 100.0% |
Leisuretowne Summary
Leisuretowne, NJ is a small town located in Burlington County, New Jersey. It is situated on the banks of the Rancocas Creek, and is part of the larger metropolitan area of Philadelphia. The town has a population of approximately 4,000 people, and is known for its small-town charm and friendly atmosphere.
Geography
Leisuretowne is located in the heart of Burlington County, New Jersey. It is situated on the banks of the Rancocas Creek, and is part of the larger metropolitan area of Philadelphia. The town is bordered by the towns of Mount Laurel, Moorestown, and Mount Holly. The town is located in the Central Jersey region of the state, and is approximately 25 miles from Philadelphia. The town is situated on a flat plain, and is surrounded by rolling hills and wooded areas.
The climate in Leisuretowne is typical of the Northeast, with hot summers and cold winters. The average temperature in the summer is around 80 degrees Fahrenheit, and the average temperature in the winter is around 40 degrees Fahrenheit. The town receives an average of 40 inches of precipitation per year, with most of it falling in the form of rain.
Economy
Leisuretowne has a strong economy, with a variety of businesses and industries. The town is home to several large corporations, including a major pharmaceutical company and a large food processing plant. The town also has a thriving retail sector, with several large shopping centers and a variety of small businesses. The town is also home to a number of small manufacturing companies, as well as a number of service-based businesses.
The town is also home to a number of educational institutions, including a community college and a number of private schools. The town is also home to a number of parks and recreational facilities, including a golf course and a number of public parks.
Demographics
Leisuretowne has a population of approximately 4,000 people, with a median age of 39. The town is predominantly white, with a small percentage of African Americans and Hispanics. The town has a median household income of $60,000, and the median home value is $250,000. The town has a low unemployment rate, and the majority of the population is employed in the service sector.
Leisuretowne is a small town with a big heart. It is a great place to live, work, and play, and is a great place to raise a family. The town has a strong economy, and is home to a variety of businesses and industries. The town is also home to a number of educational institutions, parks, and recreational facilities. The town is a great place to call home, and is a great place to visit.
Common Questions
What is the Total Population of Leisuretowne?
Total Population of Leisuretowne is 3,211.
What is the Total Male Population of Leisuretowne?
Total Male Population of Leisuretowne is 1,374.
What is the Total Female Population of Leisuretowne?
Total Female Population of Leisuretowne is 1,837.
What is the Ratio of Males per 100 Females in Leisuretowne?
There are 74.80 Males per 100 Females in Leisuretowne.
What is the Ratio of Females per 100 Males in Leisuretowne?
There are 133.70 Females per 100 Males in Leisuretowne.
What is the Median Population Age in Leisuretowne?
Median Population Age in Leisuretowne is 72.3 Years.
What is the Average Family Size in Leisuretowne
Average Family Size in Leisuretowne is 2.2 People.
What is the Average Household Size in Leisuretowne
Average Household Size in Leisuretowne is 1.6 People.
What is Per Capita Income in Leisuretowne?
Per Capita income in Leisuretowne is $43,390.
What is the Median Family Income in Leisuretowne?
Median Family Income in Leisuretowne is $73,219.
What is the Median Household income in Leisuretowne?
Median Household Income in Leisuretowne is $57,901.
What is Inequality or Gini Index in Leisuretowne?
Inequality or Gini Index in Leisuretowne is 0.40.
How Large is the Labor Force in Leisuretowne?
There are 725 People in the Labor Forcein in Leisuretowne.
What is the Percentage of People in the Labor Force in Leisuretowne?
23.1% of People are in the Labor Force in Leisuretowne.
What is the Unemployment Rate in Leisuretowne?
Unemployment Rate in Leisuretowne is 8.1%.