Sea Bright borough, NJ
Sea Bright borough Overview
1,629
TOTAL POPULATION
865
MALE POPULATION
764
FEMALE POPULATION
113.22
MALES / 100 FEMALES
88.32
FEMALES / 100 MALES
51.9
MEDIAN AGE
2.7
AVG FAMILY SIZE
1.8
AVG HOUSEHOLD SIZE
$103,242
PER CAPITA INCOME
$203,000
AVG FAMILY INCOME
$109,402
AVG HOUSEHOLD INCOME
16.9%
WAGE / INCOME GAP [ % ]
83.1¢/ $1
WAGE / INCOME GAP [ $ ]
0.52
INEQUALITY / GINI INDEX
988
LABOR FORCE [ PEOPLE ]
67.1%
PERCENT IN LABOR FORCE
5.1%
UNEMPLOYMENT RATE
Race in Sea Bright borough
The most populous races in Sea Bright borough are White / Caucasian (1,562 | 95.9%), Hispanic or Latino (39 | 2.4%), and Two or more Races (31 | 1.9%).
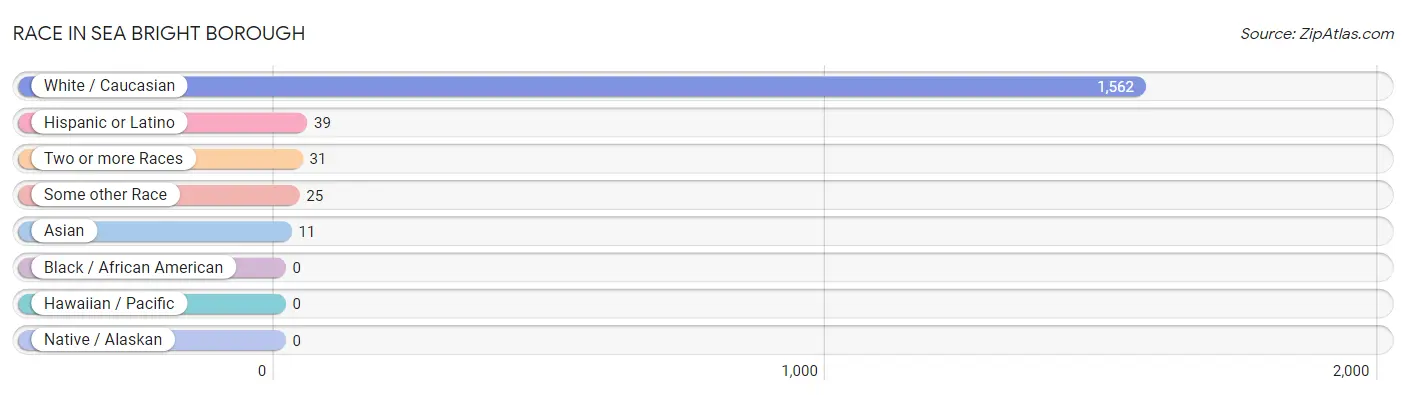
| Race | # Population | % Population |
| Asian | 11 | 0.7% |
| Black / African American | 0 | 0.0% |
| Hawaiian / Pacific | 0 | 0.0% |
| Hispanic or Latino | 39 | 2.4% |
| Native / Alaskan | 0 | 0.0% |
| White / Caucasian | 1,562 | 95.9% |
| Two or more Races | 31 | 1.9% |
| Some other Race | 25 | 1.5% |
| Total | 1,629 | 100.0% |
Ancestry in Sea Bright borough
The most populous ancestries reported in Sea Bright borough are Irish (456 | 28.0%), Italian (372 | 22.8%), German (276 | 16.9%), Polish (124 | 7.6%), and English (100 | 6.1%), together accounting for 81.5% of all Sea Bright borough residents.
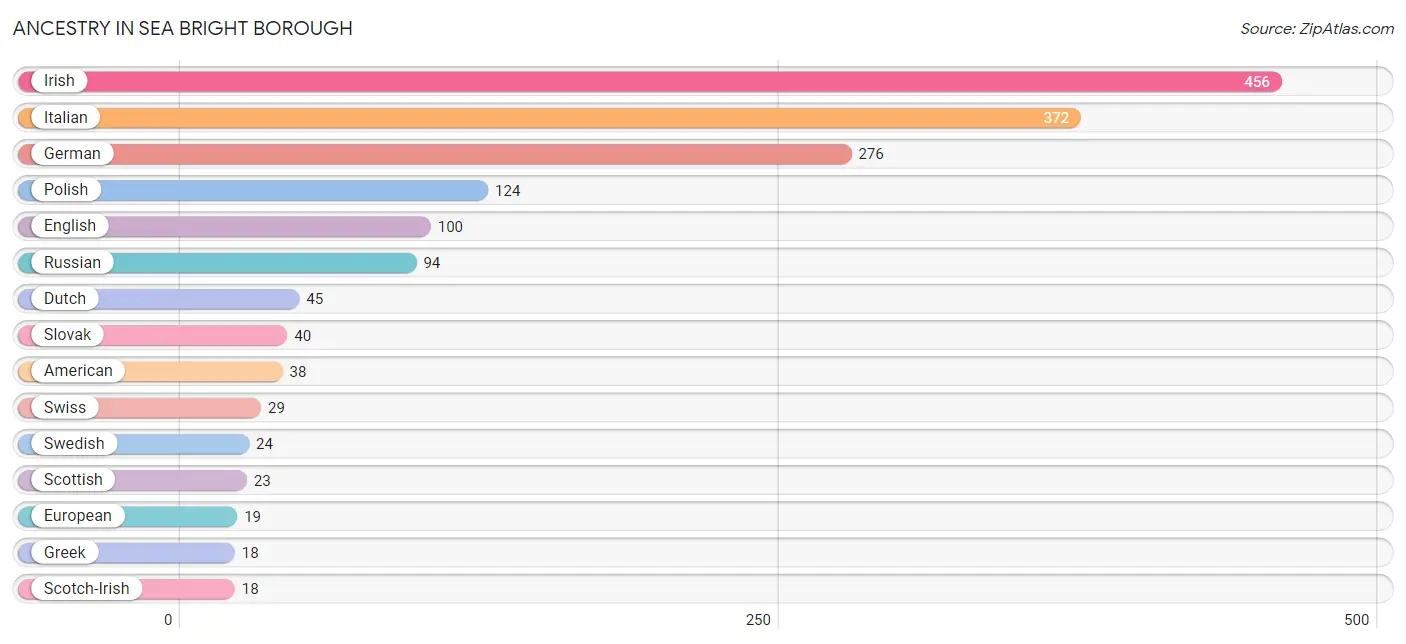
| Ancestry | # Population | % Population |
| American | 38 | 2.3% |
| Armenian | 14 | 0.9% |
| Austrian | 6 | 0.4% |
| Bhutanese | 6 | 0.4% |
| British | 6 | 0.4% |
| Burmese | 6 | 0.4% |
| Chippewa | 3 | 0.2% |
| Dutch | 45 | 2.8% |
| Eastern European | 13 | 0.8% |
| English | 100 | 6.1% |
| European | 19 | 1.2% |
| Finnish | 12 | 0.7% |
| French | 3 | 0.2% |
| German | 276 | 16.9% |
| Greek | 18 | 1.1% |
| Hungarian | 8 | 0.5% |
| Indian (Asian) | 11 | 0.7% |
| Irish | 456 | 28.0% |
| Italian | 372 | 22.8% |
| Mexican | 13 | 0.8% |
| Norwegian | 6 | 0.4% |
| Peruvian | 10 | 0.6% |
| Polish | 124 | 7.6% |
| Portuguese | 6 | 0.4% |
| Romanian | 10 | 0.6% |
| Russian | 94 | 5.8% |
| Scotch-Irish | 18 | 1.1% |
| Scottish | 23 | 1.4% |
| Slovak | 40 | 2.5% |
| South American | 10 | 0.6% |
| Spaniard | 13 | 0.8% |
| Spanish | 3 | 0.2% |
| Swedish | 24 | 1.5% |
| Swiss | 29 | 1.8% |
| Ukrainian | 12 | 0.7% |
| Welsh | 7 | 0.4% | View All 36 Rows |
Immigrants in Sea Bright borough
The most numerous immigrant groups reported in Sea Bright borough came from Europe (47 | 2.9%), Latin America (23 | 1.4%), Belarus (21 | 1.3%), Eastern Europe (21 | 1.3%), and Southern Europe (20 | 1.2%), together accounting for 8.1% of all Sea Bright borough residents.
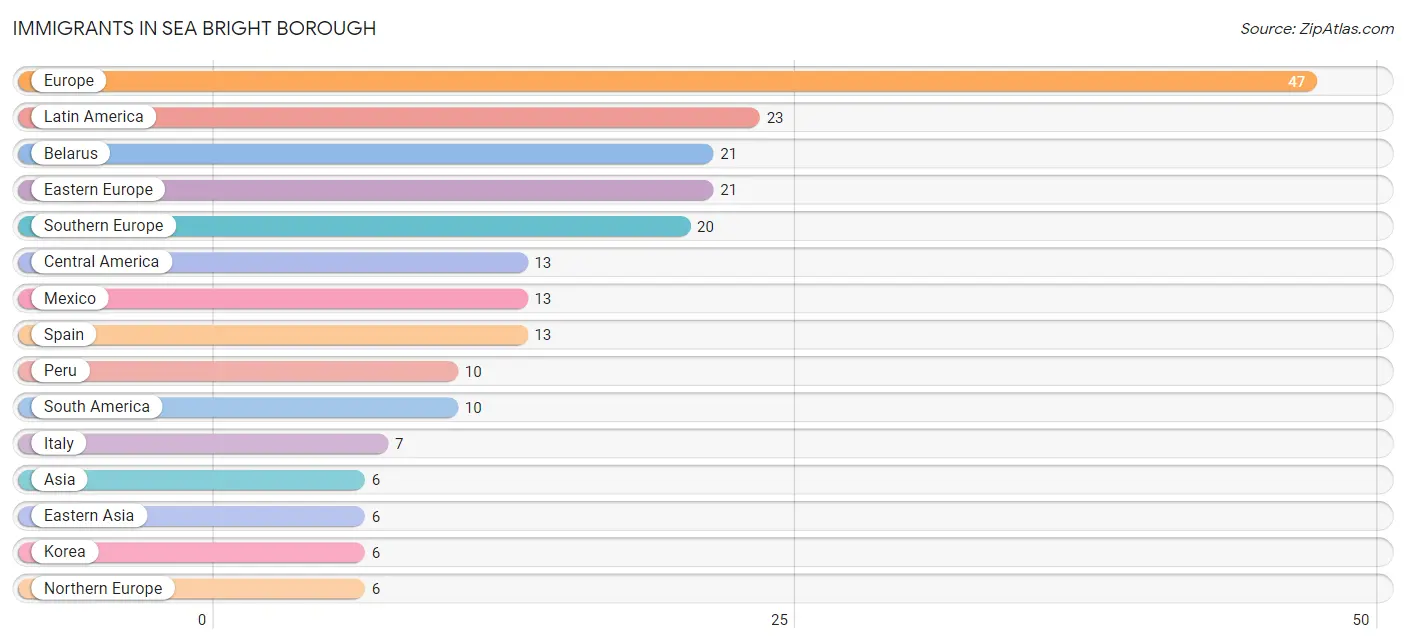
| Immigration Origin | # Population | % Population |
| Asia | 6 | 0.4% |
| Belarus | 21 | 1.3% |
| Central America | 13 | 0.8% |
| Eastern Asia | 6 | 0.4% |
| Eastern Europe | 21 | 1.3% |
| Europe | 47 | 2.9% |
| Italy | 7 | 0.4% |
| Korea | 6 | 0.4% |
| Latin America | 23 | 1.4% |
| Mexico | 13 | 0.8% |
| Northern Europe | 6 | 0.4% |
| Peru | 10 | 0.6% |
| South America | 10 | 0.6% |
| Southern Europe | 20 | 1.2% |
| Spain | 13 | 0.8% | View All 15 Rows |
Sex and Age in Sea Bright borough
Sex and Age in Sea Bright borough
The most populous age groups in Sea Bright borough are 50 to 54 Years (145 | 16.8%) for men and 55 to 59 Years (106 | 13.9%) for women.
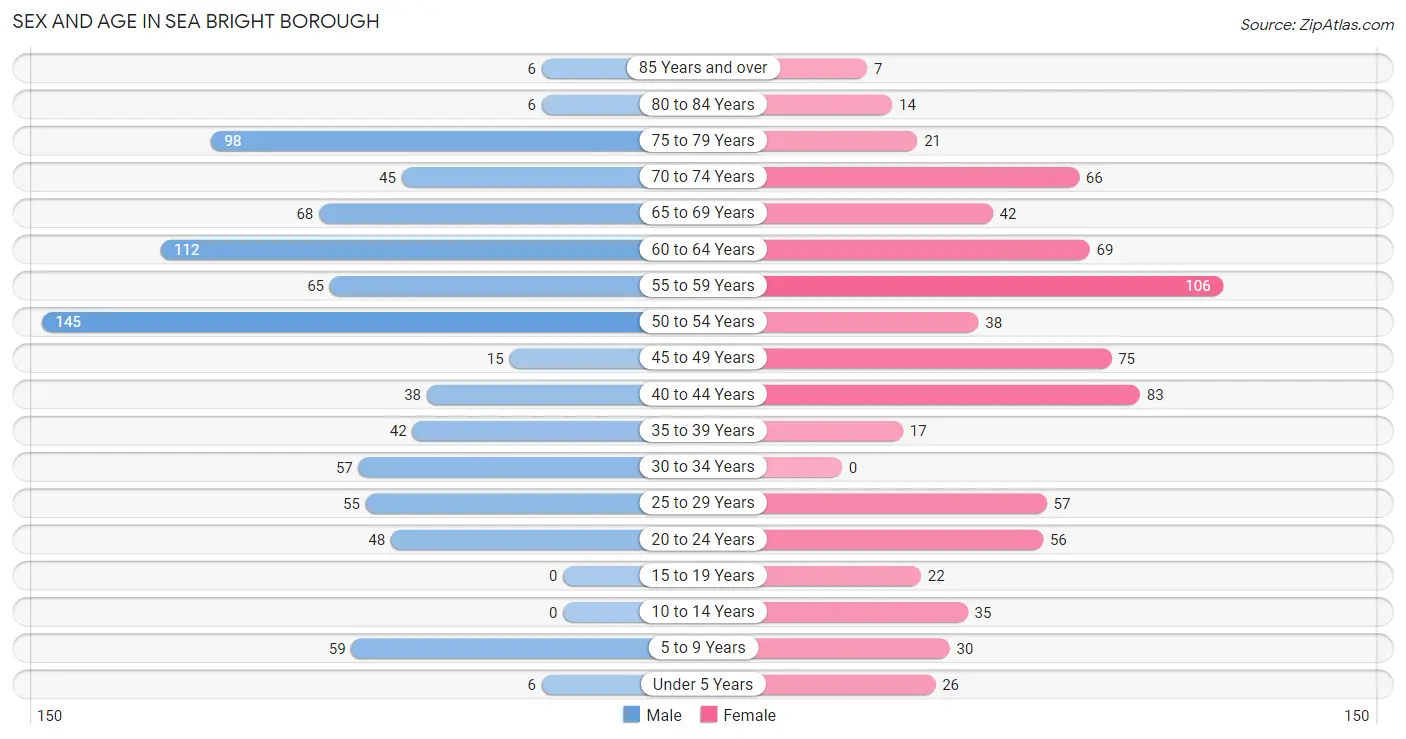
| Age Bracket | Male | Female |
| Under 5 Years | 6 (0.7%) | 26 (3.4%) |
| 5 to 9 Years | 59 (6.8%) | 30 (3.9%) |
| 10 to 14 Years | 0 (0.0%) | 35 (4.6%) |
| 15 to 19 Years | 0 (0.0%) | 22 (2.9%) |
| 20 to 24 Years | 48 (5.6%) | 56 (7.3%) |
| 25 to 29 Years | 55 (6.4%) | 57 (7.5%) |
| 30 to 34 Years | 57 (6.6%) | 0 (0.0%) |
| 35 to 39 Years | 42 (4.9%) | 17 (2.2%) |
| 40 to 44 Years | 38 (4.4%) | 83 (10.9%) |
| 45 to 49 Years | 15 (1.7%) | 75 (9.8%) |
| 50 to 54 Years | 145 (16.8%) | 38 (5.0%) |
| 55 to 59 Years | 65 (7.5%) | 106 (13.9%) |
| 60 to 64 Years | 112 (13.0%) | 69 (9.0%) |
| 65 to 69 Years | 68 (7.9%) | 42 (5.5%) |
| 70 to 74 Years | 45 (5.2%) | 66 (8.6%) |
| 75 to 79 Years | 98 (11.3%) | 21 (2.8%) |
| 80 to 84 Years | 6 (0.7%) | 14 (1.8%) |
| 85 Years and over | 6 (0.7%) | 7 (0.9%) |
| Total | 865 (100.0%) | 764 (100.0%) |
Families and Households in Sea Bright borough
Median Family Size in Sea Bright borough
The median family size in Sea Bright borough is 2.68 persons per family, with single female/mother families (15 | 5.2%) accounting for the largest median family size of 2.73 persons per family. On the other hand, single male/father families (7 | 2.4%) represent the smallest median family size with 1.86 persons per family.
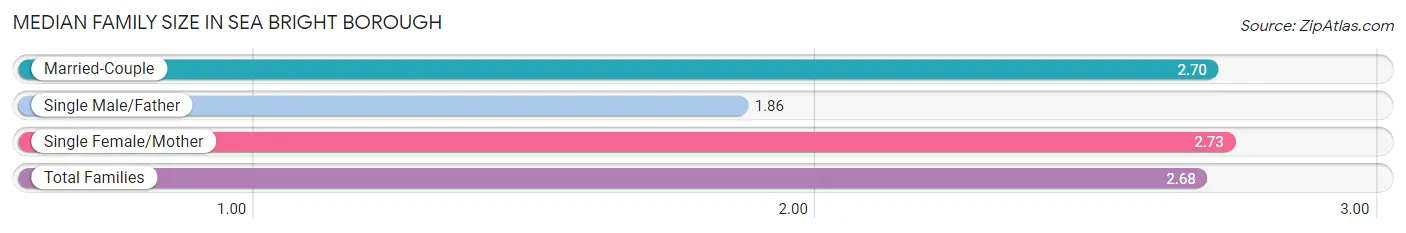
| Family Type | # Families | Family Size |
| Married-Couple | 266 (92.4%) | 2.70 |
| Single Male/Father | 7 (2.4%) | 1.86 |
| Single Female/Mother | 15 (5.2%) | 2.73 |
| Total Families | 288 (100.0%) | 2.68 |
Median Household Size in Sea Bright borough
The median household size in Sea Bright borough is 1.82 persons per household, with single female/mother households (15 | 1.7%) accounting for the largest median household size of 3.07 persons per household. non-family households (607 | 67.8%) represent the smallest median household size with 1.39 persons per household.
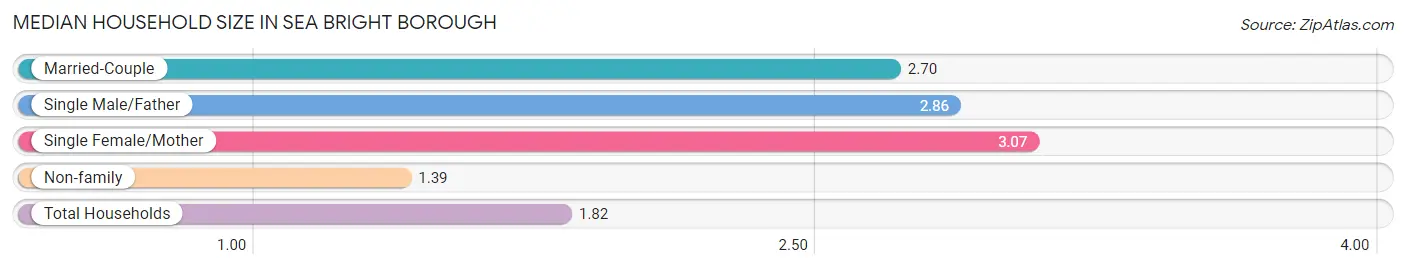
| Household Type | # Households | Household Size |
| Married-Couple | 266 (29.7%) | 2.70 |
| Single Male/Father | 7 (0.8%) | 2.86 |
| Single Female/Mother | 15 (1.7%) | 3.07 |
| Non-family | 607 (67.8%) | 1.39 |
| Total Households | 895 (100.0%) | 1.82 |
Household Size by Marriage Status in Sea Bright borough
Out of a total of 895 households in Sea Bright borough, 288 (32.2%) are family households, while 607 (67.8%) are nonfamily households. The most numerous type of family households are 2-person households, comprising 172, and the most common type of nonfamily households are 1-person households, comprising 386.
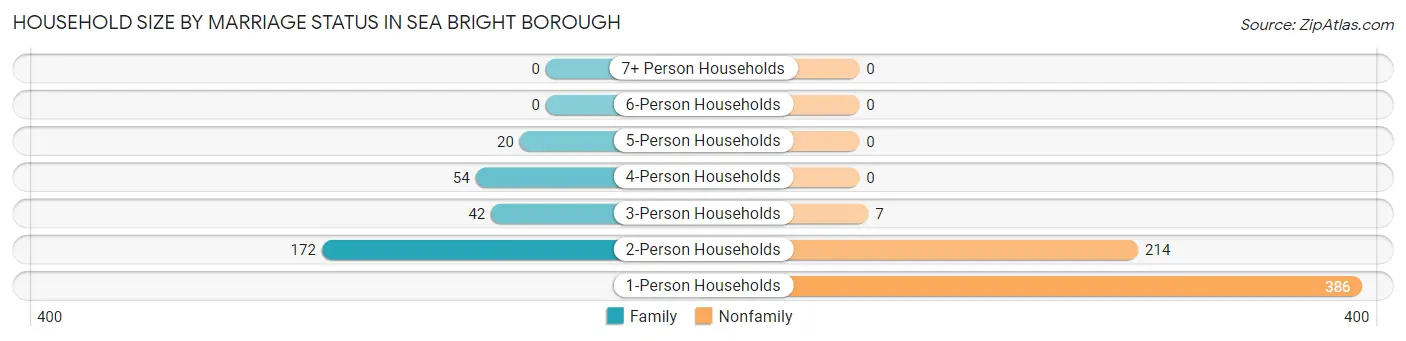
| Household Size | Family Households | Nonfamily Households |
| 1-Person Households | - | 386 (43.1%) |
| 2-Person Households | 172 (19.2%) | 214 (23.9%) |
| 3-Person Households | 42 (4.7%) | 7 (0.8%) |
| 4-Person Households | 54 (6.0%) | 0 (0.0%) |
| 5-Person Households | 20 (2.2%) | 0 (0.0%) |
| 6-Person Households | 0 (0.0%) | 0 (0.0%) |
| 7+ Person Households | 0 (0.0%) | 0 (0.0%) |
| Total | 288 (32.2%) | 607 (67.8%) |
Female Fertility in Sea Bright borough
Fertility by Age in Sea Bright borough
Average fertility rate in Sea Bright borough is 41.0 births per 1,000 women. Women in the age bracket of 35 to 50 years have the highest fertility rate with 71.0 births per 1,000 women. Women in the age bracket of 35 to 50 years acount for 100.0% of all women with births.
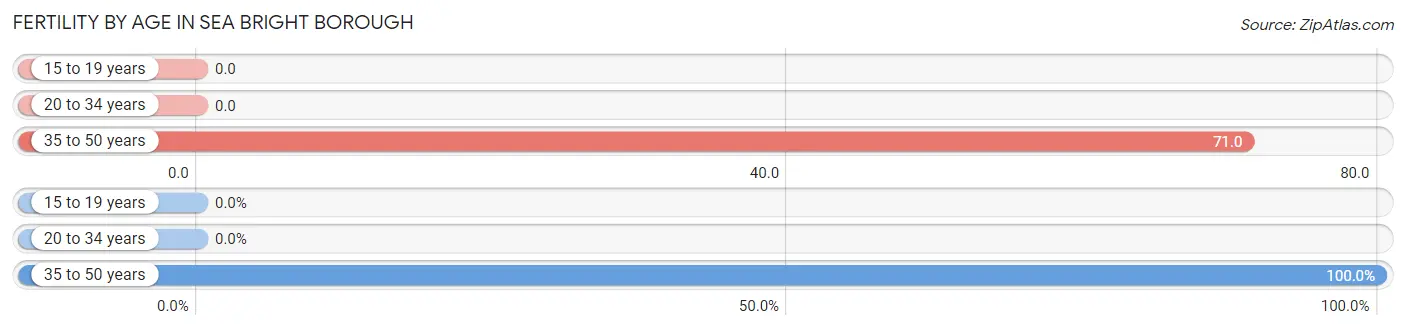
| Age Bracket | Women with Births | Births / 1,000 Women |
| 15 to 19 years | 0 (0.0%) | 0.0 |
| 20 to 34 years | 0 (0.0%) | 0.0 |
| 35 to 50 years | 13 (100.0%) | 71.0 |
| Total | 13 (100.0%) | 41.0 |
Fertility by Age by Marriage Status in Sea Bright borough
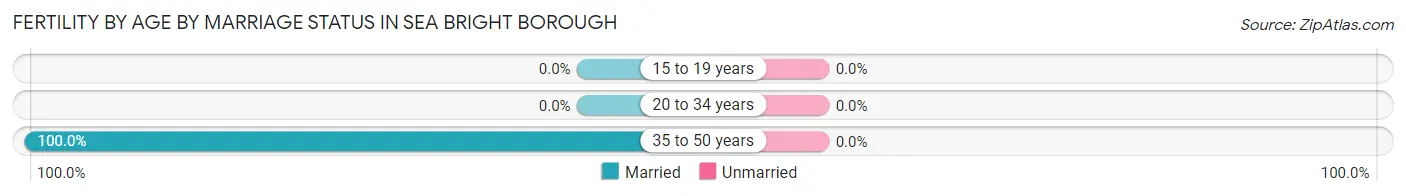
| Age Bracket | Married | Unmarried |
| 15 to 19 years | 0 (0.0%) | 0 (0.0%) |
| 20 to 34 years | 0 (0.0%) | 0 (0.0%) |
| 35 to 50 years | 13 (100.0%) | 0 (0.0%) |
| Total | 13 (100.0%) | 0 (0.0%) |
Fertility by Education in Sea Bright borough
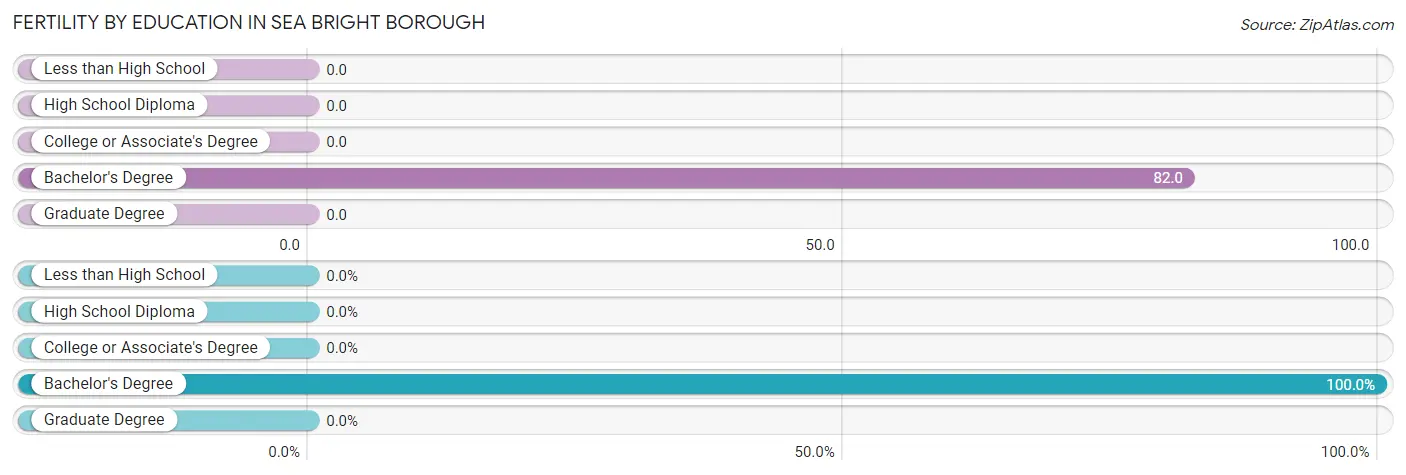
| Educational Attainment | Women with Births | Births / 1,000 Women |
| Less than High School | 0 (0.0%) | 0.0 |
| High School Diploma | 0 (0.0%) | 0.0 |
| College or Associate's Degree | 0 (0.0%) | 0.0 |
| Bachelor's Degree | 13 (100.0%) | 82.0 |
| Graduate Degree | 0 (0.0%) | 0.0 |
| Total | 13 (100.0%) | 41.0 |
Fertility by Education by Marriage Status in Sea Bright borough
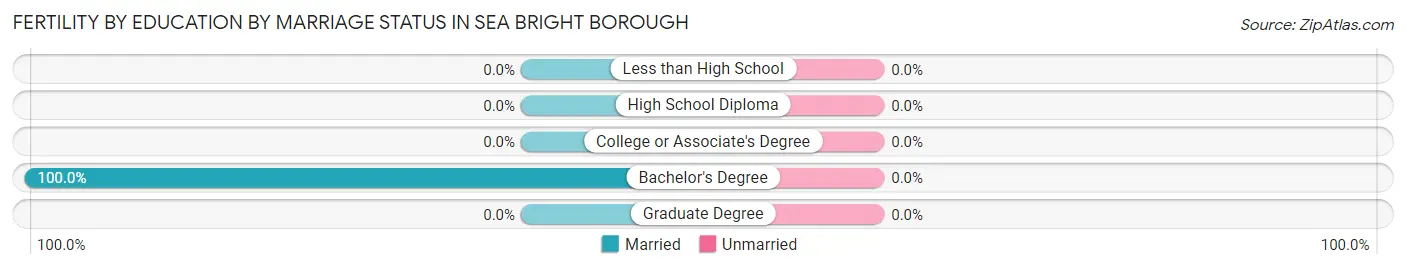
| Educational Attainment | Married | Unmarried |
| Less than High School | 0 (0.0%) | 0 (0.0%) |
| High School Diploma | 0 (0.0%) | 0 (0.0%) |
| College or Associate's Degree | 0 (0.0%) | 0 (0.0%) |
| Bachelor's Degree | 13 (100.0%) | 0 (0.0%) |
| Graduate Degree | 0 (0.0%) | 0 (0.0%) |
| Total | 13 (100.0%) | 0 (0.0%) |
Income in Sea Bright borough
Income Overview in Sea Bright borough
Per Capita Income in Sea Bright borough is $103,242, while median incomes of families and households are $203,000 and $109,402 respectively.
| Characteristic | Number | Measure |
| Per Capita Income | 1,629 | $103,242 |
| Median Family Income | 288 | $203,000 |
| Mean Family Income | 288 | $343,390 |
| Median Household Income | 895 | $109,402 |
| Mean Household Income | 895 | $186,418 |
| Income Deficit | 288 | $0 |
| Wage / Income Gap (%) | 1,629 | 16.87% |
| Wage / Income Gap ($) | 1,629 | 83.13¢ per $1 |
| Gini / Inequality Index | 1,629 | 0.52 |
Earnings by Sex in Sea Bright borough
Average Earnings in Sea Bright borough are $87,407, $91,419 for men and $76,000 for women, a difference of 16.9%.
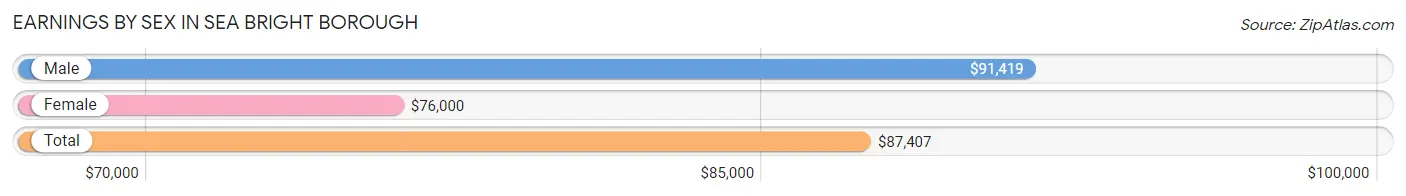
| Sex | Number | Average Earnings |
| Male | 568 (54.5%) | $91,419 |
| Female | 474 (45.5%) | $76,000 |
| Total | 1,042 (100.0%) | $87,407 |
Earnings by Sex by Income Bracket in Sea Bright borough
The most common earnings brackets in Sea Bright borough are $100,000+ for men (236 | 41.5%) and $100,000+ for women (145 | 30.6%).
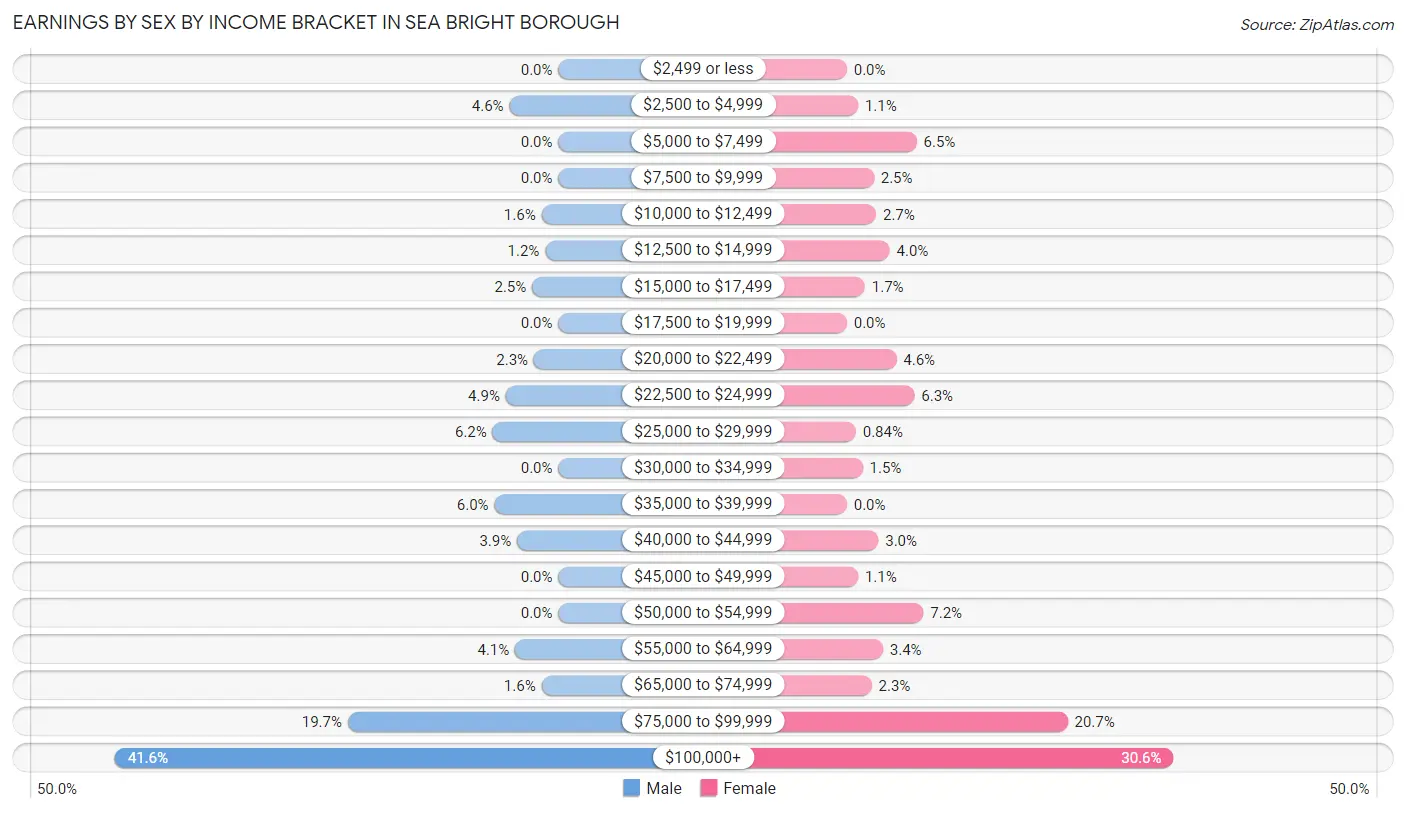
| Income | Male | Female |
| $2,499 or less | 0 (0.0%) | 0 (0.0%) |
| $2,500 to $4,999 | 26 (4.6%) | 5 (1.1%) |
| $5,000 to $7,499 | 0 (0.0%) | 31 (6.5%) |
| $7,500 to $9,999 | 0 (0.0%) | 12 (2.5%) |
| $10,000 to $12,499 | 9 (1.6%) | 13 (2.7%) |
| $12,500 to $14,999 | 7 (1.2%) | 19 (4.0%) |
| $15,000 to $17,499 | 14 (2.5%) | 8 (1.7%) |
| $17,500 to $19,999 | 0 (0.0%) | 0 (0.0%) |
| $20,000 to $22,499 | 13 (2.3%) | 22 (4.6%) |
| $22,500 to $24,999 | 28 (4.9%) | 30 (6.3%) |
| $25,000 to $29,999 | 35 (6.2%) | 4 (0.8%) |
| $30,000 to $34,999 | 0 (0.0%) | 7 (1.5%) |
| $35,000 to $39,999 | 34 (6.0%) | 0 (0.0%) |
| $40,000 to $44,999 | 22 (3.9%) | 14 (2.9%) |
| $45,000 to $49,999 | 0 (0.0%) | 5 (1.1%) |
| $50,000 to $54,999 | 0 (0.0%) | 34 (7.2%) |
| $55,000 to $64,999 | 23 (4.1%) | 16 (3.4%) |
| $65,000 to $74,999 | 9 (1.6%) | 11 (2.3%) |
| $75,000 to $99,999 | 112 (19.7%) | 98 (20.7%) |
| $100,000+ | 236 (41.5%) | 145 (30.6%) |
| Total | 568 (100.0%) | 474 (100.0%) |
Earnings by Sex by Educational Attainment in Sea Bright borough
Average earnings in Sea Bright borough are $92,128 for men and $86,296 for women, a difference of 6.3%. Men with an educational attainment of graduate degree enjoy the highest average annual earnings of $114,940, while those with high school diploma education earn the least with $59,375. Women with an educational attainment of graduate degree earn the most with the average annual earnings of $91,620, while those with high school diploma education have the smallest earnings of $20,577.
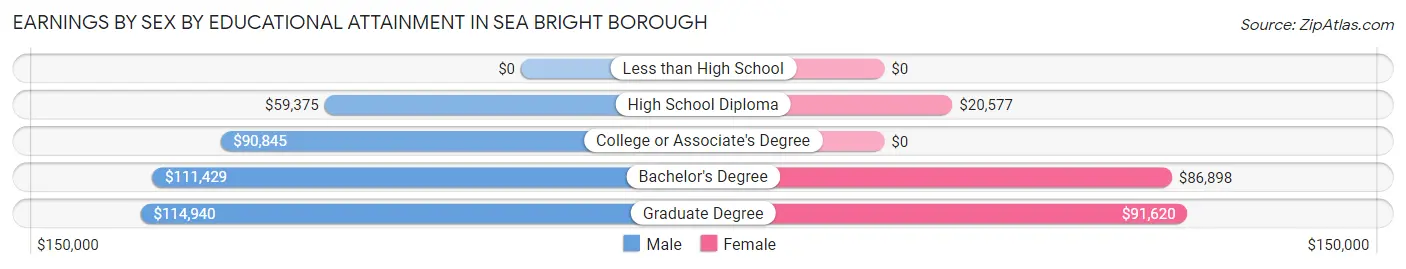
| Educational Attainment | Male Income | Female Income |
| Less than High School | - | - |
| High School Diploma | $59,375 | $20,577 |
| College or Associate's Degree | $90,845 | $0 |
| Bachelor's Degree | $111,429 | $86,898 |
| Graduate Degree | $114,940 | $91,620 |
| Total | $92,128 | $86,296 |
Family Income in Sea Bright borough
Family Income Brackets in Sea Bright borough
According to the Sea Bright borough family income data, there are 145 families falling into the $200,000+ income range, which is the most common income bracket and makes up 50.3% of all families.
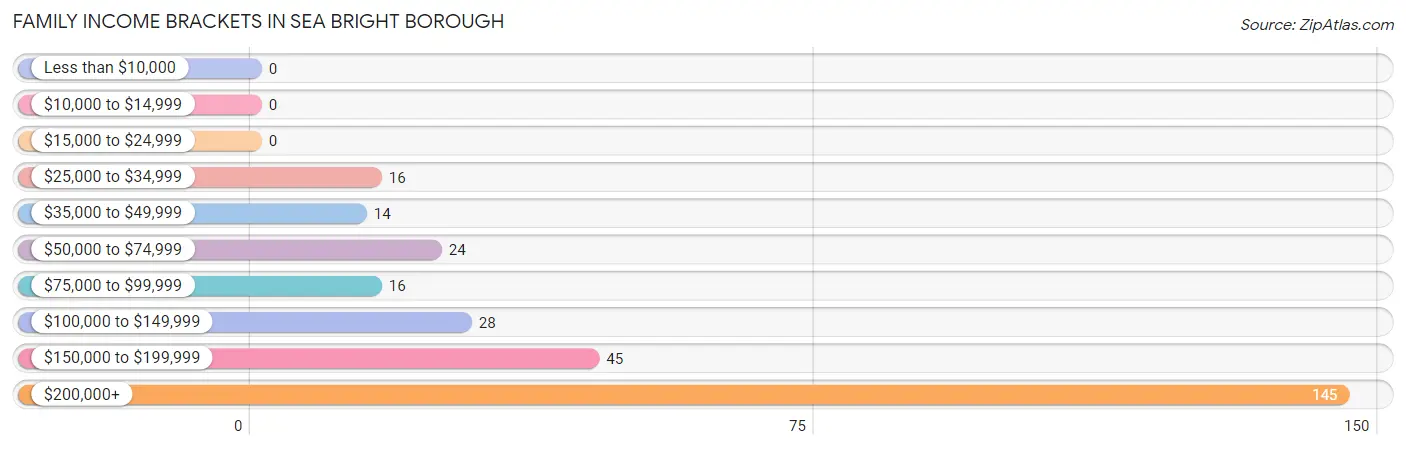
| Income Bracket | # Families | % Families |
| Less than $10,000 | 0 | 0.0% |
| $10,000 to $14,999 | 0 | 0.0% |
| $15,000 to $24,999 | 0 | 0.0% |
| $25,000 to $34,999 | 16 | 5.6% |
| $35,000 to $49,999 | 14 | 4.9% |
| $50,000 to $74,999 | 24 | 8.3% |
| $75,000 to $99,999 | 16 | 5.6% |
| $100,000 to $149,999 | 28 | 9.7% |
| $150,000 to $199,999 | 45 | 15.6% |
| $200,000+ | 145 | 50.3% |
Family Income by Famaliy Size in Sea Bright borough
3-person families (40 | 13.9%) account for the highest median family income in Sea Bright borough with $208,333 per family, while 2-person families (179 | 62.2%) have the highest median income of $77,054 per family member.
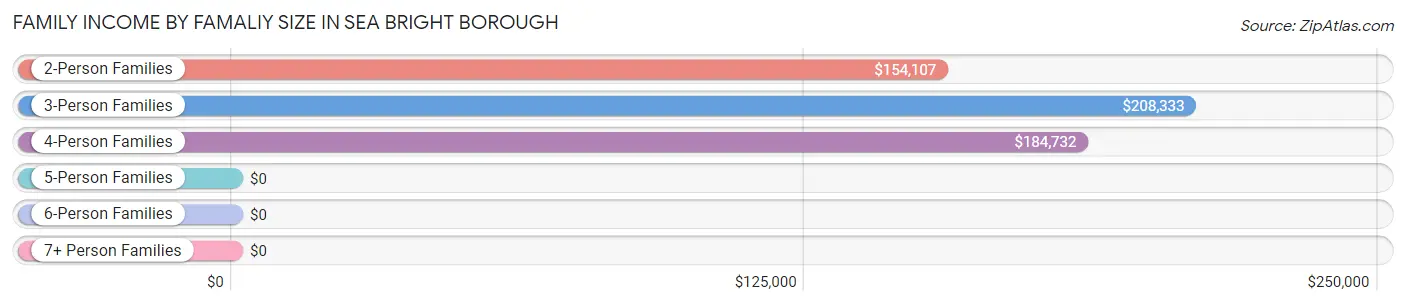
| Income Bracket | # Families | Median Income |
| 2-Person Families | 179 (62.2%) | $154,107 |
| 3-Person Families | 40 (13.9%) | $208,333 |
| 4-Person Families | 49 (17.0%) | $184,732 |
| 5-Person Families | 20 (6.9%) | $0 |
| 6-Person Families | 0 (0.0%) | $0 |
| 7+ Person Families | 0 (0.0%) | $0 |
| Total | 288 (100.0%) | $203,000 |
Family Income by Number of Earners in Sea Bright borough
The median family income in Sea Bright borough is $203,000, with families comprising 2 earners (110) having the highest median family income of $250,001, while families with 1 earner (107) have the lowest median family income of $125,179, accounting for 38.2% and 37.1% of families, respectively.
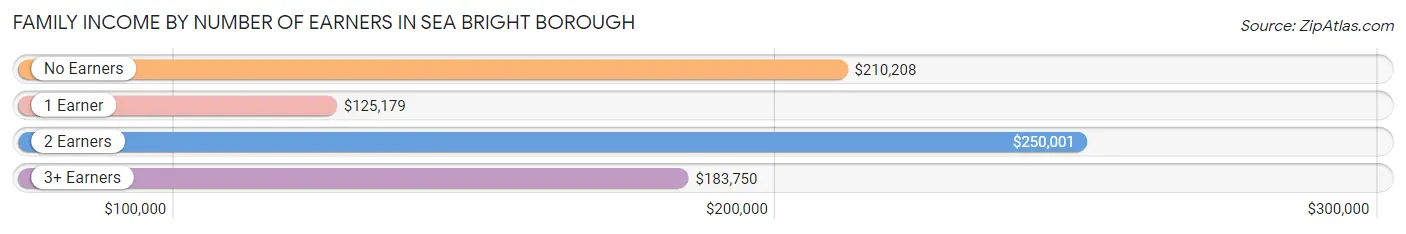
| Number of Earners | # Families | Median Income |
| No Earners | 47 (16.3%) | $210,208 |
| 1 Earner | 107 (37.1%) | $125,179 |
| 2 Earners | 110 (38.2%) | $250,001 |
| 3+ Earners | 24 (8.3%) | $183,750 |
| Total | 288 (100.0%) | $203,000 |
Household Income in Sea Bright borough
Household Income Brackets in Sea Bright borough
With 233 households falling in the category, the $200,000+ income range is the most frequent in Sea Bright borough, accounting for 26.0% of all households. In contrast, only 7 households (0.8%) fall into the $10,000 to $14,999 income bracket, making it the least populous group.
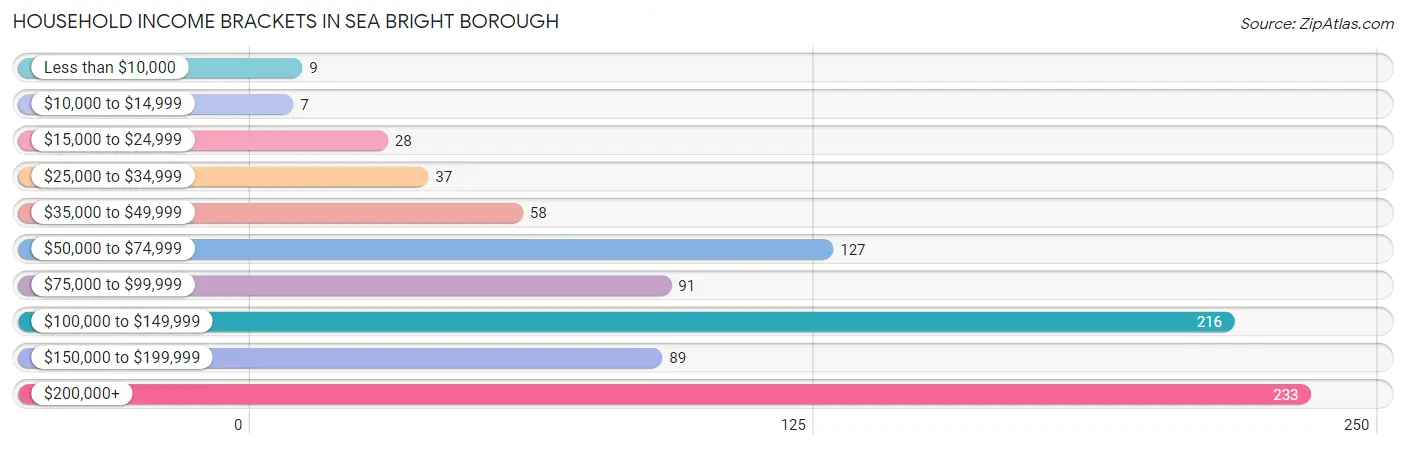
| Income Bracket | # Households | % Households |
| Less than $10,000 | 9 | 1.0% |
| $10,000 to $14,999 | 7 | 0.8% |
| $15,000 to $24,999 | 28 | 3.1% |
| $25,000 to $34,999 | 37 | 4.1% |
| $35,000 to $49,999 | 58 | 6.5% |
| $50,000 to $74,999 | 127 | 14.2% |
| $75,000 to $99,999 | 91 | 10.2% |
| $100,000 to $149,999 | 216 | 24.1% |
| $150,000 to $199,999 | 89 | 9.9% |
| $200,000+ | 233 | 26.0% |
Household Income by Householder Age in Sea Bright borough
The median household income in Sea Bright borough is $109,402, with the highest median household income of $122,917 found in the 45 to 64 years age bracket for the primary householder. A total of 372 households (41.6%) fall into this category. Meanwhile, the 15 to 24 years age bracket for the primary householder has the lowest median household income of $0, with 55 households (6.1%) in this group.
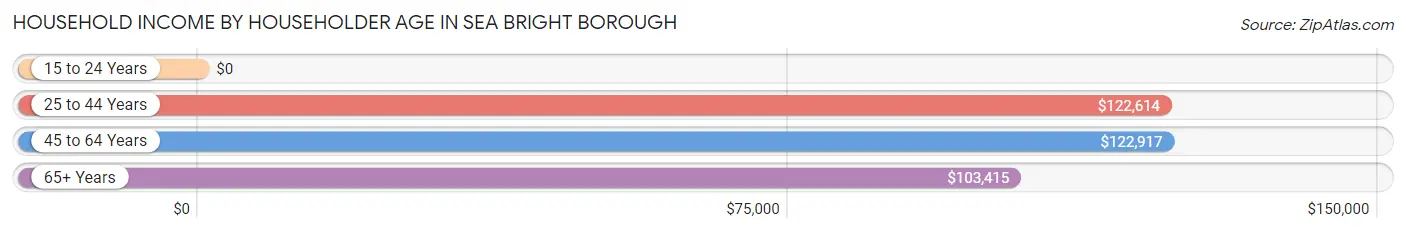
| Income Bracket | # Households | Median Income |
| 15 to 24 Years | 55 (6.1%) | $0 |
| 25 to 44 Years | 203 (22.7%) | $122,614 |
| 45 to 64 Years | 372 (41.6%) | $122,917 |
| 65+ Years | 265 (29.6%) | $103,415 |
| Total | 895 (100.0%) | $109,402 |
Poverty in Sea Bright borough
Income Below Poverty by Sex and Age in Sea Bright borough
With 7.3% poverty level for males and 8.4% for females among the residents of Sea Bright borough, 75 year old and over males and 55 to 64 year old females are the most vulnerable to poverty, with 56 males (50.9%) and 41 females (23.4%) in their respective age groups living below the poverty level.
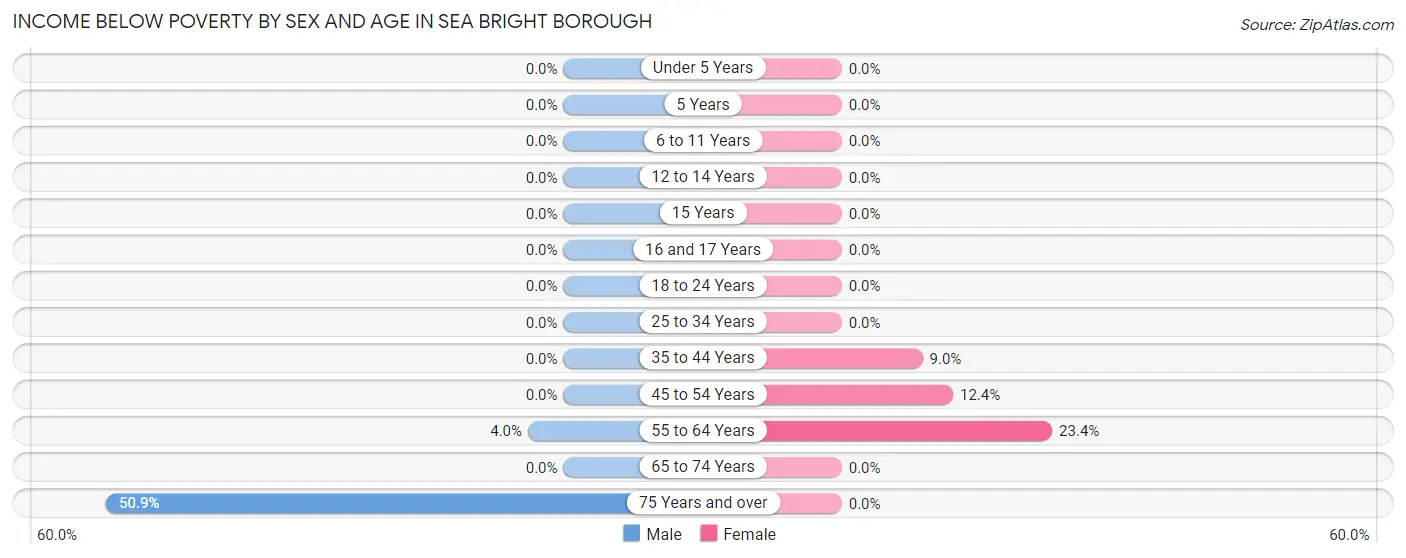
| Age Bracket | Male | Female |
| Under 5 Years | 0 (0.0%) | 0 (0.0%) |
| 5 Years | 0 (0.0%) | 0 (0.0%) |
| 6 to 11 Years | 0 (0.0%) | 0 (0.0%) |
| 12 to 14 Years | 0 (0.0%) | 0 (0.0%) |
| 15 Years | 0 (0.0%) | 0 (0.0%) |
| 16 and 17 Years | 0 (0.0%) | 0 (0.0%) |
| 18 to 24 Years | 0 (0.0%) | 0 (0.0%) |
| 25 to 34 Years | 0 (0.0%) | 0 (0.0%) |
| 35 to 44 Years | 0 (0.0%) | 9 (9.0%) |
| 45 to 54 Years | 0 (0.0%) | 14 (12.4%) |
| 55 to 64 Years | 7 (4.0%) | 41 (23.4%) |
| 65 to 74 Years | 0 (0.0%) | 0 (0.0%) |
| 75 Years and over | 56 (50.9%) | 0 (0.0%) |
| Total | 63 (7.3%) | 64 (8.4%) |
Income Above Poverty by Sex and Age in Sea Bright borough
According to the poverty statistics in Sea Bright borough, males aged under 5 years and females aged under 5 years are the age groups that are most secure financially, with 100.0% of males and 100.0% of females in these age groups living above the poverty line.
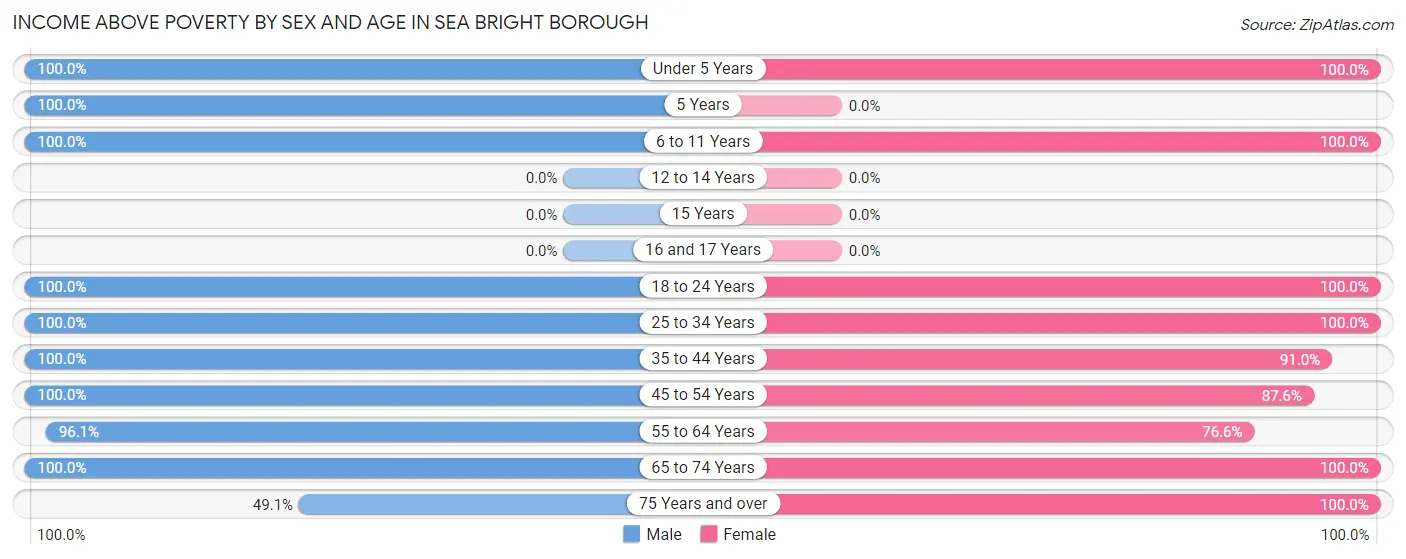
| Age Bracket | Male | Female |
| Under 5 Years | 6 (100.0%) | 26 (100.0%) |
| 5 Years | 20 (100.0%) | 0 (0.0%) |
| 6 to 11 Years | 39 (100.0%) | 65 (100.0%) |
| 12 to 14 Years | 0 (0.0%) | 0 (0.0%) |
| 15 Years | 0 (0.0%) | 0 (0.0%) |
| 16 and 17 Years | 0 (0.0%) | 0 (0.0%) |
| 18 to 24 Years | 48 (100.0%) | 78 (100.0%) |
| 25 to 34 Years | 112 (100.0%) | 57 (100.0%) |
| 35 to 44 Years | 80 (100.0%) | 91 (91.0%) |
| 45 to 54 Years | 160 (100.0%) | 99 (87.6%) |
| 55 to 64 Years | 170 (96.1%) | 134 (76.6%) |
| 65 to 74 Years | 113 (100.0%) | 108 (100.0%) |
| 75 Years and over | 54 (49.1%) | 42 (100.0%) |
| Total | 802 (92.7%) | 700 (91.6%) |
Income Below Poverty Among Married-Couple Families in Sea Bright borough
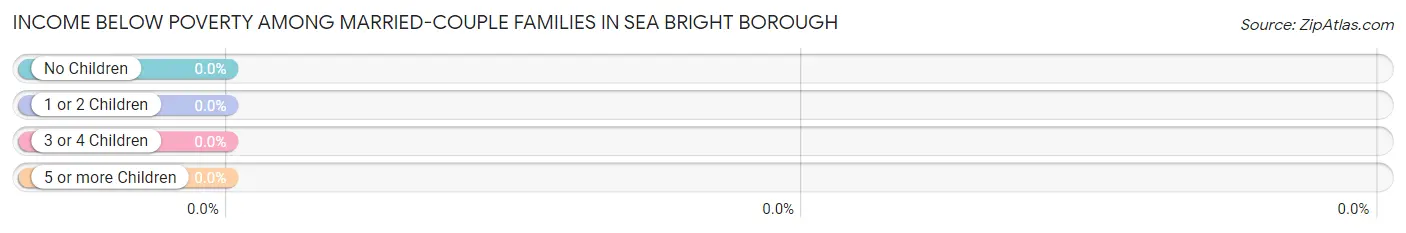
| Children | Above Poverty | Below Poverty |
| No Children | 192 (100.0%) | 0 (0.0%) |
| 1 or 2 Children | 54 (100.0%) | 0 (0.0%) |
| 3 or 4 Children | 20 (100.0%) | 0 (0.0%) |
| 5 or more Children | 0 (0.0%) | 0 (0.0%) |
| Total | 266 (100.0%) | 0 (0.0%) |
Income Below Poverty Among Single-Parent Households in Sea Bright borough
| Children | Single Father | Single Mother |
| No Children | 0 (0.0%) | 0 (0.0%) |
| 1 or 2 Children | 0 (0.0%) | 0 (0.0%) |
| 3 or 4 Children | 0 (0.0%) | 0 (0.0%) |
| 5 or more Children | 0 (0.0%) | 0 (0.0%) |
| Total | 0 (0.0%) | 0 (0.0%) |
Income Below Poverty Among Married-Couple vs Single-Parent Households in Sea Bright borough
| Children | Married-Couple Families | Single-Parent Households |
| No Children | 0 (0.0%) | 0 (0.0%) |
| 1 or 2 Children | 0 (0.0%) | 0 (0.0%) |
| 3 or 4 Children | 0 (0.0%) | 0 (0.0%) |
| 5 or more Children | 0 (0.0%) | 0 (0.0%) |
| Total | 0 (0.0%) | 0 (0.0%) |
Employment Characteristics in Sea Bright borough
Employment by Class of Employer in Sea Bright borough
Among the 859 employed individuals in Sea Bright borough, private company employees (578 | 67.3%), self-employed (incorporated) (88 | 10.2%), and local government employees (69 | 8.0%) make up the most common classes of employment.
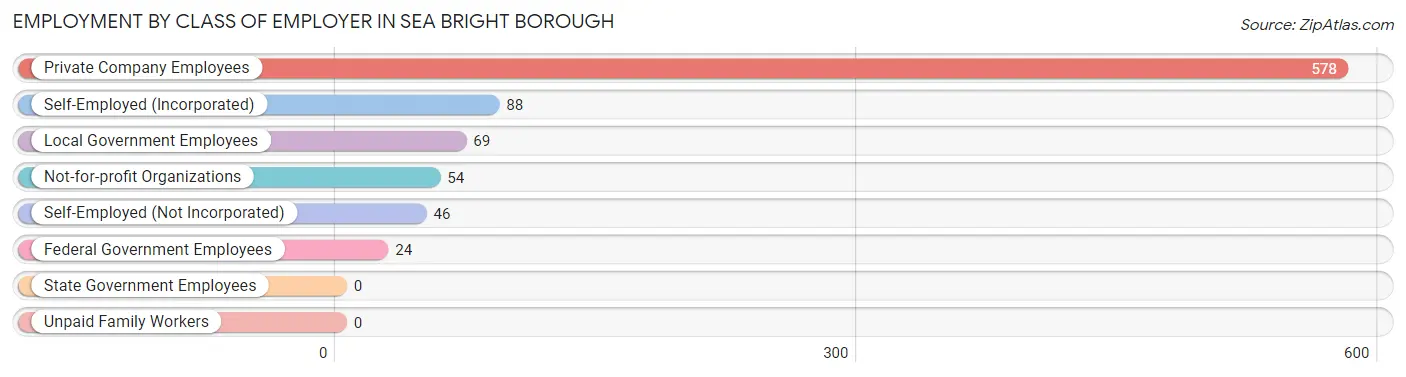
| Employer Class | # Employees | % Employees |
| Private Company Employees | 578 | 67.3% |
| Self-Employed (Incorporated) | 88 | 10.2% |
| Self-Employed (Not Incorporated) | 46 | 5.4% |
| Not-for-profit Organizations | 54 | 6.3% |
| Local Government Employees | 69 | 8.0% |
| State Government Employees | 0 | 0.0% |
| Federal Government Employees | 24 | 2.8% |
| Unpaid Family Workers | 0 | 0.0% |
| Total | 859 | 100.0% |
Employment Status by Age in Sea Bright borough
According to the labor force statistics for Sea Bright borough, out of the total population over 16 years of age (1,473), 67.1% or 988 individuals are in the labor force, with 5.1% or 50 of them unemployed. The age group with the highest labor force participation rate is 16 to 19 years, with 100.0% or 22 individuals in the labor force. Within the labor force, the 25 to 29 years age range has the highest percentage of unemployed individuals, with 21.4% or 24 of them being unemployed.
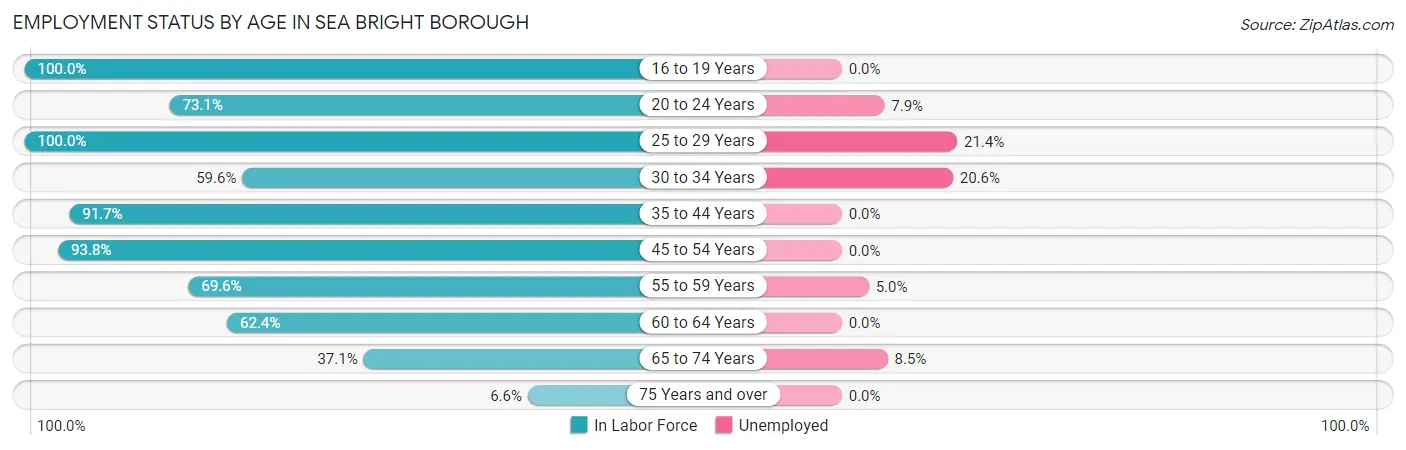
| Age Bracket | In Labor Force | Unemployed |
| 16 to 19 Years | 22 (100.0%) | 0 (0.0%) |
| 20 to 24 Years | 76 (73.1%) | 6 (7.9%) |
| 25 to 29 Years | 112 (100.0%) | 24 (21.4%) |
| 30 to 34 Years | 34 (59.6%) | 7 (20.6%) |
| 35 to 44 Years | 165 (91.7%) | 0 (0.0%) |
| 45 to 54 Years | 256 (93.8%) | 0 (0.0%) |
| 55 to 59 Years | 119 (69.6%) | 6 (5.0%) |
| 60 to 64 Years | 113 (62.4%) | 0 (0.0%) |
| 65 to 74 Years | 82 (37.1%) | 7 (8.5%) |
| 75 Years and over | 10 (6.6%) | 0 (0.0%) |
| Total | 988 (67.1%) | 50 (5.1%) |
Employment Status by Educational Attainment in Sea Bright borough
According to labor force statistics for Sea Bright borough, 82.0% of individuals (799) out of the total population between 25 and 64 years of age (974) are in the labor force, with 4.6% or 37 of them being unemployed. The group with the highest labor force participation rate are those with the educational attainment of high school diploma, with 100.0% or 67 individuals in the labor force. Within the labor force, individuals with bachelor's degree or higher education have the highest percentage of unemployment, with 5.6% or 30 of them being unemployed.
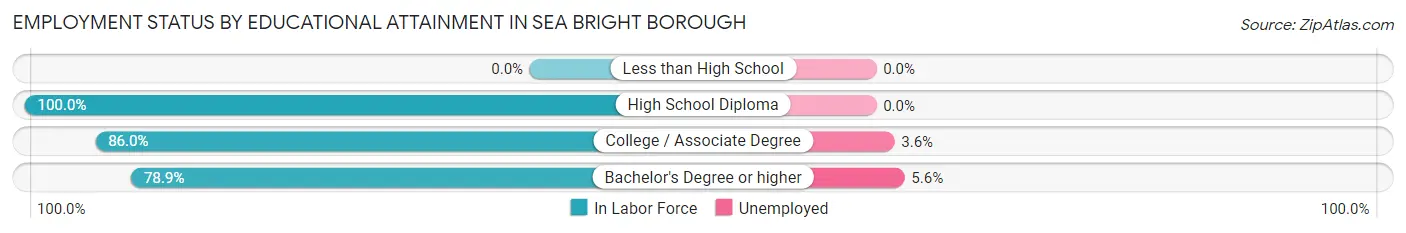
| Educational Attainment | In Labor Force | Unemployed |
| Less than High School | 0 (0.0%) | 0 (0.0%) |
| High School Diploma | 67 (100.0%) | 0 (0.0%) |
| College / Associate Degree | 197 (86.0%) | 8 (3.6%) |
| Bachelor's Degree or higher | 535 (78.9%) | 38 (5.6%) |
| Total | 799 (82.0%) | 45 (4.6%) |
Employment Occupations by Sex in Sea Bright borough
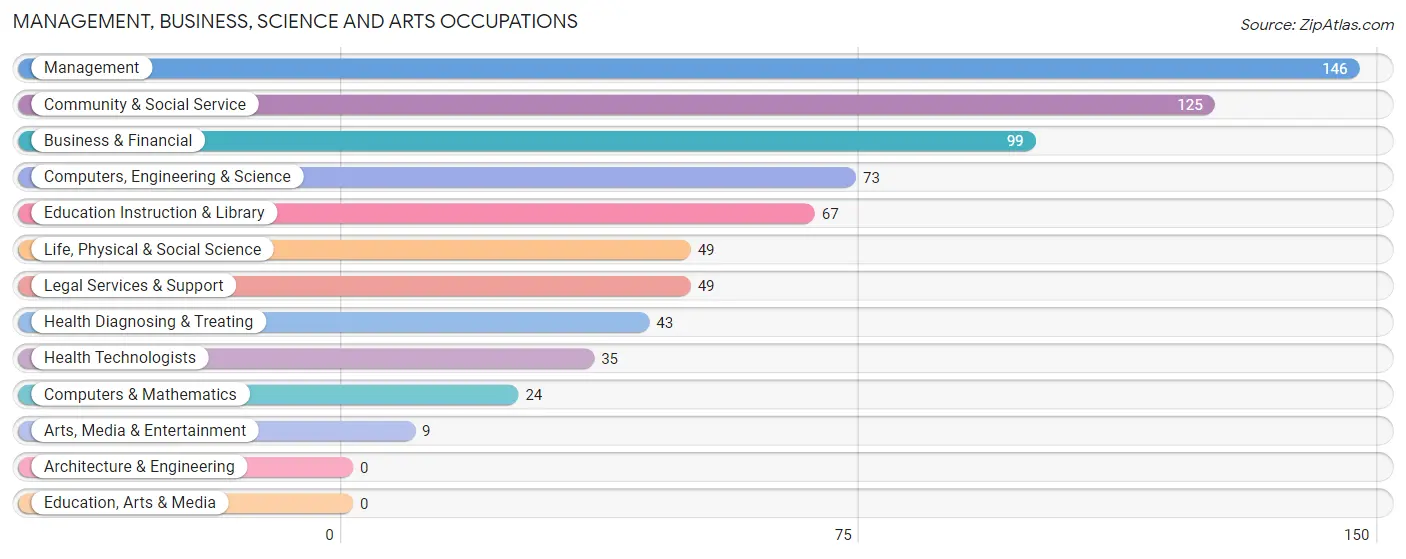
Management, Business, Science and Arts Occupations
The most common Management, Business, Science and Arts occupations in Sea Bright borough are Management (146 | 15.5%), Community & Social Service (125 | 13.3%), Business & Financial (99 | 10.5%), Computers, Engineering & Science (73 | 7.8%), and Education Instruction & Library (67 | 7.1%).
Management, Business, Science and Arts Occupations by Sex
Within the Management, Business, Science and Arts occupations in Sea Bright borough, the most male-oriented occupations are Arts, Media & Entertainment (100.0%), Business & Financial (55.6%), and Management (53.4%), while the most female-oriented occupations are Life, Physical & Social Science (100.0%), Education Instruction & Library (88.1%), and Computers, Engineering & Science (83.6%).
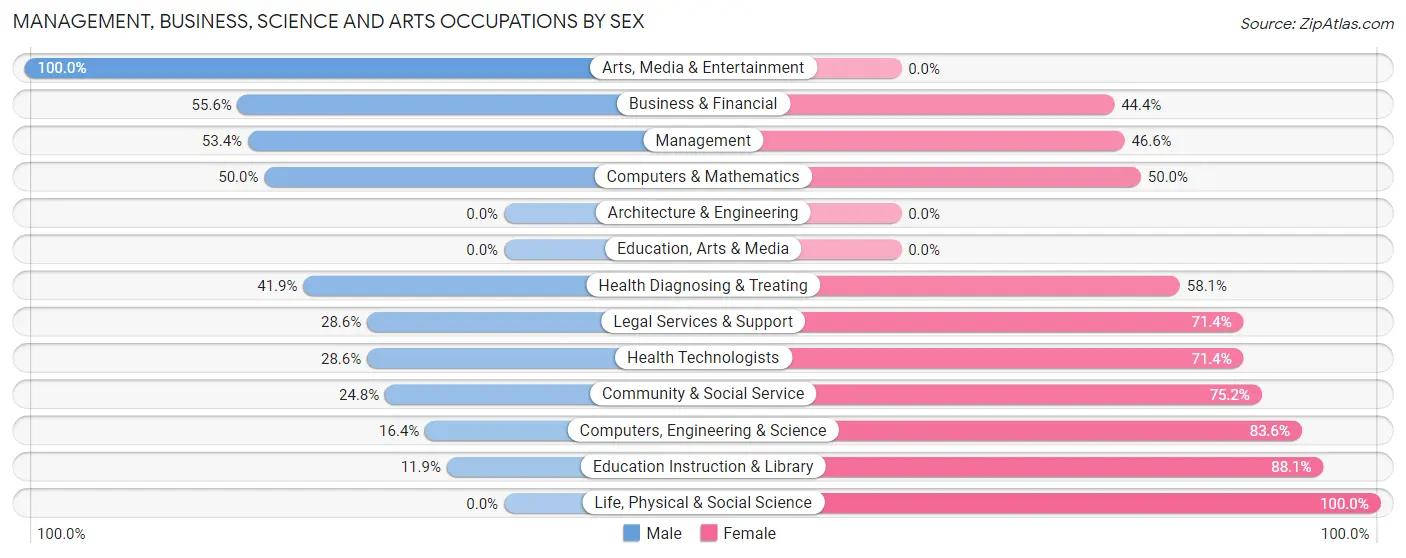
| Occupation | Male | Female |
| Management | 78 (53.4%) | 68 (46.6%) |
| Business & Financial | 55 (55.6%) | 44 (44.4%) |
| Computers, Engineering & Science | 12 (16.4%) | 61 (83.6%) |
| Computers & Mathematics | 12 (50.0%) | 12 (50.0%) |
| Architecture & Engineering | 0 (0.0%) | 0 (0.0%) |
| Life, Physical & Social Science | 0 (0.0%) | 49 (100.0%) |
| Community & Social Service | 31 (24.8%) | 94 (75.2%) |
| Education, Arts & Media | 0 (0.0%) | 0 (0.0%) |
| Legal Services & Support | 14 (28.6%) | 35 (71.4%) |
| Education Instruction & Library | 8 (11.9%) | 59 (88.1%) |
| Arts, Media & Entertainment | 9 (100.0%) | 0 (0.0%) |
| Health Diagnosing & Treating | 18 (41.9%) | 25 (58.1%) |
| Health Technologists | 10 (28.6%) | 25 (71.4%) |
| Total (Category) | 194 (39.9%) | 292 (60.1%) |
| Total (Overall) | 476 (50.7%) | 463 (49.3%) |
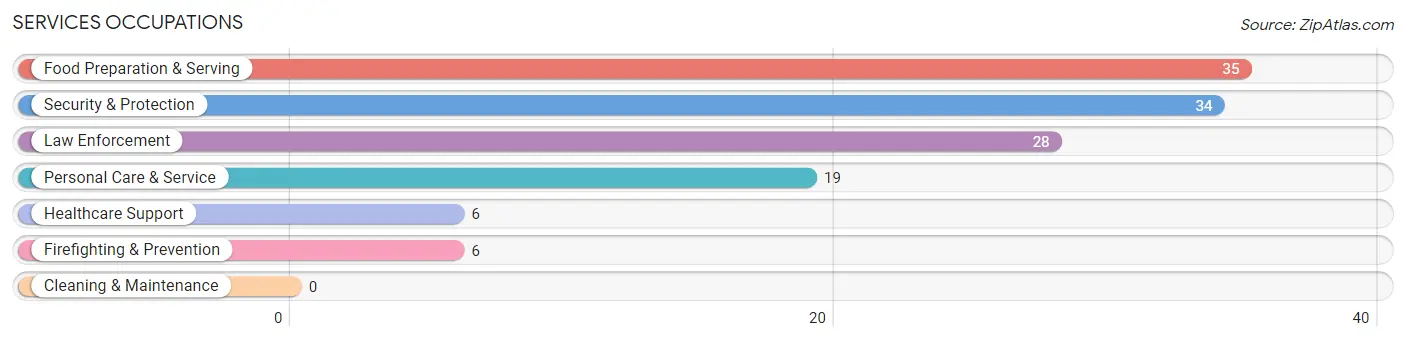
Services Occupations
The most common Services occupations in Sea Bright borough are Food Preparation & Serving (35 | 3.7%), Security & Protection (34 | 3.6%), Law Enforcement (28 | 3.0%), Personal Care & Service (19 | 2.0%), and Healthcare Support (6 | 0.6%).
Services Occupations by Sex
Within the Services occupations in Sea Bright borough, the most male-oriented occupations are Security & Protection (100.0%), Firefighting & Prevention (100.0%), and Law Enforcement (100.0%), while the most female-oriented occupations are Healthcare Support (100.0%), Food Preparation & Serving (100.0%), and Personal Care & Service (100.0%).
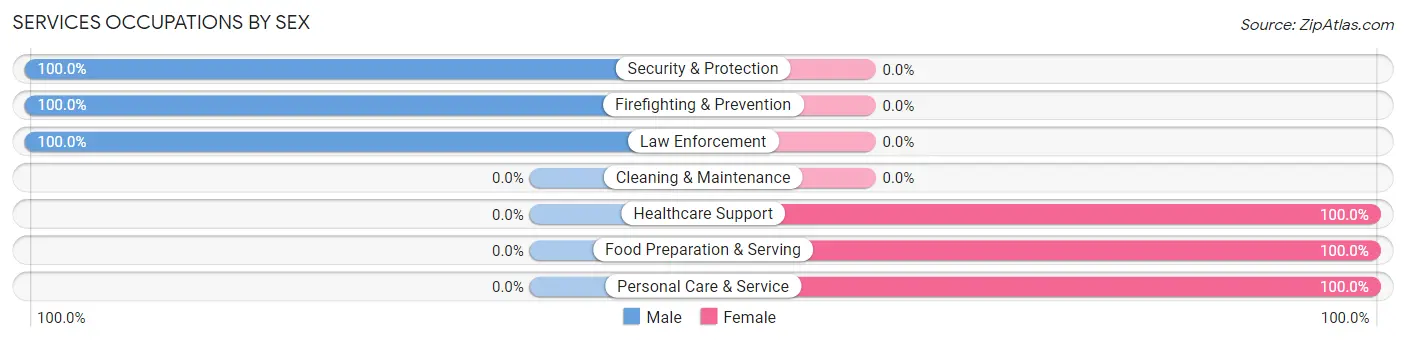
| Occupation | Male | Female |
| Healthcare Support | 0 (0.0%) | 6 (100.0%) |
| Security & Protection | 34 (100.0%) | 0 (0.0%) |
| Firefighting & Prevention | 6 (100.0%) | 0 (0.0%) |
| Law Enforcement | 28 (100.0%) | 0 (0.0%) |
| Food Preparation & Serving | 0 (0.0%) | 35 (100.0%) |
| Cleaning & Maintenance | 0 (0.0%) | 0 (0.0%) |
| Personal Care & Service | 0 (0.0%) | 19 (100.0%) |
| Total (Category) | 34 (36.2%) | 60 (63.8%) |
| Total (Overall) | 476 (50.7%) | 463 (49.3%) |
Sales and Office Occupations
The most common Sales and Office occupations in Sea Bright borough are Sales & Related (223 | 23.7%), and Office & Administration (41 | 4.4%).
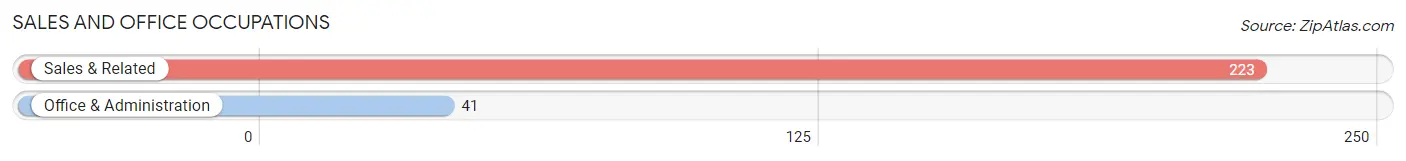
Sales and Office Occupations by Sex
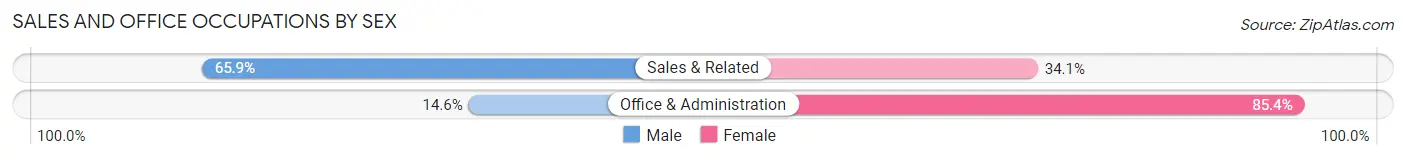
| Occupation | Male | Female |
| Sales & Related | 147 (65.9%) | 76 (34.1%) |
| Office & Administration | 6 (14.6%) | 35 (85.4%) |
| Total (Category) | 153 (58.0%) | 111 (42.0%) |
| Total (Overall) | 476 (50.7%) | 463 (49.3%) |
Natural Resources, Construction and Maintenance Occupations
The most common Natural Resources, Construction and Maintenance occupations in Sea Bright borough are Farming, Fishing & Forestry (34 | 3.6%), Construction & Extraction (31 | 3.3%), and Installation, Maintenance & Repair (20 | 2.1%).
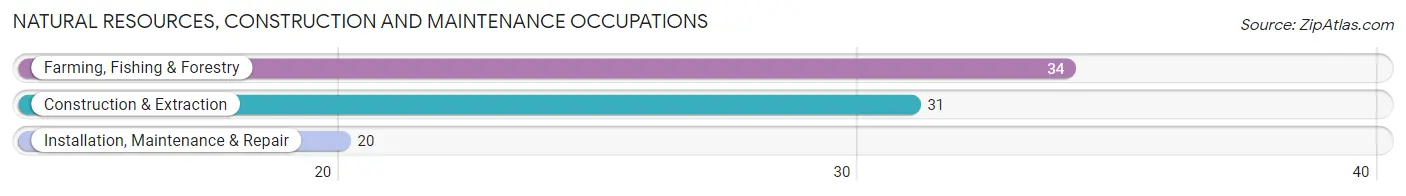
Natural Resources, Construction and Maintenance Occupations by Sex
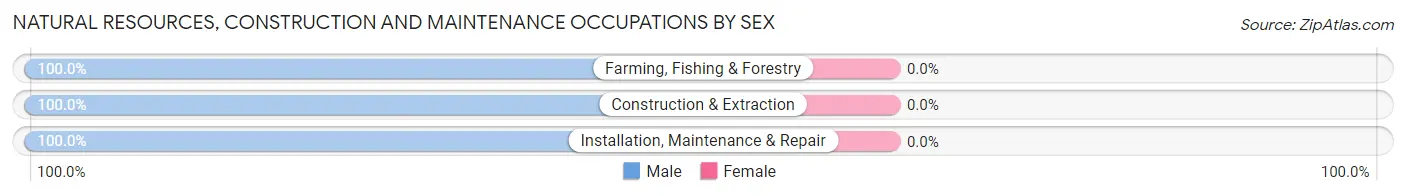
| Occupation | Male | Female |
| Farming, Fishing & Forestry | 34 (100.0%) | 0 (0.0%) |
| Construction & Extraction | 31 (100.0%) | 0 (0.0%) |
| Installation, Maintenance & Repair | 20 (100.0%) | 0 (0.0%) |
| Total (Category) | 85 (100.0%) | 0 (0.0%) |
| Total (Overall) | 476 (50.7%) | 463 (49.3%) |
Production, Transportation and Moving Occupations
The most common Production, Transportation and Moving occupations in Sea Bright borough are , and Production (10 | 1.1%).
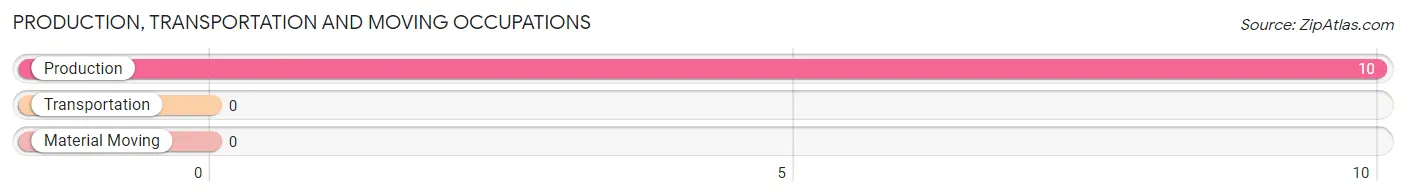
Production, Transportation and Moving Occupations by Sex
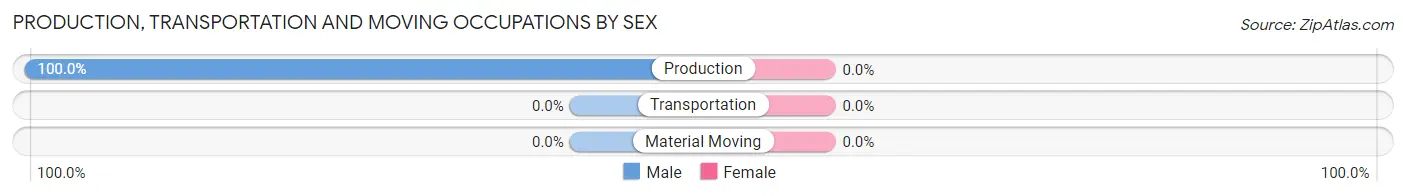
| Occupation | Male | Female |
| Production | 10 (100.0%) | 0 (0.0%) |
| Transportation | 0 (0.0%) | 0 (0.0%) |
| Material Moving | 0 (0.0%) | 0 (0.0%) |
| Total (Category) | 10 (100.0%) | 0 (0.0%) |
| Total (Overall) | 476 (50.7%) | 463 (49.3%) |
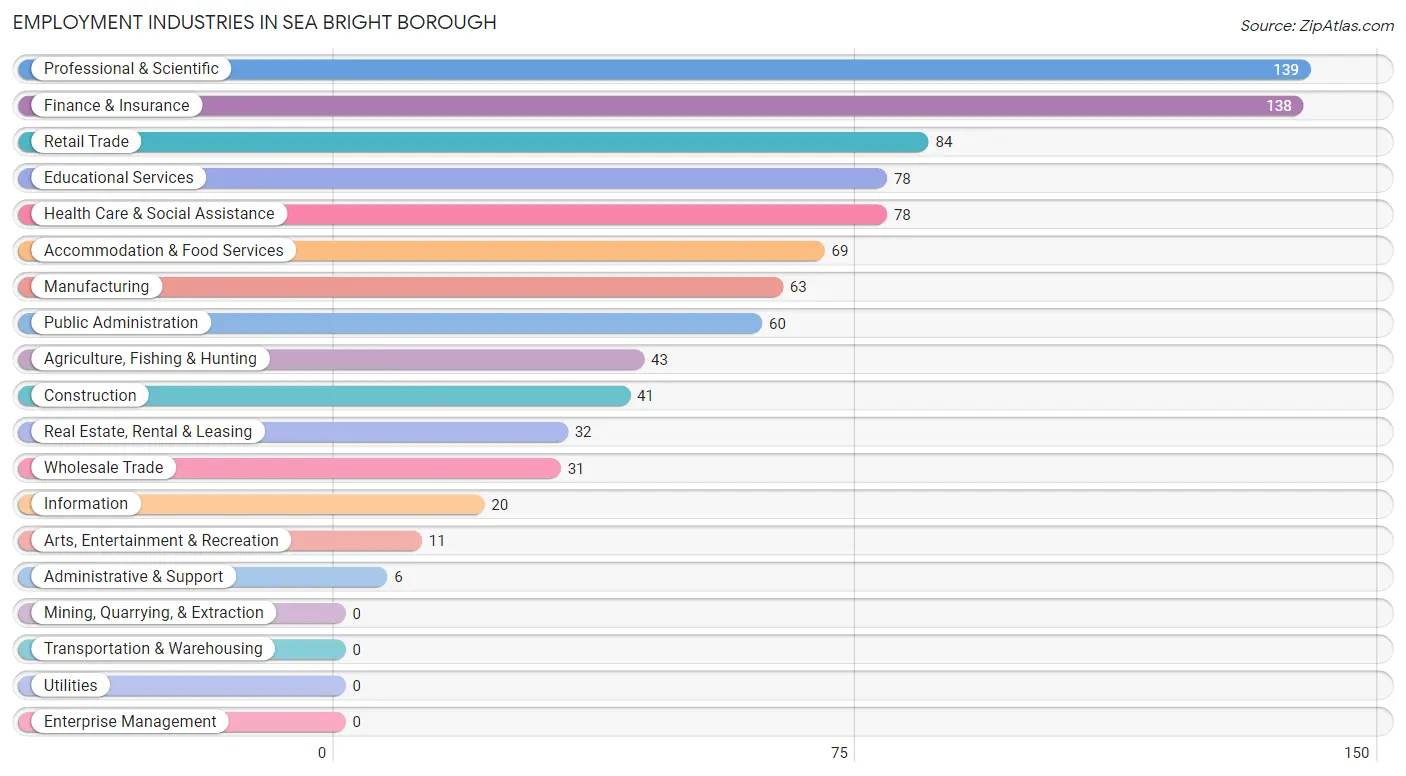
Employment Industries by Sex in Sea Bright borough
Employment Industries in Sea Bright borough
The major employment industries in Sea Bright borough include Professional & Scientific (139 | 14.8%), Finance & Insurance (138 | 14.7%), Retail Trade (84 | 8.9%), Educational Services (78 | 8.3%), and Health Care & Social Assistance (78 | 8.3%).
Employment Industries by Sex in Sea Bright borough
The Sea Bright borough industries that see more men than women are Agriculture, Fishing & Hunting (100.0%), Information (100.0%), and Administrative & Support (100.0%), whereas the industries that tend to have a higher number of women are Educational Services (78.2%), Retail Trade (76.2%), and Accommodation & Food Services (69.6%).
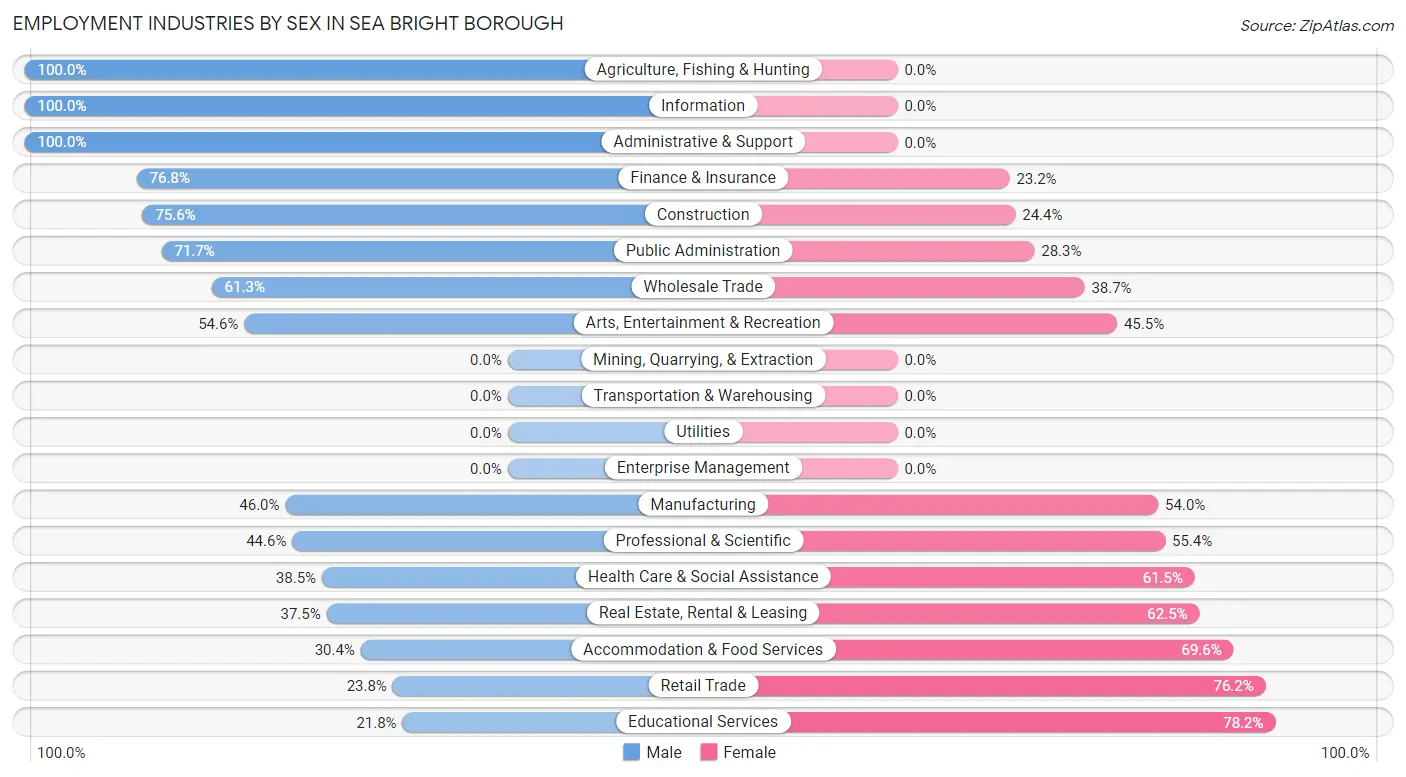
| Industry | Male | Female |
| Agriculture, Fishing & Hunting | 43 (100.0%) | 0 (0.0%) |
| Mining, Quarrying, & Extraction | 0 (0.0%) | 0 (0.0%) |
| Construction | 31 (75.6%) | 10 (24.4%) |
| Manufacturing | 29 (46.0%) | 34 (54.0%) |
| Wholesale Trade | 19 (61.3%) | 12 (38.7%) |
| Retail Trade | 20 (23.8%) | 64 (76.2%) |
| Transportation & Warehousing | 0 (0.0%) | 0 (0.0%) |
| Utilities | 0 (0.0%) | 0 (0.0%) |
| Information | 20 (100.0%) | 0 (0.0%) |
| Finance & Insurance | 106 (76.8%) | 32 (23.2%) |
| Real Estate, Rental & Leasing | 12 (37.5%) | 20 (62.5%) |
| Professional & Scientific | 62 (44.6%) | 77 (55.4%) |
| Enterprise Management | 0 (0.0%) | 0 (0.0%) |
| Administrative & Support | 6 (100.0%) | 0 (0.0%) |
| Educational Services | 17 (21.8%) | 61 (78.2%) |
| Health Care & Social Assistance | 30 (38.5%) | 48 (61.5%) |
| Arts, Entertainment & Recreation | 6 (54.5%) | 5 (45.5%) |
| Accommodation & Food Services | 21 (30.4%) | 48 (69.6%) |
| Public Administration | 43 (71.7%) | 17 (28.3%) |
| Total | 476 (50.7%) | 463 (49.3%) |
Education in Sea Bright borough
School Enrollment in Sea Bright borough
The most common levels of schooling among the 197 students in Sea Bright borough are elementary school (60 | 30.5%), college / undergraduate (51 | 25.9%), and kindergarten (38 | 19.3%).
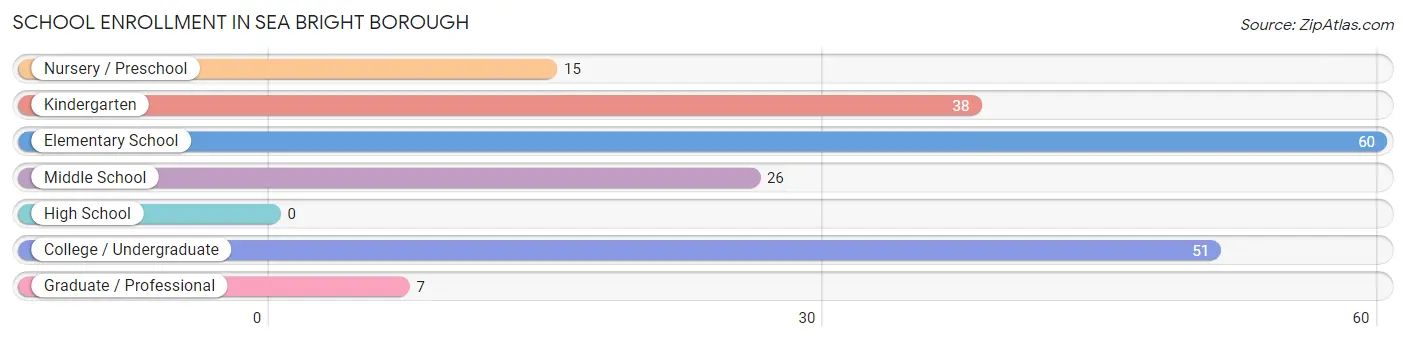
| School Level | # Students | % Students |
| Nursery / Preschool | 15 | 7.6% |
| Kindergarten | 38 | 19.3% |
| Elementary School | 60 | 30.5% |
| Middle School | 26 | 13.2% |
| High School | 0 | 0.0% |
| College / Undergraduate | 51 | 25.9% |
| Graduate / Professional | 7 | 3.5% |
| Total | 197 | 100.0% |
School Enrollment by Age by Funding Source in Sea Bright borough
Out of a total of 197 students who are enrolled in schools in Sea Bright borough, 51 (25.9%) attend a private institution, while the remaining 146 (74.1%) are enrolled in public schools. The age group of 3 to 4 year olds has the highest likelihood of being enrolled in private schools, with 15 (100.0% in the age bracket) enrolled. Conversely, the age group of 10 to 14 year olds has the lowest likelihood of being enrolled in a private school, with 35 (100.0% in the age bracket) attending a public institution.
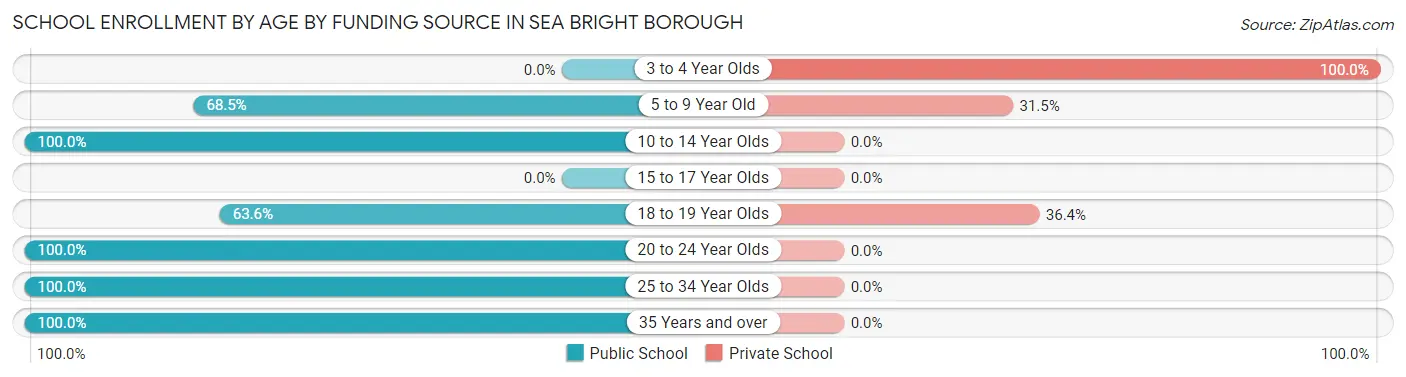
| Age Bracket | Public School | Private School |
| 3 to 4 Year Olds | 0 (0.0%) | 15 (100.0%) |
| 5 to 9 Year Old | 61 (68.5%) | 28 (31.5%) |
| 10 to 14 Year Olds | 35 (100.0%) | 0 (0.0%) |
| 15 to 17 Year Olds | 0 (0.0%) | 0 (0.0%) |
| 18 to 19 Year Olds | 14 (63.6%) | 8 (36.4%) |
| 20 to 24 Year Olds | 12 (100.0%) | 0 (0.0%) |
| 25 to 34 Year Olds | 14 (100.0%) | 0 (0.0%) |
| 35 Years and over | 10 (100.0%) | 0 (0.0%) |
| Total | 146 (74.1%) | 51 (25.9%) |
Educational Attainment by Field of Study in Sea Bright borough
Business (210 | 22.4%), education (135 | 14.4%), liberal arts & history (105 | 11.2%), communications (90 | 9.6%), and physical & health sciences (60 | 6.4%) are the most common fields of study among 937 individuals in Sea Bright borough who have obtained a bachelor's degree or higher.
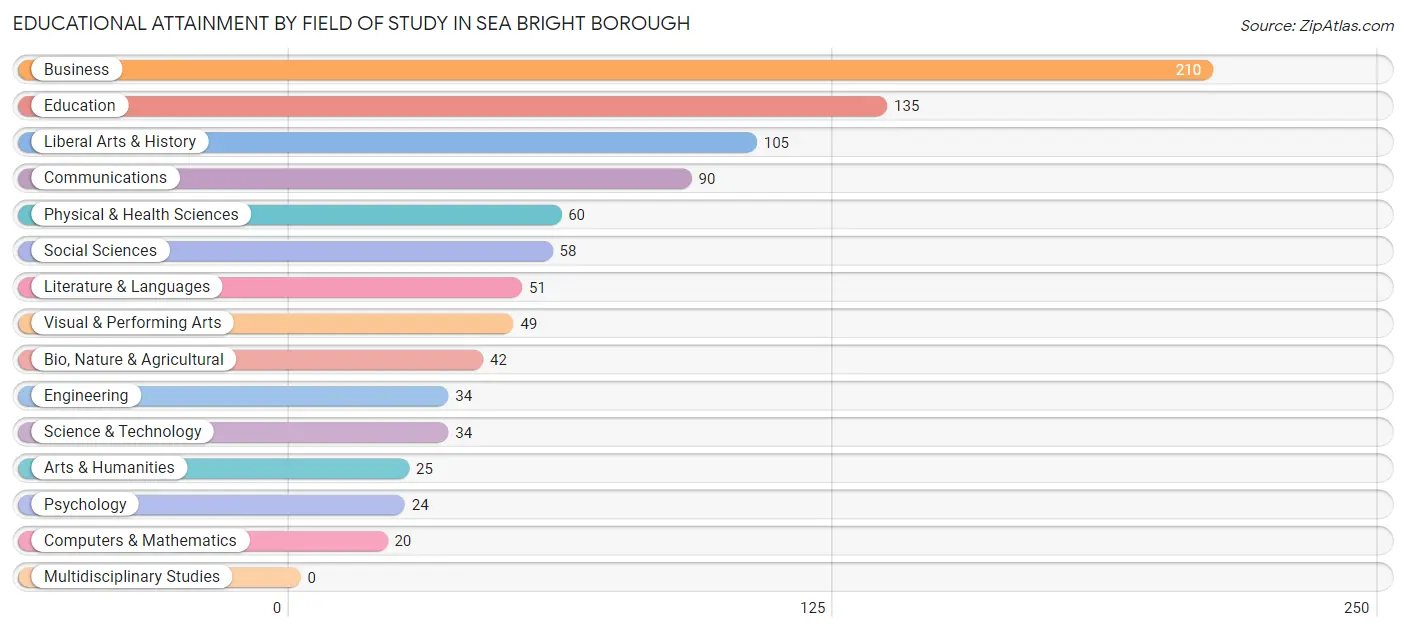
| Field of Study | # Graduates | % Graduates |
| Computers & Mathematics | 20 | 2.1% |
| Bio, Nature & Agricultural | 42 | 4.5% |
| Physical & Health Sciences | 60 | 6.4% |
| Psychology | 24 | 2.6% |
| Social Sciences | 58 | 6.2% |
| Engineering | 34 | 3.6% |
| Multidisciplinary Studies | 0 | 0.0% |
| Science & Technology | 34 | 3.6% |
| Business | 210 | 22.4% |
| Education | 135 | 14.4% |
| Literature & Languages | 51 | 5.4% |
| Liberal Arts & History | 105 | 11.2% |
| Visual & Performing Arts | 49 | 5.2% |
| Communications | 90 | 9.6% |
| Arts & Humanities | 25 | 2.7% |
| Total | 937 | 100.0% |
Transportation & Commute in Sea Bright borough
Vehicle Availability by Sex in Sea Bright borough
The most prevalent vehicle ownership categories in Sea Bright borough are males with 1 vehicle (165, accounting for 41.7%) and females with 1 vehicle (133, making up 35.6%).
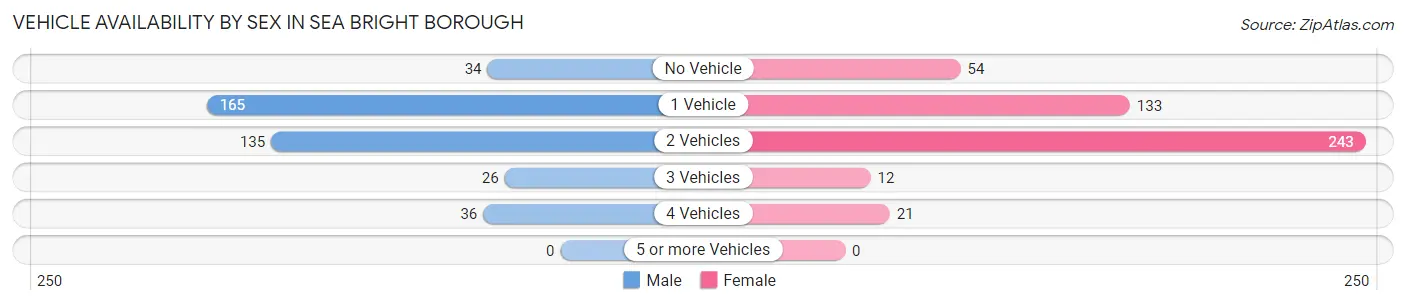
| Vehicles Available | Male | Female |
| No Vehicle | 34 (8.6%) | 54 (11.7%) |
| 1 Vehicle | 165 (41.7%) | 133 (28.7%) |
| 2 Vehicles | 135 (34.1%) | 243 (52.5%) |
| 3 Vehicles | 26 (6.6%) | 12 (2.6%) |
| 4 Vehicles | 36 (9.1%) | 21 (4.5%) |
| 5 or more Vehicles | 0 (0.0%) | 0 (0.0%) |
| Total | 396 (100.0%) | 463 (100.0%) |
Commute Time in Sea Bright borough
The most frequently occuring commute durations in Sea Bright borough are 20 to 24 minutes (104 commuters, 14.2%), 15 to 19 minutes (92 commuters, 12.6%), and 90 or more minutes (89 commuters, 12.2%).
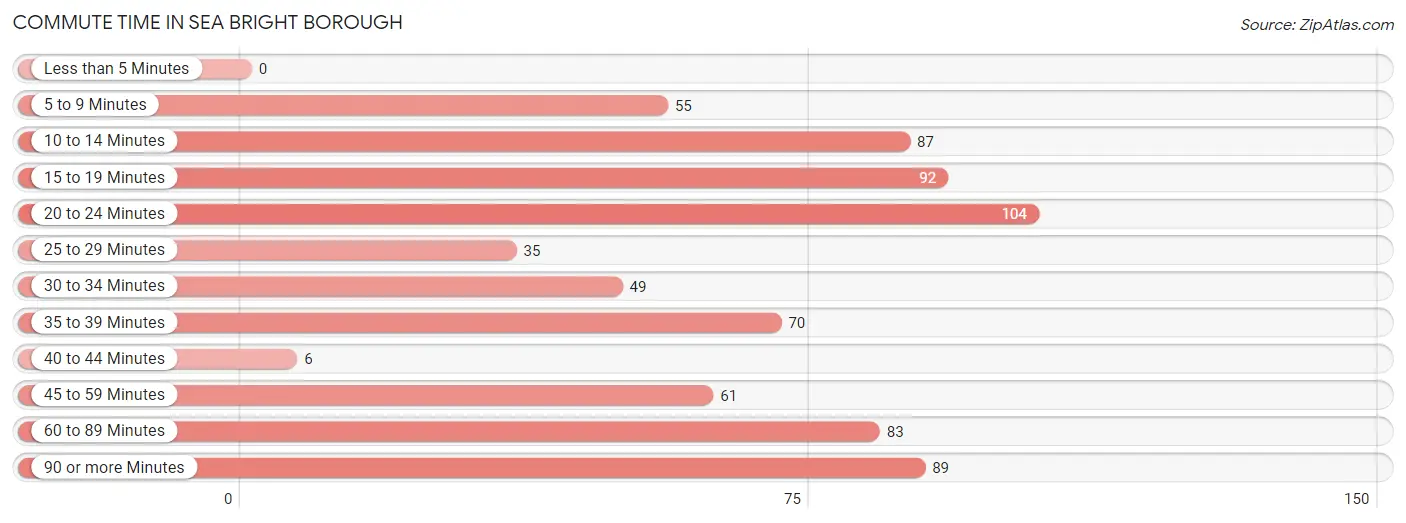
| Commute Time | # Commuters | % Commuters |
| Less than 5 Minutes | 0 | 0.0% |
| 5 to 9 Minutes | 55 | 7.5% |
| 10 to 14 Minutes | 87 | 11.9% |
| 15 to 19 Minutes | 92 | 12.6% |
| 20 to 24 Minutes | 104 | 14.2% |
| 25 to 29 Minutes | 35 | 4.8% |
| 30 to 34 Minutes | 49 | 6.7% |
| 35 to 39 Minutes | 70 | 9.6% |
| 40 to 44 Minutes | 6 | 0.8% |
| 45 to 59 Minutes | 61 | 8.3% |
| 60 to 89 Minutes | 83 | 11.4% |
| 90 or more Minutes | 89 | 12.2% |
Commute Time by Sex in Sea Bright borough
The most common commute times in Sea Bright borough are 15 to 19 minutes (62 commuters, 17.8%) for males and 20 to 24 minutes (66 commuters, 17.2%) for females.
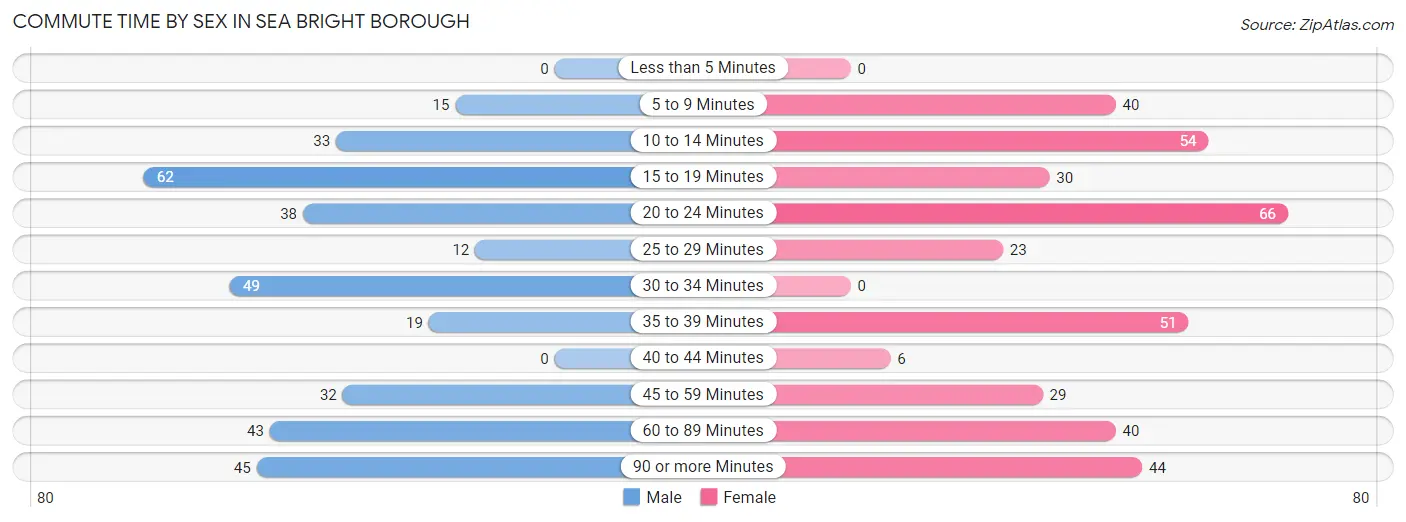
| Commute Time | Male | Female |
| Less than 5 Minutes | 0 (0.0%) | 0 (0.0%) |
| 5 to 9 Minutes | 15 (4.3%) | 40 (10.4%) |
| 10 to 14 Minutes | 33 (9.5%) | 54 (14.1%) |
| 15 to 19 Minutes | 62 (17.8%) | 30 (7.8%) |
| 20 to 24 Minutes | 38 (10.9%) | 66 (17.2%) |
| 25 to 29 Minutes | 12 (3.5%) | 23 (6.0%) |
| 30 to 34 Minutes | 49 (14.1%) | 0 (0.0%) |
| 35 to 39 Minutes | 19 (5.5%) | 51 (13.3%) |
| 40 to 44 Minutes | 0 (0.0%) | 6 (1.6%) |
| 45 to 59 Minutes | 32 (9.2%) | 29 (7.6%) |
| 60 to 89 Minutes | 43 (12.4%) | 40 (10.4%) |
| 90 or more Minutes | 45 (12.9%) | 44 (11.5%) |
Time of Departure to Work by Sex in Sea Bright borough
The most frequent times of departure to work in Sea Bright borough are 8:00 AM to 8:29 AM (75, 21.5%) for males and 8:00 AM to 8:29 AM (129, 33.7%) for females.
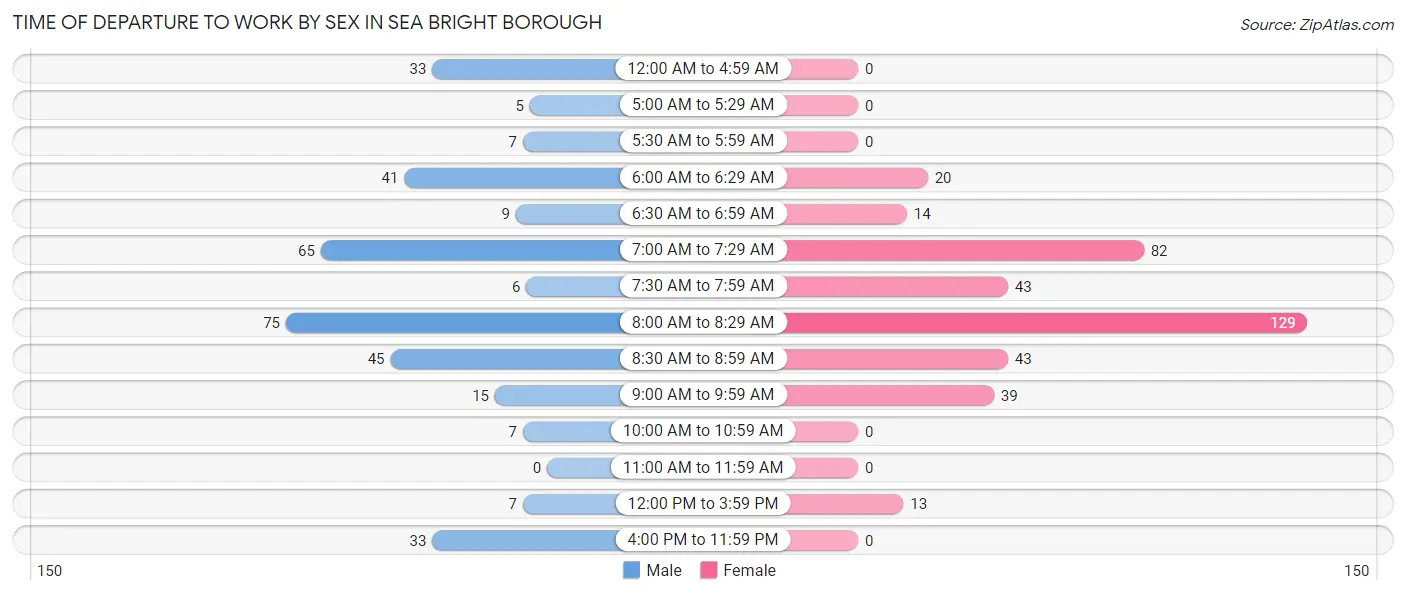
| Time of Departure | Male | Female |
| 12:00 AM to 4:59 AM | 33 (9.5%) | 0 (0.0%) |
| 5:00 AM to 5:29 AM | 5 (1.4%) | 0 (0.0%) |
| 5:30 AM to 5:59 AM | 7 (2.0%) | 0 (0.0%) |
| 6:00 AM to 6:29 AM | 41 (11.8%) | 20 (5.2%) |
| 6:30 AM to 6:59 AM | 9 (2.6%) | 14 (3.7%) |
| 7:00 AM to 7:29 AM | 65 (18.7%) | 82 (21.4%) |
| 7:30 AM to 7:59 AM | 6 (1.7%) | 43 (11.2%) |
| 8:00 AM to 8:29 AM | 75 (21.5%) | 129 (33.7%) |
| 8:30 AM to 8:59 AM | 45 (12.9%) | 43 (11.2%) |
| 9:00 AM to 9:59 AM | 15 (4.3%) | 39 (10.2%) |
| 10:00 AM to 10:59 AM | 7 (2.0%) | 0 (0.0%) |
| 11:00 AM to 11:59 AM | 0 (0.0%) | 0 (0.0%) |
| 12:00 PM to 3:59 PM | 7 (2.0%) | 13 (3.4%) |
| 4:00 PM to 11:59 PM | 33 (9.5%) | 0 (0.0%) |
| Total | 348 (100.0%) | 383 (100.0%) |
Housing Occupancy in Sea Bright borough
Occupancy by Ownership in Sea Bright borough
Of the total 895 dwellings in Sea Bright borough, owner-occupied units account for 616 (68.8%), while renter-occupied units make up 279 (31.2%).
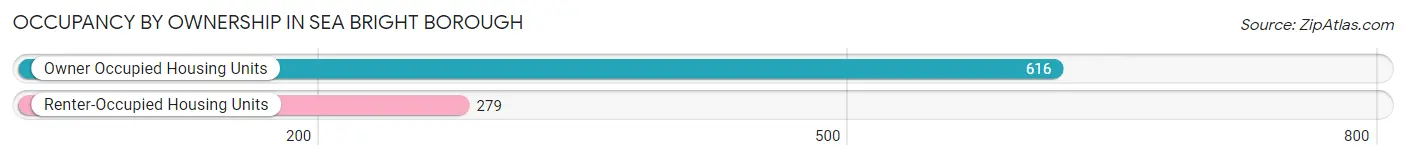
| Occupancy | # Housing Units | % Housing Units |
| Owner Occupied Housing Units | 616 | 68.8% |
| Renter-Occupied Housing Units | 279 | 31.2% |
| Total Occupied Housing Units | 895 | 100.0% |
Occupancy by Household Size in Sea Bright borough
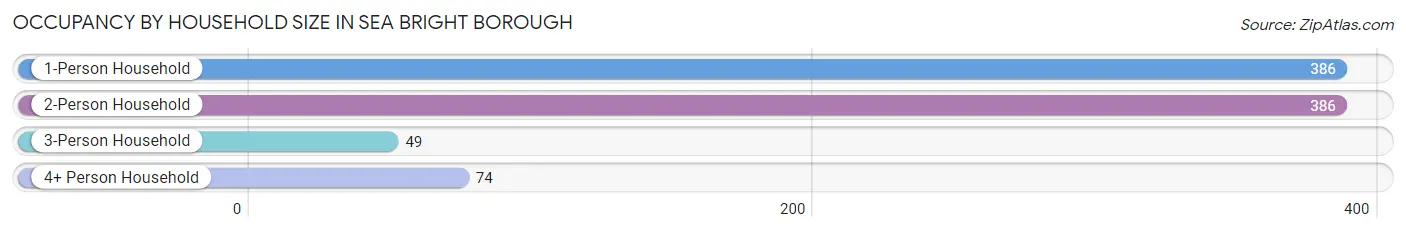
| Household Size | # Housing Units | % Housing Units |
| 1-Person Household | 386 | 43.1% |
| 2-Person Household | 386 | 43.1% |
| 3-Person Household | 49 | 5.5% |
| 4+ Person Household | 74 | 8.3% |
| Total Housing Units | 895 | 100.0% |
Occupancy by Ownership by Household Size in Sea Bright borough
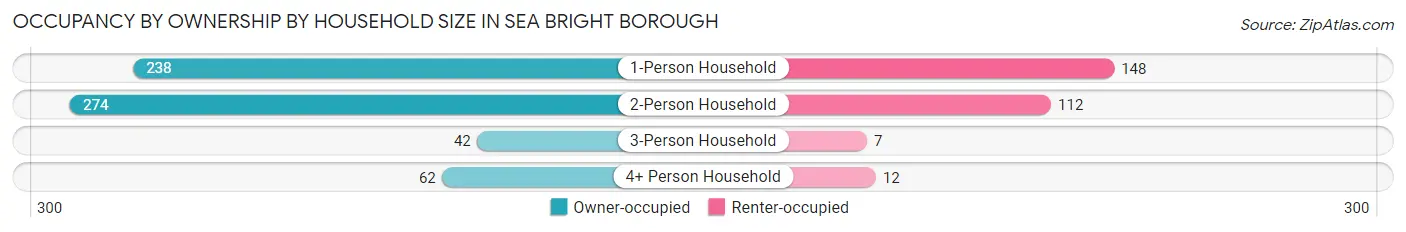
| Household Size | Owner-occupied | Renter-occupied |
| 1-Person Household | 238 (61.7%) | 148 (38.3%) |
| 2-Person Household | 274 (71.0%) | 112 (29.0%) |
| 3-Person Household | 42 (85.7%) | 7 (14.3%) |
| 4+ Person Household | 62 (83.8%) | 12 (16.2%) |
| Total Housing Units | 616 (68.8%) | 279 (31.2%) |
Occupancy by Educational Attainment in Sea Bright borough
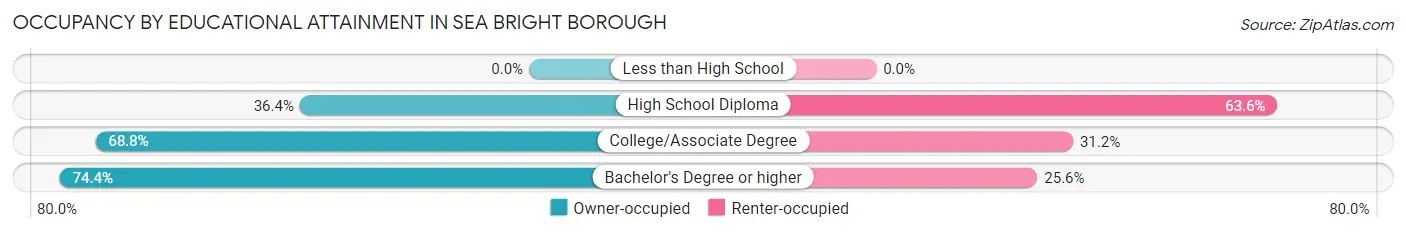
| Household Size | Owner-occupied | Renter-occupied |
| Less than High School | 0 (0.0%) | 0 (0.0%) |
| High School Diploma | 36 (36.4%) | 63 (63.6%) |
| College/Associate Degree | 152 (68.8%) | 69 (31.2%) |
| Bachelor's Degree or higher | 428 (74.4%) | 147 (25.6%) |
Occupancy by Age of Householder in Sea Bright borough
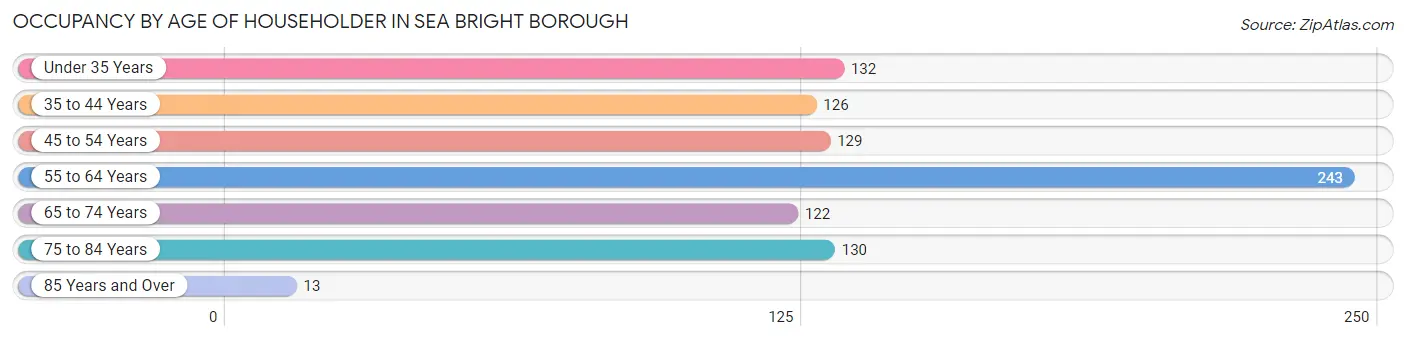
| Age Bracket | # Households | % Households |
| Under 35 Years | 132 | 14.7% |
| 35 to 44 Years | 126 | 14.1% |
| 45 to 54 Years | 129 | 14.4% |
| 55 to 64 Years | 243 | 27.2% |
| 65 to 74 Years | 122 | 13.6% |
| 75 to 84 Years | 130 | 14.5% |
| 85 Years and Over | 13 | 1.5% |
| Total | 895 | 100.0% |
Housing Finances in Sea Bright borough
Median Income by Occupancy in Sea Bright borough
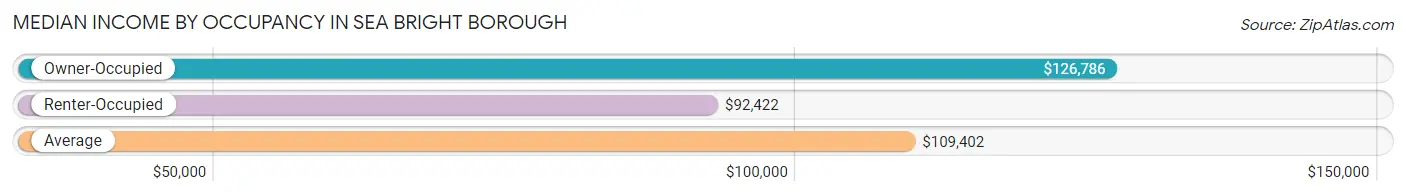
| Occupancy Type | # Households | Median Income |
| Owner-Occupied | 616 (68.8%) | $126,786 |
| Renter-Occupied | 279 (31.2%) | $92,422 |
| Average | 895 (100.0%) | $109,402 |
Occupancy by Householder Income Bracket in Sea Bright borough
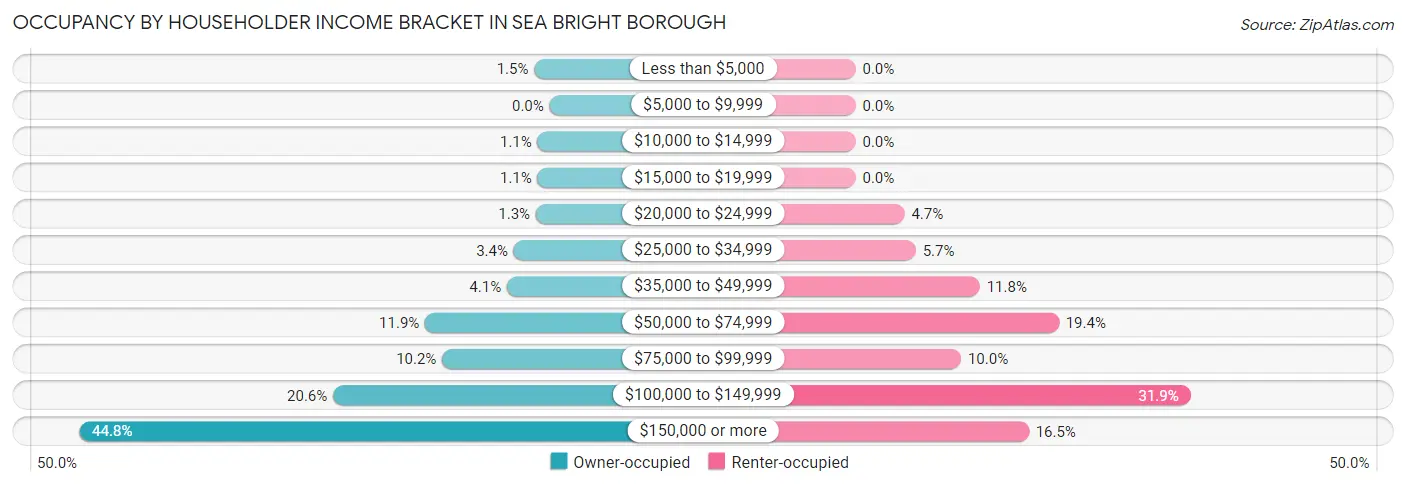
| Income Bracket | Owner-occupied | Renter-occupied |
| Less than $5,000 | 9 (1.5%) | 0 (0.0%) |
| $5,000 to $9,999 | 0 (0.0%) | 0 (0.0%) |
| $10,000 to $14,999 | 7 (1.1%) | 0 (0.0%) |
| $15,000 to $19,999 | 7 (1.1%) | 0 (0.0%) |
| $20,000 to $24,999 | 8 (1.3%) | 13 (4.7%) |
| $25,000 to $34,999 | 21 (3.4%) | 16 (5.7%) |
| $35,000 to $49,999 | 25 (4.1%) | 33 (11.8%) |
| $50,000 to $74,999 | 73 (11.8%) | 54 (19.4%) |
| $75,000 to $99,999 | 63 (10.2%) | 28 (10.0%) |
| $100,000 to $149,999 | 127 (20.6%) | 89 (31.9%) |
| $150,000 or more | 276 (44.8%) | 46 (16.5%) |
| Total | 616 (100.0%) | 279 (100.0%) |
Monthly Housing Cost Tiers in Sea Bright borough
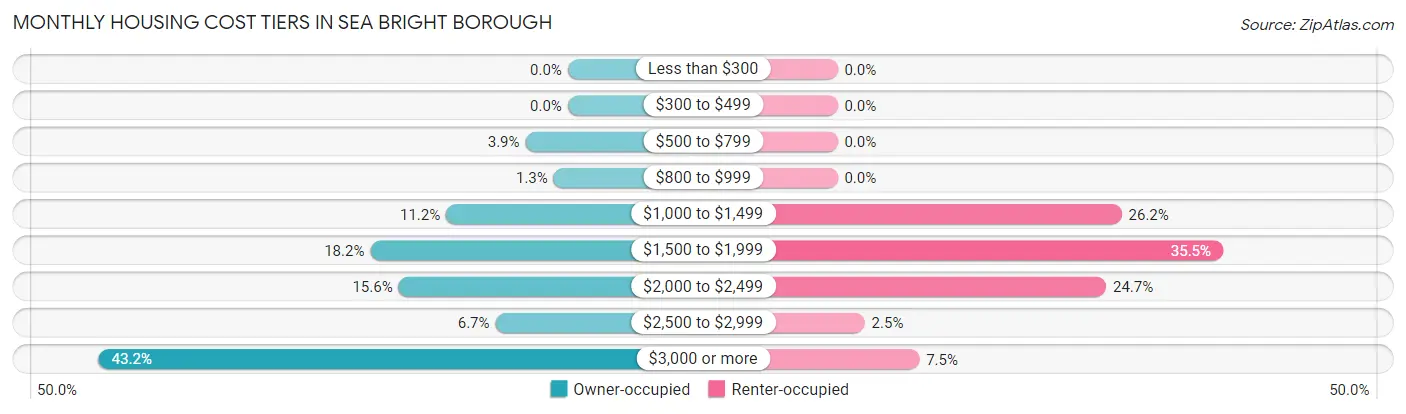
| Monthly Cost | Owner-occupied | Renter-occupied |
| Less than $300 | 0 (0.0%) | 0 (0.0%) |
| $300 to $499 | 0 (0.0%) | 0 (0.0%) |
| $500 to $799 | 24 (3.9%) | 0 (0.0%) |
| $800 to $999 | 8 (1.3%) | 0 (0.0%) |
| $1,000 to $1,499 | 69 (11.2%) | 73 (26.2%) |
| $1,500 to $1,999 | 112 (18.2%) | 99 (35.5%) |
| $2,000 to $2,499 | 96 (15.6%) | 69 (24.7%) |
| $2,500 to $2,999 | 41 (6.7%) | 7 (2.5%) |
| $3,000 or more | 266 (43.2%) | 21 (7.5%) |
| Total | 616 (100.0%) | 279 (100.0%) |
Physical Housing Characteristics in Sea Bright borough
Housing Structures in Sea Bright borough
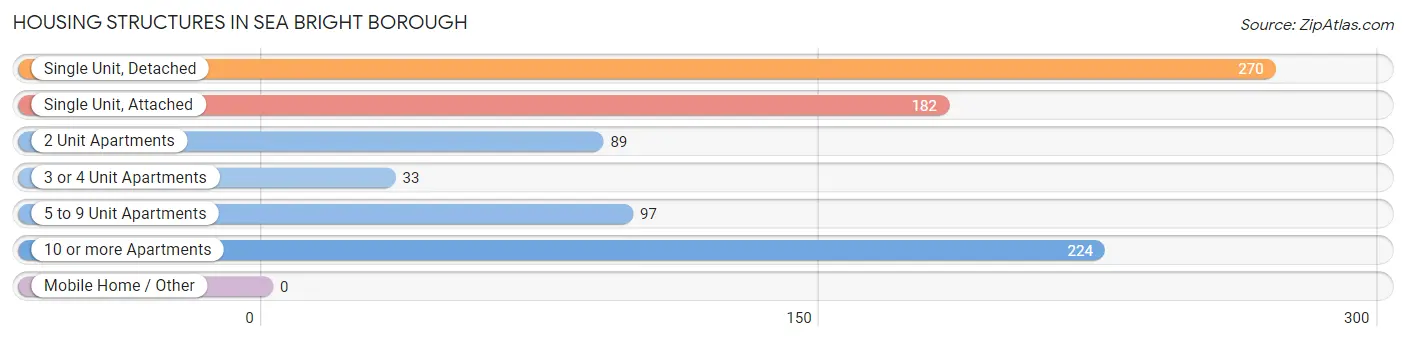
| Structure Type | # Housing Units | % Housing Units |
| Single Unit, Detached | 270 | 30.2% |
| Single Unit, Attached | 182 | 20.3% |
| 2 Unit Apartments | 89 | 9.9% |
| 3 or 4 Unit Apartments | 33 | 3.7% |
| 5 to 9 Unit Apartments | 97 | 10.8% |
| 10 or more Apartments | 224 | 25.0% |
| Mobile Home / Other | 0 | 0.0% |
| Total | 895 | 100.0% |
Housing Structures by Occupancy in Sea Bright borough
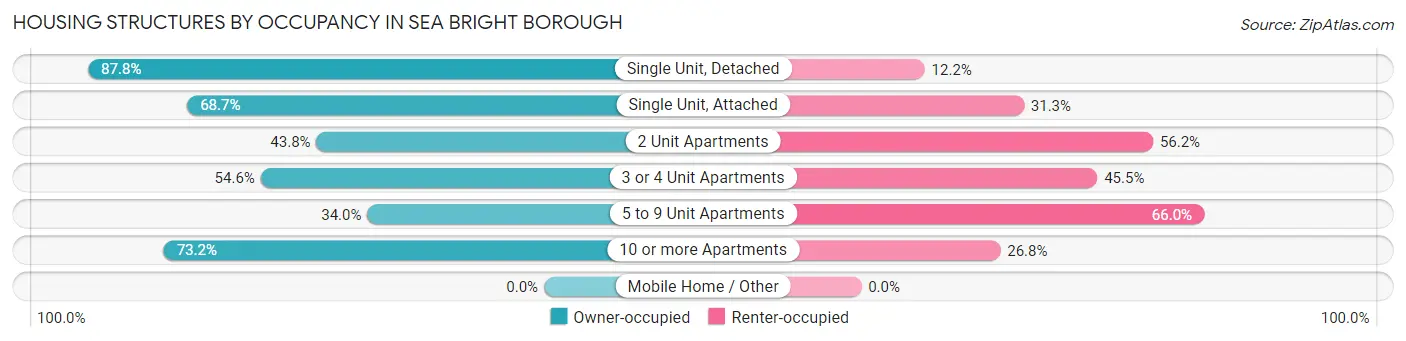
| Structure Type | Owner-occupied | Renter-occupied |
| Single Unit, Detached | 237 (87.8%) | 33 (12.2%) |
| Single Unit, Attached | 125 (68.7%) | 57 (31.3%) |
| 2 Unit Apartments | 39 (43.8%) | 50 (56.2%) |
| 3 or 4 Unit Apartments | 18 (54.5%) | 15 (45.5%) |
| 5 to 9 Unit Apartments | 33 (34.0%) | 64 (66.0%) |
| 10 or more Apartments | 164 (73.2%) | 60 (26.8%) |
| Mobile Home / Other | 0 (0.0%) | 0 (0.0%) |
| Total | 616 (68.8%) | 279 (31.2%) |
Housing Structures by Number of Rooms in Sea Bright borough
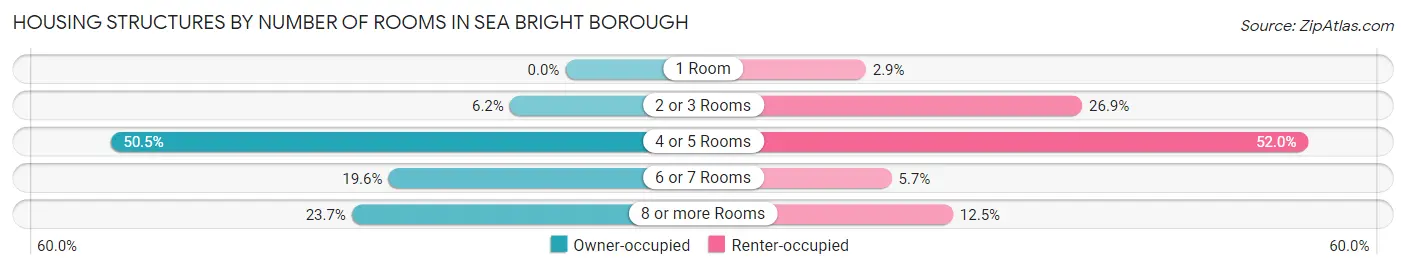
| Number of Rooms | Owner-occupied | Renter-occupied |
| 1 Room | 0 (0.0%) | 8 (2.9%) |
| 2 or 3 Rooms | 38 (6.2%) | 75 (26.9%) |
| 4 or 5 Rooms | 311 (50.5%) | 145 (52.0%) |
| 6 or 7 Rooms | 121 (19.6%) | 16 (5.7%) |
| 8 or more Rooms | 146 (23.7%) | 35 (12.5%) |
| Total | 616 (100.0%) | 279 (100.0%) |
Housing Structure by Heating Type in Sea Bright borough
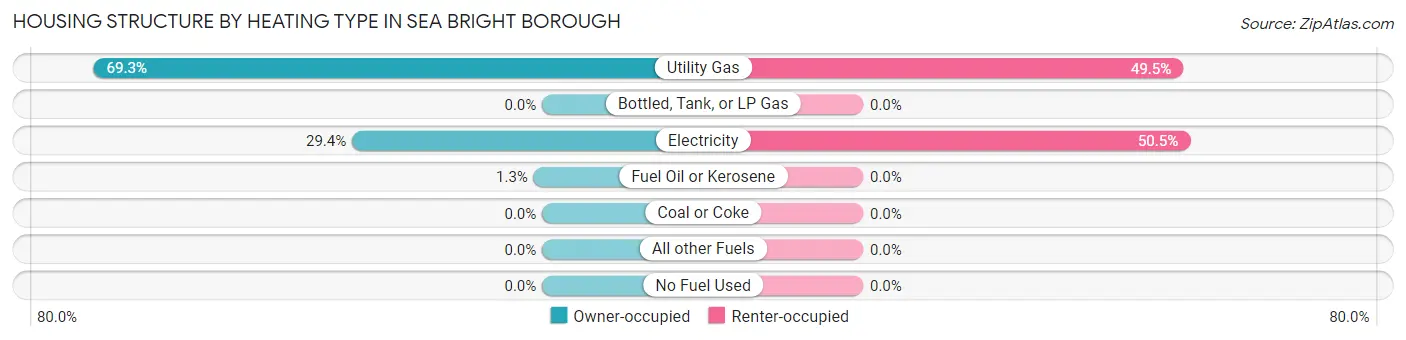
| Heating Type | Owner-occupied | Renter-occupied |
| Utility Gas | 427 (69.3%) | 138 (49.5%) |
| Bottled, Tank, or LP Gas | 0 (0.0%) | 0 (0.0%) |
| Electricity | 181 (29.4%) | 141 (50.5%) |
| Fuel Oil or Kerosene | 8 (1.3%) | 0 (0.0%) |
| Coal or Coke | 0 (0.0%) | 0 (0.0%) |
| All other Fuels | 0 (0.0%) | 0 (0.0%) |
| No Fuel Used | 0 (0.0%) | 0 (0.0%) |
| Total | 616 (100.0%) | 279 (100.0%) |
Household Vehicle Usage in Sea Bright borough
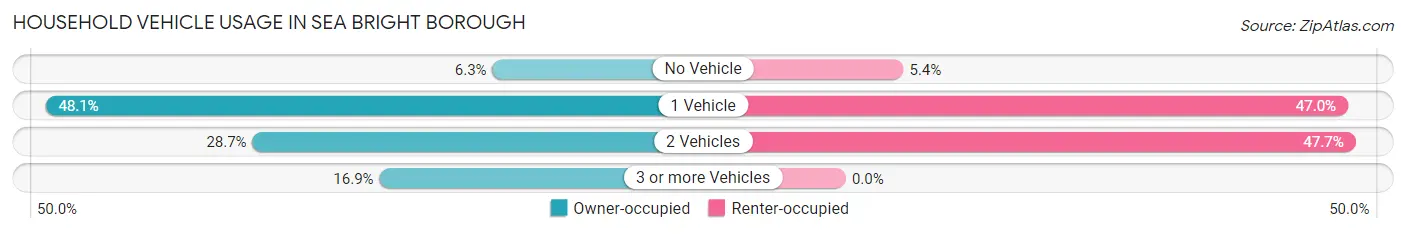
| Vehicles per Household | Owner-occupied | Renter-occupied |
| No Vehicle | 39 (6.3%) | 15 (5.4%) |
| 1 Vehicle | 296 (48.0%) | 131 (46.9%) |
| 2 Vehicles | 177 (28.7%) | 133 (47.7%) |
| 3 or more Vehicles | 104 (16.9%) | 0 (0.0%) |
| Total | 616 (100.0%) | 279 (100.0%) |
Real Estate & Mortgages in Sea Bright borough
Real Estate and Mortgage Overview in Sea Bright borough
| Characteristic | Without Mortgage | With Mortgage |
| Housing Units | 277 | 339 |
| Median Property Value | $825,900 | $755,400 |
| Median Household Income | $103,075 | $197 |
| Monthly Housing Costs | $1,501 | $244 |
| Real Estate Taxes | $6,188 | $0 |
Property Value by Mortgage Status in Sea Bright borough
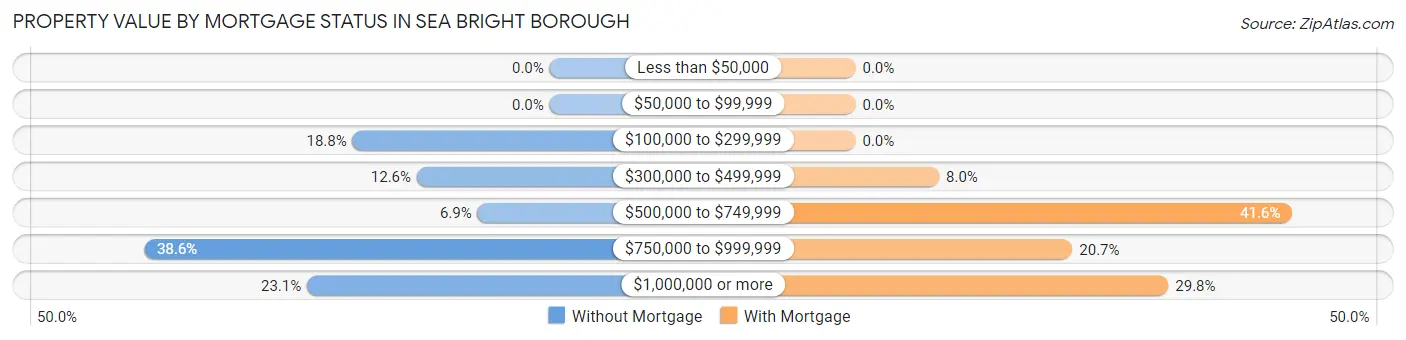
| Property Value | Without Mortgage | With Mortgage |
| Less than $50,000 | 0 (0.0%) | 0 (0.0%) |
| $50,000 to $99,999 | 0 (0.0%) | 0 (0.0%) |
| $100,000 to $299,999 | 52 (18.8%) | 0 (0.0%) |
| $300,000 to $499,999 | 35 (12.6%) | 27 (8.0%) |
| $500,000 to $749,999 | 19 (6.9%) | 141 (41.6%) |
| $750,000 to $999,999 | 107 (38.6%) | 70 (20.6%) |
| $1,000,000 or more | 64 (23.1%) | 101 (29.8%) |
| Total | 277 (100.0%) | 339 (100.0%) |
Household Income by Mortgage Status in Sea Bright borough
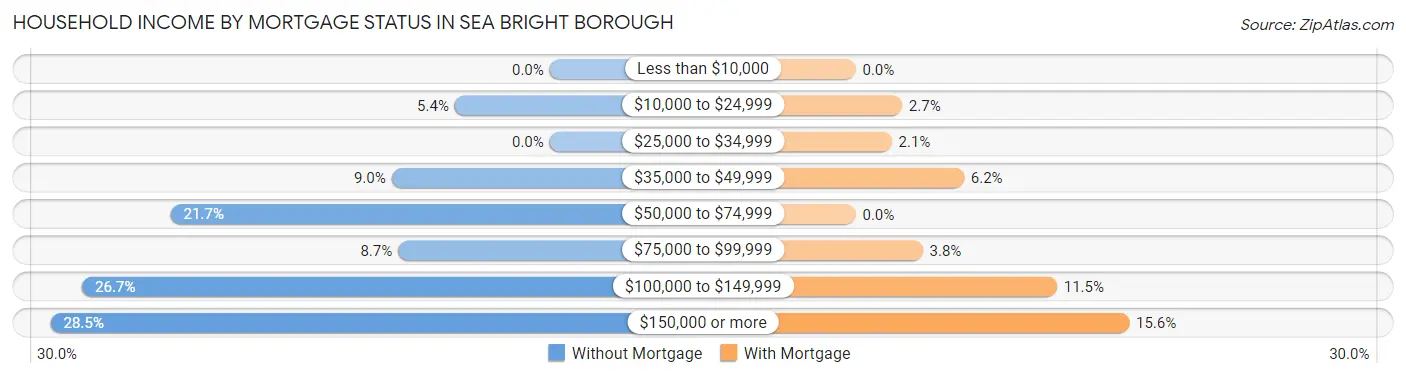
| Household Income | Without Mortgage | With Mortgage |
| Less than $10,000 | 0 (0.0%) | 0 (0.0%) |
| $10,000 to $24,999 | 15 (5.4%) | 9 (2.6%) |
| $25,000 to $34,999 | 0 (0.0%) | 7 (2.1%) |
| $35,000 to $49,999 | 25 (9.0%) | 21 (6.2%) |
| $50,000 to $74,999 | 60 (21.7%) | 0 (0.0%) |
| $75,000 to $99,999 | 24 (8.7%) | 13 (3.8%) |
| $100,000 to $149,999 | 74 (26.7%) | 39 (11.5%) |
| $150,000 or more | 79 (28.5%) | 53 (15.6%) |
| Total | 277 (100.0%) | 339 (100.0%) |
Property Value to Household Income Ratio in Sea Bright borough
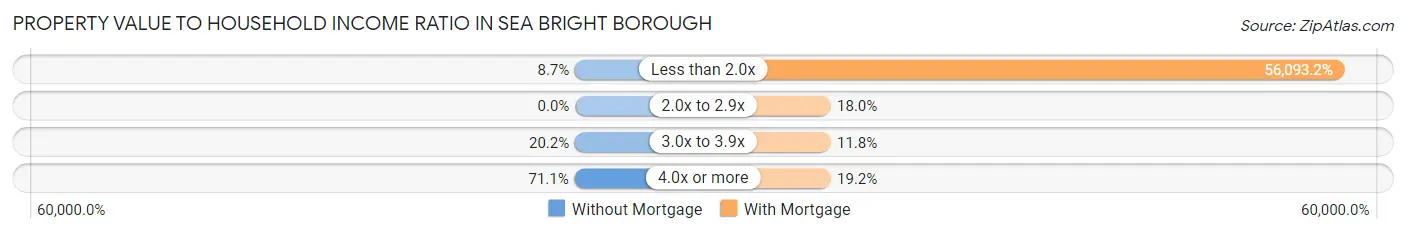
| Value-to-Income Ratio | Without Mortgage | With Mortgage |
| Less than 2.0x | 24 (8.7%) | 190,156 (56,093.2%) |
| 2.0x to 2.9x | 0 (0.0%) | 61 (18.0%) |
| 3.0x to 3.9x | 56 (20.2%) | 40 (11.8%) |
| 4.0x or more | 197 (71.1%) | 65 (19.2%) |
| Total | 277 (100.0%) | 339 (100.0%) |
Real Estate Taxes by Mortgage Status in Sea Bright borough
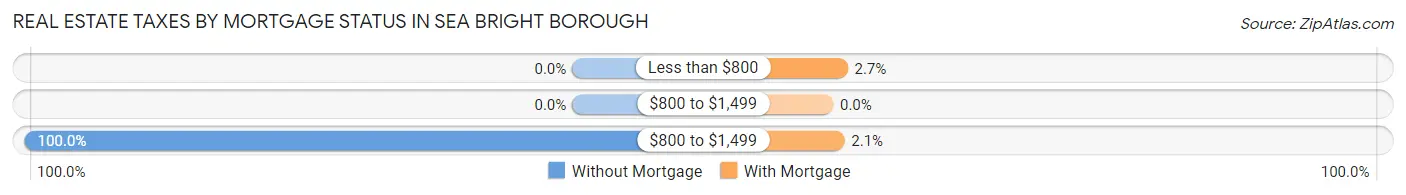
| Property Taxes | Without Mortgage | With Mortgage |
| Less than $800 | 0 (0.0%) | 9 (2.6%) |
| $800 to $1,499 | 0 (0.0%) | 0 (0.0%) |
| $800 to $1,499 | 277 (100.0%) | 7 (2.1%) |
| Total | 277 (100.0%) | 339 (100.0%) |
Health & Disability in Sea Bright borough
Health Insurance Coverage by Age in Sea Bright borough
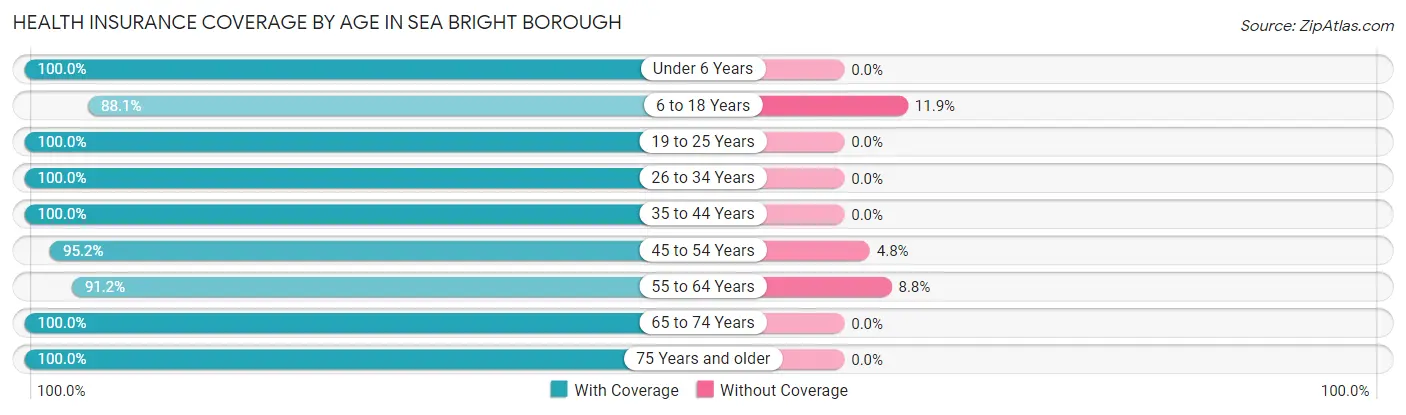
| Age Bracket | With Coverage | Without Coverage |
| Under 6 Years | 52 (100.0%) | 0 (0.0%) |
| 6 to 18 Years | 104 (88.1%) | 14 (11.9%) |
| 19 to 25 Years | 128 (100.0%) | 0 (0.0%) |
| 26 to 34 Years | 153 (100.0%) | 0 (0.0%) |
| 35 to 44 Years | 180 (100.0%) | 0 (0.0%) |
| 45 to 54 Years | 260 (95.2%) | 13 (4.8%) |
| 55 to 64 Years | 321 (91.2%) | 31 (8.8%) |
| 65 to 74 Years | 221 (100.0%) | 0 (0.0%) |
| 75 Years and older | 152 (100.0%) | 0 (0.0%) |
| Total | 1,571 (96.4%) | 58 (3.6%) |
Health Insurance Coverage by Citizenship Status in Sea Bright borough
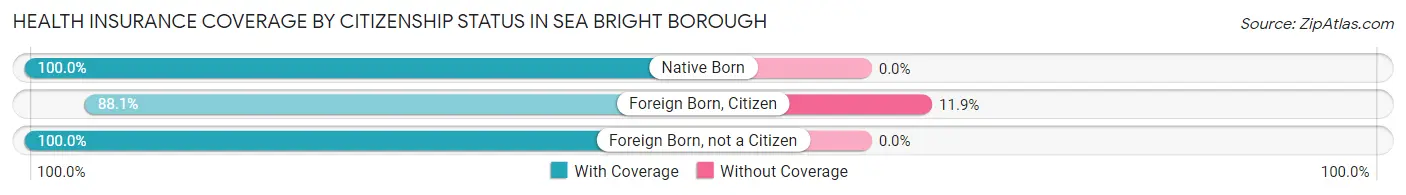
| Citizenship Status | With Coverage | Without Coverage |
| Native Born | 52 (100.0%) | 0 (0.0%) |
| Foreign Born, Citizen | 104 (88.1%) | 14 (11.9%) |
| Foreign Born, not a Citizen | 128 (100.0%) | 0 (0.0%) |
Health Insurance Coverage by Household Income in Sea Bright borough
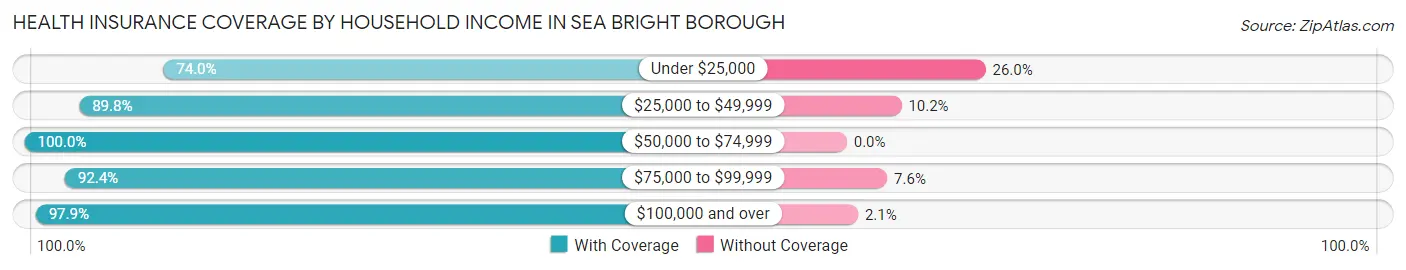
| Household Income | With Coverage | Without Coverage |
| Under $25,000 | 37 (74.0%) | 13 (26.0%) |
| $25,000 to $49,999 | 114 (89.8%) | 13 (10.2%) |
| $50,000 to $74,999 | 233 (100.0%) | 0 (0.0%) |
| $75,000 to $99,999 | 110 (92.4%) | 9 (7.6%) |
| $100,000 and over | 1,077 (97.9%) | 23 (2.1%) |
Public vs Private Health Insurance Coverage by Age in Sea Bright borough
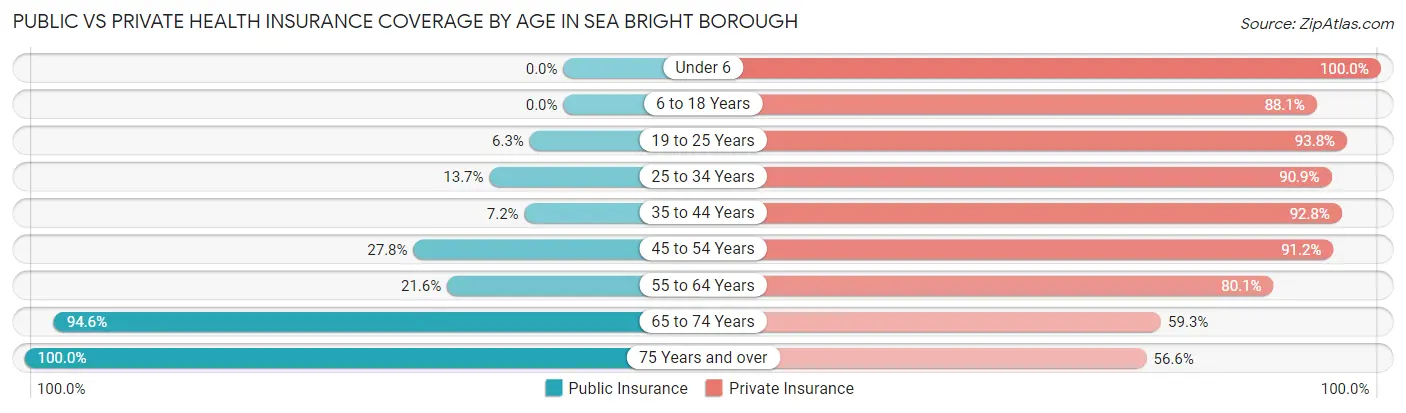
| Age Bracket | Public Insurance | Private Insurance |
| Under 6 | 0 (0.0%) | 52 (100.0%) |
| 6 to 18 Years | 0 (0.0%) | 104 (88.1%) |
| 19 to 25 Years | 8 (6.2%) | 120 (93.8%) |
| 25 to 34 Years | 21 (13.7%) | 139 (90.8%) |
| 35 to 44 Years | 13 (7.2%) | 167 (92.8%) |
| 45 to 54 Years | 76 (27.8%) | 249 (91.2%) |
| 55 to 64 Years | 76 (21.6%) | 282 (80.1%) |
| 65 to 74 Years | 209 (94.6%) | 131 (59.3%) |
| 75 Years and over | 152 (100.0%) | 86 (56.6%) |
| Total | 555 (34.1%) | 1,330 (81.7%) |
Disability Status by Sex by Age in Sea Bright borough
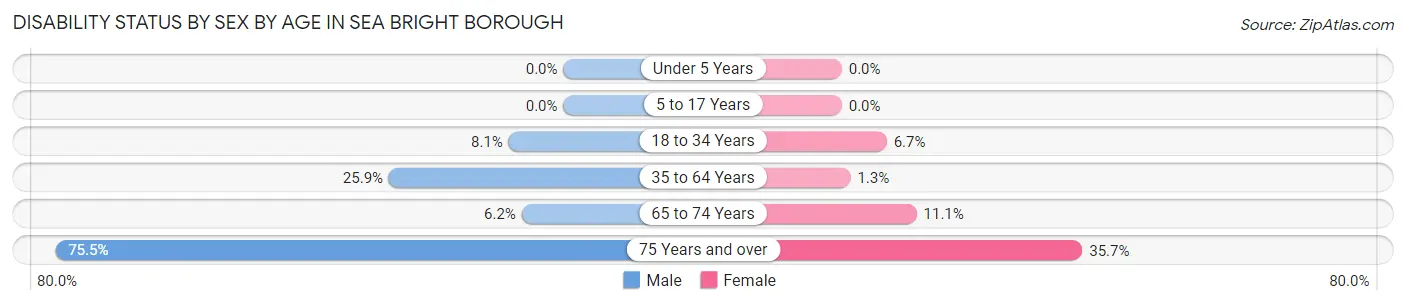
| Age Bracket | Male | Female |
| Under 5 Years | 0 (0.0%) | 0 (0.0%) |
| 5 to 17 Years | 0 (0.0%) | 0 (0.0%) |
| 18 to 34 Years | 13 (8.1%) | 9 (6.7%) |
| 35 to 64 Years | 108 (25.9%) | 5 (1.3%) |
| 65 to 74 Years | 7 (6.2%) | 12 (11.1%) |
| 75 Years and over | 83 (75.4%) | 15 (35.7%) |
Disability Class by Sex by Age in Sea Bright borough
Disability Class: Hearing Difficulty
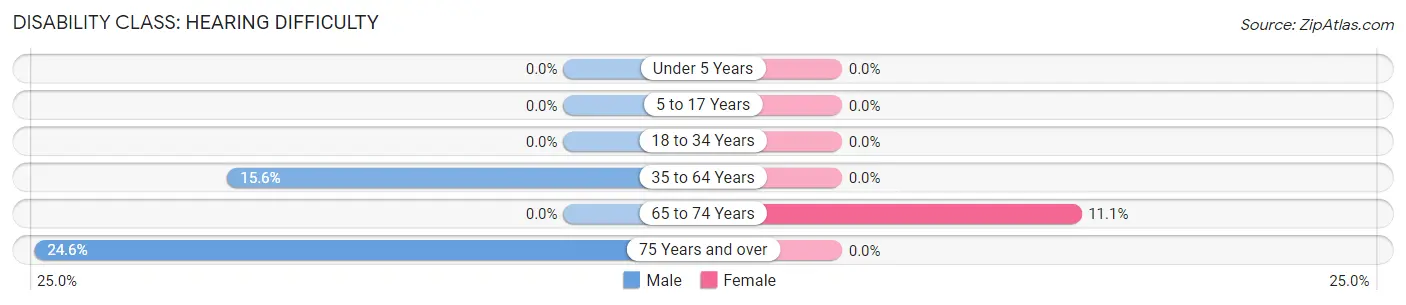
| Age Bracket | Male | Female |
| Under 5 Years | 0 (0.0%) | 0 (0.0%) |
| 5 to 17 Years | 0 (0.0%) | 0 (0.0%) |
| 18 to 34 Years | 0 (0.0%) | 0 (0.0%) |
| 35 to 64 Years | 65 (15.6%) | 0 (0.0%) |
| 65 to 74 Years | 0 (0.0%) | 12 (11.1%) |
| 75 Years and over | 27 (24.5%) | 0 (0.0%) |
Disability Class: Vision Difficulty
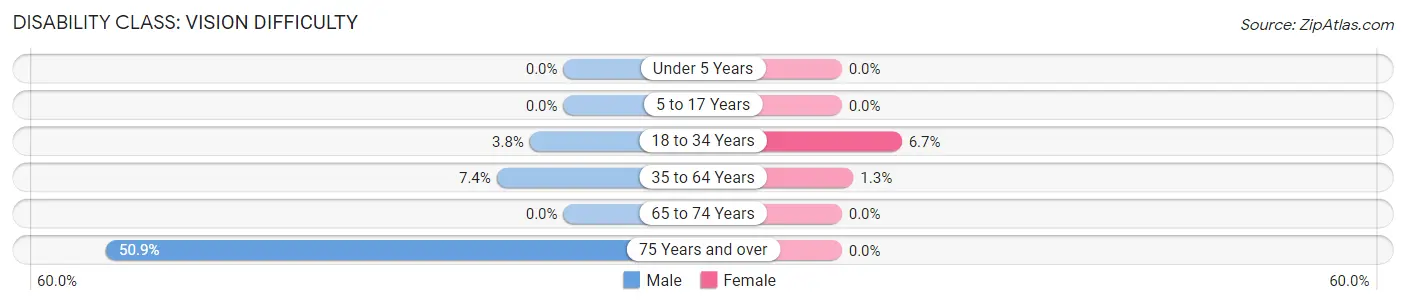
| Age Bracket | Male | Female |
| Under 5 Years | 0 (0.0%) | 0 (0.0%) |
| 5 to 17 Years | 0 (0.0%) | 0 (0.0%) |
| 18 to 34 Years | 6 (3.7%) | 9 (6.7%) |
| 35 to 64 Years | 31 (7.4%) | 5 (1.3%) |
| 65 to 74 Years | 0 (0.0%) | 0 (0.0%) |
| 75 Years and over | 56 (50.9%) | 0 (0.0%) |
Disability Class: Cognitive Difficulty
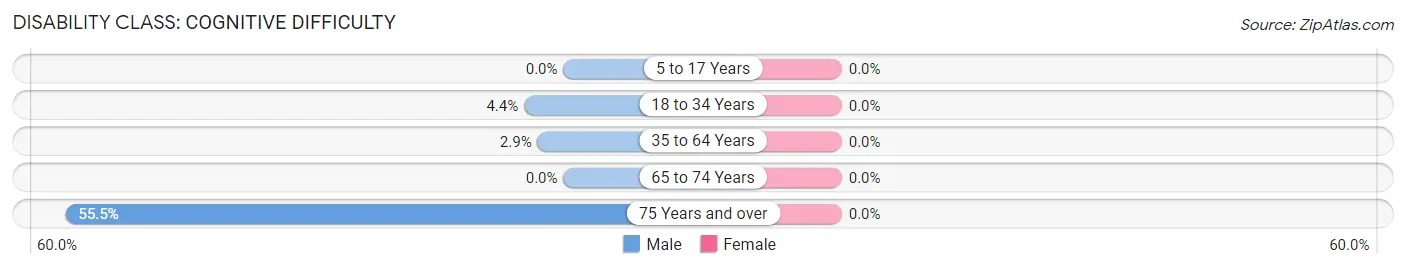
| Age Bracket | Male | Female |
| 5 to 17 Years | 0 (0.0%) | 0 (0.0%) |
| 18 to 34 Years | 7 (4.4%) | 0 (0.0%) |
| 35 to 64 Years | 12 (2.9%) | 0 (0.0%) |
| 65 to 74 Years | 0 (0.0%) | 0 (0.0%) |
| 75 Years and over | 61 (55.4%) | 0 (0.0%) |
Disability Class: Ambulatory Difficulty
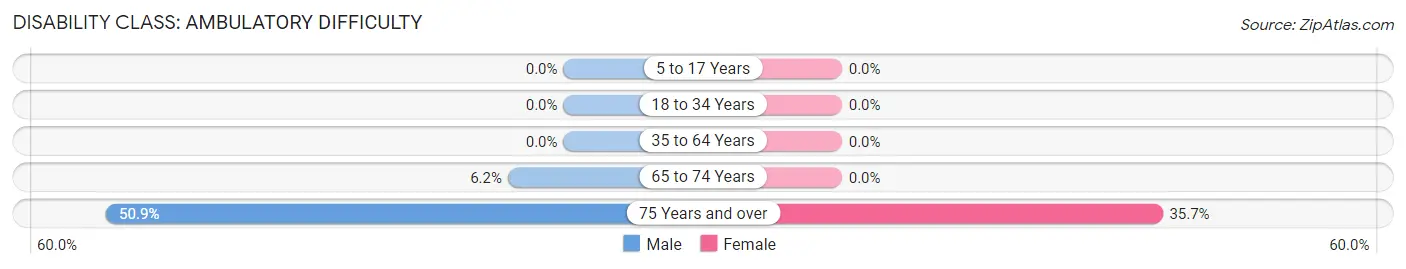
| Age Bracket | Male | Female |
| 5 to 17 Years | 0 (0.0%) | 0 (0.0%) |
| 18 to 34 Years | 0 (0.0%) | 0 (0.0%) |
| 35 to 64 Years | 0 (0.0%) | 0 (0.0%) |
| 65 to 74 Years | 7 (6.2%) | 0 (0.0%) |
| 75 Years and over | 56 (50.9%) | 15 (35.7%) |
Disability Class: Self-Care Difficulty
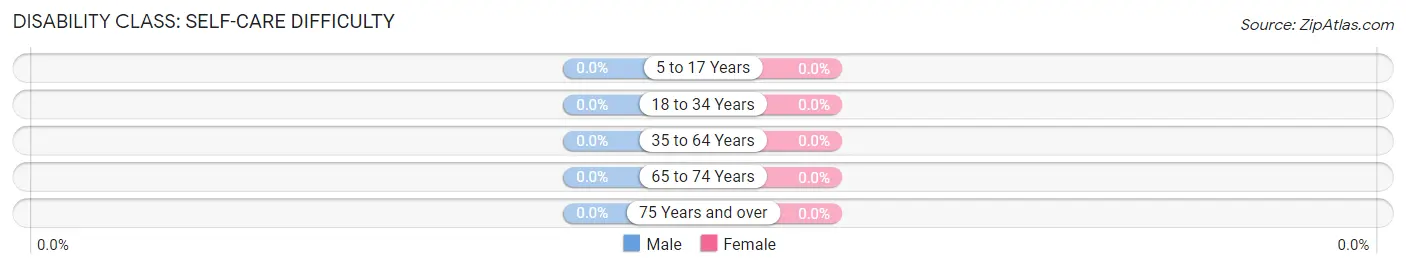
| Age Bracket | Male | Female |
| 5 to 17 Years | 0 (0.0%) | 0 (0.0%) |
| 18 to 34 Years | 0 (0.0%) | 0 (0.0%) |
| 35 to 64 Years | 0 (0.0%) | 0 (0.0%) |
| 65 to 74 Years | 0 (0.0%) | 0 (0.0%) |
| 75 Years and over | 0 (0.0%) | 0 (0.0%) |
Technology Access in Sea Bright borough
Computing Device Access in Sea Bright borough
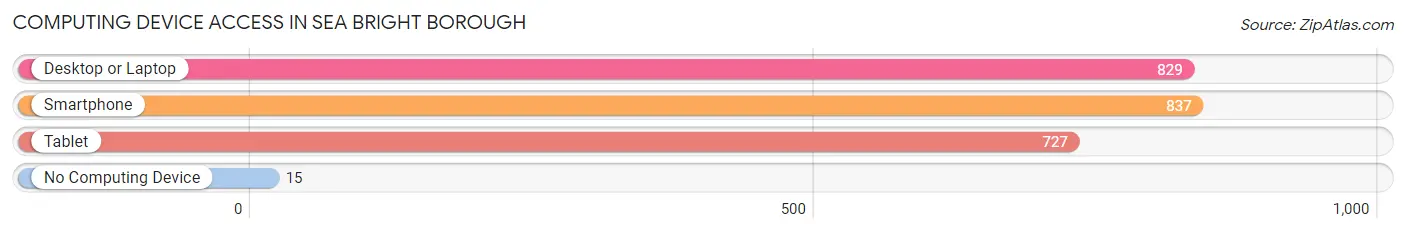
| Device Type | # Households | % Households |
| Desktop or Laptop | 829 | 92.6% |
| Smartphone | 837 | 93.5% |
| Tablet | 727 | 81.2% |
| No Computing Device | 15 | 1.7% |
| Total | 895 | 100.0% |
Internet Access in Sea Bright borough
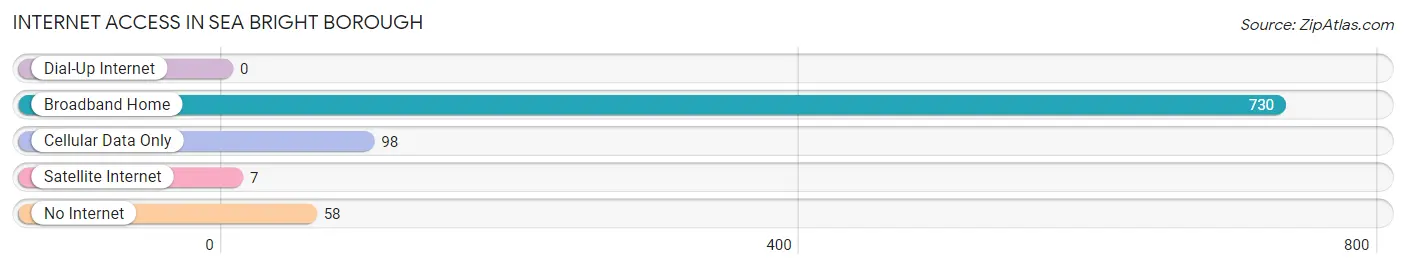
| Internet Type | # Households | % Households |
| Dial-Up Internet | 0 | 0.0% |
| Broadband Home | 730 | 81.6% |
| Cellular Data Only | 98 | 11.0% |
| Satellite Internet | 7 | 0.8% |
| No Internet | 58 | 6.5% |
| Total | 895 | 100.0% |
Sea Bright borough Summary
Introduction
Sea Bright Borough is a small borough located in Monmouth County, New Jersey. It is situated on the Atlantic Ocean, just south of the Navesink River. The borough is bordered by the towns of Monmouth Beach and Rumson to the north, and the borough of Highlands to the south. Sea Bright is a popular destination for beachgoers, and is known for its vibrant nightlife.
History
Sea Bright was first settled in the early 1700s by Dutch and English settlers. The area was originally known as Navesink, and was part of Shrewsbury Township. In 1869, the area was incorporated as the Borough of Sea Bright. The name was chosen to reflect the town’s location on the Atlantic Ocean.
In the late 19th century, Sea Bright became a popular destination for wealthy New Yorkers, who built large summer homes along the shore. The town was also a popular spot for fishing and boating. In the early 20th century, Sea Bright became a popular destination for tourists, and the town’s economy began to grow.
In the 1950s, Sea Bright began to decline as a tourist destination. The town’s economy suffered, and many of the summer homes were abandoned. In the 1970s, the town began to experience a resurgence, as new businesses and restaurants opened up.
Geography
Sea Bright is located in Monmouth County, New Jersey. It is situated on the Atlantic Ocean, just south of the Navesink River. The borough is bordered by the towns of Monmouth Beach and Rumson to the north, and the borough of Highlands to the south.
The borough covers an area of 1.2 square miles, and is home to a population of approximately 1,400 people. The town is located on a narrow strip of land between the Atlantic Ocean and the Navesink River. The town is known for its beautiful beaches, which are popular with tourists and locals alike.
Economy
The economy of Sea Bright is largely based on tourism. The town is home to a number of restaurants, bars, and shops, which cater to tourists and locals alike. The town is also home to a number of marinas, which provide services to boaters.
The town is also home to a number of businesses, including a number of real estate agencies, a bank, and a number of professional services. The town is also home to a number of small businesses, including a number of art galleries, antique stores, and gift shops.
Demographics
As of the 2010 census, the population of Sea Bright was 1,412. The racial makeup of the town was 94.3% White, 2.2% African American, 0.2% Native American, 0.9% Asian, 0.1% Pacific Islander, 0.7% from other races, and 1.6% from two or more races. Hispanic or Latino of any race were 3.3% of the population.
The median income for a household in the town was $68,750, and the median income for a family was $77,917. The per capita income for the town was $37,917. About 4.3% of families and 5.7% of the population were below the poverty line, including 6.3% of those under age 18 and 4.2% of those age 65 or over.
Conclusion
Sea Bright Borough is a small borough located in Monmouth County, New Jersey. It is situated on the Atlantic Ocean, just south of the Navesink River. The borough is bordered by the towns of Monmouth Beach and Rumson to the north, and the borough of Highlands to the south. Sea Bright is a popular destination for beachgoers, and is known for its vibrant nightlife. The economy of Sea Bright is largely based on tourism, and the town is home to a number of restaurants, bars, and shops. The population of Sea Bright was 1,412 as of the 2010 census, and the median income for a household in the town was $68,750.
Common Questions
What is the Total Population of Sea Bright borough?
Total Population of Sea Bright borough is 1,629.
What is the Total Male Population of Sea Bright borough?
Total Male Population of Sea Bright borough is 865.
What is the Total Female Population of Sea Bright borough?
Total Female Population of Sea Bright borough is 764.
What is the Ratio of Males per 100 Females in Sea Bright borough?
There are 113.22 Males per 100 Females in Sea Bright borough.
What is the Ratio of Females per 100 Males in Sea Bright borough?
There are 88.32 Females per 100 Males in Sea Bright borough.
What is the Median Population Age in Sea Bright borough?
Median Population Age in Sea Bright borough is 51.9 Years.
What is the Average Family Size in Sea Bright borough
Average Family Size in Sea Bright borough is 2.7 People.
What is the Average Household Size in Sea Bright borough
Average Household Size in Sea Bright borough is 1.8 People.
What is Per Capita Income in Sea Bright borough?
Per Capita income in Sea Bright borough is $103,242.
What is the Median Family Income in Sea Bright borough?
Median Family Income in Sea Bright borough is $203,000.
What is the Median Household income in Sea Bright borough?
Median Household Income in Sea Bright borough is $109,402.
What is Income or Wage Gap in Sea Bright borough?
Income or Wage Gap in Sea Bright borough is 16.9%.
Women in Sea Bright borough earn 83.1 cents for every dollar earned by a man.
What is Inequality or Gini Index in Sea Bright borough?
Inequality or Gini Index in Sea Bright borough is 0.52.
How Large is the Labor Force in Sea Bright borough?
There are 988 People in the Labor Forcein in Sea Bright borough.
What is the Percentage of People in the Labor Force in Sea Bright borough?
67.1% of People are in the Labor Force in Sea Bright borough.
What is the Unemployment Rate in Sea Bright borough?
Unemployment Rate in Sea Bright borough is 5.1%.