Manasquan borough, NJ
Manasquan borough Overview
5,921
TOTAL POPULATION
2,995
MALE POPULATION
2,926
FEMALE POPULATION
102.36
MALES / 100 FEMALES
97.70
FEMALES / 100 MALES
47.5
MEDIAN AGE
3.0
AVG FAMILY SIZE
2.4
AVG HOUSEHOLD SIZE
$84,708
PER CAPITA INCOME
$178,750
AVG FAMILY INCOME
$130,240
AVG HOUSEHOLD INCOME
42.3%
WAGE / INCOME GAP [ % ]
57.7¢/ $1
WAGE / INCOME GAP [ $ ]
0.52
INEQUALITY / GINI INDEX
3,269
LABOR FORCE [ PEOPLE ]
67.4%
PERCENT IN LABOR FORCE
4.5%
UNEMPLOYMENT RATE
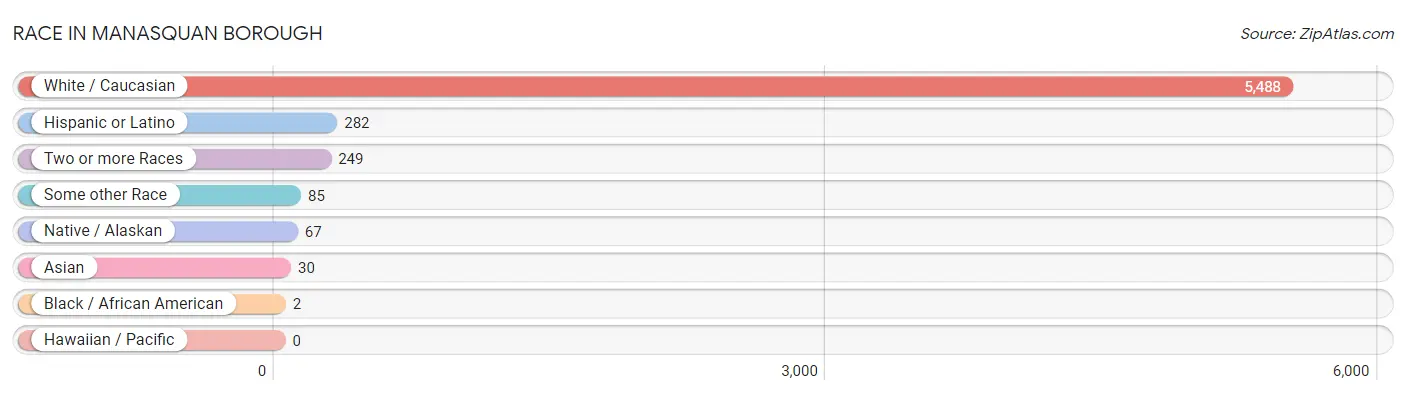
Race in Manasquan borough
The most populous races in Manasquan borough are White / Caucasian (5,488 | 92.7%), Hispanic or Latino (282 | 4.8%), and Two or more Races (249 | 4.2%).
| Race | # Population | % Population |
| Asian | 30 | 0.5% |
| Black / African American | 2 | 0.0% |
| Hawaiian / Pacific | 0 | 0.0% |
| Hispanic or Latino | 282 | 4.8% |
| Native / Alaskan | 67 | 1.1% |
| White / Caucasian | 5,488 | 92.7% |
| Two or more Races | 249 | 4.2% |
| Some other Race | 85 | 1.4% |
| Total | 5,921 | 100.0% |
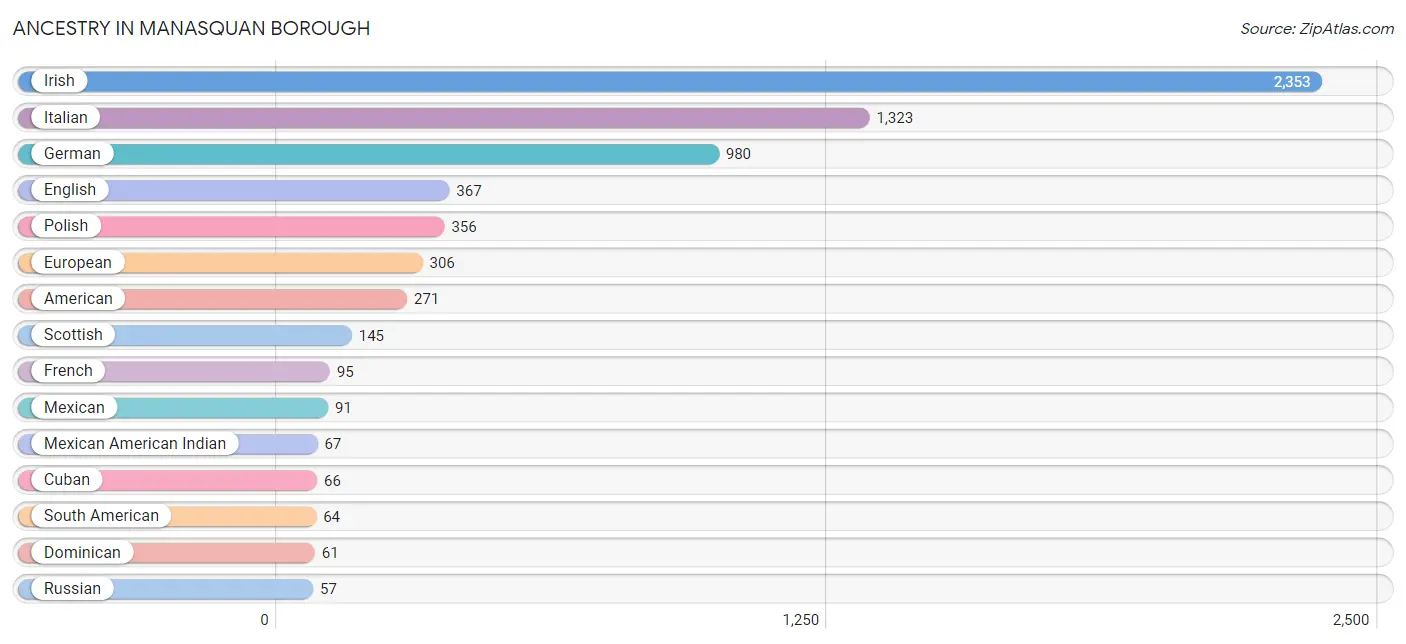
Ancestry in Manasquan borough
The most populous ancestries reported in Manasquan borough are Irish (2,353 | 39.7%), Italian (1,323 | 22.3%), German (980 | 16.6%), English (367 | 6.2%), and Polish (356 | 6.0%), together accounting for 90.8% of all Manasquan borough residents.
| Ancestry | # Population | % Population |
| African | 29 | 0.5% |
| American | 271 | 4.6% |
| Arab | 8 | 0.1% |
| Austrian | 23 | 0.4% |
| Belgian | 5 | 0.1% |
| Bhutanese | 10 | 0.2% |
| Brazilian | 12 | 0.2% |
| British | 29 | 0.5% |
| Burmese | 6 | 0.1% |
| Canadian | 27 | 0.5% |
| Celtic | 27 | 0.5% |
| Chilean | 34 | 0.6% |
| Colombian | 23 | 0.4% |
| Croatian | 37 | 0.6% |
| Cuban | 66 | 1.1% |
| Czech | 9 | 0.2% |
| Dominican | 61 | 1.0% |
| Dutch | 26 | 0.4% |
| Ecuadorian | 7 | 0.1% |
| Egyptian | 8 | 0.1% |
| English | 367 | 6.2% |
| European | 306 | 5.2% |
| Finnish | 11 | 0.2% |
| French | 95 | 1.6% |
| German | 980 | 16.6% |
| Greek | 9 | 0.2% |
| Hungarian | 21 | 0.4% |
| Indian (Asian) | 24 | 0.4% |
| Irish | 2,353 | 39.7% |
| Israeli | 6 | 0.1% |
| Italian | 1,323 | 22.3% |
| Korean | 5 | 0.1% |
| Lithuanian | 33 | 0.6% |
| Mexican | 91 | 1.5% |
| Mexican American Indian | 67 | 1.1% |
| Norwegian | 13 | 0.2% |
| Polish | 356 | 6.0% |
| Portuguese | 44 | 0.7% |
| Russian | 57 | 1.0% |
| Scandinavian | 5 | 0.1% |
| Scotch-Irish | 30 | 0.5% |
| Scottish | 145 | 2.5% |
| Slavic | 8 | 0.1% |
| Slovak | 34 | 0.6% |
| South American | 64 | 1.1% |
| Subsaharan African | 29 | 0.5% |
| Swedish | 13 | 0.2% |
| Ukrainian | 30 | 0.5% |
| Welsh | 9 | 0.2% | View All 49 Rows |
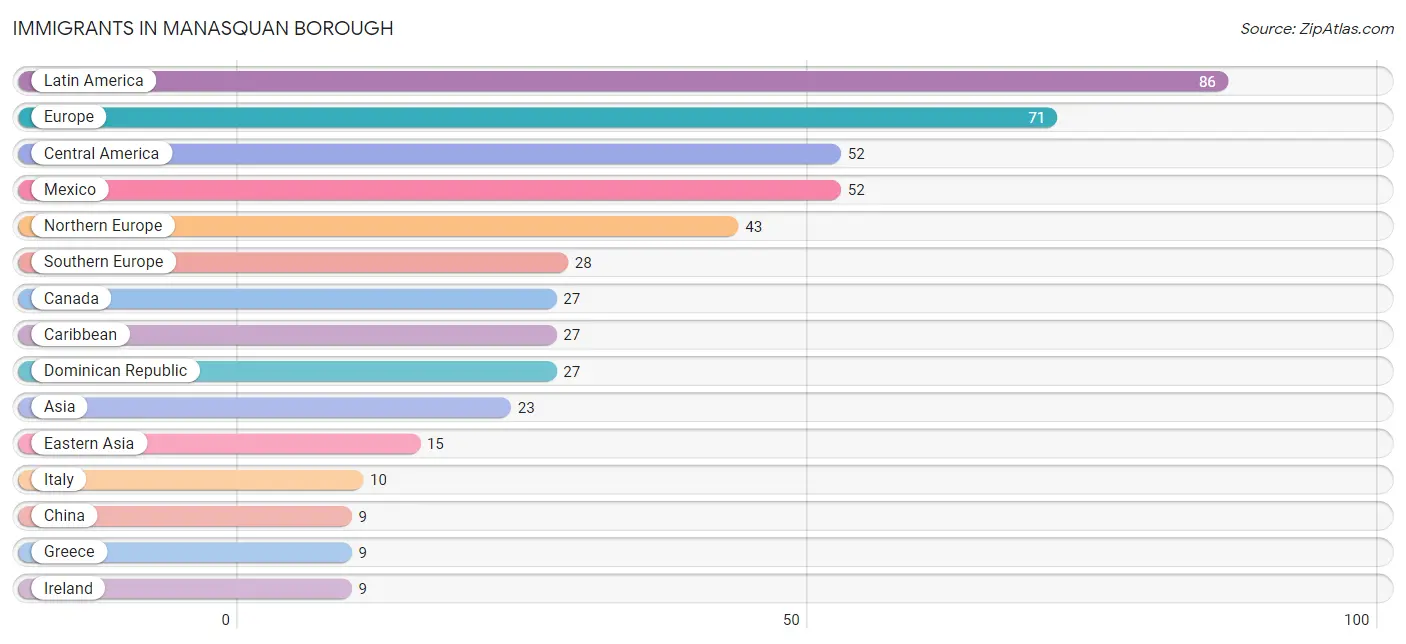
Immigrants in Manasquan borough
The most numerous immigrant groups reported in Manasquan borough came from Latin America (86 | 1.5%), Europe (71 | 1.2%), Central America (52 | 0.9%), Mexico (52 | 0.9%), and Northern Europe (43 | 0.7%), together accounting for 5.1% of all Manasquan borough residents.
| Immigration Origin | # Population | % Population |
| Asia | 23 | 0.4% |
| Canada | 27 | 0.5% |
| Caribbean | 27 | 0.5% |
| Central America | 52 | 0.9% |
| China | 9 | 0.2% |
| Dominican Republic | 27 | 0.5% |
| Eastern Asia | 15 | 0.3% |
| Ecuador | 7 | 0.1% |
| Europe | 71 | 1.2% |
| Greece | 9 | 0.2% |
| Ireland | 9 | 0.2% |
| Italy | 10 | 0.2% |
| Korea | 6 | 0.1% |
| Latin America | 86 | 1.5% |
| Mexico | 52 | 0.9% |
| Northern Europe | 43 | 0.7% |
| Portugal | 9 | 0.2% |
| South America | 7 | 0.1% |
| Southern Europe | 28 | 0.5% |
| Western Asia | 8 | 0.1% | View All 20 Rows |
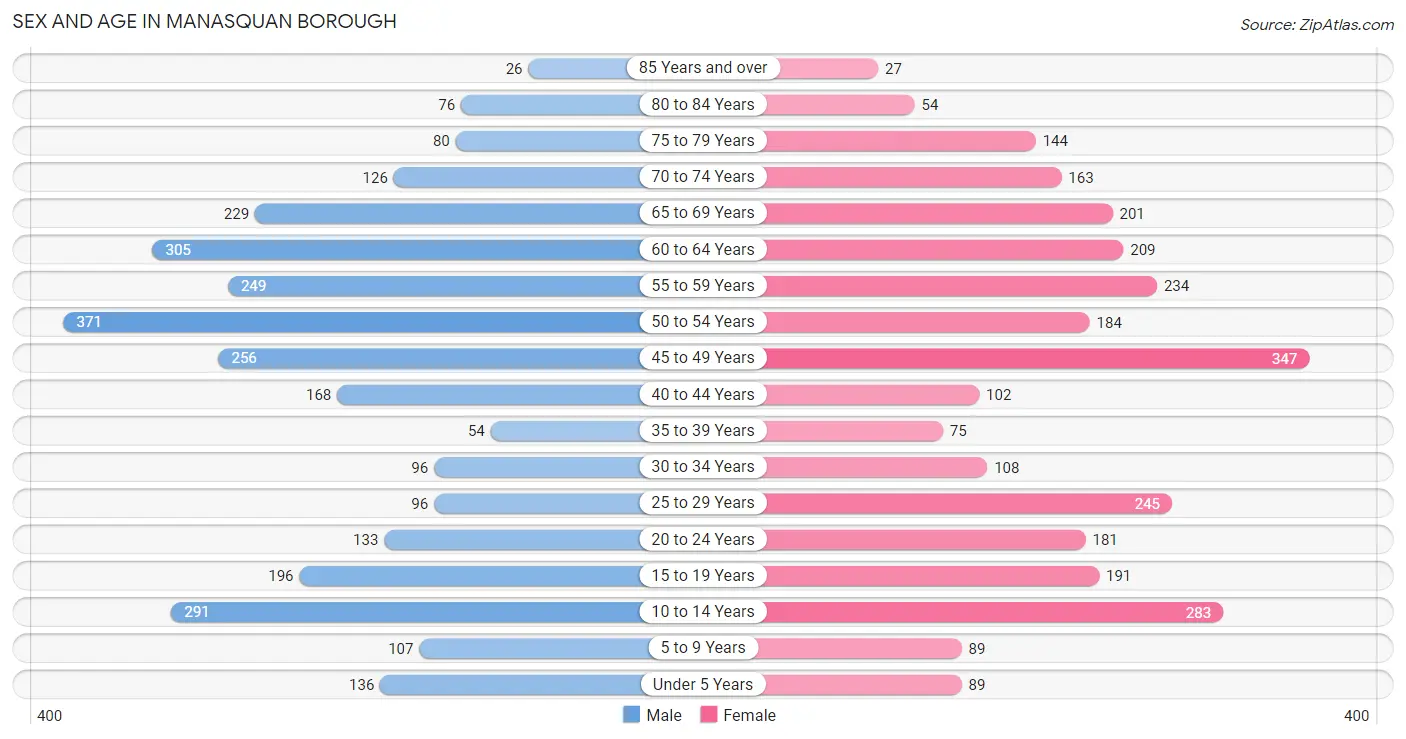
Sex and Age in Manasquan borough
Sex and Age in Manasquan borough
The most populous age groups in Manasquan borough are 50 to 54 Years (371 | 12.4%) for men and 45 to 49 Years (347 | 11.9%) for women.
| Age Bracket | Male | Female |
| Under 5 Years | 136 (4.5%) | 89 (3.0%) |
| 5 to 9 Years | 107 (3.6%) | 89 (3.0%) |
| 10 to 14 Years | 291 (9.7%) | 283 (9.7%) |
| 15 to 19 Years | 196 (6.5%) | 191 (6.5%) |
| 20 to 24 Years | 133 (4.4%) | 181 (6.2%) |
| 25 to 29 Years | 96 (3.2%) | 245 (8.4%) |
| 30 to 34 Years | 96 (3.2%) | 108 (3.7%) |
| 35 to 39 Years | 54 (1.8%) | 75 (2.6%) |
| 40 to 44 Years | 168 (5.6%) | 102 (3.5%) |
| 45 to 49 Years | 256 (8.6%) | 347 (11.9%) |
| 50 to 54 Years | 371 (12.4%) | 184 (6.3%) |
| 55 to 59 Years | 249 (8.3%) | 234 (8.0%) |
| 60 to 64 Years | 305 (10.2%) | 209 (7.1%) |
| 65 to 69 Years | 229 (7.6%) | 201 (6.9%) |
| 70 to 74 Years | 126 (4.2%) | 163 (5.6%) |
| 75 to 79 Years | 80 (2.7%) | 144 (4.9%) |
| 80 to 84 Years | 76 (2.5%) | 54 (1.8%) |
| 85 Years and over | 26 (0.9%) | 27 (0.9%) |
| Total | 2,995 (100.0%) | 2,926 (100.0%) |
Families and Households in Manasquan borough
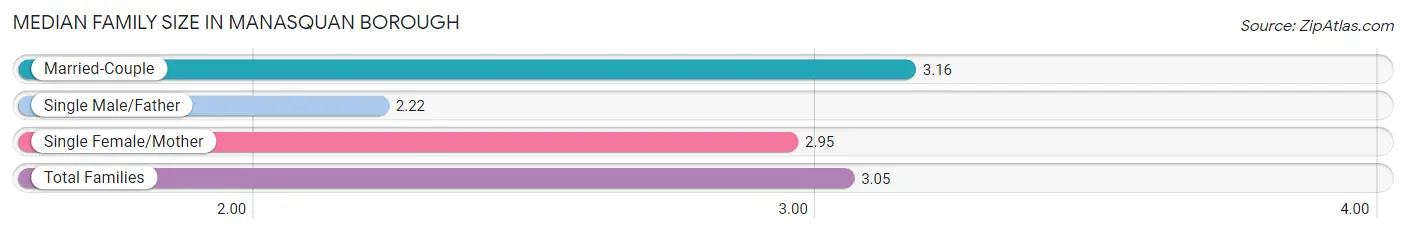
Median Family Size in Manasquan borough
The median family size in Manasquan borough is 3.05 persons per family, with married-couple families (1,336 | 83.8%) accounting for the largest median family size of 3.16 persons per family. On the other hand, single male/father families (160 | 10.0%) represent the smallest median family size with 2.22 persons per family.
| Family Type | # Families | Family Size |
| Married-Couple | 1,336 (83.8%) | 3.16 |
| Single Male/Father | 160 (10.0%) | 2.22 |
| Single Female/Mother | 98 (6.1%) | 2.95 |
| Total Families | 1,594 (100.0%) | 3.05 |
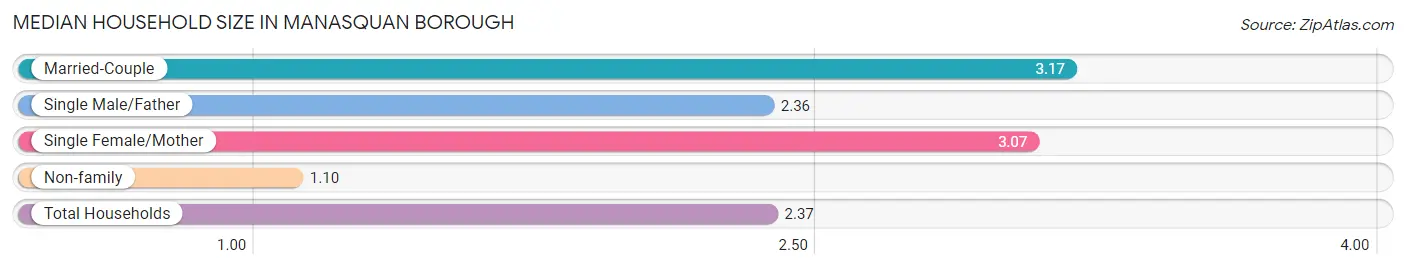
Median Household Size in Manasquan borough
The median household size in Manasquan borough is 2.37 persons per household, with married-couple households (1,336 | 53.4%) accounting for the largest median household size of 3.17 persons per household. non-family households (907 | 36.3%) represent the smallest median household size with 1.10 persons per household.
| Household Type | # Households | Household Size |
| Married-Couple | 1,336 (53.4%) | 3.17 |
| Single Male/Father | 160 (6.4%) | 2.36 |
| Single Female/Mother | 98 (3.9%) | 3.07 |
| Non-family | 907 (36.3%) | 1.10 |
| Total Households | 2,501 (100.0%) | 2.37 |
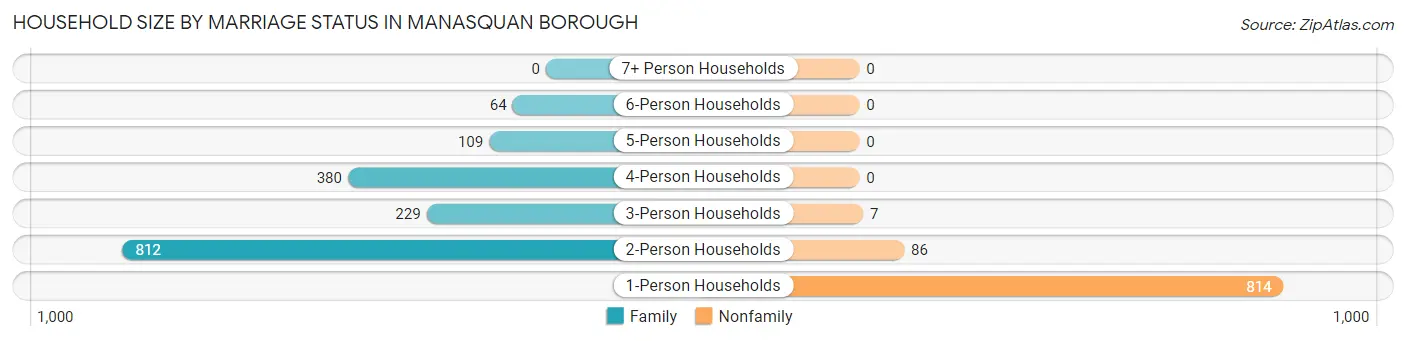
Household Size by Marriage Status in Manasquan borough
Out of a total of 2,501 households in Manasquan borough, 1,594 (63.7%) are family households, while 907 (36.3%) are nonfamily households. The most numerous type of family households are 2-person households, comprising 812, and the most common type of nonfamily households are 1-person households, comprising 814.
| Household Size | Family Households | Nonfamily Households |
| 1-Person Households | - | 814 (32.6%) |
| 2-Person Households | 812 (32.5%) | 86 (3.4%) |
| 3-Person Households | 229 (9.2%) | 7 (0.3%) |
| 4-Person Households | 380 (15.2%) | 0 (0.0%) |
| 5-Person Households | 109 (4.4%) | 0 (0.0%) |
| 6-Person Households | 64 (2.6%) | 0 (0.0%) |
| 7+ Person Households | 0 (0.0%) | 0 (0.0%) |
| Total | 1,594 (63.7%) | 907 (36.3%) |
Female Fertility in Manasquan borough
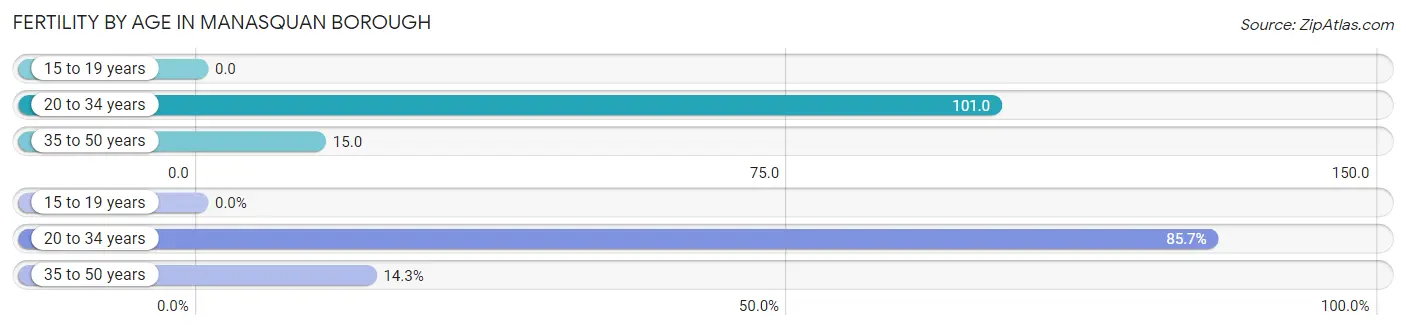
Fertility by Age in Manasquan borough
Average fertility rate in Manasquan borough is 48.0 births per 1,000 women. Women in the age bracket of 20 to 34 years have the highest fertility rate with 101.0 births per 1,000 women. Women in the age bracket of 20 to 34 years acount for 85.7% of all women with births.
| Age Bracket | Women with Births | Births / 1,000 Women |
| 15 to 19 years | 0 (0.0%) | 0.0 |
| 20 to 34 years | 54 (85.7%) | 101.0 |
| 35 to 50 years | 9 (14.3%) | 15.0 |
| Total | 63 (100.0%) | 48.0 |
Fertility by Age by Marriage Status in Manasquan borough
58.7% of women with births (63) in Manasquan borough are married. The highest percentage of unmarried women with births falls into 20 to 34 years age bracket with 48.1% of them unmarried at the time of birth, while the lowest percentage of unmarried women with births belong to 35 to 50 years age bracket with 0.0% of them unmarried.
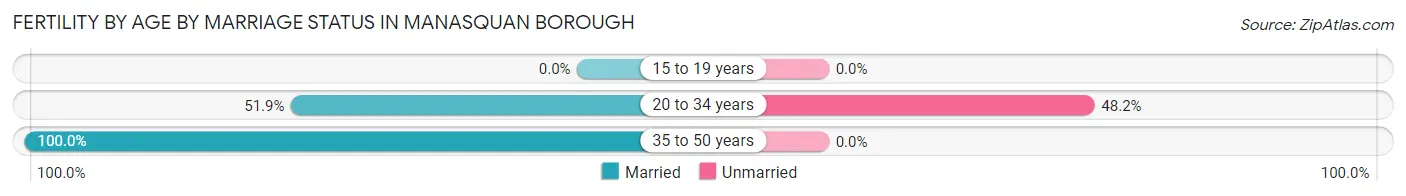
| Age Bracket | Married | Unmarried |
| 15 to 19 years | 0 (0.0%) | 0 (0.0%) |
| 20 to 34 years | 28 (51.8%) | 26 (48.1%) |
| 35 to 50 years | 9 (100.0%) | 0 (0.0%) |
| Total | 37 (58.7%) | 26 (41.3%) |
Fertility by Education in Manasquan borough
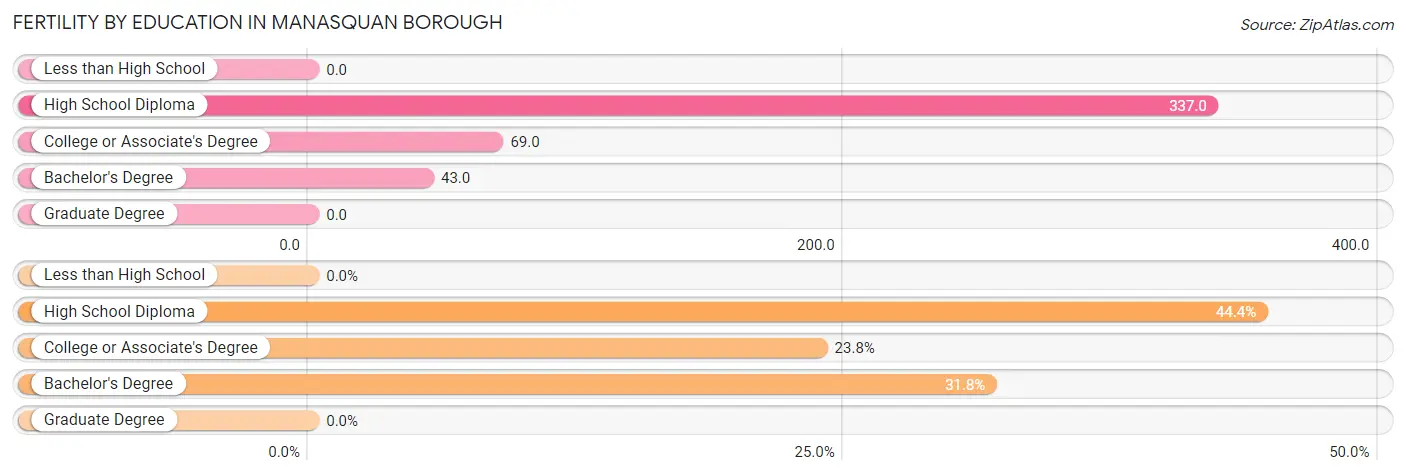
| Educational Attainment | Women with Births | Births / 1,000 Women |
| Less than High School | 0 (0.0%) | 0.0 |
| High School Diploma | 28 (44.4%) | 337.0 |
| College or Associate's Degree | 15 (23.8%) | 69.0 |
| Bachelor's Degree | 20 (31.8%) | 43.0 |
| Graduate Degree | 0 (0.0%) | 0.0 |
| Total | 63 (100.0%) | 48.0 |
Fertility by Education by Marriage Status in Manasquan borough
41.3% of women with births in Manasquan borough are unmarried. Women with the educational attainment of high school diploma are most likely to be married with 100.0% of them married at childbirth, while women with the educational attainment of college or associate's degree are least likely to be married with 100.0% of them unmarried at childbirth.
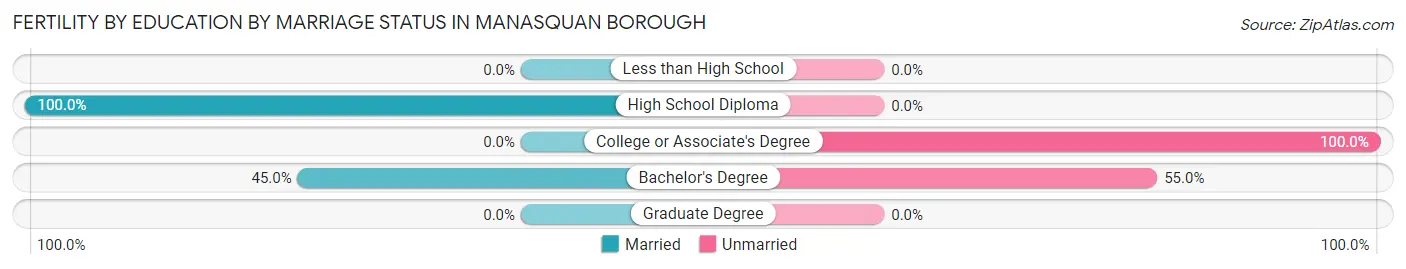
| Educational Attainment | Married | Unmarried |
| Less than High School | 0 (0.0%) | 0 (0.0%) |
| High School Diploma | 28 (100.0%) | 0 (0.0%) |
| College or Associate's Degree | 0 (0.0%) | 15 (100.0%) |
| Bachelor's Degree | 9 (45.0%) | 11 (55.0%) |
| Graduate Degree | 0 (0.0%) | 0 (0.0%) |
| Total | 37 (58.7%) | 26 (41.3%) |
Income in Manasquan borough
Income Overview in Manasquan borough
Per Capita Income in Manasquan borough is $84,708, while median incomes of families and households are $178,750 and $130,240 respectively.
| Characteristic | Number | Measure |
| Per Capita Income | 5,921 | $84,708 |
| Median Family Income | 1,594 | $178,750 |
| Mean Family Income | 1,594 | $229,530 |
| Median Household Income | 2,501 | $130,240 |
| Mean Household Income | 2,501 | $199,989 |
| Income Deficit | 1,594 | $0 |
| Wage / Income Gap (%) | 5,921 | 42.30% |
| Wage / Income Gap ($) | 5,921 | 57.70¢ per $1 |
| Gini / Inequality Index | 5,921 | 0.52 |
Earnings by Sex in Manasquan borough
Average Earnings in Manasquan borough are $66,033, $86,500 for men and $49,909 for women, a difference of 42.3%.
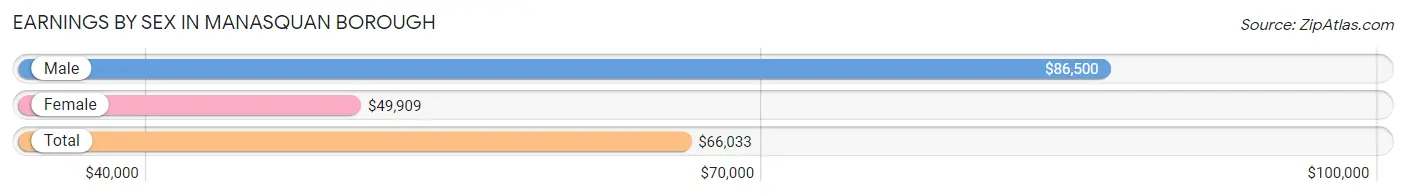
| Sex | Number | Average Earnings |
| Male | 1,812 (52.8%) | $86,500 |
| Female | 1,617 (47.2%) | $49,909 |
| Total | 3,429 (100.0%) | $66,033 |
Earnings by Sex by Income Bracket in Manasquan borough
The most common earnings brackets in Manasquan borough are $100,000+ for men (855 | 47.2%) and $100,000+ for women (452 | 28.0%).
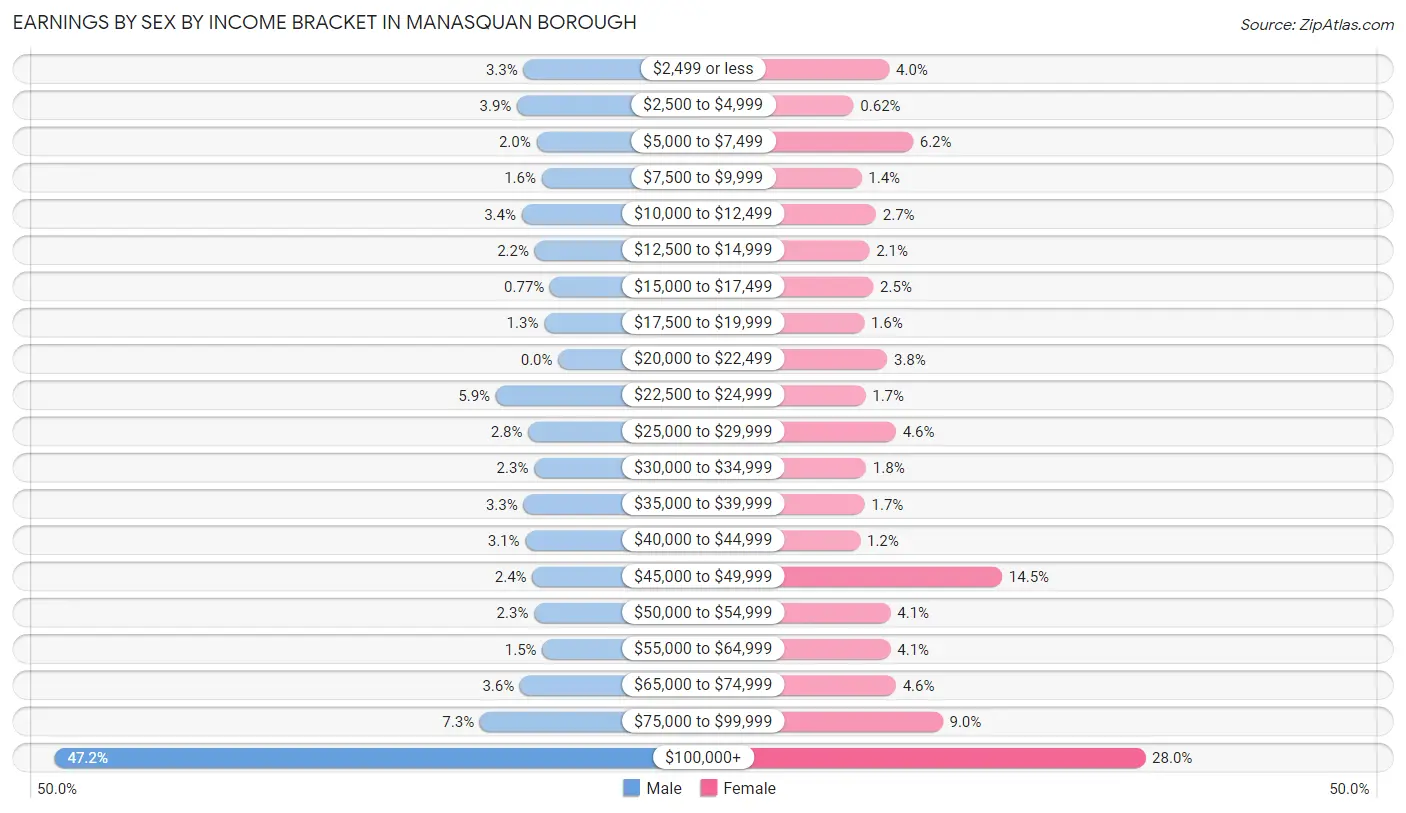
| Income | Male | Female |
| $2,499 or less | 59 (3.3%) | 64 (4.0%) |
| $2,500 to $4,999 | 70 (3.9%) | 10 (0.6%) |
| $5,000 to $7,499 | 37 (2.0%) | 100 (6.2%) |
| $7,500 to $9,999 | 28 (1.5%) | 22 (1.4%) |
| $10,000 to $12,499 | 62 (3.4%) | 44 (2.7%) |
| $12,500 to $14,999 | 40 (2.2%) | 34 (2.1%) |
| $15,000 to $17,499 | 14 (0.8%) | 40 (2.5%) |
| $17,500 to $19,999 | 24 (1.3%) | 26 (1.6%) |
| $20,000 to $22,499 | 0 (0.0%) | 61 (3.8%) |
| $22,500 to $24,999 | 106 (5.9%) | 28 (1.7%) |
| $25,000 to $29,999 | 51 (2.8%) | 74 (4.6%) |
| $30,000 to $34,999 | 41 (2.3%) | 29 (1.8%) |
| $35,000 to $39,999 | 59 (3.3%) | 27 (1.7%) |
| $40,000 to $44,999 | 56 (3.1%) | 20 (1.2%) |
| $45,000 to $49,999 | 44 (2.4%) | 235 (14.5%) |
| $50,000 to $54,999 | 41 (2.3%) | 66 (4.1%) |
| $55,000 to $64,999 | 27 (1.5%) | 66 (4.1%) |
| $65,000 to $74,999 | 65 (3.6%) | 74 (4.6%) |
| $75,000 to $99,999 | 133 (7.3%) | 145 (9.0%) |
| $100,000+ | 855 (47.2%) | 452 (28.0%) |
| Total | 1,812 (100.0%) | 1,617 (100.0%) |
Earnings by Sex by Educational Attainment in Manasquan borough
Average earnings in Manasquan borough are $105,852 for men and $63,860 for women, a difference of 39.7%. Men with an educational attainment of graduate degree enjoy the highest average annual earnings of $145,982, while those with high school diploma education earn the least with $61,705. Women with an educational attainment of college or associate's degree earn the most with the average annual earnings of $87,841, while those with high school diploma education have the smallest earnings of $30,139.
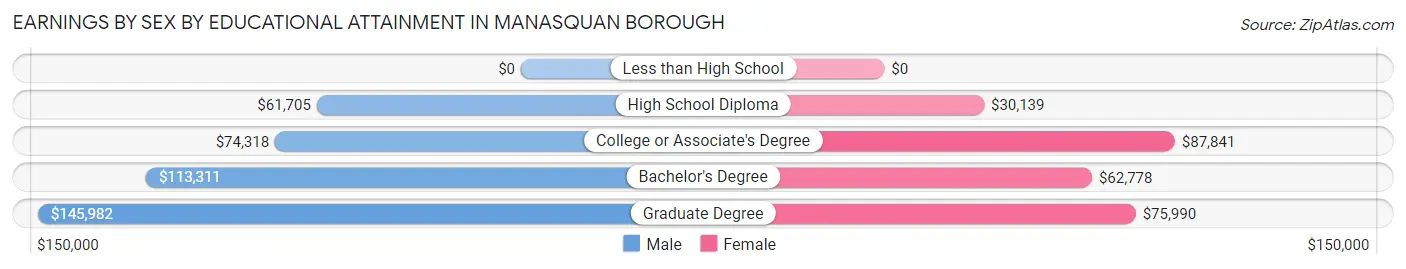
| Educational Attainment | Male Income | Female Income |
| Less than High School | - | - |
| High School Diploma | $61,705 | $30,139 |
| College or Associate's Degree | $74,318 | $87,841 |
| Bachelor's Degree | $113,311 | $62,778 |
| Graduate Degree | $145,982 | $75,990 |
| Total | $105,852 | $63,860 |
Family Income in Manasquan borough
Family Income Brackets in Manasquan borough
According to the Manasquan borough family income data, there are 673 families falling into the $200,000+ income range, which is the most common income bracket and makes up 42.2% of all families.
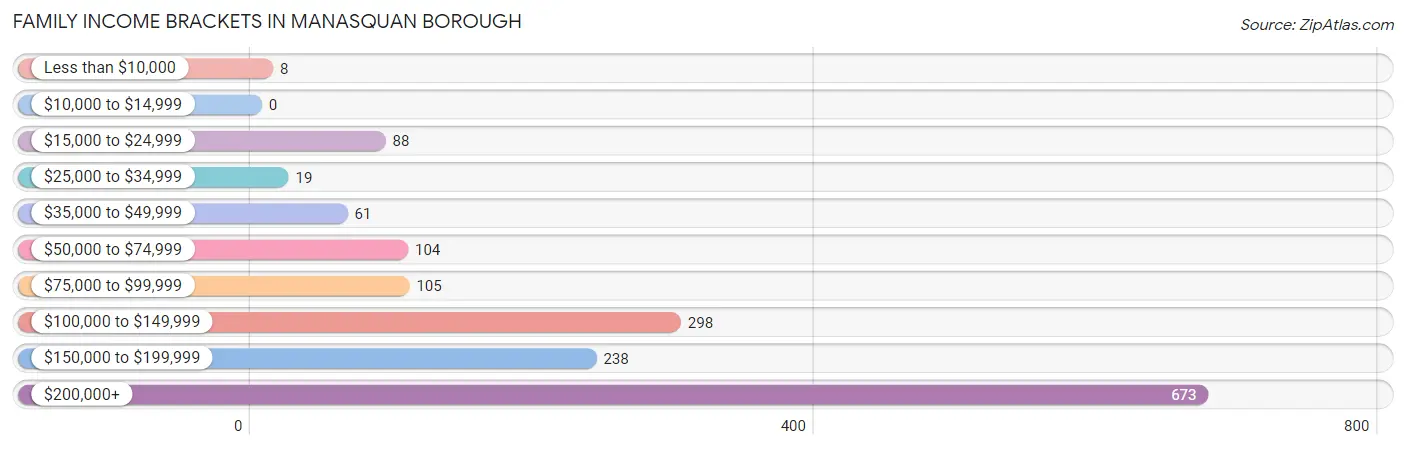
| Income Bracket | # Families | % Families |
| Less than $10,000 | 8 | 0.5% |
| $10,000 to $14,999 | 0 | 0.0% |
| $15,000 to $24,999 | 88 | 5.5% |
| $25,000 to $34,999 | 19 | 1.2% |
| $35,000 to $49,999 | 61 | 3.8% |
| $50,000 to $74,999 | 104 | 6.5% |
| $75,000 to $99,999 | 105 | 6.6% |
| $100,000 to $149,999 | 298 | 18.7% |
| $150,000 to $199,999 | 238 | 14.9% |
| $200,000+ | 673 | 42.2% |
Family Income by Famaliy Size in Manasquan borough
6-person families (64 | 4.0%) account for the highest median family income in Manasquan borough with $250,001 per family, while 2-person families (839 | 52.6%) have the highest median income of $63,462 per family member.
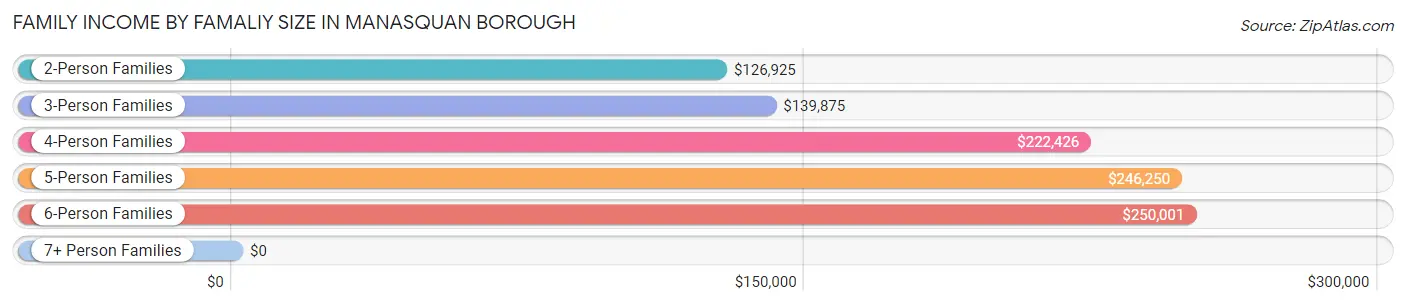
| Income Bracket | # Families | Median Income |
| 2-Person Families | 839 (52.6%) | $126,925 |
| 3-Person Families | 223 (14.0%) | $139,875 |
| 4-Person Families | 359 (22.5%) | $222,426 |
| 5-Person Families | 109 (6.8%) | $246,250 |
| 6-Person Families | 64 (4.0%) | $250,001 |
| 7+ Person Families | 0 (0.0%) | $0 |
| Total | 1,594 (100.0%) | $178,750 |
Family Income by Number of Earners in Manasquan borough
The median family income in Manasquan borough is $178,750, with families comprising 3+ earners (277) having the highest median family income of $246,442, while families with 1 earner (418) have the lowest median family income of $106,974, accounting for 17.4% and 26.2% of families, respectively.
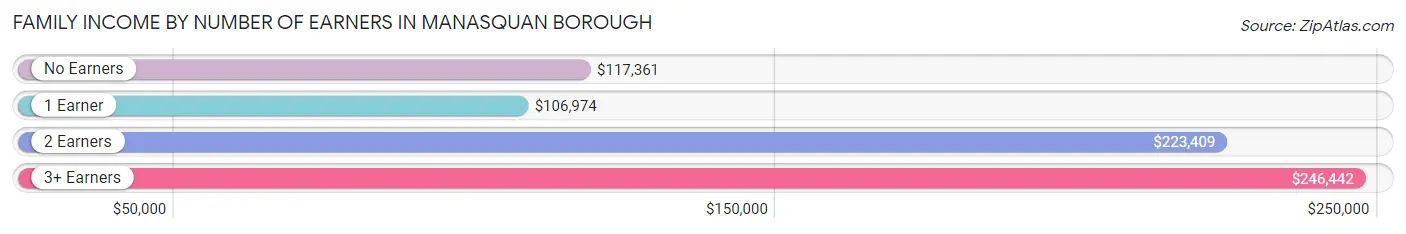
| Number of Earners | # Families | Median Income |
| No Earners | 255 (16.0%) | $117,361 |
| 1 Earner | 418 (26.2%) | $106,974 |
| 2 Earners | 644 (40.4%) | $223,409 |
| 3+ Earners | 277 (17.4%) | $246,442 |
| Total | 1,594 (100.0%) | $178,750 |
Household Income in Manasquan borough
Household Income Brackets in Manasquan borough
With 785 households falling in the category, the $200,000+ income range is the most frequent in Manasquan borough, accounting for 31.4% of all households.
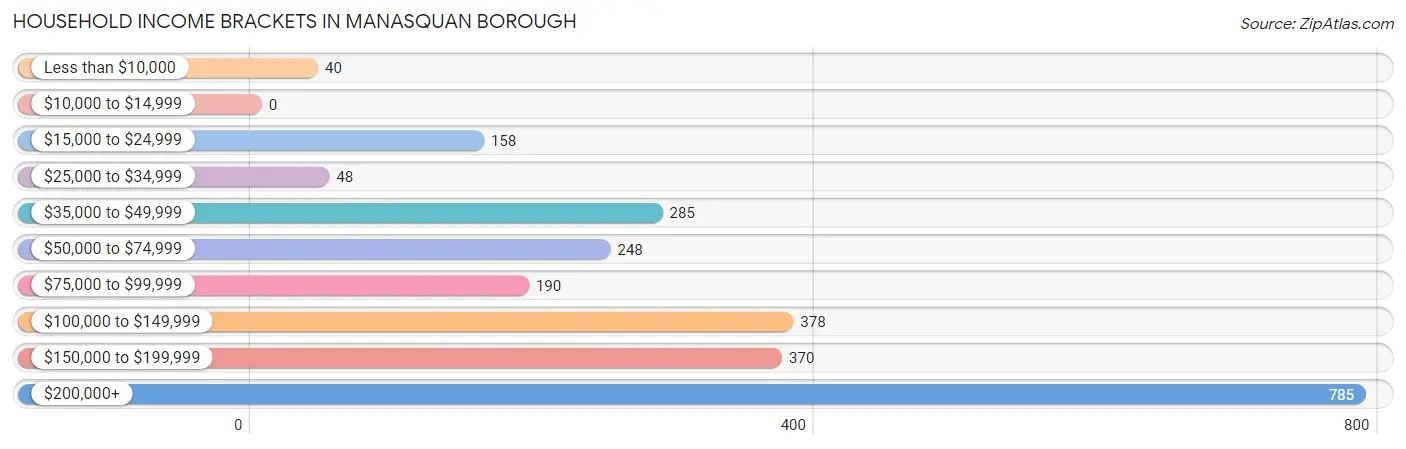
| Income Bracket | # Households | % Households |
| Less than $10,000 | 40 | 1.6% |
| $10,000 to $14,999 | 0 | 0.0% |
| $15,000 to $24,999 | 158 | 6.3% |
| $25,000 to $34,999 | 48 | 1.9% |
| $35,000 to $49,999 | 285 | 11.4% |
| $50,000 to $74,999 | 248 | 9.9% |
| $75,000 to $99,999 | 190 | 7.6% |
| $100,000 to $149,999 | 378 | 15.1% |
| $150,000 to $199,999 | 370 | 14.8% |
| $200,000+ | 785 | 31.4% |
Household Income by Householder Age in Manasquan borough
The median household income in Manasquan borough is $130,240, with the highest median household income of $159,926 found in the 45 to 64 years age bracket for the primary householder. A total of 1,355 households (54.2%) fall into this category.
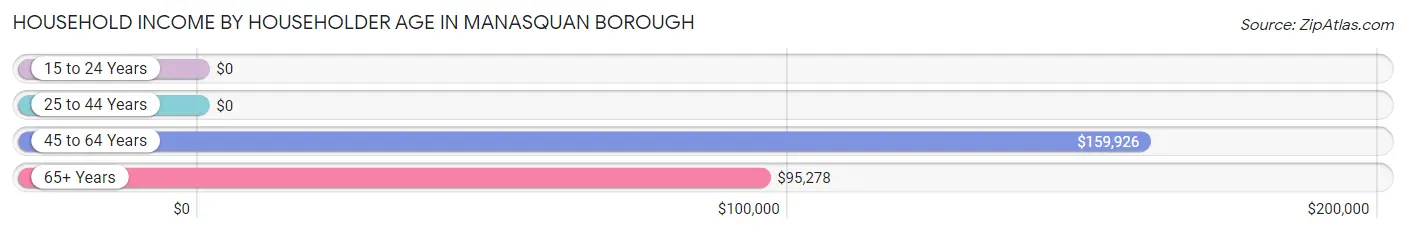
| Income Bracket | # Households | Median Income |
| 15 to 24 Years | 0 (0.0%) | $0 |
| 25 to 44 Years | 416 (16.6%) | $0 |
| 45 to 64 Years | 1,355 (54.2%) | $159,926 |
| 65+ Years | 730 (29.2%) | $95,278 |
| Total | 2,501 (100.0%) | $130,240 |
Poverty in Manasquan borough
Income Below Poverty by Sex and Age in Manasquan borough
With 1.6% poverty level for males and 2.8% for females among the residents of Manasquan borough, 75 year old and over males and 75 year old and over females are the most vulnerable to poverty, with 13 males (7.1%) and 16 females (7.1%) in their respective age groups living below the poverty level.
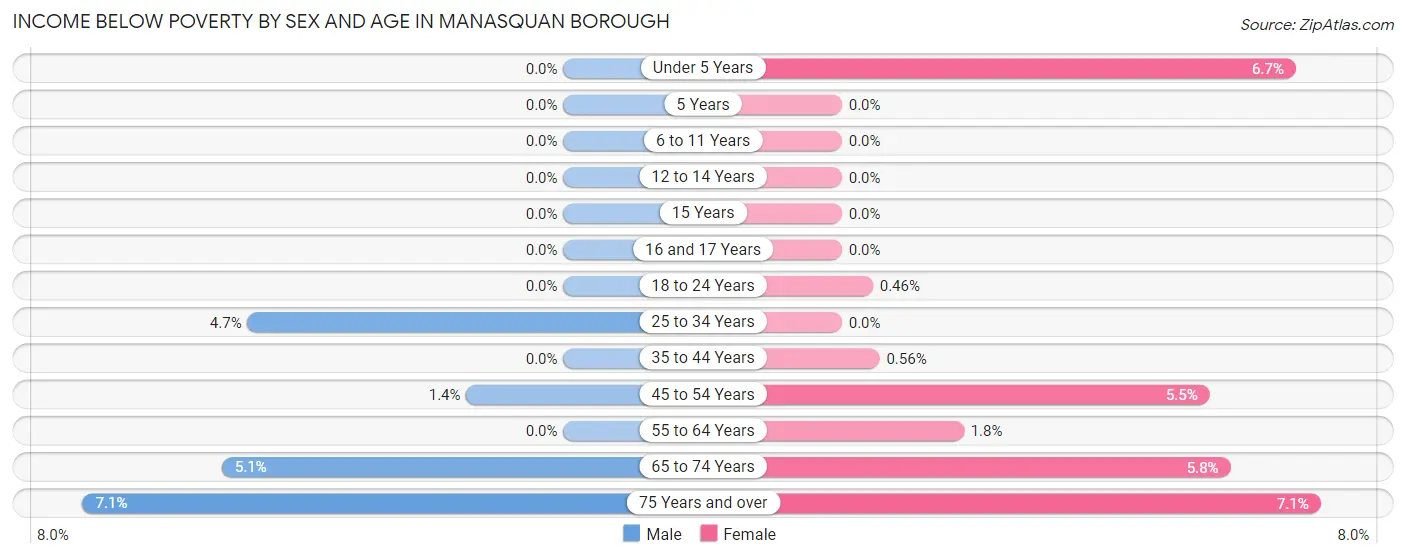
| Age Bracket | Male | Female |
| Under 5 Years | 0 (0.0%) | 6 (6.7%) |
| 5 Years | 0 (0.0%) | 0 (0.0%) |
| 6 to 11 Years | 0 (0.0%) | 0 (0.0%) |
| 12 to 14 Years | 0 (0.0%) | 0 (0.0%) |
| 15 Years | 0 (0.0%) | 0 (0.0%) |
| 16 and 17 Years | 0 (0.0%) | 0 (0.0%) |
| 18 to 24 Years | 0 (0.0%) | 1 (0.5%) |
| 25 to 34 Years | 9 (4.7%) | 0 (0.0%) |
| 35 to 44 Years | 0 (0.0%) | 1 (0.6%) |
| 45 to 54 Years | 9 (1.4%) | 29 (5.5%) |
| 55 to 64 Years | 0 (0.0%) | 8 (1.8%) |
| 65 to 74 Years | 18 (5.1%) | 21 (5.8%) |
| 75 Years and over | 13 (7.1%) | 16 (7.1%) |
| Total | 49 (1.6%) | 82 (2.8%) |
Income Above Poverty by Sex and Age in Manasquan borough
According to the poverty statistics in Manasquan borough, males aged under 5 years and females aged 6 to 11 years are the age groups that are most secure financially, with 100.0% of males and 100.0% of females in these age groups living above the poverty line.
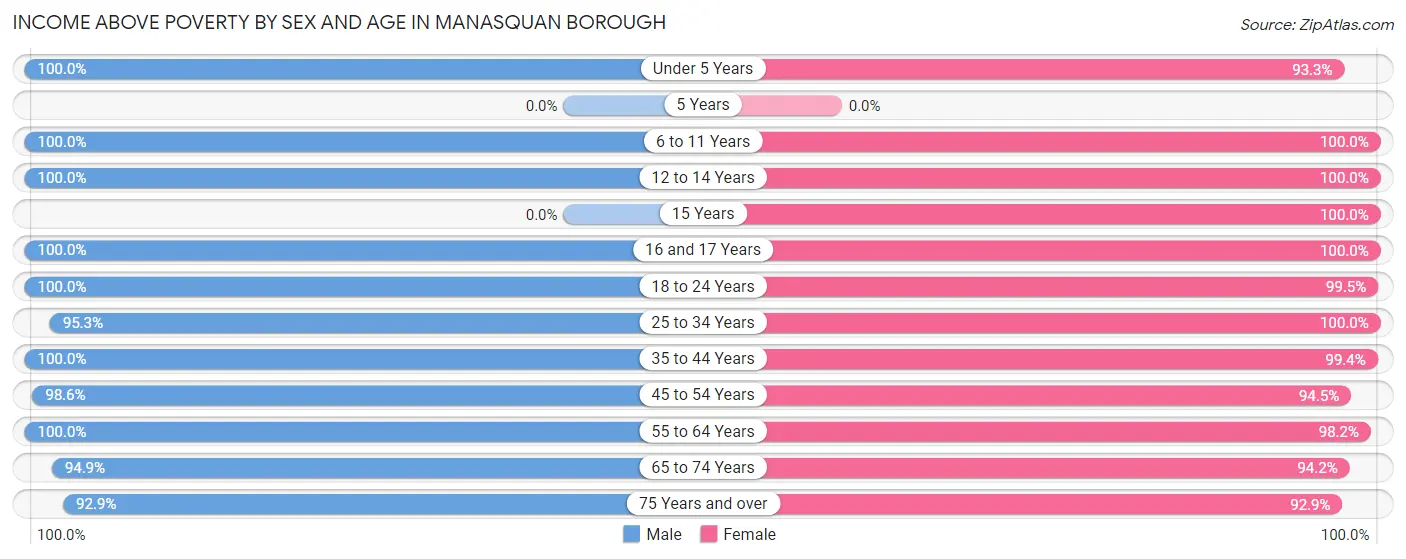
| Age Bracket | Male | Female |
| Under 5 Years | 136 (100.0%) | 83 (93.3%) |
| 5 Years | 0 (0.0%) | 0 (0.0%) |
| 6 to 11 Years | 226 (100.0%) | 203 (100.0%) |
| 12 to 14 Years | 172 (100.0%) | 169 (100.0%) |
| 15 Years | 0 (0.0%) | 76 (100.0%) |
| 16 and 17 Years | 148 (100.0%) | 79 (100.0%) |
| 18 to 24 Years | 181 (100.0%) | 216 (99.5%) |
| 25 to 34 Years | 183 (95.3%) | 353 (100.0%) |
| 35 to 44 Years | 222 (100.0%) | 176 (99.4%) |
| 45 to 54 Years | 618 (98.6%) | 502 (94.5%) |
| 55 to 64 Years | 554 (100.0%) | 435 (98.2%) |
| 65 to 74 Years | 337 (94.9%) | 343 (94.2%) |
| 75 Years and over | 169 (92.9%) | 209 (92.9%) |
| Total | 2,946 (98.4%) | 2,844 (97.2%) |
Income Below Poverty Among Married-Couple Families in Manasquan borough
The poverty statistics for married-couple families in Manasquan borough show that 1.7% or 23 of the total 1,336 families live below the poverty line. Families with no children have the highest poverty rate of 2.7%, comprising of 23 families. On the other hand, families with 1 or 2 children have the lowest poverty rate of 0.0%, which includes 0 families.
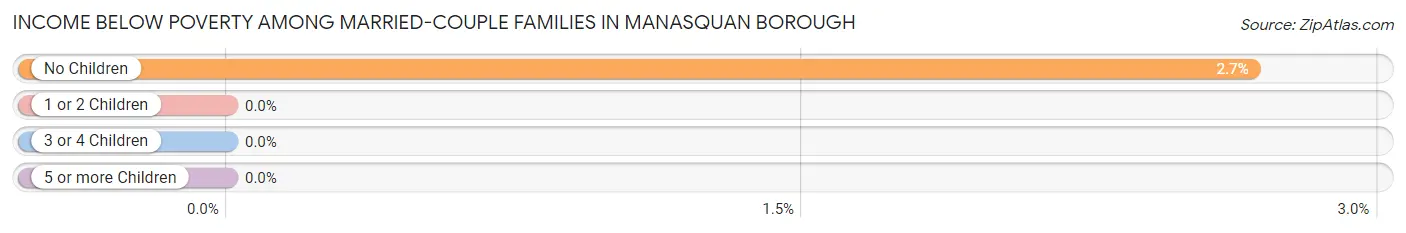
| Children | Above Poverty | Below Poverty |
| No Children | 838 (97.3%) | 23 (2.7%) |
| 1 or 2 Children | 340 (100.0%) | 0 (0.0%) |
| 3 or 4 Children | 135 (100.0%) | 0 (0.0%) |
| 5 or more Children | 0 (0.0%) | 0 (0.0%) |
| Total | 1,313 (98.3%) | 23 (1.7%) |
Income Below Poverty Among Single-Parent Households in Manasquan borough
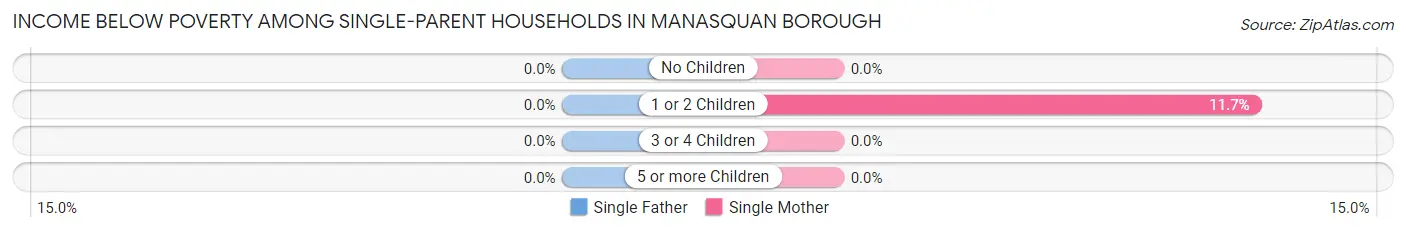
| Children | Single Father | Single Mother |
| No Children | 0 (0.0%) | 0 (0.0%) |
| 1 or 2 Children | 0 (0.0%) | 7 (11.7%) |
| 3 or 4 Children | 0 (0.0%) | 0 (0.0%) |
| 5 or more Children | 0 (0.0%) | 0 (0.0%) |
| Total | 0 (0.0%) | 7 (7.1%) |
Income Below Poverty Among Married-Couple vs Single-Parent Households in Manasquan borough
The poverty data for Manasquan borough shows that 23 of the married-couple family households (1.7%) and 7 of the single-parent households (2.7%) are living below the poverty level. Within the married-couple family households, those with no children have the highest poverty rate, with 23 households (2.7%) falling below the poverty line. Among the single-parent households, those with 1 or 2 children have the highest poverty rate, with 7 household (5.1%) living below poverty.
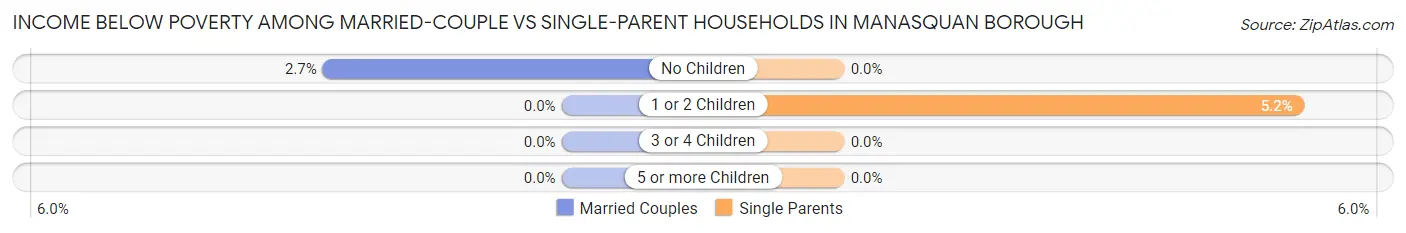
| Children | Married-Couple Families | Single-Parent Households |
| No Children | 23 (2.7%) | 0 (0.0%) |
| 1 or 2 Children | 0 (0.0%) | 7 (5.1%) |
| 3 or 4 Children | 0 (0.0%) | 0 (0.0%) |
| 5 or more Children | 0 (0.0%) | 0 (0.0%) |
| Total | 23 (1.7%) | 7 (2.7%) |
Employment Characteristics in Manasquan borough
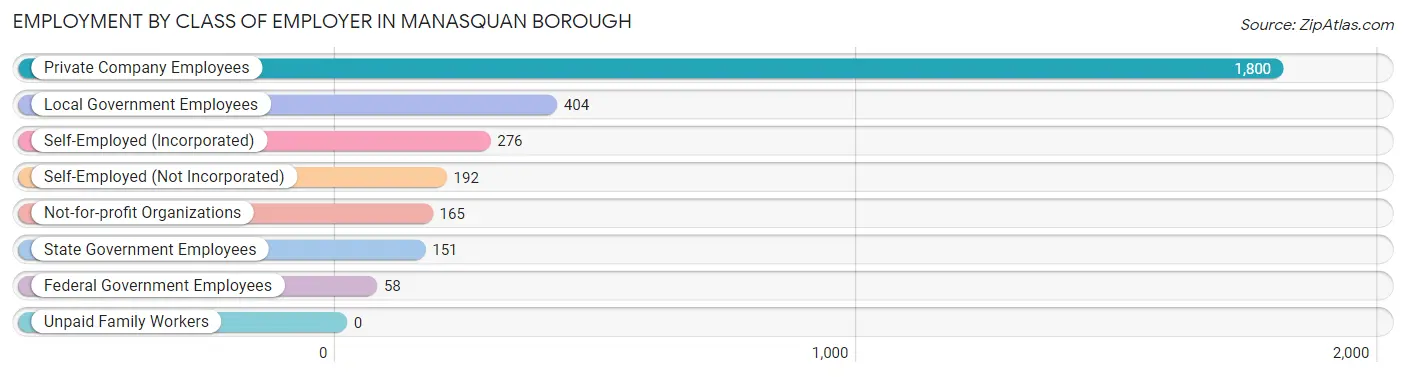
Employment by Class of Employer in Manasquan borough
Among the 3,046 employed individuals in Manasquan borough, private company employees (1,800 | 59.1%), local government employees (404 | 13.3%), and self-employed (incorporated) (276 | 9.1%) make up the most common classes of employment.
| Employer Class | # Employees | % Employees |
| Private Company Employees | 1,800 | 59.1% |
| Self-Employed (Incorporated) | 276 | 9.1% |
| Self-Employed (Not Incorporated) | 192 | 6.3% |
| Not-for-profit Organizations | 165 | 5.4% |
| Local Government Employees | 404 | 13.3% |
| State Government Employees | 151 | 5.0% |
| Federal Government Employees | 58 | 1.9% |
| Unpaid Family Workers | 0 | 0.0% |
| Total | 3,046 | 100.0% |
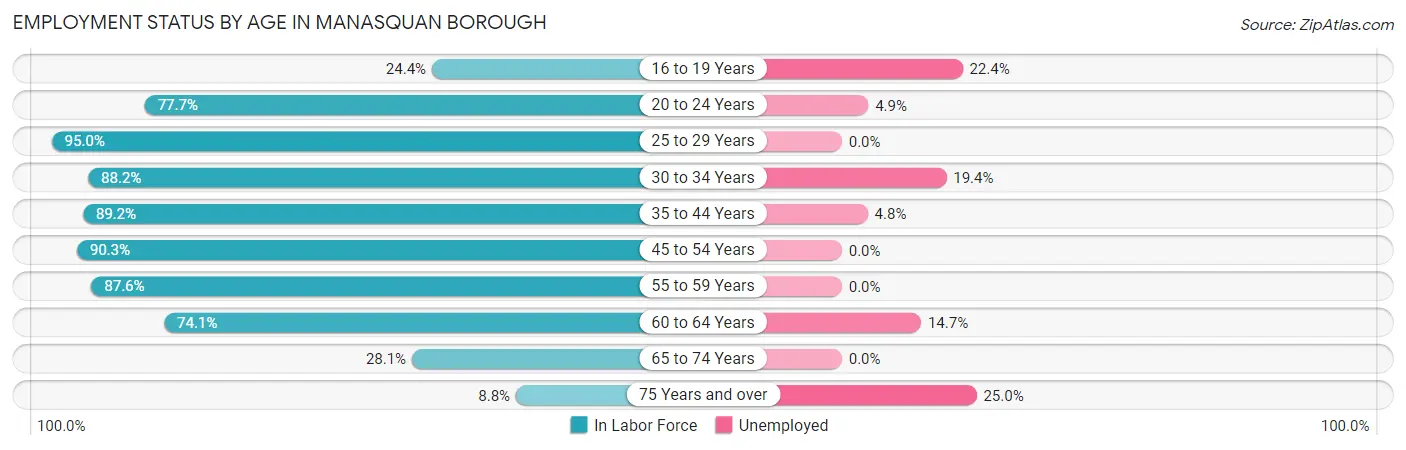
Employment Status by Age in Manasquan borough
According to the labor force statistics for Manasquan borough, out of the total population over 16 years of age (4,850), 67.4% or 3,269 individuals are in the labor force, with 4.5% or 147 of them unemployed. The age group with the highest labor force participation rate is 25 to 29 years, with 95.0% or 324 individuals in the labor force. Within the labor force, the 75 years and over age range has the highest percentage of unemployed individuals, with 25.0% or 9 of them being unemployed.
| Age Bracket | In Labor Force | Unemployed |
| 16 to 19 Years | 76 (24.4%) | 17 (22.4%) |
| 20 to 24 Years | 244 (77.7%) | 12 (4.9%) |
| 25 to 29 Years | 324 (95.0%) | 0 (0.0%) |
| 30 to 34 Years | 180 (88.2%) | 35 (19.4%) |
| 35 to 44 Years | 356 (89.2%) | 17 (4.8%) |
| 45 to 54 Years | 1,046 (90.3%) | 0 (0.0%) |
| 55 to 59 Years | 423 (87.6%) | 0 (0.0%) |
| 60 to 64 Years | 381 (74.1%) | 56 (14.7%) |
| 65 to 74 Years | 202 (28.1%) | 0 (0.0%) |
| 75 Years and over | 36 (8.8%) | 9 (25.0%) |
| Total | 3,269 (67.4%) | 147 (4.5%) |
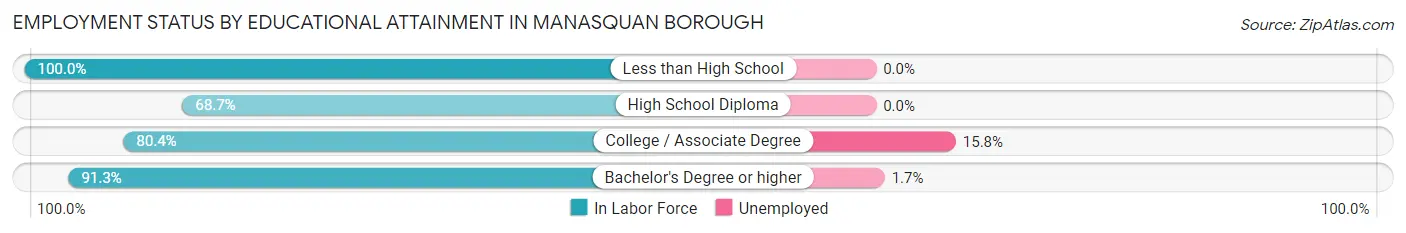
Employment Status by Educational Attainment in Manasquan borough
According to labor force statistics for Manasquan borough, 87.4% of individuals (2,709) out of the total population between 25 and 64 years of age (3,099) are in the labor force, with 4.0% or 108 of them being unemployed. The group with the highest labor force participation rate are those with the educational attainment of less than high school, with 100.0% or 11 individuals in the labor force. Within the labor force, individuals with college / associate degree education have the highest percentage of unemployment, with 15.8% or 72 of them being unemployed.
| Educational Attainment | In Labor Force | Unemployed |
| Less than High School | 11 (100.0%) | 0 (0.0%) |
| High School Diploma | 180 (68.7%) | 0 (0.0%) |
| College / Associate Degree | 455 (80.4%) | 89 (15.8%) |
| Bachelor's Degree or higher | 2,063 (91.3%) | 38 (1.7%) |
| Total | 2,709 (87.4%) | 124 (4.0%) |
Employment Occupations by Sex in Manasquan borough
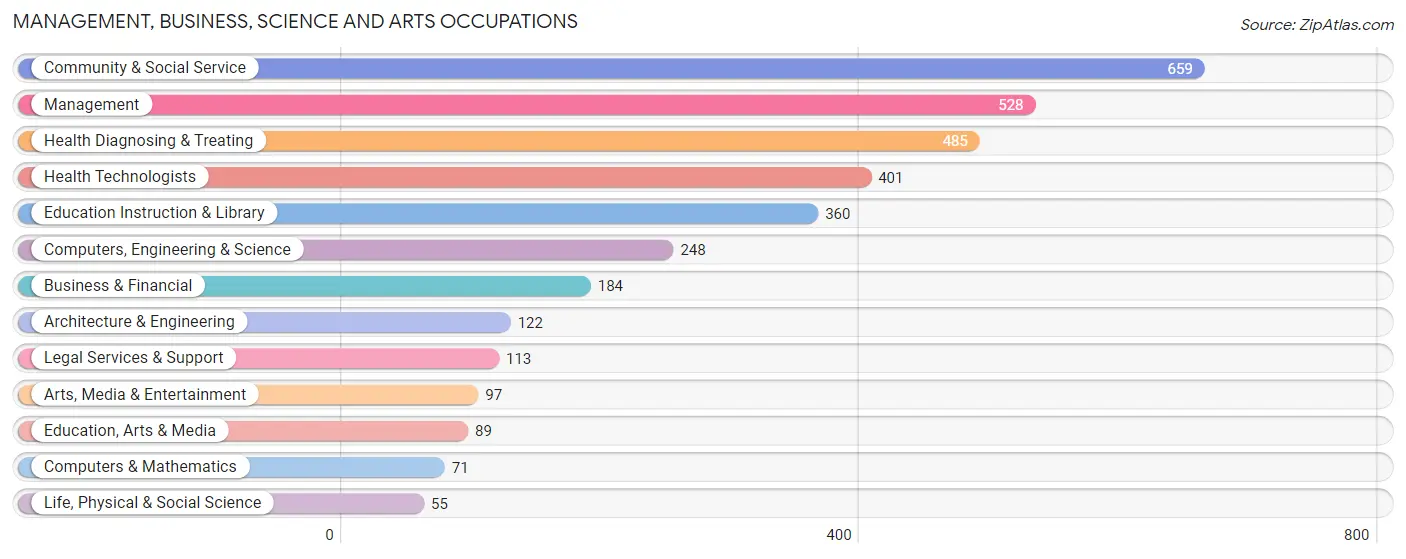
Management, Business, Science and Arts Occupations
The most common Management, Business, Science and Arts occupations in Manasquan borough are Community & Social Service (659 | 21.1%), Management (528 | 16.9%), Health Diagnosing & Treating (485 | 15.5%), Health Technologists (401 | 12.8%), and Education Instruction & Library (360 | 11.5%).
Management, Business, Science and Arts Occupations by Sex
Within the Management, Business, Science and Arts occupations in Manasquan borough, the most male-oriented occupations are Architecture & Engineering (93.4%), Business & Financial (70.1%), and Management (69.1%), while the most female-oriented occupations are Health Technologists (89.5%), Health Diagnosing & Treating (87.6%), and Life, Physical & Social Science (81.8%).
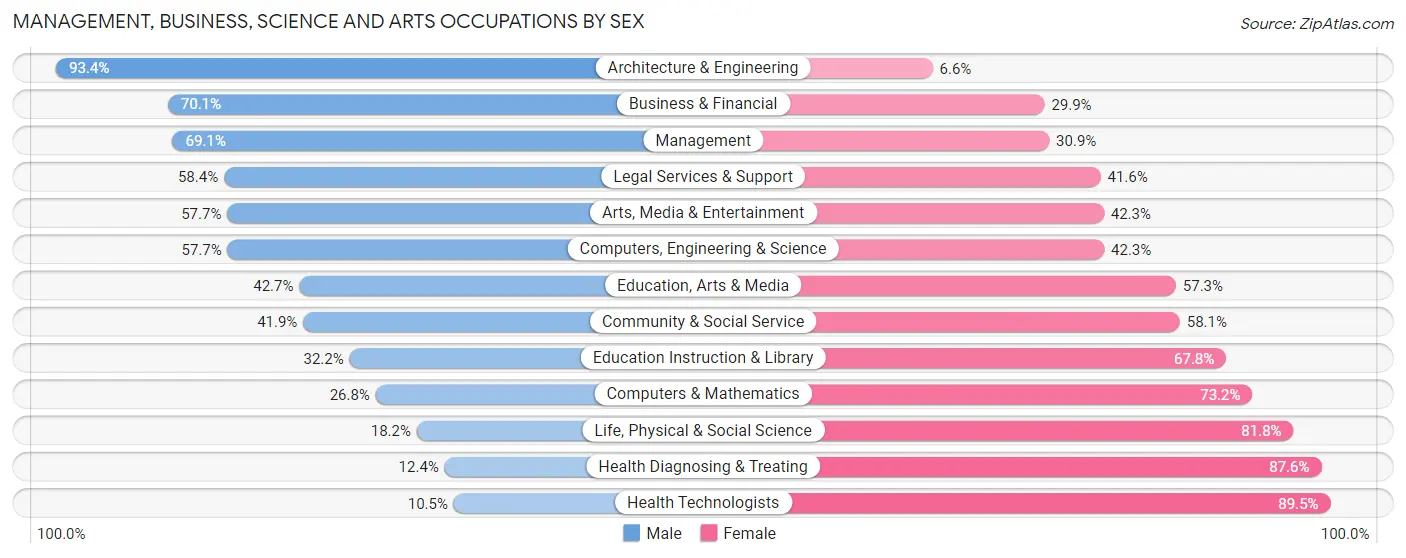
| Occupation | Male | Female |
| Management | 365 (69.1%) | 163 (30.9%) |
| Business & Financial | 129 (70.1%) | 55 (29.9%) |
| Computers, Engineering & Science | 143 (57.7%) | 105 (42.3%) |
| Computers & Mathematics | 19 (26.8%) | 52 (73.2%) |
| Architecture & Engineering | 114 (93.4%) | 8 (6.6%) |
| Life, Physical & Social Science | 10 (18.2%) | 45 (81.8%) |
| Community & Social Service | 276 (41.9%) | 383 (58.1%) |
| Education, Arts & Media | 38 (42.7%) | 51 (57.3%) |
| Legal Services & Support | 66 (58.4%) | 47 (41.6%) |
| Education Instruction & Library | 116 (32.2%) | 244 (67.8%) |
| Arts, Media & Entertainment | 56 (57.7%) | 41 (42.3%) |
| Health Diagnosing & Treating | 60 (12.4%) | 425 (87.6%) |
| Health Technologists | 42 (10.5%) | 359 (89.5%) |
| Total (Category) | 973 (46.3%) | 1,131 (53.7%) |
| Total (Overall) | 1,622 (51.9%) | 1,500 (48.0%) |
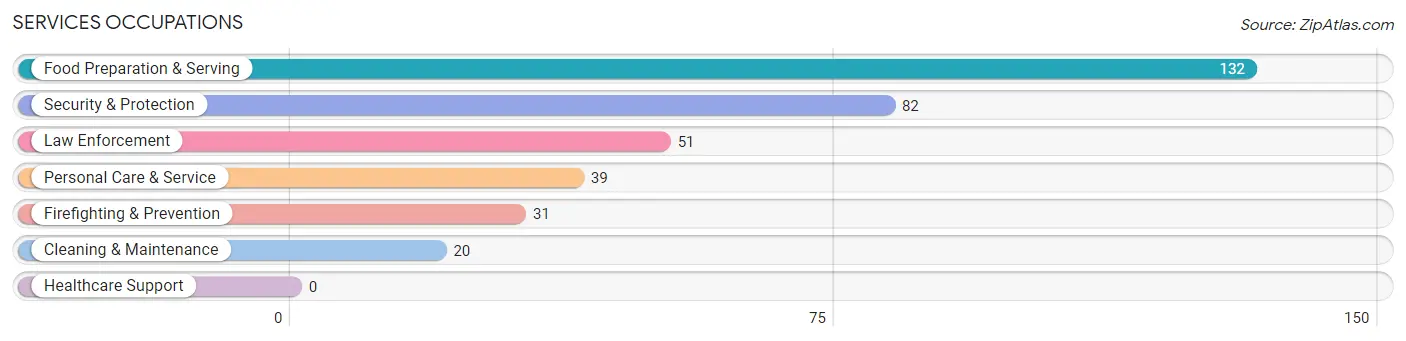
Services Occupations
The most common Services occupations in Manasquan borough are Food Preparation & Serving (132 | 4.2%), Security & Protection (82 | 2.6%), Law Enforcement (51 | 1.6%), Personal Care & Service (39 | 1.3%), and Firefighting & Prevention (31 | 1.0%).
Services Occupations by Sex
Within the Services occupations in Manasquan borough, the most male-oriented occupations are Security & Protection (100.0%), Firefighting & Prevention (100.0%), and Law Enforcement (100.0%), while the most female-oriented occupations are Personal Care & Service (87.2%), Cleaning & Maintenance (75.0%), and Food Preparation & Serving (43.2%).
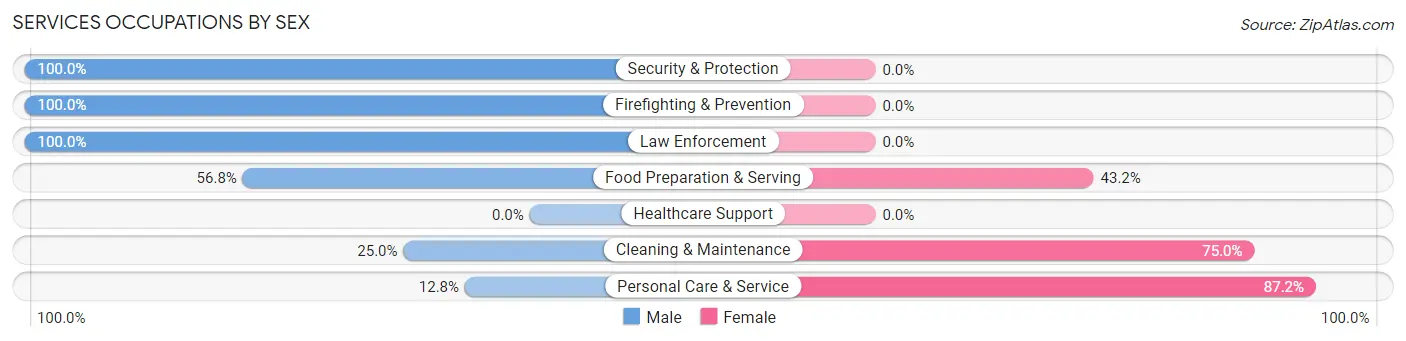
| Occupation | Male | Female |
| Healthcare Support | 0 (0.0%) | 0 (0.0%) |
| Security & Protection | 82 (100.0%) | 0 (0.0%) |
| Firefighting & Prevention | 31 (100.0%) | 0 (0.0%) |
| Law Enforcement | 51 (100.0%) | 0 (0.0%) |
| Food Preparation & Serving | 75 (56.8%) | 57 (43.2%) |
| Cleaning & Maintenance | 5 (25.0%) | 15 (75.0%) |
| Personal Care & Service | 5 (12.8%) | 34 (87.2%) |
| Total (Category) | 167 (61.2%) | 106 (38.8%) |
| Total (Overall) | 1,622 (51.9%) | 1,500 (48.0%) |
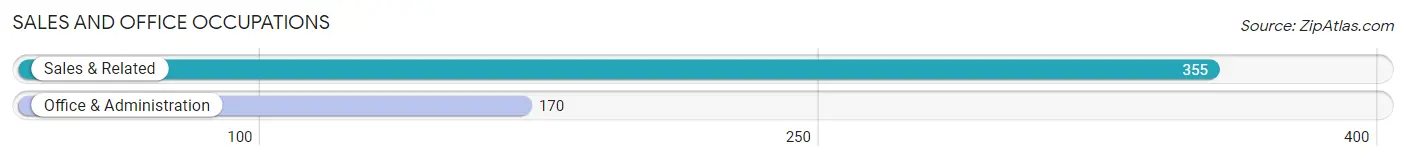
Sales and Office Occupations
The most common Sales and Office occupations in Manasquan borough are Sales & Related (355 | 11.4%), and Office & Administration (170 | 5.4%).
Sales and Office Occupations by Sex
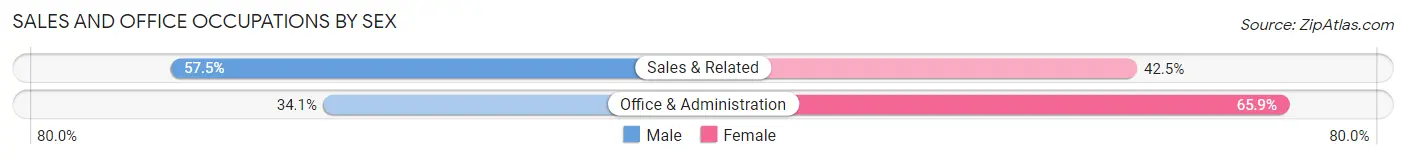
| Occupation | Male | Female |
| Sales & Related | 204 (57.5%) | 151 (42.5%) |
| Office & Administration | 58 (34.1%) | 112 (65.9%) |
| Total (Category) | 262 (49.9%) | 263 (50.1%) |
| Total (Overall) | 1,622 (51.9%) | 1,500 (48.0%) |
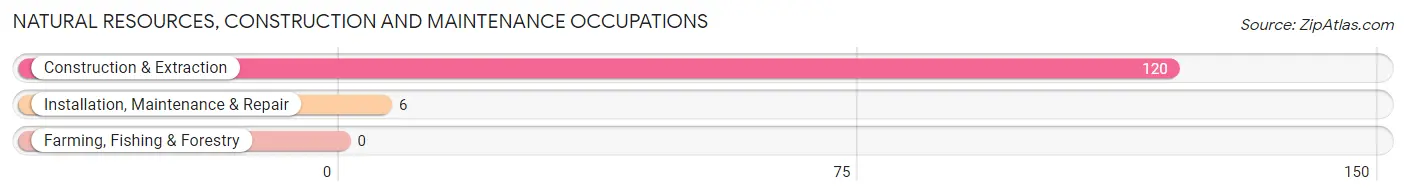
Natural Resources, Construction and Maintenance Occupations
The most common Natural Resources, Construction and Maintenance occupations in Manasquan borough are Construction & Extraction (120 | 3.8%), and Installation, Maintenance & Repair (6 | 0.2%).
Natural Resources, Construction and Maintenance Occupations by Sex
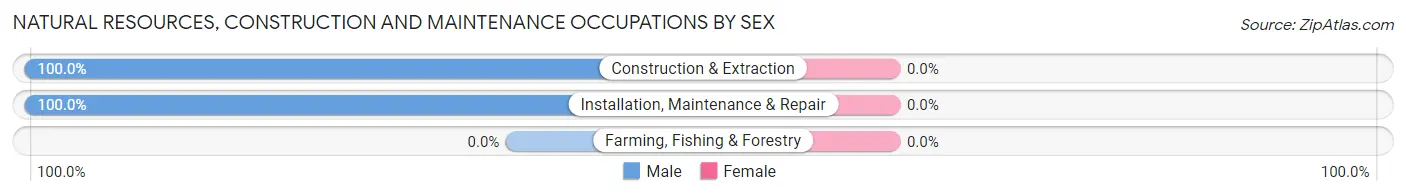
| Occupation | Male | Female |
| Farming, Fishing & Forestry | 0 (0.0%) | 0 (0.0%) |
| Construction & Extraction | 120 (100.0%) | 0 (0.0%) |
| Installation, Maintenance & Repair | 6 (100.0%) | 0 (0.0%) |
| Total (Category) | 126 (100.0%) | 0 (0.0%) |
| Total (Overall) | 1,622 (51.9%) | 1,500 (48.0%) |
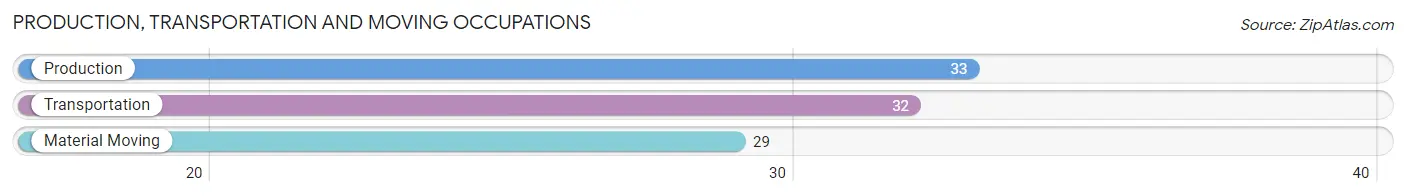
Production, Transportation and Moving Occupations
The most common Production, Transportation and Moving occupations in Manasquan borough are Production (33 | 1.1%), Transportation (32 | 1.0%), and Material Moving (29 | 0.9%).
Production, Transportation and Moving Occupations by Sex
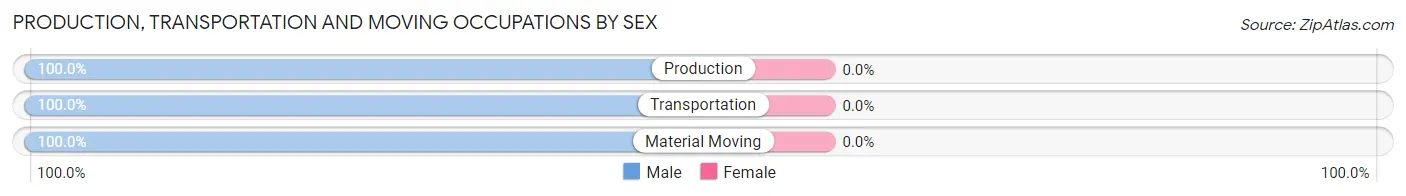
| Occupation | Male | Female |
| Production | 33 (100.0%) | 0 (0.0%) |
| Transportation | 32 (100.0%) | 0 (0.0%) |
| Material Moving | 29 (100.0%) | 0 (0.0%) |
| Total (Category) | 94 (100.0%) | 0 (0.0%) |
| Total (Overall) | 1,622 (51.9%) | 1,500 (48.0%) |
Employment Industries by Sex in Manasquan borough
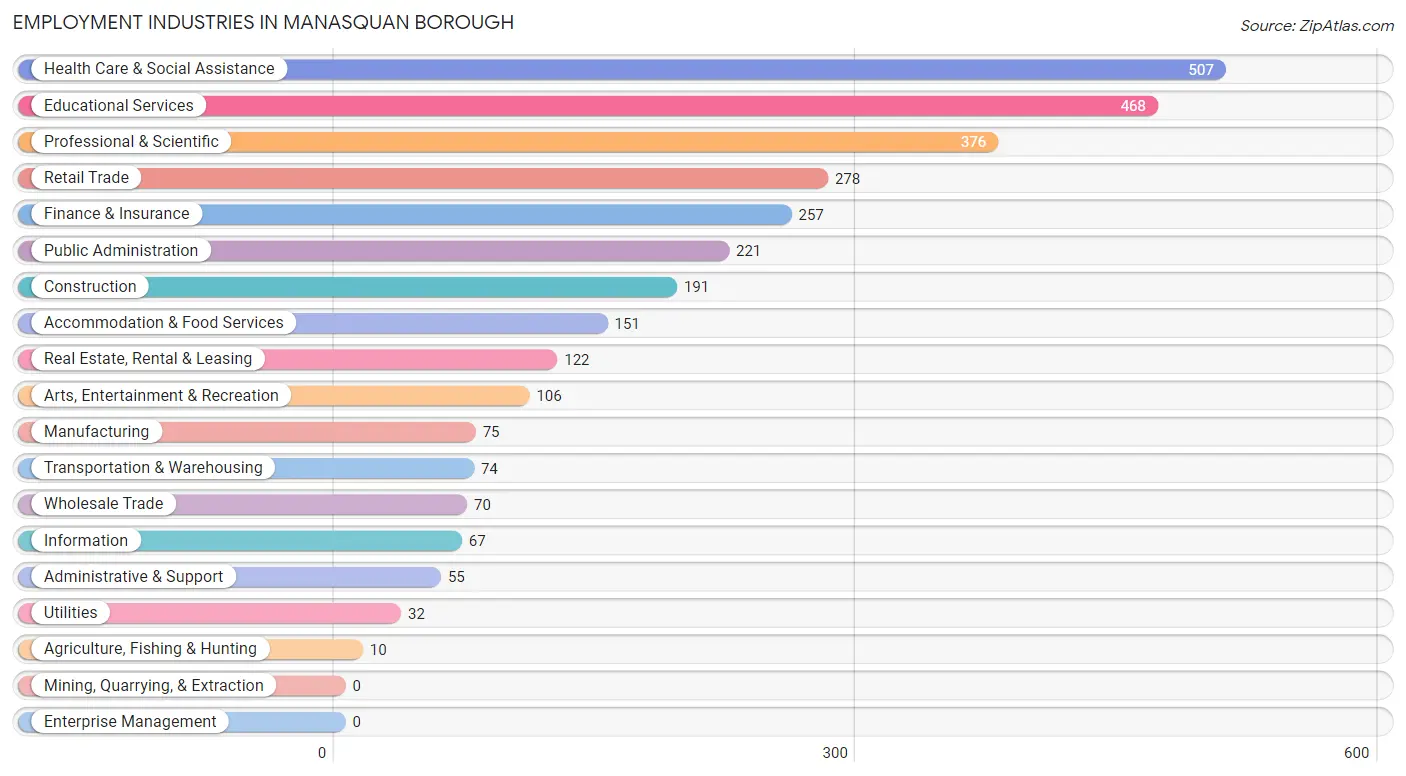
Employment Industries in Manasquan borough
The major employment industries in Manasquan borough include Health Care & Social Assistance (507 | 16.2%), Educational Services (468 | 15.0%), Professional & Scientific (376 | 12.0%), Retail Trade (278 | 8.9%), and Finance & Insurance (257 | 8.2%).
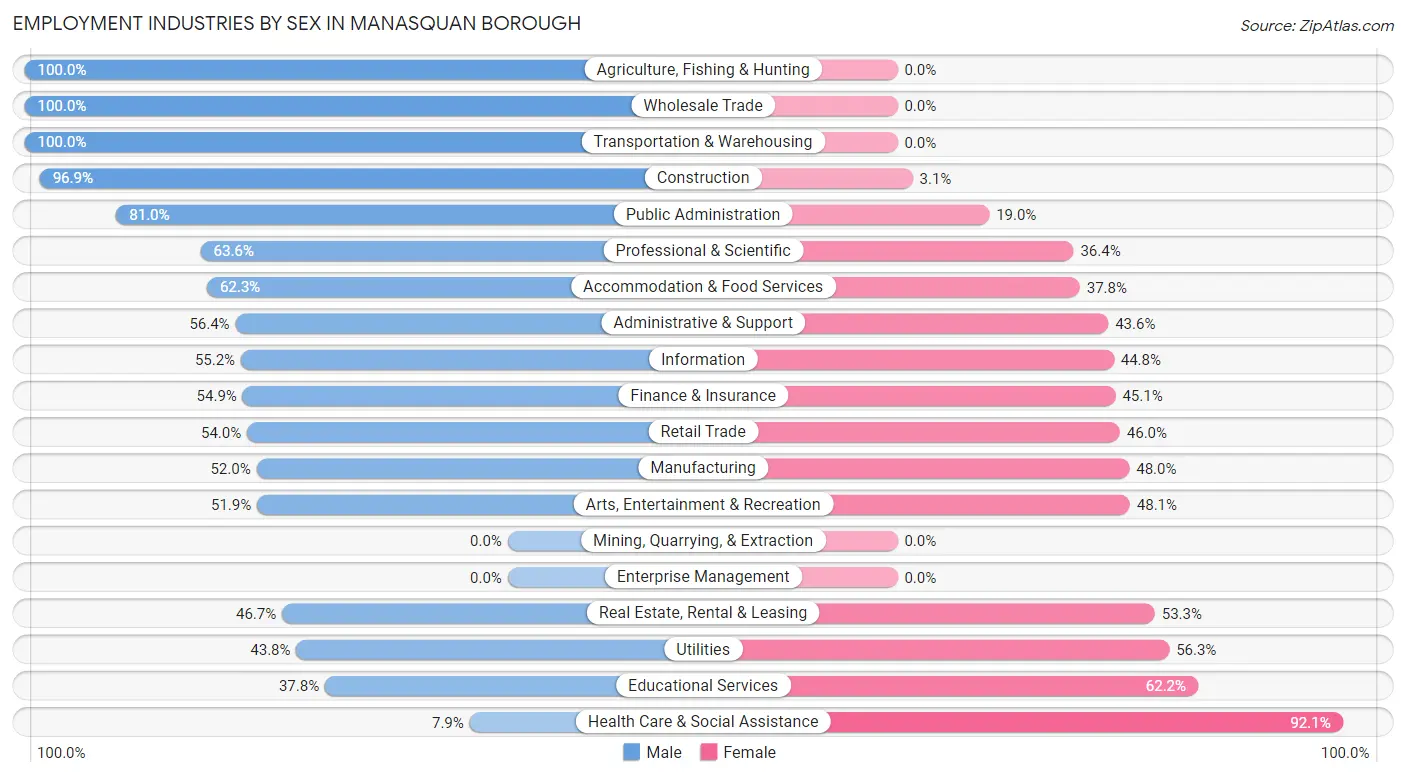
Employment Industries by Sex in Manasquan borough
The Manasquan borough industries that see more men than women are Agriculture, Fishing & Hunting (100.0%), Wholesale Trade (100.0%), and Transportation & Warehousing (100.0%), whereas the industries that tend to have a higher number of women are Health Care & Social Assistance (92.1%), Educational Services (62.2%), and Utilities (56.2%).
| Industry | Male | Female |
| Agriculture, Fishing & Hunting | 10 (100.0%) | 0 (0.0%) |
| Mining, Quarrying, & Extraction | 0 (0.0%) | 0 (0.0%) |
| Construction | 185 (96.9%) | 6 (3.1%) |
| Manufacturing | 39 (52.0%) | 36 (48.0%) |
| Wholesale Trade | 70 (100.0%) | 0 (0.0%) |
| Retail Trade | 150 (54.0%) | 128 (46.0%) |
| Transportation & Warehousing | 74 (100.0%) | 0 (0.0%) |
| Utilities | 14 (43.8%) | 18 (56.2%) |
| Information | 37 (55.2%) | 30 (44.8%) |
| Finance & Insurance | 141 (54.9%) | 116 (45.1%) |
| Real Estate, Rental & Leasing | 57 (46.7%) | 65 (53.3%) |
| Professional & Scientific | 239 (63.6%) | 137 (36.4%) |
| Enterprise Management | 0 (0.0%) | 0 (0.0%) |
| Administrative & Support | 31 (56.4%) | 24 (43.6%) |
| Educational Services | 177 (37.8%) | 291 (62.2%) |
| Health Care & Social Assistance | 40 (7.9%) | 467 (92.1%) |
| Arts, Entertainment & Recreation | 55 (51.9%) | 51 (48.1%) |
| Accommodation & Food Services | 94 (62.3%) | 57 (37.8%) |
| Public Administration | 179 (81.0%) | 42 (19.0%) |
| Total | 1,622 (51.9%) | 1,500 (48.0%) |
Education in Manasquan borough
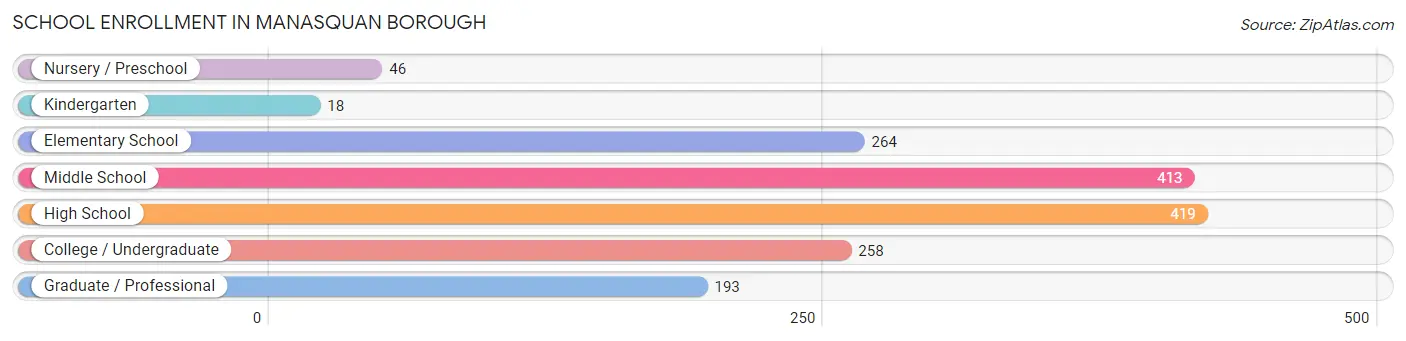
School Enrollment in Manasquan borough
The most common levels of schooling among the 1,611 students in Manasquan borough are high school (419 | 26.0%), middle school (413 | 25.6%), and elementary school (264 | 16.4%).
| School Level | # Students | % Students |
| Nursery / Preschool | 46 | 2.9% |
| Kindergarten | 18 | 1.1% |
| Elementary School | 264 | 16.4% |
| Middle School | 413 | 25.6% |
| High School | 419 | 26.0% |
| College / Undergraduate | 258 | 16.0% |
| Graduate / Professional | 193 | 12.0% |
| Total | 1,611 | 100.0% |
School Enrollment by Age by Funding Source in Manasquan borough
Out of a total of 1,611 students who are enrolled in schools in Manasquan borough, 230 (14.3%) attend a private institution, while the remaining 1,381 (85.7%) are enrolled in public schools. The age group of 3 to 4 year olds has the highest likelihood of being enrolled in private schools, with 36 (78.3% in the age bracket) enrolled. Conversely, the age group of 5 to 9 year old has the lowest likelihood of being enrolled in a private school, with 196 (100.0% in the age bracket) attending a public institution.
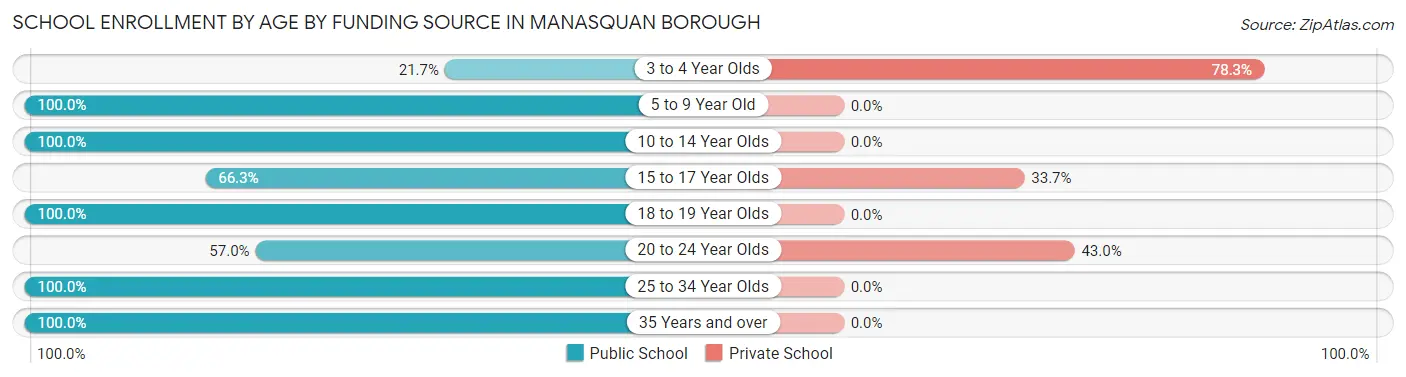
| Age Bracket | Public School | Private School |
| 3 to 4 Year Olds | 10 (21.7%) | 36 (78.3%) |
| 5 to 9 Year Old | 196 (100.0%) | 0 (0.0%) |
| 10 to 14 Year Olds | 554 (100.0%) | 0 (0.0%) |
| 15 to 17 Year Olds | 201 (66.3%) | 102 (33.7%) |
| 18 to 19 Year Olds | 67 (100.0%) | 0 (0.0%) |
| 20 to 24 Year Olds | 122 (57.0%) | 92 (43.0%) |
| 25 to 34 Year Olds | 166 (100.0%) | 0 (0.0%) |
| 35 Years and over | 65 (100.0%) | 0 (0.0%) |
| Total | 1,381 (85.7%) | 230 (14.3%) |
Educational Attainment by Field of Study in Manasquan borough
Business (712 | 22.9%), education (501 | 16.1%), science & technology (410 | 13.2%), social sciences (404 | 13.0%), and psychology (188 | 6.0%) are the most common fields of study among 3,115 individuals in Manasquan borough who have obtained a bachelor's degree or higher.
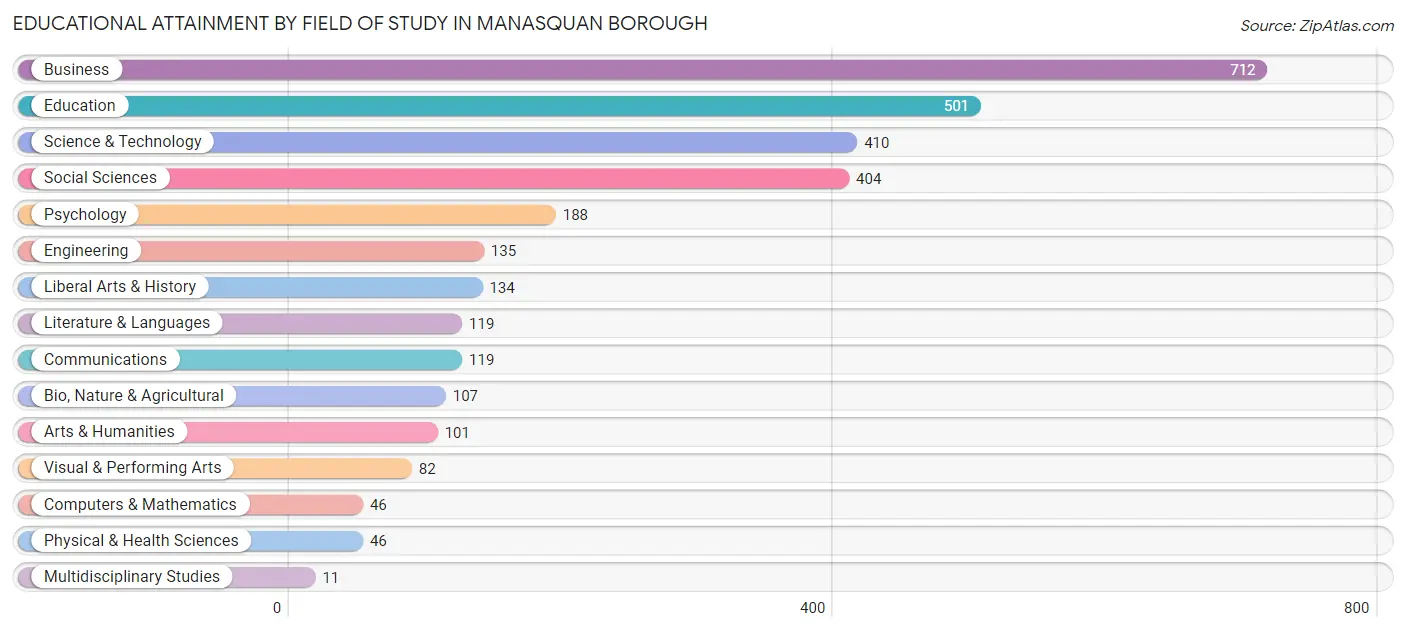
| Field of Study | # Graduates | % Graduates |
| Computers & Mathematics | 46 | 1.5% |
| Bio, Nature & Agricultural | 107 | 3.4% |
| Physical & Health Sciences | 46 | 1.5% |
| Psychology | 188 | 6.0% |
| Social Sciences | 404 | 13.0% |
| Engineering | 135 | 4.3% |
| Multidisciplinary Studies | 11 | 0.4% |
| Science & Technology | 410 | 13.2% |
| Business | 712 | 22.9% |
| Education | 501 | 16.1% |
| Literature & Languages | 119 | 3.8% |
| Liberal Arts & History | 134 | 4.3% |
| Visual & Performing Arts | 82 | 2.6% |
| Communications | 119 | 3.8% |
| Arts & Humanities | 101 | 3.2% |
| Total | 3,115 | 100.0% |
Transportation & Commute in Manasquan borough
Vehicle Availability by Sex in Manasquan borough
The most prevalent vehicle ownership categories in Manasquan borough are males with 2 vehicles (801, accounting for 51.5%) and females with 2 vehicles (639, making up 53.8%).
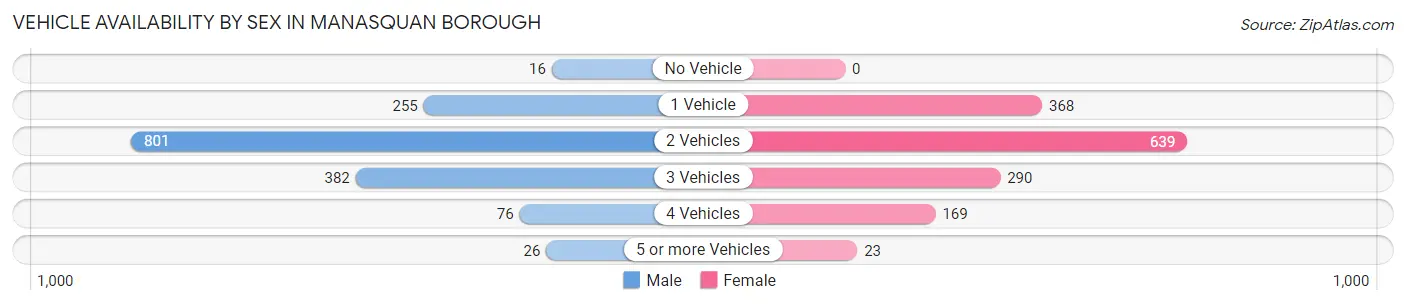
| Vehicles Available | Male | Female |
| No Vehicle | 16 (1.0%) | 0 (0.0%) |
| 1 Vehicle | 255 (16.4%) | 368 (24.7%) |
| 2 Vehicles | 801 (51.5%) | 639 (42.9%) |
| 3 Vehicles | 382 (24.5%) | 290 (19.5%) |
| 4 Vehicles | 76 (4.9%) | 169 (11.4%) |
| 5 or more Vehicles | 26 (1.7%) | 23 (1.5%) |
| Total | 1,556 (100.0%) | 1,489 (100.0%) |
Commute Time in Manasquan borough
The most frequently occuring commute durations in Manasquan borough are 5 to 9 minutes (494 commuters, 19.3%), 60 to 89 minutes (370 commuters, 14.4%), and 30 to 34 minutes (359 commuters, 14.0%).
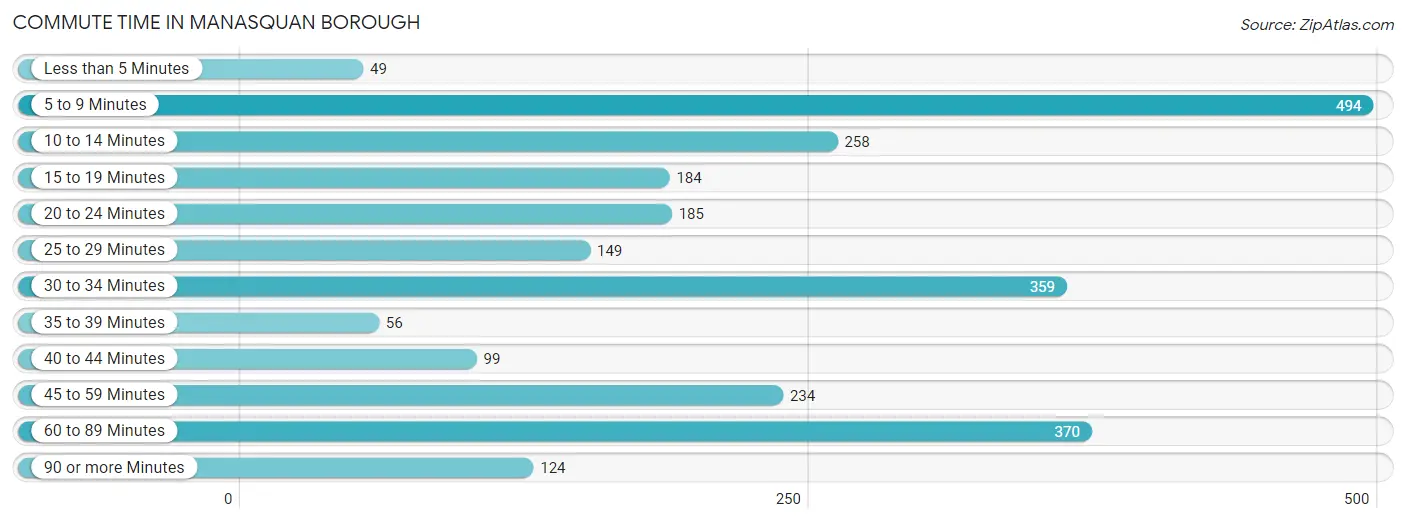
| Commute Time | # Commuters | % Commuters |
| Less than 5 Minutes | 49 | 1.9% |
| 5 to 9 Minutes | 494 | 19.3% |
| 10 to 14 Minutes | 258 | 10.1% |
| 15 to 19 Minutes | 184 | 7.2% |
| 20 to 24 Minutes | 185 | 7.2% |
| 25 to 29 Minutes | 149 | 5.8% |
| 30 to 34 Minutes | 359 | 14.0% |
| 35 to 39 Minutes | 56 | 2.2% |
| 40 to 44 Minutes | 99 | 3.9% |
| 45 to 59 Minutes | 234 | 9.1% |
| 60 to 89 Minutes | 370 | 14.4% |
| 90 or more Minutes | 124 | 4.8% |
Commute Time by Sex in Manasquan borough
The most common commute times in Manasquan borough are 5 to 9 minutes (254 commuters, 21.5%) for males and 5 to 9 minutes (240 commuters, 17.4%) for females.
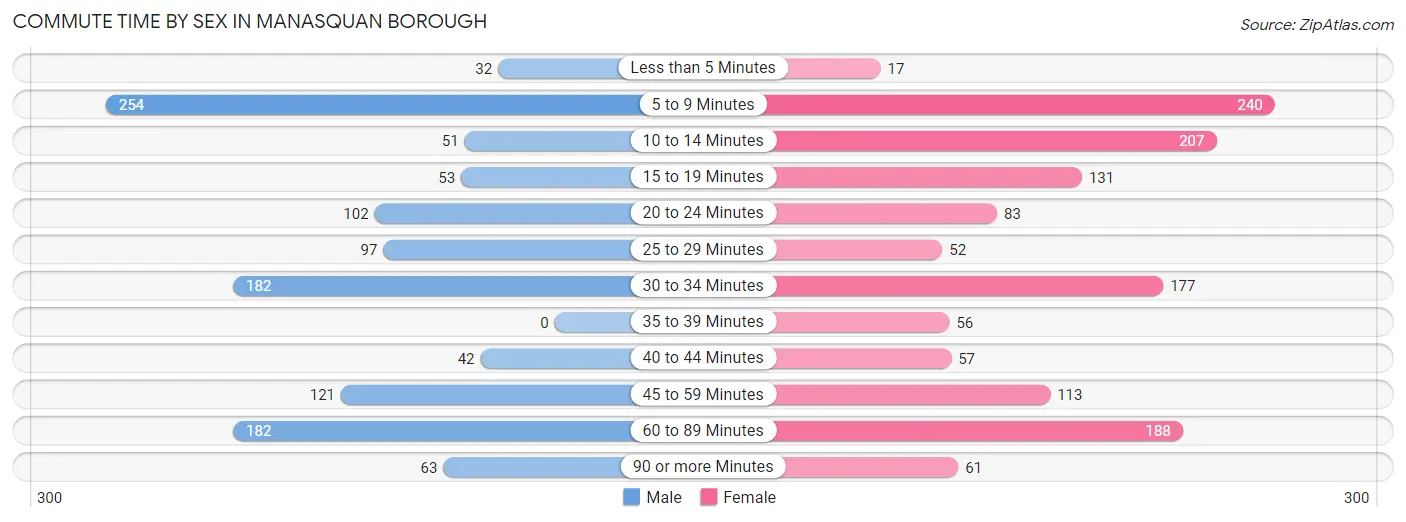
| Commute Time | Male | Female |
| Less than 5 Minutes | 32 (2.7%) | 17 (1.2%) |
| 5 to 9 Minutes | 254 (21.5%) | 240 (17.4%) |
| 10 to 14 Minutes | 51 (4.3%) | 207 (15.0%) |
| 15 to 19 Minutes | 53 (4.5%) | 131 (9.5%) |
| 20 to 24 Minutes | 102 (8.6%) | 83 (6.0%) |
| 25 to 29 Minutes | 97 (8.2%) | 52 (3.8%) |
| 30 to 34 Minutes | 182 (15.4%) | 177 (12.8%) |
| 35 to 39 Minutes | 0 (0.0%) | 56 (4.1%) |
| 40 to 44 Minutes | 42 (3.6%) | 57 (4.1%) |
| 45 to 59 Minutes | 121 (10.3%) | 113 (8.2%) |
| 60 to 89 Minutes | 182 (15.4%) | 188 (13.6%) |
| 90 or more Minutes | 63 (5.3%) | 61 (4.4%) |
Time of Departure to Work by Sex in Manasquan borough
The most frequent times of departure to work in Manasquan borough are 9:00 AM to 9:59 AM (213, 18.1%) for males and 8:00 AM to 8:29 AM (359, 26.0%) for females.
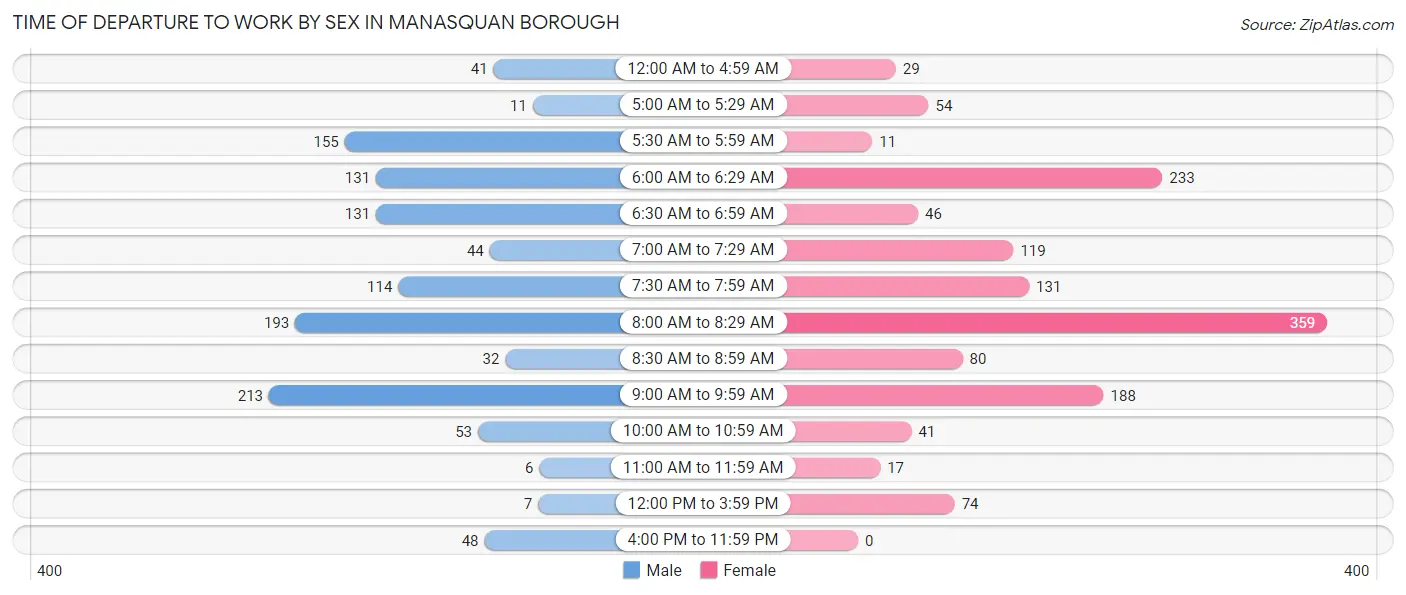
| Time of Departure | Male | Female |
| 12:00 AM to 4:59 AM | 41 (3.5%) | 29 (2.1%) |
| 5:00 AM to 5:29 AM | 11 (0.9%) | 54 (3.9%) |
| 5:30 AM to 5:59 AM | 155 (13.2%) | 11 (0.8%) |
| 6:00 AM to 6:29 AM | 131 (11.1%) | 233 (16.9%) |
| 6:30 AM to 6:59 AM | 131 (11.1%) | 46 (3.3%) |
| 7:00 AM to 7:29 AM | 44 (3.7%) | 119 (8.6%) |
| 7:30 AM to 7:59 AM | 114 (9.7%) | 131 (9.5%) |
| 8:00 AM to 8:29 AM | 193 (16.4%) | 359 (26.0%) |
| 8:30 AM to 8:59 AM | 32 (2.7%) | 80 (5.8%) |
| 9:00 AM to 9:59 AM | 213 (18.1%) | 188 (13.6%) |
| 10:00 AM to 10:59 AM | 53 (4.5%) | 41 (3.0%) |
| 11:00 AM to 11:59 AM | 6 (0.5%) | 17 (1.2%) |
| 12:00 PM to 3:59 PM | 7 (0.6%) | 74 (5.3%) |
| 4:00 PM to 11:59 PM | 48 (4.1%) | 0 (0.0%) |
| Total | 1,179 (100.0%) | 1,382 (100.0%) |
Housing Occupancy in Manasquan borough
Occupancy by Ownership in Manasquan borough
Of the total 2,501 dwellings in Manasquan borough, owner-occupied units account for 2,175 (87.0%), while renter-occupied units make up 326 (13.0%).
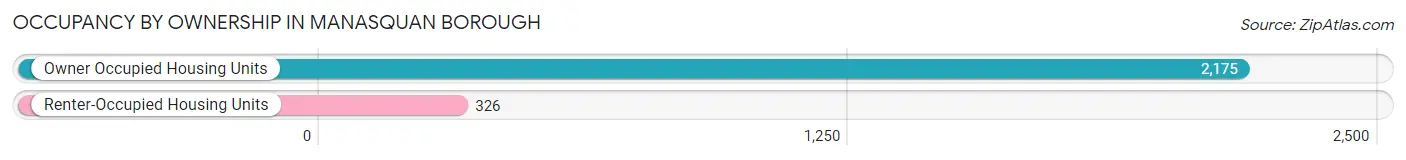
| Occupancy | # Housing Units | % Housing Units |
| Owner Occupied Housing Units | 2,175 | 87.0% |
| Renter-Occupied Housing Units | 326 | 13.0% |
| Total Occupied Housing Units | 2,501 | 100.0% |
Occupancy by Household Size in Manasquan borough
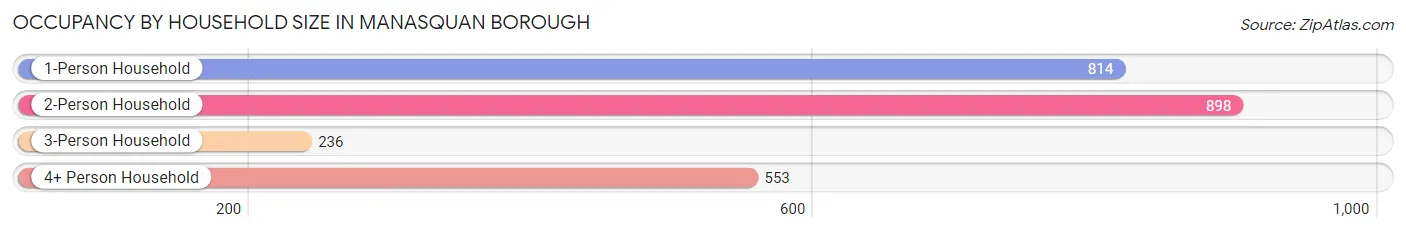
| Household Size | # Housing Units | % Housing Units |
| 1-Person Household | 814 | 32.6% |
| 2-Person Household | 898 | 35.9% |
| 3-Person Household | 236 | 9.4% |
| 4+ Person Household | 553 | 22.1% |
| Total Housing Units | 2,501 | 100.0% |
Occupancy by Ownership by Household Size in Manasquan borough
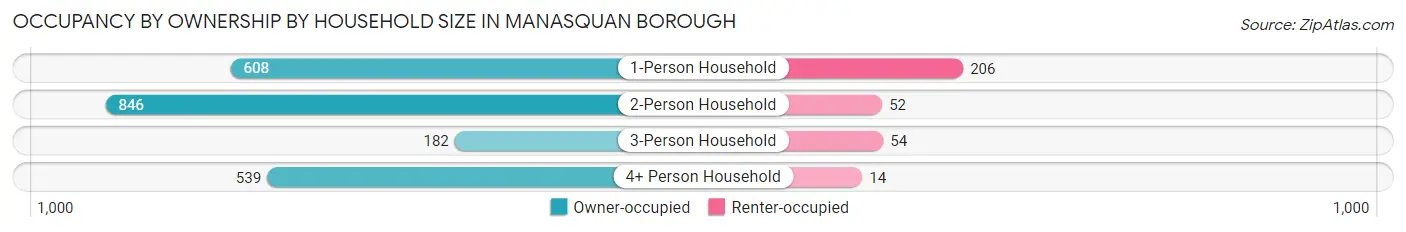
| Household Size | Owner-occupied | Renter-occupied |
| 1-Person Household | 608 (74.7%) | 206 (25.3%) |
| 2-Person Household | 846 (94.2%) | 52 (5.8%) |
| 3-Person Household | 182 (77.1%) | 54 (22.9%) |
| 4+ Person Household | 539 (97.5%) | 14 (2.5%) |
| Total Housing Units | 2,175 (87.0%) | 326 (13.0%) |
Occupancy by Educational Attainment in Manasquan borough
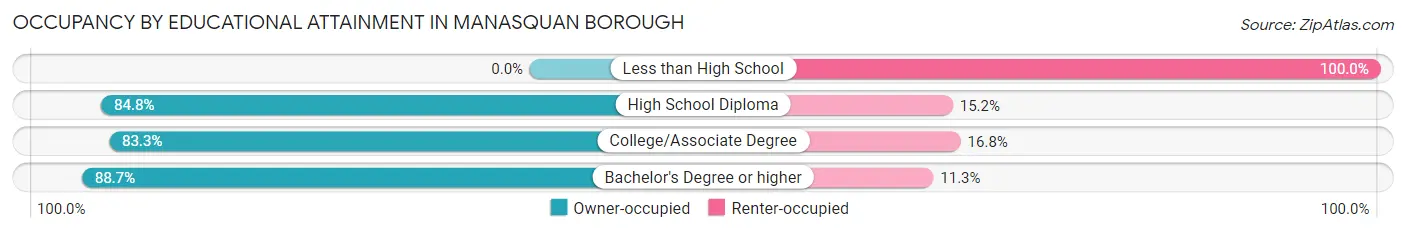
| Household Size | Owner-occupied | Renter-occupied |
| Less than High School | 0 (0.0%) | 11 (100.0%) |
| High School Diploma | 229 (84.8%) | 41 (15.2%) |
| College/Associate Degree | 343 (83.3%) | 69 (16.8%) |
| Bachelor's Degree or higher | 1,603 (88.7%) | 205 (11.3%) |
Occupancy by Age of Householder in Manasquan borough
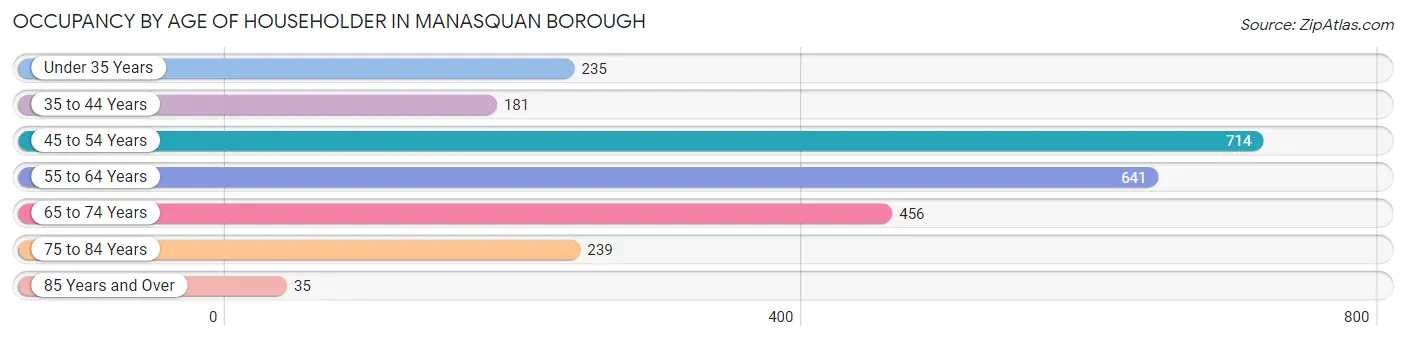
| Age Bracket | # Households | % Households |
| Under 35 Years | 235 | 9.4% |
| 35 to 44 Years | 181 | 7.2% |
| 45 to 54 Years | 714 | 28.5% |
| 55 to 64 Years | 641 | 25.6% |
| 65 to 74 Years | 456 | 18.2% |
| 75 to 84 Years | 239 | 9.6% |
| 85 Years and Over | 35 | 1.4% |
| Total | 2,501 | 100.0% |
Housing Finances in Manasquan borough
Median Income by Occupancy in Manasquan borough
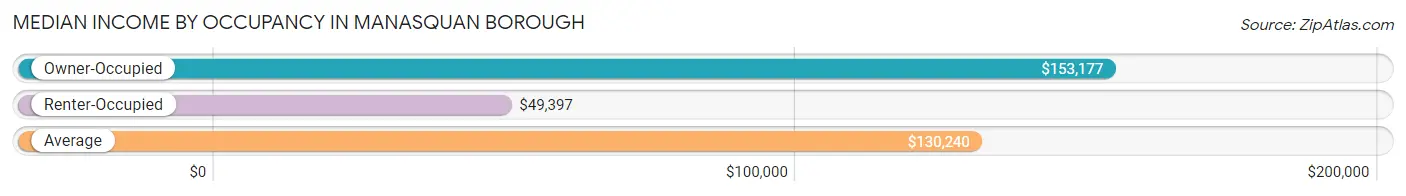
| Occupancy Type | # Households | Median Income |
| Owner-Occupied | 2,175 (87.0%) | $153,177 |
| Renter-Occupied | 326 (13.0%) | $49,397 |
| Average | 2,501 (100.0%) | $130,240 |
Occupancy by Householder Income Bracket in Manasquan borough
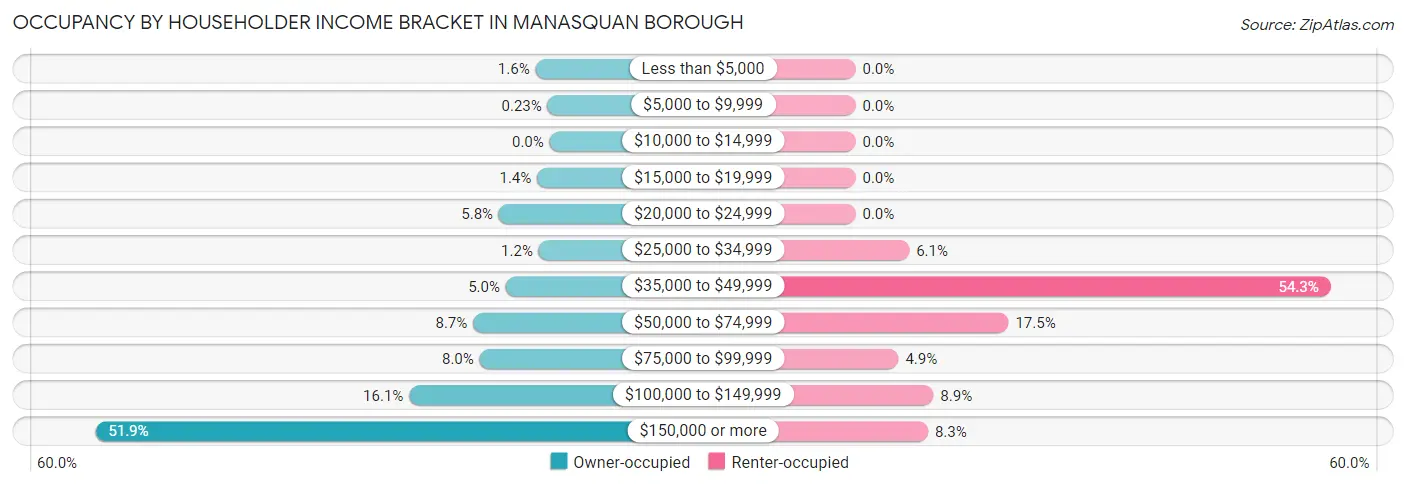
| Income Bracket | Owner-occupied | Renter-occupied |
| Less than $5,000 | 35 (1.6%) | 0 (0.0%) |
| $5,000 to $9,999 | 5 (0.2%) | 0 (0.0%) |
| $10,000 to $14,999 | 0 (0.0%) | 0 (0.0%) |
| $15,000 to $19,999 | 31 (1.4%) | 0 (0.0%) |
| $20,000 to $24,999 | 126 (5.8%) | 0 (0.0%) |
| $25,000 to $34,999 | 27 (1.2%) | 20 (6.1%) |
| $35,000 to $49,999 | 109 (5.0%) | 177 (54.3%) |
| $50,000 to $74,999 | 190 (8.7%) | 57 (17.5%) |
| $75,000 to $99,999 | 174 (8.0%) | 16 (4.9%) |
| $100,000 to $149,999 | 349 (16.1%) | 29 (8.9%) |
| $150,000 or more | 1,129 (51.9%) | 27 (8.3%) |
| Total | 2,175 (100.0%) | 326 (100.0%) |
Monthly Housing Cost Tiers in Manasquan borough
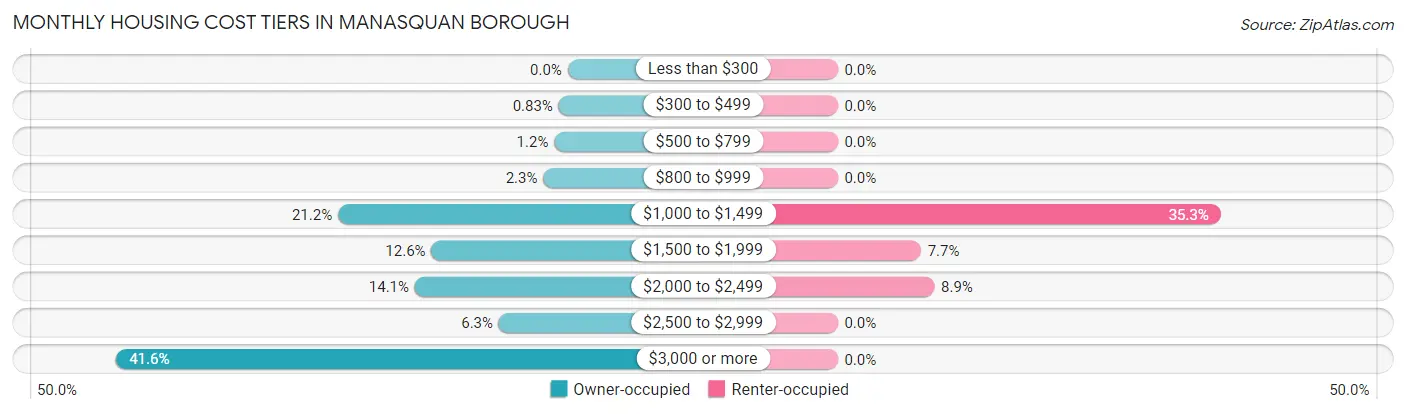
| Monthly Cost | Owner-occupied | Renter-occupied |
| Less than $300 | 0 (0.0%) | 0 (0.0%) |
| $300 to $499 | 18 (0.8%) | 0 (0.0%) |
| $500 to $799 | 27 (1.2%) | 0 (0.0%) |
| $800 to $999 | 49 (2.2%) | 0 (0.0%) |
| $1,000 to $1,499 | 460 (21.1%) | 115 (35.3%) |
| $1,500 to $1,999 | 273 (12.6%) | 25 (7.7%) |
| $2,000 to $2,499 | 306 (14.1%) | 29 (8.9%) |
| $2,500 to $2,999 | 138 (6.3%) | 0 (0.0%) |
| $3,000 or more | 904 (41.6%) | 0 (0.0%) |
| Total | 2,175 (100.0%) | 326 (100.0%) |
Physical Housing Characteristics in Manasquan borough
Housing Structures in Manasquan borough
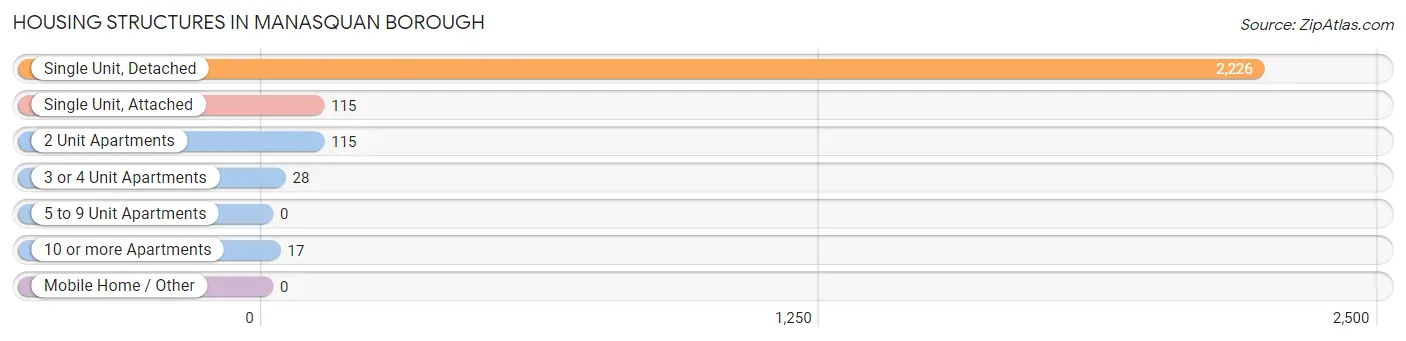
| Structure Type | # Housing Units | % Housing Units |
| Single Unit, Detached | 2,226 | 89.0% |
| Single Unit, Attached | 115 | 4.6% |
| 2 Unit Apartments | 115 | 4.6% |
| 3 or 4 Unit Apartments | 28 | 1.1% |
| 5 to 9 Unit Apartments | 0 | 0.0% |
| 10 or more Apartments | 17 | 0.7% |
| Mobile Home / Other | 0 | 0.0% |
| Total | 2,501 | 100.0% |
Housing Structures by Occupancy in Manasquan borough
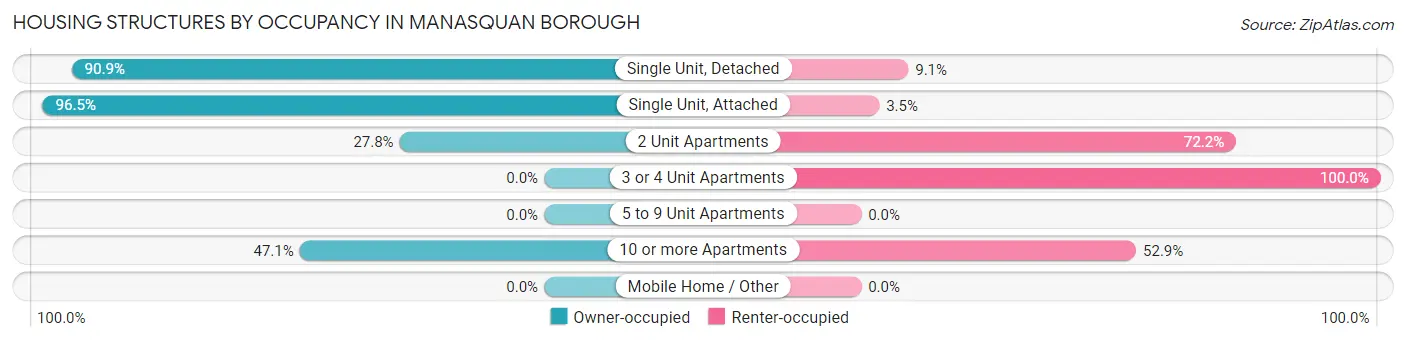
| Structure Type | Owner-occupied | Renter-occupied |
| Single Unit, Detached | 2,024 (90.9%) | 202 (9.1%) |
| Single Unit, Attached | 111 (96.5%) | 4 (3.5%) |
| 2 Unit Apartments | 32 (27.8%) | 83 (72.2%) |
| 3 or 4 Unit Apartments | 0 (0.0%) | 28 (100.0%) |
| 5 to 9 Unit Apartments | 0 (0.0%) | 0 (0.0%) |
| 10 or more Apartments | 8 (47.1%) | 9 (52.9%) |
| Mobile Home / Other | 0 (0.0%) | 0 (0.0%) |
| Total | 2,175 (87.0%) | 326 (13.0%) |
Housing Structures by Number of Rooms in Manasquan borough
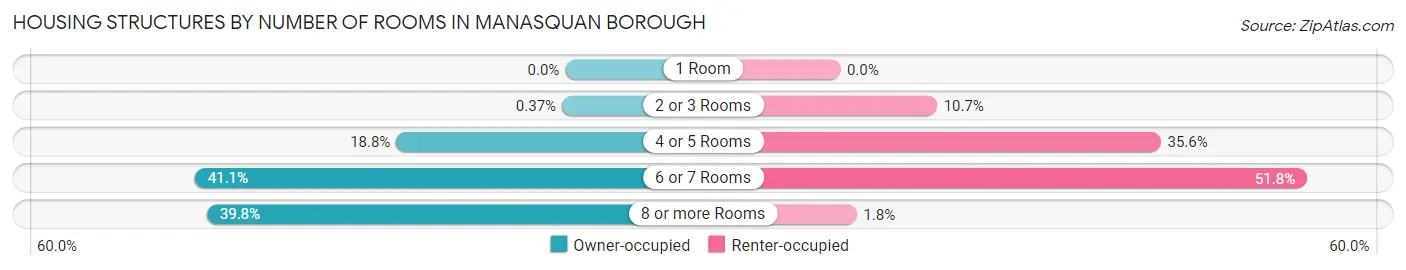
| Number of Rooms | Owner-occupied | Renter-occupied |
| 1 Room | 0 (0.0%) | 0 (0.0%) |
| 2 or 3 Rooms | 8 (0.4%) | 35 (10.7%) |
| 4 or 5 Rooms | 408 (18.8%) | 116 (35.6%) |
| 6 or 7 Rooms | 894 (41.1%) | 169 (51.8%) |
| 8 or more Rooms | 865 (39.8%) | 6 (1.8%) |
| Total | 2,175 (100.0%) | 326 (100.0%) |
Housing Structure by Heating Type in Manasquan borough
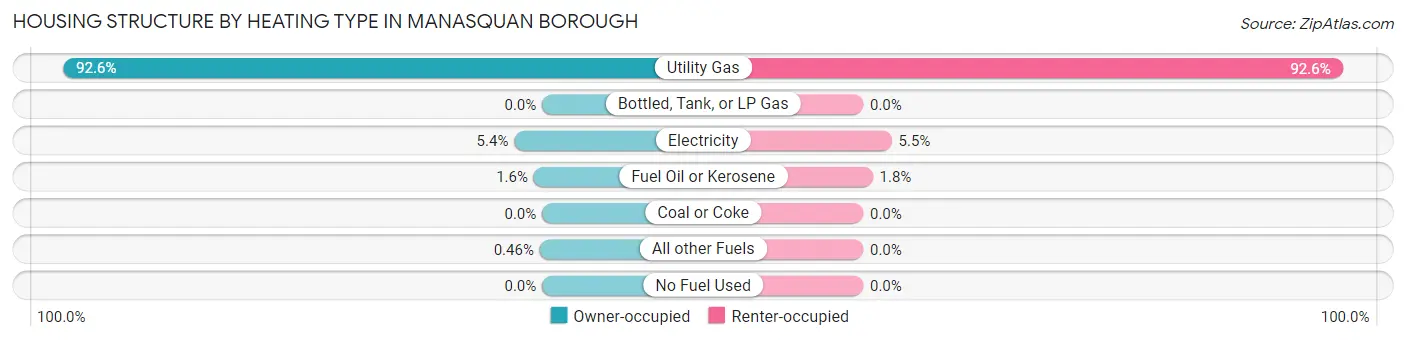
| Heating Type | Owner-occupied | Renter-occupied |
| Utility Gas | 2,013 (92.5%) | 302 (92.6%) |
| Bottled, Tank, or LP Gas | 0 (0.0%) | 0 (0.0%) |
| Electricity | 117 (5.4%) | 18 (5.5%) |
| Fuel Oil or Kerosene | 35 (1.6%) | 6 (1.8%) |
| Coal or Coke | 0 (0.0%) | 0 (0.0%) |
| All other Fuels | 10 (0.5%) | 0 (0.0%) |
| No Fuel Used | 0 (0.0%) | 0 (0.0%) |
| Total | 2,175 (100.0%) | 326 (100.0%) |
Household Vehicle Usage in Manasquan borough
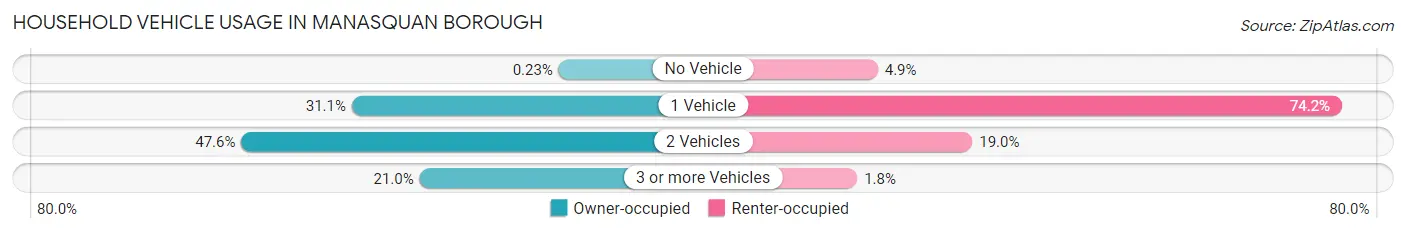
| Vehicles per Household | Owner-occupied | Renter-occupied |
| No Vehicle | 5 (0.2%) | 16 (4.9%) |
| 1 Vehicle | 677 (31.1%) | 242 (74.2%) |
| 2 Vehicles | 1,036 (47.6%) | 62 (19.0%) |
| 3 or more Vehicles | 457 (21.0%) | 6 (1.8%) |
| Total | 2,175 (100.0%) | 326 (100.0%) |
Real Estate & Mortgages in Manasquan borough
Real Estate and Mortgage Overview in Manasquan borough
| Characteristic | Without Mortgage | With Mortgage |
| Housing Units | 752 | 1,423 |
| Median Property Value | $881,400 | $857,700 |
| Median Household Income | $101,275 | $872 |
| Monthly Housing Costs | $1,304 | $895 |
| Real Estate Taxes | $10,001 | $5 |
Property Value by Mortgage Status in Manasquan borough
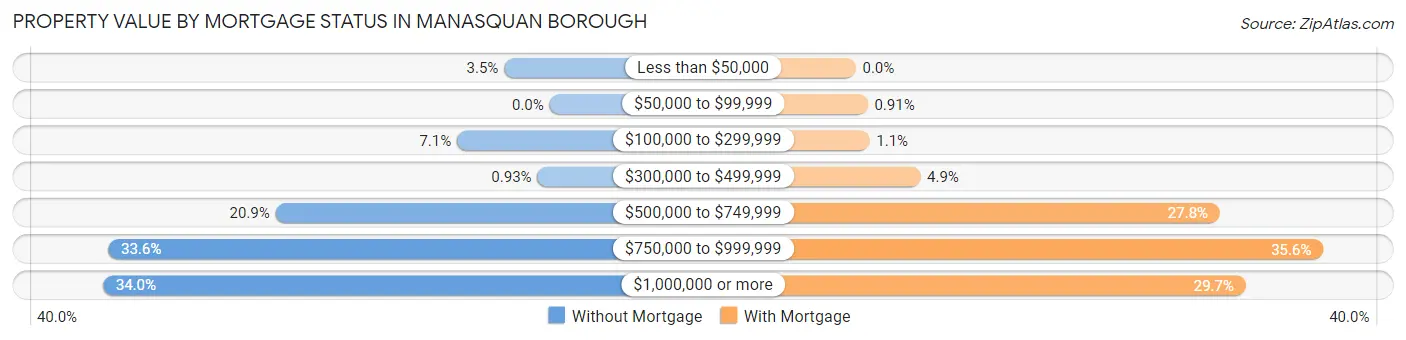
| Property Value | Without Mortgage | With Mortgage |
| Less than $50,000 | 26 (3.5%) | 0 (0.0%) |
| $50,000 to $99,999 | 0 (0.0%) | 13 (0.9%) |
| $100,000 to $299,999 | 53 (7.0%) | 15 (1.1%) |
| $300,000 to $499,999 | 7 (0.9%) | 70 (4.9%) |
| $500,000 to $749,999 | 157 (20.9%) | 395 (27.8%) |
| $750,000 to $999,999 | 253 (33.6%) | 507 (35.6%) |
| $1,000,000 or more | 256 (34.0%) | 423 (29.7%) |
| Total | 752 (100.0%) | 1,423 (100.0%) |
Household Income by Mortgage Status in Manasquan borough
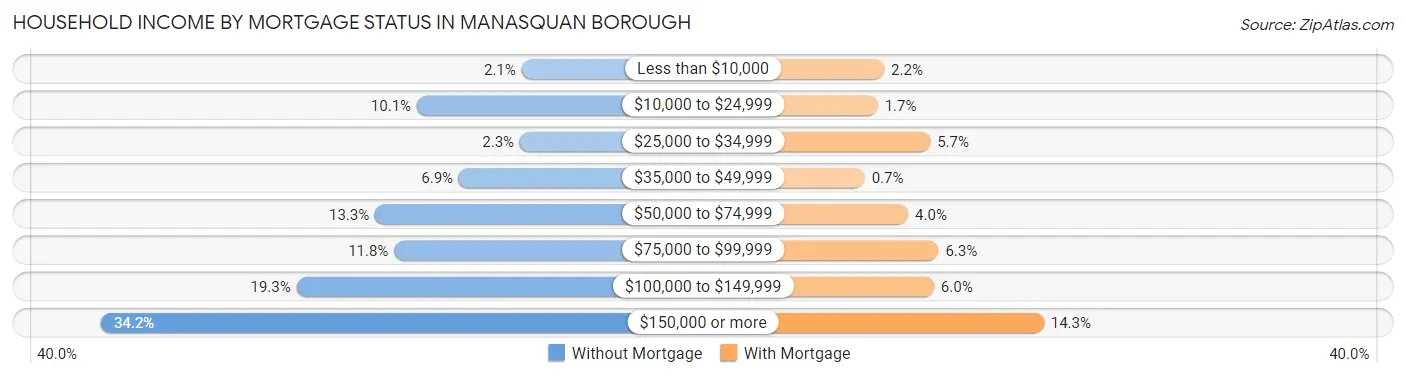
| Household Income | Without Mortgage | With Mortgage |
| Less than $10,000 | 16 (2.1%) | 31 (2.2%) |
| $10,000 to $24,999 | 76 (10.1%) | 24 (1.7%) |
| $25,000 to $34,999 | 17 (2.3%) | 81 (5.7%) |
| $35,000 to $49,999 | 52 (6.9%) | 10 (0.7%) |
| $50,000 to $74,999 | 100 (13.3%) | 57 (4.0%) |
| $75,000 to $99,999 | 89 (11.8%) | 90 (6.3%) |
| $100,000 to $149,999 | 145 (19.3%) | 85 (6.0%) |
| $150,000 or more | 257 (34.2%) | 204 (14.3%) |
| Total | 752 (100.0%) | 1,423 (100.0%) |
Property Value to Household Income Ratio in Manasquan borough
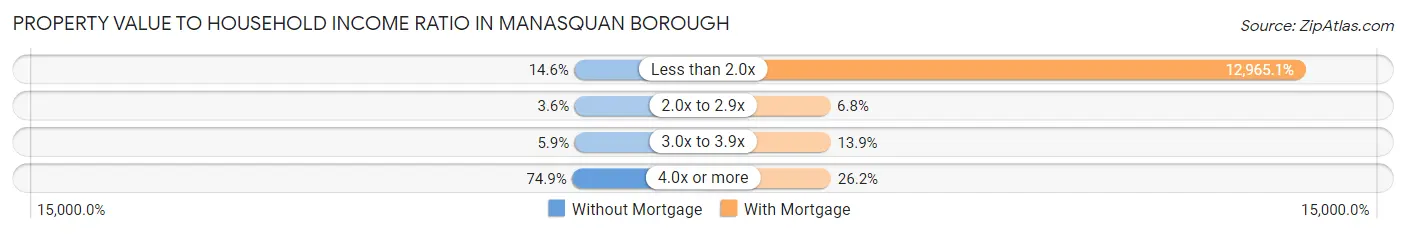
| Value-to-Income Ratio | Without Mortgage | With Mortgage |
| Less than 2.0x | 110 (14.6%) | 184,493 (12,965.1%) |
| 2.0x to 2.9x | 27 (3.6%) | 97 (6.8%) |
| 3.0x to 3.9x | 44 (5.9%) | 198 (13.9%) |
| 4.0x or more | 563 (74.9%) | 373 (26.2%) |
| Total | 752 (100.0%) | 1,423 (100.0%) |
Real Estate Taxes by Mortgage Status in Manasquan borough
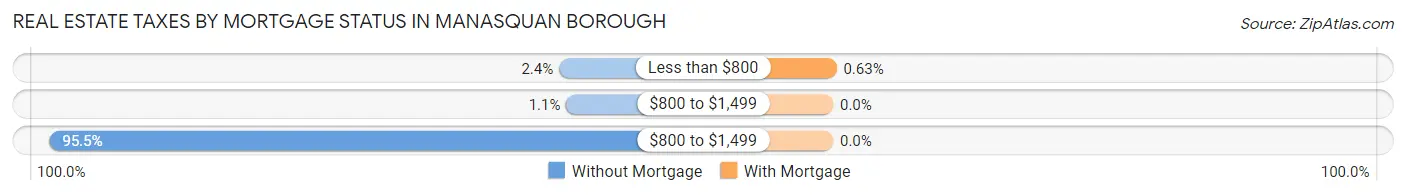
| Property Taxes | Without Mortgage | With Mortgage |
| Less than $800 | 18 (2.4%) | 9 (0.6%) |
| $800 to $1,499 | 8 (1.1%) | 0 (0.0%) |
| $800 to $1,499 | 718 (95.5%) | 0 (0.0%) |
| Total | 752 (100.0%) | 1,423 (100.0%) |
Health & Disability in Manasquan borough
Health Insurance Coverage by Age in Manasquan borough
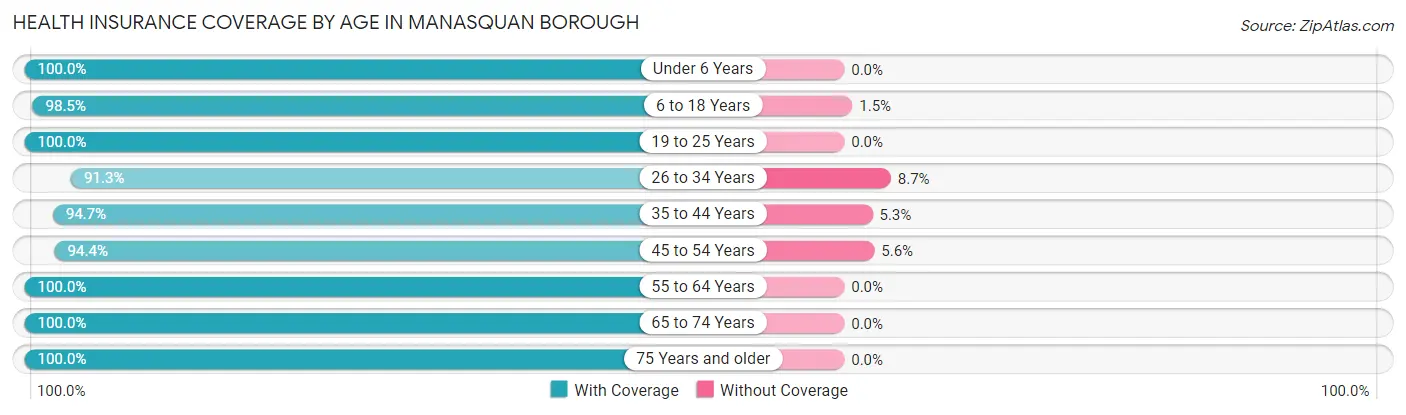
| Age Bracket | With Coverage | Without Coverage |
| Under 6 Years | 225 (100.0%) | 0 (0.0%) |
| 6 to 18 Years | 1,117 (98.5%) | 17 (1.5%) |
| 19 to 25 Years | 421 (100.0%) | 0 (0.0%) |
| 26 to 34 Years | 421 (91.3%) | 40 (8.7%) |
| 35 to 44 Years | 378 (94.7%) | 21 (5.3%) |
| 45 to 54 Years | 1,093 (94.4%) | 65 (5.6%) |
| 55 to 64 Years | 997 (100.0%) | 0 (0.0%) |
| 65 to 74 Years | 719 (100.0%) | 0 (0.0%) |
| 75 Years and older | 407 (100.0%) | 0 (0.0%) |
| Total | 5,778 (97.6%) | 143 (2.4%) |
Health Insurance Coverage by Citizenship Status in Manasquan borough
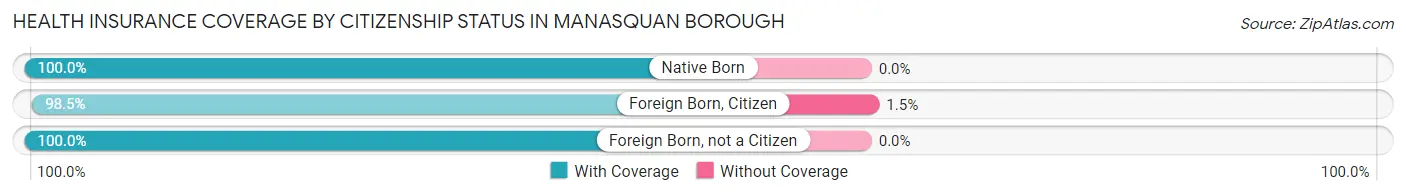
| Citizenship Status | With Coverage | Without Coverage |
| Native Born | 225 (100.0%) | 0 (0.0%) |
| Foreign Born, Citizen | 1,117 (98.5%) | 17 (1.5%) |
| Foreign Born, not a Citizen | 421 (100.0%) | 0 (0.0%) |
Health Insurance Coverage by Household Income in Manasquan borough
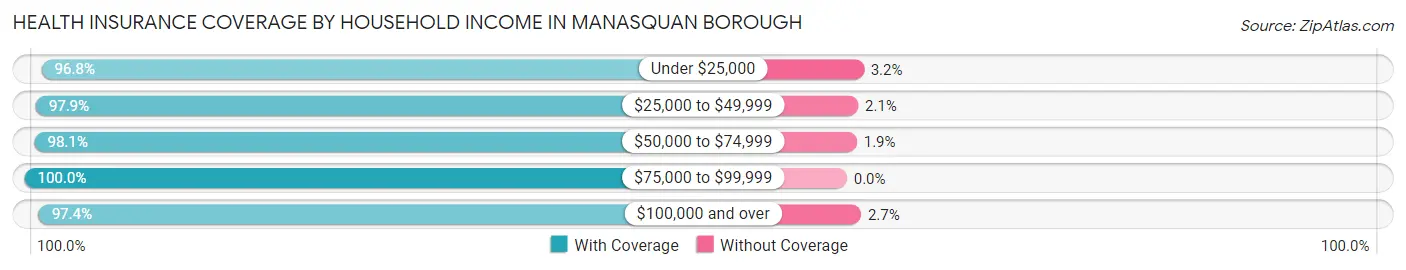
| Household Income | With Coverage | Without Coverage |
| Under $25,000 | 275 (96.8%) | 9 (3.2%) |
| $25,000 to $49,999 | 415 (97.9%) | 9 (2.1%) |
| $50,000 to $74,999 | 473 (98.1%) | 9 (1.9%) |
| $75,000 to $99,999 | 347 (100.0%) | 0 (0.0%) |
| $100,000 and over | 4,263 (97.4%) | 116 (2.6%) |
Public vs Private Health Insurance Coverage by Age in Manasquan borough
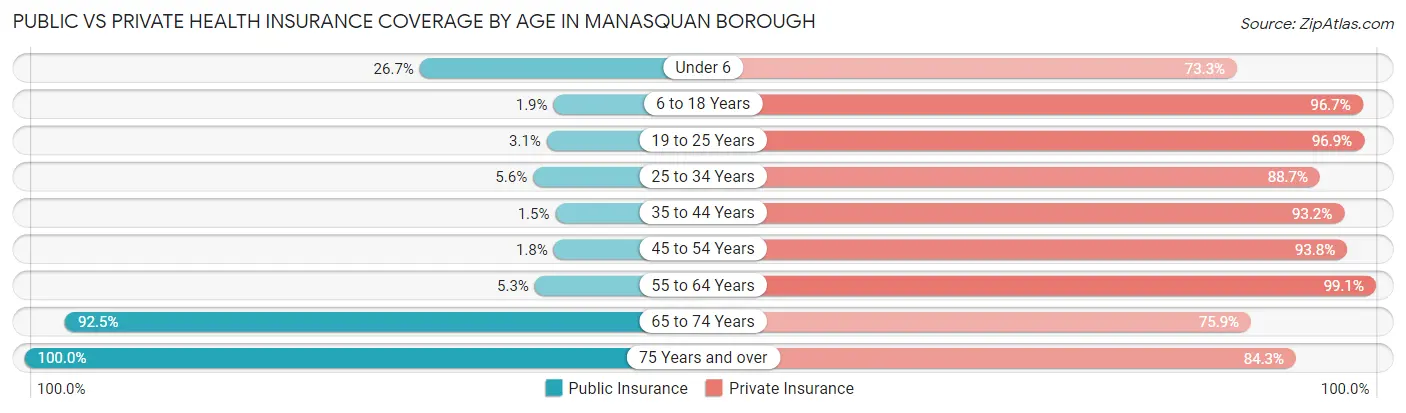
| Age Bracket | Public Insurance | Private Insurance |
| Under 6 | 60 (26.7%) | 165 (73.3%) |
| 6 to 18 Years | 21 (1.8%) | 1,096 (96.7%) |
| 19 to 25 Years | 13 (3.1%) | 408 (96.9%) |
| 25 to 34 Years | 26 (5.6%) | 409 (88.7%) |
| 35 to 44 Years | 6 (1.5%) | 372 (93.2%) |
| 45 to 54 Years | 21 (1.8%) | 1,086 (93.8%) |
| 55 to 64 Years | 53 (5.3%) | 988 (99.1%) |
| 65 to 74 Years | 665 (92.5%) | 546 (75.9%) |
| 75 Years and over | 407 (100.0%) | 343 (84.3%) |
| Total | 1,272 (21.5%) | 5,413 (91.4%) |
Disability Status by Sex by Age in Manasquan borough
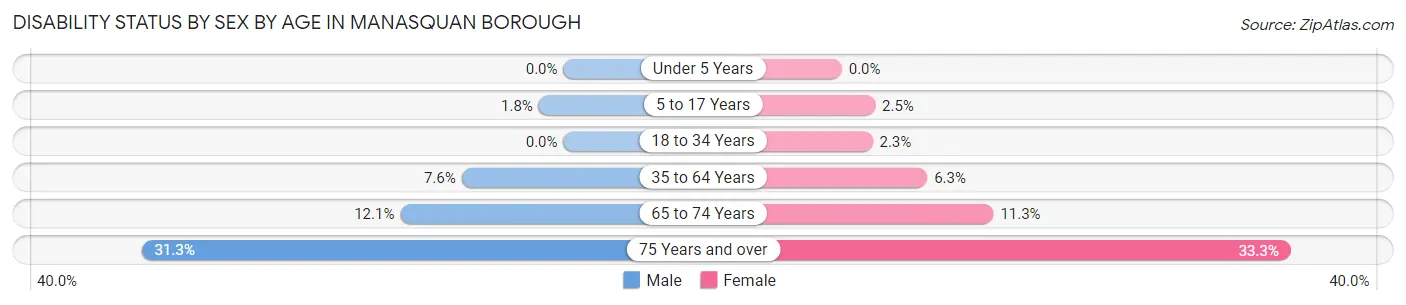
| Age Bracket | Male | Female |
| Under 5 Years | 0 (0.0%) | 0 (0.0%) |
| 5 to 17 Years | 10 (1.8%) | 13 (2.5%) |
| 18 to 34 Years | 0 (0.0%) | 13 (2.3%) |
| 35 to 64 Years | 106 (7.6%) | 73 (6.3%) |
| 65 to 74 Years | 43 (12.1%) | 41 (11.3%) |
| 75 Years and over | 57 (31.3%) | 75 (33.3%) |
Disability Class by Sex by Age in Manasquan borough
Disability Class: Hearing Difficulty
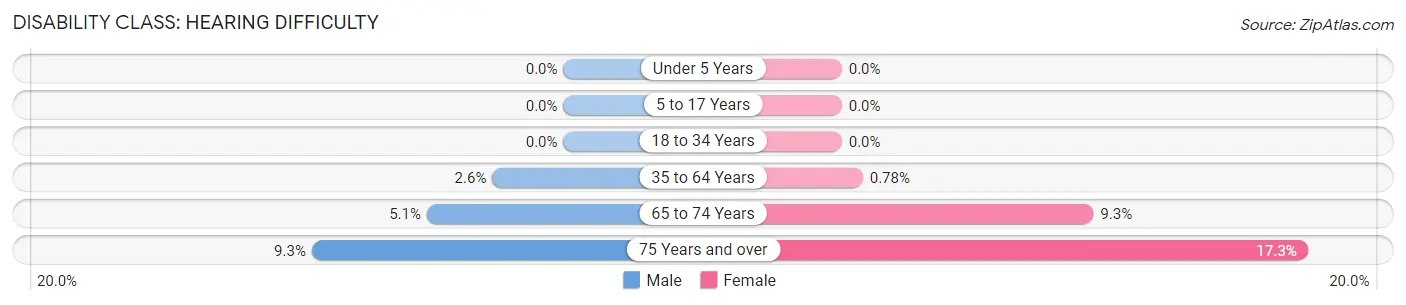
| Age Bracket | Male | Female |
| Under 5 Years | 0 (0.0%) | 0 (0.0%) |
| 5 to 17 Years | 0 (0.0%) | 0 (0.0%) |
| 18 to 34 Years | 0 (0.0%) | 0 (0.0%) |
| 35 to 64 Years | 37 (2.6%) | 9 (0.8%) |
| 65 to 74 Years | 18 (5.1%) | 34 (9.3%) |
| 75 Years and over | 17 (9.3%) | 39 (17.3%) |
Disability Class: Vision Difficulty
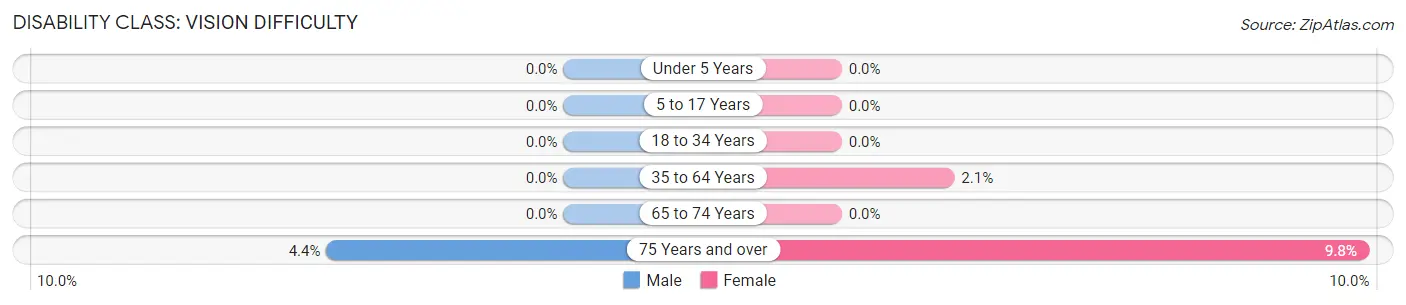
| Age Bracket | Male | Female |
| Under 5 Years | 0 (0.0%) | 0 (0.0%) |
| 5 to 17 Years | 0 (0.0%) | 0 (0.0%) |
| 18 to 34 Years | 0 (0.0%) | 0 (0.0%) |
| 35 to 64 Years | 0 (0.0%) | 24 (2.1%) |
| 65 to 74 Years | 0 (0.0%) | 0 (0.0%) |
| 75 Years and over | 8 (4.4%) | 22 (9.8%) |
Disability Class: Cognitive Difficulty
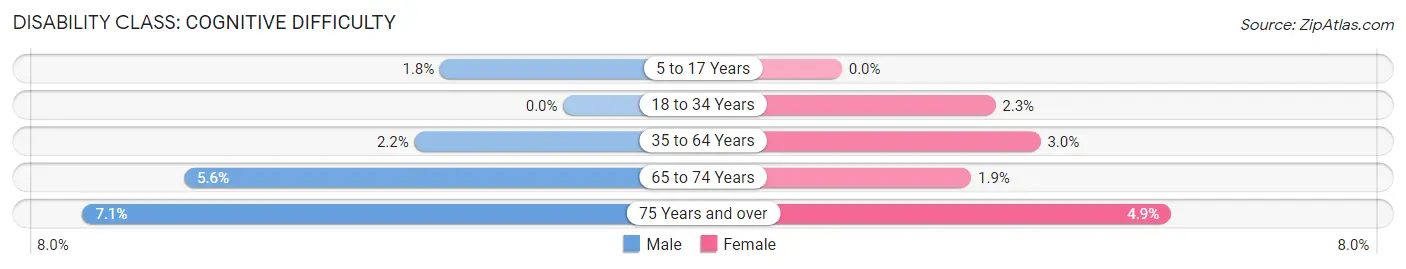
| Age Bracket | Male | Female |
| 5 to 17 Years | 10 (1.8%) | 0 (0.0%) |
| 18 to 34 Years | 0 (0.0%) | 13 (2.3%) |
| 35 to 64 Years | 31 (2.2%) | 34 (2.9%) |
| 65 to 74 Years | 20 (5.6%) | 7 (1.9%) |
| 75 Years and over | 13 (7.1%) | 11 (4.9%) |
Disability Class: Ambulatory Difficulty
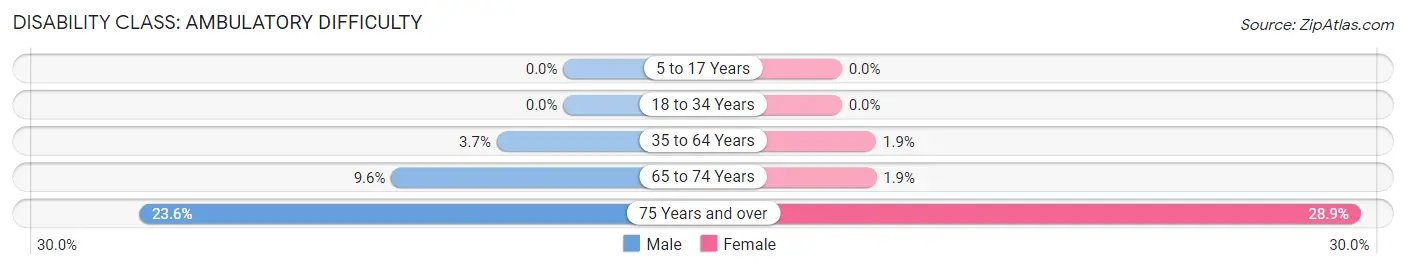
| Age Bracket | Male | Female |
| 5 to 17 Years | 0 (0.0%) | 0 (0.0%) |
| 18 to 34 Years | 0 (0.0%) | 0 (0.0%) |
| 35 to 64 Years | 52 (3.7%) | 22 (1.9%) |
| 65 to 74 Years | 34 (9.6%) | 7 (1.9%) |
| 75 Years and over | 43 (23.6%) | 65 (28.9%) |
Disability Class: Self-Care Difficulty
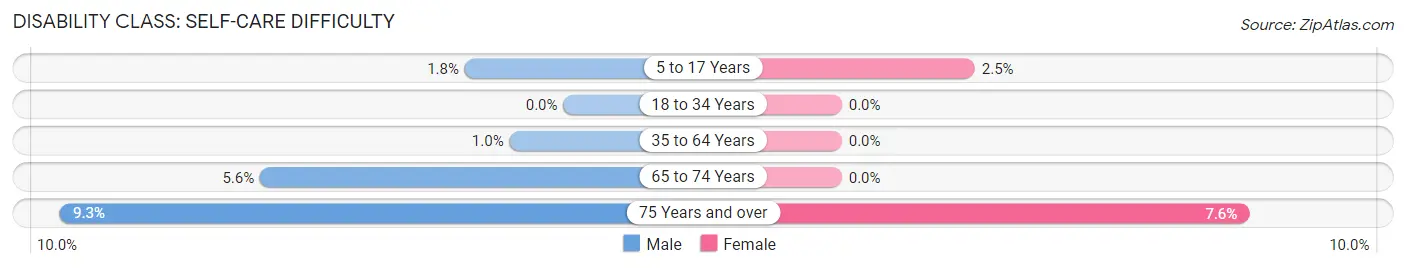
| Age Bracket | Male | Female |
| 5 to 17 Years | 10 (1.8%) | 13 (2.5%) |
| 18 to 34 Years | 0 (0.0%) | 0 (0.0%) |
| 35 to 64 Years | 14 (1.0%) | 0 (0.0%) |
| 65 to 74 Years | 20 (5.6%) | 0 (0.0%) |
| 75 Years and over | 17 (9.3%) | 17 (7.6%) |
Technology Access in Manasquan borough
Computing Device Access in Manasquan borough
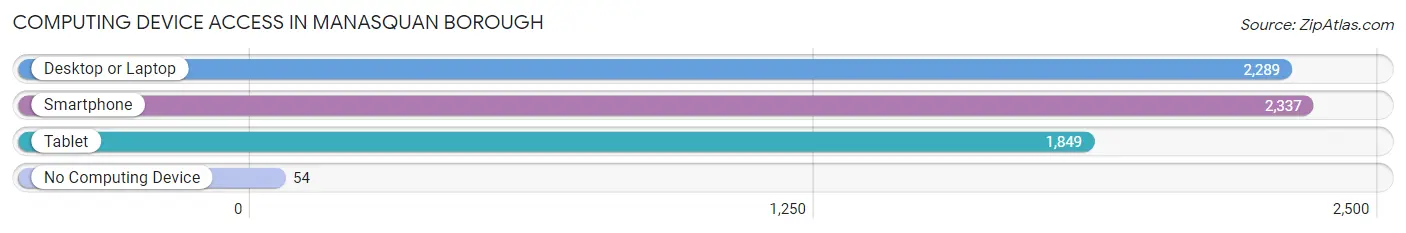
| Device Type | # Households | % Households |
| Desktop or Laptop | 2,289 | 91.5% |
| Smartphone | 2,337 | 93.4% |
| Tablet | 1,849 | 73.9% |
| No Computing Device | 54 | 2.2% |
| Total | 2,501 | 100.0% |
Internet Access in Manasquan borough
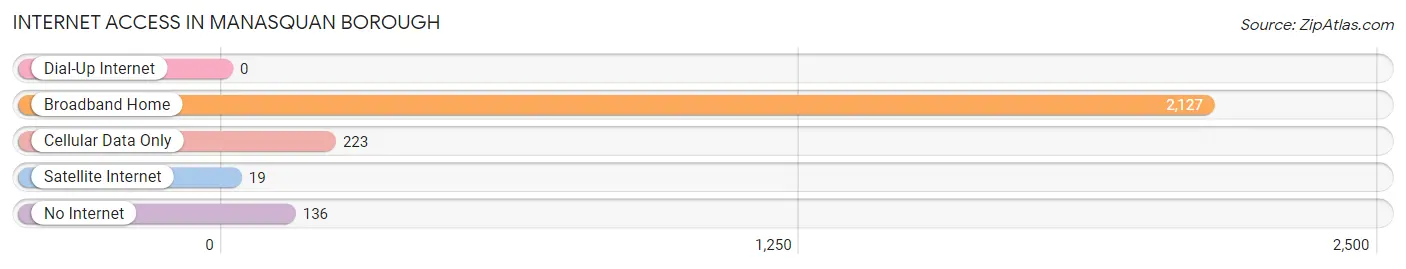
| Internet Type | # Households | % Households |
| Dial-Up Internet | 0 | 0.0% |
| Broadband Home | 2,127 | 85.1% |
| Cellular Data Only | 223 | 8.9% |
| Satellite Internet | 19 | 0.8% |
| No Internet | 136 | 5.4% |
| Total | 2,501 | 100.0% |
Manasquan borough Summary
Manasquan Borough is a small borough located in Monmouth County, New Jersey. It is situated on the Atlantic Ocean and is part of the Jersey Shore region. The borough has a population of 5,897 as of the 2010 census and covers an area of 1.9 square miles.
History
The area that is now Manasquan Borough was originally inhabited by the Lenape Native Americans. The first European settlers arrived in the area in the late 17th century and the area was officially incorporated as a borough in 1887. The borough was named after the Manasquan River, which was named after the Lenape word for “stream of the island”.
The borough was a popular destination for vacationers in the late 19th and early 20th centuries. The area was known for its beaches, fishing, and other recreational activities. The borough was also home to several resorts and hotels, including the Manasquan Hotel, which was built in 1887 and was one of the first hotels in the area.
Geography
Manasquan Borough is located in Monmouth County, New Jersey. It is situated on the Atlantic Ocean and is part of the Jersey Shore region. The borough has a total area of 1.9 square miles, all of which is land. The borough is bordered by the Manasquan River to the north and the Atlantic Ocean to the east.
The borough is located in a humid subtropical climate zone, with hot, humid summers and mild winters. The average temperature in the summer is around 75°F and the average temperature in the winter is around 40°F. The average annual precipitation is around 45 inches.
Economy
The economy of Manasquan Borough is largely based on tourism and recreation. The borough is home to several beaches, parks, and other recreational areas, which attract visitors from all over the region. The borough is also home to several restaurants, bars, and shops, which cater to tourists and locals alike.
The borough is also home to several businesses, including a number of professional services firms, retail stores, and manufacturing companies. The borough is also home to a number of financial institutions, including banks, credit unions, and insurance companies.
Demographics
As of the 2010 census, the population of Manasquan Borough was 5,897. The racial makeup of the borough was 94.3% White, 2.2% African American, 0.3% Native American, 1.2% Asian, 0.1% Pacific Islander, 0.7% from other races, and 1.3% from two or more races. Hispanic or Latino of any race were 3.2% of the population.
The median household income in Manasquan Borough was $76,944 in 2017. The per capita income in the borough was $41,945 in 2017. The median age in the borough was 44.7 years in 2017. The borough is home to a number of educational institutions, including Manasquan High School, Manasquan Elementary School, and Manasquan Middle School.
Common Questions
What is the Total Population of Manasquan borough?
Total Population of Manasquan borough is 5,921.
What is the Total Male Population of Manasquan borough?
Total Male Population of Manasquan borough is 2,995.
What is the Total Female Population of Manasquan borough?
Total Female Population of Manasquan borough is 2,926.
What is the Ratio of Males per 100 Females in Manasquan borough?
There are 102.36 Males per 100 Females in Manasquan borough.
What is the Ratio of Females per 100 Males in Manasquan borough?
There are 97.70 Females per 100 Males in Manasquan borough.
What is the Median Population Age in Manasquan borough?
Median Population Age in Manasquan borough is 47.5 Years.
What is the Average Family Size in Manasquan borough
Average Family Size in Manasquan borough is 3.0 People.
What is the Average Household Size in Manasquan borough
Average Household Size in Manasquan borough is 2.4 People.
What is Per Capita Income in Manasquan borough?
Per Capita income in Manasquan borough is $84,708.
What is the Median Family Income in Manasquan borough?
Median Family Income in Manasquan borough is $178,750.
What is the Median Household income in Manasquan borough?
Median Household Income in Manasquan borough is $130,240.
What is Income or Wage Gap in Manasquan borough?
Income or Wage Gap in Manasquan borough is 42.3%.
Women in Manasquan borough earn 57.7 cents for every dollar earned by a man.
What is Inequality or Gini Index in Manasquan borough?
Inequality or Gini Index in Manasquan borough is 0.52.
How Large is the Labor Force in Manasquan borough?
There are 3,269 People in the Labor Forcein in Manasquan borough.
What is the Percentage of People in the Labor Force in Manasquan borough?
67.4% of People are in the Labor Force in Manasquan borough.
What is the Unemployment Rate in Manasquan borough?
Unemployment Rate in Manasquan borough is 4.5%.