Riverton borough, NJ
Riverton borough Overview
2,764
TOTAL POPULATION
1,359
MALE POPULATION
1,405
FEMALE POPULATION
96.73
MALES / 100 FEMALES
103.38
FEMALES / 100 MALES
42.0
MEDIAN AGE
3.0
AVG FAMILY SIZE
2.6
AVG HOUSEHOLD SIZE
$54,499
PER CAPITA INCOME
$132,593
AVG FAMILY INCOME
$122,069
AVG HOUSEHOLD INCOME
12.0%
WAGE / INCOME GAP [ % ]
88.0¢/ $1
WAGE / INCOME GAP [ $ ]
0.35
INEQUALITY / GINI INDEX
1,594
LABOR FORCE [ PEOPLE ]
73.0%
PERCENT IN LABOR FORCE
4.0%
UNEMPLOYMENT RATE
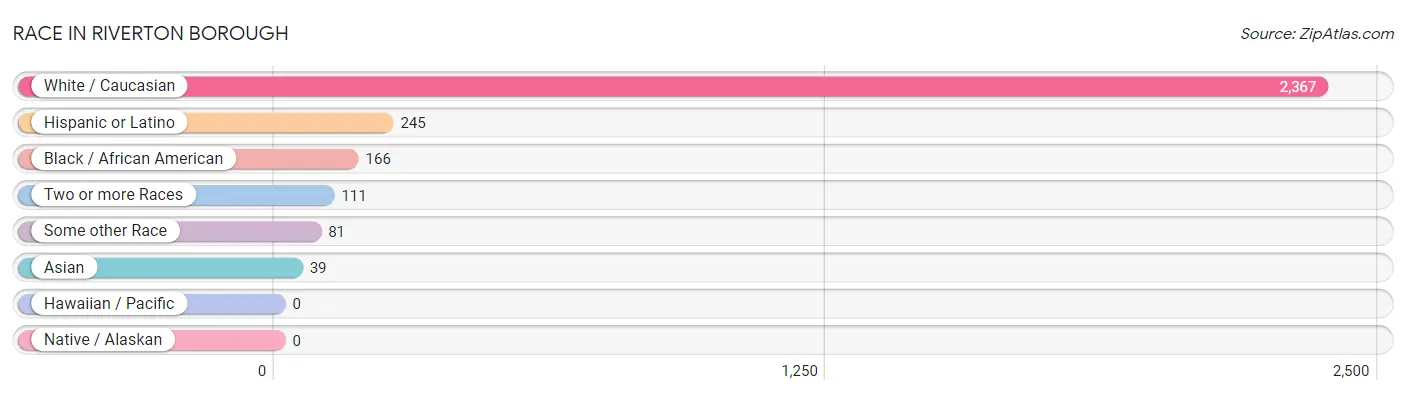
Race in Riverton borough
The most populous races in Riverton borough are White / Caucasian (2,367 | 85.6%), Hispanic or Latino (245 | 8.9%), and Black / African American (166 | 6.0%).
| Race | # Population | % Population |
| Asian | 39 | 1.4% |
| Black / African American | 166 | 6.0% |
| Hawaiian / Pacific | 0 | 0.0% |
| Hispanic or Latino | 245 | 8.9% |
| Native / Alaskan | 0 | 0.0% |
| White / Caucasian | 2,367 | 85.6% |
| Two or more Races | 111 | 4.0% |
| Some other Race | 81 | 2.9% |
| Total | 2,764 | 100.0% |
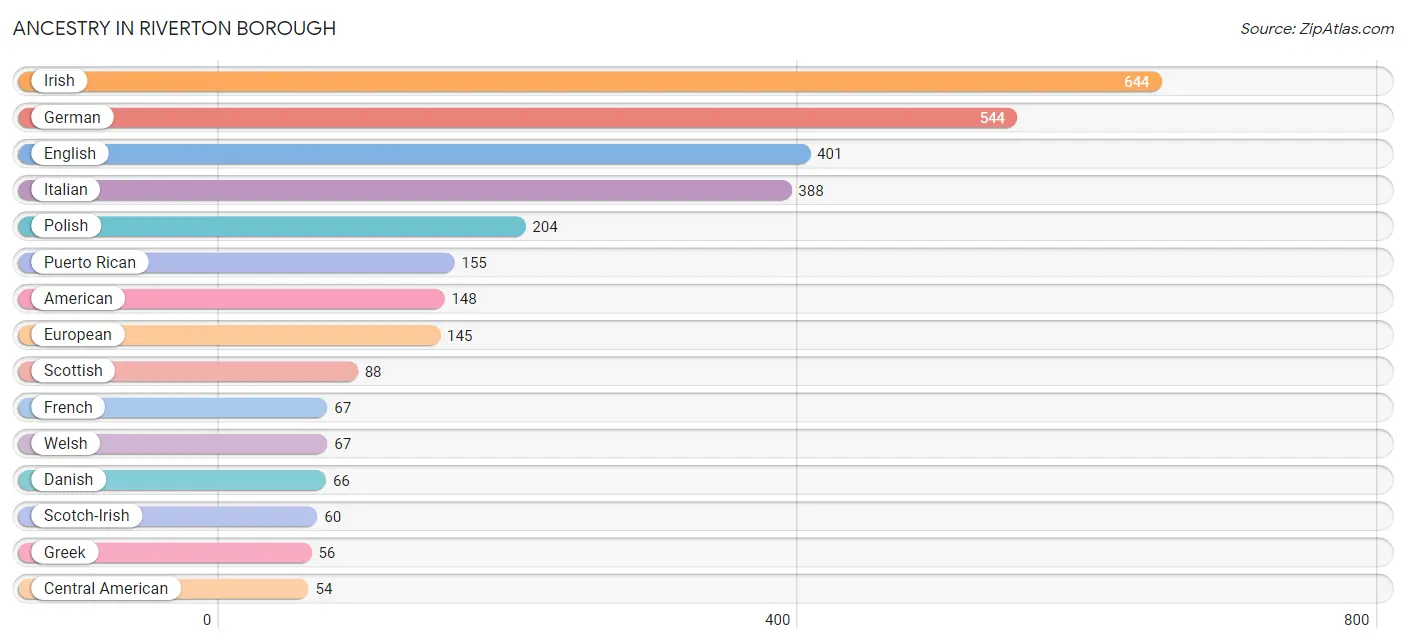
Ancestry in Riverton borough
The most populous ancestries reported in Riverton borough are Irish (644 | 23.3%), German (544 | 19.7%), English (401 | 14.5%), Italian (388 | 14.0%), and Polish (204 | 7.4%), together accounting for 78.9% of all Riverton borough residents.
| Ancestry | # Population | % Population |
| American | 148 | 5.3% |
| Argentinean | 6 | 0.2% |
| Australian | 5 | 0.2% |
| Belgian | 8 | 0.3% |
| British | 43 | 1.6% |
| Canadian | 5 | 0.2% |
| Central American | 54 | 1.9% |
| Czech | 4 | 0.1% |
| Danish | 66 | 2.4% |
| Dominican | 6 | 0.2% |
| Dutch | 43 | 1.6% |
| Eastern European | 5 | 0.2% |
| English | 401 | 14.5% |
| European | 145 | 5.2% |
| Finnish | 6 | 0.2% |
| French | 67 | 2.4% |
| French Canadian | 9 | 0.3% |
| German | 544 | 19.7% |
| Greek | 56 | 2.0% |
| Guatemalan | 13 | 0.5% |
| Haitian | 21 | 0.8% |
| Indian (Asian) | 25 | 0.9% |
| Irish | 644 | 23.3% |
| Italian | 388 | 14.0% |
| Mexican | 24 | 0.9% |
| Nicaraguan | 41 | 1.5% |
| Norwegian | 31 | 1.1% |
| Polish | 204 | 7.4% |
| Portuguese | 5 | 0.2% |
| Puerto Rican | 155 | 5.6% |
| Russian | 26 | 0.9% |
| Scandinavian | 6 | 0.2% |
| Scotch-Irish | 60 | 2.2% |
| Scottish | 88 | 3.2% |
| South American | 6 | 0.2% |
| Sri Lankan | 37 | 1.3% |
| Swedish | 14 | 0.5% |
| Swiss | 6 | 0.2% |
| Welsh | 67 | 2.4% | View All 39 Rows |
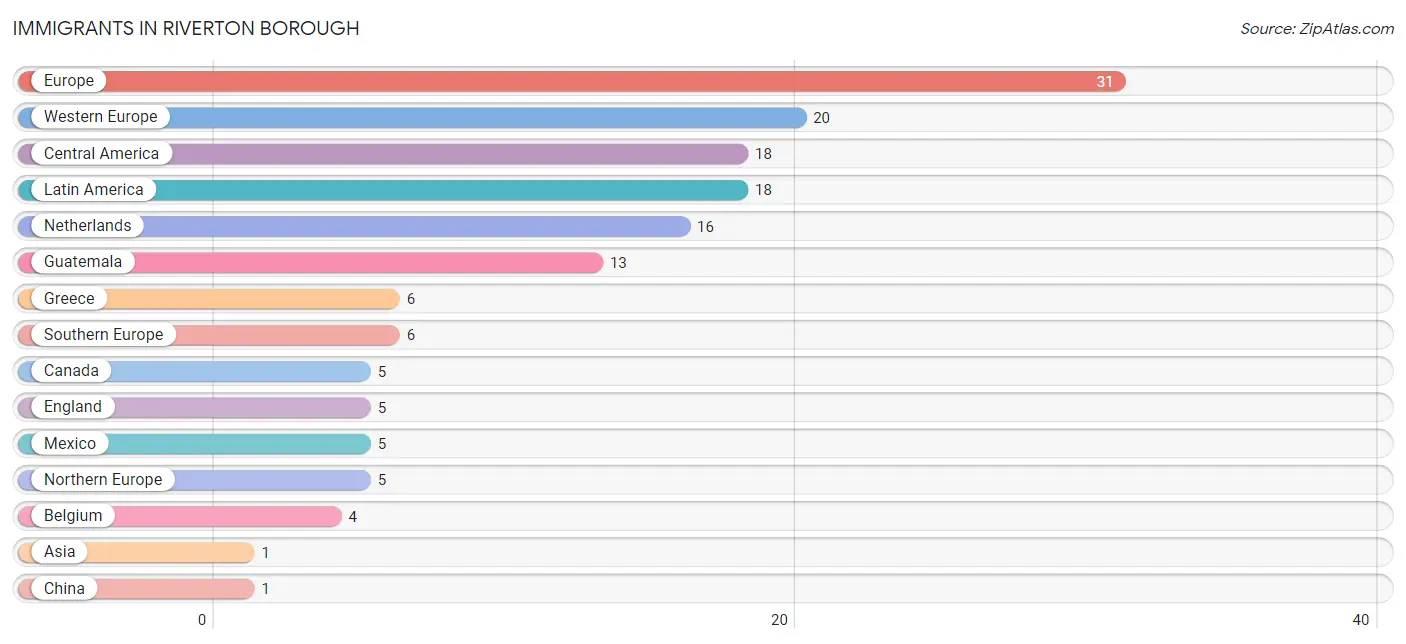
Immigrants in Riverton borough
The most numerous immigrant groups reported in Riverton borough came from Europe (31 | 1.1%), Western Europe (20 | 0.7%), Central America (18 | 0.6%), Latin America (18 | 0.6%), and Netherlands (16 | 0.6%), together accounting for 3.7% of all Riverton borough residents.
| Immigration Origin | # Population | % Population |
| Asia | 1 | 0.0% |
| Belgium | 4 | 0.1% |
| Canada | 5 | 0.2% |
| Central America | 18 | 0.6% |
| China | 1 | 0.0% |
| Eastern Asia | 1 | 0.0% |
| England | 5 | 0.2% |
| Europe | 31 | 1.1% |
| Greece | 6 | 0.2% |
| Guatemala | 13 | 0.5% |
| Latin America | 18 | 0.6% |
| Mexico | 5 | 0.2% |
| Netherlands | 16 | 0.6% |
| Northern Europe | 5 | 0.2% |
| Southern Europe | 6 | 0.2% |
| Taiwan | 1 | 0.0% |
| Western Europe | 20 | 0.7% | View All 17 Rows |
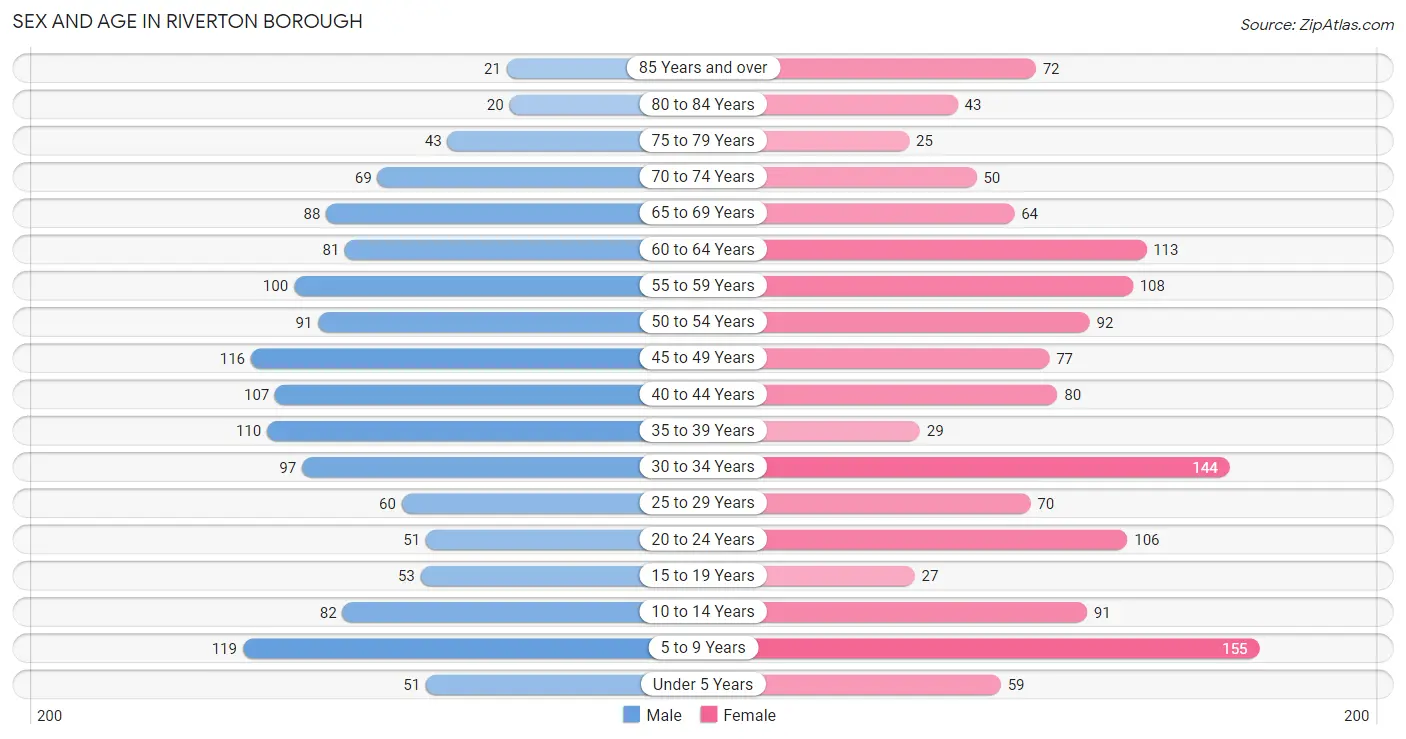
Sex and Age in Riverton borough
Sex and Age in Riverton borough
The most populous age groups in Riverton borough are 5 to 9 Years (119 | 8.8%) for men and 5 to 9 Years (155 | 11.0%) for women.
| Age Bracket | Male | Female |
| Under 5 Years | 51 (3.7%) | 59 (4.2%) |
| 5 to 9 Years | 119 (8.8%) | 155 (11.0%) |
| 10 to 14 Years | 82 (6.0%) | 91 (6.5%) |
| 15 to 19 Years | 53 (3.9%) | 27 (1.9%) |
| 20 to 24 Years | 51 (3.7%) | 106 (7.5%) |
| 25 to 29 Years | 60 (4.4%) | 70 (5.0%) |
| 30 to 34 Years | 97 (7.1%) | 144 (10.2%) |
| 35 to 39 Years | 110 (8.1%) | 29 (2.1%) |
| 40 to 44 Years | 107 (7.9%) | 80 (5.7%) |
| 45 to 49 Years | 116 (8.5%) | 77 (5.5%) |
| 50 to 54 Years | 91 (6.7%) | 92 (6.6%) |
| 55 to 59 Years | 100 (7.4%) | 108 (7.7%) |
| 60 to 64 Years | 81 (6.0%) | 113 (8.0%) |
| 65 to 69 Years | 88 (6.5%) | 64 (4.6%) |
| 70 to 74 Years | 69 (5.1%) | 50 (3.6%) |
| 75 to 79 Years | 43 (3.2%) | 25 (1.8%) |
| 80 to 84 Years | 20 (1.5%) | 43 (3.1%) |
| 85 Years and over | 21 (1.5%) | 72 (5.1%) |
| Total | 1,359 (100.0%) | 1,405 (100.0%) |
Families and Households in Riverton borough
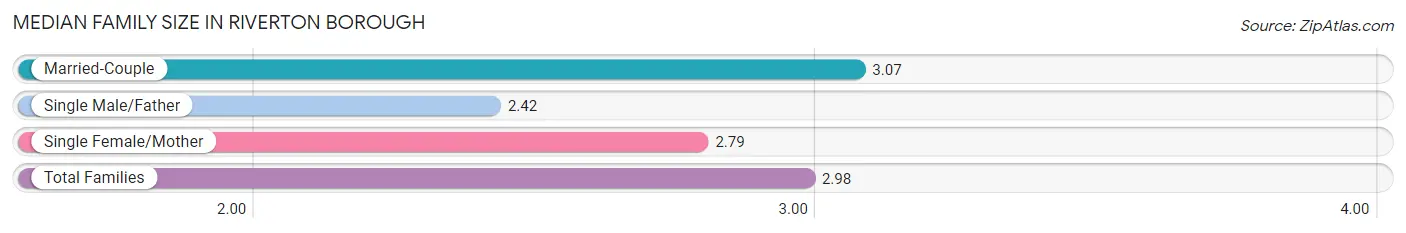
Median Family Size in Riverton borough
The median family size in Riverton borough is 2.98 persons per family, with married-couple families (602 | 82.7%) accounting for the largest median family size of 3.07 persons per family. On the other hand, single male/father families (97 | 13.3%) represent the smallest median family size with 2.42 persons per family.
| Family Type | # Families | Family Size |
| Married-Couple | 602 (82.7%) | 3.07 |
| Single Male/Father | 97 (13.3%) | 2.42 |
| Single Female/Mother | 29 (4.0%) | 2.79 |
| Total Families | 728 (100.0%) | 2.98 |
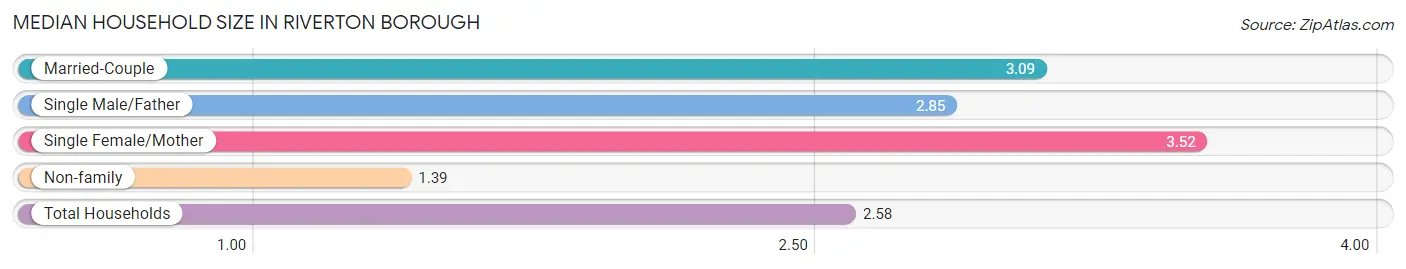
Median Household Size in Riverton borough
The median household size in Riverton borough is 2.58 persons per household, with single female/mother households (29 | 2.8%) accounting for the largest median household size of 3.52 persons per household. non-family households (300 | 29.2%) represent the smallest median household size with 1.39 persons per household.
| Household Type | # Households | Household Size |
| Married-Couple | 602 (58.6%) | 3.09 |
| Single Male/Father | 97 (9.4%) | 2.85 |
| Single Female/Mother | 29 (2.8%) | 3.52 |
| Non-family | 300 (29.2%) | 1.39 |
| Total Households | 1,028 (100.0%) | 2.58 |
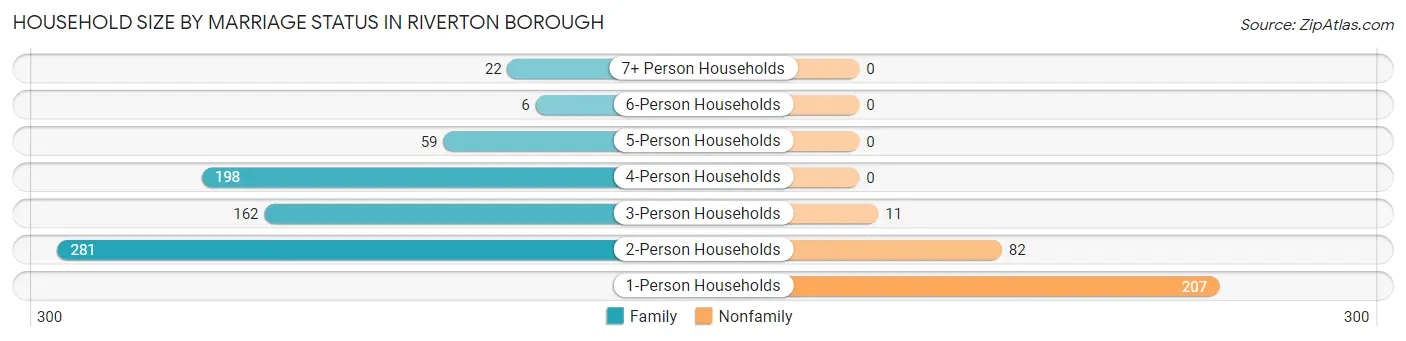
Household Size by Marriage Status in Riverton borough
Out of a total of 1,028 households in Riverton borough, 728 (70.8%) are family households, while 300 (29.2%) are nonfamily households. The most numerous type of family households are 2-person households, comprising 281, and the most common type of nonfamily households are 1-person households, comprising 207.
| Household Size | Family Households | Nonfamily Households |
| 1-Person Households | - | 207 (20.1%) |
| 2-Person Households | 281 (27.3%) | 82 (8.0%) |
| 3-Person Households | 162 (15.8%) | 11 (1.1%) |
| 4-Person Households | 198 (19.3%) | 0 (0.0%) |
| 5-Person Households | 59 (5.7%) | 0 (0.0%) |
| 6-Person Households | 6 (0.6%) | 0 (0.0%) |
| 7+ Person Households | 22 (2.1%) | 0 (0.0%) |
| Total | 728 (70.8%) | 300 (29.2%) |
Female Fertility in Riverton borough
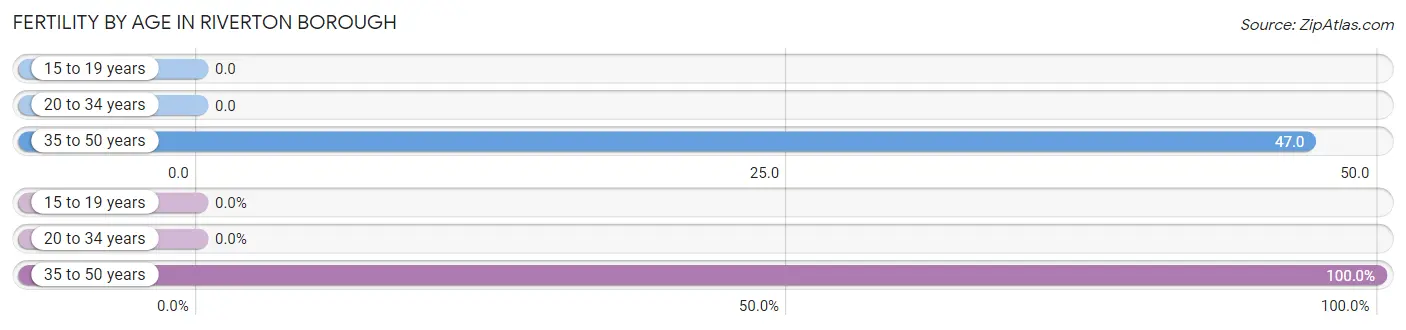
Fertility by Age in Riverton borough
Average fertility rate in Riverton borough is 17.0 births per 1,000 women. Women in the age bracket of 35 to 50 years have the highest fertility rate with 47.0 births per 1,000 women. Women in the age bracket of 35 to 50 years acount for 100.0% of all women with births.
| Age Bracket | Women with Births | Births / 1,000 Women |
| 15 to 19 years | 0 (0.0%) | 0.0 |
| 20 to 34 years | 0 (0.0%) | 0.0 |
| 35 to 50 years | 9 (100.0%) | 47.0 |
| Total | 9 (100.0%) | 17.0 |
Fertility by Age by Marriage Status in Riverton borough
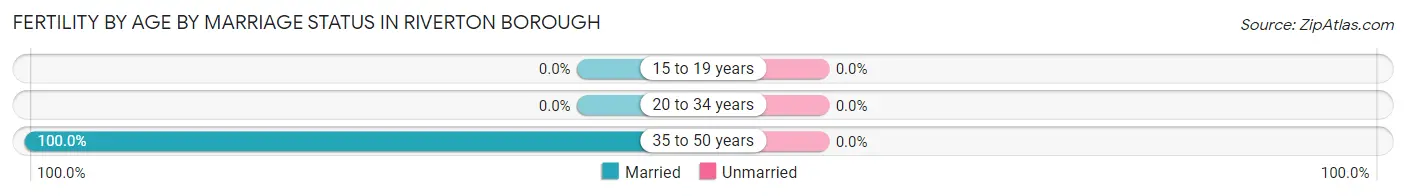
| Age Bracket | Married | Unmarried |
| 15 to 19 years | 0 (0.0%) | 0 (0.0%) |
| 20 to 34 years | 0 (0.0%) | 0 (0.0%) |
| 35 to 50 years | 9 (100.0%) | 0 (0.0%) |
| Total | 9 (100.0%) | 0 (0.0%) |
Fertility by Education in Riverton borough
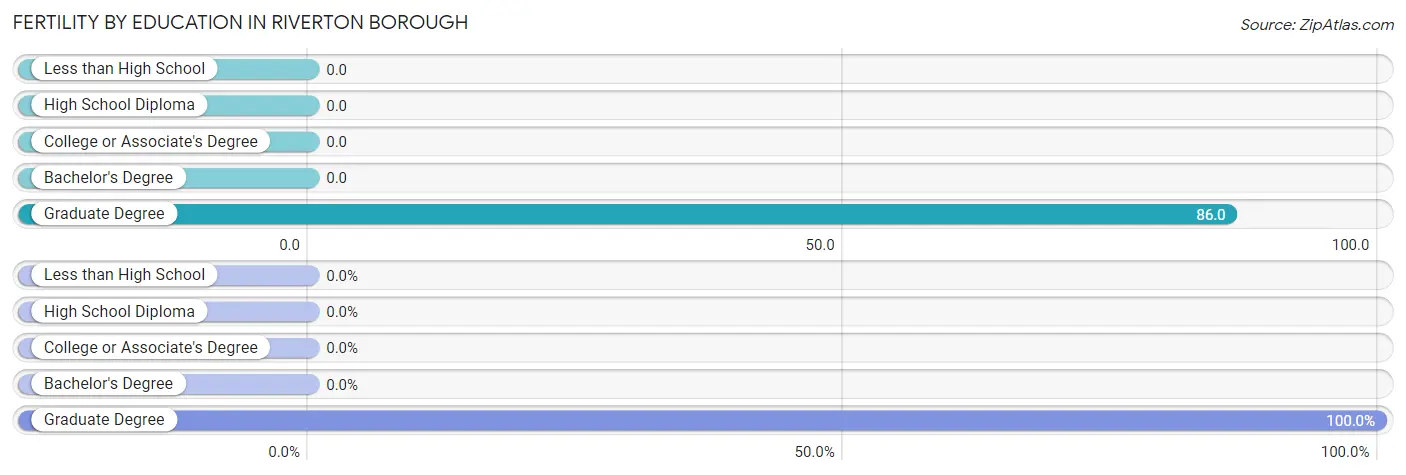
| Educational Attainment | Women with Births | Births / 1,000 Women |
| Less than High School | 0 (0.0%) | 0.0 |
| High School Diploma | 0 (0.0%) | 0.0 |
| College or Associate's Degree | 0 (0.0%) | 0.0 |
| Bachelor's Degree | 0 (0.0%) | 0.0 |
| Graduate Degree | 9 (100.0%) | 86.0 |
| Total | 9 (100.0%) | 17.0 |
Fertility by Education by Marriage Status in Riverton borough
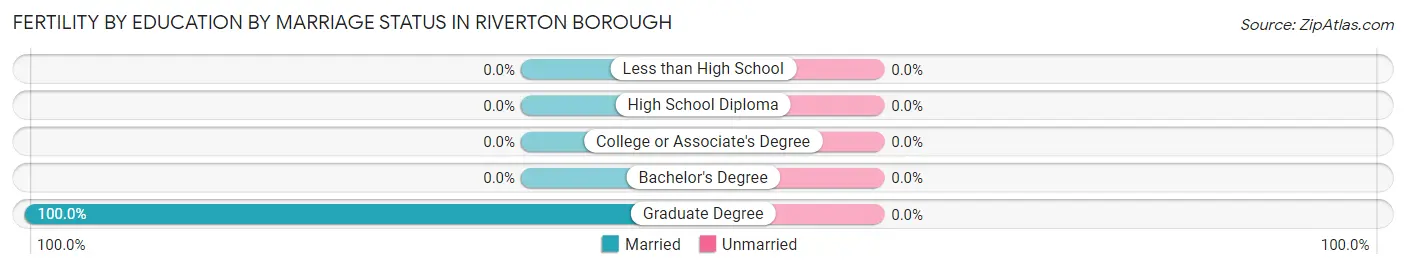
| Educational Attainment | Married | Unmarried |
| Less than High School | 0 (0.0%) | 0 (0.0%) |
| High School Diploma | 0 (0.0%) | 0 (0.0%) |
| College or Associate's Degree | 0 (0.0%) | 0 (0.0%) |
| Bachelor's Degree | 0 (0.0%) | 0 (0.0%) |
| Graduate Degree | 9 (100.0%) | 0 (0.0%) |
| Total | 9 (100.0%) | 0 (0.0%) |
Income in Riverton borough
Income Overview in Riverton borough
Per Capita Income in Riverton borough is $54,499, while median incomes of families and households are $132,593 and $122,069 respectively.
| Characteristic | Number | Measure |
| Per Capita Income | 2,764 | $54,499 |
| Median Family Income | 728 | $132,593 |
| Mean Family Income | 728 | $158,088 |
| Median Household Income | 1,028 | $122,069 |
| Mean Household Income | 1,028 | $144,689 |
| Income Deficit | 728 | $0 |
| Wage / Income Gap (%) | 2,764 | 11.98% |
| Wage / Income Gap ($) | 2,764 | 88.02¢ per $1 |
| Gini / Inequality Index | 2,764 | 0.35 |
Earnings by Sex in Riverton borough
Average Earnings in Riverton borough are $62,946, $67,083 for men and $59,048 for women, a difference of 12.0%.
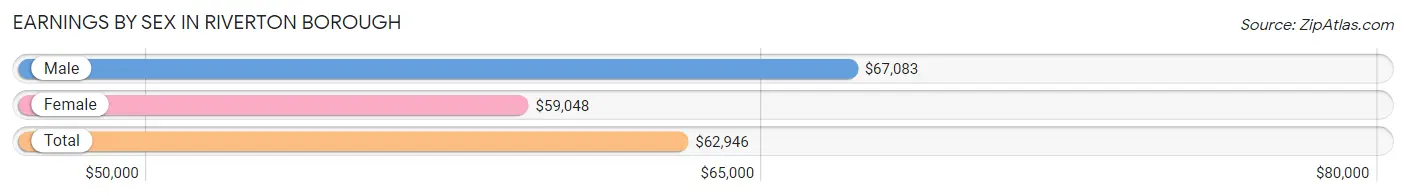
| Sex | Number | Average Earnings |
| Male | 857 (51.9%) | $67,083 |
| Female | 794 (48.1%) | $59,048 |
| Total | 1,651 (100.0%) | $62,946 |
Earnings by Sex by Income Bracket in Riverton borough
The most common earnings brackets in Riverton borough are $100,000+ for men (287 | 33.5%) and $100,000+ for women (154 | 19.4%).
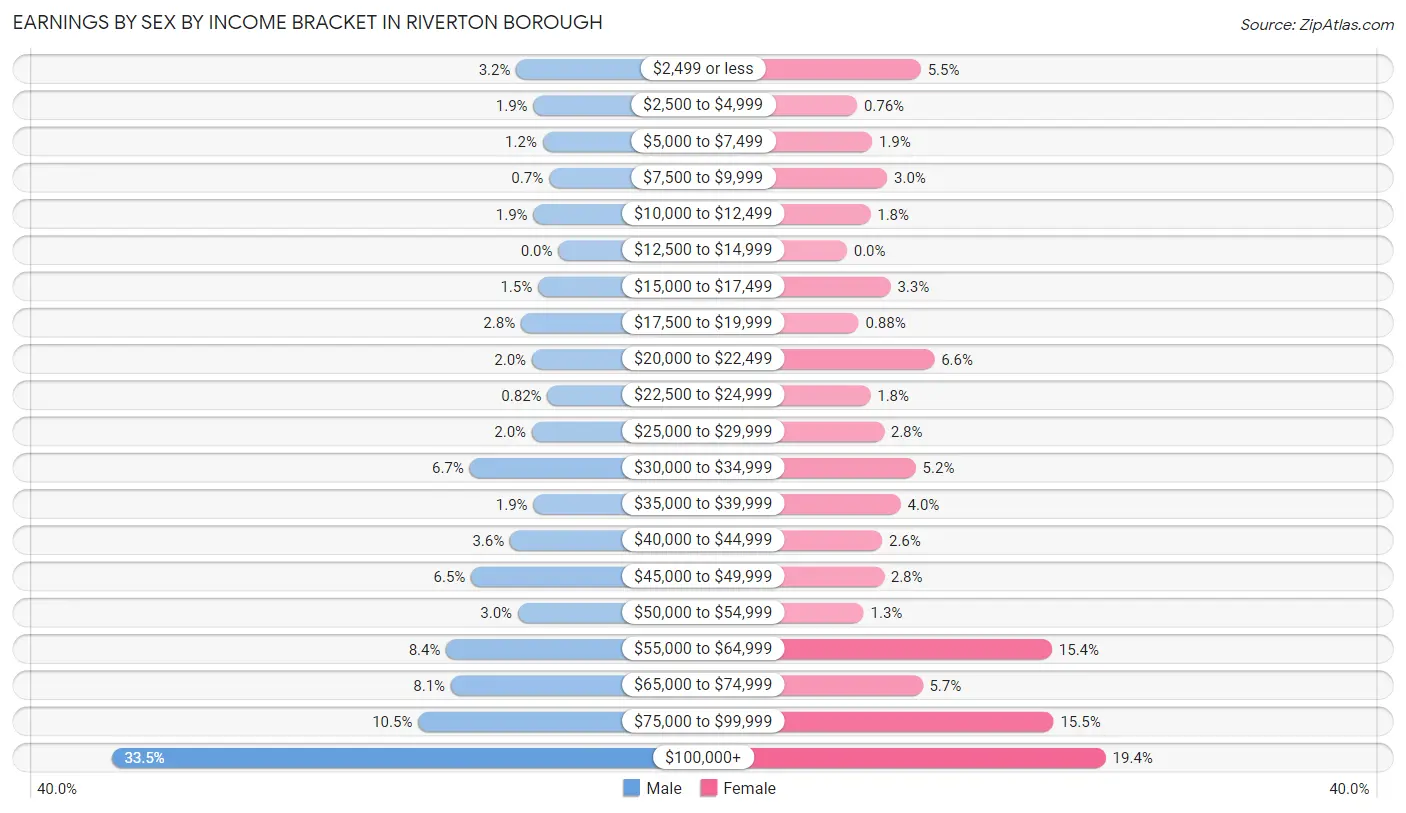
| Income | Male | Female |
| $2,499 or less | 27 (3.2%) | 44 (5.5%) |
| $2,500 to $4,999 | 16 (1.9%) | 6 (0.8%) |
| $5,000 to $7,499 | 10 (1.2%) | 15 (1.9%) |
| $7,500 to $9,999 | 6 (0.7%) | 24 (3.0%) |
| $10,000 to $12,499 | 16 (1.9%) | 14 (1.8%) |
| $12,500 to $14,999 | 0 (0.0%) | 0 (0.0%) |
| $15,000 to $17,499 | 13 (1.5%) | 26 (3.3%) |
| $17,500 to $19,999 | 24 (2.8%) | 7 (0.9%) |
| $20,000 to $22,499 | 17 (2.0%) | 52 (6.6%) |
| $22,500 to $24,999 | 7 (0.8%) | 14 (1.8%) |
| $25,000 to $29,999 | 17 (2.0%) | 22 (2.8%) |
| $30,000 to $34,999 | 57 (6.7%) | 41 (5.2%) |
| $35,000 to $39,999 | 16 (1.9%) | 32 (4.0%) |
| $40,000 to $44,999 | 31 (3.6%) | 21 (2.6%) |
| $45,000 to $49,999 | 56 (6.5%) | 22 (2.8%) |
| $50,000 to $54,999 | 26 (3.0%) | 10 (1.3%) |
| $55,000 to $64,999 | 72 (8.4%) | 122 (15.4%) |
| $65,000 to $74,999 | 69 (8.1%) | 45 (5.7%) |
| $75,000 to $99,999 | 90 (10.5%) | 123 (15.5%) |
| $100,000+ | 287 (33.5%) | 154 (19.4%) |
| Total | 857 (100.0%) | 794 (100.0%) |
Earnings by Sex by Educational Attainment in Riverton borough
Average earnings in Riverton borough are $68,802 for men and $63,184 for women, a difference of 8.2%. Men with an educational attainment of graduate degree enjoy the highest average annual earnings of $127,188, while those with high school diploma education earn the least with $45,375. Women with an educational attainment of graduate degree earn the most with the average annual earnings of $86,458, while those with college or associate's degree education have the smallest earnings of $34,662.
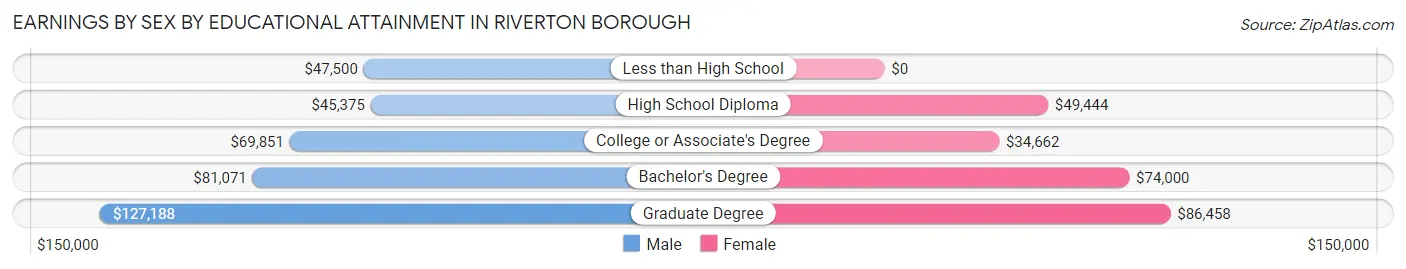
| Educational Attainment | Male Income | Female Income |
| Less than High School | $47,500 | $0 |
| High School Diploma | $45,375 | $49,444 |
| College or Associate's Degree | $69,851 | $34,662 |
| Bachelor's Degree | $81,071 | $74,000 |
| Graduate Degree | $127,188 | $86,458 |
| Total | $68,802 | $63,184 |
Family Income in Riverton borough
Family Income Brackets in Riverton borough
According to the Riverton borough family income data, there are 235 families falling into the $100,000 to $149,999 income range, which is the most common income bracket and makes up 32.3% of all families.
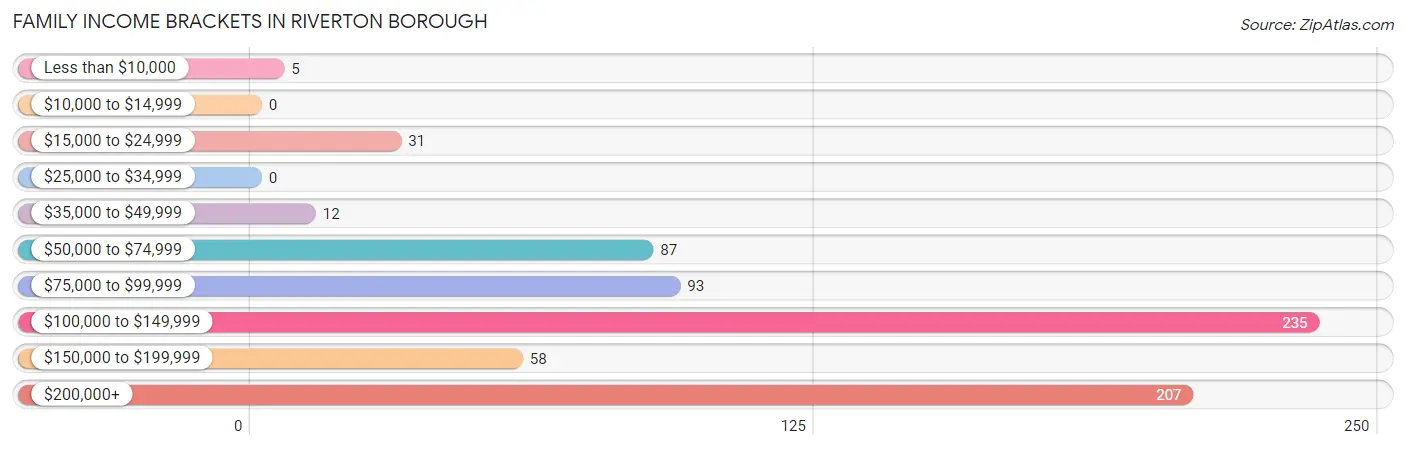
| Income Bracket | # Families | % Families |
| Less than $10,000 | 5 | 0.7% |
| $10,000 to $14,999 | 0 | 0.0% |
| $15,000 to $24,999 | 31 | 4.3% |
| $25,000 to $34,999 | 0 | 0.0% |
| $35,000 to $49,999 | 12 | 1.6% |
| $50,000 to $74,999 | 87 | 12.0% |
| $75,000 to $99,999 | 93 | 12.8% |
| $100,000 to $149,999 | 235 | 32.3% |
| $150,000 to $199,999 | 58 | 8.0% |
| $200,000+ | 207 | 28.4% |
Family Income by Famaliy Size in Riverton borough
3-person families (144 | 19.8%) account for the highest median family income in Riverton borough with $180,500 per family, while 3-person families (144 | 19.8%) have the highest median income of $60,167 per family member.
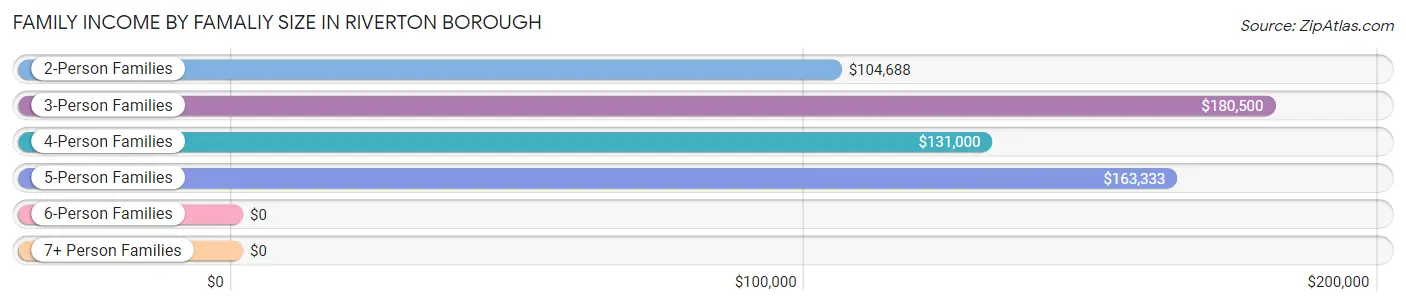
| Income Bracket | # Families | Median Income |
| 2-Person Families | 310 (42.6%) | $104,688 |
| 3-Person Families | 144 (19.8%) | $180,500 |
| 4-Person Families | 218 (29.9%) | $131,000 |
| 5-Person Families | 28 (3.8%) | $163,333 |
| 6-Person Families | 12 (1.7%) | $0 |
| 7+ Person Families | 16 (2.2%) | $0 |
| Total | 728 (100.0%) | $132,593 |
Family Income by Number of Earners in Riverton borough
The median family income in Riverton borough is $132,593, with families comprising 3+ earners (91) having the highest median family income of $240,625, while families with no earners (53) have the lowest median family income of $84,750, accounting for 12.5% and 7.3% of families, respectively.
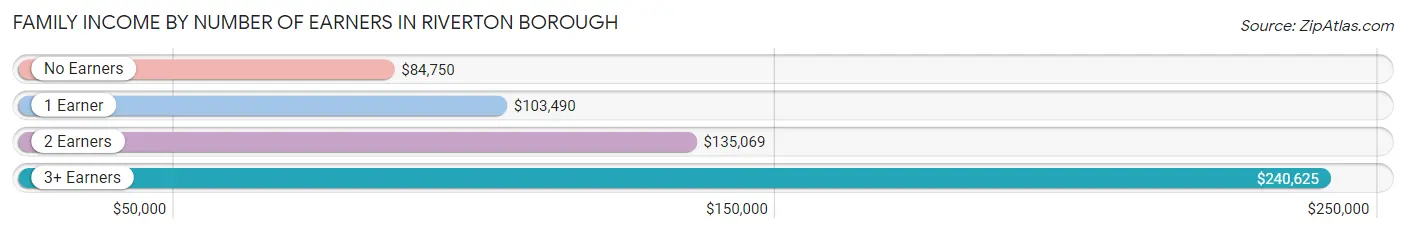
| Number of Earners | # Families | Median Income |
| No Earners | 53 (7.3%) | $84,750 |
| 1 Earner | 239 (32.8%) | $103,490 |
| 2 Earners | 345 (47.4%) | $135,069 |
| 3+ Earners | 91 (12.5%) | $240,625 |
| Total | 728 (100.0%) | $132,593 |
Household Income in Riverton borough
Household Income Brackets in Riverton borough
With 313 households falling in the category, the $100,000 to $149,999 income range is the most frequent in Riverton borough, accounting for 30.4% of all households. In contrast, only 5 households (0.5%) fall into the less than $10,000 income bracket, making it the least populous group.
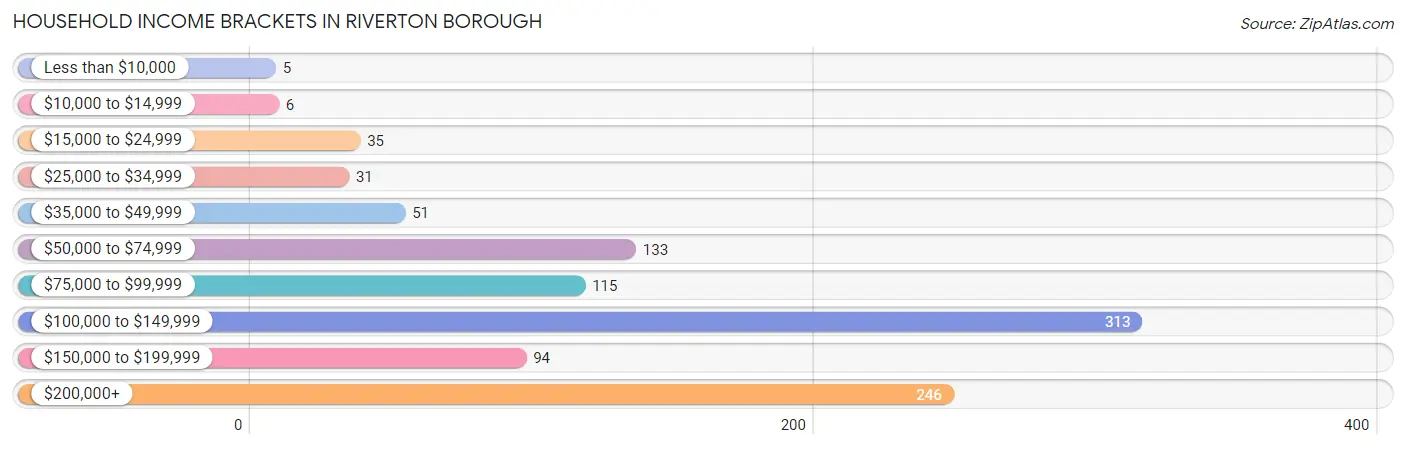
| Income Bracket | # Households | % Households |
| Less than $10,000 | 5 | 0.5% |
| $10,000 to $14,999 | 6 | 0.6% |
| $15,000 to $24,999 | 35 | 3.4% |
| $25,000 to $34,999 | 31 | 3.0% |
| $35,000 to $49,999 | 51 | 5.0% |
| $50,000 to $74,999 | 133 | 12.9% |
| $75,000 to $99,999 | 115 | 11.2% |
| $100,000 to $149,999 | 313 | 30.4% |
| $150,000 to $199,999 | 94 | 9.1% |
| $200,000+ | 246 | 23.9% |
Household Income by Householder Age in Riverton borough
The median household income in Riverton borough is $122,069, with the highest median household income of $168,214 found in the 45 to 64 years age bracket for the primary householder. A total of 410 households (39.9%) fall into this category. Meanwhile, the 15 to 24 years age bracket for the primary householder has the lowest median household income of $0, with 7 households (0.7%) in this group.
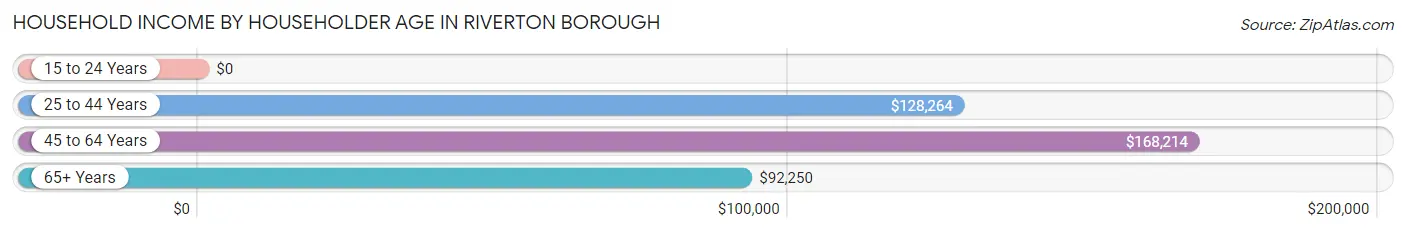
| Income Bracket | # Households | Median Income |
| 15 to 24 Years | 7 (0.7%) | $0 |
| 25 to 44 Years | 361 (35.1%) | $128,264 |
| 45 to 64 Years | 410 (39.9%) | $168,214 |
| 65+ Years | 250 (24.3%) | $92,250 |
| Total | 1,028 (100.0%) | $122,069 |
Poverty in Riverton borough
Income Below Poverty by Sex and Age in Riverton borough
With 3.6% poverty level for males and 2.2% for females among the residents of Riverton borough, under 5 year old males and under 5 year old females are the most vulnerable to poverty, with 7 males (13.7%) and 7 females (11.9%) in their respective age groups living below the poverty level.
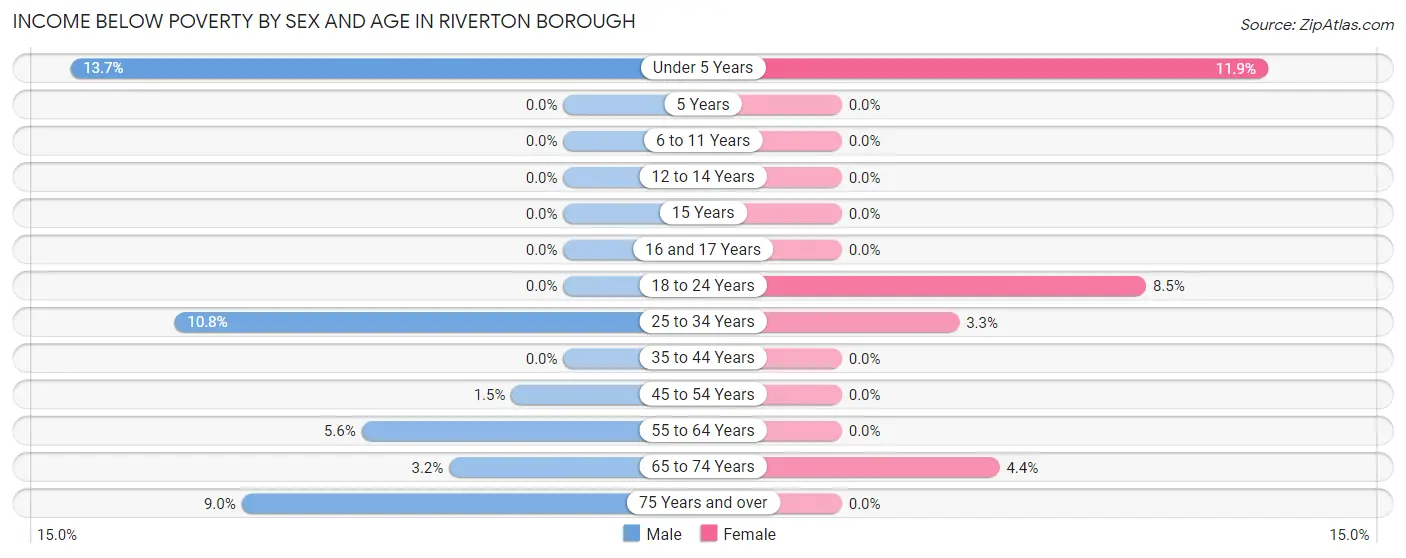
| Age Bracket | Male | Female |
| Under 5 Years | 7 (13.7%) | 7 (11.9%) |
| 5 Years | 0 (0.0%) | 0 (0.0%) |
| 6 to 11 Years | 0 (0.0%) | 0 (0.0%) |
| 12 to 14 Years | 0 (0.0%) | 0 (0.0%) |
| 15 Years | 0 (0.0%) | 0 (0.0%) |
| 16 and 17 Years | 0 (0.0%) | 0 (0.0%) |
| 18 to 24 Years | 0 (0.0%) | 10 (8.5%) |
| 25 to 34 Years | 17 (10.8%) | 7 (3.3%) |
| 35 to 44 Years | 0 (0.0%) | 0 (0.0%) |
| 45 to 54 Years | 3 (1.5%) | 0 (0.0%) |
| 55 to 64 Years | 10 (5.6%) | 0 (0.0%) |
| 65 to 74 Years | 5 (3.2%) | 5 (4.4%) |
| 75 Years and over | 6 (9.0%) | 0 (0.0%) |
| Total | 48 (3.6%) | 29 (2.2%) |
Income Above Poverty by Sex and Age in Riverton borough
According to the poverty statistics in Riverton borough, males aged 5 years and females aged 6 to 11 years are the age groups that are most secure financially, with 100.0% of males and 100.0% of females in these age groups living above the poverty line.
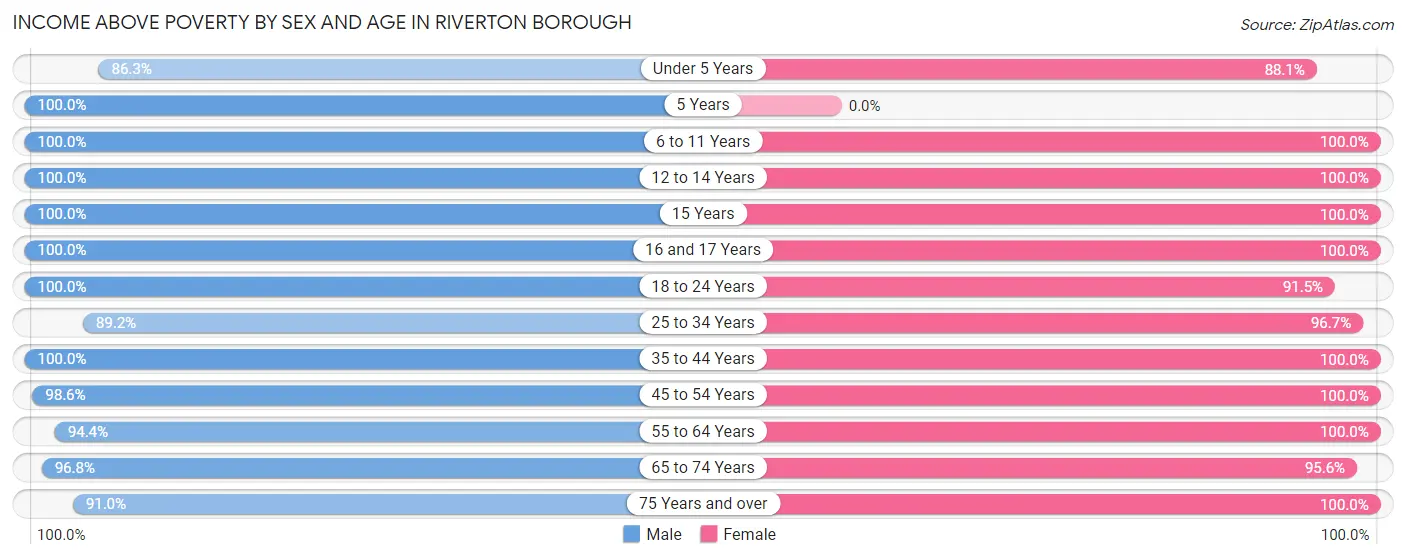
| Age Bracket | Male | Female |
| Under 5 Years | 44 (86.3%) | 52 (88.1%) |
| 5 Years | 8 (100.0%) | 0 (0.0%) |
| 6 to 11 Years | 132 (100.0%) | 217 (100.0%) |
| 12 to 14 Years | 61 (100.0%) | 29 (100.0%) |
| 15 Years | 17 (100.0%) | 7 (100.0%) |
| 16 and 17 Years | 25 (100.0%) | 8 (100.0%) |
| 18 to 24 Years | 62 (100.0%) | 108 (91.5%) |
| 25 to 34 Years | 140 (89.2%) | 207 (96.7%) |
| 35 to 44 Years | 217 (100.0%) | 109 (100.0%) |
| 45 to 54 Years | 204 (98.6%) | 169 (100.0%) |
| 55 to 64 Years | 168 (94.4%) | 215 (100.0%) |
| 65 to 74 Years | 152 (96.8%) | 109 (95.6%) |
| 75 Years and over | 61 (91.0%) | 61 (100.0%) |
| Total | 1,291 (96.4%) | 1,291 (97.8%) |
Income Below Poverty Among Married-Couple Families in Riverton borough
The poverty statistics for married-couple families in Riverton borough show that 2.0% or 12 of the total 602 families live below the poverty line. Families with 1 or 2 children have the highest poverty rate of 2.8%, comprising of 7 families. On the other hand, families with 3 or 4 children have the lowest poverty rate of 0.0%, which includes 0 families.
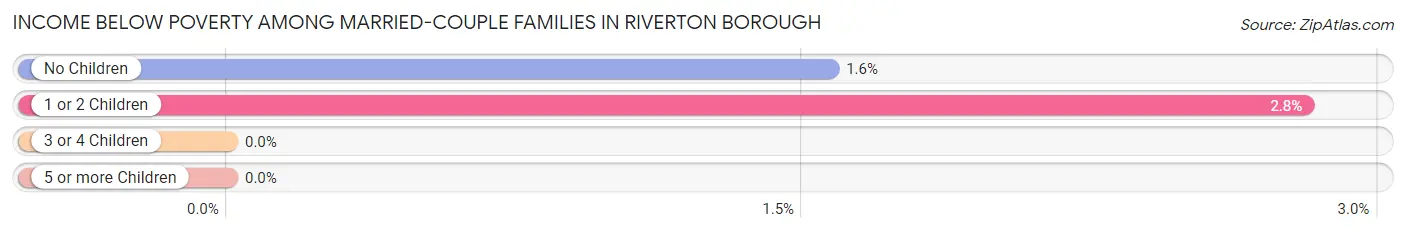
| Children | Above Poverty | Below Poverty |
| No Children | 313 (98.4%) | 5 (1.6%) |
| 1 or 2 Children | 242 (97.2%) | 7 (2.8%) |
| 3 or 4 Children | 19 (100.0%) | 0 (0.0%) |
| 5 or more Children | 16 (100.0%) | 0 (0.0%) |
| Total | 590 (98.0%) | 12 (2.0%) |
Income Below Poverty Among Single-Parent Households in Riverton borough
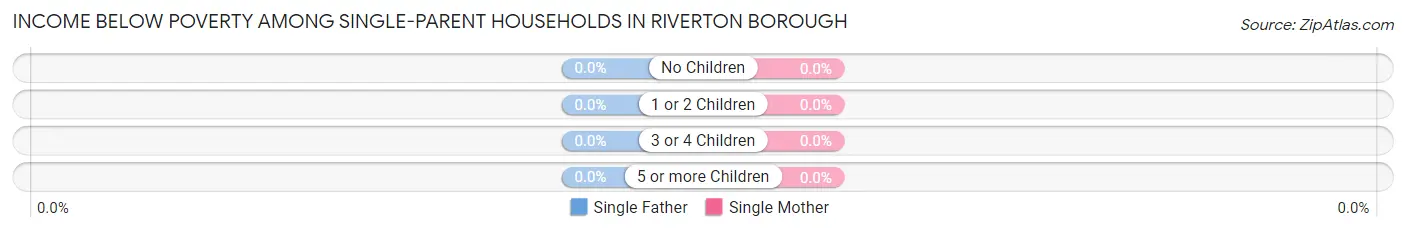
| Children | Single Father | Single Mother |
| No Children | 0 (0.0%) | 0 (0.0%) |
| 1 or 2 Children | 0 (0.0%) | 0 (0.0%) |
| 3 or 4 Children | 0 (0.0%) | 0 (0.0%) |
| 5 or more Children | 0 (0.0%) | 0 (0.0%) |
| Total | 0 (0.0%) | 0 (0.0%) |
Income Below Poverty Among Married-Couple vs Single-Parent Households in Riverton borough
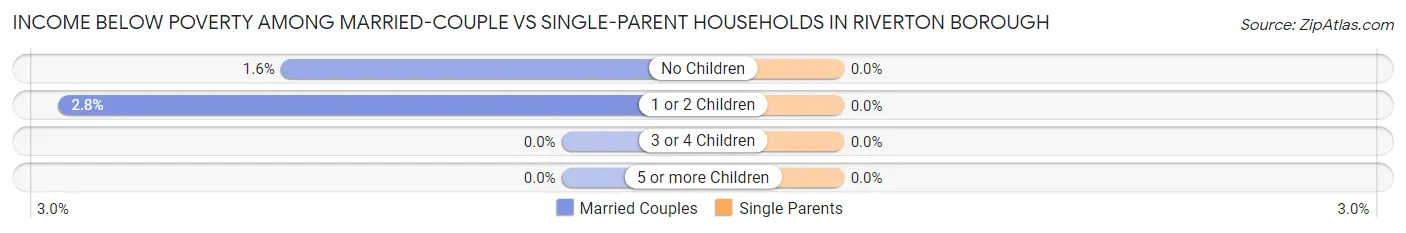
| Children | Married-Couple Families | Single-Parent Households |
| No Children | 5 (1.6%) | 0 (0.0%) |
| 1 or 2 Children | 7 (2.8%) | 0 (0.0%) |
| 3 or 4 Children | 0 (0.0%) | 0 (0.0%) |
| 5 or more Children | 0 (0.0%) | 0 (0.0%) |
| Total | 12 (2.0%) | 0 (0.0%) |
Employment Characteristics in Riverton borough
Employment by Class of Employer in Riverton borough
Among the 1,492 employed individuals in Riverton borough, private company employees (973 | 65.2%), not-for-profit organizations (172 | 11.5%), and local government employees (138 | 9.2%) make up the most common classes of employment.
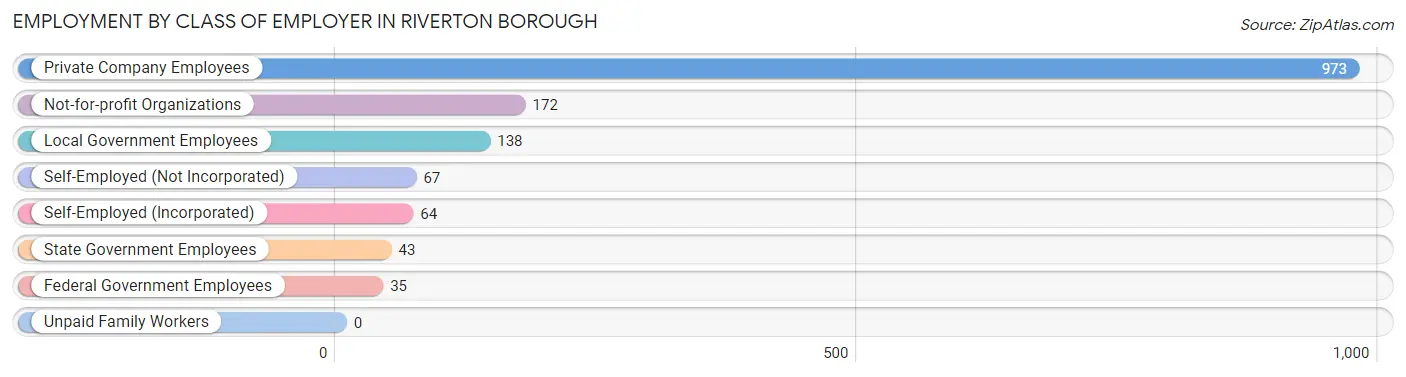
| Employer Class | # Employees | % Employees |
| Private Company Employees | 973 | 65.2% |
| Self-Employed (Incorporated) | 64 | 4.3% |
| Self-Employed (Not Incorporated) | 67 | 4.5% |
| Not-for-profit Organizations | 172 | 11.5% |
| Local Government Employees | 138 | 9.2% |
| State Government Employees | 43 | 2.9% |
| Federal Government Employees | 35 | 2.4% |
| Unpaid Family Workers | 0 | 0.0% |
| Total | 1,492 | 100.0% |
Employment Status by Age in Riverton borough
According to the labor force statistics for Riverton borough, out of the total population over 16 years of age (2,183), 73.0% or 1,594 individuals are in the labor force, with 4.0% or 64 of them unemployed. The age group with the highest labor force participation rate is 25 to 29 years, with 100.0% or 130 individuals in the labor force. Within the labor force, the 16 to 19 years age range has the highest percentage of unemployed individuals, with 21.4% or 6 of them being unemployed.
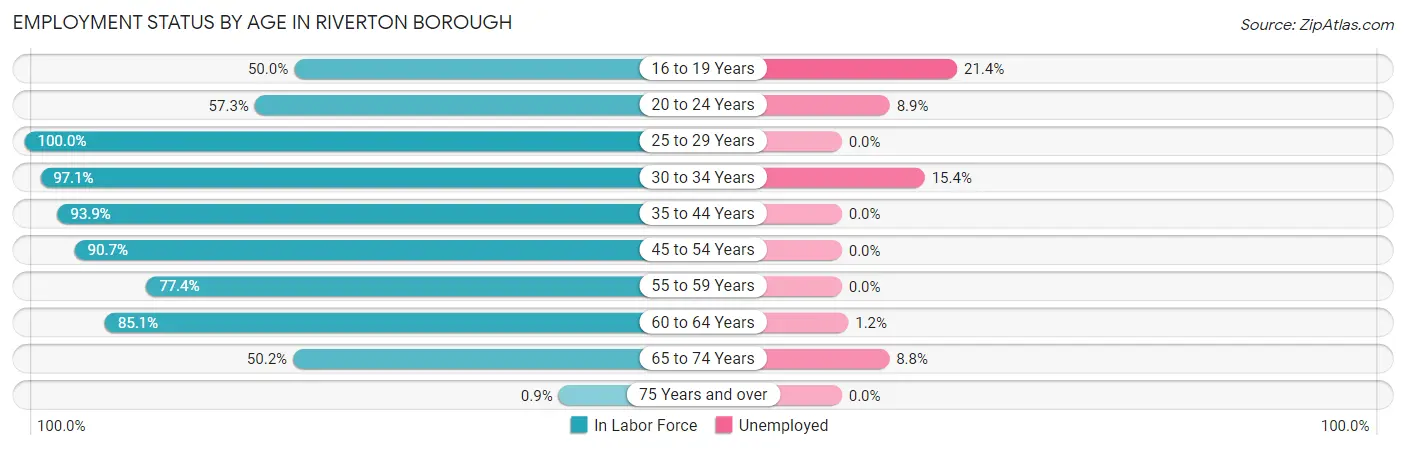
| Age Bracket | In Labor Force | Unemployed |
| 16 to 19 Years | 28 (50.0%) | 6 (21.4%) |
| 20 to 24 Years | 90 (57.3%) | 8 (8.9%) |
| 25 to 29 Years | 130 (100.0%) | 0 (0.0%) |
| 30 to 34 Years | 234 (97.1%) | 36 (15.4%) |
| 35 to 44 Years | 306 (93.9%) | 0 (0.0%) |
| 45 to 54 Years | 341 (90.7%) | 0 (0.0%) |
| 55 to 59 Years | 161 (77.4%) | 0 (0.0%) |
| 60 to 64 Years | 165 (85.1%) | 2 (1.2%) |
| 65 to 74 Years | 136 (50.2%) | 12 (8.8%) |
| 75 Years and over | 2 (0.9%) | 0 (0.0%) |
| Total | 1,594 (73.0%) | 64 (4.0%) |
Employment Status by Educational Attainment in Riverton borough
According to labor force statistics for Riverton borough, 90.6% of individuals (1,336) out of the total population between 25 and 64 years of age (1,475) are in the labor force, with 2.8% or 37 of them being unemployed. The group with the highest labor force participation rate are those with the educational attainment of bachelor's degree or higher, with 94.1% or 717 individuals in the labor force. Within the labor force, individuals with high school diploma education have the highest percentage of unemployment, with 10.5% or 32 of them being unemployed.
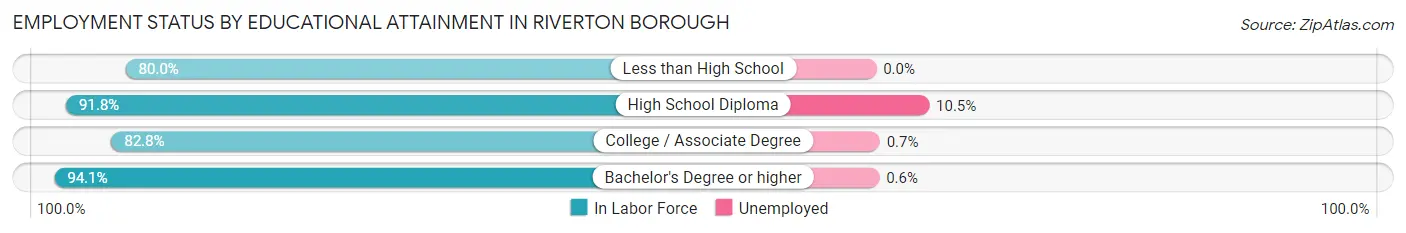
| Educational Attainment | In Labor Force | Unemployed |
| Less than High School | 12 (80.0%) | 0 (0.0%) |
| High School Diploma | 304 (91.8%) | 35 (10.5%) |
| College / Associate Degree | 304 (82.8%) | 3 (0.7%) |
| Bachelor's Degree or higher | 717 (94.1%) | 5 (0.6%) |
| Total | 1,336 (90.6%) | 41 (2.8%) |
Employment Occupations by Sex in Riverton borough
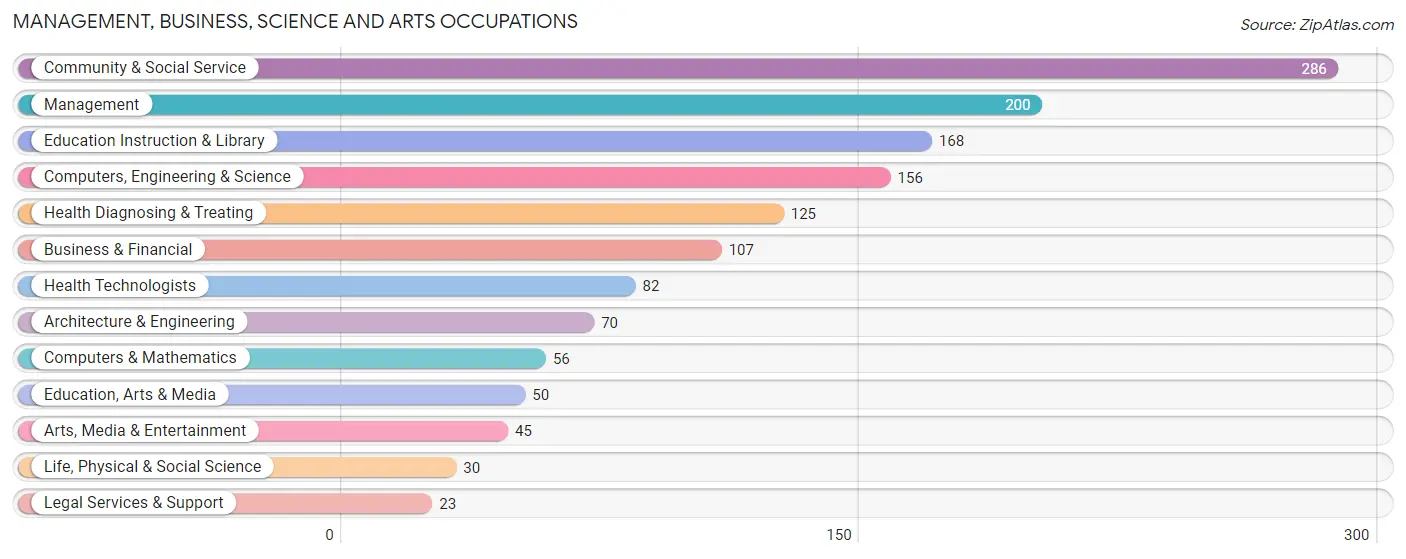
Management, Business, Science and Arts Occupations
The most common Management, Business, Science and Arts occupations in Riverton borough are Community & Social Service (286 | 18.7%), Management (200 | 13.1%), Education Instruction & Library (168 | 11.0%), Computers, Engineering & Science (156 | 10.2%), and Health Diagnosing & Treating (125 | 8.2%).
Management, Business, Science and Arts Occupations by Sex
Within the Management, Business, Science and Arts occupations in Riverton borough, the most male-oriented occupations are Computers & Mathematics (89.3%), Computers, Engineering & Science (78.8%), and Architecture & Engineering (75.7%), while the most female-oriented occupations are Health Diagnosing & Treating (90.4%), Health Technologists (85.4%), and Education, Arts & Media (64.0%).
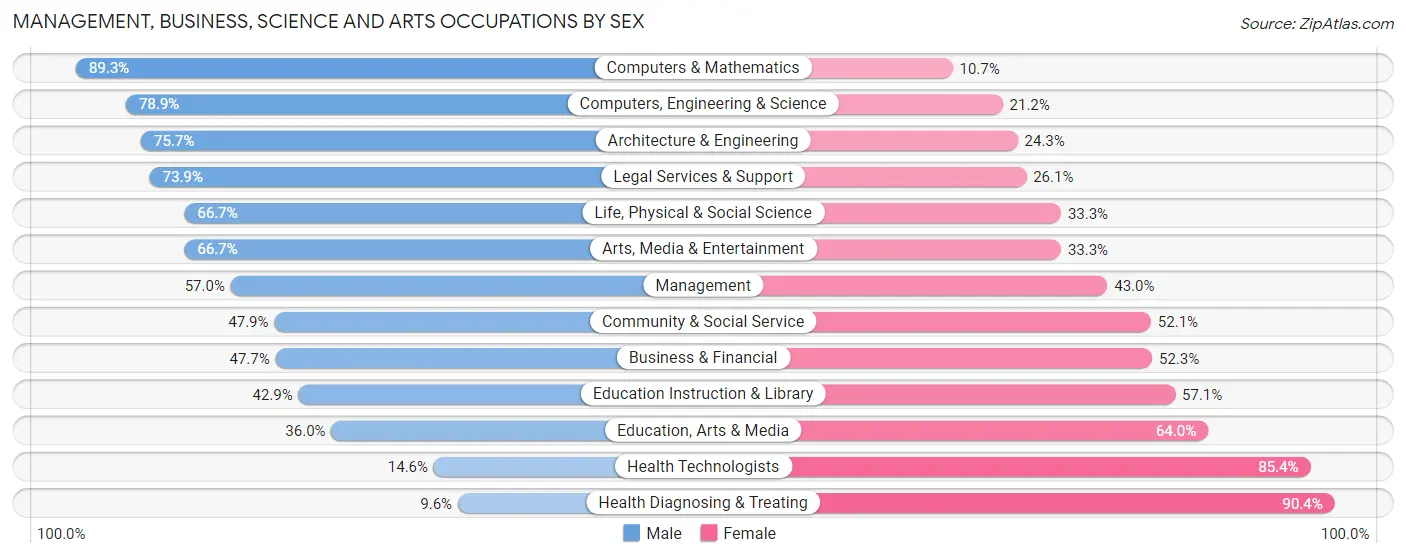
| Occupation | Male | Female |
| Management | 114 (57.0%) | 86 (43.0%) |
| Business & Financial | 51 (47.7%) | 56 (52.3%) |
| Computers, Engineering & Science | 123 (78.8%) | 33 (21.1%) |
| Computers & Mathematics | 50 (89.3%) | 6 (10.7%) |
| Architecture & Engineering | 53 (75.7%) | 17 (24.3%) |
| Life, Physical & Social Science | 20 (66.7%) | 10 (33.3%) |
| Community & Social Service | 137 (47.9%) | 149 (52.1%) |
| Education, Arts & Media | 18 (36.0%) | 32 (64.0%) |
| Legal Services & Support | 17 (73.9%) | 6 (26.1%) |
| Education Instruction & Library | 72 (42.9%) | 96 (57.1%) |
| Arts, Media & Entertainment | 30 (66.7%) | 15 (33.3%) |
| Health Diagnosing & Treating | 12 (9.6%) | 113 (90.4%) |
| Health Technologists | 12 (14.6%) | 70 (85.4%) |
| Total (Category) | 437 (50.0%) | 437 (50.0%) |
| Total (Overall) | 797 (52.1%) | 732 (47.9%) |
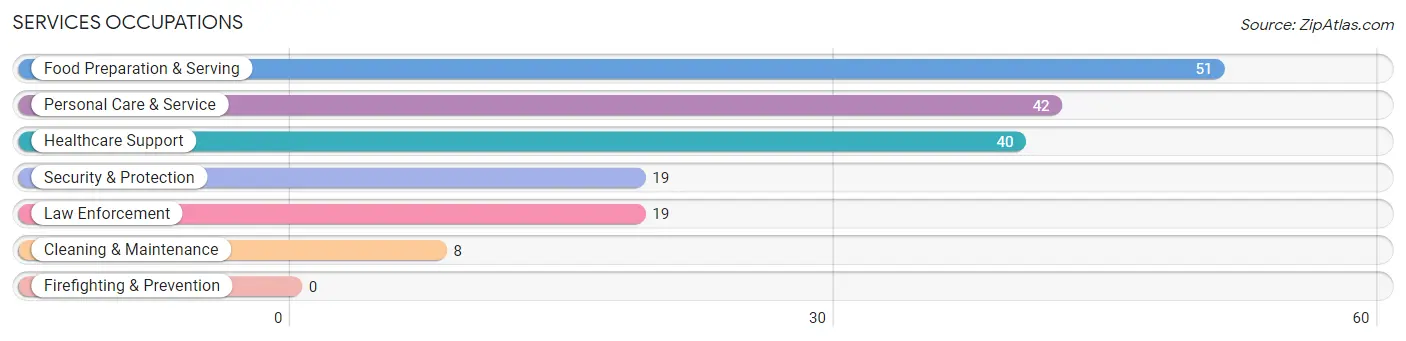
Services Occupations
The most common Services occupations in Riverton borough are Food Preparation & Serving (51 | 3.3%), Personal Care & Service (42 | 2.8%), Healthcare Support (40 | 2.6%), Security & Protection (19 | 1.2%), and Law Enforcement (19 | 1.2%).
Services Occupations by Sex
Within the Services occupations in Riverton borough, the most male-oriented occupations are Security & Protection (100.0%), Law Enforcement (100.0%), and Cleaning & Maintenance (100.0%), while the most female-oriented occupations are Personal Care & Service (83.3%), Healthcare Support (75.0%), and Food Preparation & Serving (25.5%).
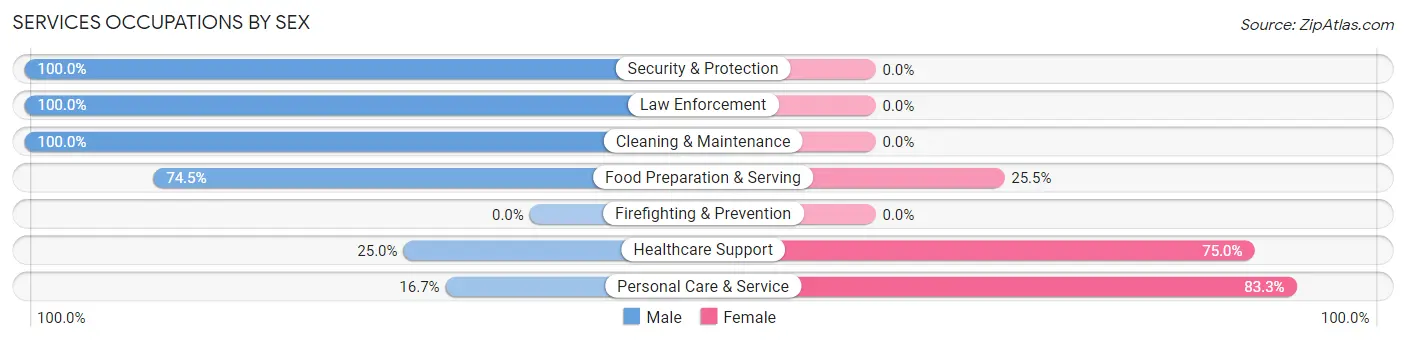
| Occupation | Male | Female |
| Healthcare Support | 10 (25.0%) | 30 (75.0%) |
| Security & Protection | 19 (100.0%) | 0 (0.0%) |
| Firefighting & Prevention | 0 (0.0%) | 0 (0.0%) |
| Law Enforcement | 19 (100.0%) | 0 (0.0%) |
| Food Preparation & Serving | 38 (74.5%) | 13 (25.5%) |
| Cleaning & Maintenance | 8 (100.0%) | 0 (0.0%) |
| Personal Care & Service | 7 (16.7%) | 35 (83.3%) |
| Total (Category) | 82 (51.2%) | 78 (48.7%) |
| Total (Overall) | 797 (52.1%) | 732 (47.9%) |
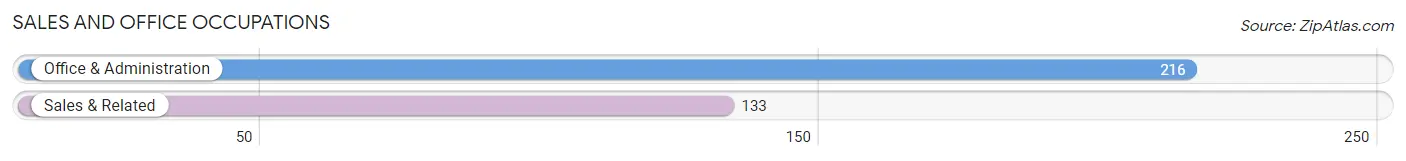
Sales and Office Occupations
The most common Sales and Office occupations in Riverton borough are Office & Administration (216 | 14.1%), and Sales & Related (133 | 8.7%).
Sales and Office Occupations by Sex
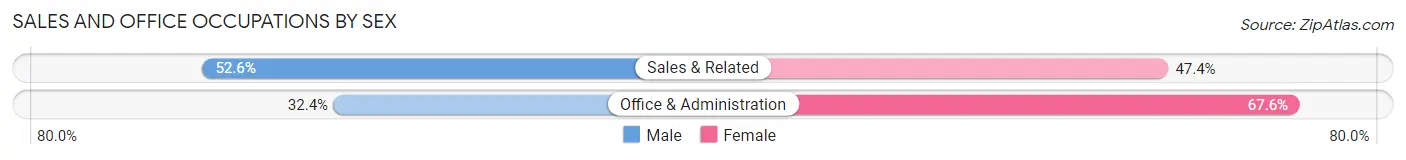
| Occupation | Male | Female |
| Sales & Related | 70 (52.6%) | 63 (47.4%) |
| Office & Administration | 70 (32.4%) | 146 (67.6%) |
| Total (Category) | 140 (40.1%) | 209 (59.9%) |
| Total (Overall) | 797 (52.1%) | 732 (47.9%) |
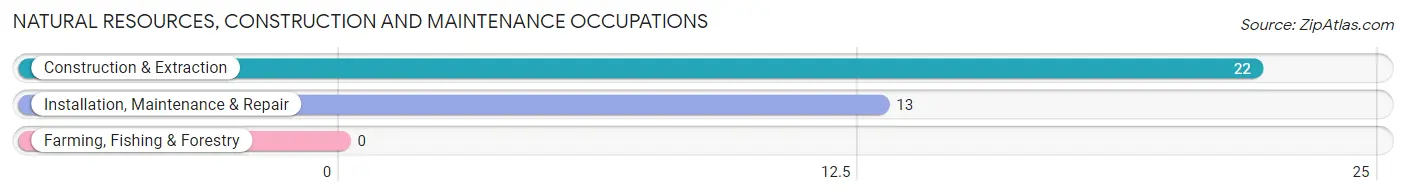
Natural Resources, Construction and Maintenance Occupations
The most common Natural Resources, Construction and Maintenance occupations in Riverton borough are Construction & Extraction (22 | 1.4%), and Installation, Maintenance & Repair (13 | 0.9%).
Natural Resources, Construction and Maintenance Occupations by Sex
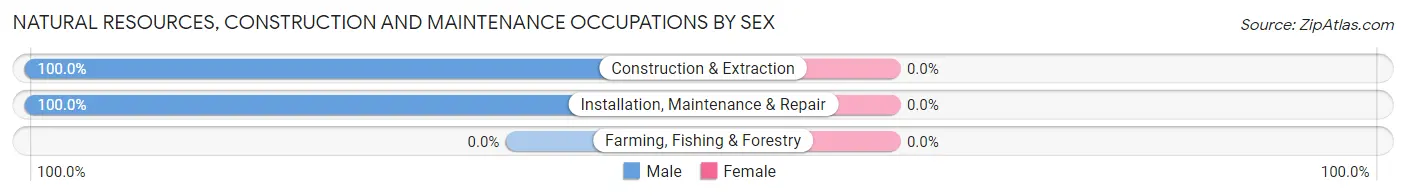
| Occupation | Male | Female |
| Farming, Fishing & Forestry | 0 (0.0%) | 0 (0.0%) |
| Construction & Extraction | 22 (100.0%) | 0 (0.0%) |
| Installation, Maintenance & Repair | 13 (100.0%) | 0 (0.0%) |
| Total (Category) | 35 (100.0%) | 0 (0.0%) |
| Total (Overall) | 797 (52.1%) | 732 (47.9%) |
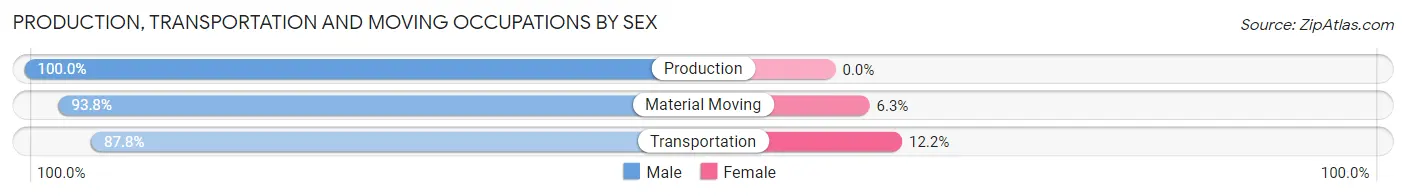
Production, Transportation and Moving Occupations
The most common Production, Transportation and Moving occupations in Riverton borough are Material Moving (48 | 3.1%), Transportation (41 | 2.7%), and Production (22 | 1.4%).
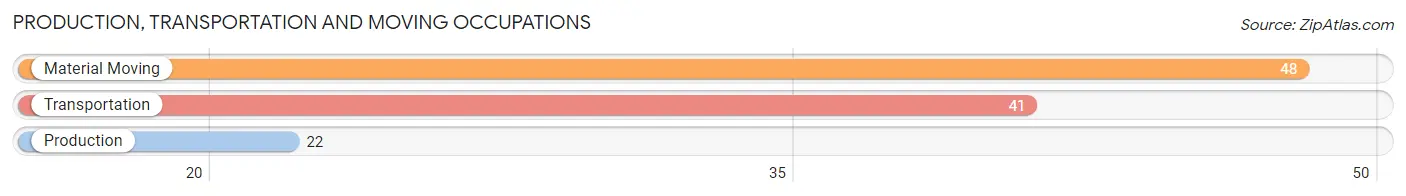
Production, Transportation and Moving Occupations by Sex
| Occupation | Male | Female |
| Production | 22 (100.0%) | 0 (0.0%) |
| Transportation | 36 (87.8%) | 5 (12.2%) |
| Material Moving | 45 (93.8%) | 3 (6.2%) |
| Total (Category) | 103 (92.8%) | 8 (7.2%) |
| Total (Overall) | 797 (52.1%) | 732 (47.9%) |
Employment Industries by Sex in Riverton borough
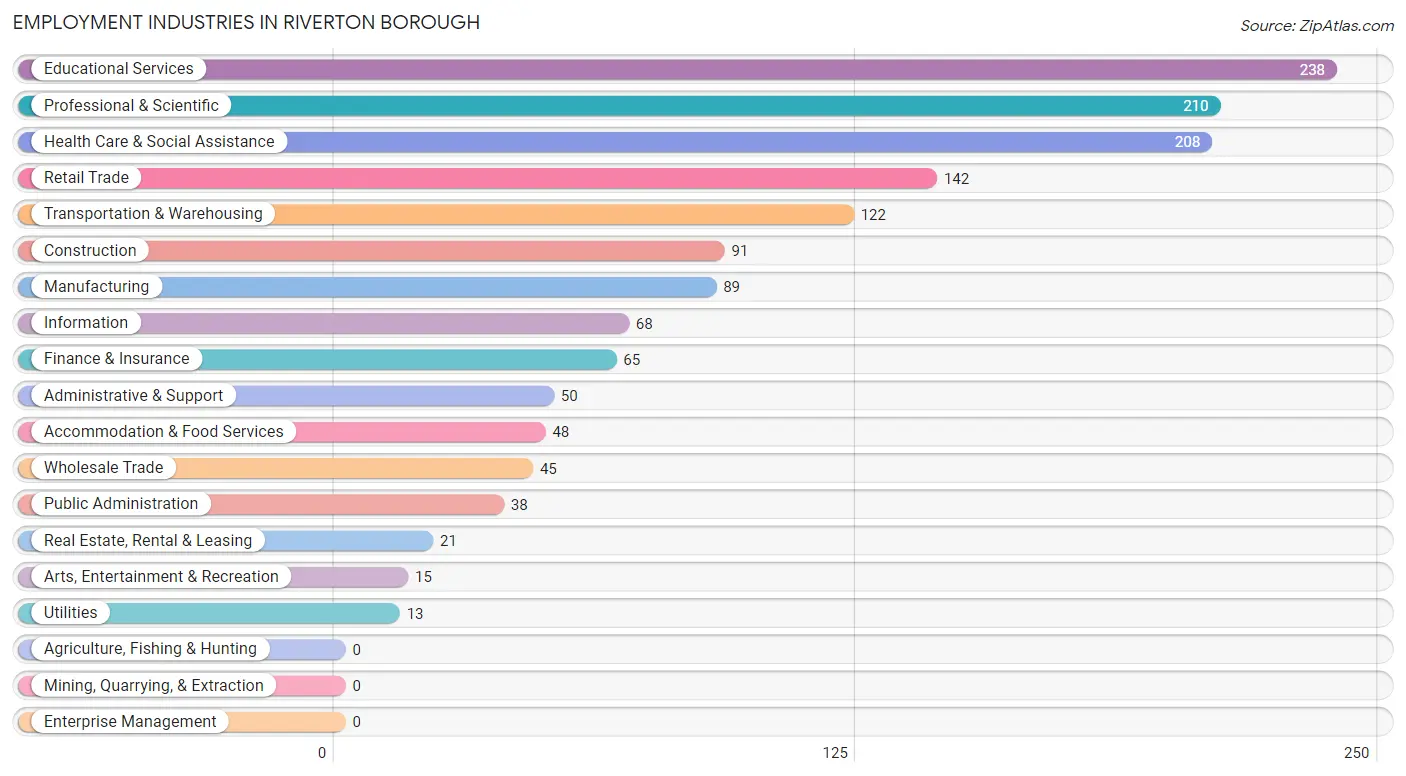
Employment Industries in Riverton borough
The major employment industries in Riverton borough include Educational Services (238 | 15.6%), Professional & Scientific (210 | 13.7%), Health Care & Social Assistance (208 | 13.6%), Retail Trade (142 | 9.3%), and Transportation & Warehousing (122 | 8.0%).
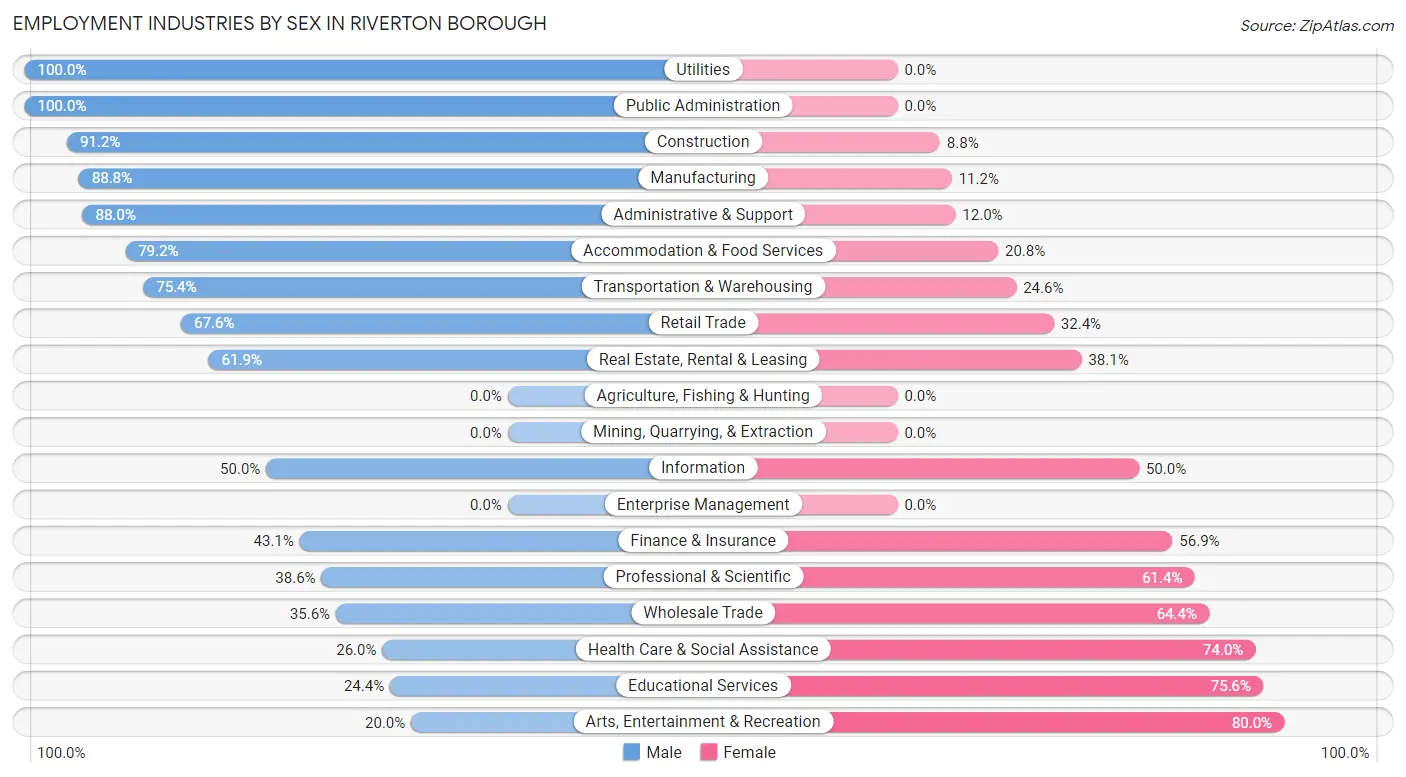
Employment Industries by Sex in Riverton borough
The Riverton borough industries that see more men than women are Utilities (100.0%), Public Administration (100.0%), and Construction (91.2%), whereas the industries that tend to have a higher number of women are Arts, Entertainment & Recreation (80.0%), Educational Services (75.6%), and Health Care & Social Assistance (74.0%).
| Industry | Male | Female |
| Agriculture, Fishing & Hunting | 0 (0.0%) | 0 (0.0%) |
| Mining, Quarrying, & Extraction | 0 (0.0%) | 0 (0.0%) |
| Construction | 83 (91.2%) | 8 (8.8%) |
| Manufacturing | 79 (88.8%) | 10 (11.2%) |
| Wholesale Trade | 16 (35.6%) | 29 (64.4%) |
| Retail Trade | 96 (67.6%) | 46 (32.4%) |
| Transportation & Warehousing | 92 (75.4%) | 30 (24.6%) |
| Utilities | 13 (100.0%) | 0 (0.0%) |
| Information | 34 (50.0%) | 34 (50.0%) |
| Finance & Insurance | 28 (43.1%) | 37 (56.9%) |
| Real Estate, Rental & Leasing | 13 (61.9%) | 8 (38.1%) |
| Professional & Scientific | 81 (38.6%) | 129 (61.4%) |
| Enterprise Management | 0 (0.0%) | 0 (0.0%) |
| Administrative & Support | 44 (88.0%) | 6 (12.0%) |
| Educational Services | 58 (24.4%) | 180 (75.6%) |
| Health Care & Social Assistance | 54 (26.0%) | 154 (74.0%) |
| Arts, Entertainment & Recreation | 3 (20.0%) | 12 (80.0%) |
| Accommodation & Food Services | 38 (79.2%) | 10 (20.8%) |
| Public Administration | 38 (100.0%) | 0 (0.0%) |
| Total | 797 (52.1%) | 732 (47.9%) |
Education in Riverton borough
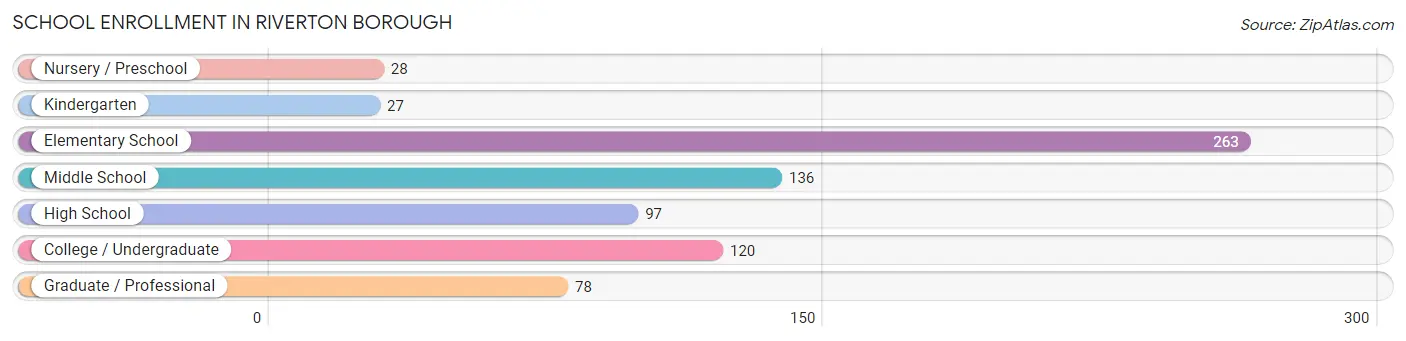
School Enrollment in Riverton borough
The most common levels of schooling among the 749 students in Riverton borough are elementary school (263 | 35.1%), middle school (136 | 18.2%), and college / undergraduate (120 | 16.0%).
| School Level | # Students | % Students |
| Nursery / Preschool | 28 | 3.7% |
| Kindergarten | 27 | 3.6% |
| Elementary School | 263 | 35.1% |
| Middle School | 136 | 18.2% |
| High School | 97 | 13.0% |
| College / Undergraduate | 120 | 16.0% |
| Graduate / Professional | 78 | 10.4% |
| Total | 749 | 100.0% |
School Enrollment by Age by Funding Source in Riverton borough
Out of a total of 749 students who are enrolled in schools in Riverton borough, 174 (23.2%) attend a private institution, while the remaining 575 (76.8%) are enrolled in public schools. The age group of 3 to 4 year olds has the highest likelihood of being enrolled in private schools, with 25 (89.3% in the age bracket) enrolled. Conversely, the age group of 5 to 9 year old has the lowest likelihood of being enrolled in a private school, with 274 (100.0% in the age bracket) attending a public institution.
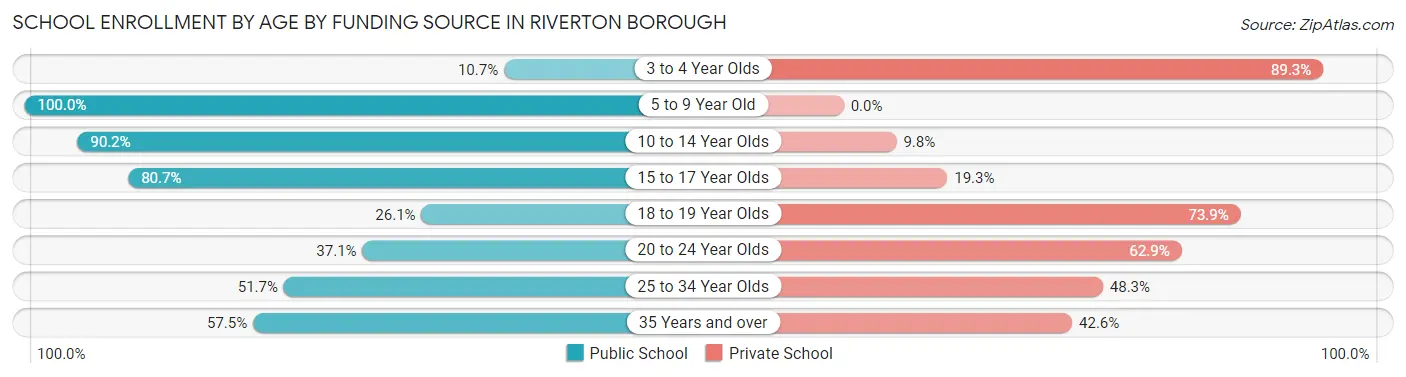
| Age Bracket | Public School | Private School |
| 3 to 4 Year Olds | 3 (10.7%) | 25 (89.3%) |
| 5 to 9 Year Old | 274 (100.0%) | 0 (0.0%) |
| 10 to 14 Year Olds | 156 (90.2%) | 17 (9.8%) |
| 15 to 17 Year Olds | 46 (80.7%) | 11 (19.3%) |
| 18 to 19 Year Olds | 6 (26.1%) | 17 (73.9%) |
| 20 to 24 Year Olds | 33 (37.1%) | 56 (62.9%) |
| 25 to 34 Year Olds | 30 (51.7%) | 28 (48.3%) |
| 35 Years and over | 27 (57.5%) | 20 (42.5%) |
| Total | 575 (76.8%) | 174 (23.2%) |
Educational Attainment by Field of Study in Riverton borough
Education (145 | 14.6%), business (133 | 13.4%), science & technology (131 | 13.2%), engineering (78 | 7.8%), and literature & languages (76 | 7.6%) are the most common fields of study among 996 individuals in Riverton borough who have obtained a bachelor's degree or higher.
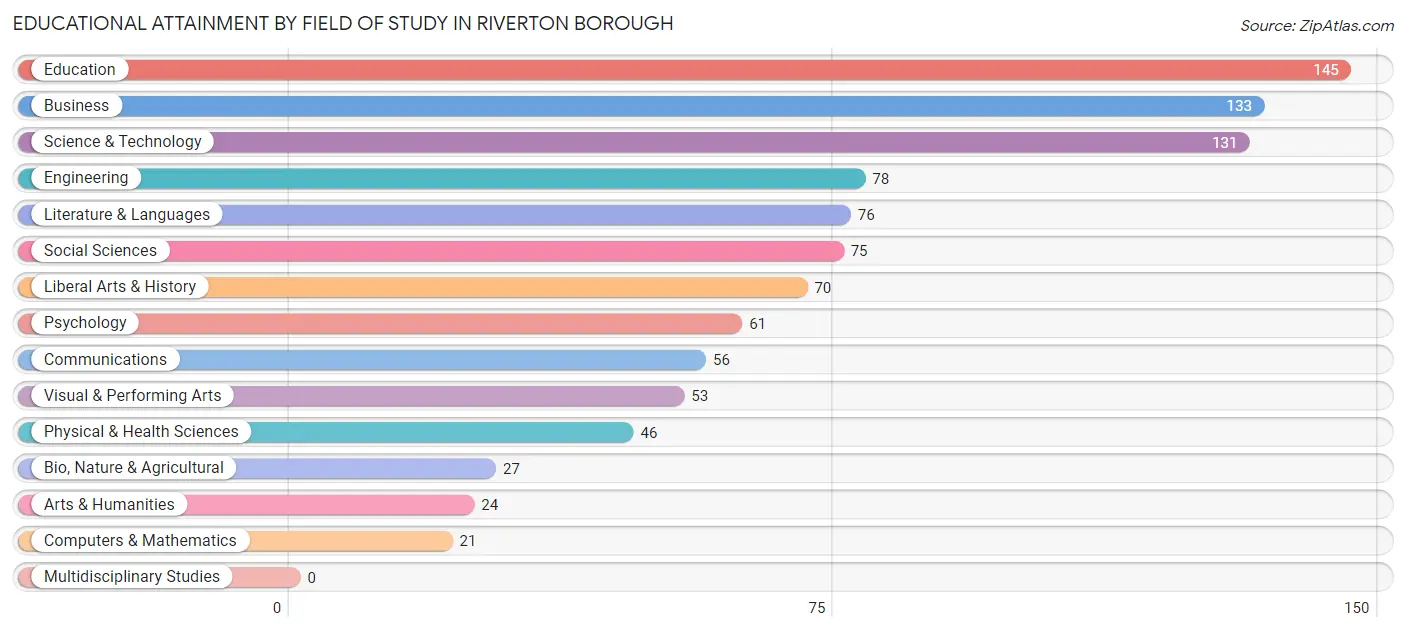
| Field of Study | # Graduates | % Graduates |
| Computers & Mathematics | 21 | 2.1% |
| Bio, Nature & Agricultural | 27 | 2.7% |
| Physical & Health Sciences | 46 | 4.6% |
| Psychology | 61 | 6.1% |
| Social Sciences | 75 | 7.5% |
| Engineering | 78 | 7.8% |
| Multidisciplinary Studies | 0 | 0.0% |
| Science & Technology | 131 | 13.2% |
| Business | 133 | 13.4% |
| Education | 145 | 14.6% |
| Literature & Languages | 76 | 7.6% |
| Liberal Arts & History | 70 | 7.0% |
| Visual & Performing Arts | 53 | 5.3% |
| Communications | 56 | 5.6% |
| Arts & Humanities | 24 | 2.4% |
| Total | 996 | 100.0% |
Transportation & Commute in Riverton borough
Vehicle Availability by Sex in Riverton borough
The most prevalent vehicle ownership categories in Riverton borough are males with 2 vehicles (342, accounting for 42.9%) and females with 2 vehicles (278, making up 49.2%).
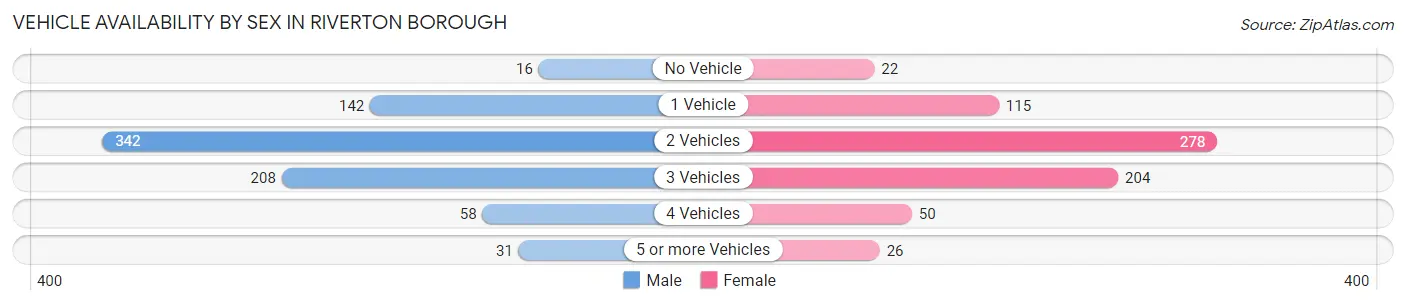
| Vehicles Available | Male | Female |
| No Vehicle | 16 (2.0%) | 22 (3.2%) |
| 1 Vehicle | 142 (17.8%) | 115 (16.6%) |
| 2 Vehicles | 342 (42.9%) | 278 (40.0%) |
| 3 Vehicles | 208 (26.1%) | 204 (29.3%) |
| 4 Vehicles | 58 (7.3%) | 50 (7.2%) |
| 5 or more Vehicles | 31 (3.9%) | 26 (3.7%) |
| Total | 797 (100.0%) | 695 (100.0%) |
Commute Time in Riverton borough
The most frequently occuring commute durations in Riverton borough are 30 to 34 minutes (250 commuters, 20.1%), 20 to 24 minutes (180 commuters, 14.5%), and 15 to 19 minutes (175 commuters, 14.1%).
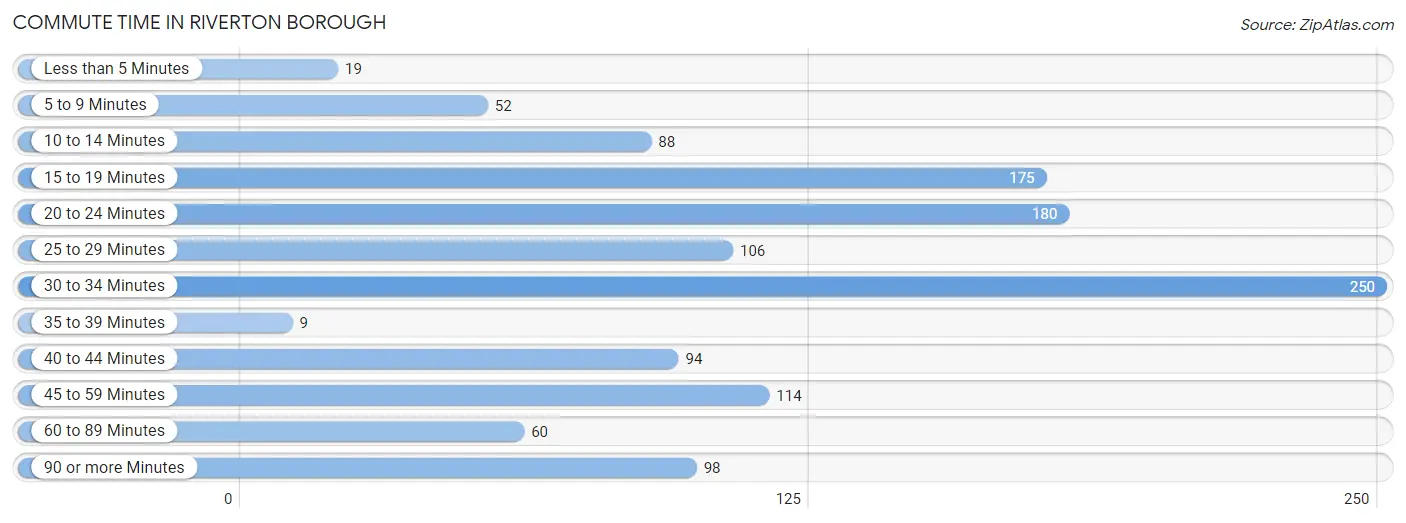
| Commute Time | # Commuters | % Commuters |
| Less than 5 Minutes | 19 | 1.5% |
| 5 to 9 Minutes | 52 | 4.2% |
| 10 to 14 Minutes | 88 | 7.1% |
| 15 to 19 Minutes | 175 | 14.1% |
| 20 to 24 Minutes | 180 | 14.5% |
| 25 to 29 Minutes | 106 | 8.5% |
| 30 to 34 Minutes | 250 | 20.1% |
| 35 to 39 Minutes | 9 | 0.7% |
| 40 to 44 Minutes | 94 | 7.5% |
| 45 to 59 Minutes | 114 | 9.2% |
| 60 to 89 Minutes | 60 | 4.8% |
| 90 or more Minutes | 98 | 7.9% |
Commute Time by Sex in Riverton borough
The most common commute times in Riverton borough are 20 to 24 minutes (118 commuters, 17.9%) for males and 30 to 34 minutes (135 commuters, 23.0%) for females.
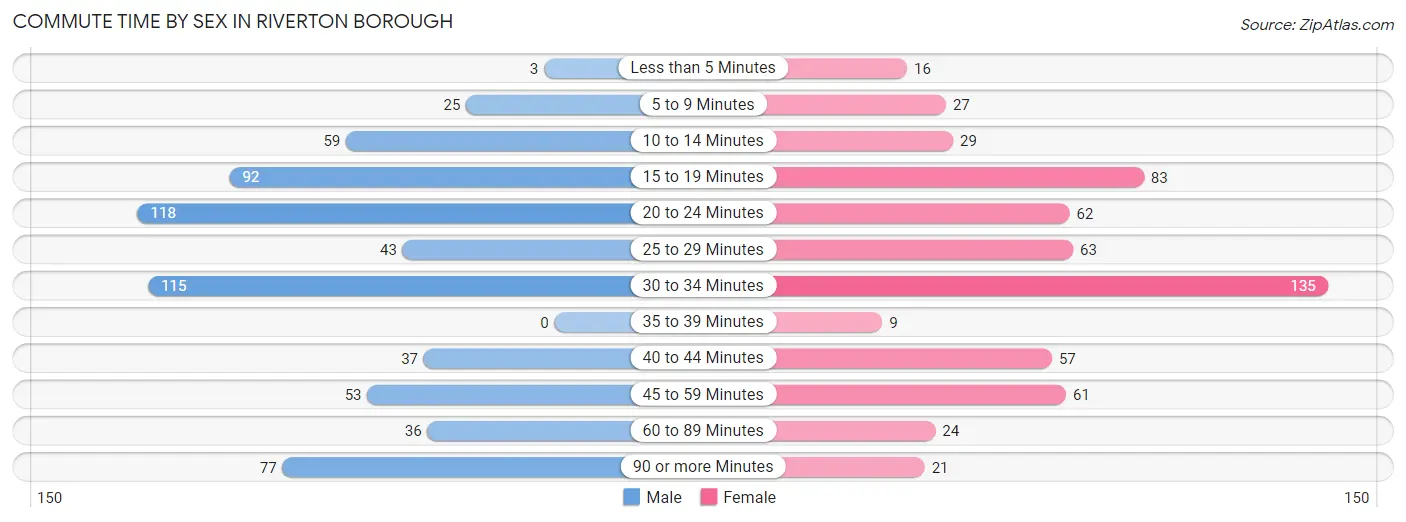
| Commute Time | Male | Female |
| Less than 5 Minutes | 3 (0.5%) | 16 (2.7%) |
| 5 to 9 Minutes | 25 (3.8%) | 27 (4.6%) |
| 10 to 14 Minutes | 59 (9.0%) | 29 (4.9%) |
| 15 to 19 Minutes | 92 (14.0%) | 83 (14.1%) |
| 20 to 24 Minutes | 118 (17.9%) | 62 (10.6%) |
| 25 to 29 Minutes | 43 (6.5%) | 63 (10.7%) |
| 30 to 34 Minutes | 115 (17.5%) | 135 (23.0%) |
| 35 to 39 Minutes | 0 (0.0%) | 9 (1.5%) |
| 40 to 44 Minutes | 37 (5.6%) | 57 (9.7%) |
| 45 to 59 Minutes | 53 (8.1%) | 61 (10.4%) |
| 60 to 89 Minutes | 36 (5.5%) | 24 (4.1%) |
| 90 or more Minutes | 77 (11.7%) | 21 (3.6%) |
Time of Departure to Work by Sex in Riverton borough
The most frequent times of departure to work in Riverton borough are 6:00 AM to 6:29 AM (103, 15.7%) for males and 7:30 AM to 7:59 AM (145, 24.7%) for females.
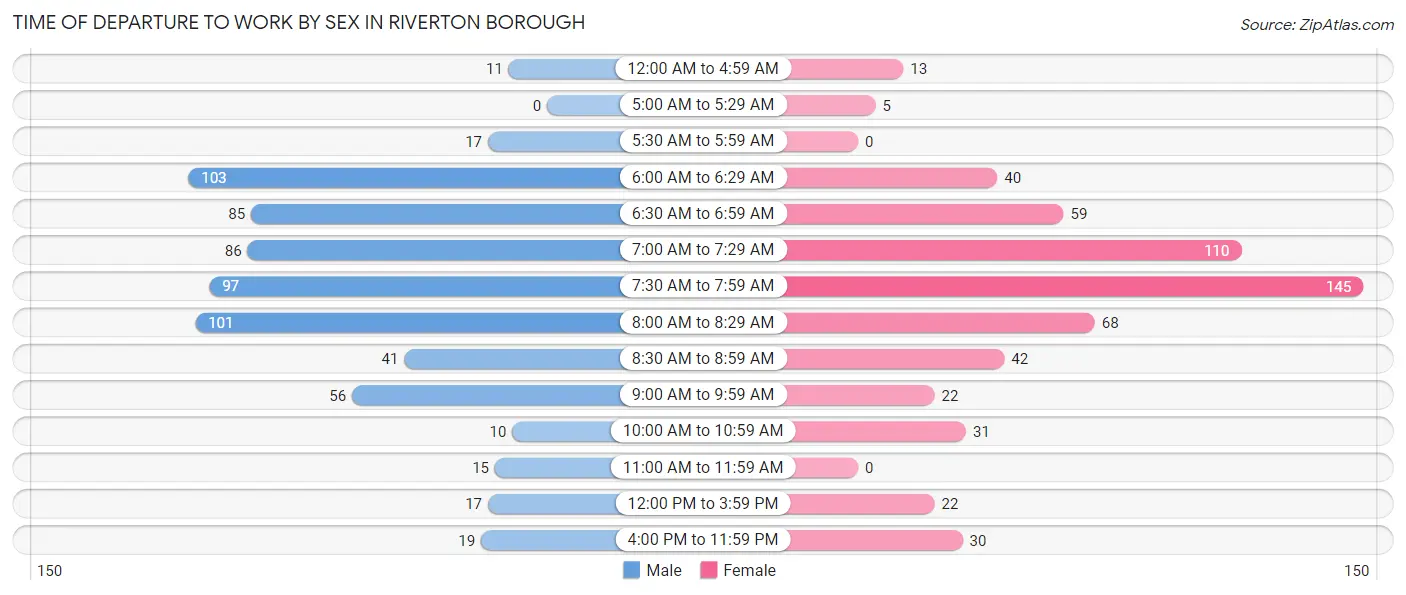
| Time of Departure | Male | Female |
| 12:00 AM to 4:59 AM | 11 (1.7%) | 13 (2.2%) |
| 5:00 AM to 5:29 AM | 0 (0.0%) | 5 (0.9%) |
| 5:30 AM to 5:59 AM | 17 (2.6%) | 0 (0.0%) |
| 6:00 AM to 6:29 AM | 103 (15.7%) | 40 (6.8%) |
| 6:30 AM to 6:59 AM | 85 (12.9%) | 59 (10.1%) |
| 7:00 AM to 7:29 AM | 86 (13.1%) | 110 (18.7%) |
| 7:30 AM to 7:59 AM | 97 (14.7%) | 145 (24.7%) |
| 8:00 AM to 8:29 AM | 101 (15.3%) | 68 (11.6%) |
| 8:30 AM to 8:59 AM | 41 (6.2%) | 42 (7.2%) |
| 9:00 AM to 9:59 AM | 56 (8.5%) | 22 (3.7%) |
| 10:00 AM to 10:59 AM | 10 (1.5%) | 31 (5.3%) |
| 11:00 AM to 11:59 AM | 15 (2.3%) | 0 (0.0%) |
| 12:00 PM to 3:59 PM | 17 (2.6%) | 22 (3.7%) |
| 4:00 PM to 11:59 PM | 19 (2.9%) | 30 (5.1%) |
| Total | 658 (100.0%) | 587 (100.0%) |
Housing Occupancy in Riverton borough
Occupancy by Ownership in Riverton borough
Of the total 1,028 dwellings in Riverton borough, owner-occupied units account for 781 (76.0%), while renter-occupied units make up 247 (24.0%).
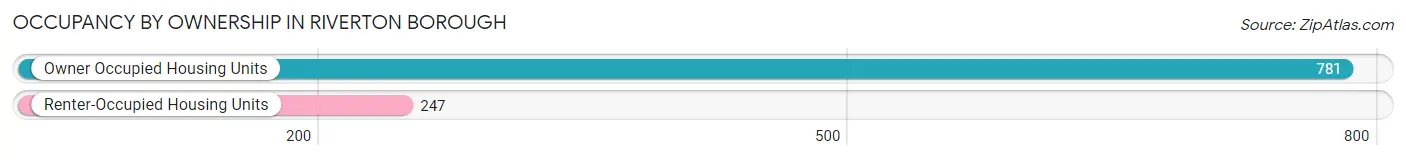
| Occupancy | # Housing Units | % Housing Units |
| Owner Occupied Housing Units | 781 | 76.0% |
| Renter-Occupied Housing Units | 247 | 24.0% |
| Total Occupied Housing Units | 1,028 | 100.0% |
Occupancy by Household Size in Riverton borough
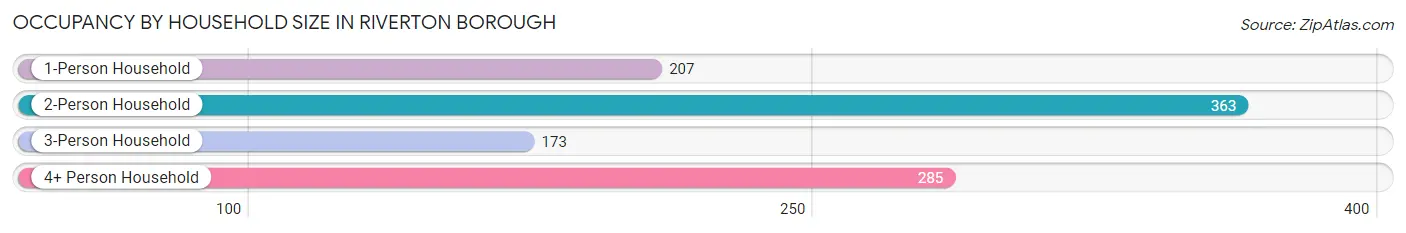
| Household Size | # Housing Units | % Housing Units |
| 1-Person Household | 207 | 20.1% |
| 2-Person Household | 363 | 35.3% |
| 3-Person Household | 173 | 16.8% |
| 4+ Person Household | 285 | 27.7% |
| Total Housing Units | 1,028 | 100.0% |
Occupancy by Ownership by Household Size in Riverton borough
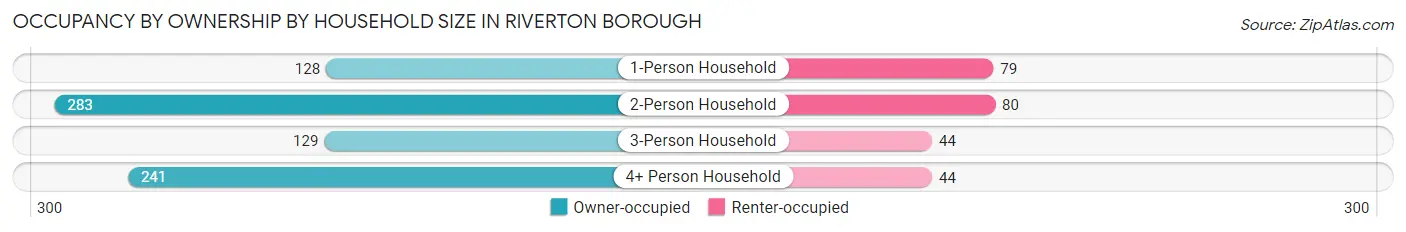
| Household Size | Owner-occupied | Renter-occupied |
| 1-Person Household | 128 (61.8%) | 79 (38.2%) |
| 2-Person Household | 283 (78.0%) | 80 (22.0%) |
| 3-Person Household | 129 (74.6%) | 44 (25.4%) |
| 4+ Person Household | 241 (84.6%) | 44 (15.4%) |
| Total Housing Units | 781 (76.0%) | 247 (24.0%) |
Occupancy by Educational Attainment in Riverton borough
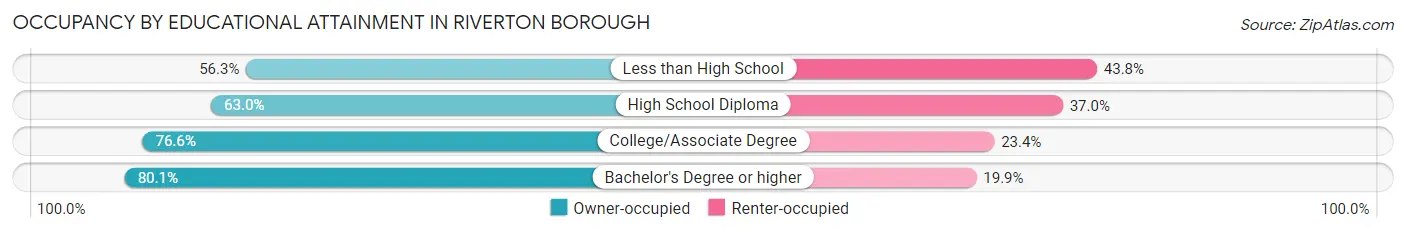
| Household Size | Owner-occupied | Renter-occupied |
| Less than High School | 9 (56.2%) | 7 (43.8%) |
| High School Diploma | 109 (63.0%) | 64 (37.0%) |
| College/Associate Degree | 203 (76.6%) | 62 (23.4%) |
| Bachelor's Degree or higher | 460 (80.1%) | 114 (19.9%) |
Occupancy by Age of Householder in Riverton borough
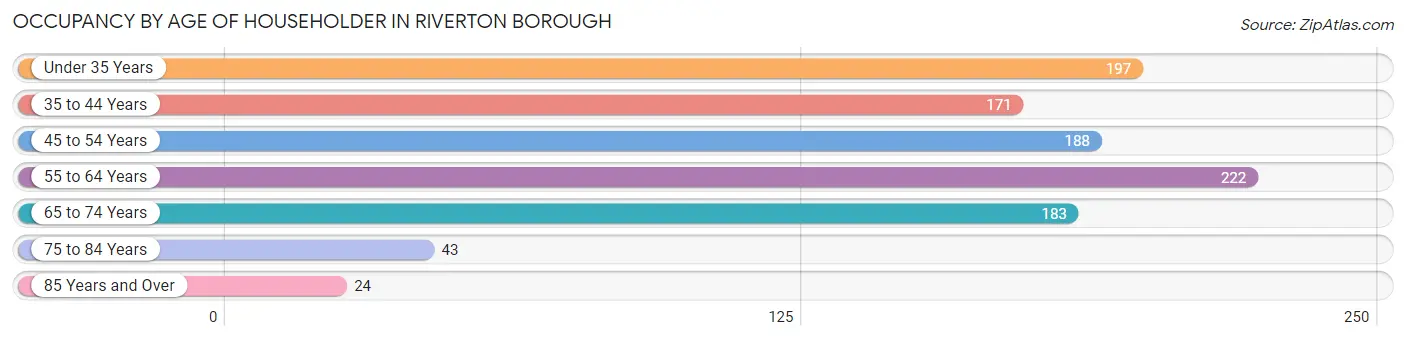
| Age Bracket | # Households | % Households |
| Under 35 Years | 197 | 19.2% |
| 35 to 44 Years | 171 | 16.6% |
| 45 to 54 Years | 188 | 18.3% |
| 55 to 64 Years | 222 | 21.6% |
| 65 to 74 Years | 183 | 17.8% |
| 75 to 84 Years | 43 | 4.2% |
| 85 Years and Over | 24 | 2.3% |
| Total | 1,028 | 100.0% |
Housing Finances in Riverton borough
Median Income by Occupancy in Riverton borough
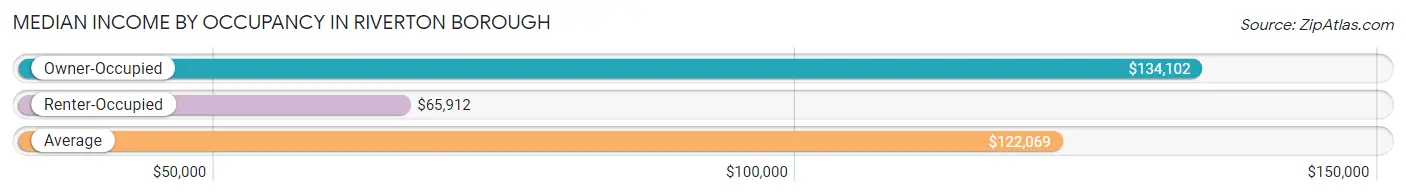
| Occupancy Type | # Households | Median Income |
| Owner-Occupied | 781 (76.0%) | $134,102 |
| Renter-Occupied | 247 (24.0%) | $65,912 |
| Average | 1,028 (100.0%) | $122,069 |
Occupancy by Householder Income Bracket in Riverton borough
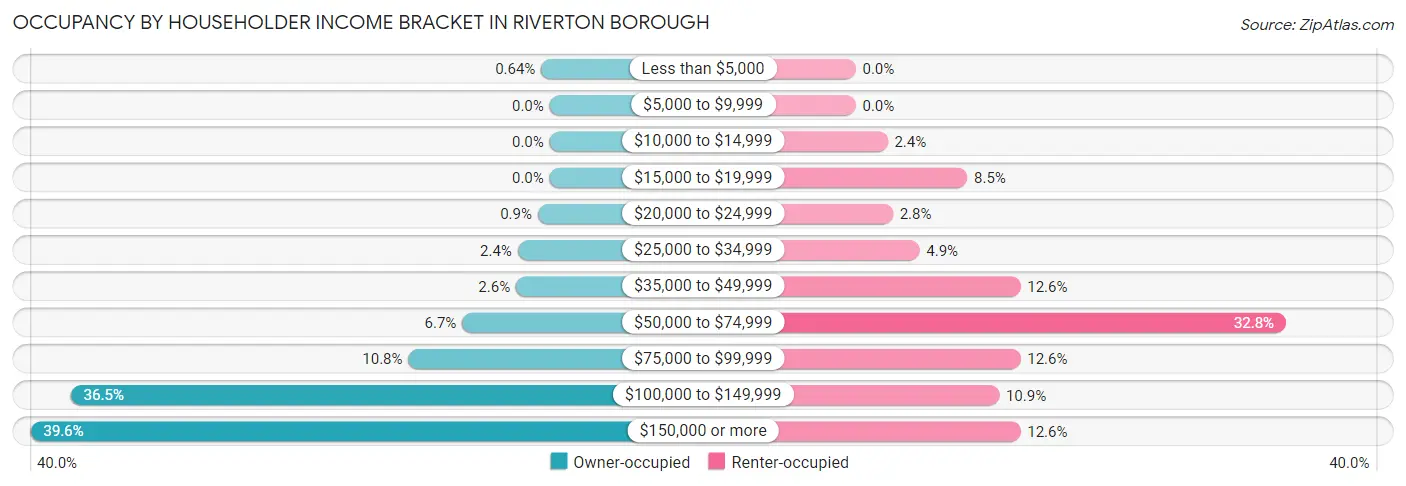
| Income Bracket | Owner-occupied | Renter-occupied |
| Less than $5,000 | 5 (0.6%) | 0 (0.0%) |
| $5,000 to $9,999 | 0 (0.0%) | 0 (0.0%) |
| $10,000 to $14,999 | 0 (0.0%) | 6 (2.4%) |
| $15,000 to $19,999 | 0 (0.0%) | 21 (8.5%) |
| $20,000 to $24,999 | 7 (0.9%) | 7 (2.8%) |
| $25,000 to $34,999 | 19 (2.4%) | 12 (4.9%) |
| $35,000 to $49,999 | 20 (2.6%) | 31 (12.6%) |
| $50,000 to $74,999 | 52 (6.7%) | 81 (32.8%) |
| $75,000 to $99,999 | 84 (10.8%) | 31 (12.6%) |
| $100,000 to $149,999 | 285 (36.5%) | 27 (10.9%) |
| $150,000 or more | 309 (39.6%) | 31 (12.6%) |
| Total | 781 (100.0%) | 247 (100.0%) |
Monthly Housing Cost Tiers in Riverton borough
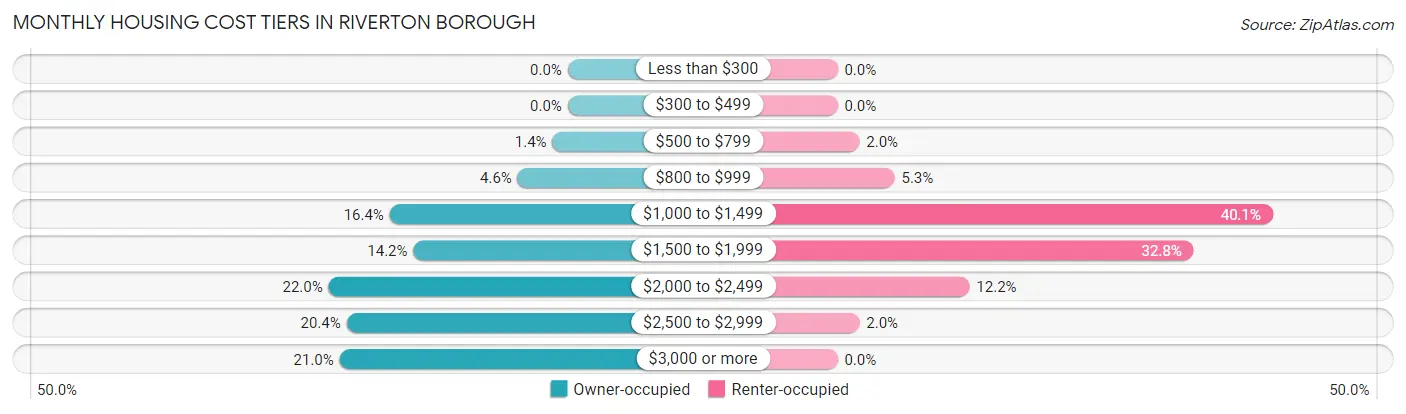
| Monthly Cost | Owner-occupied | Renter-occupied |
| Less than $300 | 0 (0.0%) | 0 (0.0%) |
| $300 to $499 | 0 (0.0%) | 0 (0.0%) |
| $500 to $799 | 11 (1.4%) | 5 (2.0%) |
| $800 to $999 | 36 (4.6%) | 13 (5.3%) |
| $1,000 to $1,499 | 128 (16.4%) | 99 (40.1%) |
| $1,500 to $1,999 | 111 (14.2%) | 81 (32.8%) |
| $2,000 to $2,499 | 172 (22.0%) | 30 (12.1%) |
| $2,500 to $2,999 | 159 (20.4%) | 5 (2.0%) |
| $3,000 or more | 164 (21.0%) | 0 (0.0%) |
| Total | 781 (100.0%) | 247 (100.0%) |
Physical Housing Characteristics in Riverton borough
Housing Structures in Riverton borough
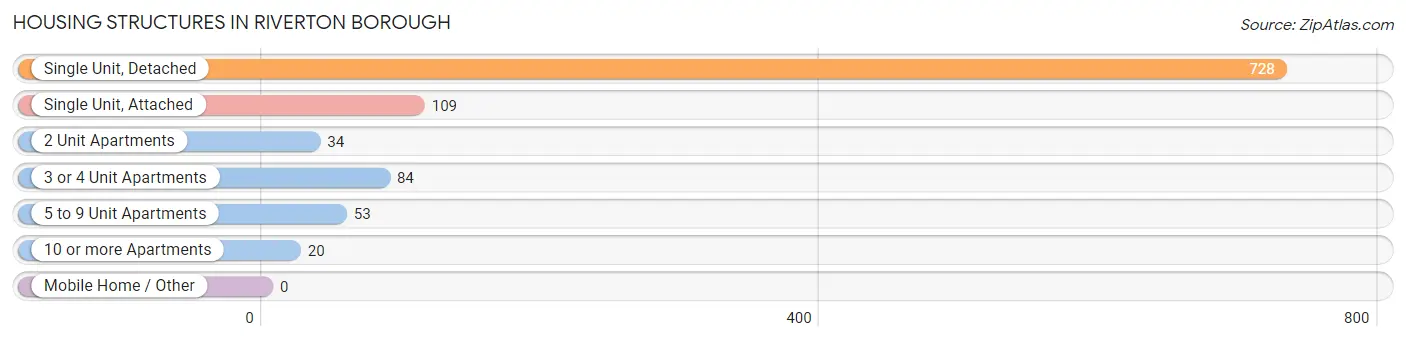
| Structure Type | # Housing Units | % Housing Units |
| Single Unit, Detached | 728 | 70.8% |
| Single Unit, Attached | 109 | 10.6% |
| 2 Unit Apartments | 34 | 3.3% |
| 3 or 4 Unit Apartments | 84 | 8.2% |
| 5 to 9 Unit Apartments | 53 | 5.2% |
| 10 or more Apartments | 20 | 1.9% |
| Mobile Home / Other | 0 | 0.0% |
| Total | 1,028 | 100.0% |
Housing Structures by Occupancy in Riverton borough
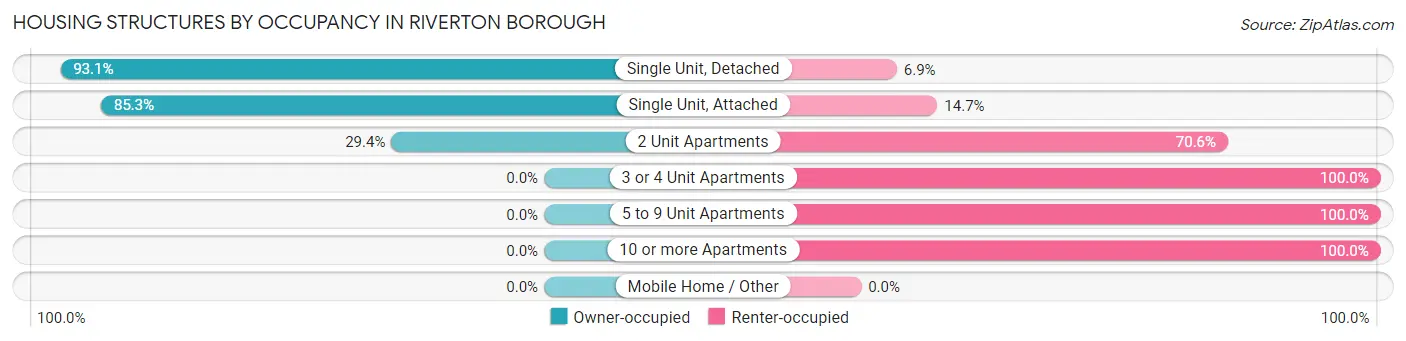
| Structure Type | Owner-occupied | Renter-occupied |
| Single Unit, Detached | 678 (93.1%) | 50 (6.9%) |
| Single Unit, Attached | 93 (85.3%) | 16 (14.7%) |
| 2 Unit Apartments | 10 (29.4%) | 24 (70.6%) |
| 3 or 4 Unit Apartments | 0 (0.0%) | 84 (100.0%) |
| 5 to 9 Unit Apartments | 0 (0.0%) | 53 (100.0%) |
| 10 or more Apartments | 0 (0.0%) | 20 (100.0%) |
| Mobile Home / Other | 0 (0.0%) | 0 (0.0%) |
| Total | 781 (76.0%) | 247 (24.0%) |
Housing Structures by Number of Rooms in Riverton borough
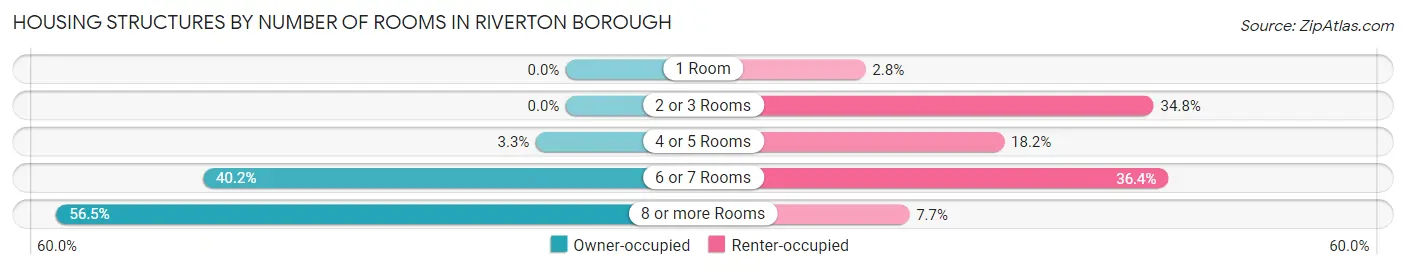
| Number of Rooms | Owner-occupied | Renter-occupied |
| 1 Room | 0 (0.0%) | 7 (2.8%) |
| 2 or 3 Rooms | 0 (0.0%) | 86 (34.8%) |
| 4 or 5 Rooms | 26 (3.3%) | 45 (18.2%) |
| 6 or 7 Rooms | 314 (40.2%) | 90 (36.4%) |
| 8 or more Rooms | 441 (56.5%) | 19 (7.7%) |
| Total | 781 (100.0%) | 247 (100.0%) |
Housing Structure by Heating Type in Riverton borough
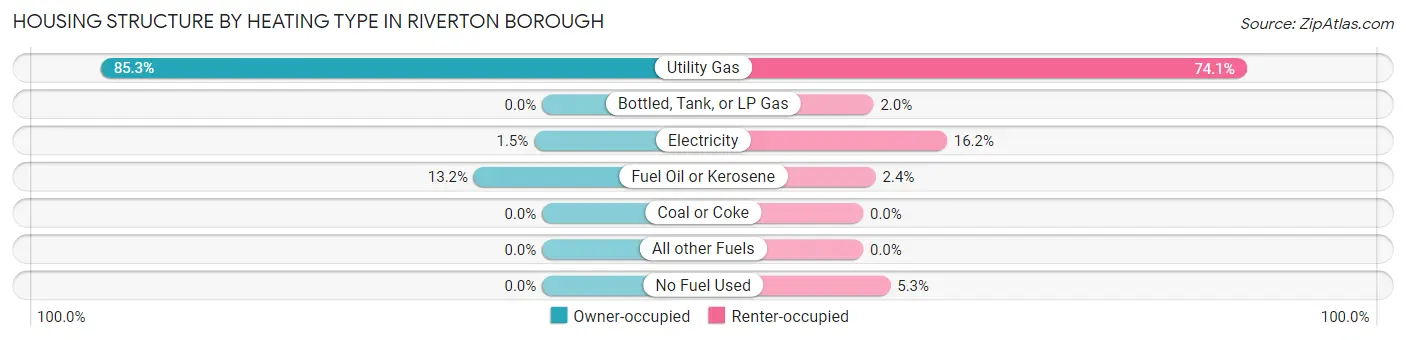
| Heating Type | Owner-occupied | Renter-occupied |
| Utility Gas | 666 (85.3%) | 183 (74.1%) |
| Bottled, Tank, or LP Gas | 0 (0.0%) | 5 (2.0%) |
| Electricity | 12 (1.5%) | 40 (16.2%) |
| Fuel Oil or Kerosene | 103 (13.2%) | 6 (2.4%) |
| Coal or Coke | 0 (0.0%) | 0 (0.0%) |
| All other Fuels | 0 (0.0%) | 0 (0.0%) |
| No Fuel Used | 0 (0.0%) | 13 (5.3%) |
| Total | 781 (100.0%) | 247 (100.0%) |
Household Vehicle Usage in Riverton borough
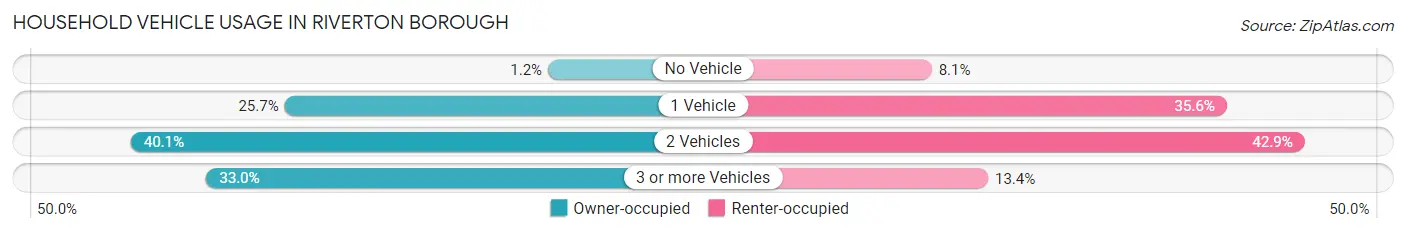
| Vehicles per Household | Owner-occupied | Renter-occupied |
| No Vehicle | 9 (1.1%) | 20 (8.1%) |
| 1 Vehicle | 201 (25.7%) | 88 (35.6%) |
| 2 Vehicles | 313 (40.1%) | 106 (42.9%) |
| 3 or more Vehicles | 258 (33.0%) | 33 (13.4%) |
| Total | 781 (100.0%) | 247 (100.0%) |
Real Estate & Mortgages in Riverton borough
Real Estate and Mortgage Overview in Riverton borough
| Characteristic | Without Mortgage | With Mortgage |
| Housing Units | 206 | 575 |
| Median Property Value | $363,500 | $338,100 |
| Median Household Income | $119,545 | $227 |
| Monthly Housing Costs | $1,332 | $164 |
| Real Estate Taxes | $10,001 | $13 |
Property Value by Mortgage Status in Riverton borough
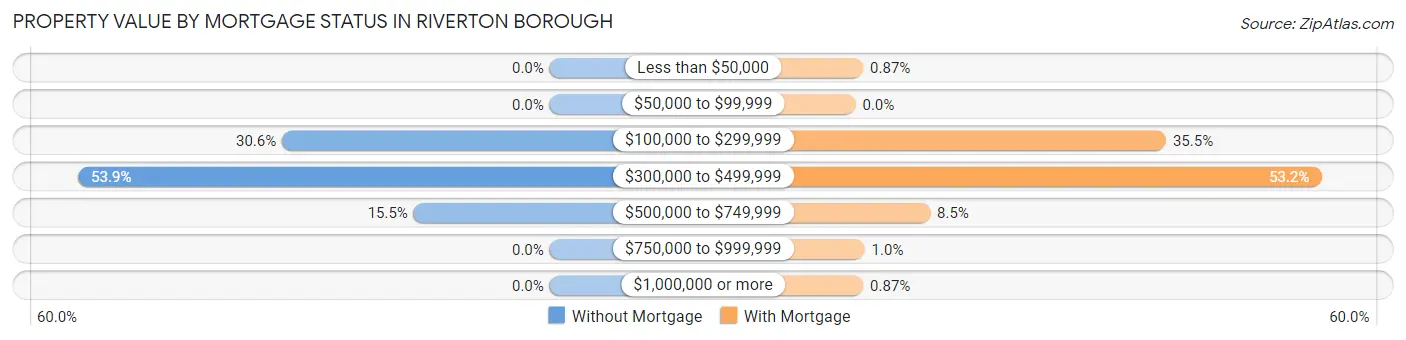
| Property Value | Without Mortgage | With Mortgage |
| Less than $50,000 | 0 (0.0%) | 5 (0.9%) |
| $50,000 to $99,999 | 0 (0.0%) | 0 (0.0%) |
| $100,000 to $299,999 | 63 (30.6%) | 204 (35.5%) |
| $300,000 to $499,999 | 111 (53.9%) | 306 (53.2%) |
| $500,000 to $749,999 | 32 (15.5%) | 49 (8.5%) |
| $750,000 to $999,999 | 0 (0.0%) | 6 (1.0%) |
| $1,000,000 or more | 0 (0.0%) | 5 (0.9%) |
| Total | 206 (100.0%) | 575 (100.0%) |
Household Income by Mortgage Status in Riverton borough
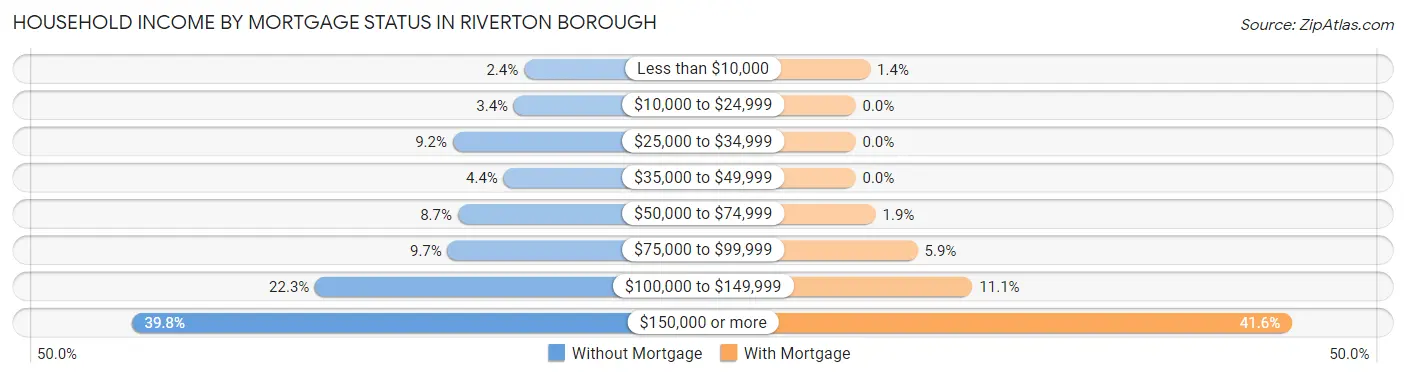
| Household Income | Without Mortgage | With Mortgage |
| Less than $10,000 | 5 (2.4%) | 8 (1.4%) |
| $10,000 to $24,999 | 7 (3.4%) | 0 (0.0%) |
| $25,000 to $34,999 | 19 (9.2%) | 0 (0.0%) |
| $35,000 to $49,999 | 9 (4.4%) | 0 (0.0%) |
| $50,000 to $74,999 | 18 (8.7%) | 11 (1.9%) |
| $75,000 to $99,999 | 20 (9.7%) | 34 (5.9%) |
| $100,000 to $149,999 | 46 (22.3%) | 64 (11.1%) |
| $150,000 or more | 82 (39.8%) | 239 (41.6%) |
| Total | 206 (100.0%) | 575 (100.0%) |
Property Value to Household Income Ratio in Riverton borough
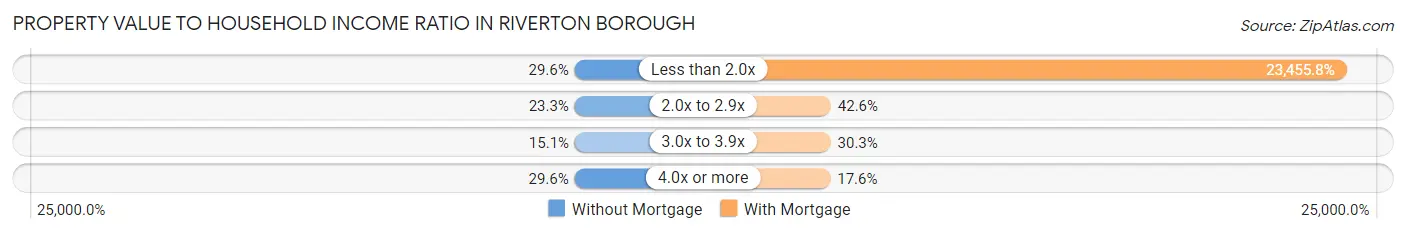
| Value-to-Income Ratio | Without Mortgage | With Mortgage |
| Less than 2.0x | 61 (29.6%) | 134,871 (23,455.8%) |
| 2.0x to 2.9x | 48 (23.3%) | 245 (42.6%) |
| 3.0x to 3.9x | 31 (15.0%) | 174 (30.3%) |
| 4.0x or more | 61 (29.6%) | 101 (17.6%) |
| Total | 206 (100.0%) | 575 (100.0%) |
Real Estate Taxes by Mortgage Status in Riverton borough
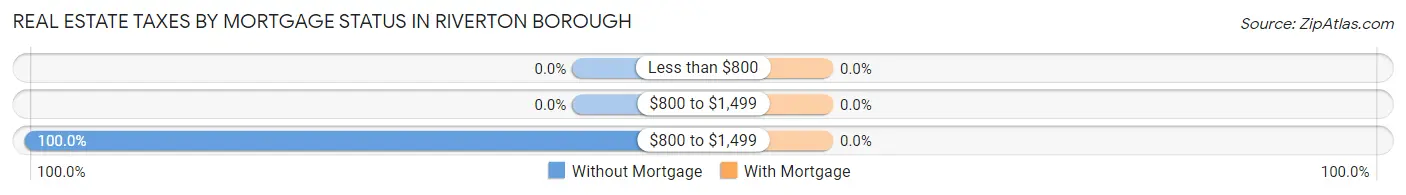
| Property Taxes | Without Mortgage | With Mortgage |
| Less than $800 | 0 (0.0%) | 0 (0.0%) |
| $800 to $1,499 | 0 (0.0%) | 0 (0.0%) |
| $800 to $1,499 | 206 (100.0%) | 0 (0.0%) |
| Total | 206 (100.0%) | 575 (100.0%) |
Health & Disability in Riverton borough
Health Insurance Coverage by Age in Riverton borough
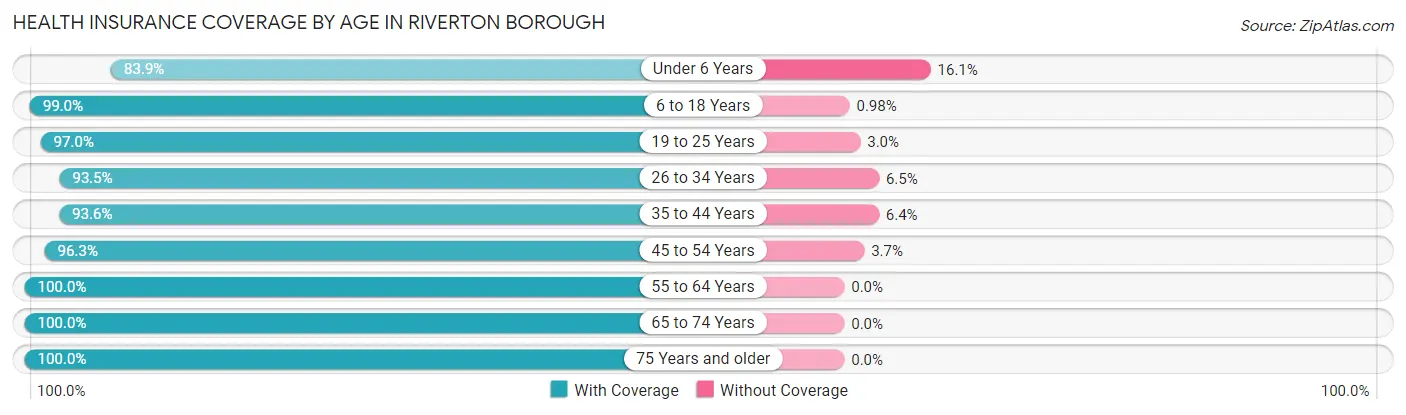
| Age Bracket | With Coverage | Without Coverage |
| Under 6 Years | 99 (83.9%) | 19 (16.1%) |
| 6 to 18 Years | 503 (99.0%) | 5 (1.0%) |
| 19 to 25 Years | 163 (97.0%) | 5 (3.0%) |
| 26 to 34 Years | 347 (93.5%) | 24 (6.5%) |
| 35 to 44 Years | 305 (93.6%) | 21 (6.4%) |
| 45 to 54 Years | 362 (96.3%) | 14 (3.7%) |
| 55 to 64 Years | 393 (100.0%) | 0 (0.0%) |
| 65 to 74 Years | 271 (100.0%) | 0 (0.0%) |
| 75 Years and older | 128 (100.0%) | 0 (0.0%) |
| Total | 2,571 (96.7%) | 88 (3.3%) |
Health Insurance Coverage by Citizenship Status in Riverton borough
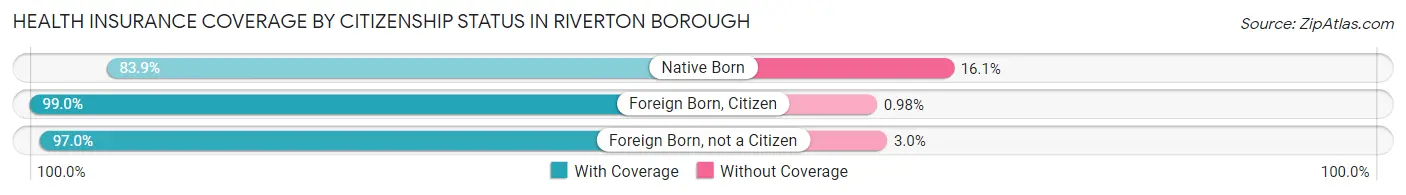
| Citizenship Status | With Coverage | Without Coverage |
| Native Born | 99 (83.9%) | 19 (16.1%) |
| Foreign Born, Citizen | 503 (99.0%) | 5 (1.0%) |
| Foreign Born, not a Citizen | 163 (97.0%) | 5 (3.0%) |
Health Insurance Coverage by Household Income in Riverton borough
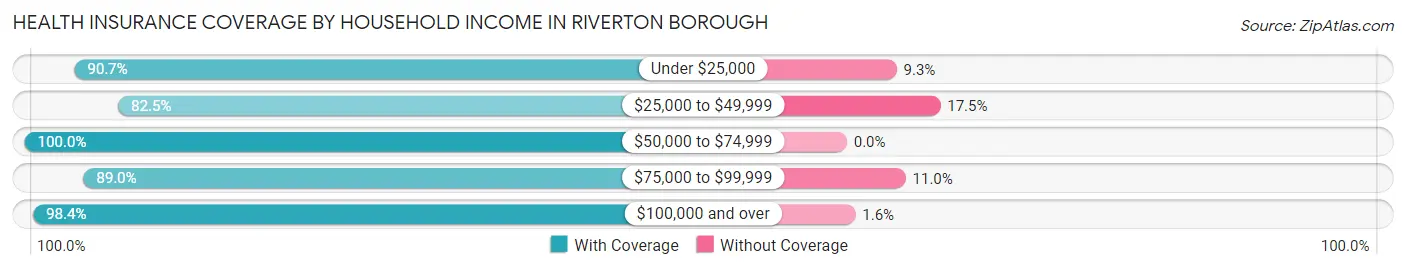
| Household Income | With Coverage | Without Coverage |
| Under $25,000 | 68 (90.7%) | 7 (9.3%) |
| $25,000 to $49,999 | 113 (82.5%) | 24 (17.5%) |
| $50,000 to $74,999 | 280 (100.0%) | 0 (0.0%) |
| $75,000 to $99,999 | 210 (89.0%) | 26 (11.0%) |
| $100,000 and over | 1,897 (98.4%) | 31 (1.6%) |
Public vs Private Health Insurance Coverage by Age in Riverton borough
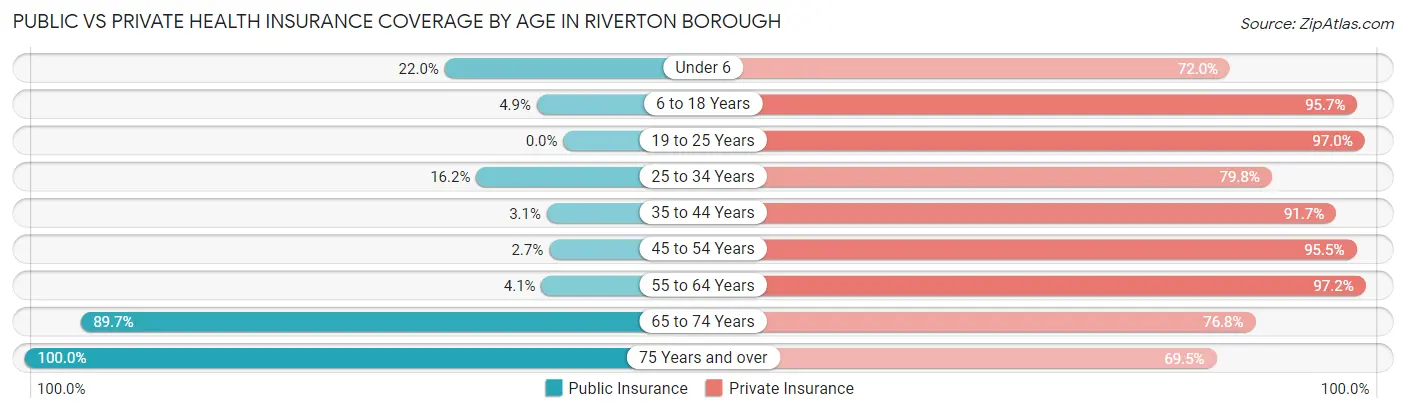
| Age Bracket | Public Insurance | Private Insurance |
| Under 6 | 26 (22.0%) | 85 (72.0%) |
| 6 to 18 Years | 25 (4.9%) | 486 (95.7%) |
| 19 to 25 Years | 0 (0.0%) | 163 (97.0%) |
| 25 to 34 Years | 60 (16.2%) | 296 (79.8%) |
| 35 to 44 Years | 10 (3.1%) | 299 (91.7%) |
| 45 to 54 Years | 10 (2.7%) | 359 (95.5%) |
| 55 to 64 Years | 16 (4.1%) | 382 (97.2%) |
| 65 to 74 Years | 243 (89.7%) | 208 (76.7%) |
| 75 Years and over | 128 (100.0%) | 89 (69.5%) |
| Total | 518 (19.5%) | 2,367 (89.0%) |
Disability Status by Sex by Age in Riverton borough
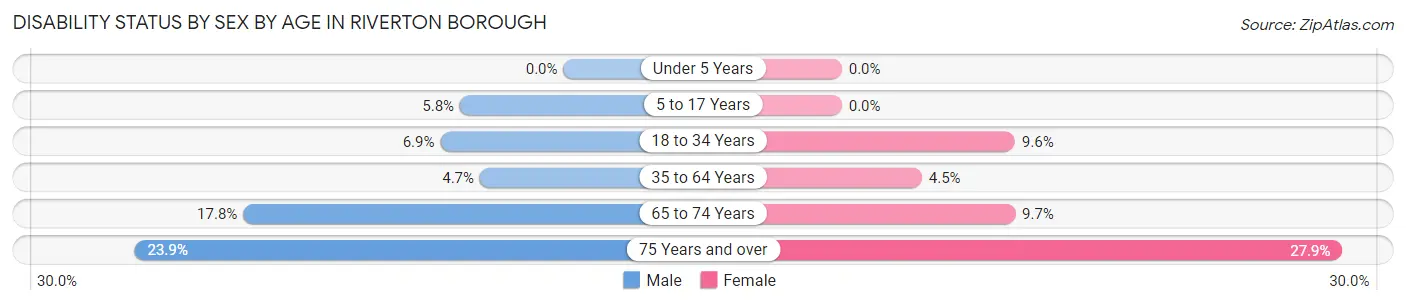
| Age Bracket | Male | Female |
| Under 5 Years | 0 (0.0%) | 0 (0.0%) |
| 5 to 17 Years | 14 (5.8%) | 0 (0.0%) |
| 18 to 34 Years | 15 (6.9%) | 32 (9.6%) |
| 35 to 64 Years | 28 (4.6%) | 22 (4.5%) |
| 65 to 74 Years | 28 (17.8%) | 11 (9.7%) |
| 75 Years and over | 16 (23.9%) | 17 (27.9%) |
Disability Class by Sex by Age in Riverton borough
Disability Class: Hearing Difficulty
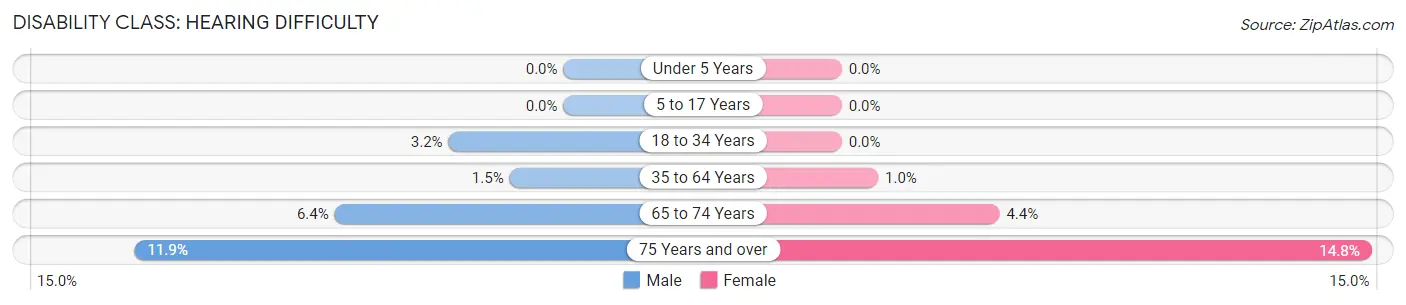
| Age Bracket | Male | Female |
| Under 5 Years | 0 (0.0%) | 0 (0.0%) |
| 5 to 17 Years | 0 (0.0%) | 0 (0.0%) |
| 18 to 34 Years | 7 (3.2%) | 0 (0.0%) |
| 35 to 64 Years | 9 (1.5%) | 5 (1.0%) |
| 65 to 74 Years | 10 (6.4%) | 5 (4.4%) |
| 75 Years and over | 8 (11.9%) | 9 (14.7%) |
Disability Class: Vision Difficulty
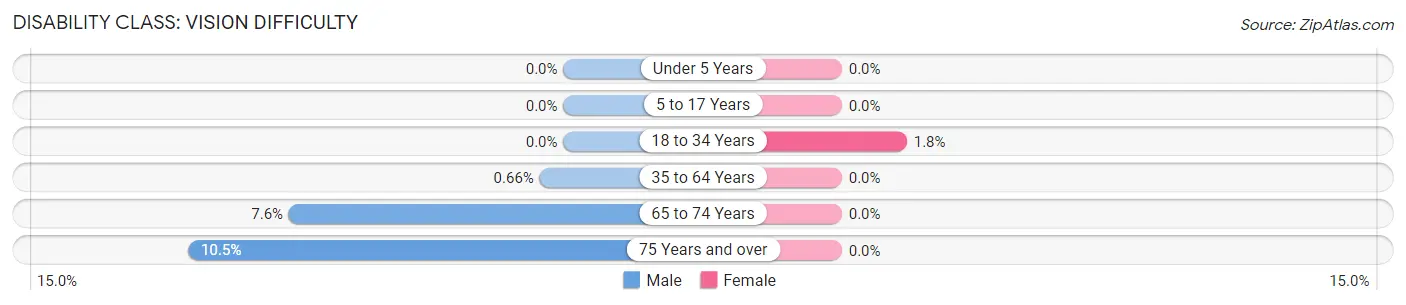
| Age Bracket | Male | Female |
| Under 5 Years | 0 (0.0%) | 0 (0.0%) |
| 5 to 17 Years | 0 (0.0%) | 0 (0.0%) |
| 18 to 34 Years | 0 (0.0%) | 6 (1.8%) |
| 35 to 64 Years | 4 (0.7%) | 0 (0.0%) |
| 65 to 74 Years | 12 (7.6%) | 0 (0.0%) |
| 75 Years and over | 7 (10.4%) | 0 (0.0%) |
Disability Class: Cognitive Difficulty
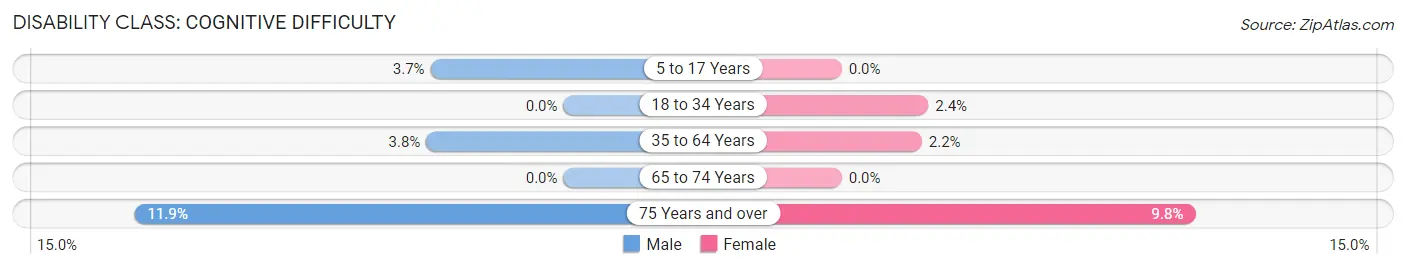
| Age Bracket | Male | Female |
| 5 to 17 Years | 9 (3.7%) | 0 (0.0%) |
| 18 to 34 Years | 0 (0.0%) | 8 (2.4%) |
| 35 to 64 Years | 23 (3.8%) | 11 (2.2%) |
| 65 to 74 Years | 0 (0.0%) | 0 (0.0%) |
| 75 Years and over | 8 (11.9%) | 6 (9.8%) |
Disability Class: Ambulatory Difficulty
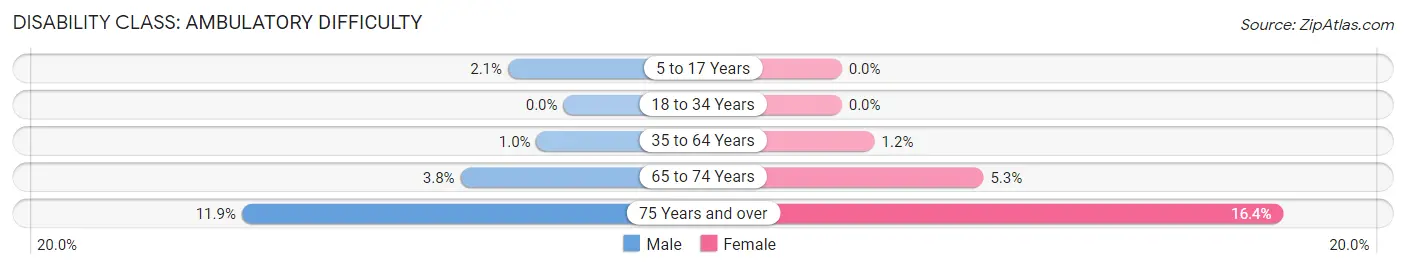
| Age Bracket | Male | Female |
| 5 to 17 Years | 5 (2.1%) | 0 (0.0%) |
| 18 to 34 Years | 0 (0.0%) | 0 (0.0%) |
| 35 to 64 Years | 6 (1.0%) | 6 (1.2%) |
| 65 to 74 Years | 6 (3.8%) | 6 (5.3%) |
| 75 Years and over | 8 (11.9%) | 10 (16.4%) |
Disability Class: Self-Care Difficulty
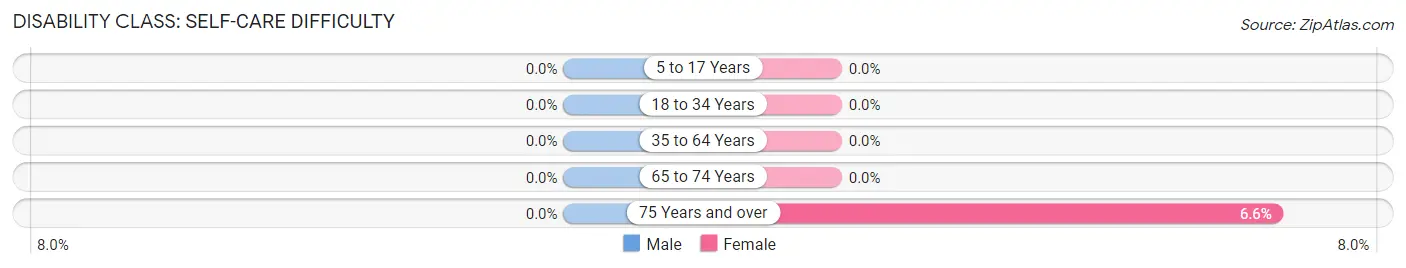
| Age Bracket | Male | Female |
| 5 to 17 Years | 0 (0.0%) | 0 (0.0%) |
| 18 to 34 Years | 0 (0.0%) | 0 (0.0%) |
| 35 to 64 Years | 0 (0.0%) | 0 (0.0%) |
| 65 to 74 Years | 0 (0.0%) | 0 (0.0%) |
| 75 Years and over | 0 (0.0%) | 4 (6.6%) |
Technology Access in Riverton borough
Computing Device Access in Riverton borough
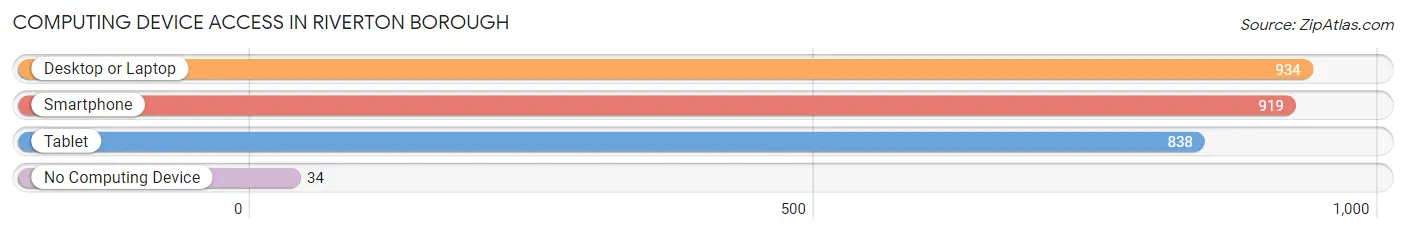
| Device Type | # Households | % Households |
| Desktop or Laptop | 934 | 90.9% |
| Smartphone | 919 | 89.4% |
| Tablet | 838 | 81.5% |
| No Computing Device | 34 | 3.3% |
| Total | 1,028 | 100.0% |
Internet Access in Riverton borough
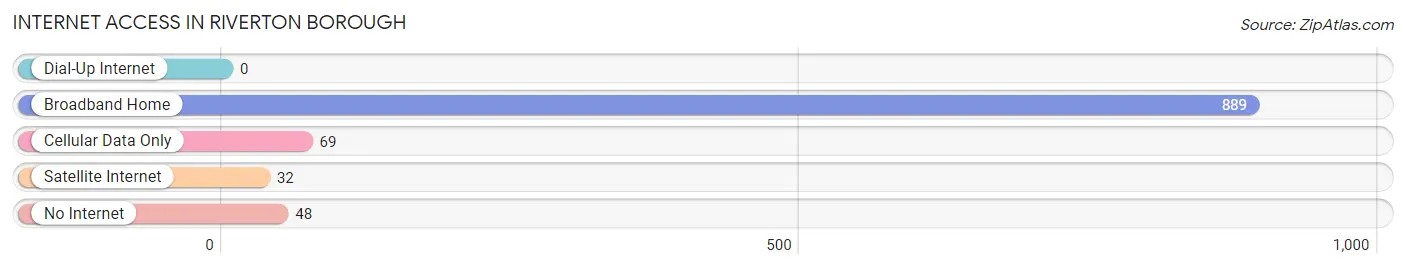
| Internet Type | # Households | % Households |
| Dial-Up Internet | 0 | 0.0% |
| Broadband Home | 889 | 86.5% |
| Cellular Data Only | 69 | 6.7% |
| Satellite Internet | 32 | 3.1% |
| No Internet | 48 | 4.7% |
| Total | 1,028 | 100.0% |
Riverton borough Summary
Riverton Borough is a small borough located in Burlington County, New Jersey. It is situated on the Delaware River, just south of Philadelphia. The borough was incorporated in 1851 and is home to a population of approximately 3,000 people.
Geography
Riverton Borough is located in the Delaware Valley region of New Jersey. It is situated on the Delaware River, just south of Philadelphia. The borough is bordered by Cinnaminson Township to the north, Palmyra Borough to the east, and Delanco Township to the south. The borough covers an area of 1.2 square miles and is home to a population of approximately 3,000 people.
The borough is located in a predominantly rural area, with the majority of the land being used for agricultural purposes. The borough is also home to several parks, including Riverton Park, which is located on the banks of the Delaware River.
Climate
Riverton Borough has a humid subtropical climate, with hot, humid summers and cold, wet winters. The average annual temperature is around 54°F, with the average high temperature in the summer months reaching around 85°F and the average low temperature in the winter months reaching around 25°F. The average annual precipitation is around 43 inches.
Demographics
As of the 2010 census, the population of Riverton Borough was 3,053. The racial makeup of the borough was 94.3% White, 2.3% African American, 0.3% Native American, 0.9% Asian, 0.1% Pacific Islander, 0.7% from other races, and 1.4% from two or more races. Hispanic or Latino of any race were 3.2% of the population.
The median household income in Riverton Borough was $68,958, and the median family income was $77,917. The per capita income was $30,945. About 4.2% of families and 5.3% of the population were below the poverty line, including 6.2% of those under age 18 and 4.2% of those age 65 or over.
Economy
Riverton Borough is home to a variety of businesses, including retail stores, restaurants, and professional services. The borough is also home to several industrial and manufacturing businesses, including a paper mill and a plastics factory. The borough is also home to a number of small businesses, including a bakery, a florist, and a furniture store.
The borough is served by the River Line light rail system, which connects the borough to Philadelphia and other nearby towns. The borough is also served by several bus routes, which provide transportation to nearby towns and cities.
History
Riverton Borough was first settled in the early 1700s by Quaker settlers. The borough was incorporated in 1851 and was originally known as “Riverside.” The name was changed to “Riverton” in 1872.
The borough was home to a number of industries in the late 19th and early 20th centuries, including a paper mill, a brickyard, and a glass factory. The borough was also home to a number of farms, which provided food for the local population.
In the late 20th century, the borough began to experience a period of growth and development. The borough was home to a number of new businesses, including a shopping center and a movie theater. The borough also experienced an influx of new residents, as people moved to the area from nearby cities and towns.
Today, Riverton Borough is a vibrant and diverse community. The borough is home to a variety of businesses, parks, and recreational activities. The borough is also home to a number of historic sites, including the Riverton Historic District, which is listed on the National Register of Historic Places.
Common Questions
What is the Total Population of Riverton borough?
Total Population of Riverton borough is 2,764.
What is the Total Male Population of Riverton borough?
Total Male Population of Riverton borough is 1,359.
What is the Total Female Population of Riverton borough?
Total Female Population of Riverton borough is 1,405.
What is the Ratio of Males per 100 Females in Riverton borough?
There are 96.73 Males per 100 Females in Riverton borough.
What is the Ratio of Females per 100 Males in Riverton borough?
There are 103.38 Females per 100 Males in Riverton borough.
What is the Median Population Age in Riverton borough?
Median Population Age in Riverton borough is 42.0 Years.
What is the Average Family Size in Riverton borough
Average Family Size in Riverton borough is 3.0 People.
What is the Average Household Size in Riverton borough
Average Household Size in Riverton borough is 2.6 People.
What is Per Capita Income in Riverton borough?
Per Capita income in Riverton borough is $54,499.
What is the Median Family Income in Riverton borough?
Median Family Income in Riverton borough is $132,593.
What is the Median Household income in Riverton borough?
Median Household Income in Riverton borough is $122,069.
What is Income or Wage Gap in Riverton borough?
Income or Wage Gap in Riverton borough is 12.0%.
Women in Riverton borough earn 88.0 cents for every dollar earned by a man.
What is Inequality or Gini Index in Riverton borough?
Inequality or Gini Index in Riverton borough is 0.35.
How Large is the Labor Force in Riverton borough?
There are 1,594 People in the Labor Forcein in Riverton borough.
What is the Percentage of People in the Labor Force in Riverton borough?
73.0% of People are in the Labor Force in Riverton borough.
What is the Unemployment Rate in Riverton borough?
Unemployment Rate in Riverton borough is 4.0%.