Moorestown Lenola, NJ
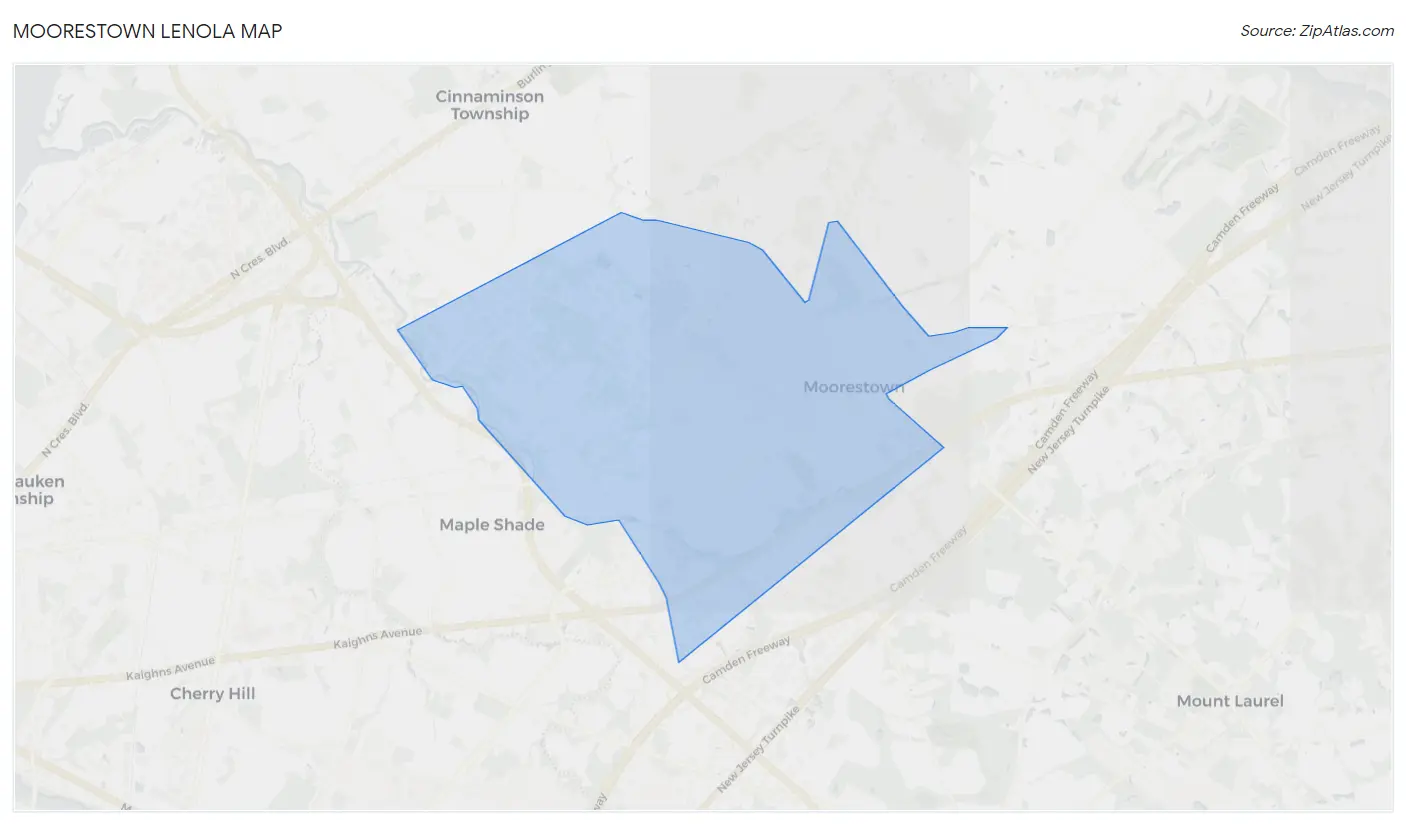
Moorestown Lenola Map
Moorestown Lenola Overview
14,379
TOTAL POPULATION
6,933
MALE POPULATION
7,446
FEMALE POPULATION
93.11
MALES / 100 FEMALES
107.40
FEMALES / 100 MALES
45.8
MEDIAN AGE
3.1
AVG FAMILY SIZE
2.6
AVG HOUSEHOLD SIZE
$80,386
PER CAPITA INCOME
$170,694
AVG FAMILY INCOME
$136,574
AVG HOUSEHOLD INCOME
39.4%
WAGE / INCOME GAP [ % ]
60.6¢/ $1
WAGE / INCOME GAP [ $ ]
0.51
INEQUALITY / GINI INDEX
7,450
LABOR FORCE [ PEOPLE ]
64.1%
PERCENT IN LABOR FORCE
4.0%
UNEMPLOYMENT RATE
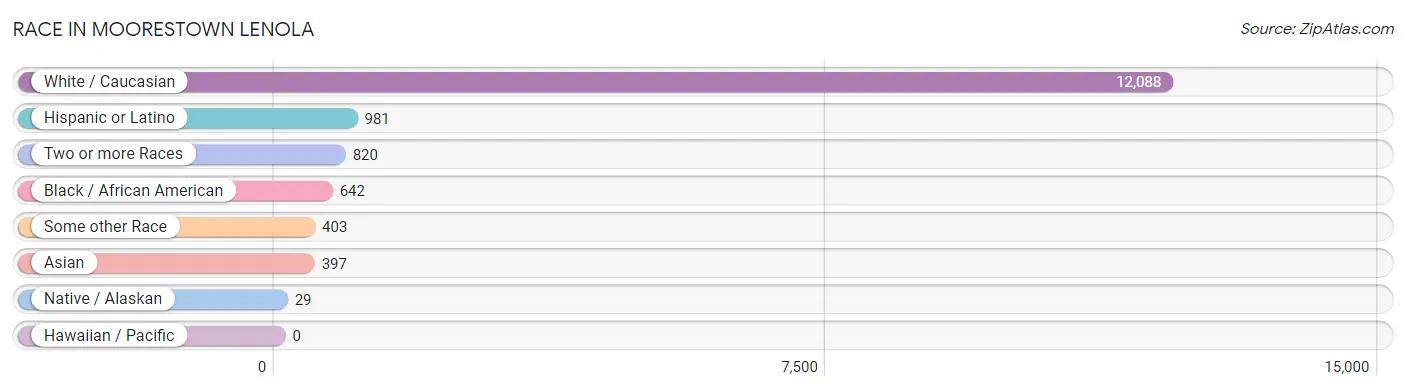
Race in Moorestown Lenola
The most populous races in Moorestown Lenola are White / Caucasian (12,088 | 84.1%), Hispanic or Latino (981 | 6.8%), and Two or more Races (820 | 5.7%).
| Race | # Population | % Population |
| Asian | 397 | 2.8% |
| Black / African American | 642 | 4.5% |
| Hawaiian / Pacific | 0 | 0.0% |
| Hispanic or Latino | 981 | 6.8% |
| Native / Alaskan | 29 | 0.2% |
| White / Caucasian | 12,088 | 84.1% |
| Two or more Races | 820 | 5.7% |
| Some other Race | 403 | 2.8% |
| Total | 14,379 | 100.0% |
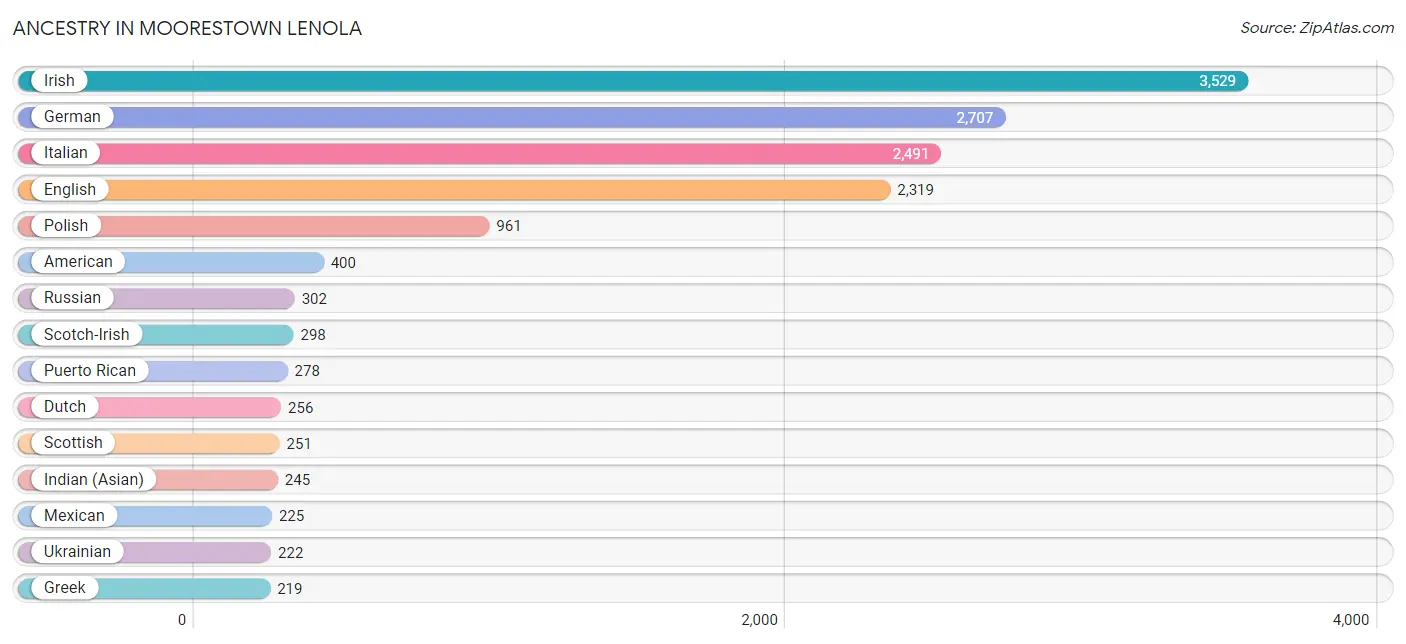
Ancestry in Moorestown Lenola
The most populous ancestries reported in Moorestown Lenola are Irish (3,529 | 24.5%), German (2,707 | 18.8%), Italian (2,491 | 17.3%), English (2,319 | 16.1%), and Polish (961 | 6.7%), together accounting for 83.5% of all Moorestown Lenola residents.
| Ancestry | # Population | % Population |
| African | 24 | 0.2% |
| Albanian | 74 | 0.5% |
| American | 400 | 2.8% |
| Arab | 98 | 0.7% |
| Armenian | 63 | 0.4% |
| Austrian | 80 | 0.6% |
| Bhutanese | 22 | 0.2% |
| Blackfeet | 29 | 0.2% |
| Bolivian | 9 | 0.1% |
| Brazilian | 81 | 0.6% |
| British | 74 | 0.5% |
| Burmese | 156 | 1.1% |
| Canadian | 41 | 0.3% |
| Carpatho Rusyn | 9 | 0.1% |
| Central American | 133 | 0.9% |
| Cherokee | 59 | 0.4% |
| Chilean | 13 | 0.1% |
| Colombian | 116 | 0.8% |
| Costa Rican | 131 | 0.9% |
| Croatian | 31 | 0.2% |
| Cuban | 50 | 0.4% |
| Czech | 25 | 0.2% |
| Danish | 37 | 0.3% |
| Dominican | 117 | 0.8% |
| Dutch | 256 | 1.8% |
| Eastern European | 39 | 0.3% |
| Egyptian | 16 | 0.1% |
| English | 2,319 | 16.1% |
| Estonian | 6 | 0.0% |
| Ethiopian | 20 | 0.1% |
| European | 152 | 1.1% |
| Finnish | 8 | 0.1% |
| French | 169 | 1.2% |
| French Canadian | 92 | 0.6% |
| German | 2,707 | 18.8% |
| Greek | 219 | 1.5% |
| Guyanese | 34 | 0.2% |
| Hungarian | 110 | 0.8% |
| Indian (Asian) | 245 | 1.7% |
| Iraqi | 48 | 0.3% |
| Irish | 3,529 | 24.5% |
| Italian | 2,491 | 17.3% |
| Korean | 106 | 0.7% |
| Latvian | 18 | 0.1% |
| Lebanese | 12 | 0.1% |
| Liberian | 12 | 0.1% |
| Lithuanian | 52 | 0.4% |
| Maltese | 7 | 0.1% |
| Mexican | 225 | 1.6% |
| Nigerian | 4 | 0.0% |
| Norwegian | 42 | 0.3% |
| Peruvian | 40 | 0.3% |
| Polish | 961 | 6.7% |
| Portuguese | 8 | 0.1% |
| Puerto Rican | 278 | 1.9% |
| Romanian | 72 | 0.5% |
| Russian | 302 | 2.1% |
| Salvadoran | 2 | 0.0% |
| Scandinavian | 10 | 0.1% |
| Scotch-Irish | 298 | 2.1% |
| Scottish | 251 | 1.8% |
| Slavic | 25 | 0.2% |
| Slovak | 8 | 0.1% |
| South American | 178 | 1.2% |
| Subsaharan African | 60 | 0.4% |
| Swedish | 141 | 1.0% |
| Swiss | 60 | 0.4% |
| Syrian | 22 | 0.2% |
| Thai | 127 | 0.9% |
| Turkish | 24 | 0.2% |
| Ukrainian | 222 | 1.5% |
| Welsh | 149 | 1.0% |
| Yugoslavian | 11 | 0.1% | View All 73 Rows |
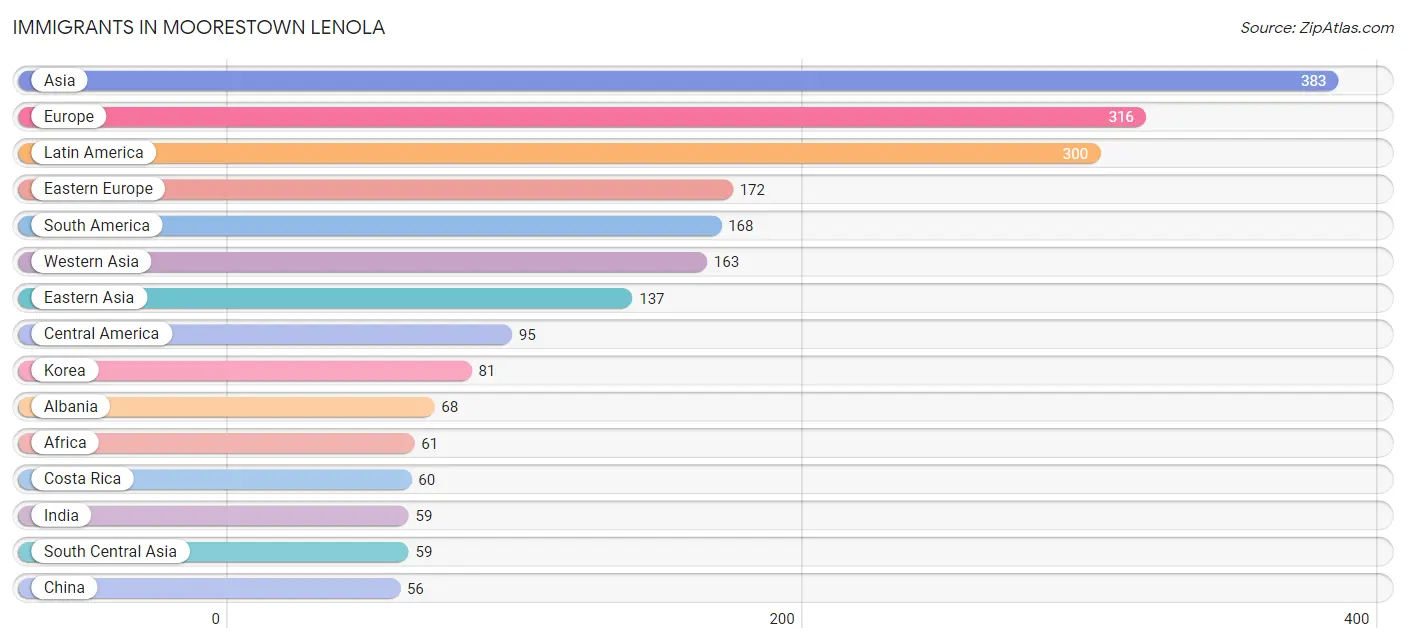
Immigrants in Moorestown Lenola
The most numerous immigrant groups reported in Moorestown Lenola came from Asia (383 | 2.7%), Europe (316 | 2.2%), Latin America (300 | 2.1%), Eastern Europe (172 | 1.2%), and South America (168 | 1.2%), together accounting for 9.3% of all Moorestown Lenola residents.
| Immigration Origin | # Population | % Population |
| Africa | 61 | 0.4% |
| Albania | 68 | 0.5% |
| Armenia | 21 | 0.2% |
| Asia | 383 | 2.7% |
| Australia | 10 | 0.1% |
| Brazil | 48 | 0.3% |
| Canada | 32 | 0.2% |
| Caribbean | 37 | 0.3% |
| Central America | 95 | 0.7% |
| Chile | 13 | 0.1% |
| China | 56 | 0.4% |
| Colombia | 48 | 0.3% |
| Costa Rica | 60 | 0.4% |
| Dominican Republic | 37 | 0.3% |
| Eastern Africa | 29 | 0.2% |
| Eastern Asia | 137 | 0.9% |
| Eastern Europe | 172 | 1.2% |
| Egypt | 16 | 0.1% |
| El Salvador | 2 | 0.0% |
| England | 18 | 0.1% |
| Ethiopia | 23 | 0.2% |
| Europe | 316 | 2.2% |
| Germany | 32 | 0.2% |
| Greece | 13 | 0.1% |
| Guyana | 34 | 0.2% |
| India | 59 | 0.4% |
| Iraq | 48 | 0.3% |
| Israel | 18 | 0.1% |
| Italy | 31 | 0.2% |
| Kenya | 6 | 0.0% |
| Korea | 81 | 0.6% |
| Latin America | 300 | 2.1% |
| Lebanon | 43 | 0.3% |
| Mexico | 33 | 0.2% |
| Netherlands | 10 | 0.1% |
| Nigeria | 4 | 0.0% |
| Northern Africa | 16 | 0.1% |
| Northern Europe | 54 | 0.4% |
| Oceania | 10 | 0.1% |
| Peru | 25 | 0.2% |
| Philippines | 11 | 0.1% |
| Poland | 23 | 0.2% |
| Romania | 48 | 0.3% |
| Russia | 18 | 0.1% |
| Singapore | 13 | 0.1% |
| South America | 168 | 1.2% |
| South Central Asia | 59 | 0.4% |
| South Eastern Asia | 24 | 0.2% |
| Southern Europe | 44 | 0.3% |
| Syria | 11 | 0.1% |
| Turkey | 13 | 0.1% |
| Ukraine | 15 | 0.1% |
| Western Africa | 4 | 0.0% |
| Western Asia | 163 | 1.1% |
| Western Europe | 42 | 0.3% | View All 55 Rows |
Sex and Age in Moorestown Lenola
Sex and Age in Moorestown Lenola
The most populous age groups in Moorestown Lenola are 45 to 49 Years (736 | 10.6%) for men and 55 to 59 Years (782 | 10.5%) for women.
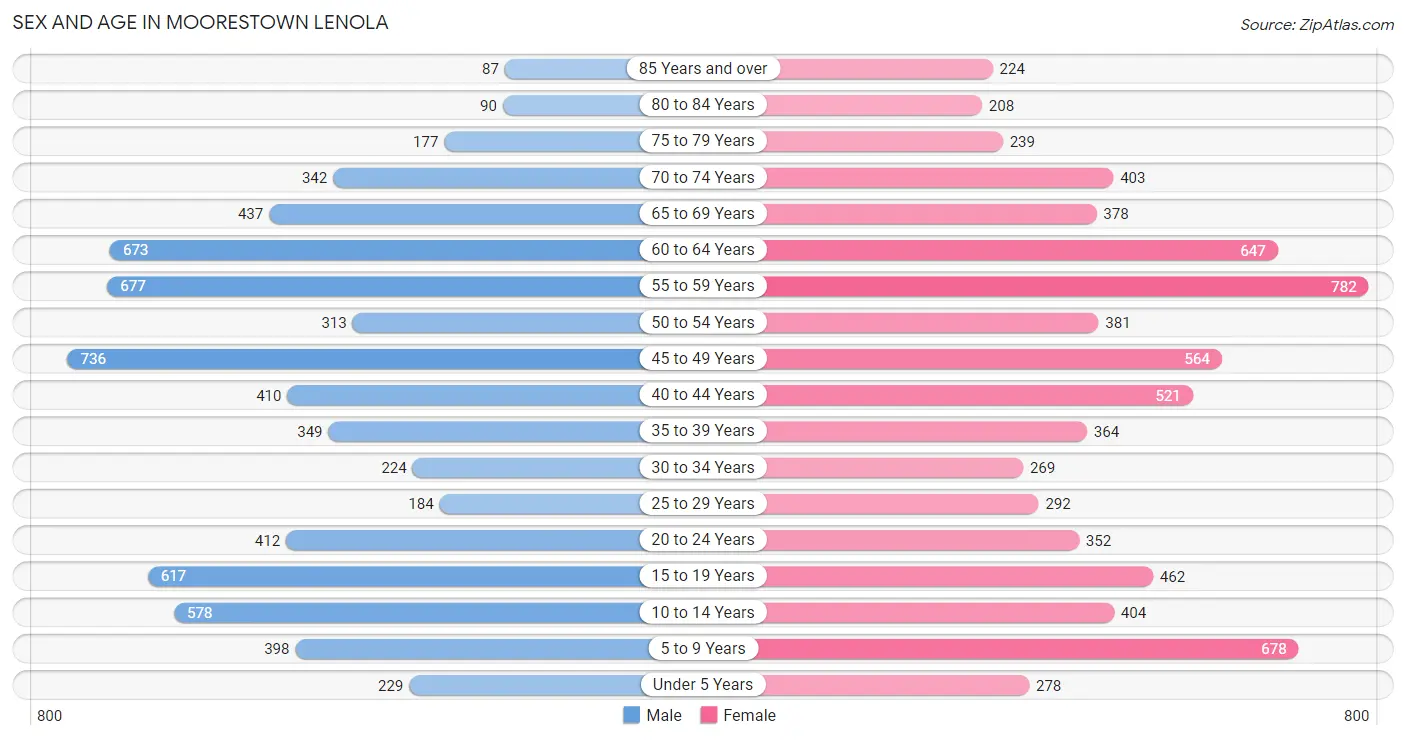
| Age Bracket | Male | Female |
| Under 5 Years | 229 (3.3%) | 278 (3.7%) |
| 5 to 9 Years | 398 (5.7%) | 678 (9.1%) |
| 10 to 14 Years | 578 (8.3%) | 404 (5.4%) |
| 15 to 19 Years | 617 (8.9%) | 462 (6.2%) |
| 20 to 24 Years | 412 (5.9%) | 352 (4.7%) |
| 25 to 29 Years | 184 (2.6%) | 292 (3.9%) |
| 30 to 34 Years | 224 (3.2%) | 269 (3.6%) |
| 35 to 39 Years | 349 (5.0%) | 364 (4.9%) |
| 40 to 44 Years | 410 (5.9%) | 521 (7.0%) |
| 45 to 49 Years | 736 (10.6%) | 564 (7.6%) |
| 50 to 54 Years | 313 (4.5%) | 381 (5.1%) |
| 55 to 59 Years | 677 (9.8%) | 782 (10.5%) |
| 60 to 64 Years | 673 (9.7%) | 647 (8.7%) |
| 65 to 69 Years | 437 (6.3%) | 378 (5.1%) |
| 70 to 74 Years | 342 (4.9%) | 403 (5.4%) |
| 75 to 79 Years | 177 (2.5%) | 239 (3.2%) |
| 80 to 84 Years | 90 (1.3%) | 208 (2.8%) |
| 85 Years and over | 87 (1.3%) | 224 (3.0%) |
| Total | 6,933 (100.0%) | 7,446 (100.0%) |
Families and Households in Moorestown Lenola
Median Family Size in Moorestown Lenola
The median family size in Moorestown Lenola is 3.13 persons per family, with single female/mother families (535 | 13.5%) accounting for the largest median family size of 3.21 persons per family. On the other hand, single male/father families (138 | 3.5%) represent the smallest median family size with 2.80 persons per family.
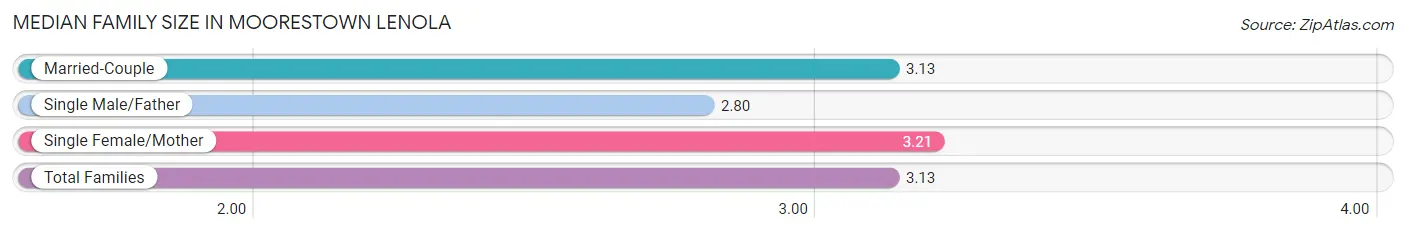
| Family Type | # Families | Family Size |
| Married-Couple | 3,294 (83.0%) | 3.13 |
| Single Male/Father | 138 (3.5%) | 2.80 |
| Single Female/Mother | 535 (13.5%) | 3.21 |
| Total Families | 3,967 (100.0%) | 3.13 |
Median Household Size in Moorestown Lenola
The median household size in Moorestown Lenola is 2.63 persons per household, with single male/father households (138 | 2.6%) accounting for the largest median household size of 3.34 persons per household. non-family households (1,415 | 26.3%) represent the smallest median household size with 1.11 persons per household.
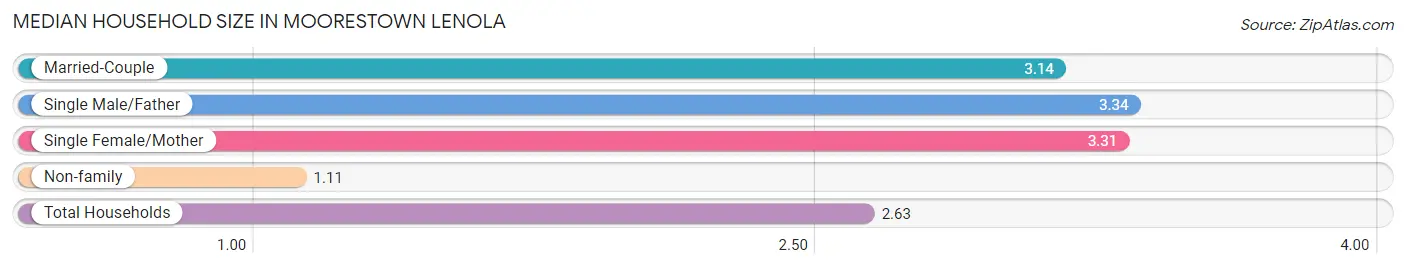
| Household Type | # Households | Household Size |
| Married-Couple | 3,294 (61.2%) | 3.14 |
| Single Male/Father | 138 (2.6%) | 3.34 |
| Single Female/Mother | 535 (9.9%) | 3.31 |
| Non-family | 1,415 (26.3%) | 1.11 |
| Total Households | 5,382 (100.0%) | 2.63 |
Household Size by Marriage Status in Moorestown Lenola
Out of a total of 5,382 households in Moorestown Lenola, 3,967 (73.7%) are family households, while 1,415 (26.3%) are nonfamily households. The most numerous type of family households are 2-person households, comprising 1,818, and the most common type of nonfamily households are 1-person households, comprising 1,307.
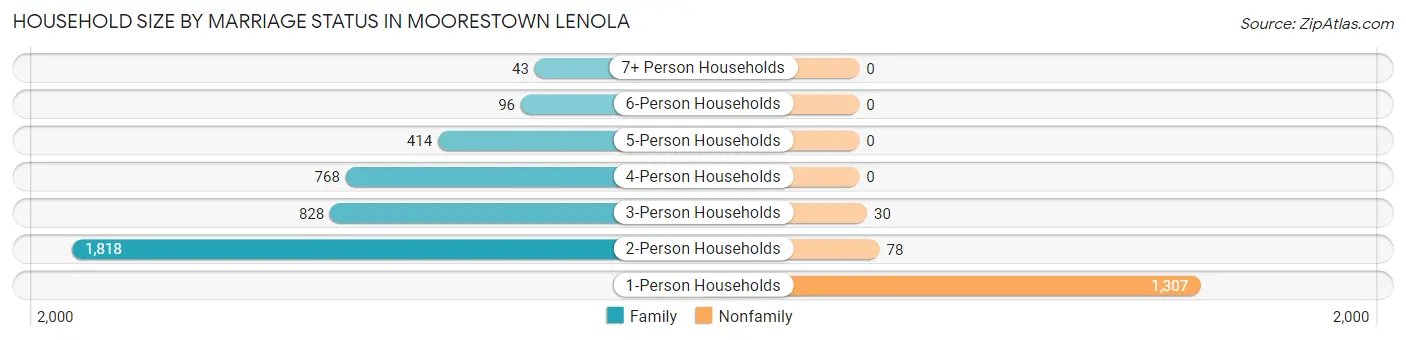
| Household Size | Family Households | Nonfamily Households |
| 1-Person Households | - | 1,307 (24.3%) |
| 2-Person Households | 1,818 (33.8%) | 78 (1.5%) |
| 3-Person Households | 828 (15.4%) | 30 (0.6%) |
| 4-Person Households | 768 (14.3%) | 0 (0.0%) |
| 5-Person Households | 414 (7.7%) | 0 (0.0%) |
| 6-Person Households | 96 (1.8%) | 0 (0.0%) |
| 7+ Person Households | 43 (0.8%) | 0 (0.0%) |
| Total | 3,967 (73.7%) | 1,415 (26.3%) |
Female Fertility in Moorestown Lenola
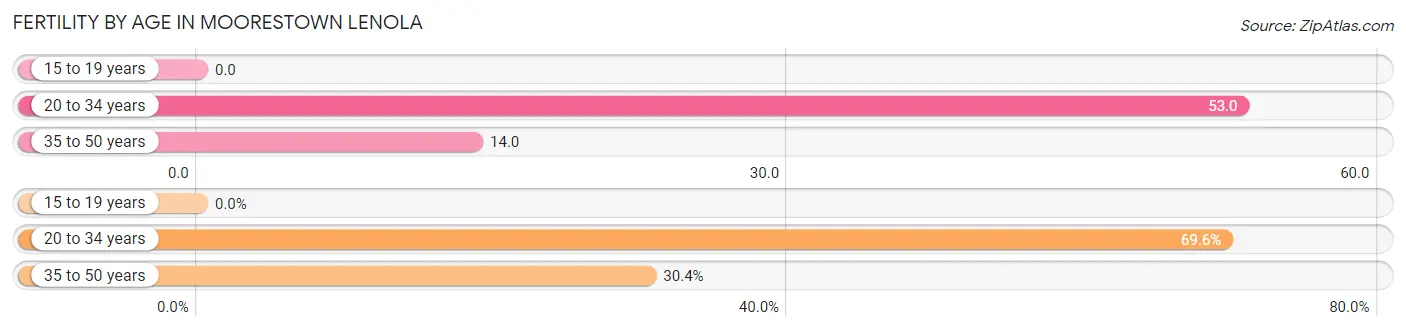
Fertility by Age in Moorestown Lenola
Average fertility rate in Moorestown Lenola is 24.0 births per 1,000 women. Women in the age bracket of 20 to 34 years have the highest fertility rate with 53.0 births per 1,000 women. Women in the age bracket of 20 to 34 years acount for 69.6% of all women with births.
| Age Bracket | Women with Births | Births / 1,000 Women |
| 15 to 19 years | 0 (0.0%) | 0.0 |
| 20 to 34 years | 48 (69.6%) | 53.0 |
| 35 to 50 years | 21 (30.4%) | 14.0 |
| Total | 69 (100.0%) | 24.0 |
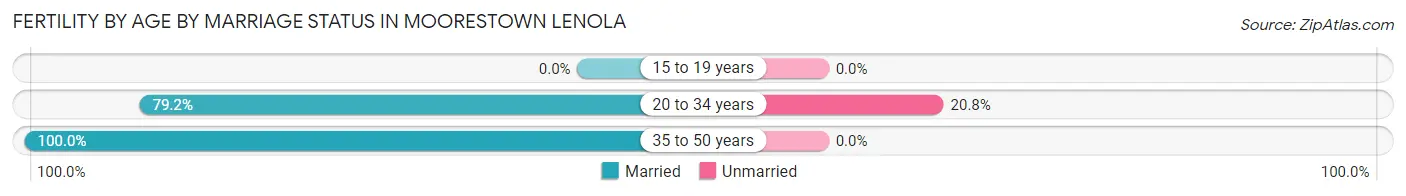
Fertility by Age by Marriage Status in Moorestown Lenola
85.5% of women with births (69) in Moorestown Lenola are married. The highest percentage of unmarried women with births falls into 20 to 34 years age bracket with 20.8% of them unmarried at the time of birth, while the lowest percentage of unmarried women with births belong to 35 to 50 years age bracket with 0.0% of them unmarried.
| Age Bracket | Married | Unmarried |
| 15 to 19 years | 0 (0.0%) | 0 (0.0%) |
| 20 to 34 years | 38 (79.2%) | 10 (20.8%) |
| 35 to 50 years | 21 (100.0%) | 0 (0.0%) |
| Total | 59 (85.5%) | 10 (14.5%) |
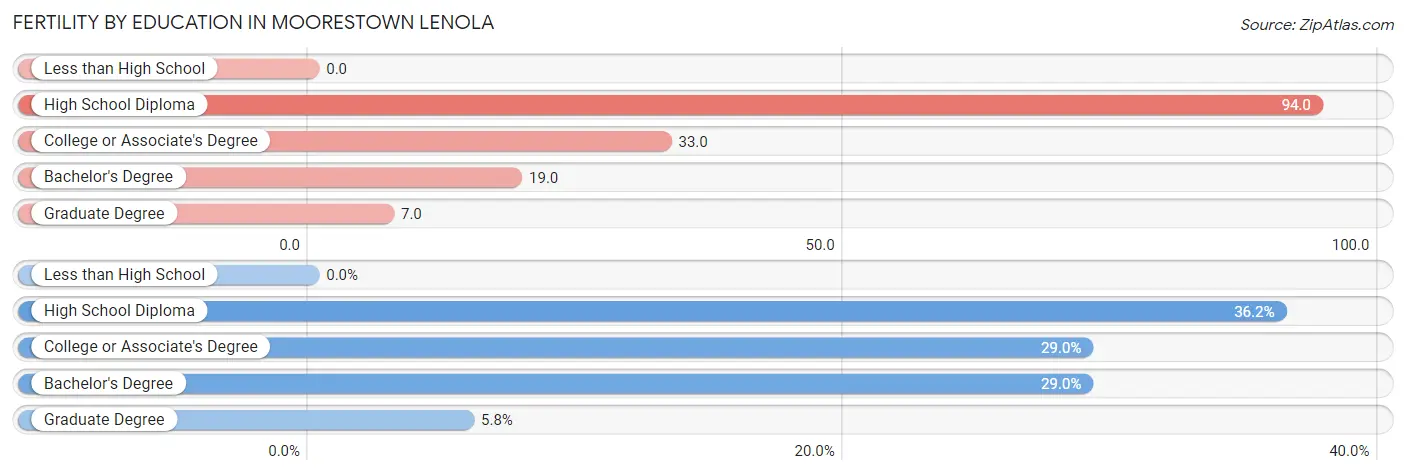
Fertility by Education in Moorestown Lenola
| Educational Attainment | Women with Births | Births / 1,000 Women |
| Less than High School | 0 (0.0%) | 0.0 |
| High School Diploma | 25 (36.2%) | 94.0 |
| College or Associate's Degree | 20 (29.0%) | 33.0 |
| Bachelor's Degree | 20 (29.0%) | 19.0 |
| Graduate Degree | 4 (5.8%) | 7.0 |
| Total | 69 (100.0%) | 24.0 |
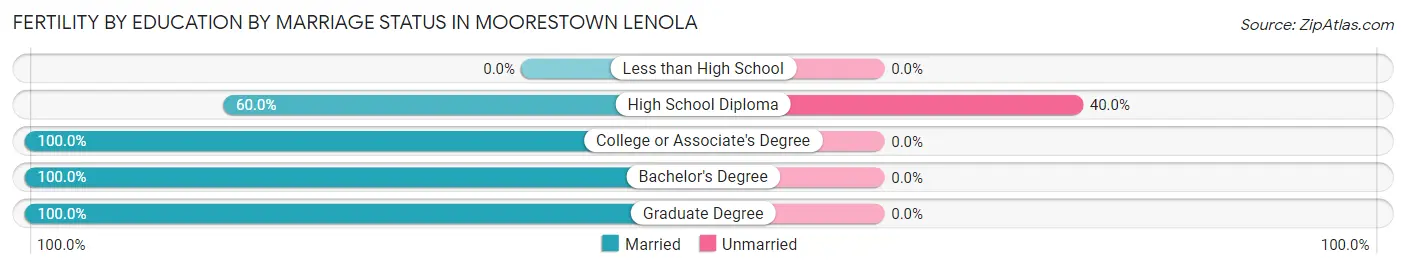
Fertility by Education by Marriage Status in Moorestown Lenola
14.5% of women with births in Moorestown Lenola are unmarried. Women with the educational attainment of college or associate's degree are most likely to be married with 100.0% of them married at childbirth, while women with the educational attainment of high school diploma are least likely to be married with 40.0% of them unmarried at childbirth.
| Educational Attainment | Married | Unmarried |
| Less than High School | 0 (0.0%) | 0 (0.0%) |
| High School Diploma | 15 (60.0%) | 10 (40.0%) |
| College or Associate's Degree | 20 (100.0%) | 0 (0.0%) |
| Bachelor's Degree | 20 (100.0%) | 0 (0.0%) |
| Graduate Degree | 4 (100.0%) | 0 (0.0%) |
| Total | 59 (85.5%) | 10 (14.5%) |
Income in Moorestown Lenola
Income Overview in Moorestown Lenola
Per Capita Income in Moorestown Lenola is $80,386, while median incomes of families and households are $170,694 and $136,574 respectively.
| Characteristic | Number | Measure |
| Per Capita Income | 14,379 | $80,386 |
| Median Family Income | 3,967 | $170,694 |
| Mean Family Income | 3,967 | $250,843 |
| Median Household Income | 5,382 | $136,574 |
| Mean Household Income | 5,382 | $211,111 |
| Income Deficit | 3,967 | $0 |
| Wage / Income Gap (%) | 14,379 | 39.43% |
| Wage / Income Gap ($) | 14,379 | 60.57¢ per $1 |
| Gini / Inequality Index | 14,379 | 0.51 |
Earnings by Sex in Moorestown Lenola
Average Earnings in Moorestown Lenola are $62,683, $77,663 for men and $47,041 for women, a difference of 39.4%.
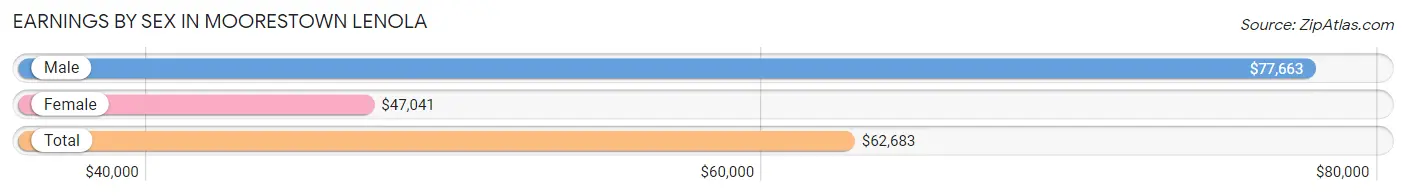
| Sex | Number | Average Earnings |
| Male | 4,350 (54.9%) | $77,663 |
| Female | 3,572 (45.1%) | $47,041 |
| Total | 7,922 (100.0%) | $62,683 |
Earnings by Sex by Income Bracket in Moorestown Lenola
The most common earnings brackets in Moorestown Lenola are $100,000+ for men (1,801 | 41.4%) and $100,000+ for women (883 | 24.7%).
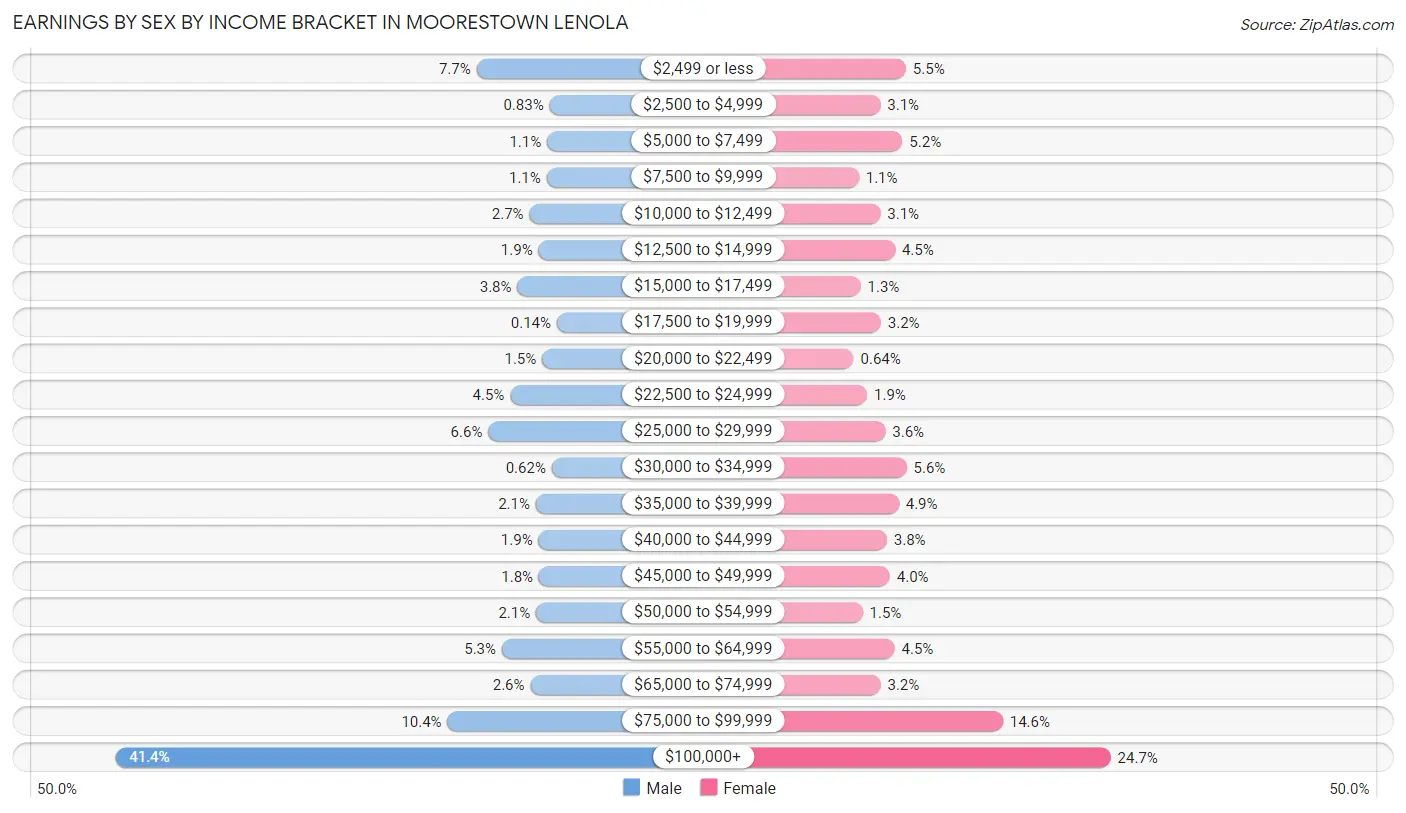
| Income | Male | Female |
| $2,499 or less | 333 (7.7%) | 198 (5.5%) |
| $2,500 to $4,999 | 36 (0.8%) | 112 (3.1%) |
| $5,000 to $7,499 | 46 (1.1%) | 186 (5.2%) |
| $7,500 to $9,999 | 48 (1.1%) | 40 (1.1%) |
| $10,000 to $12,499 | 118 (2.7%) | 112 (3.1%) |
| $12,500 to $14,999 | 81 (1.9%) | 161 (4.5%) |
| $15,000 to $17,499 | 167 (3.8%) | 46 (1.3%) |
| $17,500 to $19,999 | 6 (0.1%) | 114 (3.2%) |
| $20,000 to $22,499 | 66 (1.5%) | 23 (0.6%) |
| $22,500 to $24,999 | 196 (4.5%) | 68 (1.9%) |
| $25,000 to $29,999 | 286 (6.6%) | 129 (3.6%) |
| $30,000 to $34,999 | 27 (0.6%) | 200 (5.6%) |
| $35,000 to $39,999 | 92 (2.1%) | 174 (4.9%) |
| $40,000 to $44,999 | 81 (1.9%) | 134 (3.7%) |
| $45,000 to $49,999 | 79 (1.8%) | 144 (4.0%) |
| $50,000 to $54,999 | 91 (2.1%) | 53 (1.5%) |
| $55,000 to $64,999 | 230 (5.3%) | 160 (4.5%) |
| $65,000 to $74,999 | 114 (2.6%) | 113 (3.2%) |
| $75,000 to $99,999 | 452 (10.4%) | 522 (14.6%) |
| $100,000+ | 1,801 (41.4%) | 883 (24.7%) |
| Total | 4,350 (100.0%) | 3,572 (100.0%) |
Earnings by Sex by Educational Attainment in Moorestown Lenola
Average earnings in Moorestown Lenola are $95,526 for men and $63,045 for women, a difference of 34.0%. Men with an educational attainment of graduate degree enjoy the highest average annual earnings of $175,000, while those with less than high school education earn the least with $16,899. Women with an educational attainment of graduate degree earn the most with the average annual earnings of $87,850, while those with less than high school education have the smallest earnings of $14,268.
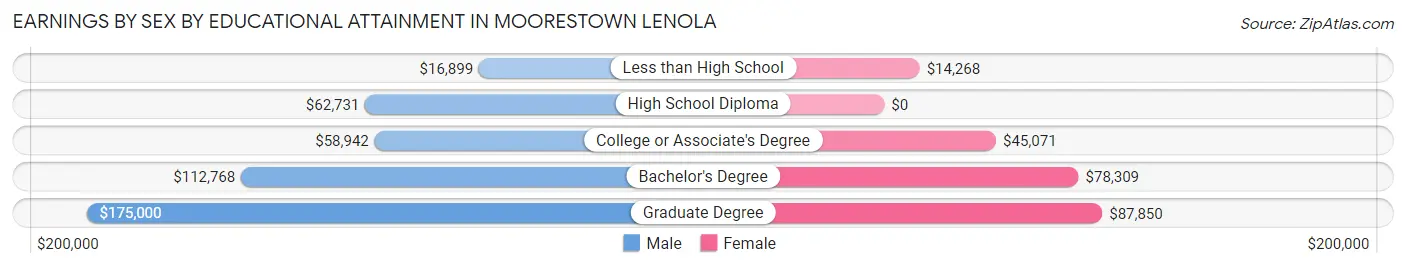
| Educational Attainment | Male Income | Female Income |
| Less than High School | $16,899 | $14,268 |
| High School Diploma | $62,731 | $0 |
| College or Associate's Degree | $58,942 | $45,071 |
| Bachelor's Degree | $112,768 | $78,309 |
| Graduate Degree | $175,000 | $87,850 |
| Total | $95,526 | $63,045 |
Family Income in Moorestown Lenola
Family Income Brackets in Moorestown Lenola
According to the Moorestown Lenola family income data, there are 1,710 families falling into the $200,000+ income range, which is the most common income bracket and makes up 43.1% of all families. Conversely, the $10,000 to $14,999 income bracket is the least frequent group with only 44 families (1.1%) belonging to this category.
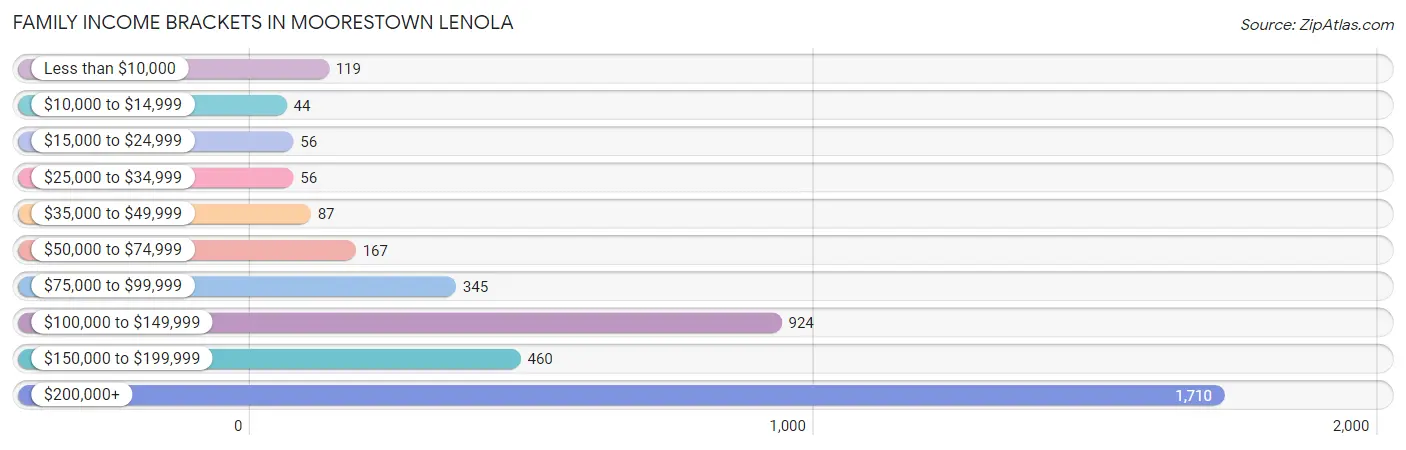
| Income Bracket | # Families | % Families |
| Less than $10,000 | 119 | 3.0% |
| $10,000 to $14,999 | 44 | 1.1% |
| $15,000 to $24,999 | 56 | 1.4% |
| $25,000 to $34,999 | 56 | 1.4% |
| $35,000 to $49,999 | 87 | 2.2% |
| $50,000 to $74,999 | 167 | 4.2% |
| $75,000 to $99,999 | 345 | 8.7% |
| $100,000 to $149,999 | 924 | 23.3% |
| $150,000 to $199,999 | 460 | 11.6% |
| $200,000+ | 1,710 | 43.1% |
Family Income by Famaliy Size in Moorestown Lenola
4-person families (691 | 17.4%) account for the highest median family income in Moorestown Lenola with $236,625 per family, while 2-person families (1,855 | 46.8%) have the highest median income of $71,998 per family member.
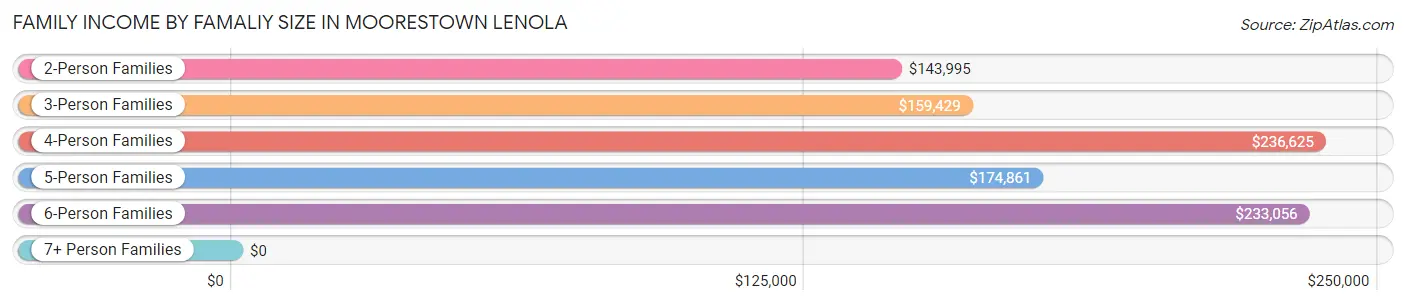
| Income Bracket | # Families | Median Income |
| 2-Person Families | 1,855 (46.8%) | $143,995 |
| 3-Person Families | 868 (21.9%) | $159,429 |
| 4-Person Families | 691 (17.4%) | $236,625 |
| 5-Person Families | 414 (10.4%) | $174,861 |
| 6-Person Families | 128 (3.2%) | $233,056 |
| 7+ Person Families | 11 (0.3%) | $0 |
| Total | 3,967 (100.0%) | $170,694 |
Family Income by Number of Earners in Moorestown Lenola
The median family income in Moorestown Lenola is $170,694, with families comprising 2 earners (1,773) having the highest median family income of $226,250, while families with no earners (479) have the lowest median family income of $103,398, accounting for 44.7% and 12.1% of families, respectively.
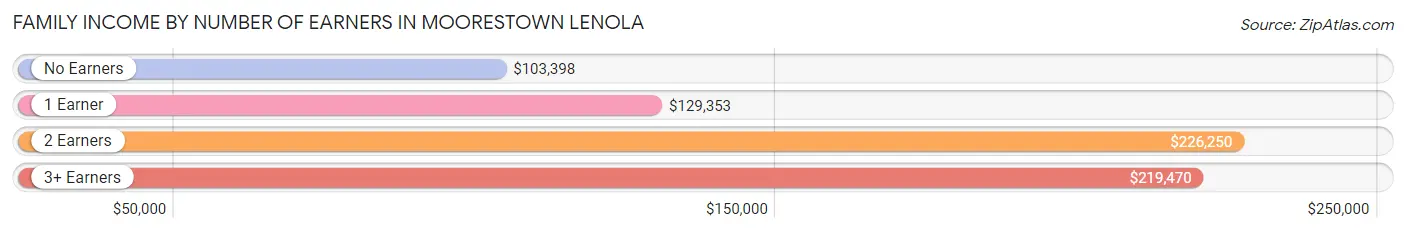
| Number of Earners | # Families | Median Income |
| No Earners | 479 (12.1%) | $103,398 |
| 1 Earner | 1,193 (30.1%) | $129,353 |
| 2 Earners | 1,773 (44.7%) | $226,250 |
| 3+ Earners | 522 (13.2%) | $219,470 |
| Total | 3,967 (100.0%) | $170,694 |
Household Income in Moorestown Lenola
Household Income Brackets in Moorestown Lenola
With 1,851 households falling in the category, the $200,000+ income range is the most frequent in Moorestown Lenola, accounting for 34.4% of all households. In contrast, only 129 households (2.4%) fall into the $10,000 to $14,999 income bracket, making it the least populous group.
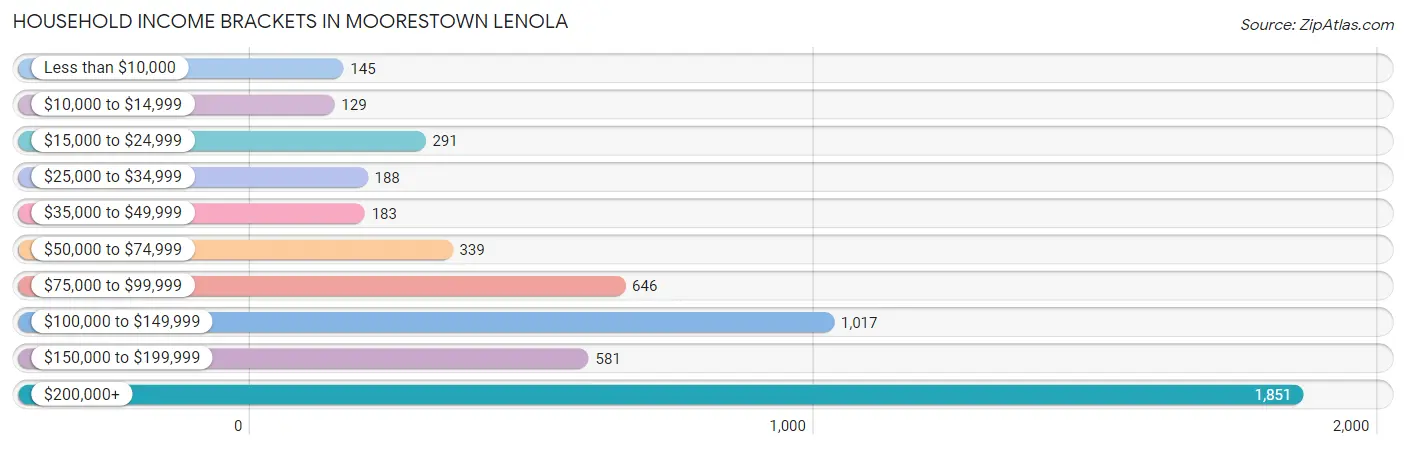
| Income Bracket | # Households | % Households |
| Less than $10,000 | 145 | 2.7% |
| $10,000 to $14,999 | 129 | 2.4% |
| $15,000 to $24,999 | 291 | 5.4% |
| $25,000 to $34,999 | 188 | 3.5% |
| $35,000 to $49,999 | 183 | 3.4% |
| $50,000 to $74,999 | 339 | 6.3% |
| $75,000 to $99,999 | 646 | 12.0% |
| $100,000 to $149,999 | 1,017 | 18.9% |
| $150,000 to $199,999 | 581 | 10.8% |
| $200,000+ | 1,851 | 34.4% |
Household Income by Householder Age in Moorestown Lenola
The median household income in Moorestown Lenola is $136,574, with the highest median household income of $172,813 found in the 45 to 64 years age bracket for the primary householder. A total of 2,599 households (48.3%) fall into this category. Meanwhile, the 15 to 24 years age bracket for the primary householder has the lowest median household income of $0, with 29 households (0.5%) in this group.
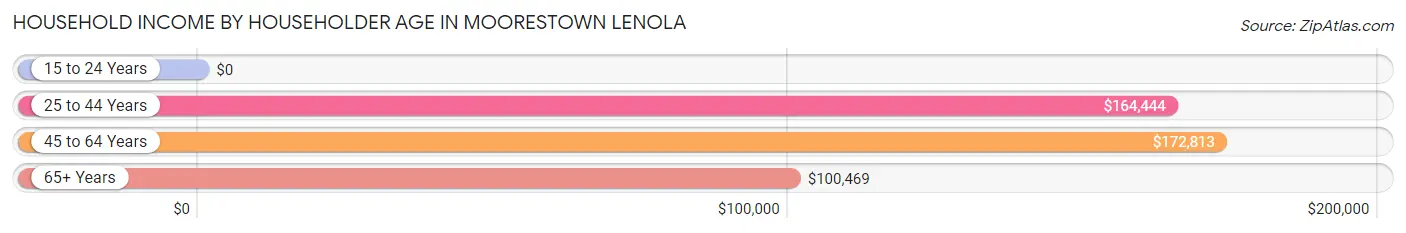
| Income Bracket | # Households | Median Income |
| 15 to 24 Years | 29 (0.5%) | $0 |
| 25 to 44 Years | 1,126 (20.9%) | $164,444 |
| 45 to 64 Years | 2,599 (48.3%) | $172,813 |
| 65+ Years | 1,628 (30.2%) | $100,469 |
| Total | 5,382 (100.0%) | $136,574 |
Poverty in Moorestown Lenola
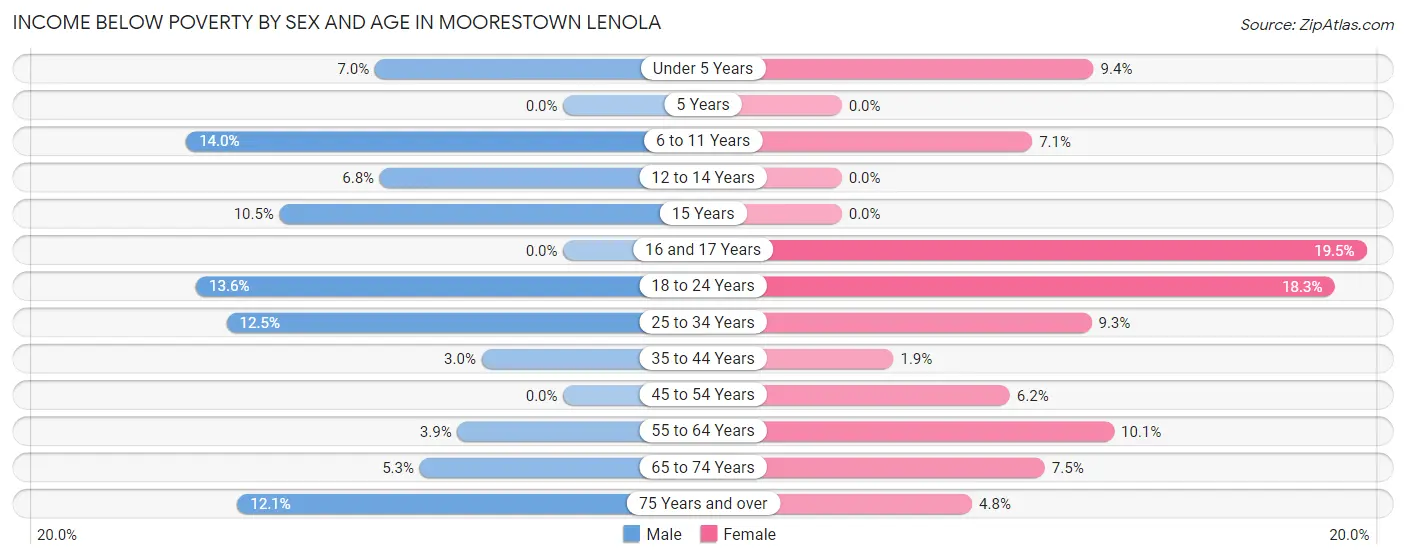
Income Below Poverty by Sex and Age in Moorestown Lenola
With 6.0% poverty level for males and 7.9% for females among the residents of Moorestown Lenola, 6 to 11 year old males and 16 and 17 year old females are the most vulnerable to poverty, with 92 males (14.0%) and 66 females (19.5%) in their respective age groups living below the poverty level.
| Age Bracket | Male | Female |
| Under 5 Years | 16 (7.0%) | 26 (9.3%) |
| 5 Years | 0 (0.0%) | 0 (0.0%) |
| 6 to 11 Years | 92 (14.0%) | 44 (7.1%) |
| 12 to 14 Years | 16 (6.8%) | 0 (0.0%) |
| 15 Years | 18 (10.5%) | 0 (0.0%) |
| 16 and 17 Years | 0 (0.0%) | 66 (19.5%) |
| 18 to 24 Years | 65 (13.6%) | 83 (18.3%) |
| 25 to 34 Years | 51 (12.5%) | 52 (9.3%) |
| 35 to 44 Years | 23 (3.0%) | 17 (1.9%) |
| 45 to 54 Years | 0 (0.0%) | 59 (6.2%) |
| 55 to 64 Years | 52 (3.9%) | 143 (10.1%) |
| 65 to 74 Years | 41 (5.3%) | 58 (7.5%) |
| 75 Years and over | 38 (12.1%) | 28 (4.8%) |
| Total | 412 (6.0%) | 576 (7.9%) |
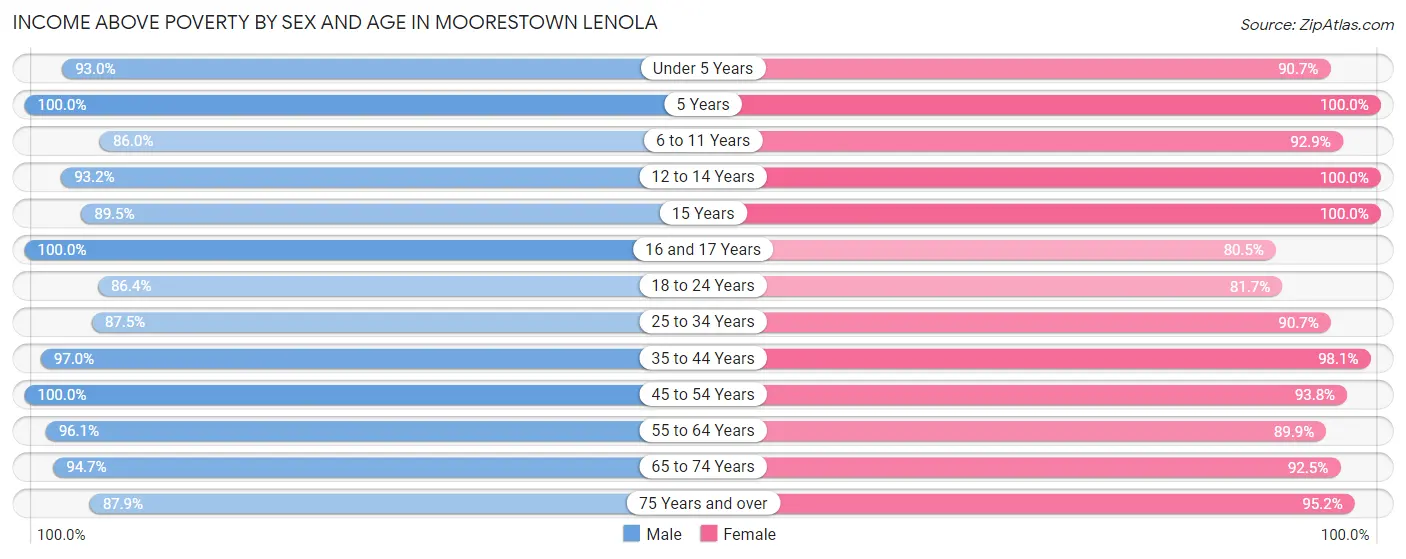
Income Above Poverty by Sex and Age in Moorestown Lenola
According to the poverty statistics in Moorestown Lenola, males aged 5 years and females aged 5 years are the age groups that are most secure financially, with 100.0% of males and 100.0% of females in these age groups living above the poverty line.
| Age Bracket | Male | Female |
| Under 5 Years | 213 (93.0%) | 252 (90.6%) |
| 5 Years | 84 (100.0%) | 148 (100.0%) |
| 6 to 11 Years | 565 (86.0%) | 578 (92.9%) |
| 12 to 14 Years | 219 (93.2%) | 305 (100.0%) |
| 15 Years | 153 (89.5%) | 21 (100.0%) |
| 16 and 17 Years | 381 (100.0%) | 273 (80.5%) |
| 18 to 24 Years | 412 (86.4%) | 371 (81.7%) |
| 25 to 34 Years | 357 (87.5%) | 509 (90.7%) |
| 35 to 44 Years | 736 (97.0%) | 868 (98.1%) |
| 45 to 54 Years | 1,049 (100.0%) | 886 (93.8%) |
| 55 to 64 Years | 1,270 (96.1%) | 1,271 (89.9%) |
| 65 to 74 Years | 728 (94.7%) | 711 (92.5%) |
| 75 Years and over | 276 (87.9%) | 550 (95.2%) |
| Total | 6,443 (94.0%) | 6,743 (92.1%) |
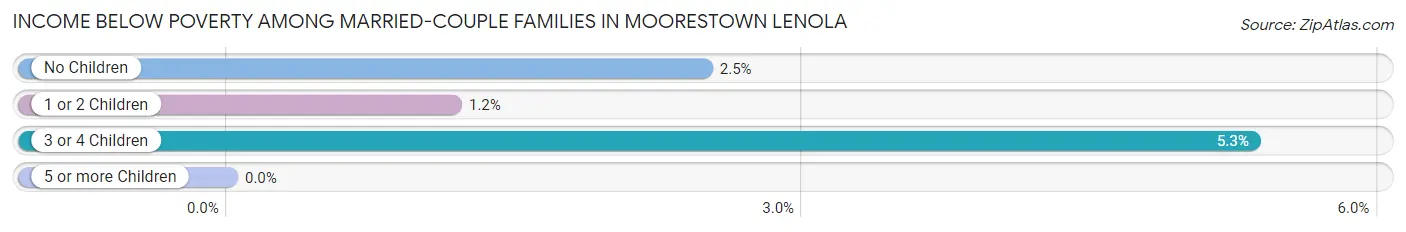
Income Below Poverty Among Married-Couple Families in Moorestown Lenola
The poverty statistics for married-couple families in Moorestown Lenola show that 2.3% or 75 of the total 3,294 families live below the poverty line. Families with 3 or 4 children have the highest poverty rate of 5.3%, comprising of 15 families. On the other hand, families with 5 or more children have the lowest poverty rate of 0.0%, which includes 0 families.
| Children | Above Poverty | Below Poverty |
| No Children | 1,848 (97.5%) | 47 (2.5%) |
| 1 or 2 Children | 1,101 (98.8%) | 13 (1.2%) |
| 3 or 4 Children | 266 (94.7%) | 15 (5.3%) |
| 5 or more Children | 4 (100.0%) | 0 (0.0%) |
| Total | 3,219 (97.7%) | 75 (2.3%) |
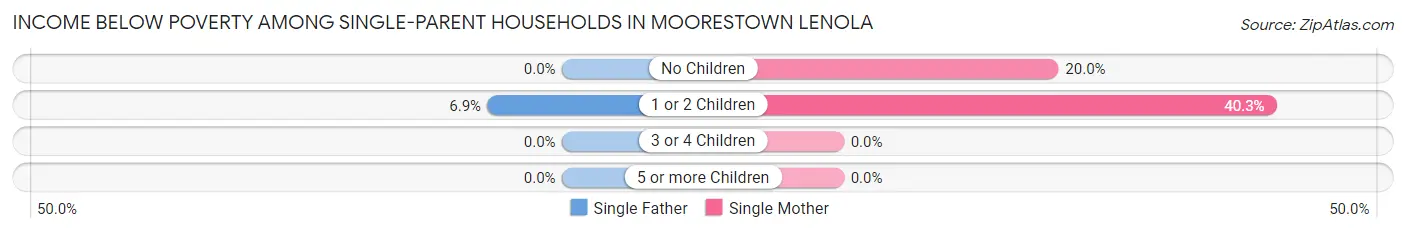
Income Below Poverty Among Single-Parent Households in Moorestown Lenola
According to the poverty data in Moorestown Lenola, 3.6% or 5 single-father households and 32.2% or 172 single-mother households are living below the poverty line. Among single-father households, those with 1 or 2 children have the highest poverty rate, with 5 households (6.9%) experiencing poverty. Likewise, among single-mother households, those with 1 or 2 children have the highest poverty rate, with 133 households (40.3%) falling below the poverty line.
| Children | Single Father | Single Mother |
| No Children | 0 (0.0%) | 39 (20.0%) |
| 1 or 2 Children | 5 (6.9%) | 133 (40.3%) |
| 3 or 4 Children | 0 (0.0%) | 0 (0.0%) |
| 5 or more Children | 0 (0.0%) | 0 (0.0%) |
| Total | 5 (3.6%) | 172 (32.2%) |
Income Below Poverty Among Married-Couple vs Single-Parent Households in Moorestown Lenola
The poverty data for Moorestown Lenola shows that 75 of the married-couple family households (2.3%) and 177 of the single-parent households (26.3%) are living below the poverty level. Within the married-couple family households, those with 3 or 4 children have the highest poverty rate, with 15 households (5.3%) falling below the poverty line. Among the single-parent households, those with 1 or 2 children have the highest poverty rate, with 138 household (34.3%) living below poverty.
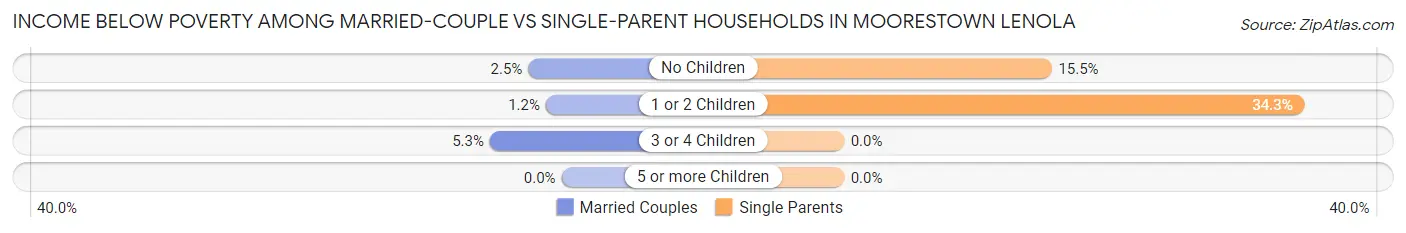
| Children | Married-Couple Families | Single-Parent Households |
| No Children | 47 (2.5%) | 39 (15.5%) |
| 1 or 2 Children | 13 (1.2%) | 138 (34.3%) |
| 3 or 4 Children | 15 (5.3%) | 0 (0.0%) |
| 5 or more Children | 0 (0.0%) | 0 (0.0%) |
| Total | 75 (2.3%) | 177 (26.3%) |
Employment Characteristics in Moorestown Lenola
Employment by Class of Employer in Moorestown Lenola
Among the 7,037 employed individuals in Moorestown Lenola, private company employees (4,371 | 62.1%), self-employed (incorporated) (602 | 8.6%), and not-for-profit organizations (552 | 7.8%) make up the most common classes of employment.
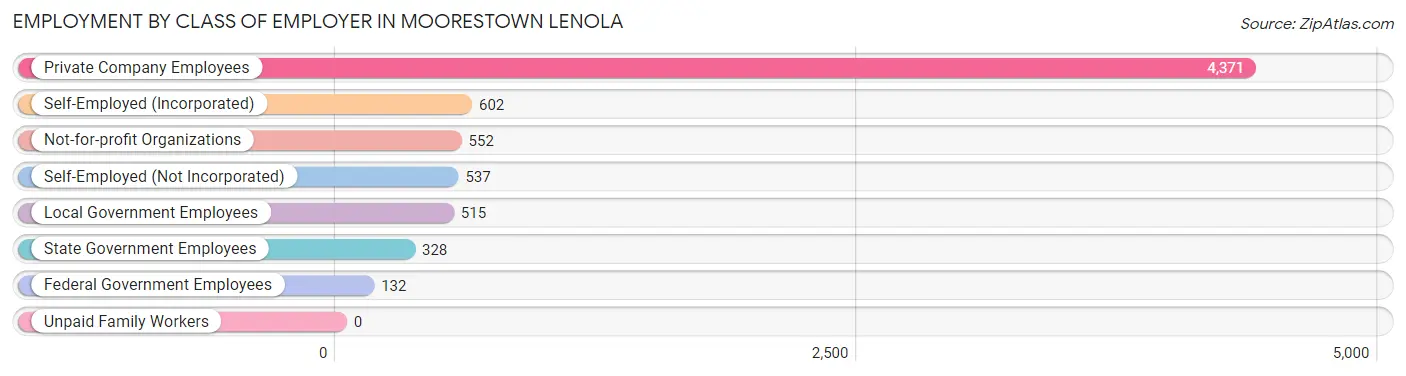
| Employer Class | # Employees | % Employees |
| Private Company Employees | 4,371 | 62.1% |
| Self-Employed (Incorporated) | 602 | 8.6% |
| Self-Employed (Not Incorporated) | 537 | 7.6% |
| Not-for-profit Organizations | 552 | 7.8% |
| Local Government Employees | 515 | 7.3% |
| State Government Employees | 328 | 4.7% |
| Federal Government Employees | 132 | 1.9% |
| Unpaid Family Workers | 0 | 0.0% |
| Total | 7,037 | 100.0% |
Employment Status by Age in Moorestown Lenola
According to the labor force statistics for Moorestown Lenola, out of the total population over 16 years of age (11,622), 64.1% or 7,450 individuals are in the labor force, with 4.0% or 298 of them unemployed. The age group with the highest labor force participation rate is 25 to 29 years, with 92.0% or 438 individuals in the labor force. Within the labor force, the 16 to 19 years age range has the highest percentage of unemployed individuals, with 10.7% or 23 of them being unemployed.
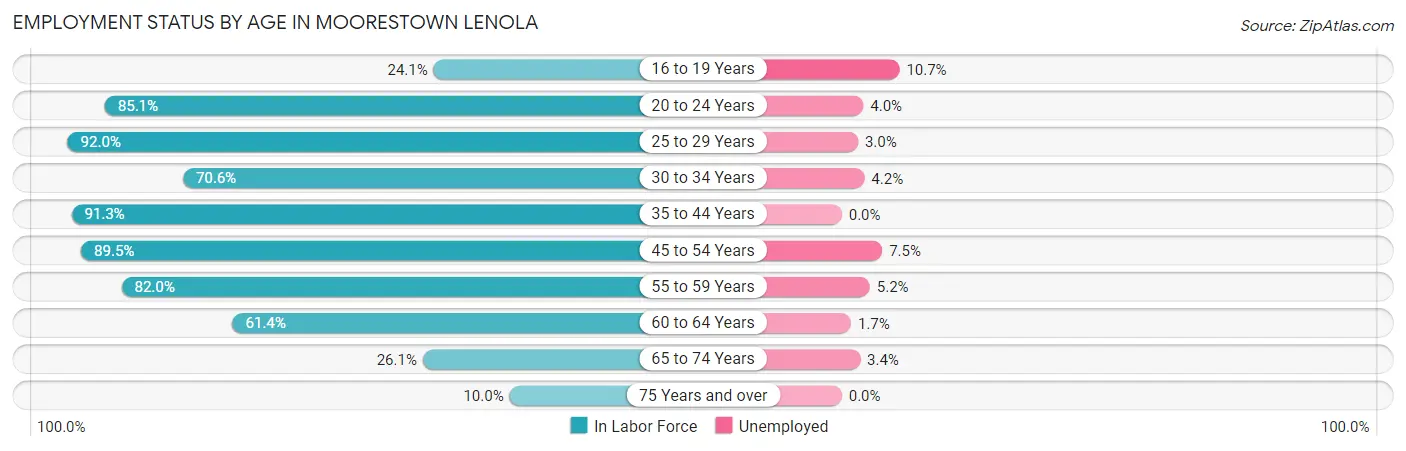
| Age Bracket | In Labor Force | Unemployed |
| 16 to 19 Years | 214 (24.1%) | 23 (10.7%) |
| 20 to 24 Years | 650 (85.1%) | 26 (4.0%) |
| 25 to 29 Years | 438 (92.0%) | 13 (3.0%) |
| 30 to 34 Years | 348 (70.6%) | 15 (4.2%) |
| 35 to 44 Years | 1,501 (91.3%) | 0 (0.0%) |
| 45 to 54 Years | 1,785 (89.5%) | 134 (7.5%) |
| 55 to 59 Years | 1,196 (82.0%) | 62 (5.2%) |
| 60 to 64 Years | 810 (61.4%) | 14 (1.7%) |
| 65 to 74 Years | 407 (26.1%) | 14 (3.4%) |
| 75 Years and over | 102 (10.0%) | 0 (0.0%) |
| Total | 7,450 (64.1%) | 298 (4.0%) |
Employment Status by Educational Attainment in Moorestown Lenola
According to labor force statistics for Moorestown Lenola, 82.3% of individuals (6,079) out of the total population between 25 and 64 years of age (7,386) are in the labor force, with 3.9% or 237 of them being unemployed. The group with the highest labor force participation rate are those with the educational attainment of bachelor's degree or higher, with 87.3% or 4,132 individuals in the labor force. Within the labor force, individuals with high school diploma education have the highest percentage of unemployment, with 9.8% or 56 of them being unemployed.
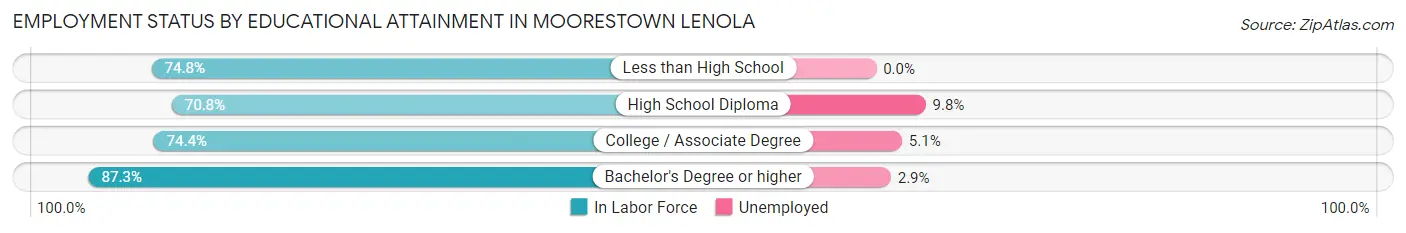
| Educational Attainment | In Labor Force | Unemployed |
| Less than High School | 175 (74.8%) | 0 (0.0%) |
| High School Diploma | 572 (70.8%) | 79 (9.8%) |
| College / Associate Degree | 1,199 (74.4%) | 82 (5.1%) |
| Bachelor's Degree or higher | 4,132 (87.3%) | 137 (2.9%) |
| Total | 6,079 (82.3%) | 288 (3.9%) |
Employment Occupations by Sex in Moorestown Lenola
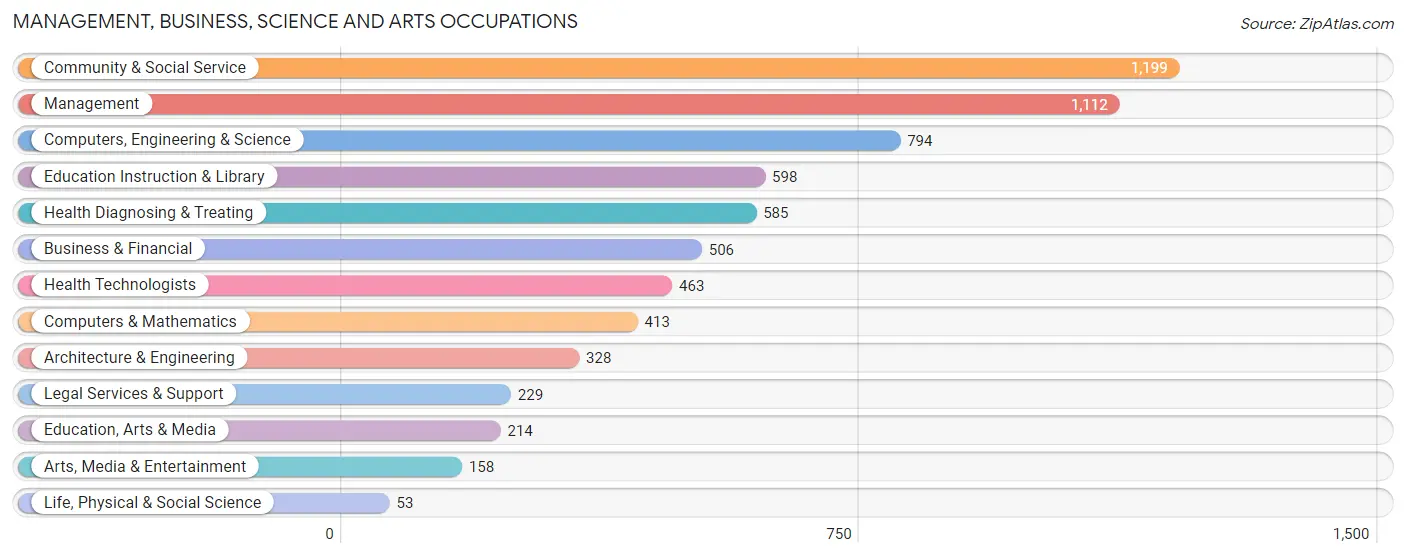
Management, Business, Science and Arts Occupations
The most common Management, Business, Science and Arts occupations in Moorestown Lenola are Community & Social Service (1,199 | 16.8%), Management (1,112 | 15.6%), Computers, Engineering & Science (794 | 11.1%), Education Instruction & Library (598 | 8.4%), and Health Diagnosing & Treating (585 | 8.2%).
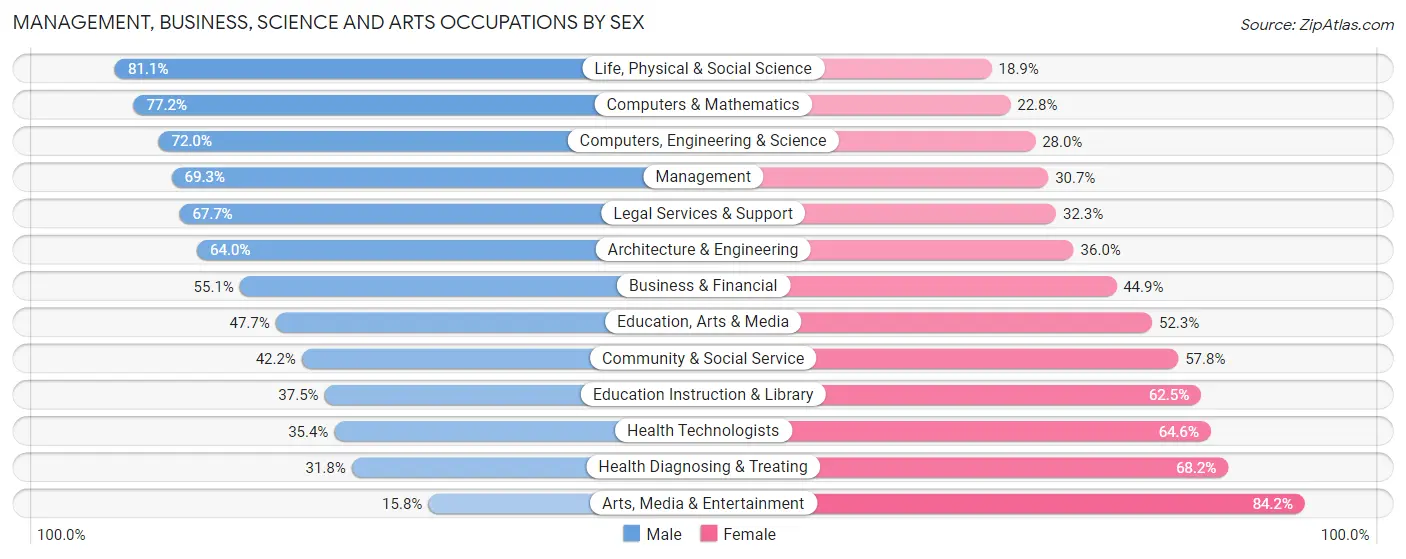
Management, Business, Science and Arts Occupations by Sex
Within the Management, Business, Science and Arts occupations in Moorestown Lenola, the most male-oriented occupations are Life, Physical & Social Science (81.1%), Computers & Mathematics (77.2%), and Computers, Engineering & Science (72.0%), while the most female-oriented occupations are Arts, Media & Entertainment (84.2%), Health Diagnosing & Treating (68.2%), and Health Technologists (64.6%).
| Occupation | Male | Female |
| Management | 771 (69.3%) | 341 (30.7%) |
| Business & Financial | 279 (55.1%) | 227 (44.9%) |
| Computers, Engineering & Science | 572 (72.0%) | 222 (28.0%) |
| Computers & Mathematics | 319 (77.2%) | 94 (22.8%) |
| Architecture & Engineering | 210 (64.0%) | 118 (36.0%) |
| Life, Physical & Social Science | 43 (81.1%) | 10 (18.9%) |
| Community & Social Service | 506 (42.2%) | 693 (57.8%) |
| Education, Arts & Media | 102 (47.7%) | 112 (52.3%) |
| Legal Services & Support | 155 (67.7%) | 74 (32.3%) |
| Education Instruction & Library | 224 (37.5%) | 374 (62.5%) |
| Arts, Media & Entertainment | 25 (15.8%) | 133 (84.2%) |
| Health Diagnosing & Treating | 186 (31.8%) | 399 (68.2%) |
| Health Technologists | 164 (35.4%) | 299 (64.6%) |
| Total (Category) | 2,314 (55.1%) | 1,882 (44.9%) |
| Total (Overall) | 3,934 (55.1%) | 3,202 (44.9%) |
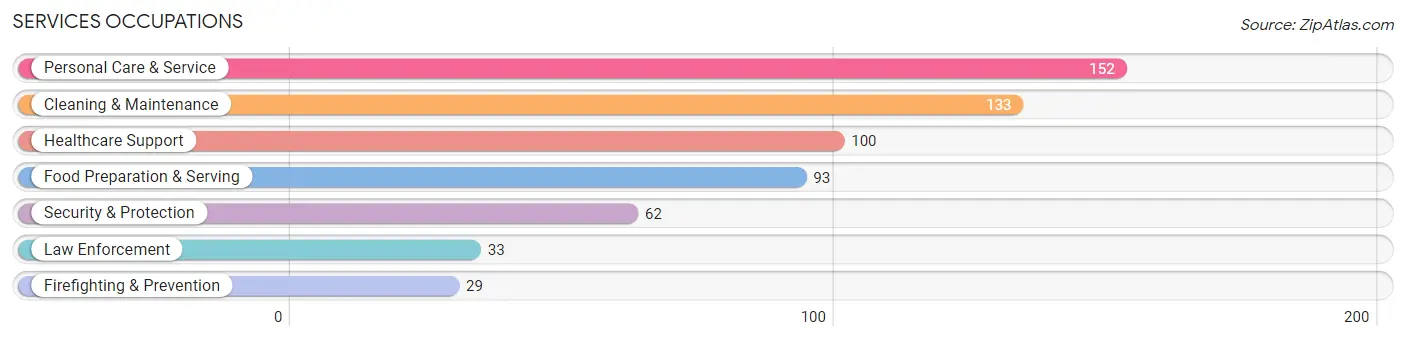
Services Occupations
The most common Services occupations in Moorestown Lenola are Personal Care & Service (152 | 2.1%), Cleaning & Maintenance (133 | 1.9%), Healthcare Support (100 | 1.4%), Food Preparation & Serving (93 | 1.3%), and Security & Protection (62 | 0.9%).
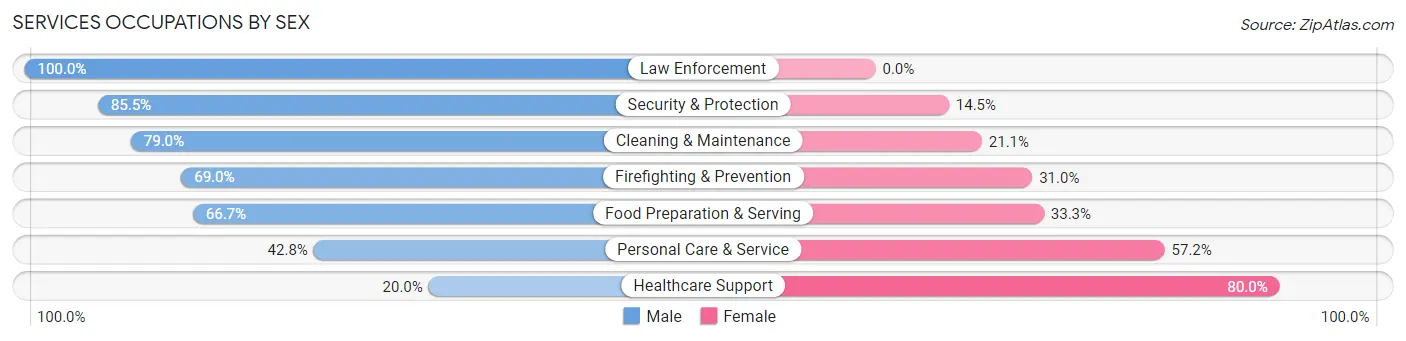
Services Occupations by Sex
Within the Services occupations in Moorestown Lenola, the most male-oriented occupations are Law Enforcement (100.0%), Security & Protection (85.5%), and Cleaning & Maintenance (78.9%), while the most female-oriented occupations are Healthcare Support (80.0%), Personal Care & Service (57.2%), and Food Preparation & Serving (33.3%).
| Occupation | Male | Female |
| Healthcare Support | 20 (20.0%) | 80 (80.0%) |
| Security & Protection | 53 (85.5%) | 9 (14.5%) |
| Firefighting & Prevention | 20 (69.0%) | 9 (31.0%) |
| Law Enforcement | 33 (100.0%) | 0 (0.0%) |
| Food Preparation & Serving | 62 (66.7%) | 31 (33.3%) |
| Cleaning & Maintenance | 105 (78.9%) | 28 (21.0%) |
| Personal Care & Service | 65 (42.8%) | 87 (57.2%) |
| Total (Category) | 305 (56.5%) | 235 (43.5%) |
| Total (Overall) | 3,934 (55.1%) | 3,202 (44.9%) |
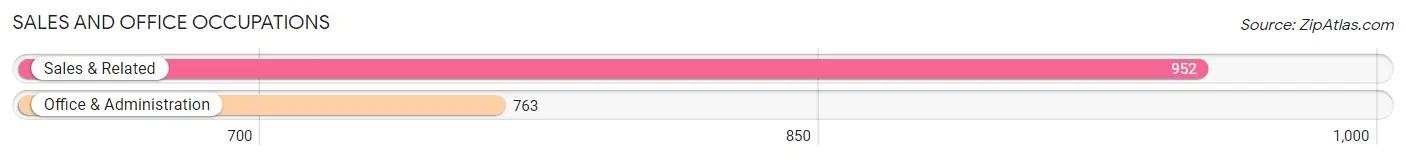
Sales and Office Occupations
The most common Sales and Office occupations in Moorestown Lenola are Sales & Related (952 | 13.3%), and Office & Administration (763 | 10.7%).
Sales and Office Occupations by Sex
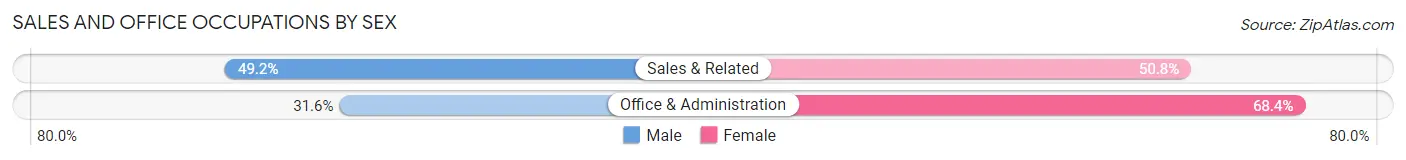
| Occupation | Male | Female |
| Sales & Related | 468 (49.2%) | 484 (50.8%) |
| Office & Administration | 241 (31.6%) | 522 (68.4%) |
| Total (Category) | 709 (41.3%) | 1,006 (58.7%) |
| Total (Overall) | 3,934 (55.1%) | 3,202 (44.9%) |
Natural Resources, Construction and Maintenance Occupations
The most common Natural Resources, Construction and Maintenance occupations in Moorestown Lenola are Construction & Extraction (274 | 3.8%), and Installation, Maintenance & Repair (129 | 1.8%).

Natural Resources, Construction and Maintenance Occupations by Sex
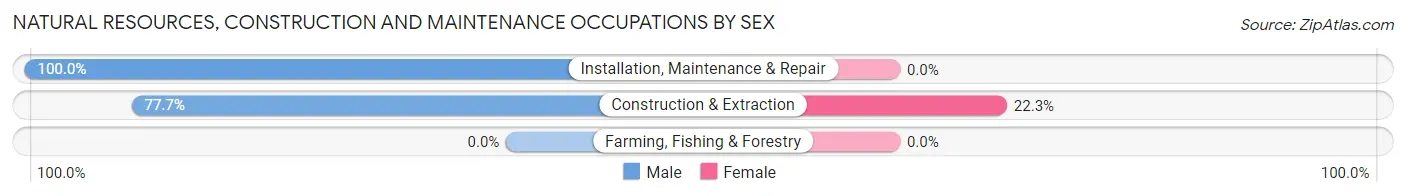
| Occupation | Male | Female |
| Farming, Fishing & Forestry | 0 (0.0%) | 0 (0.0%) |
| Construction & Extraction | 213 (77.7%) | 61 (22.3%) |
| Installation, Maintenance & Repair | 129 (100.0%) | 0 (0.0%) |
| Total (Category) | 342 (84.9%) | 61 (15.1%) |
| Total (Overall) | 3,934 (55.1%) | 3,202 (44.9%) |
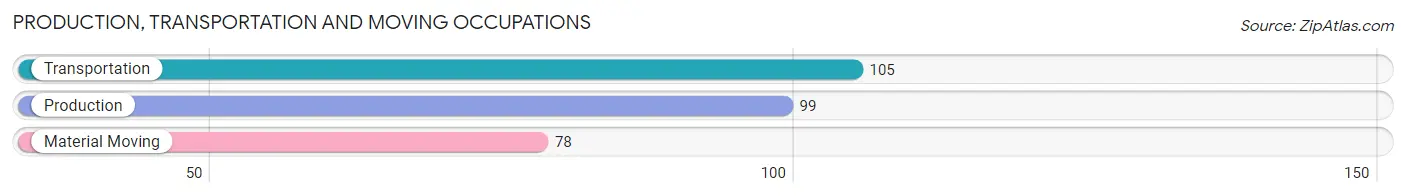
Production, Transportation and Moving Occupations
The most common Production, Transportation and Moving occupations in Moorestown Lenola are Transportation (105 | 1.5%), Production (99 | 1.4%), and Material Moving (78 | 1.1%).
Production, Transportation and Moving Occupations by Sex
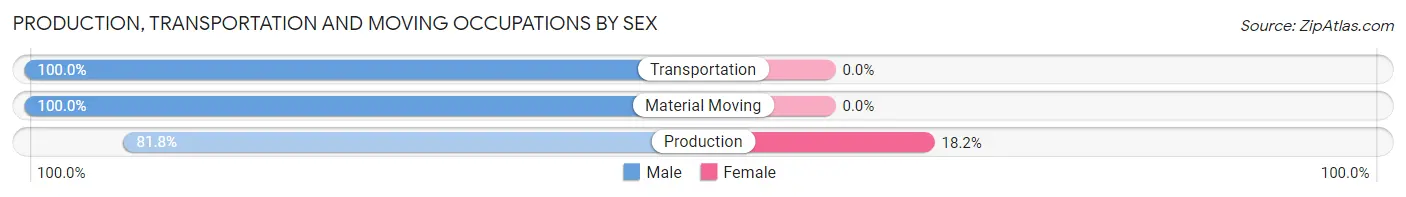
| Occupation | Male | Female |
| Production | 81 (81.8%) | 18 (18.2%) |
| Transportation | 105 (100.0%) | 0 (0.0%) |
| Material Moving | 78 (100.0%) | 0 (0.0%) |
| Total (Category) | 264 (93.6%) | 18 (6.4%) |
| Total (Overall) | 3,934 (55.1%) | 3,202 (44.9%) |
Employment Industries by Sex in Moorestown Lenola
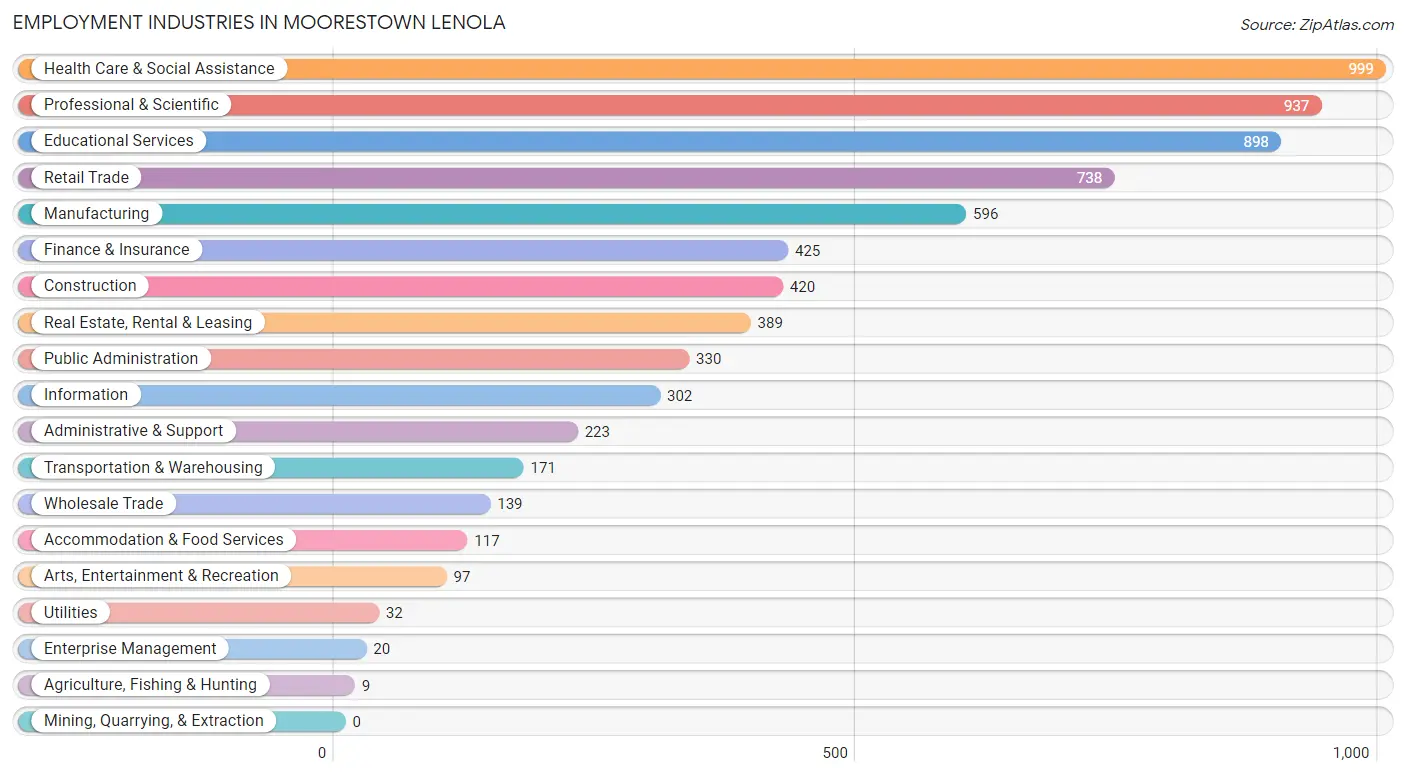
Employment Industries in Moorestown Lenola
The major employment industries in Moorestown Lenola include Health Care & Social Assistance (999 | 14.0%), Professional & Scientific (937 | 13.1%), Educational Services (898 | 12.6%), Retail Trade (738 | 10.3%), and Manufacturing (596 | 8.4%).
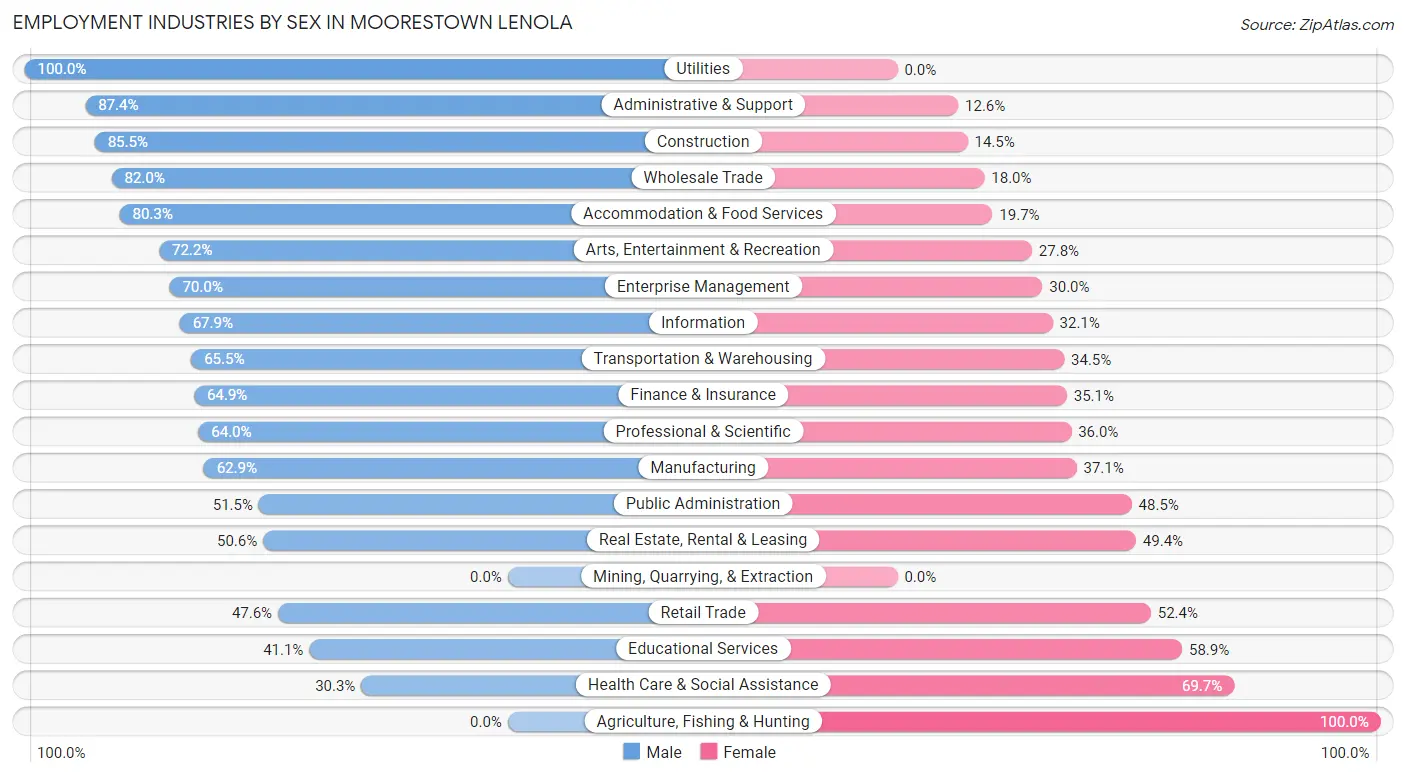
Employment Industries by Sex in Moorestown Lenola
The Moorestown Lenola industries that see more men than women are Utilities (100.0%), Administrative & Support (87.4%), and Construction (85.5%), whereas the industries that tend to have a higher number of women are Agriculture, Fishing & Hunting (100.0%), Health Care & Social Assistance (69.7%), and Educational Services (58.9%).
| Industry | Male | Female |
| Agriculture, Fishing & Hunting | 0 (0.0%) | 9 (100.0%) |
| Mining, Quarrying, & Extraction | 0 (0.0%) | 0 (0.0%) |
| Construction | 359 (85.5%) | 61 (14.5%) |
| Manufacturing | 375 (62.9%) | 221 (37.1%) |
| Wholesale Trade | 114 (82.0%) | 25 (18.0%) |
| Retail Trade | 351 (47.6%) | 387 (52.4%) |
| Transportation & Warehousing | 112 (65.5%) | 59 (34.5%) |
| Utilities | 32 (100.0%) | 0 (0.0%) |
| Information | 205 (67.9%) | 97 (32.1%) |
| Finance & Insurance | 276 (64.9%) | 149 (35.1%) |
| Real Estate, Rental & Leasing | 197 (50.6%) | 192 (49.4%) |
| Professional & Scientific | 600 (64.0%) | 337 (36.0%) |
| Enterprise Management | 14 (70.0%) | 6 (30.0%) |
| Administrative & Support | 195 (87.4%) | 28 (12.6%) |
| Educational Services | 369 (41.1%) | 529 (58.9%) |
| Health Care & Social Assistance | 303 (30.3%) | 696 (69.7%) |
| Arts, Entertainment & Recreation | 70 (72.2%) | 27 (27.8%) |
| Accommodation & Food Services | 94 (80.3%) | 23 (19.7%) |
| Public Administration | 170 (51.5%) | 160 (48.5%) |
| Total | 3,934 (55.1%) | 3,202 (44.9%) |
Education in Moorestown Lenola
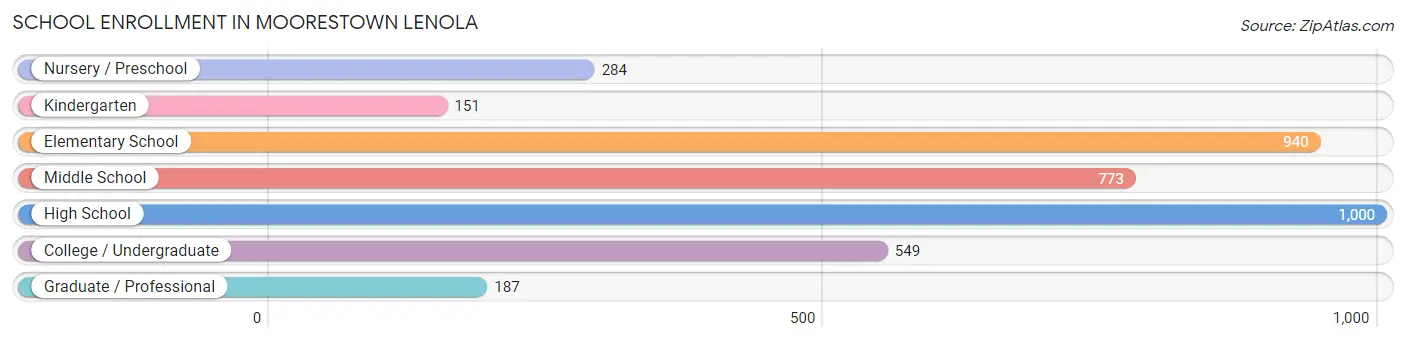
School Enrollment in Moorestown Lenola
The most common levels of schooling among the 3,884 students in Moorestown Lenola are high school (1,000 | 25.8%), elementary school (940 | 24.2%), and middle school (773 | 19.9%).
| School Level | # Students | % Students |
| Nursery / Preschool | 284 | 7.3% |
| Kindergarten | 151 | 3.9% |
| Elementary School | 940 | 24.2% |
| Middle School | 773 | 19.9% |
| High School | 1,000 | 25.8% |
| College / Undergraduate | 549 | 14.1% |
| Graduate / Professional | 187 | 4.8% |
| Total | 3,884 | 100.0% |
School Enrollment by Age by Funding Source in Moorestown Lenola
Out of a total of 3,884 students who are enrolled in schools in Moorestown Lenola, 719 (18.5%) attend a private institution, while the remaining 3,165 (81.5%) are enrolled in public schools. The age group of 35 years and over has the highest likelihood of being enrolled in private schools, with 108 (64.3% in the age bracket) enrolled. Conversely, the age group of 10 to 14 year olds has the lowest likelihood of being enrolled in a private school, with 942 (97.0% in the age bracket) attending a public institution.
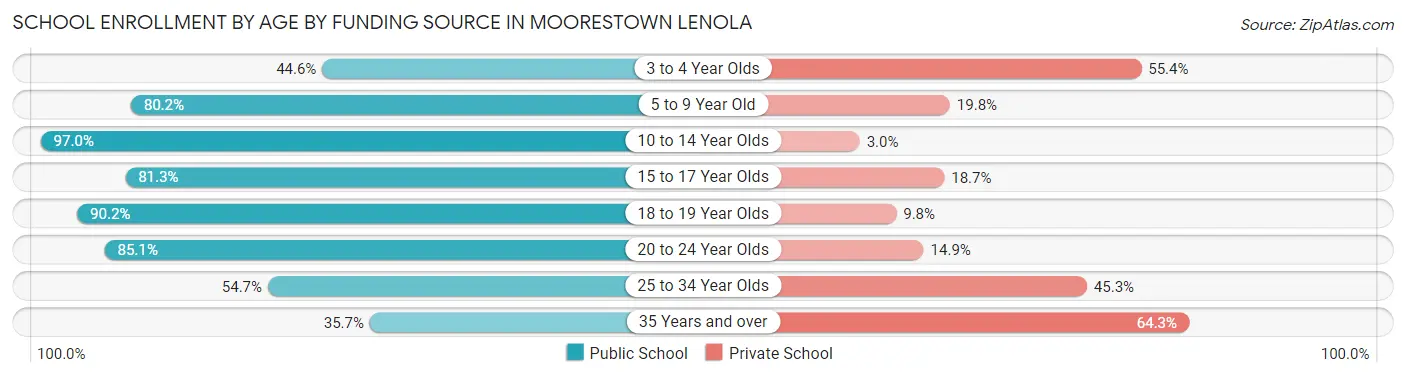
| Age Bracket | Public School | Private School |
| 3 to 4 Year Olds | 82 (44.6%) | 102 (55.4%) |
| 5 to 9 Year Old | 839 (80.2%) | 207 (19.8%) |
| 10 to 14 Year Olds | 942 (97.0%) | 29 (3.0%) |
| 15 to 17 Year Olds | 733 (81.3%) | 169 (18.7%) |
| 18 to 19 Year Olds | 138 (90.2%) | 15 (9.8%) |
| 20 to 24 Year Olds | 337 (85.1%) | 59 (14.9%) |
| 25 to 34 Year Olds | 35 (54.7%) | 29 (45.3%) |
| 35 Years and over | 60 (35.7%) | 108 (64.3%) |
| Total | 3,165 (81.5%) | 719 (18.5%) |
Educational Attainment by Field of Study in Moorestown Lenola
Business (1,450 | 21.5%), social sciences (911 | 13.5%), education (621 | 9.2%), science & technology (600 | 8.9%), and engineering (569 | 8.5%) are the most common fields of study among 6,736 individuals in Moorestown Lenola who have obtained a bachelor's degree or higher.
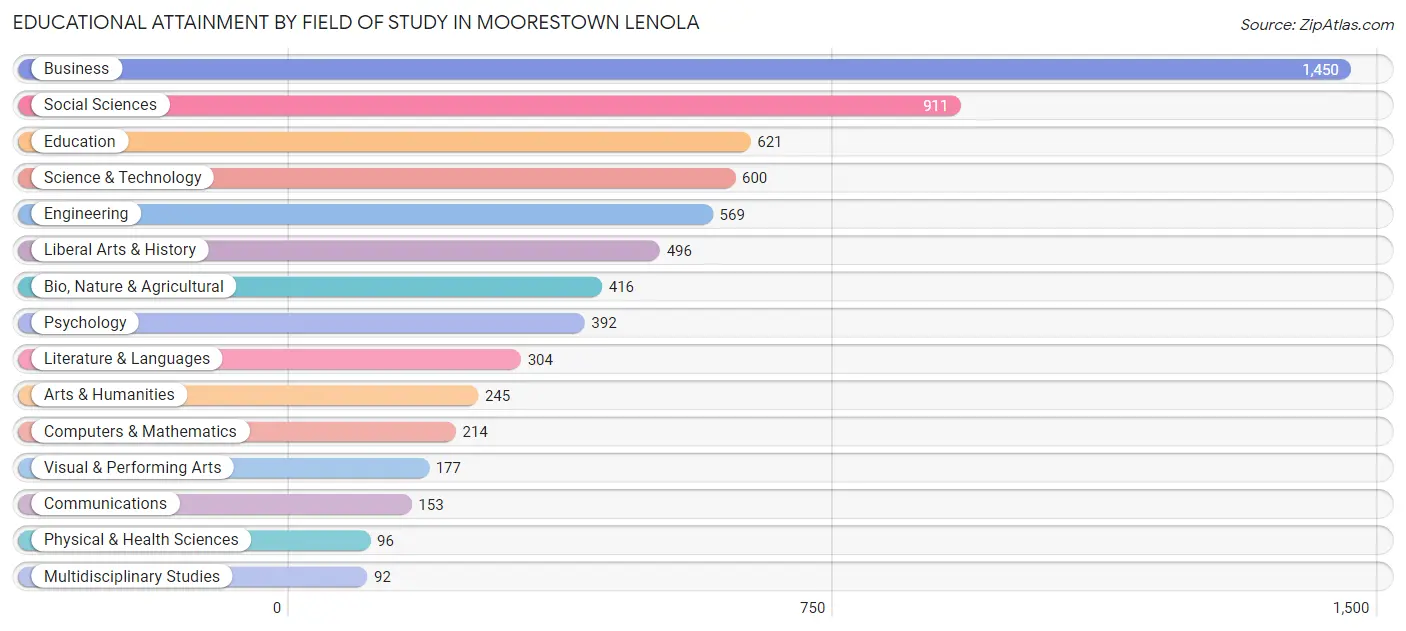
| Field of Study | # Graduates | % Graduates |
| Computers & Mathematics | 214 | 3.2% |
| Bio, Nature & Agricultural | 416 | 6.2% |
| Physical & Health Sciences | 96 | 1.4% |
| Psychology | 392 | 5.8% |
| Social Sciences | 911 | 13.5% |
| Engineering | 569 | 8.5% |
| Multidisciplinary Studies | 92 | 1.4% |
| Science & Technology | 600 | 8.9% |
| Business | 1,450 | 21.5% |
| Education | 621 | 9.2% |
| Literature & Languages | 304 | 4.5% |
| Liberal Arts & History | 496 | 7.4% |
| Visual & Performing Arts | 177 | 2.6% |
| Communications | 153 | 2.3% |
| Arts & Humanities | 245 | 3.6% |
| Total | 6,736 | 100.0% |
Transportation & Commute in Moorestown Lenola
Vehicle Availability by Sex in Moorestown Lenola
The most prevalent vehicle ownership categories in Moorestown Lenola are males with 2 vehicles (1,776, accounting for 45.9%) and females with 2 vehicles (1,229, making up 56.1%).
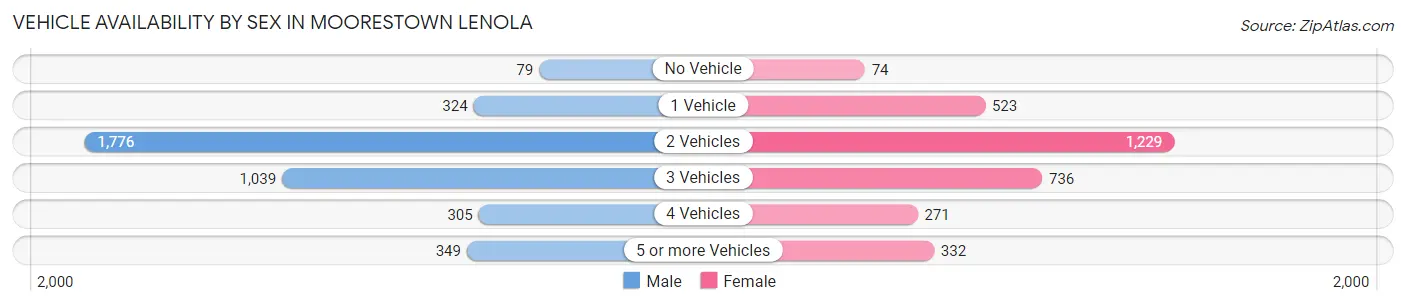
| Vehicles Available | Male | Female |
| No Vehicle | 79 (2.0%) | 74 (2.3%) |
| 1 Vehicle | 324 (8.4%) | 523 (16.5%) |
| 2 Vehicles | 1,776 (45.9%) | 1,229 (38.8%) |
| 3 Vehicles | 1,039 (26.8%) | 736 (23.3%) |
| 4 Vehicles | 305 (7.9%) | 271 (8.6%) |
| 5 or more Vehicles | 349 (9.0%) | 332 (10.5%) |
| Total | 3,872 (100.0%) | 3,165 (100.0%) |
Commute Time in Moorestown Lenola
The most frequently occuring commute durations in Moorestown Lenola are 15 to 19 minutes (870 commuters, 15.0%), 10 to 14 minutes (846 commuters, 14.6%), and 5 to 9 minutes (784 commuters, 13.5%).
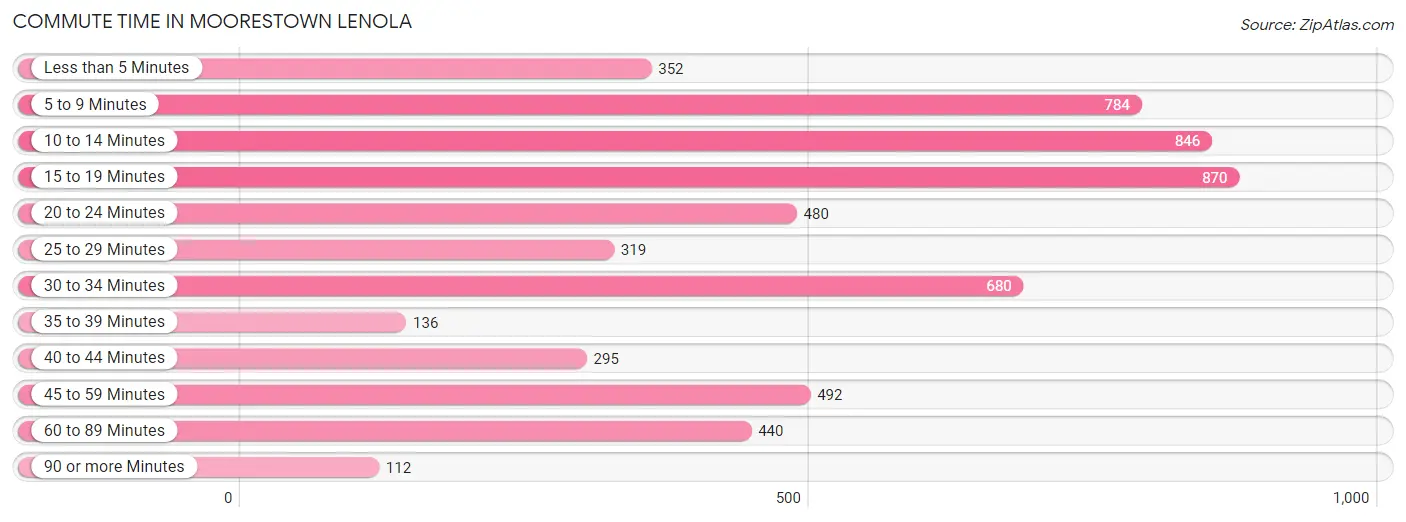
| Commute Time | # Commuters | % Commuters |
| Less than 5 Minutes | 352 | 6.1% |
| 5 to 9 Minutes | 784 | 13.5% |
| 10 to 14 Minutes | 846 | 14.6% |
| 15 to 19 Minutes | 870 | 15.0% |
| 20 to 24 Minutes | 480 | 8.3% |
| 25 to 29 Minutes | 319 | 5.5% |
| 30 to 34 Minutes | 680 | 11.7% |
| 35 to 39 Minutes | 136 | 2.3% |
| 40 to 44 Minutes | 295 | 5.1% |
| 45 to 59 Minutes | 492 | 8.5% |
| 60 to 89 Minutes | 440 | 7.6% |
| 90 or more Minutes | 112 | 1.9% |
Commute Time by Sex in Moorestown Lenola
The most common commute times in Moorestown Lenola are 15 to 19 minutes (455 commuters, 14.5%) for males and 10 to 14 minutes (428 commuters, 16.1%) for females.
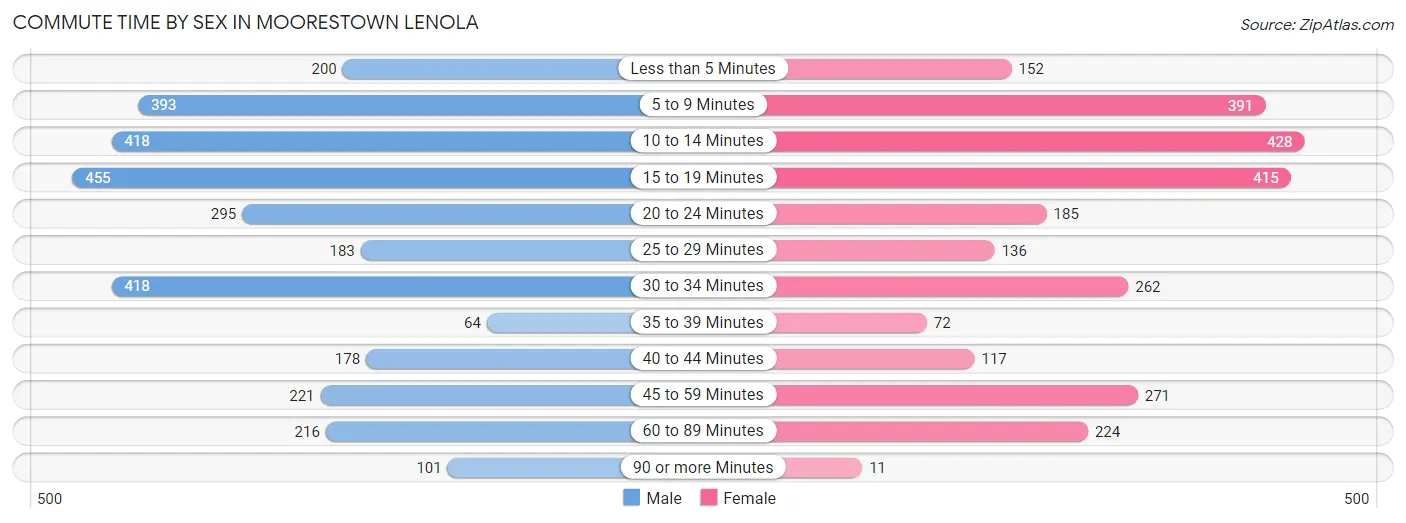
| Commute Time | Male | Female |
| Less than 5 Minutes | 200 (6.4%) | 152 (5.7%) |
| 5 to 9 Minutes | 393 (12.5%) | 391 (14.7%) |
| 10 to 14 Minutes | 418 (13.3%) | 428 (16.1%) |
| 15 to 19 Minutes | 455 (14.5%) | 415 (15.6%) |
| 20 to 24 Minutes | 295 (9.4%) | 185 (6.9%) |
| 25 to 29 Minutes | 183 (5.8%) | 136 (5.1%) |
| 30 to 34 Minutes | 418 (13.3%) | 262 (9.8%) |
| 35 to 39 Minutes | 64 (2.0%) | 72 (2.7%) |
| 40 to 44 Minutes | 178 (5.7%) | 117 (4.4%) |
| 45 to 59 Minutes | 221 (7.0%) | 271 (10.2%) |
| 60 to 89 Minutes | 216 (6.9%) | 224 (8.4%) |
| 90 or more Minutes | 101 (3.2%) | 11 (0.4%) |
Time of Departure to Work by Sex in Moorestown Lenola
The most frequent times of departure to work in Moorestown Lenola are 8:00 AM to 8:29 AM (541, 17.2%) for males and 9:00 AM to 9:59 AM (486, 18.2%) for females.
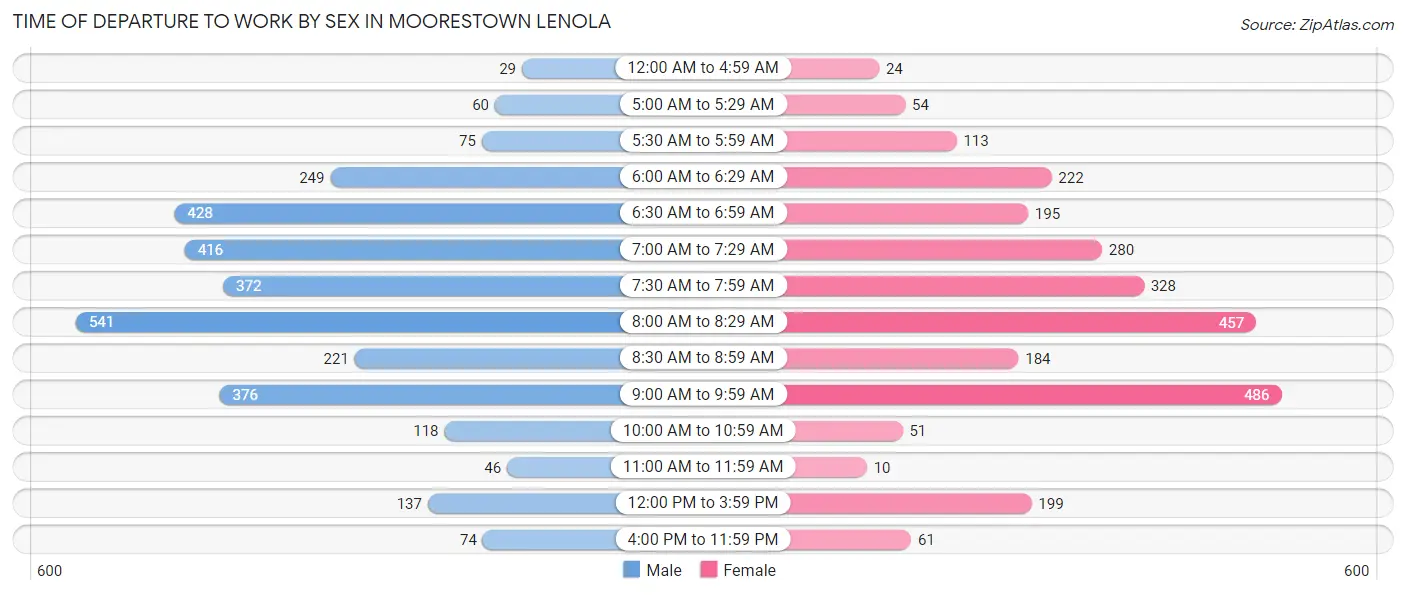
| Time of Departure | Male | Female |
| 12:00 AM to 4:59 AM | 29 (0.9%) | 24 (0.9%) |
| 5:00 AM to 5:29 AM | 60 (1.9%) | 54 (2.0%) |
| 5:30 AM to 5:59 AM | 75 (2.4%) | 113 (4.2%) |
| 6:00 AM to 6:29 AM | 249 (7.9%) | 222 (8.3%) |
| 6:30 AM to 6:59 AM | 428 (13.6%) | 195 (7.3%) |
| 7:00 AM to 7:29 AM | 416 (13.2%) | 280 (10.5%) |
| 7:30 AM to 7:59 AM | 372 (11.8%) | 328 (12.3%) |
| 8:00 AM to 8:29 AM | 541 (17.2%) | 457 (17.2%) |
| 8:30 AM to 8:59 AM | 221 (7.0%) | 184 (6.9%) |
| 9:00 AM to 9:59 AM | 376 (12.0%) | 486 (18.2%) |
| 10:00 AM to 10:59 AM | 118 (3.8%) | 51 (1.9%) |
| 11:00 AM to 11:59 AM | 46 (1.5%) | 10 (0.4%) |
| 12:00 PM to 3:59 PM | 137 (4.4%) | 199 (7.5%) |
| 4:00 PM to 11:59 PM | 74 (2.4%) | 61 (2.3%) |
| Total | 3,142 (100.0%) | 2,664 (100.0%) |
Housing Occupancy in Moorestown Lenola
Occupancy by Ownership in Moorestown Lenola
Of the total 5,382 dwellings in Moorestown Lenola, owner-occupied units account for 4,536 (84.3%), while renter-occupied units make up 846 (15.7%).
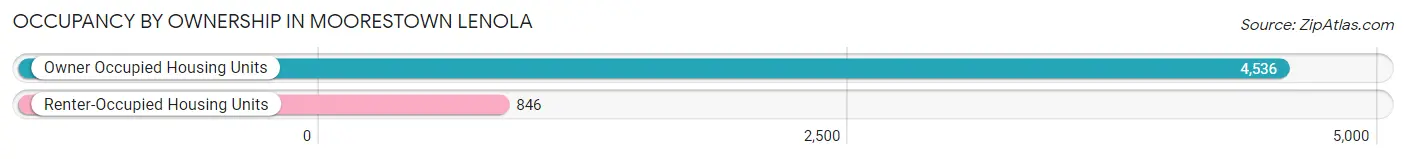
| Occupancy | # Housing Units | % Housing Units |
| Owner Occupied Housing Units | 4,536 | 84.3% |
| Renter-Occupied Housing Units | 846 | 15.7% |
| Total Occupied Housing Units | 5,382 | 100.0% |
Occupancy by Household Size in Moorestown Lenola
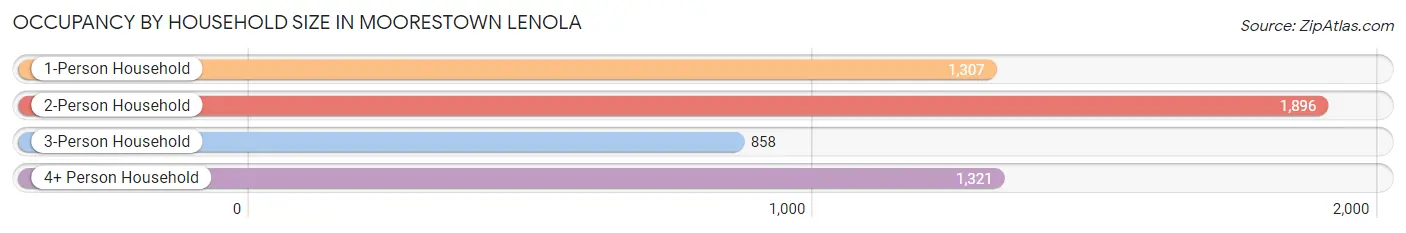
| Household Size | # Housing Units | % Housing Units |
| 1-Person Household | 1,307 | 24.3% |
| 2-Person Household | 1,896 | 35.2% |
| 3-Person Household | 858 | 15.9% |
| 4+ Person Household | 1,321 | 24.5% |
| Total Housing Units | 5,382 | 100.0% |
Occupancy by Ownership by Household Size in Moorestown Lenola
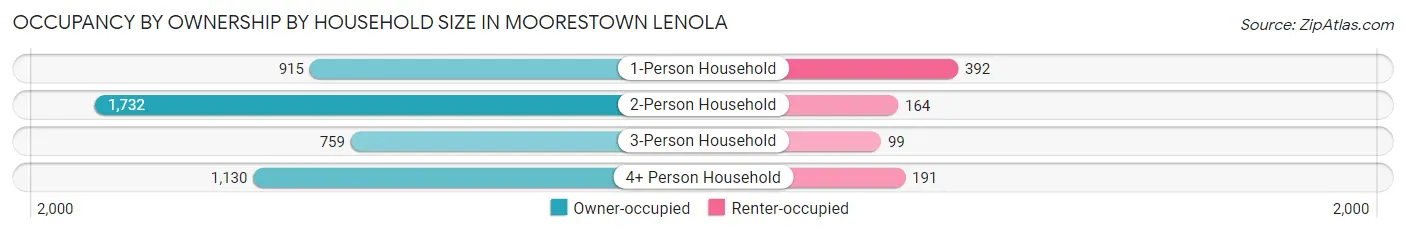
| Household Size | Owner-occupied | Renter-occupied |
| 1-Person Household | 915 (70.0%) | 392 (30.0%) |
| 2-Person Household | 1,732 (91.3%) | 164 (8.6%) |
| 3-Person Household | 759 (88.5%) | 99 (11.5%) |
| 4+ Person Household | 1,130 (85.5%) | 191 (14.5%) |
| Total Housing Units | 4,536 (84.3%) | 846 (15.7%) |
Occupancy by Educational Attainment in Moorestown Lenola
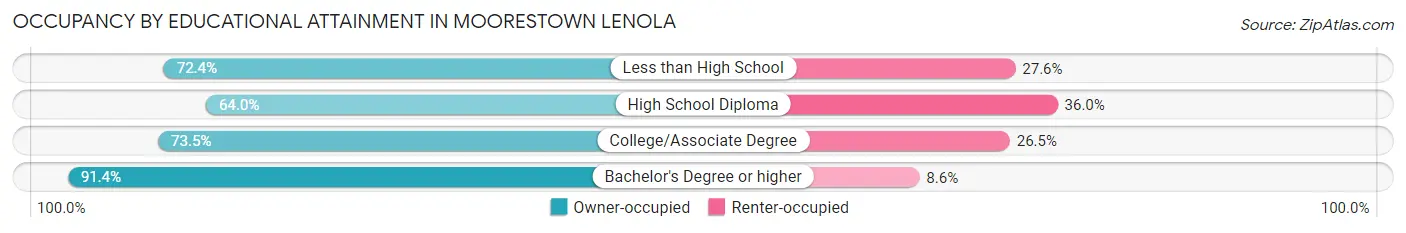
| Household Size | Owner-occupied | Renter-occupied |
| Less than High School | 181 (72.4%) | 69 (27.6%) |
| High School Diploma | 372 (64.0%) | 209 (36.0%) |
| College/Associate Degree | 730 (73.5%) | 263 (26.5%) |
| Bachelor's Degree or higher | 3,253 (91.4%) | 305 (8.6%) |
Occupancy by Age of Householder in Moorestown Lenola
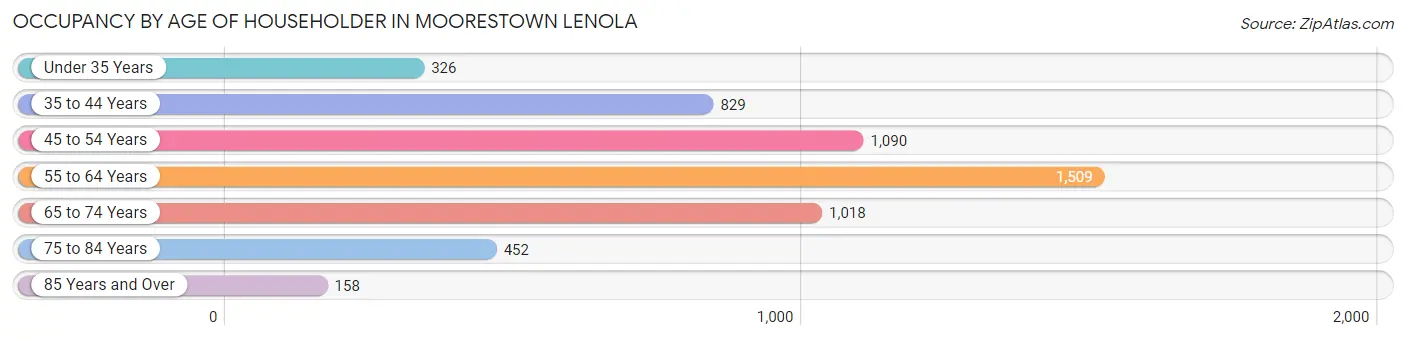
| Age Bracket | # Households | % Households |
| Under 35 Years | 326 | 6.1% |
| 35 to 44 Years | 829 | 15.4% |
| 45 to 54 Years | 1,090 | 20.3% |
| 55 to 64 Years | 1,509 | 28.0% |
| 65 to 74 Years | 1,018 | 18.9% |
| 75 to 84 Years | 452 | 8.4% |
| 85 Years and Over | 158 | 2.9% |
| Total | 5,382 | 100.0% |
Housing Finances in Moorestown Lenola
Median Income by Occupancy in Moorestown Lenola
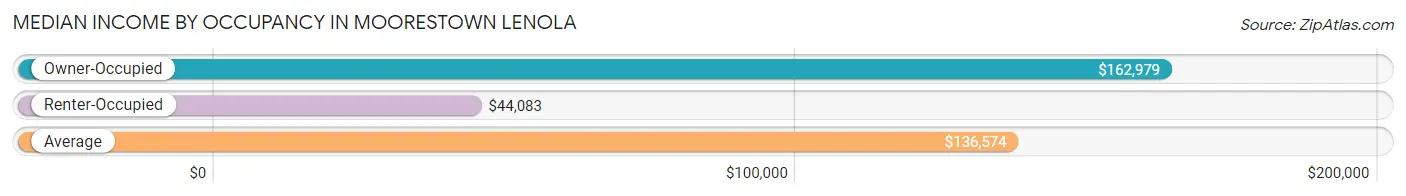
| Occupancy Type | # Households | Median Income |
| Owner-Occupied | 4,536 (84.3%) | $162,979 |
| Renter-Occupied | 846 (15.7%) | $44,083 |
| Average | 5,382 (100.0%) | $136,574 |
Occupancy by Householder Income Bracket in Moorestown Lenola
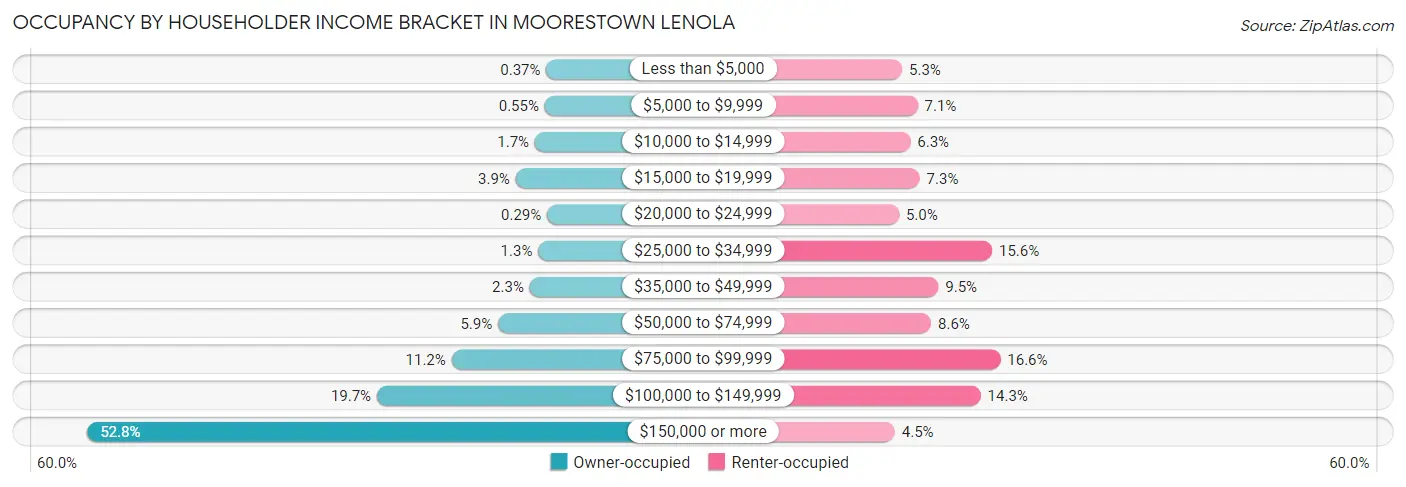
| Income Bracket | Owner-occupied | Renter-occupied |
| Less than $5,000 | 17 (0.4%) | 45 (5.3%) |
| $5,000 to $9,999 | 25 (0.5%) | 60 (7.1%) |
| $10,000 to $14,999 | 76 (1.7%) | 53 (6.3%) |
| $15,000 to $19,999 | 176 (3.9%) | 62 (7.3%) |
| $20,000 to $24,999 | 13 (0.3%) | 42 (5.0%) |
| $25,000 to $34,999 | 59 (1.3%) | 132 (15.6%) |
| $35,000 to $49,999 | 103 (2.3%) | 80 (9.5%) |
| $50,000 to $74,999 | 267 (5.9%) | 73 (8.6%) |
| $75,000 to $99,999 | 508 (11.2%) | 140 (16.6%) |
| $100,000 to $149,999 | 895 (19.7%) | 121 (14.3%) |
| $150,000 or more | 2,397 (52.8%) | 38 (4.5%) |
| Total | 4,536 (100.0%) | 846 (100.0%) |
Monthly Housing Cost Tiers in Moorestown Lenola
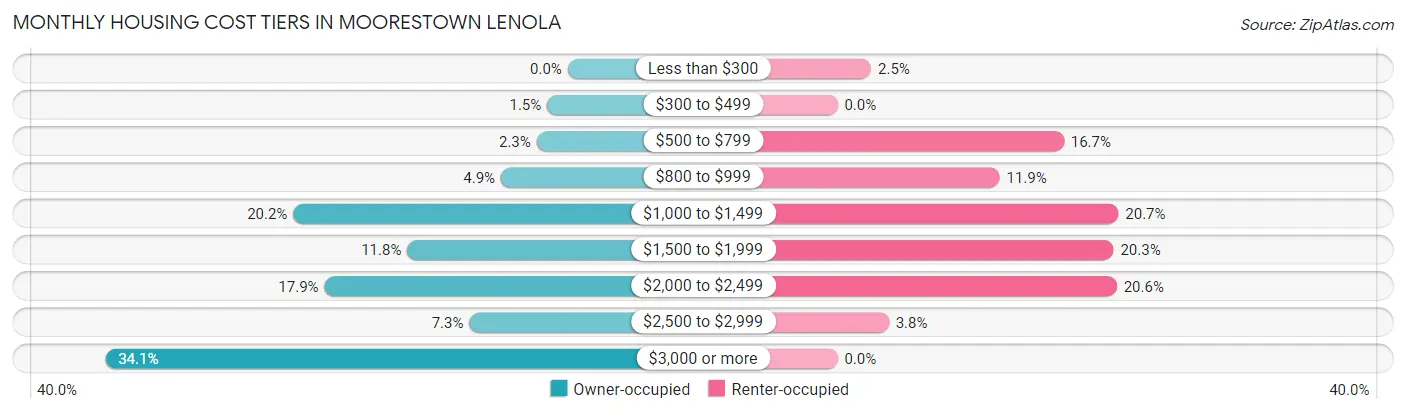
| Monthly Cost | Owner-occupied | Renter-occupied |
| Less than $300 | 0 (0.0%) | 21 (2.5%) |
| $300 to $499 | 69 (1.5%) | 0 (0.0%) |
| $500 to $799 | 104 (2.3%) | 141 (16.7%) |
| $800 to $999 | 223 (4.9%) | 101 (11.9%) |
| $1,000 to $1,499 | 917 (20.2%) | 175 (20.7%) |
| $1,500 to $1,999 | 536 (11.8%) | 172 (20.3%) |
| $2,000 to $2,499 | 813 (17.9%) | 174 (20.6%) |
| $2,500 to $2,999 | 329 (7.2%) | 32 (3.8%) |
| $3,000 or more | 1,545 (34.1%) | 0 (0.0%) |
| Total | 4,536 (100.0%) | 846 (100.0%) |
Physical Housing Characteristics in Moorestown Lenola
Housing Structures in Moorestown Lenola
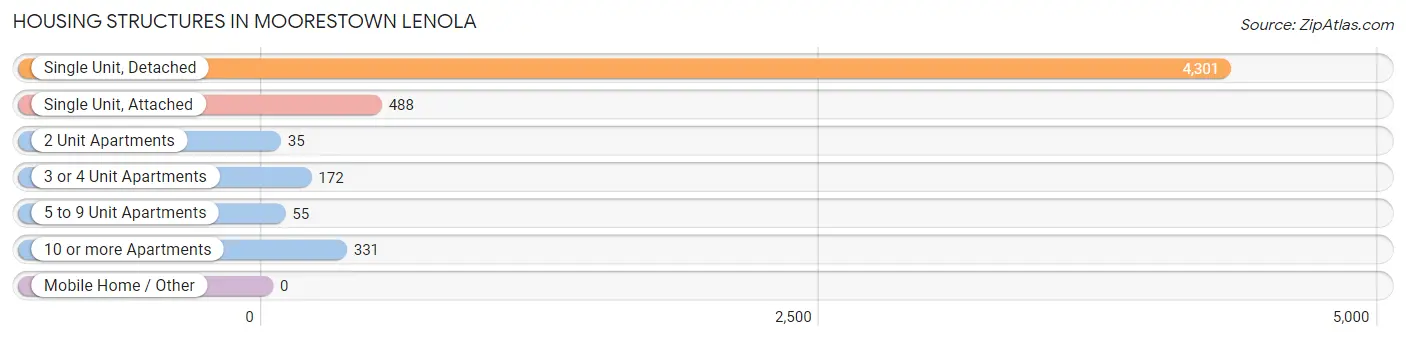
| Structure Type | # Housing Units | % Housing Units |
| Single Unit, Detached | 4,301 | 79.9% |
| Single Unit, Attached | 488 | 9.1% |
| 2 Unit Apartments | 35 | 0.6% |
| 3 or 4 Unit Apartments | 172 | 3.2% |
| 5 to 9 Unit Apartments | 55 | 1.0% |
| 10 or more Apartments | 331 | 6.1% |
| Mobile Home / Other | 0 | 0.0% |
| Total | 5,382 | 100.0% |
Housing Structures by Occupancy in Moorestown Lenola
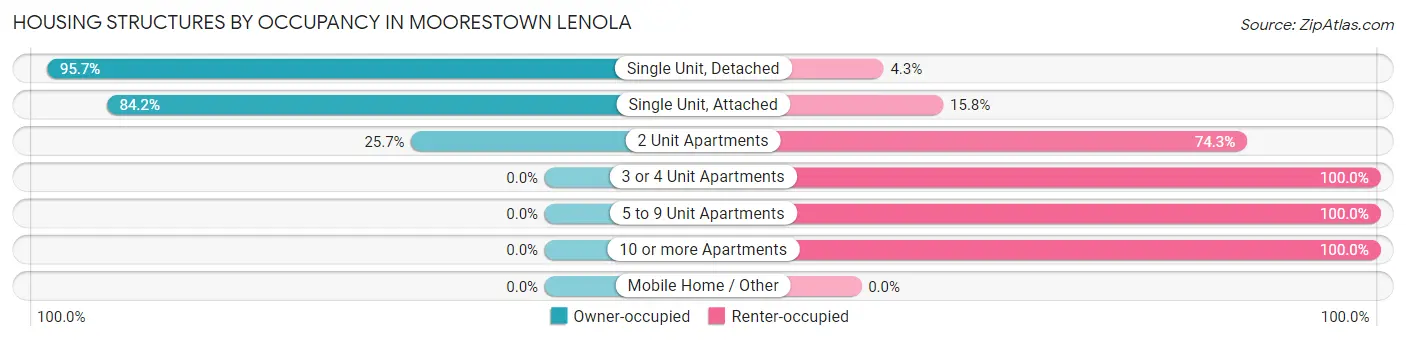
| Structure Type | Owner-occupied | Renter-occupied |
| Single Unit, Detached | 4,116 (95.7%) | 185 (4.3%) |
| Single Unit, Attached | 411 (84.2%) | 77 (15.8%) |
| 2 Unit Apartments | 9 (25.7%) | 26 (74.3%) |
| 3 or 4 Unit Apartments | 0 (0.0%) | 172 (100.0%) |
| 5 to 9 Unit Apartments | 0 (0.0%) | 55 (100.0%) |
| 10 or more Apartments | 0 (0.0%) | 331 (100.0%) |
| Mobile Home / Other | 0 (0.0%) | 0 (0.0%) |
| Total | 4,536 (84.3%) | 846 (15.7%) |
Housing Structures by Number of Rooms in Moorestown Lenola
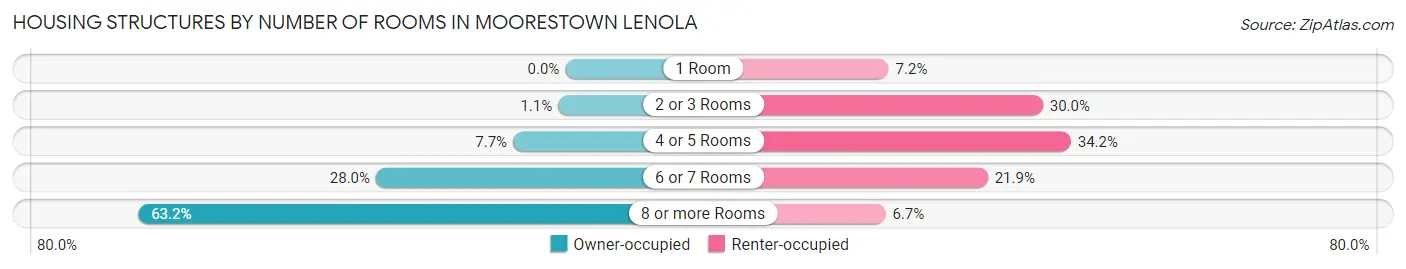
| Number of Rooms | Owner-occupied | Renter-occupied |
| 1 Room | 0 (0.0%) | 61 (7.2%) |
| 2 or 3 Rooms | 48 (1.1%) | 254 (30.0%) |
| 4 or 5 Rooms | 351 (7.7%) | 289 (34.2%) |
| 6 or 7 Rooms | 1,271 (28.0%) | 185 (21.9%) |
| 8 or more Rooms | 2,866 (63.2%) | 57 (6.7%) |
| Total | 4,536 (100.0%) | 846 (100.0%) |
Housing Structure by Heating Type in Moorestown Lenola
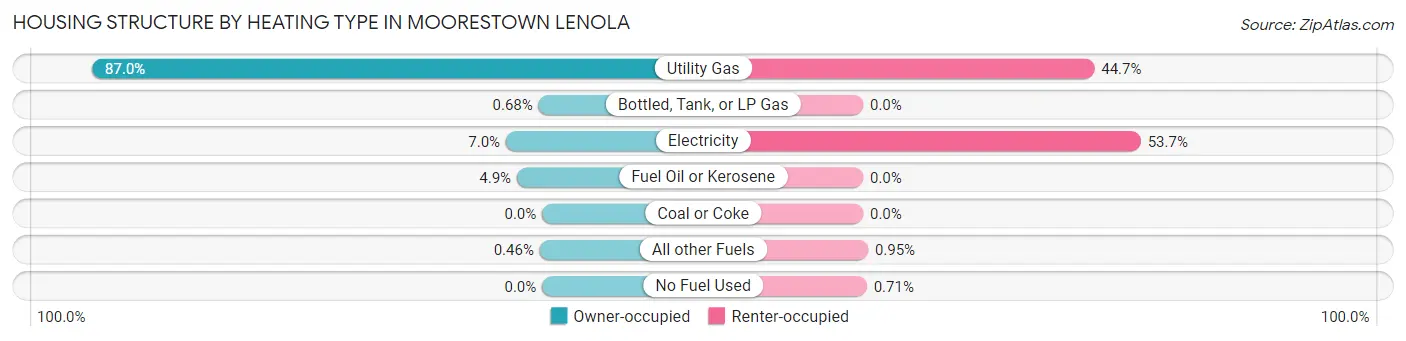
| Heating Type | Owner-occupied | Renter-occupied |
| Utility Gas | 3,946 (87.0%) | 378 (44.7%) |
| Bottled, Tank, or LP Gas | 31 (0.7%) | 0 (0.0%) |
| Electricity | 317 (7.0%) | 454 (53.7%) |
| Fuel Oil or Kerosene | 221 (4.9%) | 0 (0.0%) |
| Coal or Coke | 0 (0.0%) | 0 (0.0%) |
| All other Fuels | 21 (0.5%) | 8 (0.9%) |
| No Fuel Used | 0 (0.0%) | 6 (0.7%) |
| Total | 4,536 (100.0%) | 846 (100.0%) |
Household Vehicle Usage in Moorestown Lenola
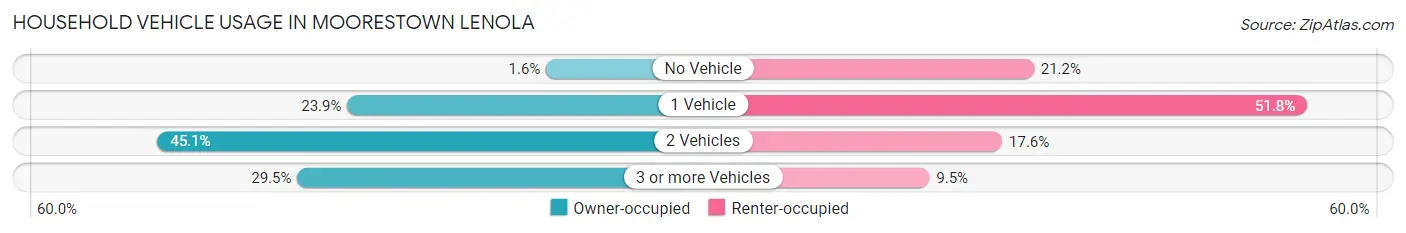
| Vehicles per Household | Owner-occupied | Renter-occupied |
| No Vehicle | 71 (1.6%) | 179 (21.2%) |
| 1 Vehicle | 1,082 (23.8%) | 438 (51.8%) |
| 2 Vehicles | 2,047 (45.1%) | 149 (17.6%) |
| 3 or more Vehicles | 1,336 (29.4%) | 80 (9.5%) |
| Total | 4,536 (100.0%) | 846 (100.0%) |
Real Estate & Mortgages in Moorestown Lenola
Real Estate and Mortgage Overview in Moorestown Lenola
| Characteristic | Without Mortgage | With Mortgage |
| Housing Units | 1,591 | 2,945 |
| Median Property Value | $480,900 | $500,200 |
| Median Household Income | $144,077 | $1,648 |
| Monthly Housing Costs | $1,267 | $1,496 |
| Real Estate Taxes | $9,014 | $16 |
Property Value by Mortgage Status in Moorestown Lenola
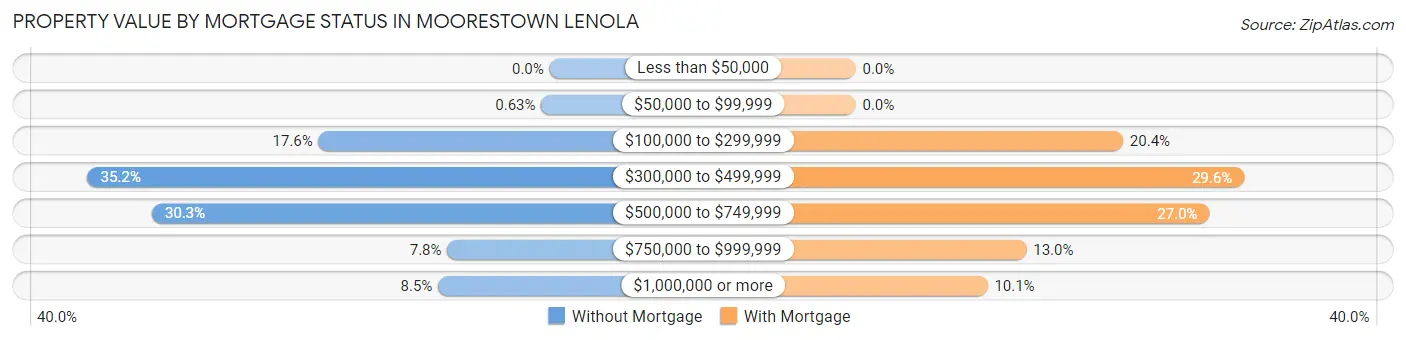
| Property Value | Without Mortgage | With Mortgage |
| Less than $50,000 | 0 (0.0%) | 0 (0.0%) |
| $50,000 to $99,999 | 10 (0.6%) | 0 (0.0%) |
| $100,000 to $299,999 | 280 (17.6%) | 600 (20.4%) |
| $300,000 to $499,999 | 560 (35.2%) | 872 (29.6%) |
| $500,000 to $749,999 | 482 (30.3%) | 794 (27.0%) |
| $750,000 to $999,999 | 124 (7.8%) | 383 (13.0%) |
| $1,000,000 or more | 135 (8.5%) | 296 (10.1%) |
| Total | 1,591 (100.0%) | 2,945 (100.0%) |
Household Income by Mortgage Status in Moorestown Lenola
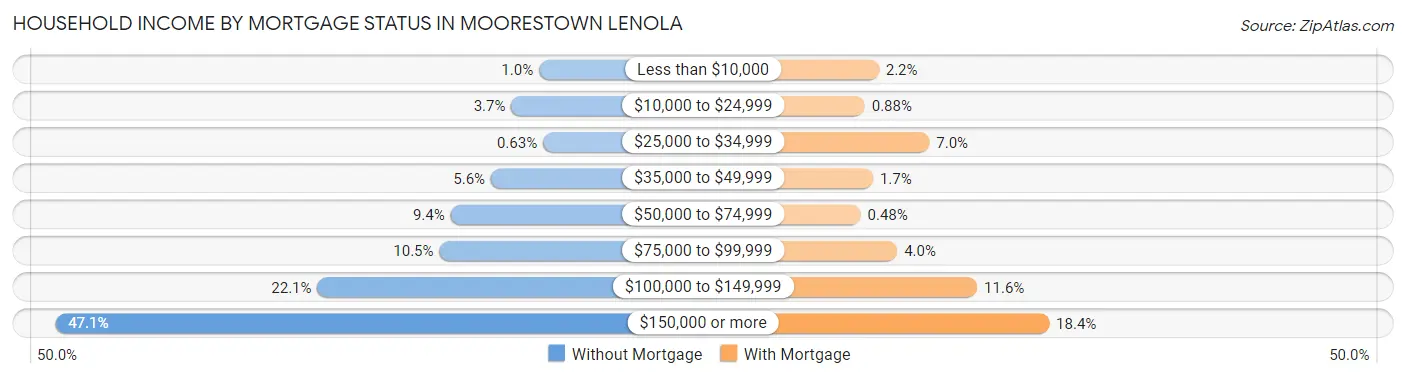
| Household Income | Without Mortgage | With Mortgage |
| Less than $10,000 | 16 (1.0%) | 65 (2.2%) |
| $10,000 to $24,999 | 58 (3.6%) | 26 (0.9%) |
| $25,000 to $34,999 | 10 (0.6%) | 207 (7.0%) |
| $35,000 to $49,999 | 89 (5.6%) | 49 (1.7%) |
| $50,000 to $74,999 | 150 (9.4%) | 14 (0.5%) |
| $75,000 to $99,999 | 167 (10.5%) | 117 (4.0%) |
| $100,000 to $149,999 | 352 (22.1%) | 341 (11.6%) |
| $150,000 or more | 749 (47.1%) | 543 (18.4%) |
| Total | 1,591 (100.0%) | 2,945 (100.0%) |
Property Value to Household Income Ratio in Moorestown Lenola
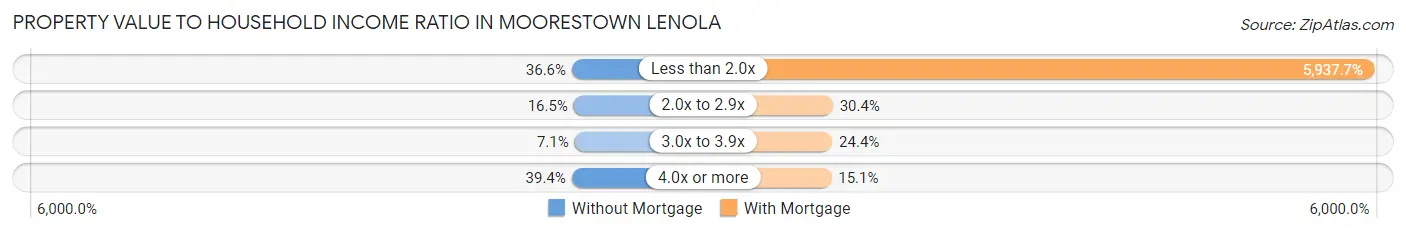
| Value-to-Income Ratio | Without Mortgage | With Mortgage |
| Less than 2.0x | 582 (36.6%) | 174,866 (5,937.7%) |
| 2.0x to 2.9x | 262 (16.5%) | 894 (30.4%) |
| 3.0x to 3.9x | 113 (7.1%) | 717 (24.3%) |
| 4.0x or more | 626 (39.4%) | 445 (15.1%) |
| Total | 1,591 (100.0%) | 2,945 (100.0%) |
Real Estate Taxes by Mortgage Status in Moorestown Lenola
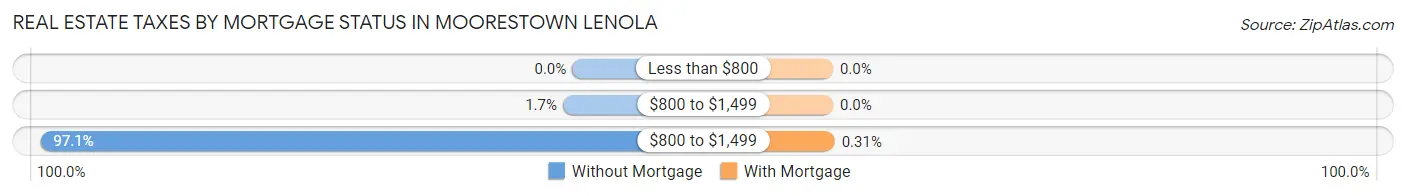
| Property Taxes | Without Mortgage | With Mortgage |
| Less than $800 | 0 (0.0%) | 0 (0.0%) |
| $800 to $1,499 | 27 (1.7%) | 0 (0.0%) |
| $800 to $1,499 | 1,545 (97.1%) | 9 (0.3%) |
| Total | 1,591 (100.0%) | 2,945 (100.0%) |
Health & Disability in Moorestown Lenola
Health Insurance Coverage by Age in Moorestown Lenola
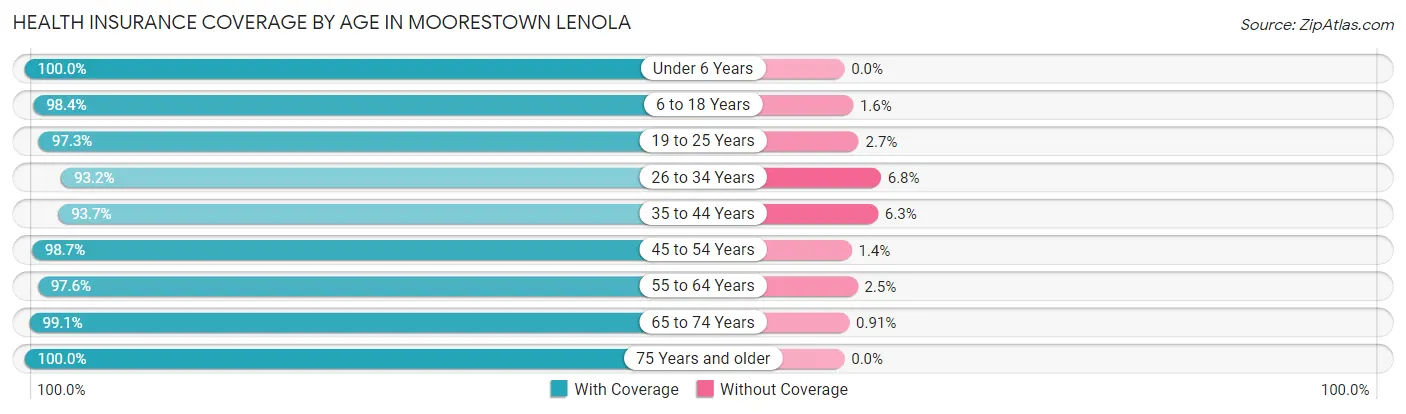
| Age Bracket | With Coverage | Without Coverage |
| Under 6 Years | 739 (100.0%) | 0 (0.0%) |
| 6 to 18 Years | 2,795 (98.4%) | 46 (1.6%) |
| 19 to 25 Years | 876 (97.3%) | 24 (2.7%) |
| 26 to 34 Years | 822 (93.2%) | 60 (6.8%) |
| 35 to 44 Years | 1,541 (93.7%) | 103 (6.3%) |
| 45 to 54 Years | 1,967 (98.7%) | 27 (1.3%) |
| 55 to 64 Years | 2,669 (97.6%) | 67 (2.5%) |
| 65 to 74 Years | 1,524 (99.1%) | 14 (0.9%) |
| 75 Years and older | 892 (100.0%) | 0 (0.0%) |
| Total | 13,825 (97.6%) | 341 (2.4%) |
Health Insurance Coverage by Citizenship Status in Moorestown Lenola
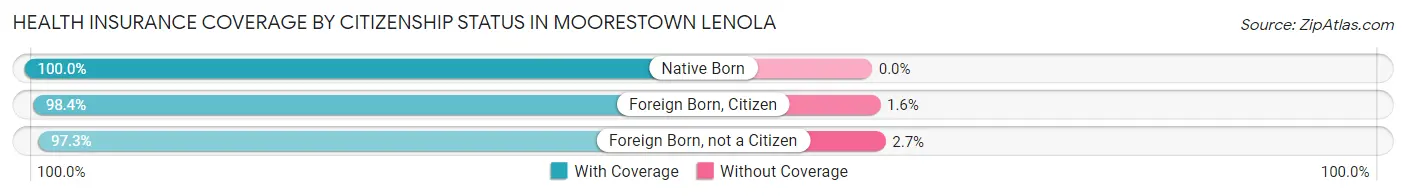
| Citizenship Status | With Coverage | Without Coverage |
| Native Born | 739 (100.0%) | 0 (0.0%) |
| Foreign Born, Citizen | 2,795 (98.4%) | 46 (1.6%) |
| Foreign Born, not a Citizen | 876 (97.3%) | 24 (2.7%) |
Health Insurance Coverage by Household Income in Moorestown Lenola
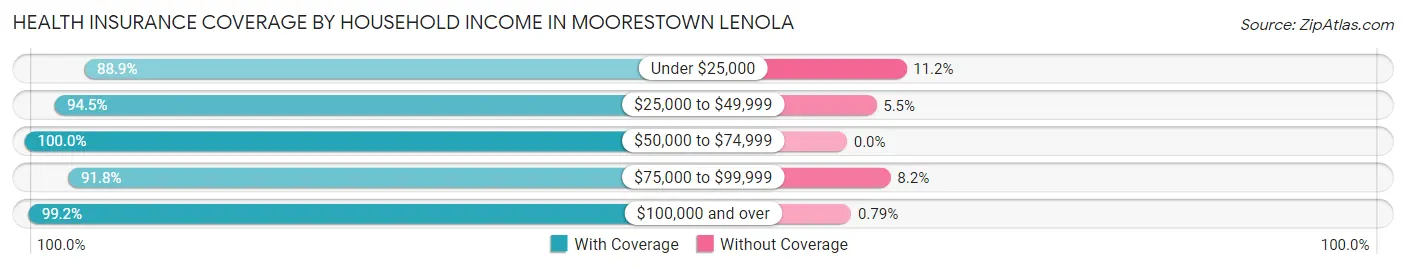
| Household Income | With Coverage | Without Coverage |
| Under $25,000 | 829 (88.8%) | 104 (11.2%) |
| $25,000 to $49,999 | 651 (94.5%) | 38 (5.5%) |
| $50,000 to $74,999 | 636 (100.0%) | 0 (0.0%) |
| $75,000 to $99,999 | 1,303 (91.8%) | 116 (8.2%) |
| $100,000 and over | 10,365 (99.2%) | 83 (0.8%) |
Public vs Private Health Insurance Coverage by Age in Moorestown Lenola
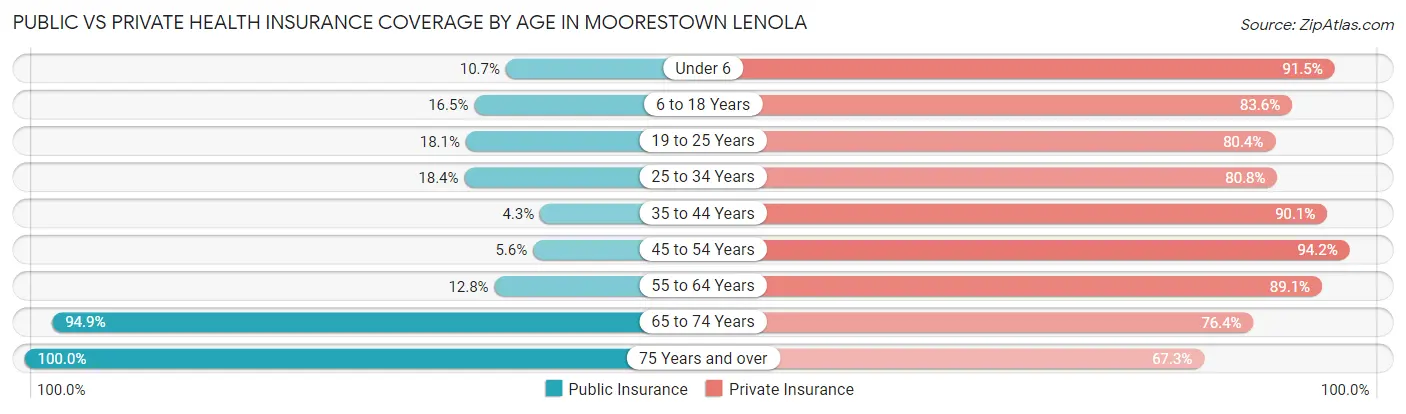
| Age Bracket | Public Insurance | Private Insurance |
| Under 6 | 79 (10.7%) | 676 (91.5%) |
| 6 to 18 Years | 470 (16.5%) | 2,374 (83.6%) |
| 19 to 25 Years | 163 (18.1%) | 724 (80.4%) |
| 25 to 34 Years | 162 (18.4%) | 713 (80.8%) |
| 35 to 44 Years | 71 (4.3%) | 1,481 (90.1%) |
| 45 to 54 Years | 112 (5.6%) | 1,879 (94.2%) |
| 55 to 64 Years | 350 (12.8%) | 2,438 (89.1%) |
| 65 to 74 Years | 1,459 (94.9%) | 1,175 (76.4%) |
| 75 Years and over | 892 (100.0%) | 600 (67.3%) |
| Total | 3,758 (26.5%) | 12,060 (85.1%) |
Disability Status by Sex by Age in Moorestown Lenola
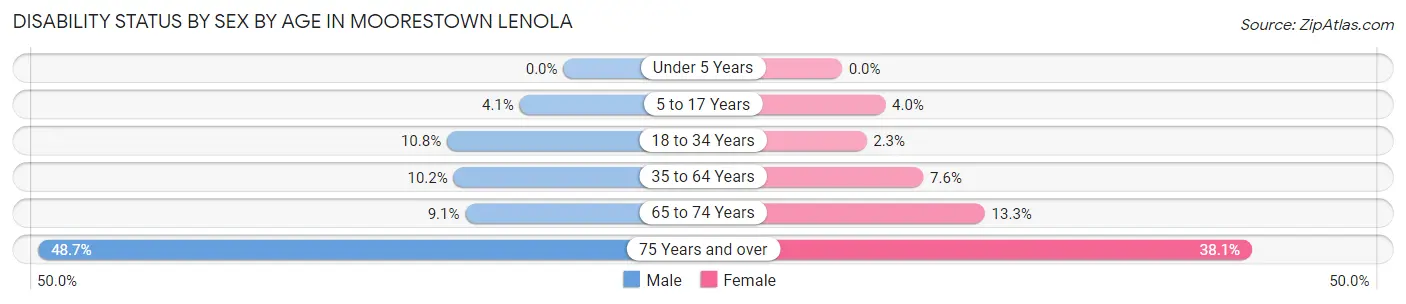
| Age Bracket | Male | Female |
| Under 5 Years | 0 (0.0%) | 0 (0.0%) |
| 5 to 17 Years | 62 (4.1%) | 58 (4.0%) |
| 18 to 34 Years | 94 (10.8%) | 23 (2.3%) |
| 35 to 64 Years | 319 (10.2%) | 245 (7.5%) |
| 65 to 74 Years | 70 (9.1%) | 102 (13.3%) |
| 75 Years and over | 153 (48.7%) | 220 (38.1%) |
Disability Class by Sex by Age in Moorestown Lenola
Disability Class: Hearing Difficulty
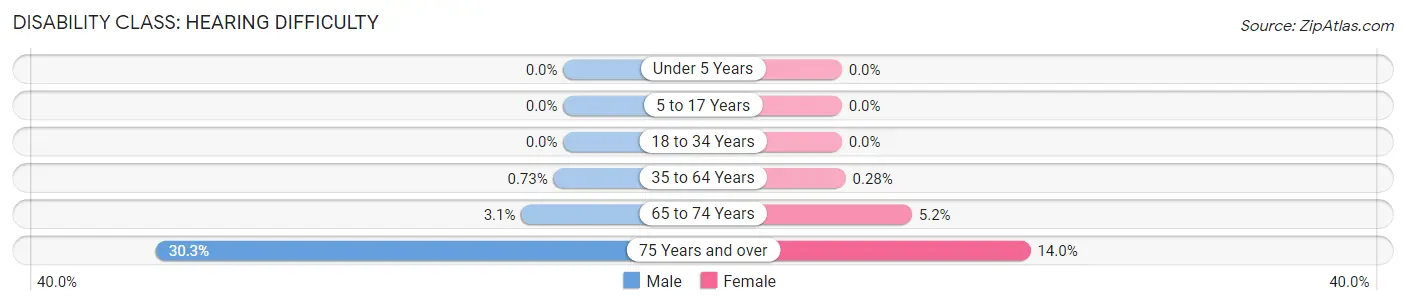
| Age Bracket | Male | Female |
| Under 5 Years | 0 (0.0%) | 0 (0.0%) |
| 5 to 17 Years | 0 (0.0%) | 0 (0.0%) |
| 18 to 34 Years | 0 (0.0%) | 0 (0.0%) |
| 35 to 64 Years | 23 (0.7%) | 9 (0.3%) |
| 65 to 74 Years | 24 (3.1%) | 40 (5.2%) |
| 75 Years and over | 95 (30.2%) | 81 (14.0%) |
Disability Class: Vision Difficulty
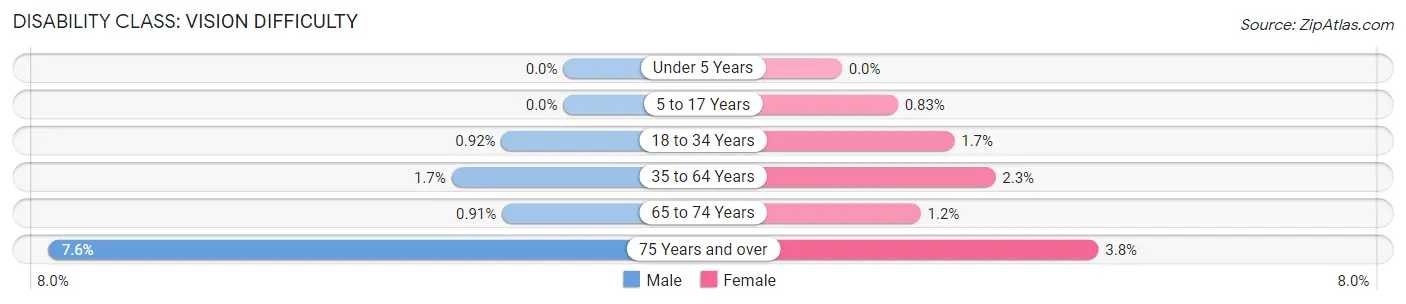
| Age Bracket | Male | Female |
| Under 5 Years | 0 (0.0%) | 0 (0.0%) |
| 5 to 17 Years | 0 (0.0%) | 12 (0.8%) |
| 18 to 34 Years | 8 (0.9%) | 17 (1.7%) |
| 35 to 64 Years | 52 (1.7%) | 74 (2.3%) |
| 65 to 74 Years | 7 (0.9%) | 9 (1.2%) |
| 75 Years and over | 24 (7.6%) | 22 (3.8%) |
Disability Class: Cognitive Difficulty
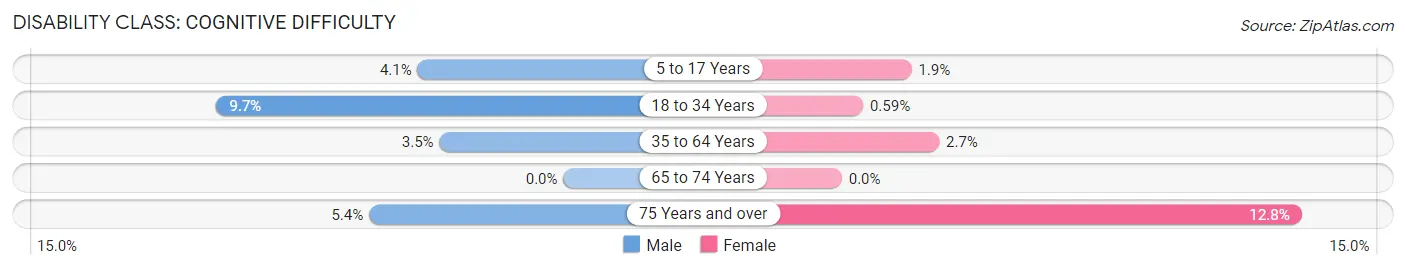
| Age Bracket | Male | Female |
| 5 to 17 Years | 62 (4.1%) | 28 (1.9%) |
| 18 to 34 Years | 84 (9.7%) | 6 (0.6%) |
| 35 to 64 Years | 108 (3.5%) | 88 (2.7%) |
| 65 to 74 Years | 0 (0.0%) | 0 (0.0%) |
| 75 Years and over | 17 (5.4%) | 74 (12.8%) |
Disability Class: Ambulatory Difficulty
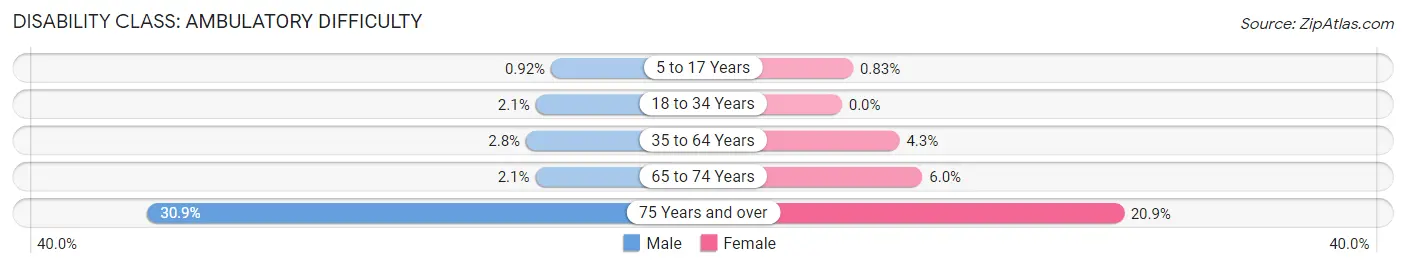
| Age Bracket | Male | Female |
| 5 to 17 Years | 14 (0.9%) | 12 (0.8%) |
| 18 to 34 Years | 18 (2.1%) | 0 (0.0%) |
| 35 to 64 Years | 87 (2.8%) | 139 (4.3%) |
| 65 to 74 Years | 16 (2.1%) | 46 (6.0%) |
| 75 Years and over | 97 (30.9%) | 121 (20.9%) |
Disability Class: Self-Care Difficulty
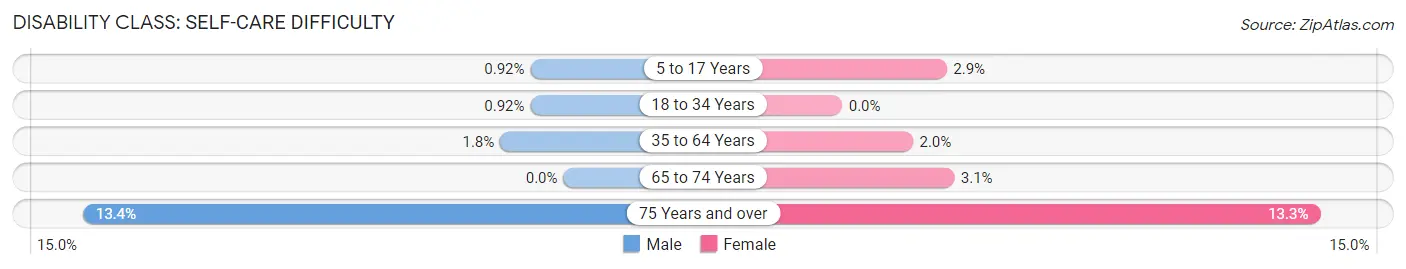
| Age Bracket | Male | Female |
| 5 to 17 Years | 14 (0.9%) | 42 (2.9%) |
| 18 to 34 Years | 8 (0.9%) | 0 (0.0%) |
| 35 to 64 Years | 55 (1.8%) | 64 (2.0%) |
| 65 to 74 Years | 0 (0.0%) | 24 (3.1%) |
| 75 Years and over | 42 (13.4%) | 77 (13.3%) |
Technology Access in Moorestown Lenola
Computing Device Access in Moorestown Lenola
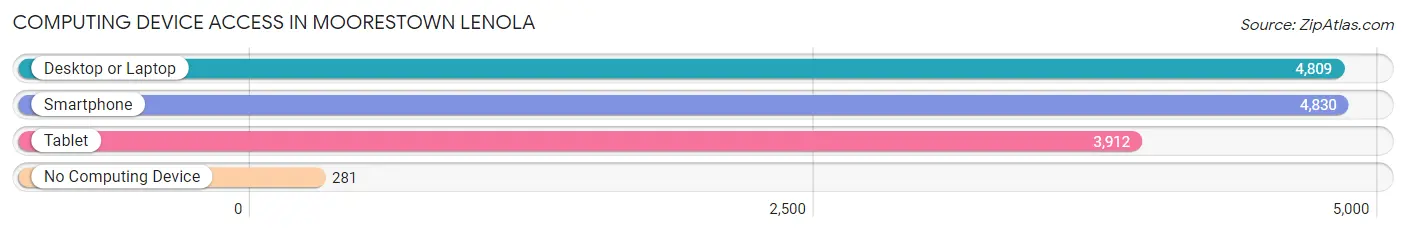
| Device Type | # Households | % Households |
| Desktop or Laptop | 4,809 | 89.3% |
| Smartphone | 4,830 | 89.7% |
| Tablet | 3,912 | 72.7% |
| No Computing Device | 281 | 5.2% |
| Total | 5,382 | 100.0% |
Internet Access in Moorestown Lenola
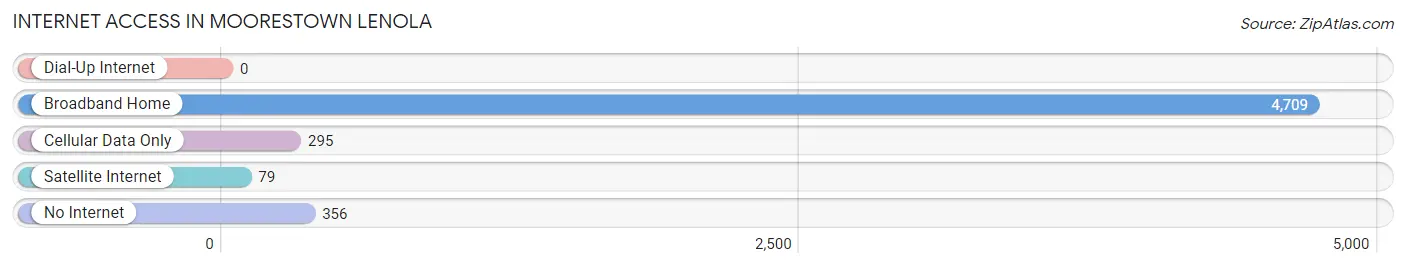
| Internet Type | # Households | % Households |
| Dial-Up Internet | 0 | 0.0% |
| Broadband Home | 4,709 | 87.5% |
| Cellular Data Only | 295 | 5.5% |
| Satellite Internet | 79 | 1.5% |
| No Internet | 356 | 6.6% |
| Total | 5,382 | 100.0% |
Moorestown Lenola Summary
Moorestown-Lenola, NJ is a small town located in Burlington County, New Jersey. It is situated between the towns of Moorestown and Mount Laurel, and is part of the Philadelphia metropolitan area. The town has a population of approximately 8,000 people, and is known for its small-town charm and close-knit community.
History
Moorestown-Lenola was originally part of the Lenape Indian territory, and was first settled by Europeans in the late 1600s. The town was originally known as “Lenape”, and was part of the Lenape Indian Reservation. In 1722, the town was officially incorporated as “Lenola”, and was named after the Lenape Indians. In 1867, the town was renamed “Moorestown-Lenola”, after the nearby town of Moorestown.
Geography
Moorestown-Lenola is located in Burlington County, New Jersey, and is situated between the towns of Moorestown and Mount Laurel. The town is located in the Delaware Valley, and is part of the Philadelphia metropolitan area. The town is bordered by the towns of Maple Shade, Mount Laurel, and Moorestown. The town is located approximately 20 miles from Philadelphia, and is accessible via the New Jersey Turnpike and Interstate 295.
Economy
Moorestown-Lenola is a small town with a population of approximately 8,000 people. The town is home to a variety of businesses, including retail stores, restaurants, and professional services. The town is also home to several large employers, including Lockheed Martin, TD Bank, and the Moorestown Mall. The town is also home to several small businesses, including a variety of restaurants, shops, and professional services.
Demographics
As of the 2010 census, Moorestown-Lenola had a population of 8,000 people. The town is predominantly white, with a population that is approximately 85% white, 8% African American, 4% Hispanic, and 3% Asian. The median household income in the town is approximately $80,000, and the median home value is approximately $400,000. The town has a low unemployment rate, and a high rate of homeownership.
Conclusion
Moorestown-Lenola is a small town located in Burlington County, New Jersey. The town has a population of approximately 8,000 people, and is known for its small-town charm and close-knit community. The town is predominantly white, with a population that is approximately 85% white, 8% African American, 4% Hispanic, and 3% Asian. The town is home to a variety of businesses, including retail stores, restaurants, and professional services. The town has a low unemployment rate, and a high rate of homeownership. Moorestown-Lenola is a great place to live, work, and raise a family.
Common Questions
What is the Total Population of Moorestown Lenola?
Total Population of Moorestown Lenola is 14,379.
What is the Total Male Population of Moorestown Lenola?
Total Male Population of Moorestown Lenola is 6,933.
What is the Total Female Population of Moorestown Lenola?
Total Female Population of Moorestown Lenola is 7,446.
What is the Ratio of Males per 100 Females in Moorestown Lenola?
There are 93.11 Males per 100 Females in Moorestown Lenola.
What is the Ratio of Females per 100 Males in Moorestown Lenola?
There are 107.40 Females per 100 Males in Moorestown Lenola.
What is the Median Population Age in Moorestown Lenola?
Median Population Age in Moorestown Lenola is 45.8 Years.
What is the Average Family Size in Moorestown Lenola
Average Family Size in Moorestown Lenola is 3.1 People.
What is the Average Household Size in Moorestown Lenola
Average Household Size in Moorestown Lenola is 2.6 People.
What is Per Capita Income in Moorestown Lenola?
Per Capita income in Moorestown Lenola is $80,386.
What is the Median Family Income in Moorestown Lenola?
Median Family Income in Moorestown Lenola is $170,694.
What is the Median Household income in Moorestown Lenola?
Median Household Income in Moorestown Lenola is $136,574.
What is Income or Wage Gap in Moorestown Lenola?
Income or Wage Gap in Moorestown Lenola is 39.4%.
Women in Moorestown Lenola earn 60.6 cents for every dollar earned by a man.
What is Inequality or Gini Index in Moorestown Lenola?
Inequality or Gini Index in Moorestown Lenola is 0.51.
How Large is the Labor Force in Moorestown Lenola?
There are 7,450 People in the Labor Forcein in Moorestown Lenola.
What is the Percentage of People in the Labor Force in Moorestown Lenola?
64.1% of People are in the Labor Force in Moorestown Lenola.
What is the Unemployment Rate in Moorestown Lenola?
Unemployment Rate in Moorestown Lenola is 4.0%.