Mercerville, NJ
Mercerville Map
Mercerville Overview
14,364
TOTAL POPULATION
6,772
MALE POPULATION
7,592
FEMALE POPULATION
89.20
MALES / 100 FEMALES
112.11
FEMALES / 100 MALES
42.6
MEDIAN AGE
3.2
AVG FAMILY SIZE
2.8
AVG HOUSEHOLD SIZE
$47,193
PER CAPITA INCOME
$129,265
AVG FAMILY INCOME
$116,380
AVG HOUSEHOLD INCOME
22.5%
WAGE / INCOME GAP [ % ]
77.5¢/ $1
WAGE / INCOME GAP [ $ ]
0.35
INEQUALITY / GINI INDEX
7,187
LABOR FORCE [ PEOPLE ]
62.0%
PERCENT IN LABOR FORCE
3.4%
UNEMPLOYMENT RATE
Mercerville Area Codes
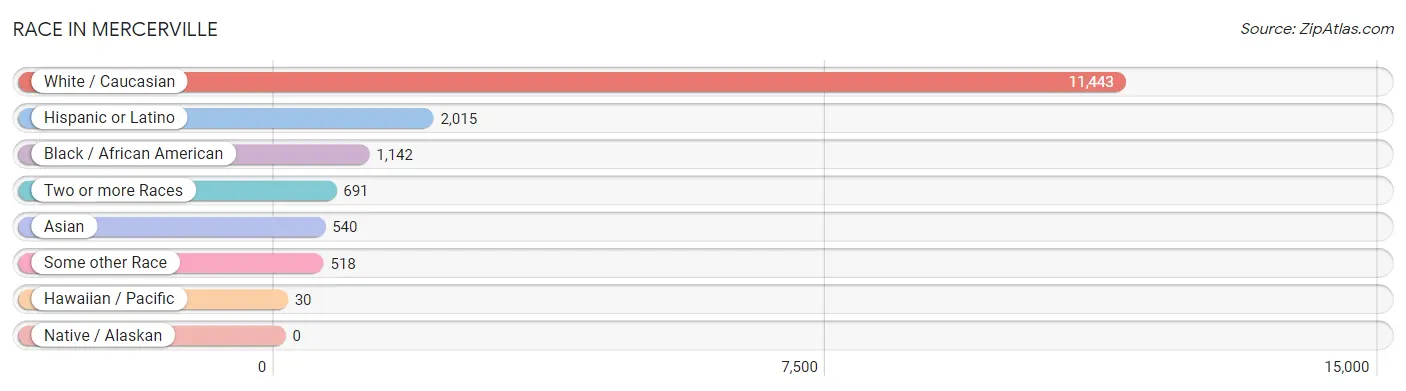
Race in Mercerville
The most populous races in Mercerville are White / Caucasian (11,443 | 79.7%), Hispanic or Latino (2,015 | 14.0%), and Black / African American (1,142 | 8.0%).
| Race | # Population | % Population |
| Asian | 540 | 3.8% |
| Black / African American | 1,142 | 8.0% |
| Hawaiian / Pacific | 30 | 0.2% |
| Hispanic or Latino | 2,015 | 14.0% |
| Native / Alaskan | 0 | 0.0% |
| White / Caucasian | 11,443 | 79.7% |
| Two or more Races | 691 | 4.8% |
| Some other Race | 518 | 3.6% |
| Total | 14,364 | 100.0% |
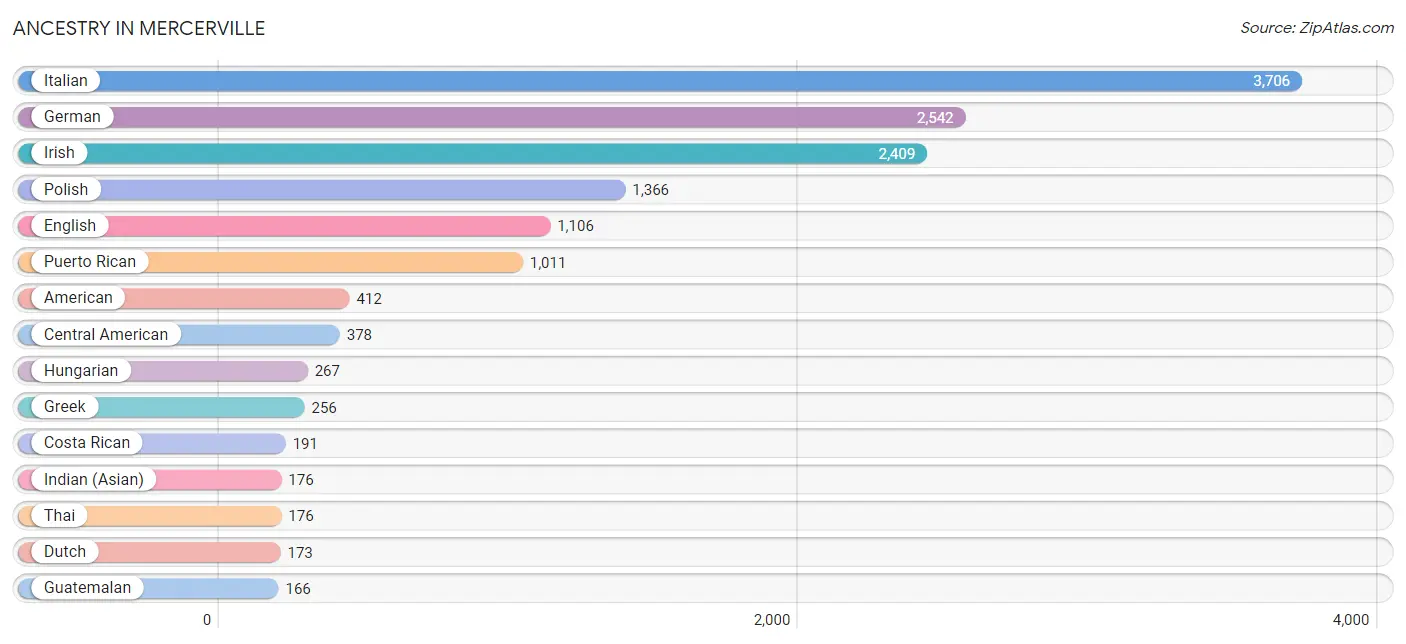
Ancestry in Mercerville
The most populous ancestries reported in Mercerville are Italian (3,706 | 25.8%), German (2,542 | 17.7%), Irish (2,409 | 16.8%), Polish (1,366 | 9.5%), and English (1,106 | 7.7%), together accounting for 77.5% of all Mercerville residents.
| Ancestry | # Population | % Population |
| African | 36 | 0.3% |
| American | 412 | 2.9% |
| Arab | 71 | 0.5% |
| Argentinean | 70 | 0.5% |
| Bhutanese | 21 | 0.2% |
| Blackfeet | 16 | 0.1% |
| Brazilian | 19 | 0.1% |
| British | 64 | 0.4% |
| Burmese | 116 | 0.8% |
| Central American | 378 | 2.6% |
| Costa Rican | 191 | 1.3% |
| Cuban | 142 | 1.0% |
| Czech | 116 | 0.8% |
| Czechoslovakian | 11 | 0.1% |
| Danish | 17 | 0.1% |
| Dutch | 173 | 1.2% |
| Ecuadorian | 23 | 0.2% |
| Egyptian | 62 | 0.4% |
| English | 1,106 | 7.7% |
| European | 138 | 1.0% |
| French | 102 | 0.7% |
| German | 2,542 | 17.7% |
| Ghanaian | 19 | 0.1% |
| Greek | 256 | 1.8% |
| Guamanian / Chamorro | 30 | 0.2% |
| Guatemalan | 166 | 1.2% |
| Haitian | 75 | 0.5% |
| Honduran | 21 | 0.2% |
| Hungarian | 267 | 1.9% |
| Indian (Asian) | 176 | 1.2% |
| Irish | 2,409 | 16.8% |
| Iroquois | 20 | 0.1% |
| Italian | 3,706 | 25.8% |
| Korean | 76 | 0.5% |
| Lebanese | 9 | 0.1% |
| Lithuanian | 98 | 0.7% |
| Mexican | 38 | 0.3% |
| Northern European | 13 | 0.1% |
| Norwegian | 78 | 0.5% |
| Pennsylvania German | 9 | 0.1% |
| Peruvian | 18 | 0.1% |
| Polish | 1,366 | 9.5% |
| Portuguese | 28 | 0.2% |
| Puerto Rican | 1,011 | 7.0% |
| Romanian | 17 | 0.1% |
| Russian | 85 | 0.6% |
| Scotch-Irish | 65 | 0.4% |
| Scottish | 154 | 1.1% |
| Sioux | 16 | 0.1% |
| Slavic | 33 | 0.2% |
| Slovak | 12 | 0.1% |
| South American | 111 | 0.8% |
| Spaniard | 141 | 1.0% |
| Subsaharan African | 55 | 0.4% |
| Swedish | 72 | 0.5% |
| Swiss | 23 | 0.2% |
| Thai | 176 | 1.2% |
| Turkish | 7 | 0.1% |
| Ukrainian | 88 | 0.6% |
| Welsh | 16 | 0.1% | View All 60 Rows |
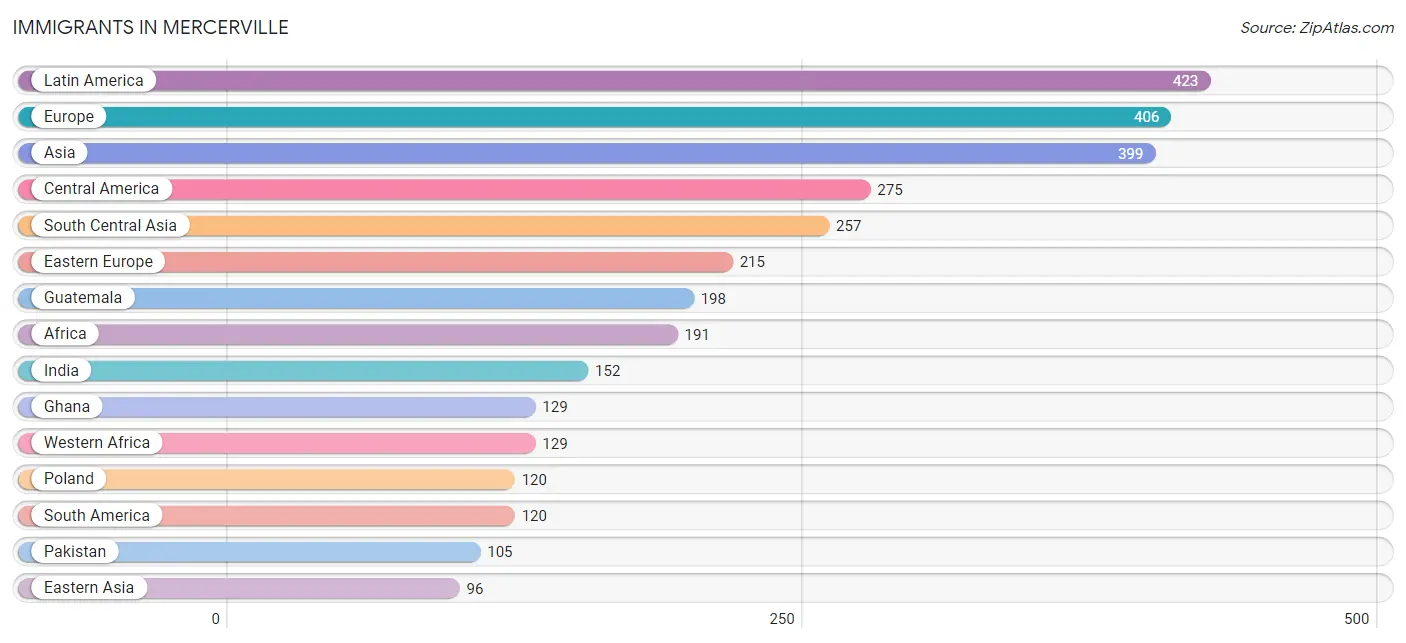
Immigrants in Mercerville
The most numerous immigrant groups reported in Mercerville came from Latin America (423 | 2.9%), Europe (406 | 2.8%), Asia (399 | 2.8%), Central America (275 | 1.9%), and South Central Asia (257 | 1.8%), together accounting for 12.2% of all Mercerville residents.
| Immigration Origin | # Population | % Population |
| Africa | 191 | 1.3% |
| Argentina | 38 | 0.3% |
| Asia | 399 | 2.8% |
| Brazil | 49 | 0.3% |
| Caribbean | 28 | 0.2% |
| Central America | 275 | 1.9% |
| China | 74 | 0.5% |
| Costa Rica | 41 | 0.3% |
| Eastern Asia | 96 | 0.7% |
| Eastern Europe | 215 | 1.5% |
| Ecuador | 15 | 0.1% |
| Egypt | 62 | 0.4% |
| England | 42 | 0.3% |
| Europe | 406 | 2.8% |
| Germany | 45 | 0.3% |
| Ghana | 129 | 0.9% |
| Guatemala | 198 | 1.4% |
| Haiti | 28 | 0.2% |
| Honduras | 21 | 0.2% |
| Hungary | 20 | 0.1% |
| India | 152 | 1.1% |
| Italy | 33 | 0.2% |
| Korea | 22 | 0.2% |
| Latin America | 423 | 2.9% |
| Mexico | 15 | 0.1% |
| Northern Africa | 62 | 0.4% |
| Northern Europe | 72 | 0.5% |
| Pakistan | 105 | 0.7% |
| Peru | 18 | 0.1% |
| Philippines | 39 | 0.3% |
| Poland | 120 | 0.8% |
| Portugal | 15 | 0.1% |
| South America | 120 | 0.8% |
| South Central Asia | 257 | 1.8% |
| South Eastern Asia | 39 | 0.3% |
| Southern Europe | 48 | 0.3% |
| Turkey | 7 | 0.1% |
| Ukraine | 75 | 0.5% |
| Western Africa | 129 | 0.9% |
| Western Asia | 7 | 0.1% |
| Western Europe | 71 | 0.5% | View All 41 Rows |
Sex and Age in Mercerville
Sex and Age in Mercerville
The most populous age groups in Mercerville are 5 to 9 Years (565 | 8.3%) for men and 15 to 19 Years (539 | 7.1%) for women.
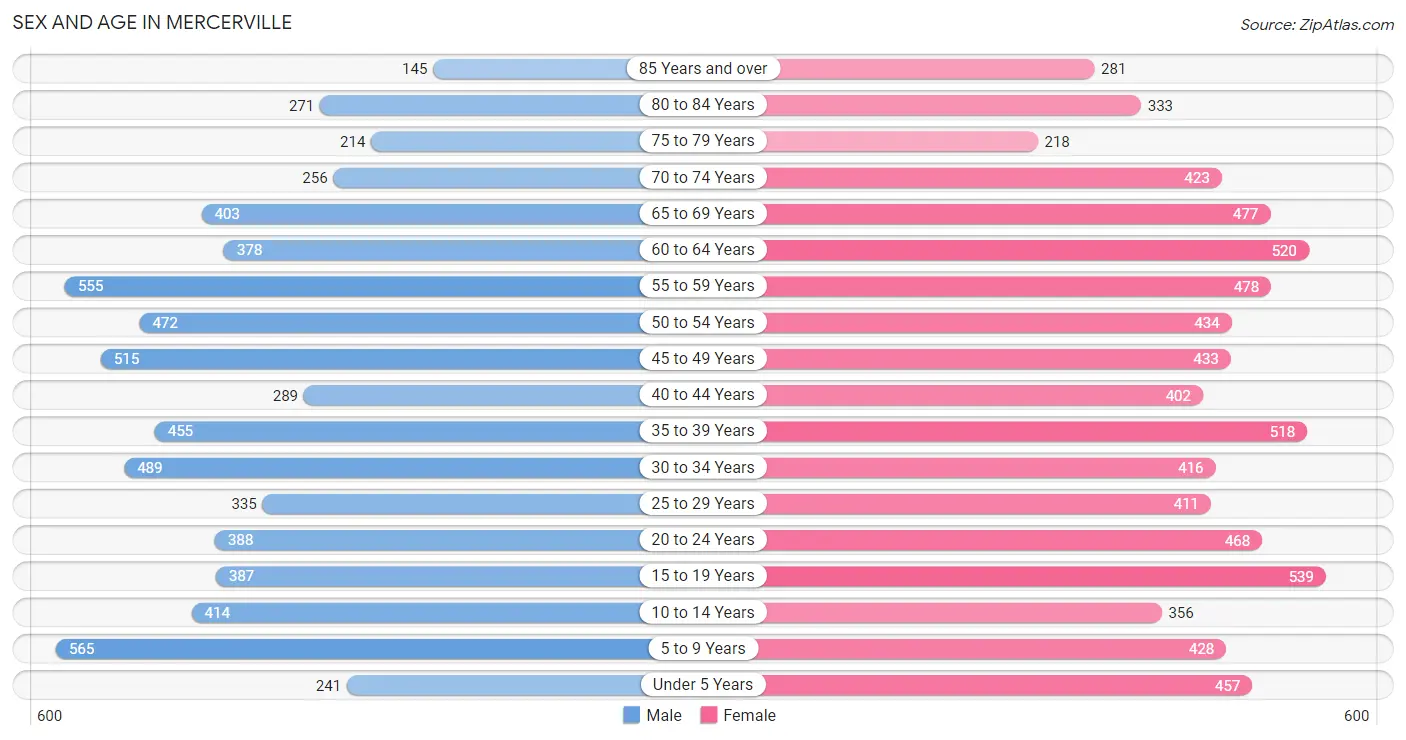
| Age Bracket | Male | Female |
| Under 5 Years | 241 (3.6%) | 457 (6.0%) |
| 5 to 9 Years | 565 (8.3%) | 428 (5.6%) |
| 10 to 14 Years | 414 (6.1%) | 356 (4.7%) |
| 15 to 19 Years | 387 (5.7%) | 539 (7.1%) |
| 20 to 24 Years | 388 (5.7%) | 468 (6.2%) |
| 25 to 29 Years | 335 (5.0%) | 411 (5.4%) |
| 30 to 34 Years | 489 (7.2%) | 416 (5.5%) |
| 35 to 39 Years | 455 (6.7%) | 518 (6.8%) |
| 40 to 44 Years | 289 (4.3%) | 402 (5.3%) |
| 45 to 49 Years | 515 (7.6%) | 433 (5.7%) |
| 50 to 54 Years | 472 (7.0%) | 434 (5.7%) |
| 55 to 59 Years | 555 (8.2%) | 478 (6.3%) |
| 60 to 64 Years | 378 (5.6%) | 520 (6.9%) |
| 65 to 69 Years | 403 (5.9%) | 477 (6.3%) |
| 70 to 74 Years | 256 (3.8%) | 423 (5.6%) |
| 75 to 79 Years | 214 (3.2%) | 218 (2.9%) |
| 80 to 84 Years | 271 (4.0%) | 333 (4.4%) |
| 85 Years and over | 145 (2.1%) | 281 (3.7%) |
| Total | 6,772 (100.0%) | 7,592 (100.0%) |
Families and Households in Mercerville
Median Family Size in Mercerville
The median family size in Mercerville is 3.16 persons per family, with married-couple families (3,270 | 81.4%) accounting for the largest median family size of 3.23 persons per family. On the other hand, single male/father families (159 | 4.0%) represent the smallest median family size with 2.72 persons per family.
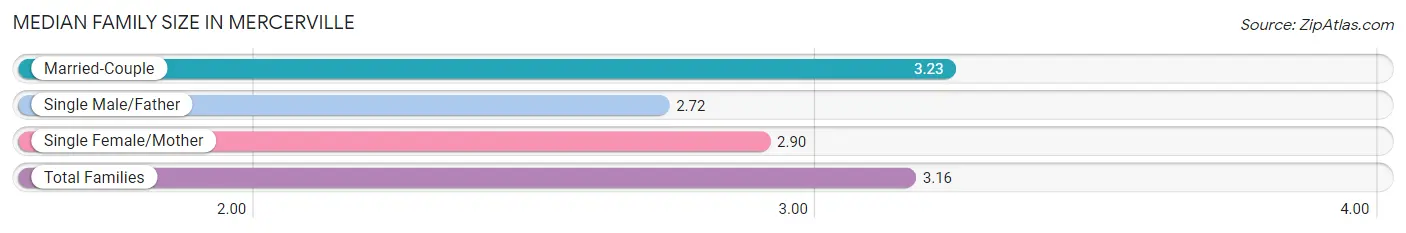
| Family Type | # Families | Family Size |
| Married-Couple | 3,270 (81.4%) | 3.23 |
| Single Male/Father | 159 (4.0%) | 2.72 |
| Single Female/Mother | 587 (14.6%) | 2.90 |
| Total Families | 4,016 (100.0%) | 3.16 |
Median Household Size in Mercerville
The median household size in Mercerville is 2.77 persons per household, with married-couple households (3,270 | 64.7%) accounting for the largest median household size of 3.24 persons per household. non-family households (1,041 | 20.6%) represent the smallest median household size with 1.16 persons per household.
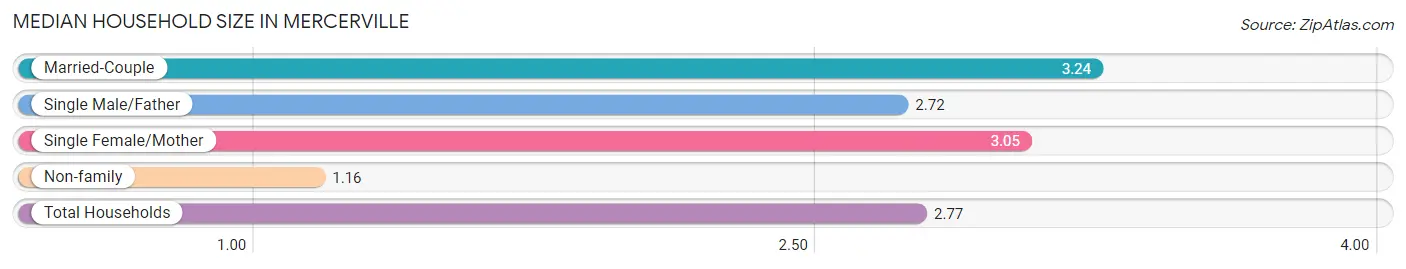
| Household Type | # Households | Household Size |
| Married-Couple | 3,270 (64.7%) | 3.24 |
| Single Male/Father | 159 (3.1%) | 2.72 |
| Single Female/Mother | 587 (11.6%) | 3.05 |
| Non-family | 1,041 (20.6%) | 1.16 |
| Total Households | 5,057 (100.0%) | 2.77 |
Household Size by Marriage Status in Mercerville
Out of a total of 5,057 households in Mercerville, 4,016 (79.4%) are family households, while 1,041 (20.6%) are nonfamily households. The most numerous type of family households are 2-person households, comprising 1,754, and the most common type of nonfamily households are 1-person households, comprising 904.
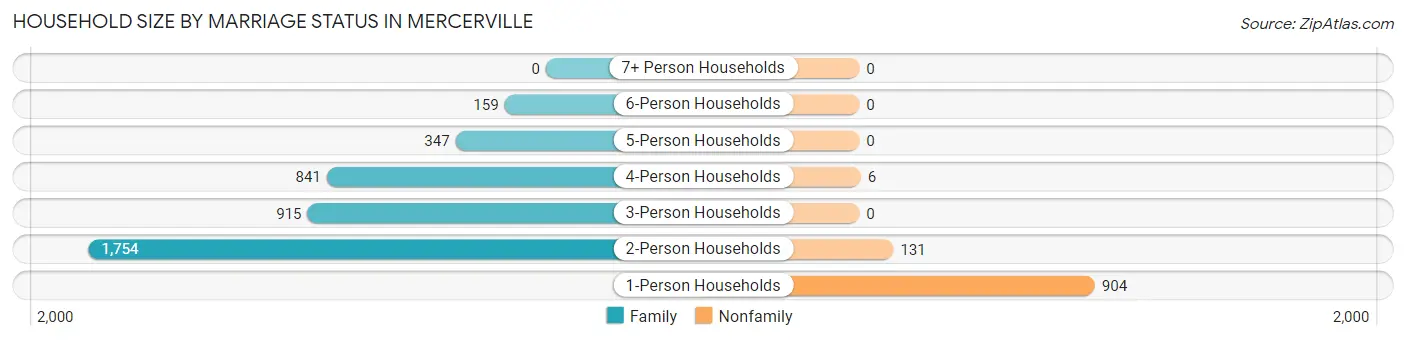
| Household Size | Family Households | Nonfamily Households |
| 1-Person Households | - | 904 (17.9%) |
| 2-Person Households | 1,754 (34.7%) | 131 (2.6%) |
| 3-Person Households | 915 (18.1%) | 0 (0.0%) |
| 4-Person Households | 841 (16.6%) | 6 (0.1%) |
| 5-Person Households | 347 (6.9%) | 0 (0.0%) |
| 6-Person Households | 159 (3.1%) | 0 (0.0%) |
| 7+ Person Households | 0 (0.0%) | 0 (0.0%) |
| Total | 4,016 (79.4%) | 1,041 (20.6%) |
Female Fertility in Mercerville
Fertility by Age in Mercerville
Average fertility rate in Mercerville is 47.0 births per 1,000 women. Women in the age bracket of 20 to 34 years have the highest fertility rate with 120.0 births per 1,000 women. Women in the age bracket of 20 to 34 years acount for 100.0% of all women with births.
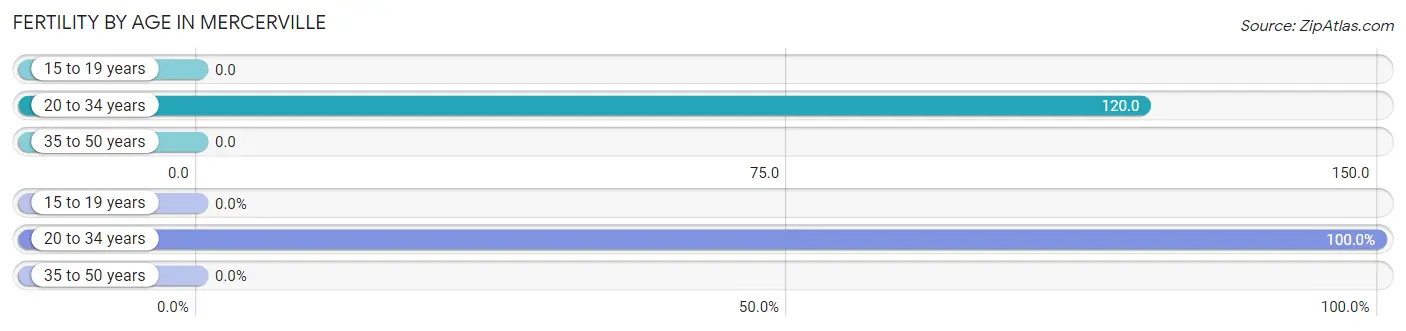
| Age Bracket | Women with Births | Births / 1,000 Women |
| 15 to 19 years | 0 (0.0%) | 0.0 |
| 20 to 34 years | 156 (100.0%) | 120.0 |
| 35 to 50 years | 0 (0.0%) | 0.0 |
| Total | 156 (100.0%) | 47.0 |
Fertility by Age by Marriage Status in Mercerville
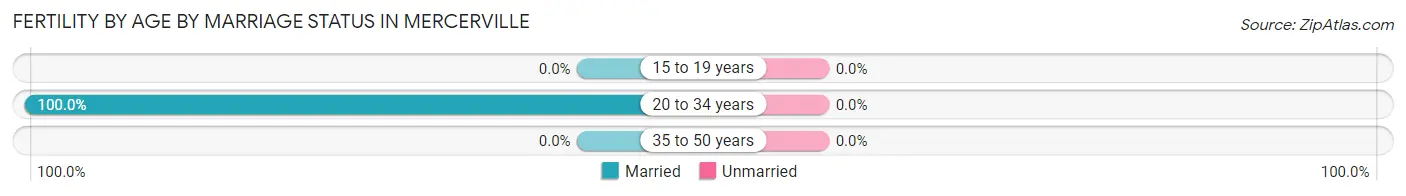
| Age Bracket | Married | Unmarried |
| 15 to 19 years | 0 (0.0%) | 0 (0.0%) |
| 20 to 34 years | 156 (100.0%) | 0 (0.0%) |
| 35 to 50 years | 0 (0.0%) | 0 (0.0%) |
| Total | 156 (100.0%) | 0 (0.0%) |
Fertility by Education in Mercerville
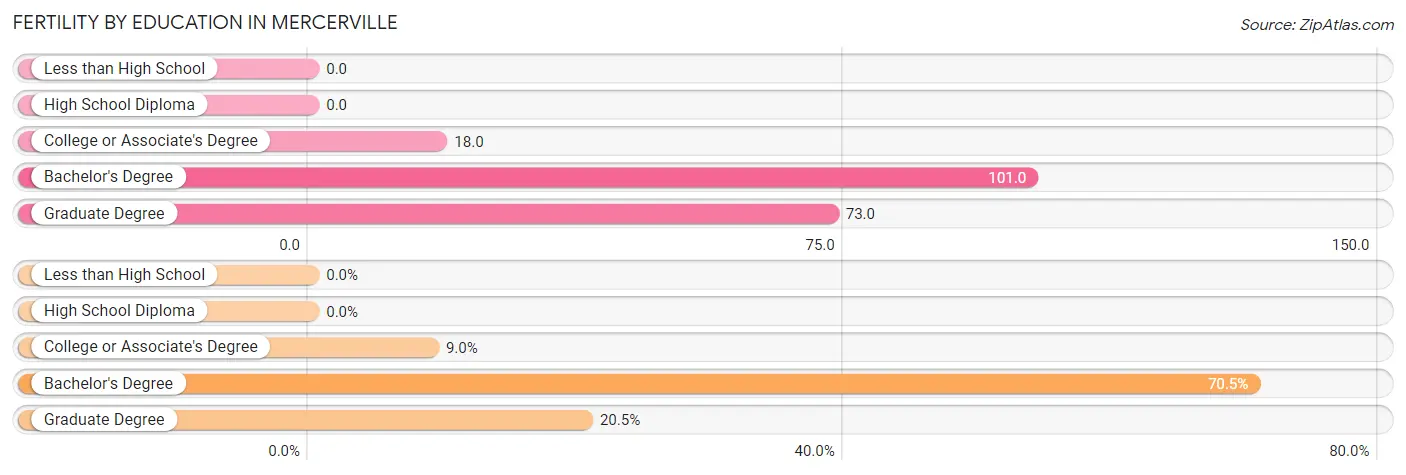
| Educational Attainment | Women with Births | Births / 1,000 Women |
| Less than High School | 0 (0.0%) | 0.0 |
| High School Diploma | 0 (0.0%) | 0.0 |
| College or Associate's Degree | 14 (9.0%) | 18.0 |
| Bachelor's Degree | 110 (70.5%) | 101.0 |
| Graduate Degree | 32 (20.5%) | 73.0 |
| Total | 156 (100.0%) | 47.0 |
Fertility by Education by Marriage Status in Mercerville
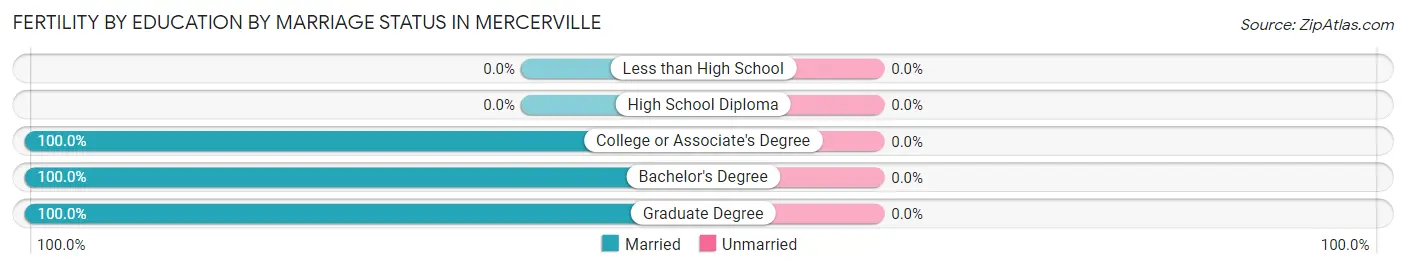
| Educational Attainment | Married | Unmarried |
| Less than High School | 0 (0.0%) | 0 (0.0%) |
| High School Diploma | 0 (0.0%) | 0 (0.0%) |
| College or Associate's Degree | 14 (100.0%) | 0 (0.0%) |
| Bachelor's Degree | 110 (100.0%) | 0 (0.0%) |
| Graduate Degree | 32 (100.0%) | 0 (0.0%) |
| Total | 156 (100.0%) | 0 (0.0%) |
Income in Mercerville
Income Overview in Mercerville
Per Capita Income in Mercerville is $47,193, while median incomes of families and households are $129,265 and $116,380 respectively.
| Characteristic | Number | Measure |
| Per Capita Income | 14,364 | $47,193 |
| Median Family Income | 4,016 | $129,265 |
| Mean Family Income | 4,016 | $141,652 |
| Median Household Income | 5,057 | $116,380 |
| Mean Household Income | 5,057 | $129,805 |
| Income Deficit | 4,016 | $0 |
| Wage / Income Gap (%) | 14,364 | 22.51% |
| Wage / Income Gap ($) | 14,364 | 77.49¢ per $1 |
| Gini / Inequality Index | 14,364 | 0.35 |
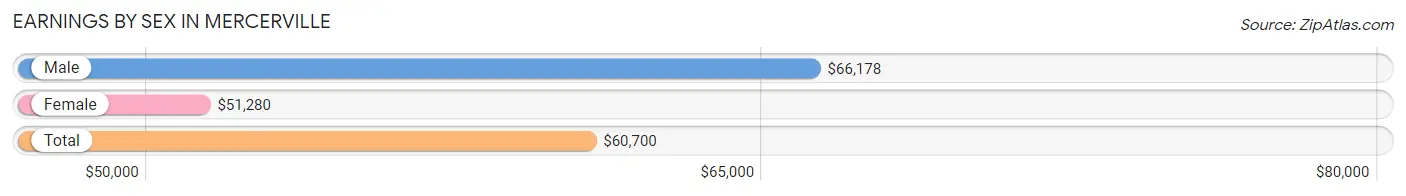
Earnings by Sex in Mercerville
Average Earnings in Mercerville are $60,700, $66,178 for men and $51,280 for women, a difference of 22.5%.
| Sex | Number | Average Earnings |
| Male | 3,832 (50.3%) | $66,178 |
| Female | 3,785 (49.7%) | $51,280 |
| Total | 7,617 (100.0%) | $60,700 |
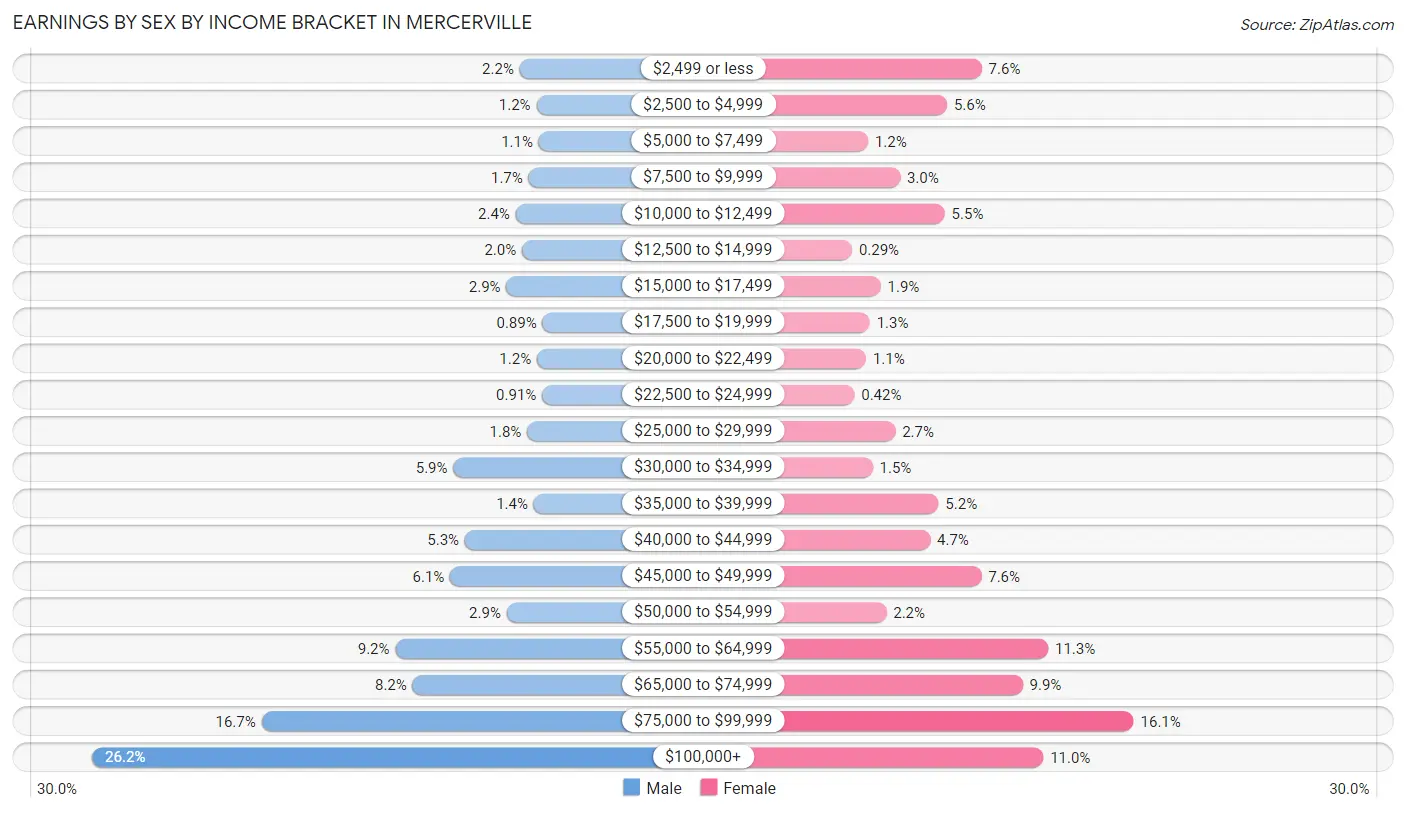
Earnings by Sex by Income Bracket in Mercerville
The most common earnings brackets in Mercerville are $100,000+ for men (1,004 | 26.2%) and $75,000 to $99,999 for women (610 | 16.1%).
| Income | Male | Female |
| $2,499 or less | 83 (2.2%) | 287 (7.6%) |
| $2,500 to $4,999 | 47 (1.2%) | 213 (5.6%) |
| $5,000 to $7,499 | 42 (1.1%) | 45 (1.2%) |
| $7,500 to $9,999 | 64 (1.7%) | 113 (3.0%) |
| $10,000 to $12,499 | 92 (2.4%) | 208 (5.5%) |
| $12,500 to $14,999 | 78 (2.0%) | 11 (0.3%) |
| $15,000 to $17,499 | 112 (2.9%) | 72 (1.9%) |
| $17,500 to $19,999 | 34 (0.9%) | 49 (1.3%) |
| $20,000 to $22,499 | 46 (1.2%) | 41 (1.1%) |
| $22,500 to $24,999 | 35 (0.9%) | 16 (0.4%) |
| $25,000 to $29,999 | 67 (1.8%) | 103 (2.7%) |
| $30,000 to $34,999 | 226 (5.9%) | 55 (1.5%) |
| $35,000 to $39,999 | 53 (1.4%) | 195 (5.1%) |
| $40,000 to $44,999 | 201 (5.2%) | 177 (4.7%) |
| $45,000 to $49,999 | 233 (6.1%) | 286 (7.6%) |
| $50,000 to $54,999 | 111 (2.9%) | 84 (2.2%) |
| $55,000 to $64,999 | 351 (9.2%) | 428 (11.3%) |
| $65,000 to $74,999 | 314 (8.2%) | 374 (9.9%) |
| $75,000 to $99,999 | 639 (16.7%) | 610 (16.1%) |
| $100,000+ | 1,004 (26.2%) | 418 (11.0%) |
| Total | 3,832 (100.0%) | 3,785 (100.0%) |
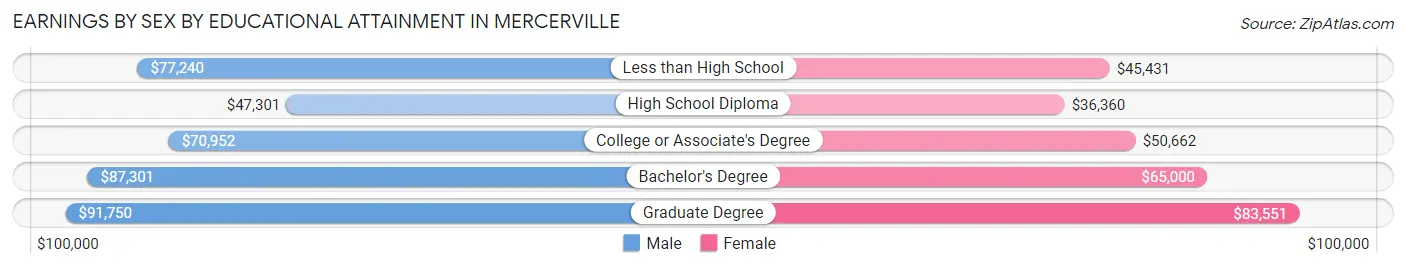
Earnings by Sex by Educational Attainment in Mercerville
Average earnings in Mercerville are $71,559 for men and $61,448 for women, a difference of 14.1%. Men with an educational attainment of graduate degree enjoy the highest average annual earnings of $91,750, while those with high school diploma education earn the least with $47,301. Women with an educational attainment of graduate degree earn the most with the average annual earnings of $83,551, while those with high school diploma education have the smallest earnings of $36,360.
| Educational Attainment | Male Income | Female Income |
| Less than High School | $77,240 | $45,431 |
| High School Diploma | $47,301 | $36,360 |
| College or Associate's Degree | $70,952 | $50,662 |
| Bachelor's Degree | $87,301 | $65,000 |
| Graduate Degree | $91,750 | $83,551 |
| Total | $71,559 | $61,448 |
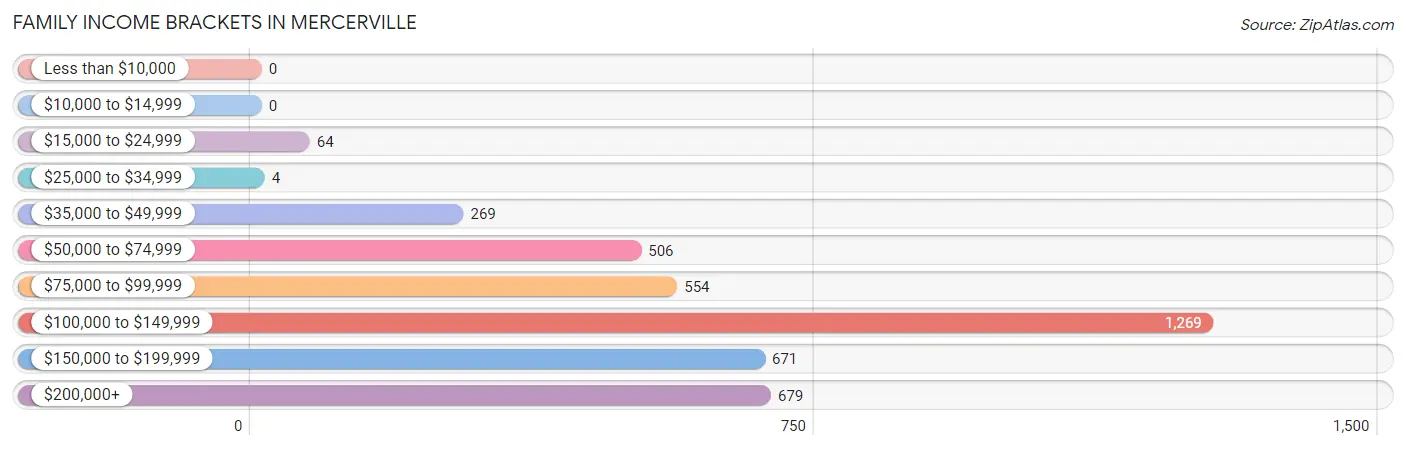
Family Income in Mercerville
Family Income Brackets in Mercerville
According to the Mercerville family income data, there are 1,269 families falling into the $100,000 to $149,999 income range, which is the most common income bracket and makes up 31.6% of all families.
| Income Bracket | # Families | % Families |
| Less than $10,000 | 0 | 0.0% |
| $10,000 to $14,999 | 0 | 0.0% |
| $15,000 to $24,999 | 64 | 1.6% |
| $25,000 to $34,999 | 4 | 0.1% |
| $35,000 to $49,999 | 269 | 6.7% |
| $50,000 to $74,999 | 506 | 12.6% |
| $75,000 to $99,999 | 554 | 13.8% |
| $100,000 to $149,999 | 1,269 | 31.6% |
| $150,000 to $199,999 | 671 | 16.7% |
| $200,000+ | 679 | 16.9% |
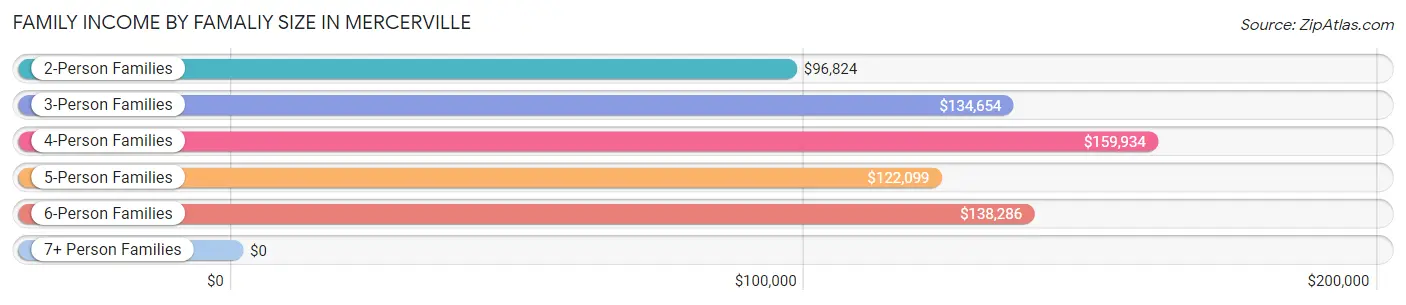
Family Income by Famaliy Size in Mercerville
4-person families (842 | 21.0%) account for the highest median family income in Mercerville with $159,934 per family, while 2-person families (1,784 | 44.4%) have the highest median income of $48,412 per family member.
| Income Bracket | # Families | Median Income |
| 2-Person Families | 1,784 (44.4%) | $96,824 |
| 3-Person Families | 916 (22.8%) | $134,654 |
| 4-Person Families | 842 (21.0%) | $159,934 |
| 5-Person Families | 327 (8.1%) | $122,099 |
| 6-Person Families | 147 (3.7%) | $138,286 |
| 7+ Person Families | 0 (0.0%) | $0 |
| Total | 4,016 (100.0%) | $129,265 |
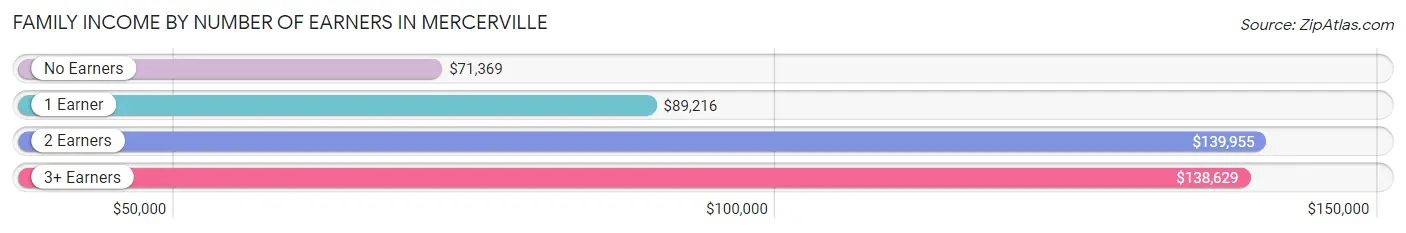
Family Income by Number of Earners in Mercerville
The median family income in Mercerville is $129,265, with families comprising 2 earners (1,714) having the highest median family income of $139,955, while families with no earners (693) have the lowest median family income of $71,369, accounting for 42.7% and 17.3% of families, respectively.
| Number of Earners | # Families | Median Income |
| No Earners | 693 (17.3%) | $71,369 |
| 1 Earner | 875 (21.8%) | $89,216 |
| 2 Earners | 1,714 (42.7%) | $139,955 |
| 3+ Earners | 734 (18.3%) | $138,629 |
| Total | 4,016 (100.0%) | $129,265 |
Household Income in Mercerville
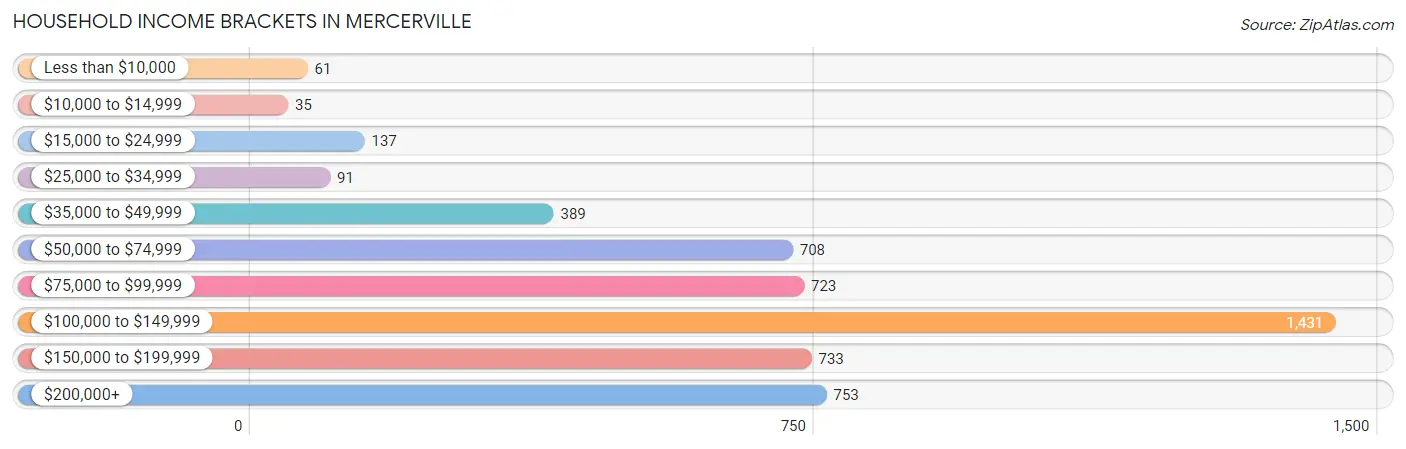
Household Income Brackets in Mercerville
With 1,431 households falling in the category, the $100,000 to $149,999 income range is the most frequent in Mercerville, accounting for 28.3% of all households. In contrast, only 35 households (0.7%) fall into the $10,000 to $14,999 income bracket, making it the least populous group.
| Income Bracket | # Households | % Households |
| Less than $10,000 | 61 | 1.2% |
| $10,000 to $14,999 | 35 | 0.7% |
| $15,000 to $24,999 | 137 | 2.7% |
| $25,000 to $34,999 | 91 | 1.8% |
| $35,000 to $49,999 | 389 | 7.7% |
| $50,000 to $74,999 | 708 | 14.0% |
| $75,000 to $99,999 | 723 | 14.3% |
| $100,000 to $149,999 | 1,431 | 28.3% |
| $150,000 to $199,999 | 733 | 14.5% |
| $200,000+ | 753 | 14.9% |
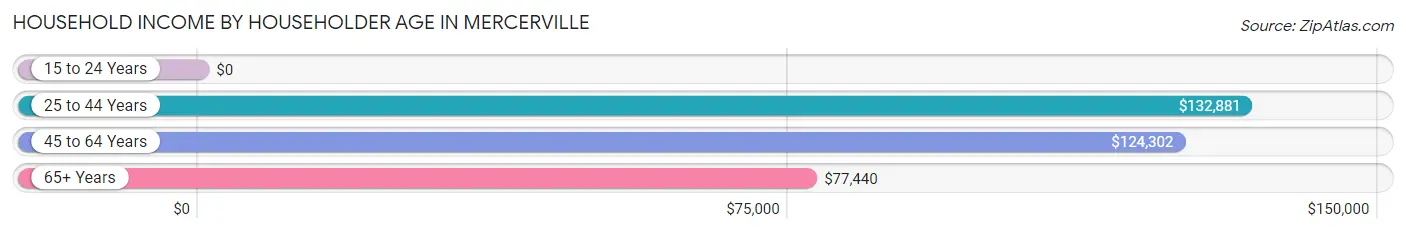
Household Income by Householder Age in Mercerville
The median household income in Mercerville is $116,380, with the highest median household income of $132,881 found in the 25 to 44 years age bracket for the primary householder. A total of 1,316 households (26.0%) fall into this category. Meanwhile, the 15 to 24 years age bracket for the primary householder has the lowest median household income of $0, with 70 households (1.4%) in this group.
| Income Bracket | # Households | Median Income |
| 15 to 24 Years | 70 (1.4%) | $0 |
| 25 to 44 Years | 1,316 (26.0%) | $132,881 |
| 45 to 64 Years | 2,024 (40.0%) | $124,302 |
| 65+ Years | 1,647 (32.6%) | $77,440 |
| Total | 5,057 (100.0%) | $116,380 |
Poverty in Mercerville
Income Below Poverty by Sex and Age in Mercerville
With 1.6% poverty level for males and 2.8% for females among the residents of Mercerville, 65 to 74 year old males and 65 to 74 year old females are the most vulnerable to poverty, with 41 males (6.5%) and 81 females (9.4%) in their respective age groups living below the poverty level.
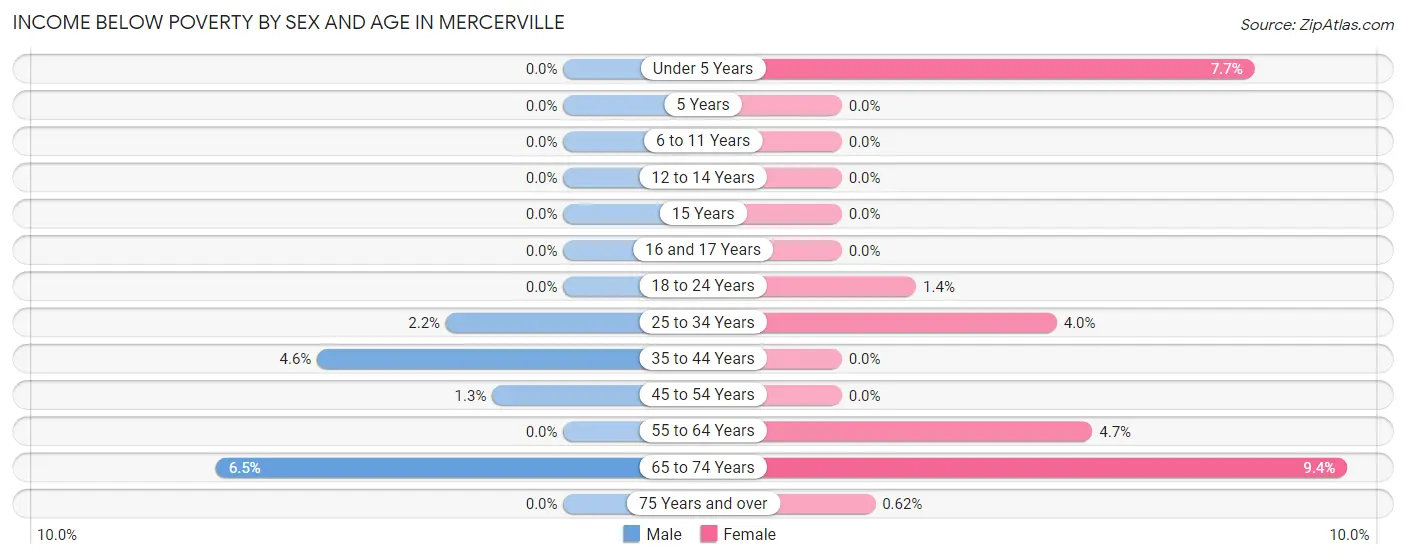
| Age Bracket | Male | Female |
| Under 5 Years | 0 (0.0%) | 35 (7.7%) |
| 5 Years | 0 (0.0%) | 0 (0.0%) |
| 6 to 11 Years | 0 (0.0%) | 0 (0.0%) |
| 12 to 14 Years | 0 (0.0%) | 0 (0.0%) |
| 15 Years | 0 (0.0%) | 0 (0.0%) |
| 16 and 17 Years | 0 (0.0%) | 0 (0.0%) |
| 18 to 24 Years | 0 (0.0%) | 8 (1.4%) |
| 25 to 34 Years | 18 (2.2%) | 33 (4.0%) |
| 35 to 44 Years | 34 (4.6%) | 0 (0.0%) |
| 45 to 54 Years | 13 (1.3%) | 0 (0.0%) |
| 55 to 64 Years | 0 (0.0%) | 46 (4.6%) |
| 65 to 74 Years | 41 (6.5%) | 81 (9.4%) |
| 75 Years and over | 0 (0.0%) | 4 (0.6%) |
| Total | 106 (1.6%) | 207 (2.8%) |
Income Above Poverty by Sex and Age in Mercerville
According to the poverty statistics in Mercerville, males aged under 5 years and females aged 5 years are the age groups that are most secure financially, with 100.0% of males and 100.0% of females in these age groups living above the poverty line.
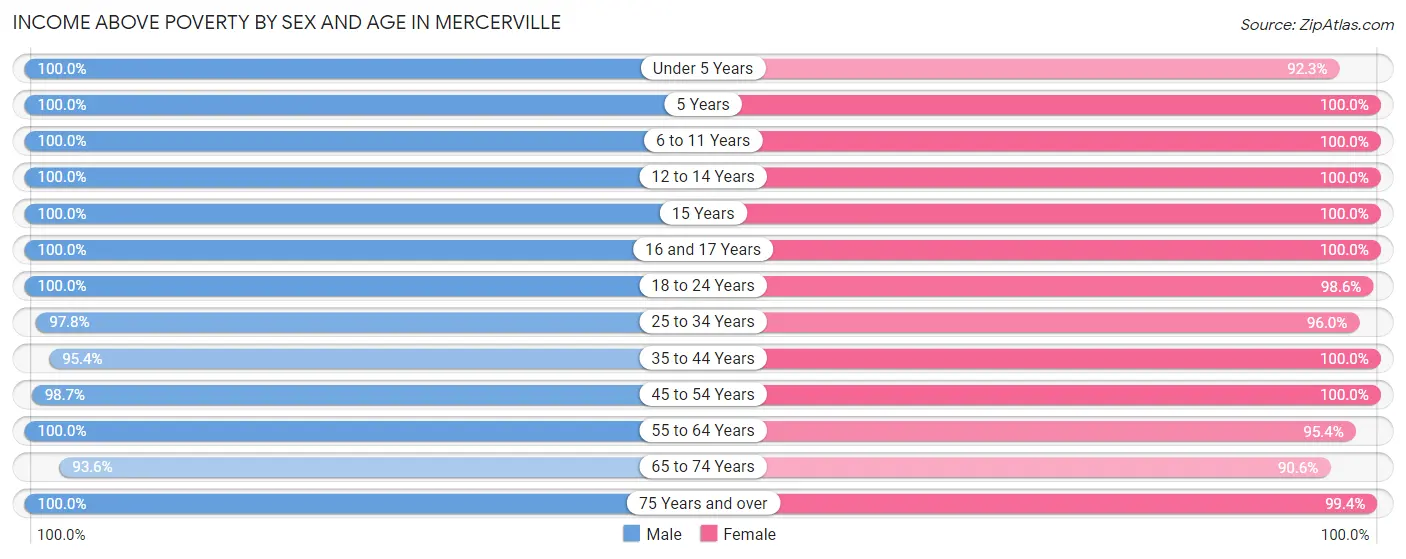
| Age Bracket | Male | Female |
| Under 5 Years | 241 (100.0%) | 422 (92.3%) |
| 5 Years | 108 (100.0%) | 65 (100.0%) |
| 6 to 11 Years | 542 (100.0%) | 547 (100.0%) |
| 12 to 14 Years | 329 (100.0%) | 172 (100.0%) |
| 15 Years | 113 (100.0%) | 198 (100.0%) |
| 16 and 17 Years | 99 (100.0%) | 230 (100.0%) |
| 18 to 24 Years | 563 (100.0%) | 571 (98.6%) |
| 25 to 34 Years | 806 (97.8%) | 794 (96.0%) |
| 35 to 44 Years | 710 (95.4%) | 909 (100.0%) |
| 45 to 54 Years | 974 (98.7%) | 867 (100.0%) |
| 55 to 64 Years | 933 (100.0%) | 943 (95.4%) |
| 65 to 74 Years | 595 (93.5%) | 783 (90.6%) |
| 75 Years and over | 601 (100.0%) | 638 (99.4%) |
| Total | 6,614 (98.4%) | 7,139 (97.2%) |
Income Below Poverty Among Married-Couple Families in Mercerville
The poverty statistics for married-couple families in Mercerville show that 1.0% or 33 of the total 3,270 families live below the poverty line. Families with 1 or 2 children have the highest poverty rate of 2.9%, comprising of 33 families. On the other hand, families with no children have the lowest poverty rate of 0.0%, which includes 0 families.
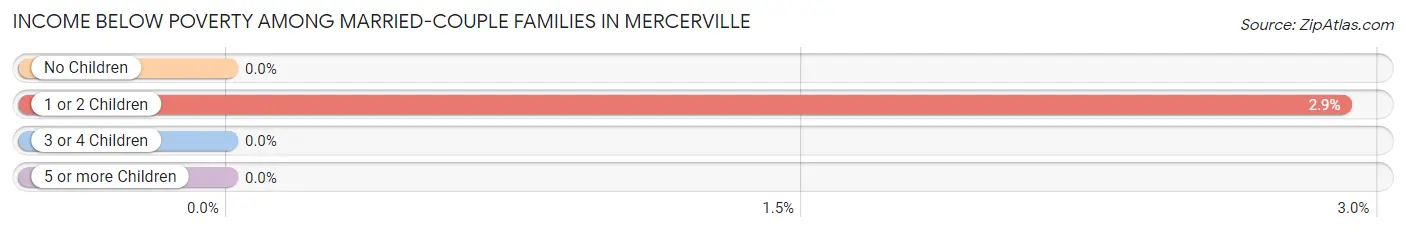
| Children | Above Poverty | Below Poverty |
| No Children | 1,897 (100.0%) | 0 (0.0%) |
| 1 or 2 Children | 1,102 (97.1%) | 33 (2.9%) |
| 3 or 4 Children | 238 (100.0%) | 0 (0.0%) |
| 5 or more Children | 0 (0.0%) | 0 (0.0%) |
| Total | 3,237 (99.0%) | 33 (1.0%) |
Income Below Poverty Among Single-Parent Households in Mercerville
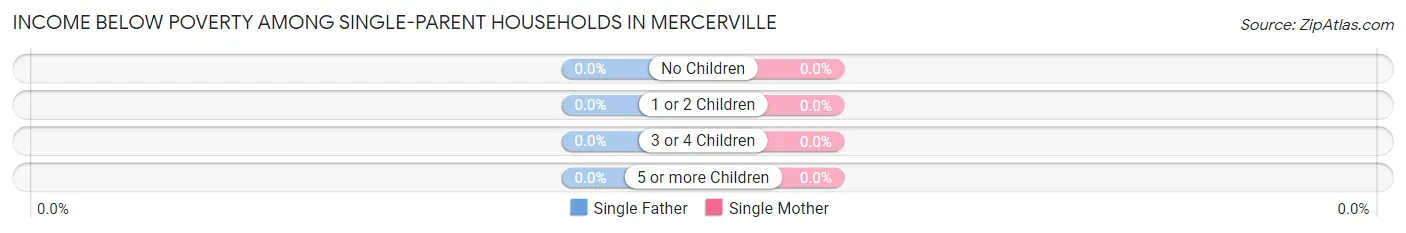
| Children | Single Father | Single Mother |
| No Children | 0 (0.0%) | 0 (0.0%) |
| 1 or 2 Children | 0 (0.0%) | 0 (0.0%) |
| 3 or 4 Children | 0 (0.0%) | 0 (0.0%) |
| 5 or more Children | 0 (0.0%) | 0 (0.0%) |
| Total | 0 (0.0%) | 0 (0.0%) |
Income Below Poverty Among Married-Couple vs Single-Parent Households in Mercerville
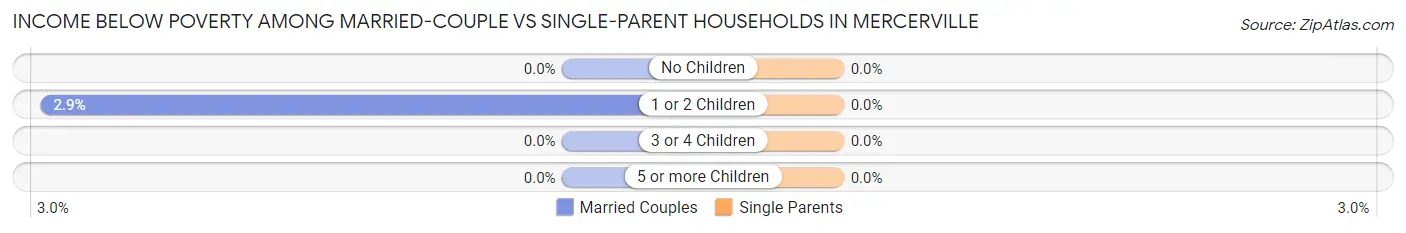
| Children | Married-Couple Families | Single-Parent Households |
| No Children | 0 (0.0%) | 0 (0.0%) |
| 1 or 2 Children | 33 (2.9%) | 0 (0.0%) |
| 3 or 4 Children | 0 (0.0%) | 0 (0.0%) |
| 5 or more Children | 0 (0.0%) | 0 (0.0%) |
| Total | 33 (1.0%) | 0 (0.0%) |
Employment Characteristics in Mercerville
Employment by Class of Employer in Mercerville
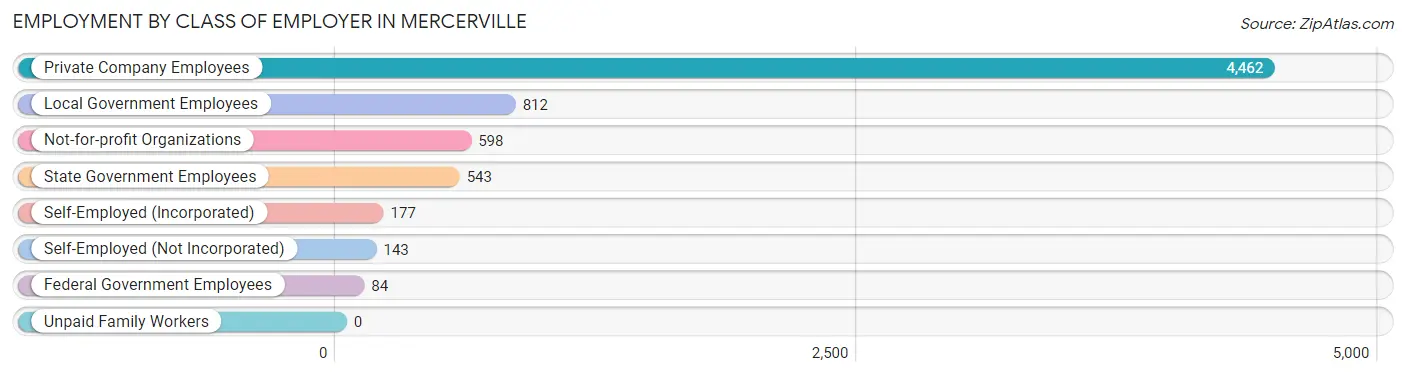
Among the 6,819 employed individuals in Mercerville, private company employees (4,462 | 65.4%), local government employees (812 | 11.9%), and not-for-profit organizations (598 | 8.8%) make up the most common classes of employment.
| Employer Class | # Employees | % Employees |
| Private Company Employees | 4,462 | 65.4% |
| Self-Employed (Incorporated) | 177 | 2.6% |
| Self-Employed (Not Incorporated) | 143 | 2.1% |
| Not-for-profit Organizations | 598 | 8.8% |
| Local Government Employees | 812 | 11.9% |
| State Government Employees | 543 | 8.0% |
| Federal Government Employees | 84 | 1.2% |
| Unpaid Family Workers | 0 | 0.0% |
| Total | 6,819 | 100.0% |
Employment Status by Age in Mercerville
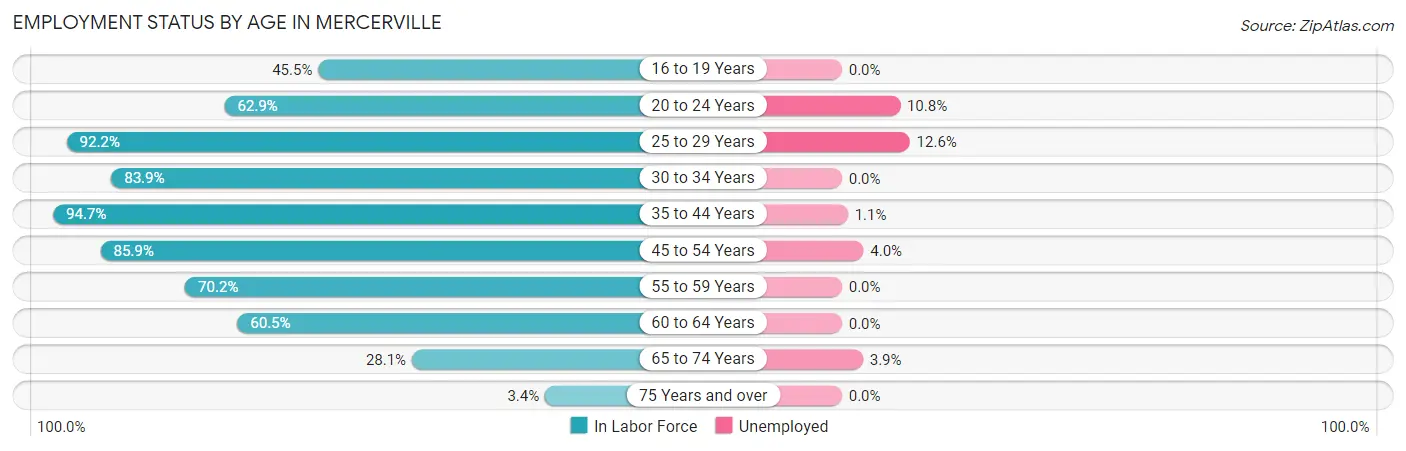
According to the labor force statistics for Mercerville, out of the total population over 16 years of age (11,592), 62.0% or 7,187 individuals are in the labor force, with 3.4% or 244 of them unemployed. The age group with the highest labor force participation rate is 35 to 44 years, with 94.7% or 1,576 individuals in the labor force. Within the labor force, the 25 to 29 years age range has the highest percentage of unemployed individuals, with 12.6% or 87 of them being unemployed.
| Age Bracket | In Labor Force | Unemployed |
| 16 to 19 Years | 280 (45.5%) | 0 (0.0%) |
| 20 to 24 Years | 538 (62.9%) | 58 (10.8%) |
| 25 to 29 Years | 688 (92.2%) | 87 (12.6%) |
| 30 to 34 Years | 759 (83.9%) | 0 (0.0%) |
| 35 to 44 Years | 1,576 (94.7%) | 17 (1.1%) |
| 45 to 54 Years | 1,593 (85.9%) | 64 (4.0%) |
| 55 to 59 Years | 725 (70.2%) | 0 (0.0%) |
| 60 to 64 Years | 543 (60.5%) | 0 (0.0%) |
| 65 to 74 Years | 438 (28.1%) | 17 (3.9%) |
| 75 Years and over | 50 (3.4%) | 0 (0.0%) |
| Total | 7,187 (62.0%) | 244 (3.4%) |
Employment Status by Educational Attainment in Mercerville
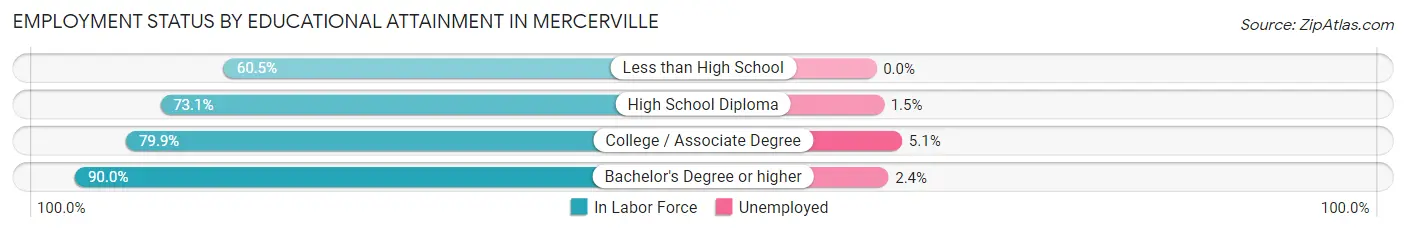
According to labor force statistics for Mercerville, 82.9% of individuals (5,886) out of the total population between 25 and 64 years of age (7,100) are in the labor force, with 2.9% or 171 of them being unemployed. The group with the highest labor force participation rate are those with the educational attainment of bachelor's degree or higher, with 90.0% or 3,211 individuals in the labor force. Within the labor force, individuals with college / associate degree education have the highest percentage of unemployment, with 5.1% or 74 of them being unemployed.
| Educational Attainment | In Labor Force | Unemployed |
| Less than High School | 170 (60.5%) | 0 (0.0%) |
| High School Diploma | 1,041 (73.1%) | 21 (1.5%) |
| College / Associate Degree | 1,460 (79.9%) | 93 (5.1%) |
| Bachelor's Degree or higher | 3,211 (90.0%) | 86 (2.4%) |
| Total | 5,886 (82.9%) | 206 (2.9%) |
Employment Occupations by Sex in Mercerville
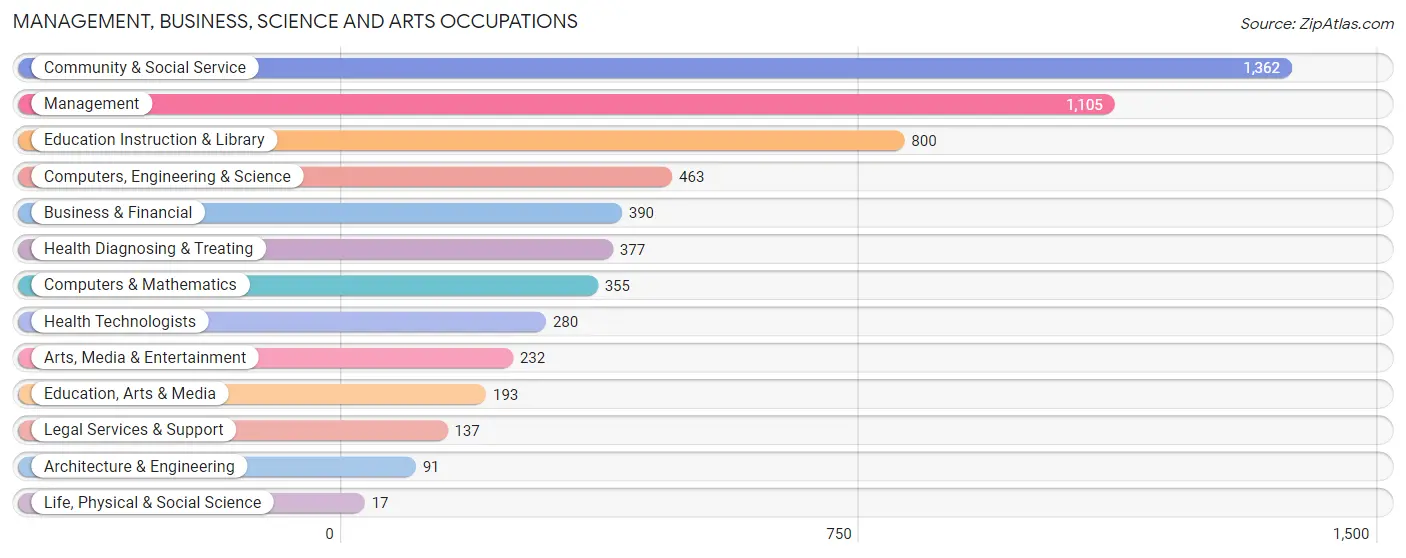
Management, Business, Science and Arts Occupations
The most common Management, Business, Science and Arts occupations in Mercerville are Community & Social Service (1,362 | 19.6%), Management (1,105 | 15.9%), Education Instruction & Library (800 | 11.5%), Computers, Engineering & Science (463 | 6.7%), and Business & Financial (390 | 5.6%).
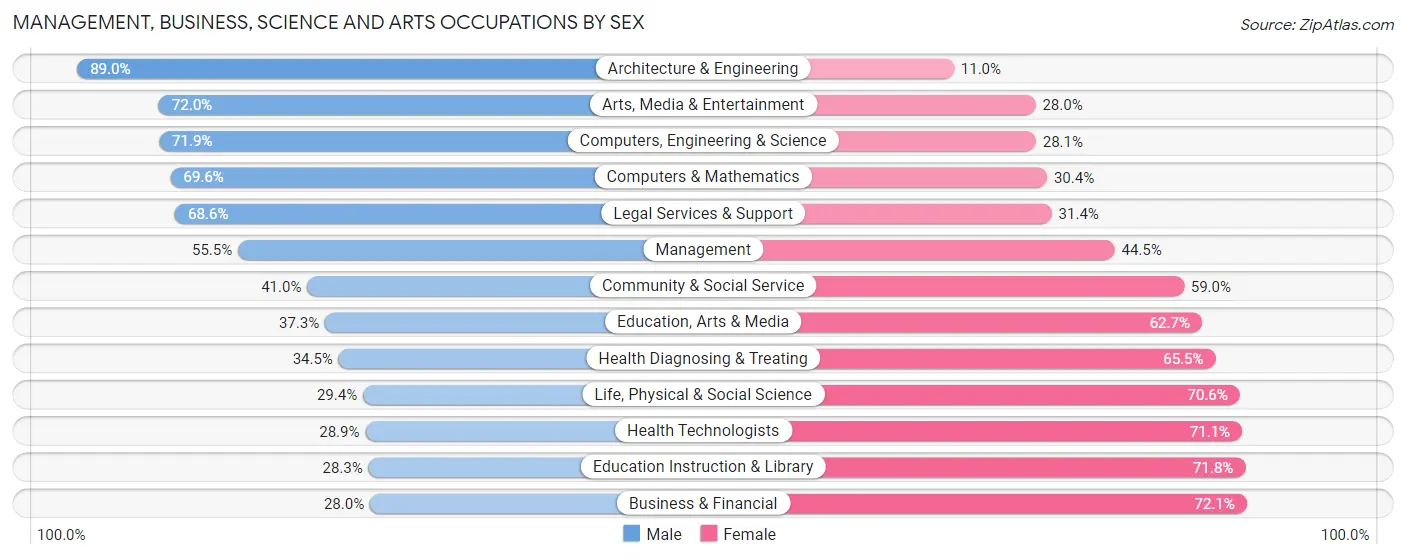
Management, Business, Science and Arts Occupations by Sex
Within the Management, Business, Science and Arts occupations in Mercerville, the most male-oriented occupations are Architecture & Engineering (89.0%), Arts, Media & Entertainment (72.0%), and Computers, Engineering & Science (71.9%), while the most female-oriented occupations are Business & Financial (72.1%), Education Instruction & Library (71.8%), and Health Technologists (71.1%).
| Occupation | Male | Female |
| Management | 613 (55.5%) | 492 (44.5%) |
| Business & Financial | 109 (28.0%) | 281 (72.1%) |
| Computers, Engineering & Science | 333 (71.9%) | 130 (28.1%) |
| Computers & Mathematics | 247 (69.6%) | 108 (30.4%) |
| Architecture & Engineering | 81 (89.0%) | 10 (11.0%) |
| Life, Physical & Social Science | 5 (29.4%) | 12 (70.6%) |
| Community & Social Service | 559 (41.0%) | 803 (59.0%) |
| Education, Arts & Media | 72 (37.3%) | 121 (62.7%) |
| Legal Services & Support | 94 (68.6%) | 43 (31.4%) |
| Education Instruction & Library | 226 (28.2%) | 574 (71.8%) |
| Arts, Media & Entertainment | 167 (72.0%) | 65 (28.0%) |
| Health Diagnosing & Treating | 130 (34.5%) | 247 (65.5%) |
| Health Technologists | 81 (28.9%) | 199 (71.1%) |
| Total (Category) | 1,744 (47.2%) | 1,953 (52.8%) |
| Total (Overall) | 3,577 (51.5%) | 3,368 (48.5%) |
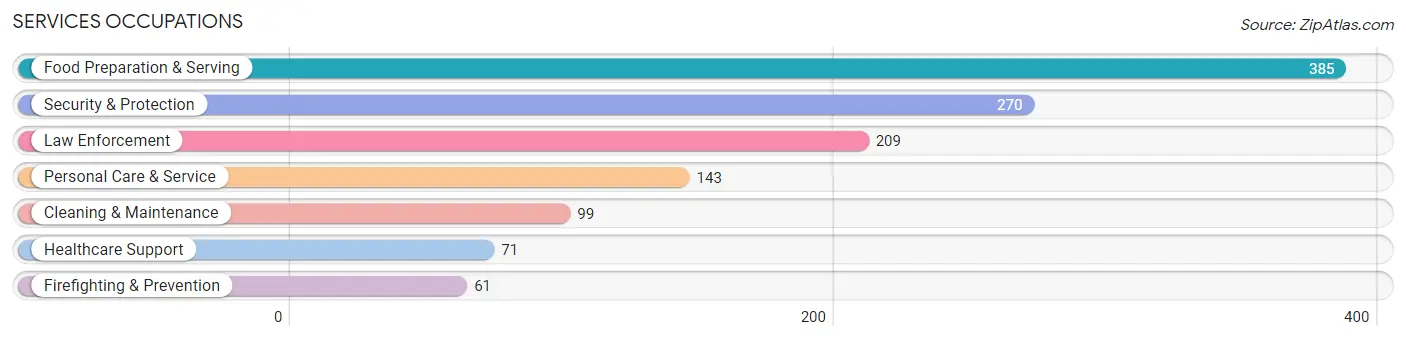
Services Occupations
The most common Services occupations in Mercerville are Food Preparation & Serving (385 | 5.5%), Security & Protection (270 | 3.9%), Law Enforcement (209 | 3.0%), Personal Care & Service (143 | 2.1%), and Cleaning & Maintenance (99 | 1.4%).
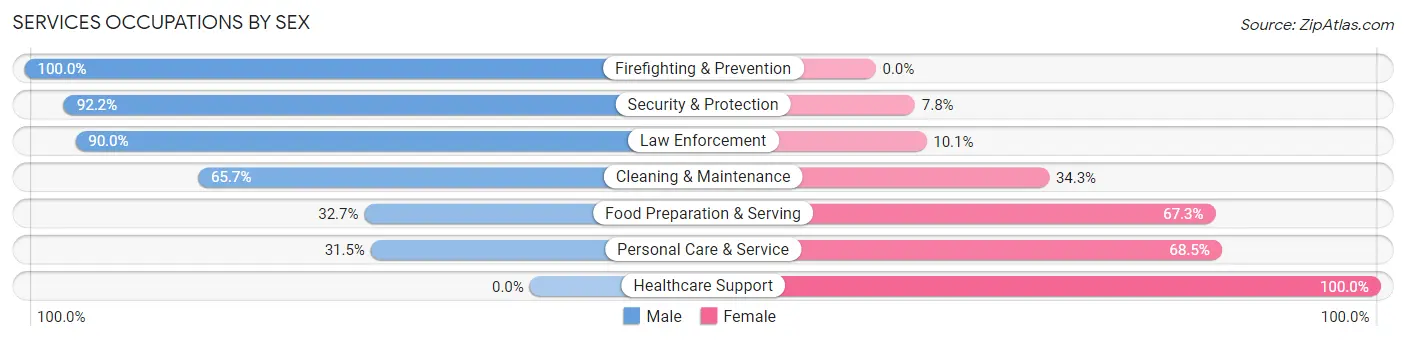
Services Occupations by Sex
Within the Services occupations in Mercerville, the most male-oriented occupations are Firefighting & Prevention (100.0%), Security & Protection (92.2%), and Law Enforcement (89.9%), while the most female-oriented occupations are Healthcare Support (100.0%), Personal Care & Service (68.5%), and Food Preparation & Serving (67.3%).
| Occupation | Male | Female |
| Healthcare Support | 0 (0.0%) | 71 (100.0%) |
| Security & Protection | 249 (92.2%) | 21 (7.8%) |
| Firefighting & Prevention | 61 (100.0%) | 0 (0.0%) |
| Law Enforcement | 188 (89.9%) | 21 (10.1%) |
| Food Preparation & Serving | 126 (32.7%) | 259 (67.3%) |
| Cleaning & Maintenance | 65 (65.7%) | 34 (34.3%) |
| Personal Care & Service | 45 (31.5%) | 98 (68.5%) |
| Total (Category) | 485 (50.1%) | 483 (49.9%) |
| Total (Overall) | 3,577 (51.5%) | 3,368 (48.5%) |
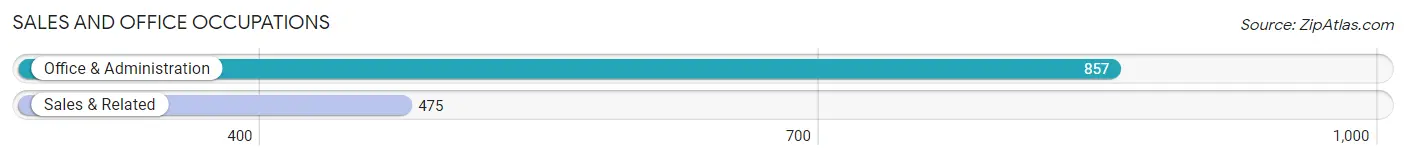
Sales and Office Occupations
The most common Sales and Office occupations in Mercerville are Office & Administration (857 | 12.3%), and Sales & Related (475 | 6.8%).
Sales and Office Occupations by Sex
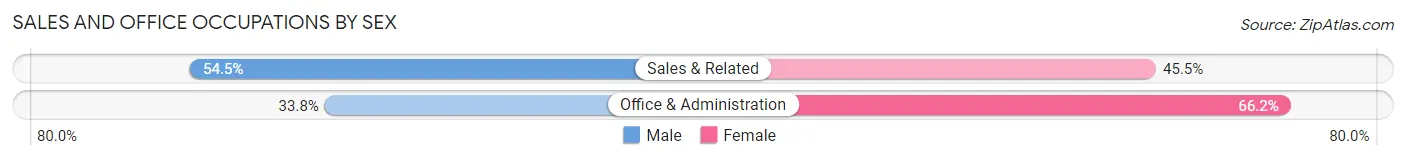
| Occupation | Male | Female |
| Sales & Related | 259 (54.5%) | 216 (45.5%) |
| Office & Administration | 290 (33.8%) | 567 (66.2%) |
| Total (Category) | 549 (41.2%) | 783 (58.8%) |
| Total (Overall) | 3,577 (51.5%) | 3,368 (48.5%) |
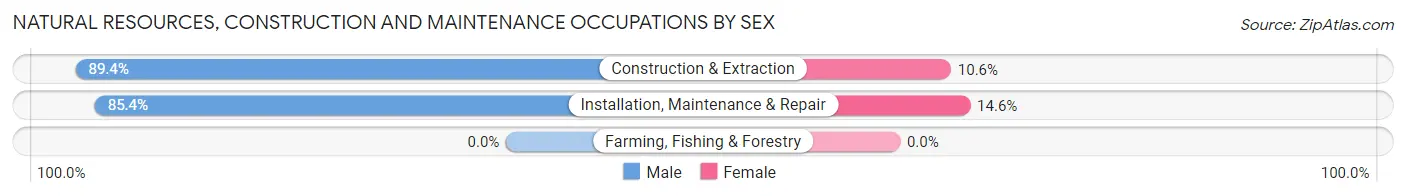
Natural Resources, Construction and Maintenance Occupations
The most common Natural Resources, Construction and Maintenance occupations in Mercerville are Construction & Extraction (302 | 4.3%), and Installation, Maintenance & Repair (89 | 1.3%).

Natural Resources, Construction and Maintenance Occupations by Sex
| Occupation | Male | Female |
| Farming, Fishing & Forestry | 0 (0.0%) | 0 (0.0%) |
| Construction & Extraction | 270 (89.4%) | 32 (10.6%) |
| Installation, Maintenance & Repair | 76 (85.4%) | 13 (14.6%) |
| Total (Category) | 346 (88.5%) | 45 (11.5%) |
| Total (Overall) | 3,577 (51.5%) | 3,368 (48.5%) |
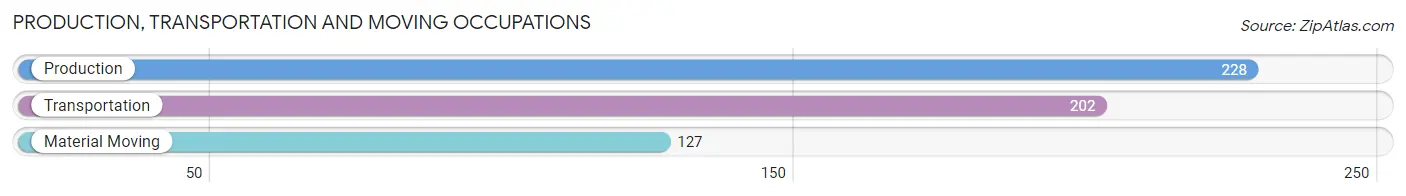
Production, Transportation and Moving Occupations
The most common Production, Transportation and Moving occupations in Mercerville are Production (228 | 3.3%), Transportation (202 | 2.9%), and Material Moving (127 | 1.8%).
Production, Transportation and Moving Occupations by Sex
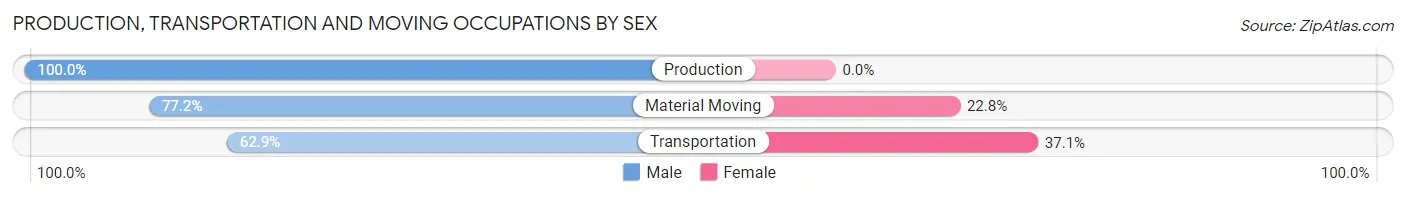
| Occupation | Male | Female |
| Production | 228 (100.0%) | 0 (0.0%) |
| Transportation | 127 (62.9%) | 75 (37.1%) |
| Material Moving | 98 (77.2%) | 29 (22.8%) |
| Total (Category) | 453 (81.3%) | 104 (18.7%) |
| Total (Overall) | 3,577 (51.5%) | 3,368 (48.5%) |
Employment Industries by Sex in Mercerville
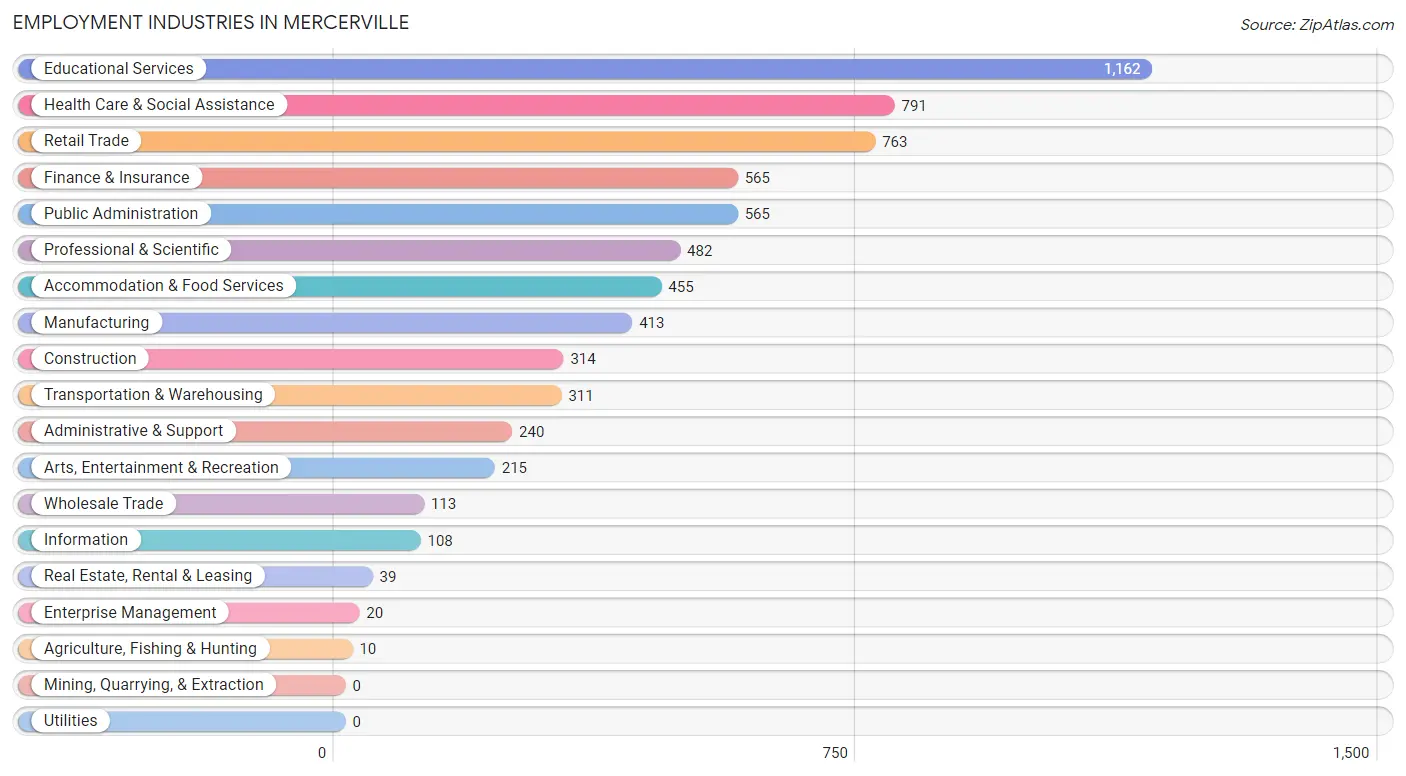
Employment Industries in Mercerville
The major employment industries in Mercerville include Educational Services (1,162 | 16.7%), Health Care & Social Assistance (791 | 11.4%), Retail Trade (763 | 11.0%), Finance & Insurance (565 | 8.1%), and Public Administration (565 | 8.1%).
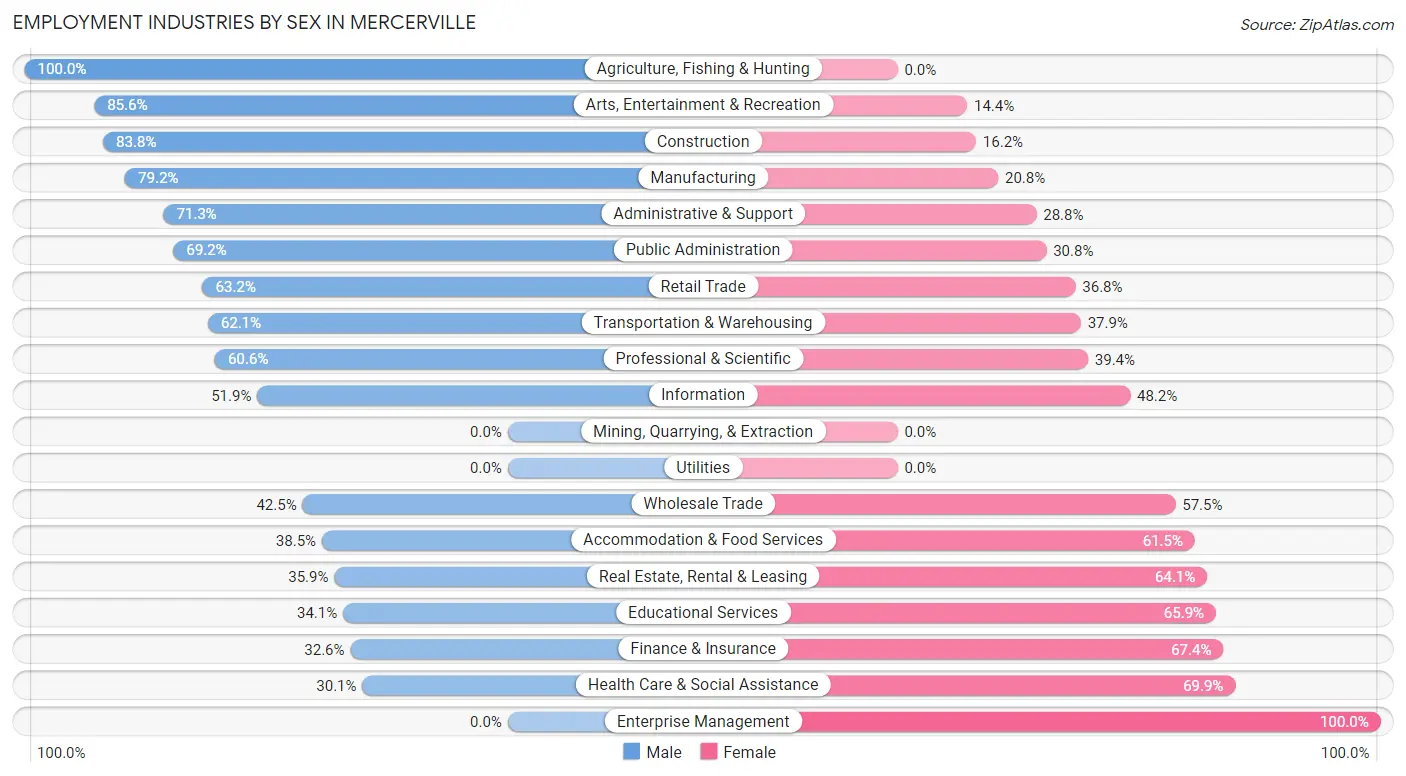
Employment Industries by Sex in Mercerville
The Mercerville industries that see more men than women are Agriculture, Fishing & Hunting (100.0%), Arts, Entertainment & Recreation (85.6%), and Construction (83.8%), whereas the industries that tend to have a higher number of women are Enterprise Management (100.0%), Health Care & Social Assistance (69.9%), and Finance & Insurance (67.4%).
| Industry | Male | Female |
| Agriculture, Fishing & Hunting | 10 (100.0%) | 0 (0.0%) |
| Mining, Quarrying, & Extraction | 0 (0.0%) | 0 (0.0%) |
| Construction | 263 (83.8%) | 51 (16.2%) |
| Manufacturing | 327 (79.2%) | 86 (20.8%) |
| Wholesale Trade | 48 (42.5%) | 65 (57.5%) |
| Retail Trade | 482 (63.2%) | 281 (36.8%) |
| Transportation & Warehousing | 193 (62.1%) | 118 (37.9%) |
| Utilities | 0 (0.0%) | 0 (0.0%) |
| Information | 56 (51.8%) | 52 (48.1%) |
| Finance & Insurance | 184 (32.6%) | 381 (67.4%) |
| Real Estate, Rental & Leasing | 14 (35.9%) | 25 (64.1%) |
| Professional & Scientific | 292 (60.6%) | 190 (39.4%) |
| Enterprise Management | 0 (0.0%) | 20 (100.0%) |
| Administrative & Support | 171 (71.3%) | 69 (28.7%) |
| Educational Services | 396 (34.1%) | 766 (65.9%) |
| Health Care & Social Assistance | 238 (30.1%) | 553 (69.9%) |
| Arts, Entertainment & Recreation | 184 (85.6%) | 31 (14.4%) |
| Accommodation & Food Services | 175 (38.5%) | 280 (61.5%) |
| Public Administration | 391 (69.2%) | 174 (30.8%) |
| Total | 3,577 (51.5%) | 3,368 (48.5%) |
Education in Mercerville
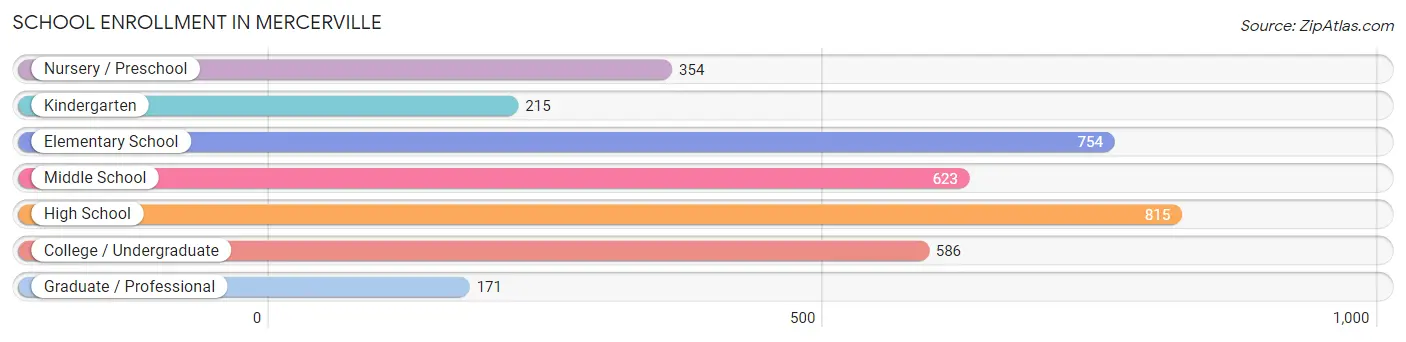
School Enrollment in Mercerville
The most common levels of schooling among the 3,518 students in Mercerville are high school (815 | 23.2%), elementary school (754 | 21.4%), and middle school (623 | 17.7%).
| School Level | # Students | % Students |
| Nursery / Preschool | 354 | 10.1% |
| Kindergarten | 215 | 6.1% |
| Elementary School | 754 | 21.4% |
| Middle School | 623 | 17.7% |
| High School | 815 | 23.2% |
| College / Undergraduate | 586 | 16.7% |
| Graduate / Professional | 171 | 4.9% |
| Total | 3,518 | 100.0% |
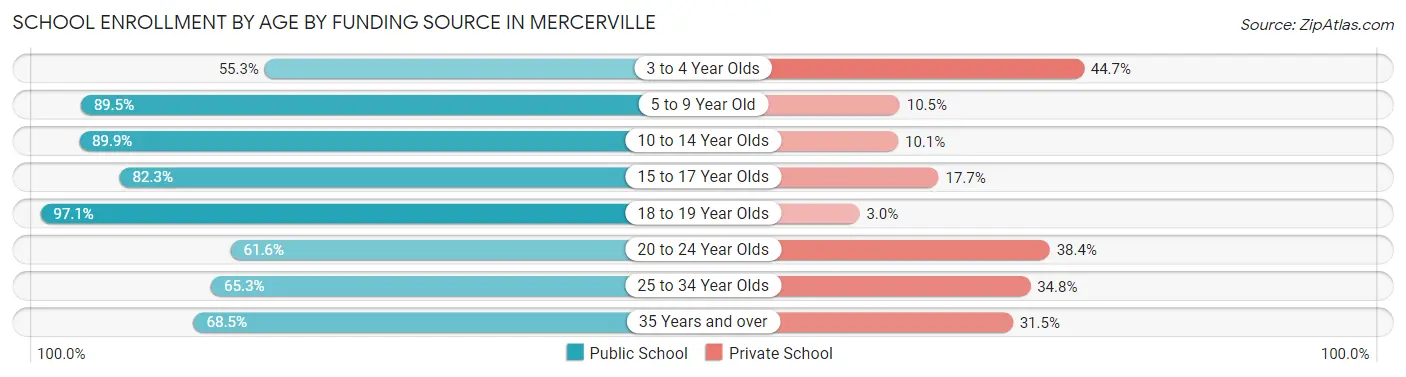
School Enrollment by Age by Funding Source in Mercerville
Out of a total of 3,518 students who are enrolled in schools in Mercerville, 651 (18.5%) attend a private institution, while the remaining 2,867 (81.5%) are enrolled in public schools. The age group of 3 to 4 year olds has the highest likelihood of being enrolled in private schools, with 144 (44.7% in the age bracket) enrolled. Conversely, the age group of 18 to 19 year olds has the lowest likelihood of being enrolled in a private school, with 263 (97.1% in the age bracket) attending a public institution.
| Age Bracket | Public School | Private School |
| 3 to 4 Year Olds | 178 (55.3%) | 144 (44.7%) |
| 5 to 9 Year Old | 839 (89.5%) | 98 (10.5%) |
| 10 to 14 Year Olds | 692 (89.9%) | 78 (10.1%) |
| 15 to 17 Year Olds | 512 (82.3%) | 110 (17.7%) |
| 18 to 19 Year Olds | 263 (97.1%) | 8 (2.9%) |
| 20 to 24 Year Olds | 183 (61.6%) | 114 (38.4%) |
| 25 to 34 Year Olds | 77 (65.2%) | 41 (34.7%) |
| 35 Years and over | 124 (68.5%) | 57 (31.5%) |
| Total | 2,867 (81.5%) | 651 (18.5%) |
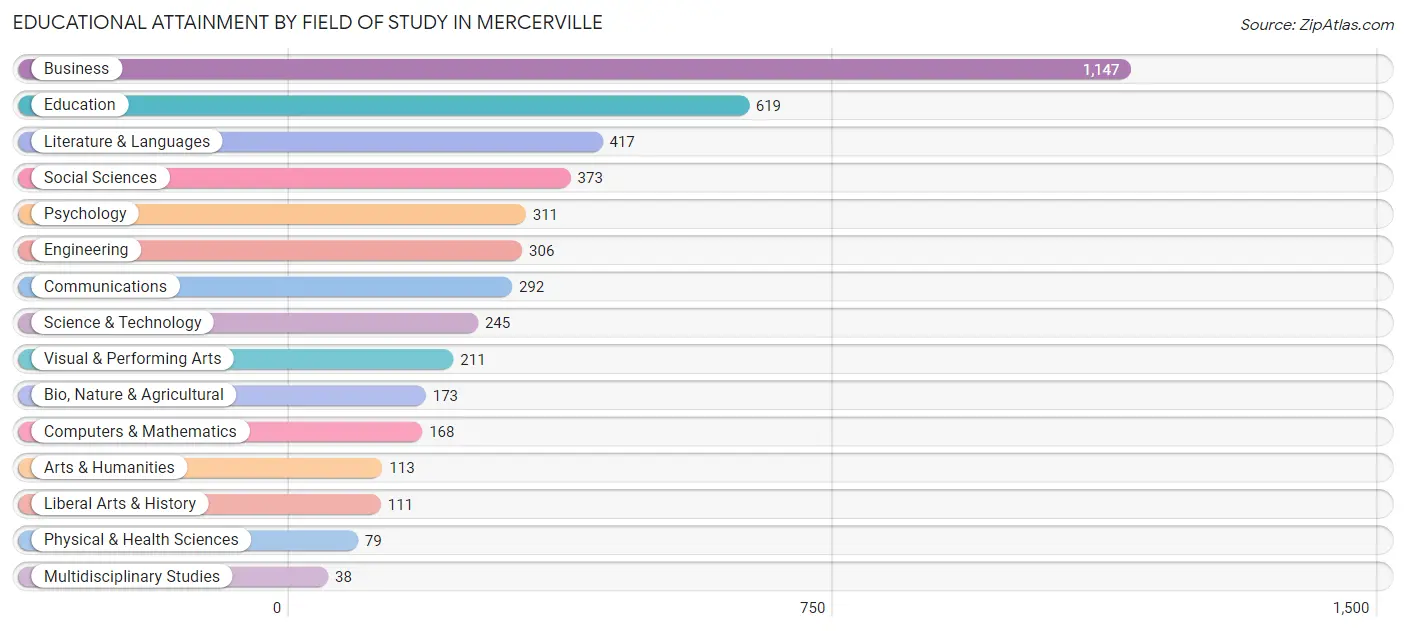
Educational Attainment by Field of Study in Mercerville
Business (1,147 | 24.9%), education (619 | 13.5%), literature & languages (417 | 9.1%), social sciences (373 | 8.1%), and psychology (311 | 6.8%) are the most common fields of study among 4,603 individuals in Mercerville who have obtained a bachelor's degree or higher.
| Field of Study | # Graduates | % Graduates |
| Computers & Mathematics | 168 | 3.6% |
| Bio, Nature & Agricultural | 173 | 3.8% |
| Physical & Health Sciences | 79 | 1.7% |
| Psychology | 311 | 6.8% |
| Social Sciences | 373 | 8.1% |
| Engineering | 306 | 6.7% |
| Multidisciplinary Studies | 38 | 0.8% |
| Science & Technology | 245 | 5.3% |
| Business | 1,147 | 24.9% |
| Education | 619 | 13.5% |
| Literature & Languages | 417 | 9.1% |
| Liberal Arts & History | 111 | 2.4% |
| Visual & Performing Arts | 211 | 4.6% |
| Communications | 292 | 6.3% |
| Arts & Humanities | 113 | 2.5% |
| Total | 4,603 | 100.0% |
Transportation & Commute in Mercerville
Vehicle Availability by Sex in Mercerville
The most prevalent vehicle ownership categories in Mercerville are males with 2 vehicles (1,936, accounting for 54.9%) and females with 2 vehicles (1,808, making up 58.7%).
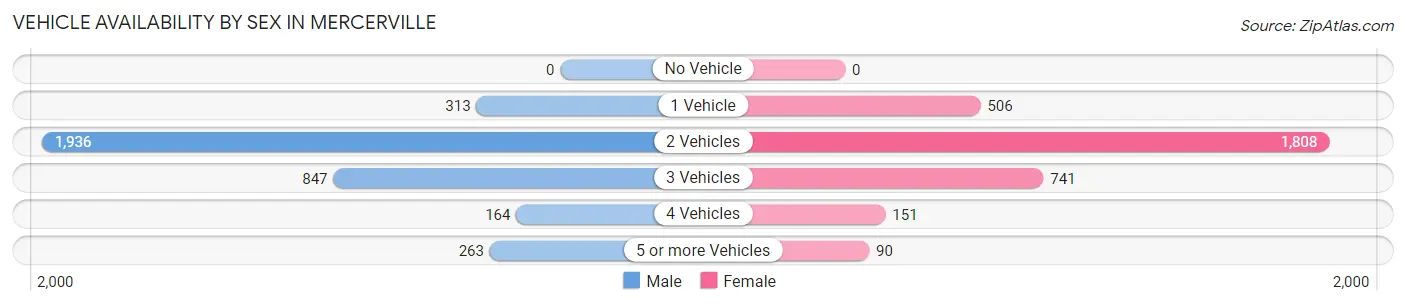
| Vehicles Available | Male | Female |
| No Vehicle | 0 (0.0%) | 0 (0.0%) |
| 1 Vehicle | 313 (8.9%) | 506 (15.3%) |
| 2 Vehicles | 1,936 (54.9%) | 1,808 (54.8%) |
| 3 Vehicles | 847 (24.0%) | 741 (22.5%) |
| 4 Vehicles | 164 (4.7%) | 151 (4.6%) |
| 5 or more Vehicles | 263 (7.5%) | 90 (2.7%) |
| Total | 3,523 (100.0%) | 3,296 (100.0%) |
Commute Time in Mercerville
The most frequently occuring commute durations in Mercerville are 20 to 24 minutes (1,263 commuters, 21.3%), 15 to 19 minutes (1,116 commuters, 18.8%), and 10 to 14 minutes (964 commuters, 16.3%).
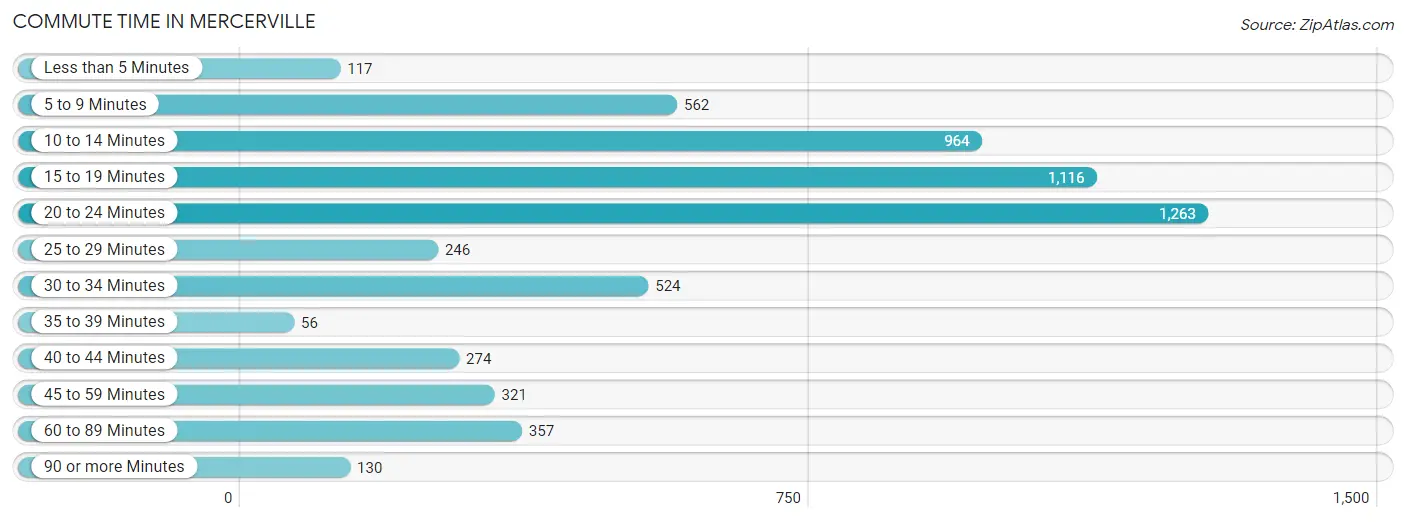
| Commute Time | # Commuters | % Commuters |
| Less than 5 Minutes | 117 | 2.0% |
| 5 to 9 Minutes | 562 | 9.5% |
| 10 to 14 Minutes | 964 | 16.3% |
| 15 to 19 Minutes | 1,116 | 18.8% |
| 20 to 24 Minutes | 1,263 | 21.3% |
| 25 to 29 Minutes | 246 | 4.2% |
| 30 to 34 Minutes | 524 | 8.8% |
| 35 to 39 Minutes | 56 | 0.9% |
| 40 to 44 Minutes | 274 | 4.6% |
| 45 to 59 Minutes | 321 | 5.4% |
| 60 to 89 Minutes | 357 | 6.0% |
| 90 or more Minutes | 130 | 2.2% |
Commute Time by Sex in Mercerville
The most common commute times in Mercerville are 20 to 24 minutes (614 commuters, 19.9%) for males and 20 to 24 minutes (649 commuters, 22.8%) for females.
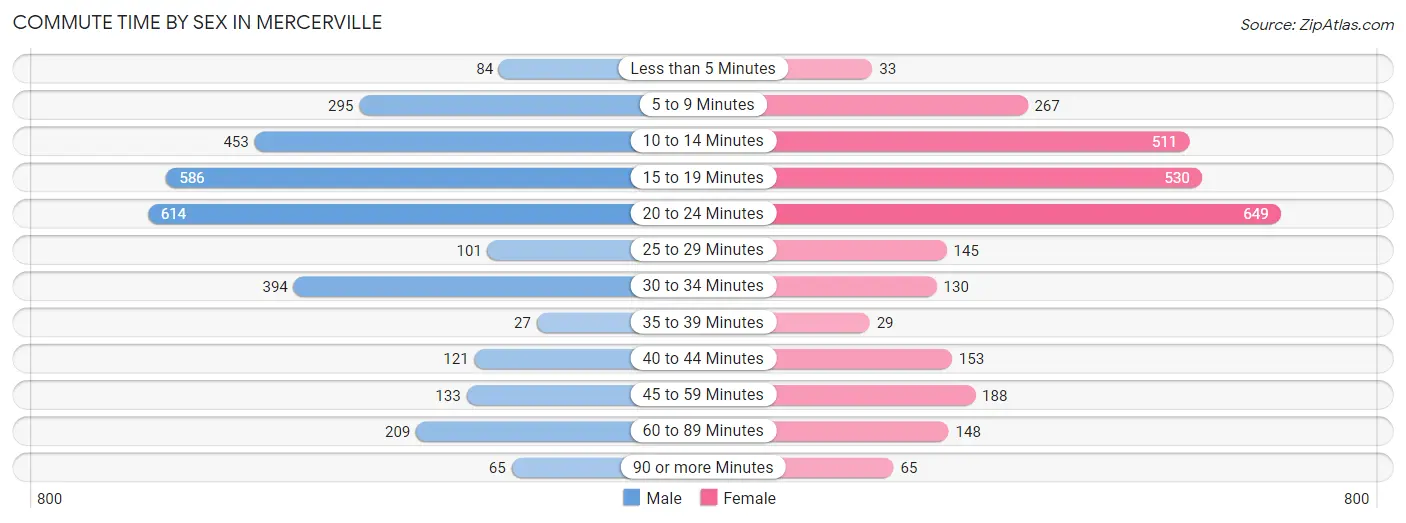
| Commute Time | Male | Female |
| Less than 5 Minutes | 84 (2.7%) | 33 (1.2%) |
| 5 to 9 Minutes | 295 (9.6%) | 267 (9.4%) |
| 10 to 14 Minutes | 453 (14.7%) | 511 (17.9%) |
| 15 to 19 Minutes | 586 (19.0%) | 530 (18.6%) |
| 20 to 24 Minutes | 614 (19.9%) | 649 (22.8%) |
| 25 to 29 Minutes | 101 (3.3%) | 145 (5.1%) |
| 30 to 34 Minutes | 394 (12.8%) | 130 (4.6%) |
| 35 to 39 Minutes | 27 (0.9%) | 29 (1.0%) |
| 40 to 44 Minutes | 121 (3.9%) | 153 (5.4%) |
| 45 to 59 Minutes | 133 (4.3%) | 188 (6.6%) |
| 60 to 89 Minutes | 209 (6.8%) | 148 (5.2%) |
| 90 or more Minutes | 65 (2.1%) | 65 (2.3%) |
Time of Departure to Work by Sex in Mercerville
The most frequent times of departure to work in Mercerville are 7:00 AM to 7:29 AM (475, 15.4%) for males and 7:00 AM to 7:29 AM (497, 17.4%) for females.
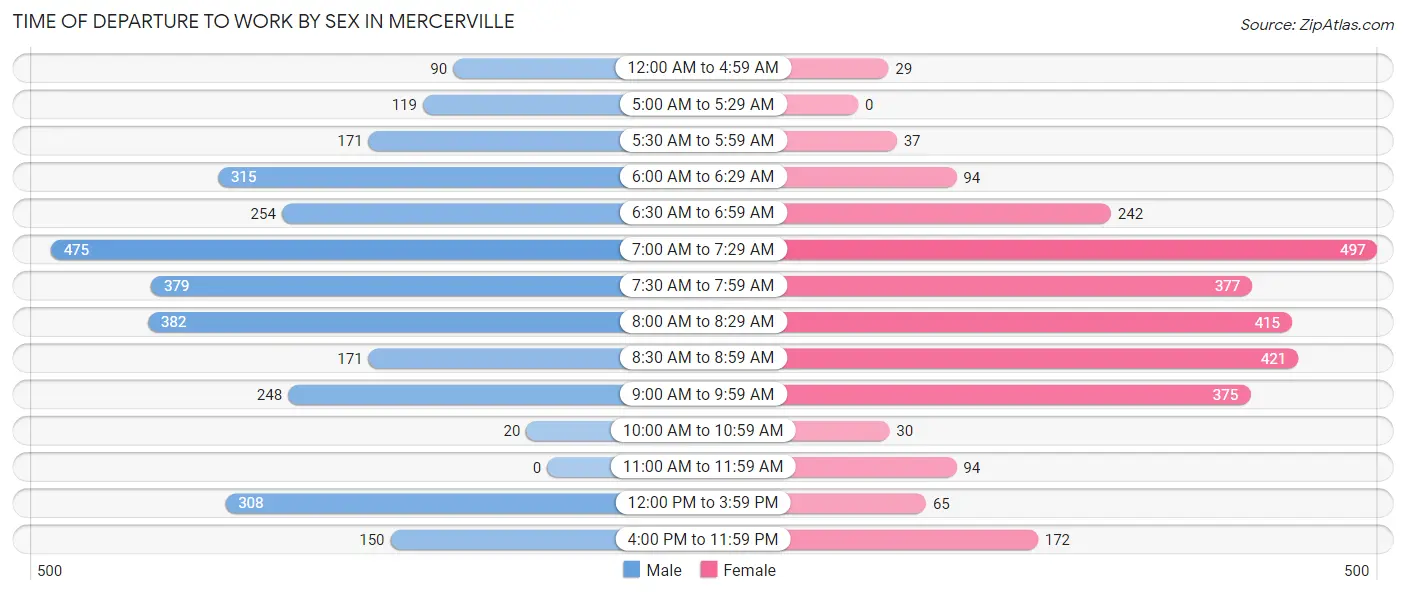
| Time of Departure | Male | Female |
| 12:00 AM to 4:59 AM | 90 (2.9%) | 29 (1.0%) |
| 5:00 AM to 5:29 AM | 119 (3.9%) | 0 (0.0%) |
| 5:30 AM to 5:59 AM | 171 (5.6%) | 37 (1.3%) |
| 6:00 AM to 6:29 AM | 315 (10.2%) | 94 (3.3%) |
| 6:30 AM to 6:59 AM | 254 (8.2%) | 242 (8.5%) |
| 7:00 AM to 7:29 AM | 475 (15.4%) | 497 (17.4%) |
| 7:30 AM to 7:59 AM | 379 (12.3%) | 377 (13.2%) |
| 8:00 AM to 8:29 AM | 382 (12.4%) | 415 (14.6%) |
| 8:30 AM to 8:59 AM | 171 (5.6%) | 421 (14.8%) |
| 9:00 AM to 9:59 AM | 248 (8.1%) | 375 (13.2%) |
| 10:00 AM to 10:59 AM | 20 (0.6%) | 30 (1.1%) |
| 11:00 AM to 11:59 AM | 0 (0.0%) | 94 (3.3%) |
| 12:00 PM to 3:59 PM | 308 (10.0%) | 65 (2.3%) |
| 4:00 PM to 11:59 PM | 150 (4.9%) | 172 (6.0%) |
| Total | 3,082 (100.0%) | 2,848 (100.0%) |
Housing Occupancy in Mercerville
Occupancy by Ownership in Mercerville
Of the total 5,057 dwellings in Mercerville, owner-occupied units account for 4,266 (84.4%), while renter-occupied units make up 791 (15.6%).
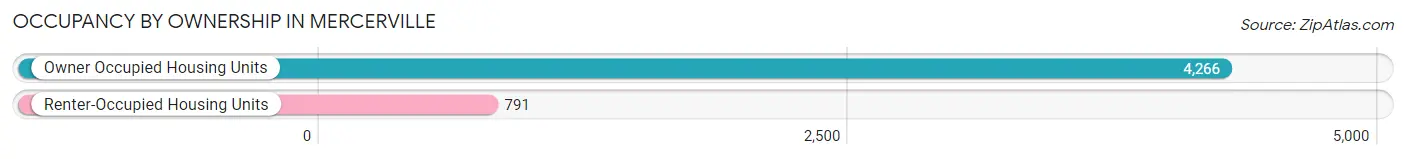
| Occupancy | # Housing Units | % Housing Units |
| Owner Occupied Housing Units | 4,266 | 84.4% |
| Renter-Occupied Housing Units | 791 | 15.6% |
| Total Occupied Housing Units | 5,057 | 100.0% |
Occupancy by Household Size in Mercerville
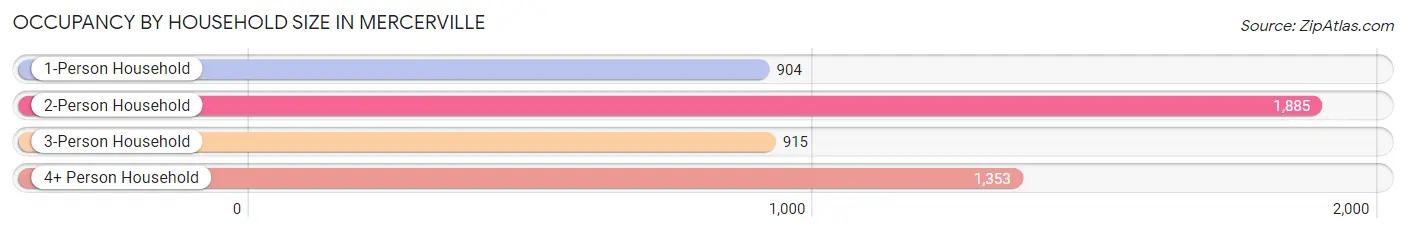
| Household Size | # Housing Units | % Housing Units |
| 1-Person Household | 904 | 17.9% |
| 2-Person Household | 1,885 | 37.3% |
| 3-Person Household | 915 | 18.1% |
| 4+ Person Household | 1,353 | 26.8% |
| Total Housing Units | 5,057 | 100.0% |
Occupancy by Ownership by Household Size in Mercerville
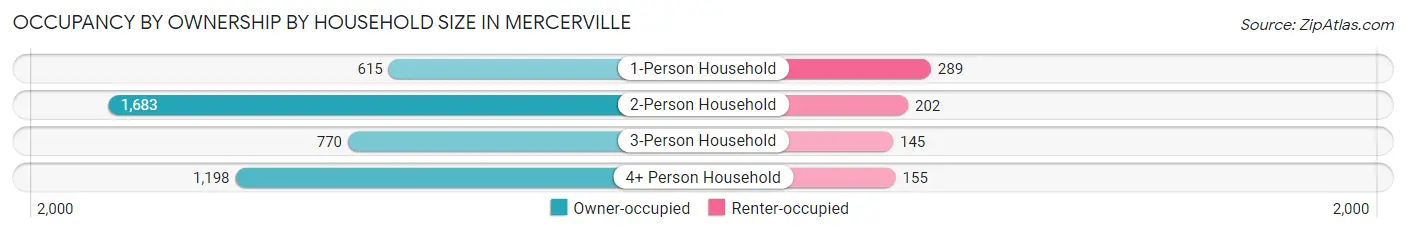
| Household Size | Owner-occupied | Renter-occupied |
| 1-Person Household | 615 (68.0%) | 289 (32.0%) |
| 2-Person Household | 1,683 (89.3%) | 202 (10.7%) |
| 3-Person Household | 770 (84.2%) | 145 (15.9%) |
| 4+ Person Household | 1,198 (88.5%) | 155 (11.5%) |
| Total Housing Units | 4,266 (84.4%) | 791 (15.6%) |
Occupancy by Educational Attainment in Mercerville
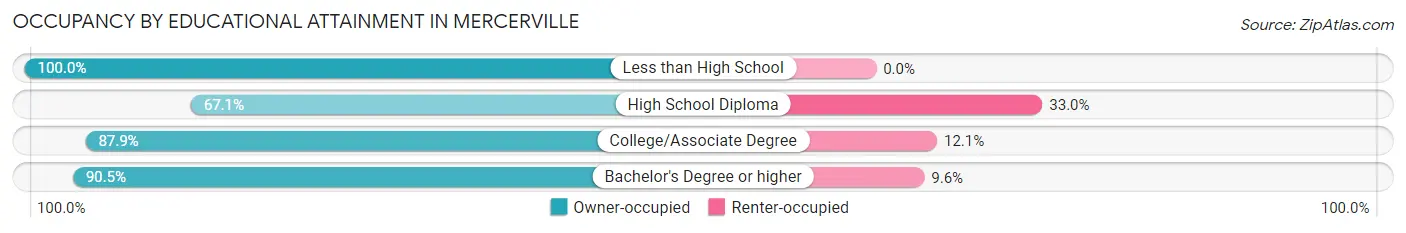
| Household Size | Owner-occupied | Renter-occupied |
| Less than High School | 124 (100.0%) | 0 (0.0%) |
| High School Diploma | 820 (67.0%) | 403 (33.0%) |
| College/Associate Degree | 1,173 (87.9%) | 161 (12.1%) |
| Bachelor's Degree or higher | 2,149 (90.4%) | 227 (9.6%) |
Occupancy by Age of Householder in Mercerville
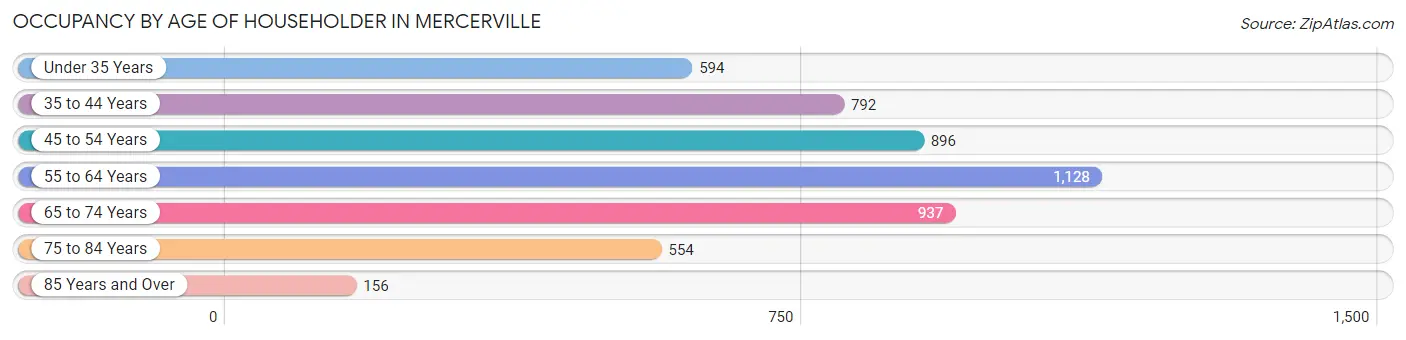
| Age Bracket | # Households | % Households |
| Under 35 Years | 594 | 11.7% |
| 35 to 44 Years | 792 | 15.7% |
| 45 to 54 Years | 896 | 17.7% |
| 55 to 64 Years | 1,128 | 22.3% |
| 65 to 74 Years | 937 | 18.5% |
| 75 to 84 Years | 554 | 11.0% |
| 85 Years and Over | 156 | 3.1% |
| Total | 5,057 | 100.0% |
Housing Finances in Mercerville
Median Income by Occupancy in Mercerville
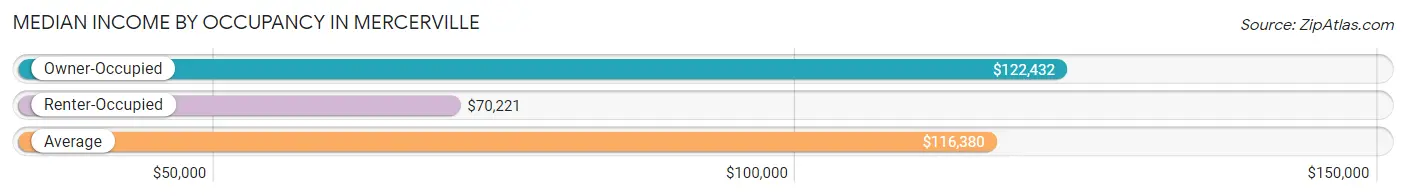
| Occupancy Type | # Households | Median Income |
| Owner-Occupied | 4,266 (84.4%) | $122,432 |
| Renter-Occupied | 791 (15.6%) | $70,221 |
| Average | 5,057 (100.0%) | $116,380 |
Occupancy by Householder Income Bracket in Mercerville
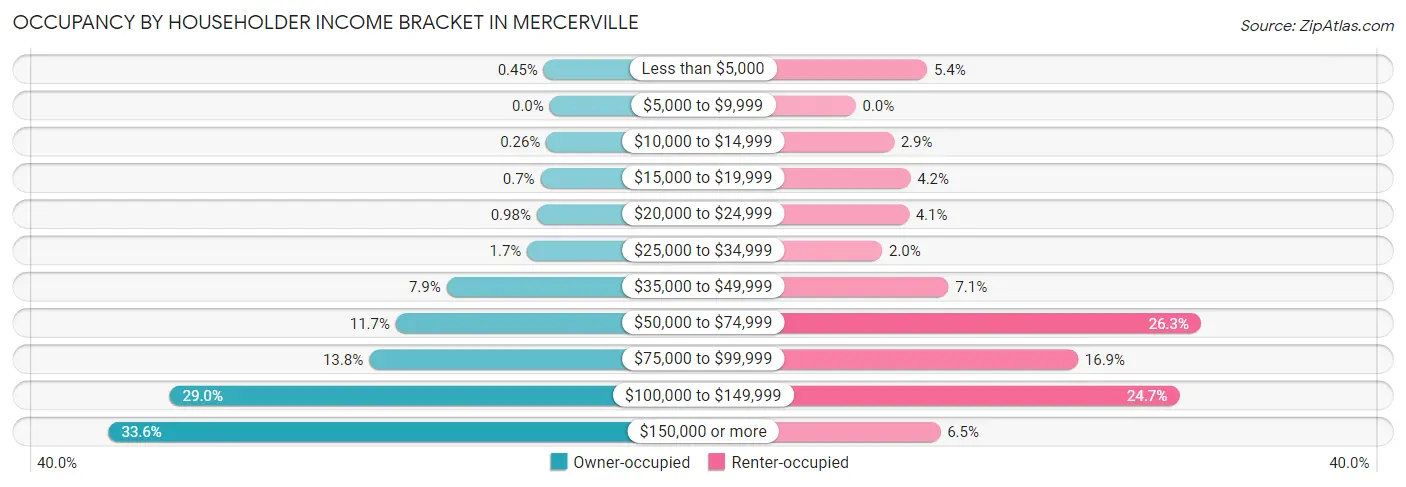
| Income Bracket | Owner-occupied | Renter-occupied |
| Less than $5,000 | 19 (0.4%) | 43 (5.4%) |
| $5,000 to $9,999 | 0 (0.0%) | 0 (0.0%) |
| $10,000 to $14,999 | 11 (0.3%) | 23 (2.9%) |
| $15,000 to $19,999 | 30 (0.7%) | 33 (4.2%) |
| $20,000 to $24,999 | 42 (1.0%) | 32 (4.1%) |
| $25,000 to $34,999 | 73 (1.7%) | 16 (2.0%) |
| $35,000 to $49,999 | 335 (7.9%) | 56 (7.1%) |
| $50,000 to $74,999 | 500 (11.7%) | 208 (26.3%) |
| $75,000 to $99,999 | 587 (13.8%) | 134 (16.9%) |
| $100,000 to $149,999 | 1,235 (28.9%) | 195 (24.6%) |
| $150,000 or more | 1,434 (33.6%) | 51 (6.5%) |
| Total | 4,266 (100.0%) | 791 (100.0%) |
Monthly Housing Cost Tiers in Mercerville
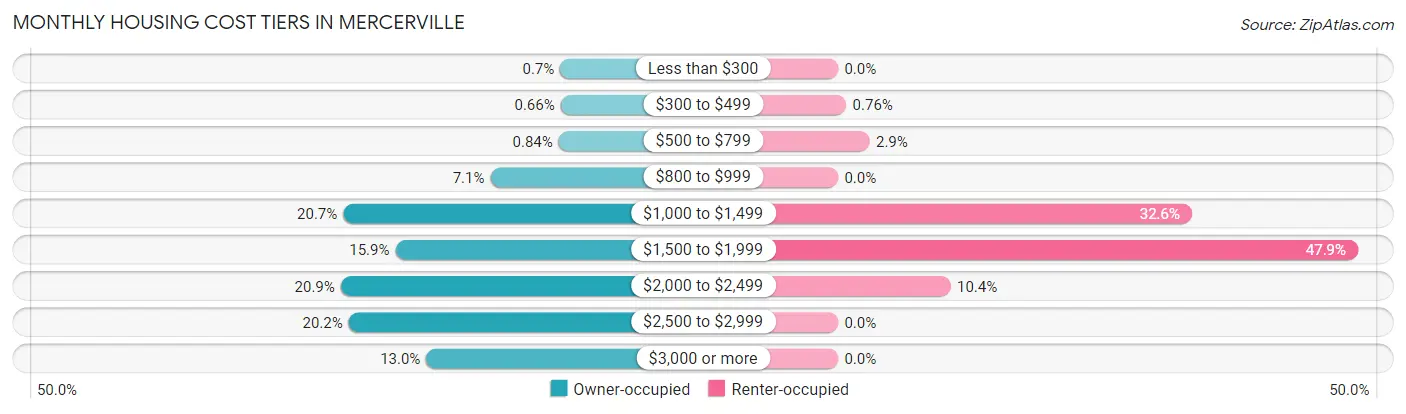
| Monthly Cost | Owner-occupied | Renter-occupied |
| Less than $300 | 30 (0.7%) | 0 (0.0%) |
| $300 to $499 | 28 (0.7%) | 6 (0.8%) |
| $500 to $799 | 36 (0.8%) | 23 (2.9%) |
| $800 to $999 | 304 (7.1%) | 0 (0.0%) |
| $1,000 to $1,499 | 882 (20.7%) | 258 (32.6%) |
| $1,500 to $1,999 | 677 (15.9%) | 379 (47.9%) |
| $2,000 to $2,499 | 892 (20.9%) | 82 (10.4%) |
| $2,500 to $2,999 | 861 (20.2%) | 0 (0.0%) |
| $3,000 or more | 556 (13.0%) | 0 (0.0%) |
| Total | 4,266 (100.0%) | 791 (100.0%) |
Physical Housing Characteristics in Mercerville
Housing Structures in Mercerville
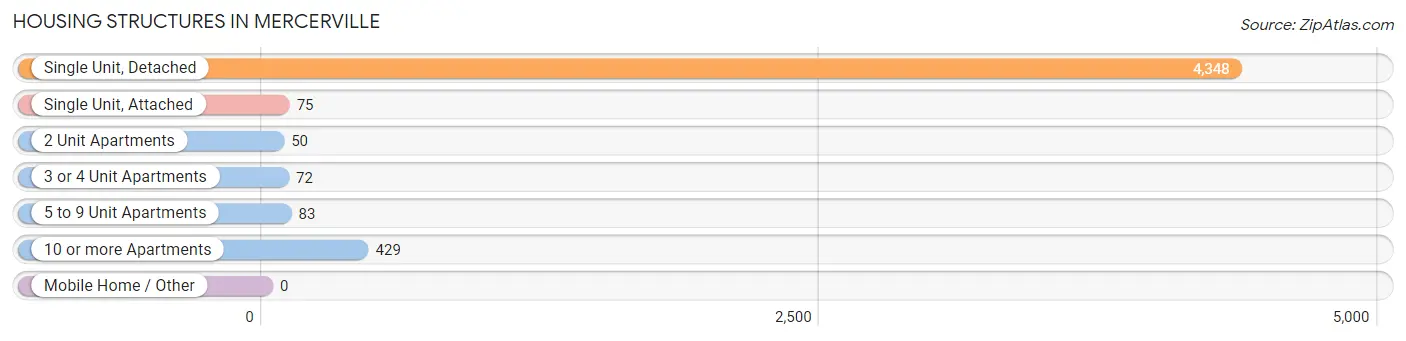
| Structure Type | # Housing Units | % Housing Units |
| Single Unit, Detached | 4,348 | 86.0% |
| Single Unit, Attached | 75 | 1.5% |
| 2 Unit Apartments | 50 | 1.0% |
| 3 or 4 Unit Apartments | 72 | 1.4% |
| 5 to 9 Unit Apartments | 83 | 1.6% |
| 10 or more Apartments | 429 | 8.5% |
| Mobile Home / Other | 0 | 0.0% |
| Total | 5,057 | 100.0% |
Housing Structures by Occupancy in Mercerville
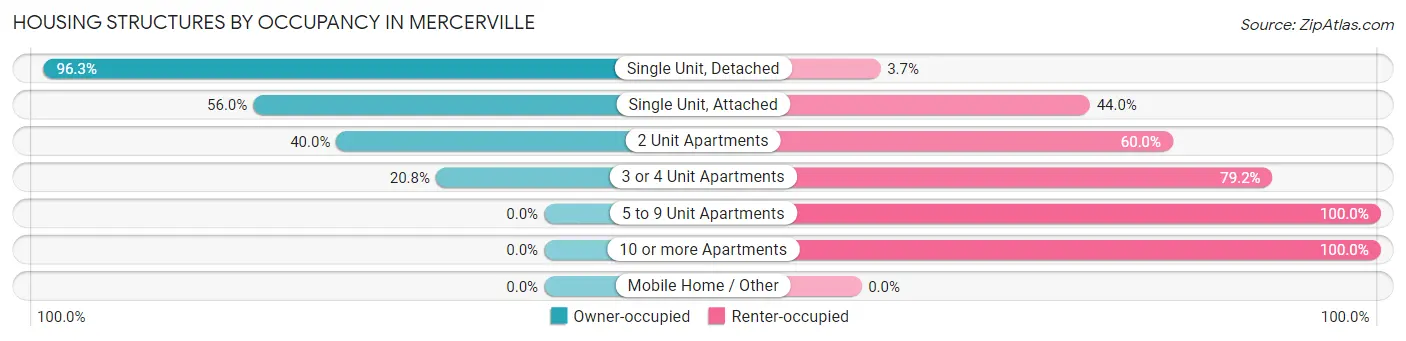
| Structure Type | Owner-occupied | Renter-occupied |
| Single Unit, Detached | 4,189 (96.3%) | 159 (3.7%) |
| Single Unit, Attached | 42 (56.0%) | 33 (44.0%) |
| 2 Unit Apartments | 20 (40.0%) | 30 (60.0%) |
| 3 or 4 Unit Apartments | 15 (20.8%) | 57 (79.2%) |
| 5 to 9 Unit Apartments | 0 (0.0%) | 83 (100.0%) |
| 10 or more Apartments | 0 (0.0%) | 429 (100.0%) |
| Mobile Home / Other | 0 (0.0%) | 0 (0.0%) |
| Total | 4,266 (84.4%) | 791 (15.6%) |
Housing Structures by Number of Rooms in Mercerville
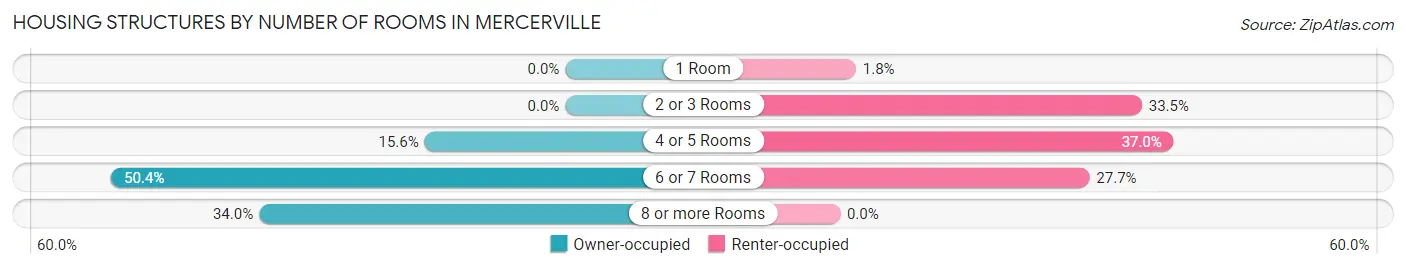
| Number of Rooms | Owner-occupied | Renter-occupied |
| 1 Room | 0 (0.0%) | 14 (1.8%) |
| 2 or 3 Rooms | 0 (0.0%) | 265 (33.5%) |
| 4 or 5 Rooms | 666 (15.6%) | 293 (37.0%) |
| 6 or 7 Rooms | 2,150 (50.4%) | 219 (27.7%) |
| 8 or more Rooms | 1,450 (34.0%) | 0 (0.0%) |
| Total | 4,266 (100.0%) | 791 (100.0%) |
Housing Structure by Heating Type in Mercerville
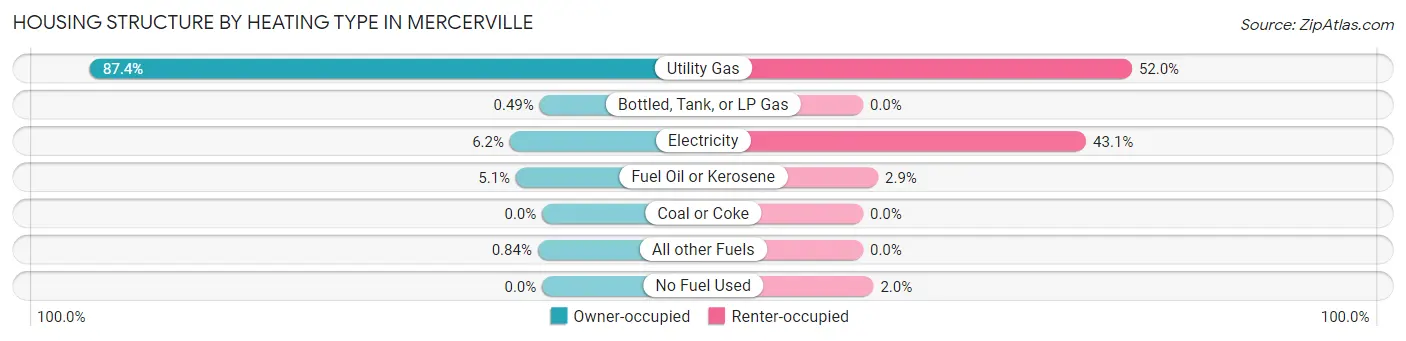
| Heating Type | Owner-occupied | Renter-occupied |
| Utility Gas | 3,727 (87.4%) | 411 (52.0%) |
| Bottled, Tank, or LP Gas | 21 (0.5%) | 0 (0.0%) |
| Electricity | 266 (6.2%) | 341 (43.1%) |
| Fuel Oil or Kerosene | 216 (5.1%) | 23 (2.9%) |
| Coal or Coke | 0 (0.0%) | 0 (0.0%) |
| All other Fuels | 36 (0.8%) | 0 (0.0%) |
| No Fuel Used | 0 (0.0%) | 16 (2.0%) |
| Total | 4,266 (100.0%) | 791 (100.0%) |
Household Vehicle Usage in Mercerville
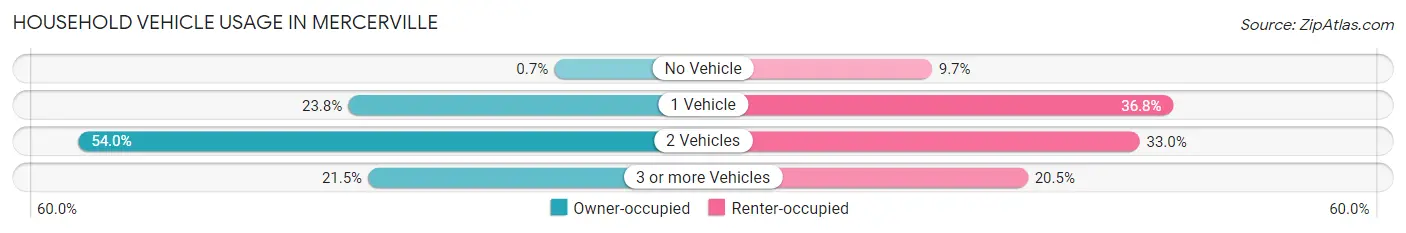
| Vehicles per Household | Owner-occupied | Renter-occupied |
| No Vehicle | 30 (0.7%) | 77 (9.7%) |
| 1 Vehicle | 1,014 (23.8%) | 291 (36.8%) |
| 2 Vehicles | 2,303 (54.0%) | 261 (33.0%) |
| 3 or more Vehicles | 919 (21.5%) | 162 (20.5%) |
| Total | 4,266 (100.0%) | 791 (100.0%) |
Real Estate & Mortgages in Mercerville
Real Estate and Mortgage Overview in Mercerville
| Characteristic | Without Mortgage | With Mortgage |
| Housing Units | 1,221 | 3,045 |
| Median Property Value | $317,400 | $305,000 |
| Median Household Income | $98,201 | $1,027 |
| Monthly Housing Costs | $1,128 | $556 |
| Real Estate Taxes | $8,677 | $0 |
Property Value by Mortgage Status in Mercerville
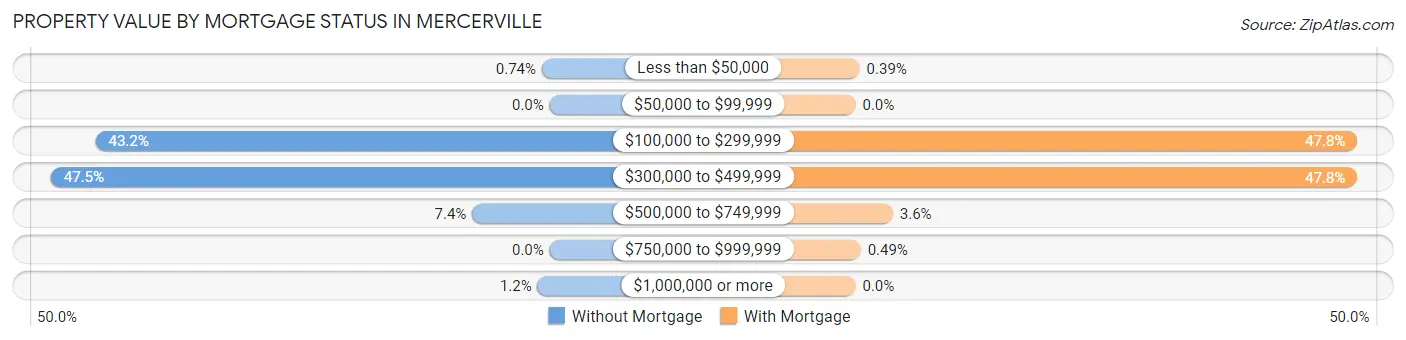
| Property Value | Without Mortgage | With Mortgage |
| Less than $50,000 | 9 (0.7%) | 12 (0.4%) |
| $50,000 to $99,999 | 0 (0.0%) | 0 (0.0%) |
| $100,000 to $299,999 | 528 (43.2%) | 1,455 (47.8%) |
| $300,000 to $499,999 | 580 (47.5%) | 1,455 (47.8%) |
| $500,000 to $749,999 | 90 (7.4%) | 108 (3.5%) |
| $750,000 to $999,999 | 0 (0.0%) | 15 (0.5%) |
| $1,000,000 or more | 14 (1.1%) | 0 (0.0%) |
| Total | 1,221 (100.0%) | 3,045 (100.0%) |
Household Income by Mortgage Status in Mercerville
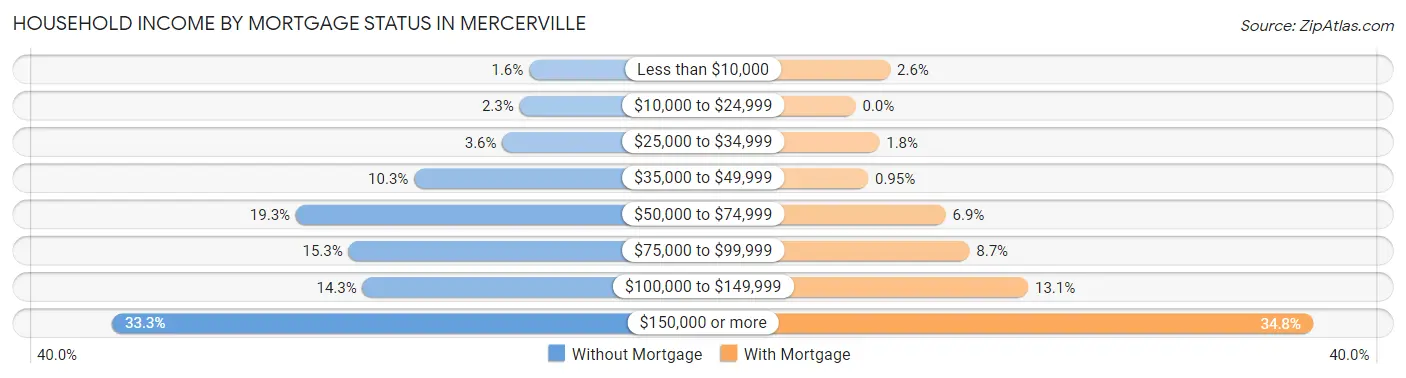
| Household Income | Without Mortgage | With Mortgage |
| Less than $10,000 | 19 (1.6%) | 80 (2.6%) |
| $10,000 to $24,999 | 28 (2.3%) | 0 (0.0%) |
| $25,000 to $34,999 | 44 (3.6%) | 55 (1.8%) |
| $35,000 to $49,999 | 126 (10.3%) | 29 (0.9%) |
| $50,000 to $74,999 | 236 (19.3%) | 209 (6.9%) |
| $75,000 to $99,999 | 187 (15.3%) | 264 (8.7%) |
| $100,000 to $149,999 | 174 (14.2%) | 400 (13.1%) |
| $150,000 or more | 407 (33.3%) | 1,061 (34.8%) |
| Total | 1,221 (100.0%) | 3,045 (100.0%) |
Property Value to Household Income Ratio in Mercerville
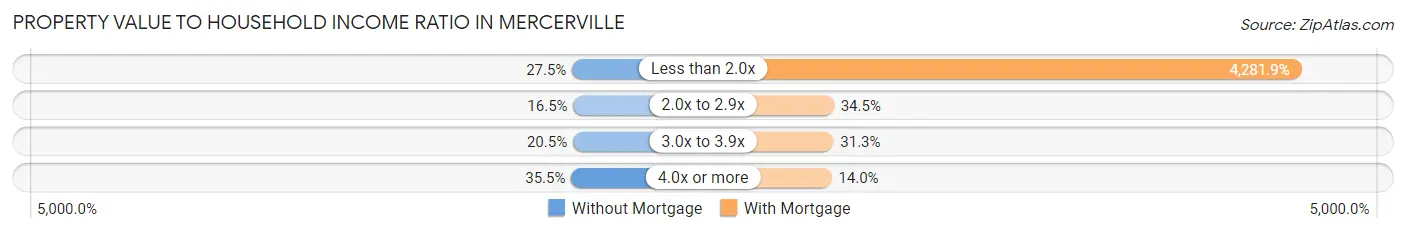
| Value-to-Income Ratio | Without Mortgage | With Mortgage |
| Less than 2.0x | 336 (27.5%) | 130,385 (4,281.9%) |
| 2.0x to 2.9x | 202 (16.5%) | 1,049 (34.4%) |
| 3.0x to 3.9x | 250 (20.5%) | 952 (31.3%) |
| 4.0x or more | 433 (35.5%) | 425 (14.0%) |
| Total | 1,221 (100.0%) | 3,045 (100.0%) |
Real Estate Taxes by Mortgage Status in Mercerville
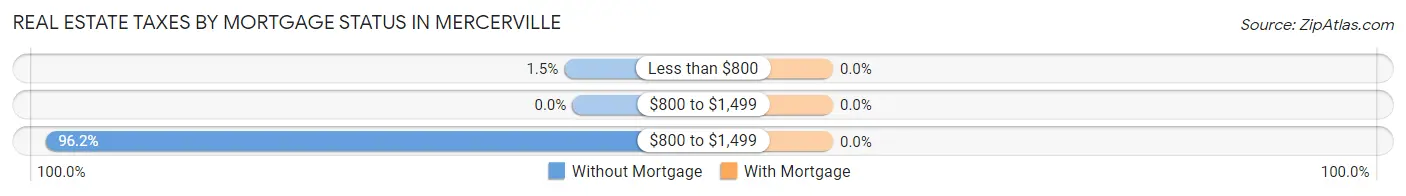
| Property Taxes | Without Mortgage | With Mortgage |
| Less than $800 | 18 (1.5%) | 0 (0.0%) |
| $800 to $1,499 | 0 (0.0%) | 0 (0.0%) |
| $800 to $1,499 | 1,175 (96.2%) | 0 (0.0%) |
| Total | 1,221 (100.0%) | 3,045 (100.0%) |
Health & Disability in Mercerville
Health Insurance Coverage by Age in Mercerville
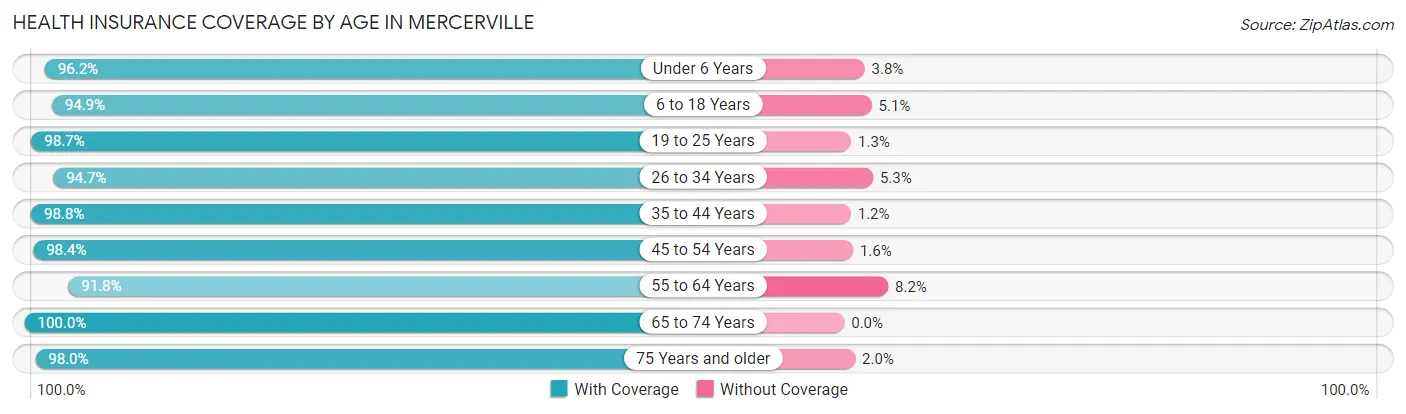
| Age Bracket | With Coverage | Without Coverage |
| Under 6 Years | 838 (96.2%) | 33 (3.8%) |
| 6 to 18 Years | 2,221 (94.9%) | 119 (5.1%) |
| 19 to 25 Years | 1,169 (98.7%) | 15 (1.3%) |
| 26 to 34 Years | 1,419 (94.7%) | 80 (5.3%) |
| 35 to 44 Years | 1,633 (98.8%) | 20 (1.2%) |
| 45 to 54 Years | 1,824 (98.4%) | 30 (1.6%) |
| 55 to 64 Years | 1,765 (91.8%) | 157 (8.2%) |
| 65 to 74 Years | 1,500 (100.0%) | 0 (0.0%) |
| 75 Years and older | 1,218 (98.0%) | 25 (2.0%) |
| Total | 13,587 (96.6%) | 479 (3.4%) |
Health Insurance Coverage by Citizenship Status in Mercerville
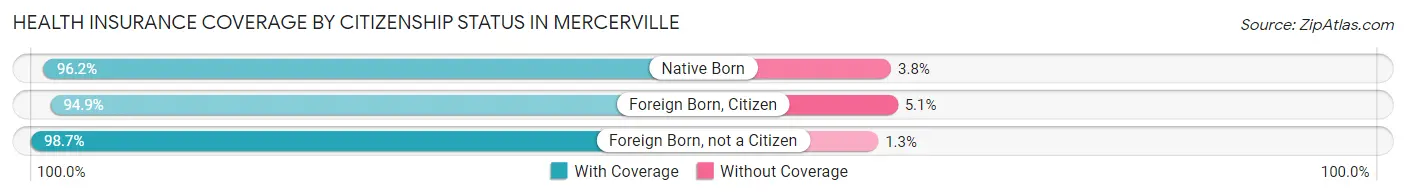
| Citizenship Status | With Coverage | Without Coverage |
| Native Born | 838 (96.2%) | 33 (3.8%) |
| Foreign Born, Citizen | 2,221 (94.9%) | 119 (5.1%) |
| Foreign Born, not a Citizen | 1,169 (98.7%) | 15 (1.3%) |
Health Insurance Coverage by Household Income in Mercerville
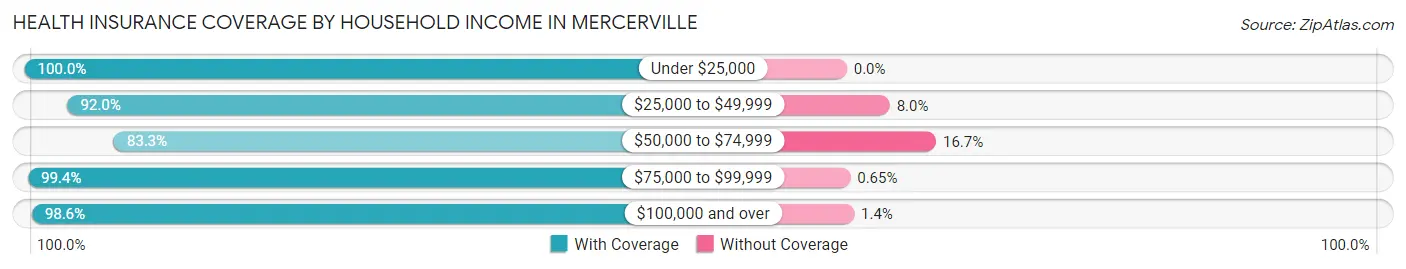
| Household Income | With Coverage | Without Coverage |
| Under $25,000 | 336 (100.0%) | 0 (0.0%) |
| $25,000 to $49,999 | 881 (92.0%) | 77 (8.0%) |
| $50,000 to $74,999 | 1,294 (83.3%) | 260 (16.7%) |
| $75,000 to $99,999 | 1,536 (99.4%) | 10 (0.6%) |
| $100,000 and over | 9,495 (98.6%) | 132 (1.4%) |
Public vs Private Health Insurance Coverage by Age in Mercerville
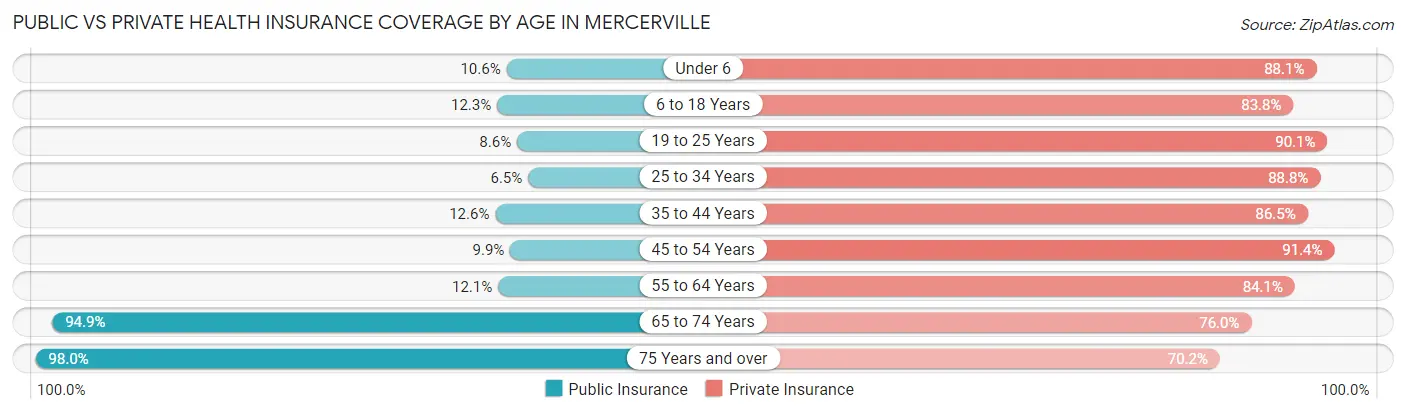
| Age Bracket | Public Insurance | Private Insurance |
| Under 6 | 92 (10.6%) | 767 (88.1%) |
| 6 to 18 Years | 288 (12.3%) | 1,961 (83.8%) |
| 19 to 25 Years | 102 (8.6%) | 1,067 (90.1%) |
| 25 to 34 Years | 98 (6.5%) | 1,331 (88.8%) |
| 35 to 44 Years | 209 (12.6%) | 1,429 (86.5%) |
| 45 to 54 Years | 183 (9.9%) | 1,695 (91.4%) |
| 55 to 64 Years | 233 (12.1%) | 1,616 (84.1%) |
| 65 to 74 Years | 1,423 (94.9%) | 1,140 (76.0%) |
| 75 Years and over | 1,218 (98.0%) | 872 (70.2%) |
| Total | 3,846 (27.3%) | 11,878 (84.4%) |
Disability Status by Sex by Age in Mercerville
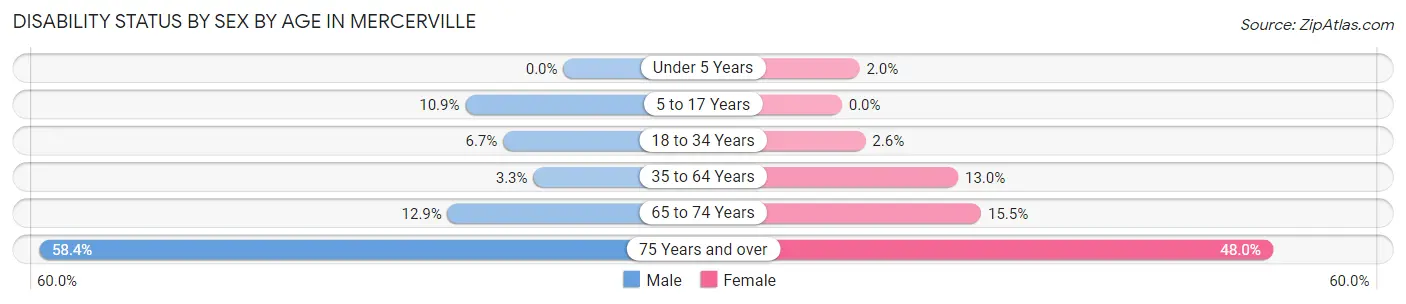
| Age Bracket | Male | Female |
| Under 5 Years | 0 (0.0%) | 9 (2.0%) |
| 5 to 17 Years | 130 (10.9%) | 0 (0.0%) |
| 18 to 34 Years | 93 (6.7%) | 37 (2.6%) |
| 35 to 64 Years | 89 (3.3%) | 358 (13.0%) |
| 65 to 74 Years | 82 (12.9%) | 134 (15.5%) |
| 75 Years and over | 351 (58.4%) | 308 (48.0%) |
Disability Class by Sex by Age in Mercerville
Disability Class: Hearing Difficulty
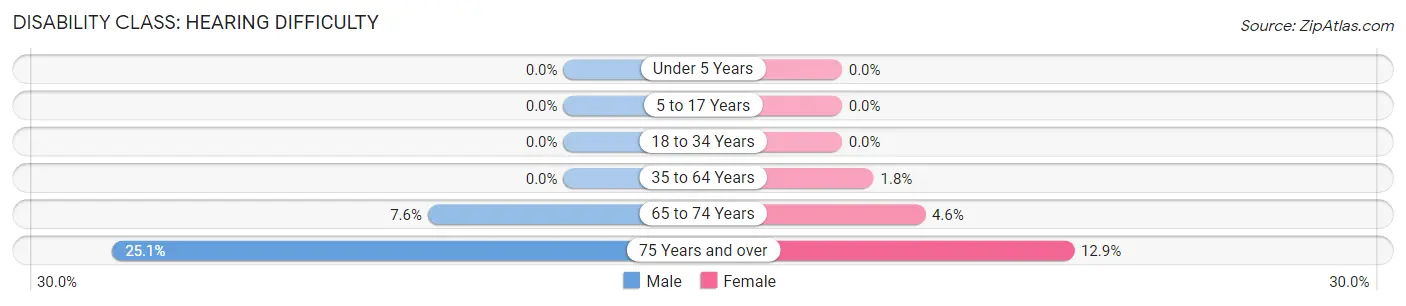
| Age Bracket | Male | Female |
| Under 5 Years | 0 (0.0%) | 0 (0.0%) |
| 5 to 17 Years | 0 (0.0%) | 0 (0.0%) |
| 18 to 34 Years | 0 (0.0%) | 0 (0.0%) |
| 35 to 64 Years | 0 (0.0%) | 49 (1.8%) |
| 65 to 74 Years | 48 (7.5%) | 40 (4.6%) |
| 75 Years and over | 151 (25.1%) | 83 (12.9%) |
Disability Class: Vision Difficulty
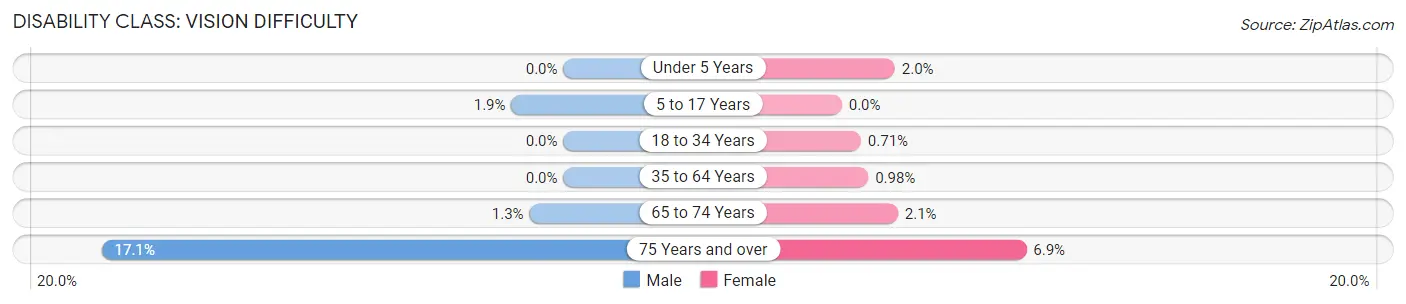
| Age Bracket | Male | Female |
| Under 5 Years | 0 (0.0%) | 9 (2.0%) |
| 5 to 17 Years | 23 (1.9%) | 0 (0.0%) |
| 18 to 34 Years | 0 (0.0%) | 10 (0.7%) |
| 35 to 64 Years | 0 (0.0%) | 27 (1.0%) |
| 65 to 74 Years | 8 (1.3%) | 18 (2.1%) |
| 75 Years and over | 103 (17.1%) | 44 (6.9%) |
Disability Class: Cognitive Difficulty
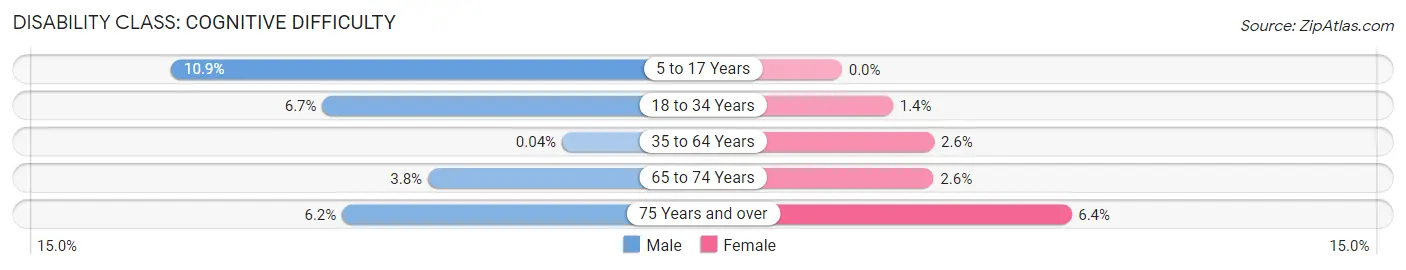
| Age Bracket | Male | Female |
| 5 to 17 Years | 130 (10.9%) | 0 (0.0%) |
| 18 to 34 Years | 93 (6.7%) | 20 (1.4%) |
| 35 to 64 Years | 1 (0.0%) | 71 (2.6%) |
| 65 to 74 Years | 24 (3.8%) | 22 (2.5%) |
| 75 Years and over | 37 (6.2%) | 41 (6.4%) |
Disability Class: Ambulatory Difficulty
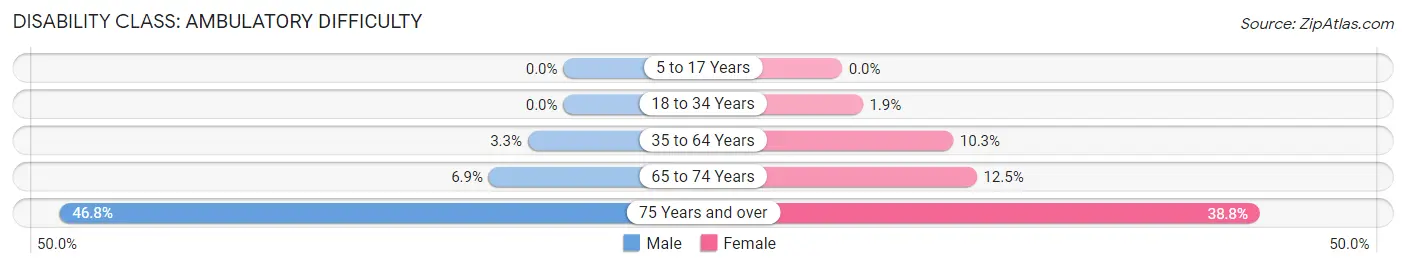
| Age Bracket | Male | Female |
| 5 to 17 Years | 0 (0.0%) | 0 (0.0%) |
| 18 to 34 Years | 0 (0.0%) | 27 (1.9%) |
| 35 to 64 Years | 88 (3.3%) | 285 (10.3%) |
| 65 to 74 Years | 44 (6.9%) | 108 (12.5%) |
| 75 Years and over | 281 (46.8%) | 249 (38.8%) |
Disability Class: Self-Care Difficulty
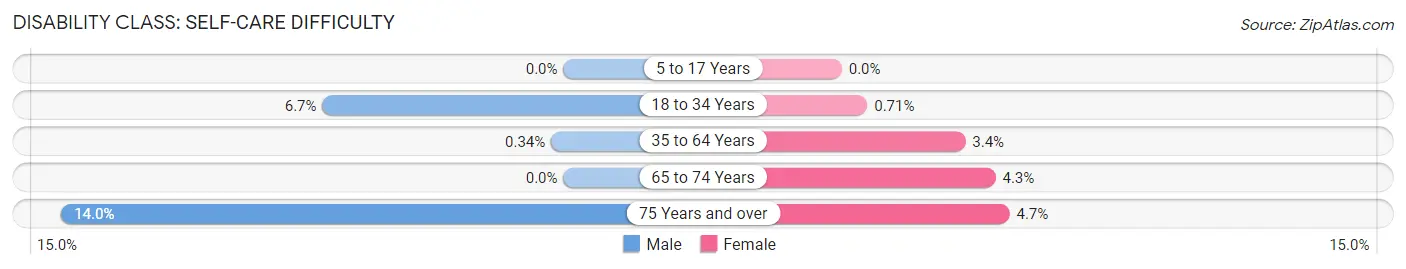
| Age Bracket | Male | Female |
| 5 to 17 Years | 0 (0.0%) | 0 (0.0%) |
| 18 to 34 Years | 93 (6.7%) | 10 (0.7%) |
| 35 to 64 Years | 9 (0.3%) | 95 (3.4%) |
| 65 to 74 Years | 0 (0.0%) | 37 (4.3%) |
| 75 Years and over | 84 (14.0%) | 30 (4.7%) |
Technology Access in Mercerville
Computing Device Access in Mercerville
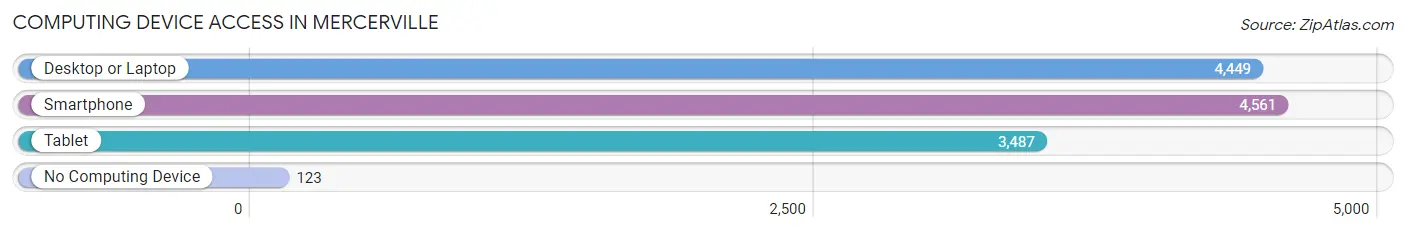
| Device Type | # Households | % Households |
| Desktop or Laptop | 4,449 | 88.0% |
| Smartphone | 4,561 | 90.2% |
| Tablet | 3,487 | 69.0% |
| No Computing Device | 123 | 2.4% |
| Total | 5,057 | 100.0% |
Internet Access in Mercerville
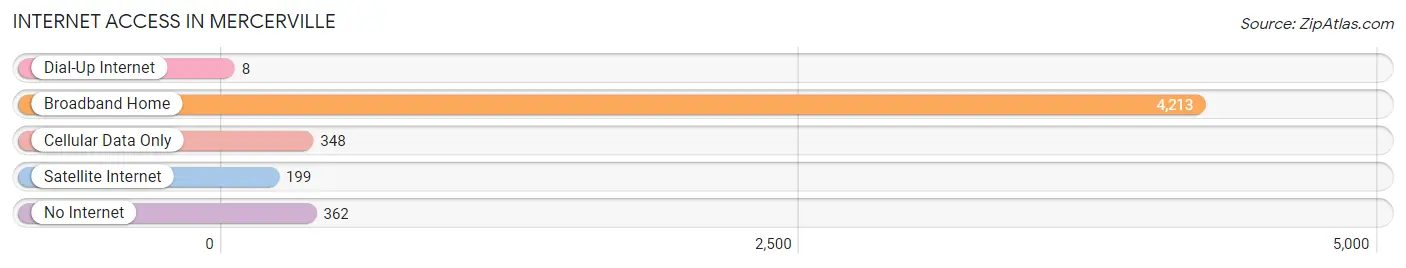
| Internet Type | # Households | % Households |
| Dial-Up Internet | 8 | 0.2% |
| Broadband Home | 4,213 | 83.3% |
| Cellular Data Only | 348 | 6.9% |
| Satellite Internet | 199 | 3.9% |
| No Internet | 362 | 7.2% |
| Total | 5,057 | 100.0% |
Mercerville Summary
Mercerville, NJ is a small town located in Mercer County, New Jersey. It is situated in the heart of the state, just a few miles from the state capital of Trenton. The town has a population of approximately 8,000 people and is part of the Trenton-Ewing Metropolitan Statistical Area.
History
Mercerville was first settled in the late 1700s by a group of Quakers from Pennsylvania. The town was originally known as “Quaker Bridge” and was located near the Delaware River. The town was officially incorporated in 1838 and was named after General Hugh Mercer, a Revolutionary War hero.
In the late 1800s, Mercerville was a thriving agricultural community. The town was known for its production of apples, peaches, and other fruits. The town also had a thriving dairy industry.
In the early 1900s, Mercerville began to experience a period of growth and development. The town was connected to the Pennsylvania Railroad and the Trenton-New Brunswick Line. This allowed for increased transportation and commerce.
In the mid-1900s, Mercerville experienced a period of decline. The town’s population decreased and many businesses closed. However, in the late 1990s, the town began to experience a period of revitalization. The town has seen an increase in population and businesses, as well as an increase in tourism.
Geography
Mercerville is located in central New Jersey, just a few miles from the state capital of Trenton. The town is situated in the Delaware Valley, which is part of the larger Atlantic Coastal Plain. The town is located on the banks of the Delaware River and is surrounded by rolling hills and forests.
The climate in Mercerville is humid subtropical, with hot and humid summers and cold winters. The average temperature in the summer is around 80 degrees Fahrenheit and the average temperature in the winter is around 40 degrees Fahrenheit.
Economy
Mercerville’s economy is largely based on tourism and retail. The town is home to several small businesses, including restaurants, shops, and galleries. The town also has a few larger businesses, such as a grocery store and a pharmacy.
The town is also home to several manufacturing companies, including a plastics manufacturer and a metal fabrication company. The town is also home to a few technology companies, including a software development company and a web design firm.
Demographics
As of the 2010 census, Mercerville had a population of 8,000 people. The racial makeup of the town was 79.3% White, 11.2% African American, 0.7% Native American, 2.2% Asian, and 6.6% from other races. The median household income was $50,000 and the median family income was $60,000.
Mercerville is a diverse community with a variety of cultures and backgrounds. The town is home to a large Hispanic population, as well as a growing Asian population. The town also has a large Jewish population.
Conclusion
Mercerville, NJ is a small town located in Mercer County, New Jersey. The town has a population of approximately 8,000 people and is part of the Trenton-Ewing Metropolitan Statistical Area. The town was first settled in the late 1700s by a group of Quakers from Pennsylvania and was officially incorporated in 1838. The town has experienced a period of growth and development in the late 1900s and is now home to a variety of businesses and cultures. The town’s economy is largely based on tourism and retail, and the town is home to a diverse population.
Common Questions
What is the Total Population of Mercerville?
Total Population of Mercerville is 14,364.
What is the Total Male Population of Mercerville?
Total Male Population of Mercerville is 6,772.
What is the Total Female Population of Mercerville?
Total Female Population of Mercerville is 7,592.
What is the Ratio of Males per 100 Females in Mercerville?
There are 89.20 Males per 100 Females in Mercerville.
What is the Ratio of Females per 100 Males in Mercerville?
There are 112.11 Females per 100 Males in Mercerville.
What is the Median Population Age in Mercerville?
Median Population Age in Mercerville is 42.6 Years.
What is the Average Family Size in Mercerville
Average Family Size in Mercerville is 3.2 People.
What is the Average Household Size in Mercerville
Average Household Size in Mercerville is 2.8 People.
What is Per Capita Income in Mercerville?
Per Capita income in Mercerville is $47,193.
What is the Median Family Income in Mercerville?
Median Family Income in Mercerville is $129,265.
What is the Median Household income in Mercerville?
Median Household Income in Mercerville is $116,380.
What is Income or Wage Gap in Mercerville?
Income or Wage Gap in Mercerville is 22.5%.
Women in Mercerville earn 77.5 cents for every dollar earned by a man.
What is Inequality or Gini Index in Mercerville?
Inequality or Gini Index in Mercerville is 0.35.
How Large is the Labor Force in Mercerville?
There are 7,187 People in the Labor Forcein in Mercerville.
What is the Percentage of People in the Labor Force in Mercerville?
62.0% of People are in the Labor Force in Mercerville.
What is the Unemployment Rate in Mercerville?
Unemployment Rate in Mercerville is 3.4%.