Kinnelon borough, NJ
Kinnelon borough Overview
9,986
TOTAL POPULATION
5,151
MALE POPULATION
4,835
FEMALE POPULATION
106.54
MALES / 100 FEMALES
93.87
FEMALES / 100 MALES
41.8
MEDIAN AGE
3.2
AVG FAMILY SIZE
3.0
AVG HOUSEHOLD SIZE
$75,346
PER CAPITA INCOME
$184,125
AVG FAMILY INCOME
$170,905
AVG HOUSEHOLD INCOME
29.6%
WAGE / INCOME GAP [ % ]
70.4¢/ $1
WAGE / INCOME GAP [ $ ]
0.43
INEQUALITY / GINI INDEX
5,528
LABOR FORCE [ PEOPLE ]
68.0%
PERCENT IN LABOR FORCE
8.9%
UNEMPLOYMENT RATE
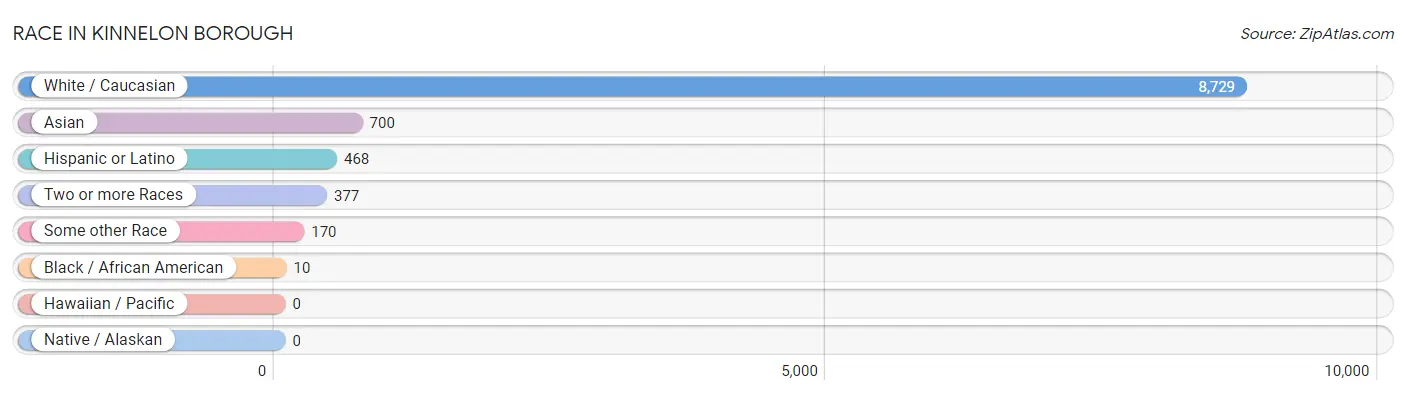
Race in Kinnelon borough
The most populous races in Kinnelon borough are White / Caucasian (8,729 | 87.4%), Asian (700 | 7.0%), and Hispanic or Latino (468 | 4.7%).
| Race | # Population | % Population |
| Asian | 700 | 7.0% |
| Black / African American | 10 | 0.1% |
| Hawaiian / Pacific | 0 | 0.0% |
| Hispanic or Latino | 468 | 4.7% |
| Native / Alaskan | 0 | 0.0% |
| White / Caucasian | 8,729 | 87.4% |
| Two or more Races | 377 | 3.8% |
| Some other Race | 170 | 1.7% |
| Total | 9,986 | 100.0% |
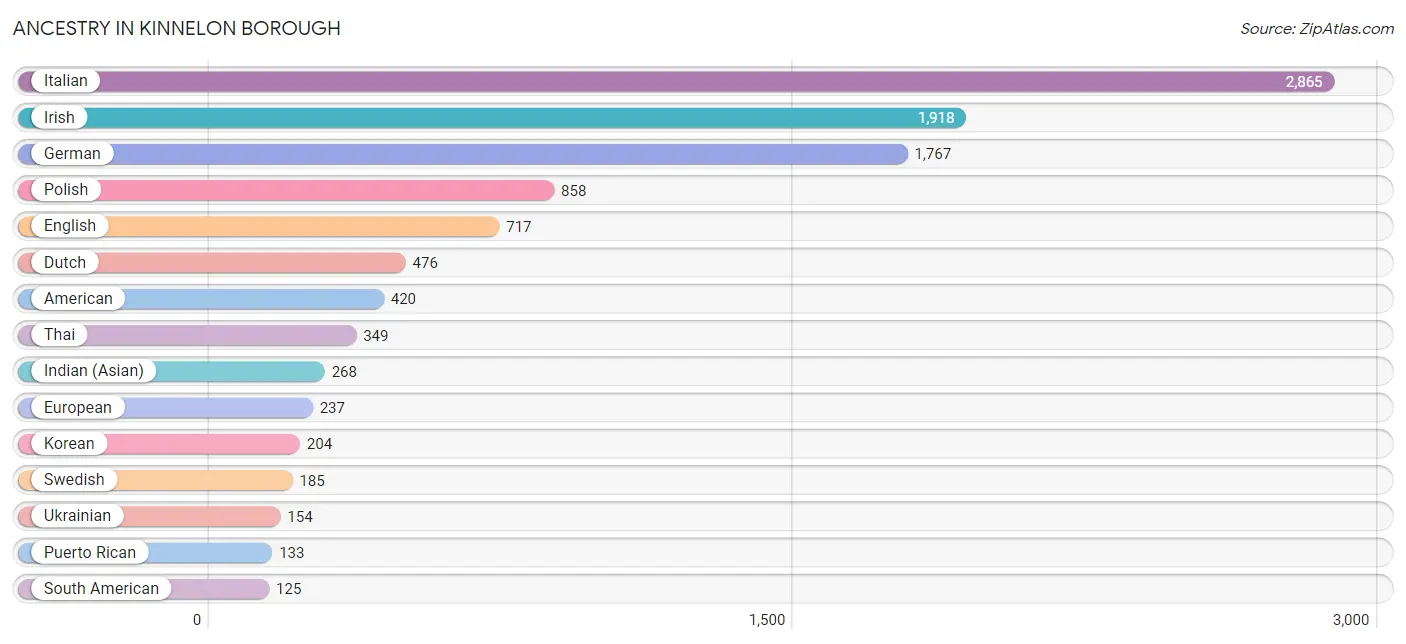
Ancestry in Kinnelon borough
The most populous ancestries reported in Kinnelon borough are Italian (2,865 | 28.7%), Irish (1,918 | 19.2%), German (1,767 | 17.7%), Polish (858 | 8.6%), and English (717 | 7.2%), together accounting for 81.4% of all Kinnelon borough residents.
| Ancestry | # Population | % Population |
| Albanian | 119 | 1.2% |
| American | 420 | 4.2% |
| Arab | 33 | 0.3% |
| Argentinean | 22 | 0.2% |
| Armenian | 30 | 0.3% |
| Austrian | 65 | 0.6% |
| Belgian | 22 | 0.2% |
| Blackfeet | 10 | 0.1% |
| Brazilian | 54 | 0.5% |
| British | 56 | 0.6% |
| Burmese | 13 | 0.1% |
| Carpatho Rusyn | 15 | 0.2% |
| Cherokee | 17 | 0.2% |
| Colombian | 46 | 0.5% |
| Croatian | 25 | 0.3% |
| Cuban | 61 | 0.6% |
| Czech | 8 | 0.1% |
| Czechoslovakian | 10 | 0.1% |
| Danish | 9 | 0.1% |
| Dominican | 81 | 0.8% |
| Dutch | 476 | 4.8% |
| Eastern European | 39 | 0.4% |
| Ecuadorian | 57 | 0.6% |
| English | 717 | 7.2% |
| European | 237 | 2.4% |
| French | 124 | 1.2% |
| French Canadian | 110 | 1.1% |
| German | 1,767 | 17.7% |
| Greek | 45 | 0.4% |
| Hungarian | 76 | 0.8% |
| Indian (Asian) | 268 | 2.7% |
| Irish | 1,918 | 19.2% |
| Israeli | 11 | 0.1% |
| Italian | 2,865 | 28.7% |
| Korean | 204 | 2.0% |
| Lithuanian | 40 | 0.4% |
| Maltese | 1 | 0.0% |
| Mexican | 22 | 0.2% |
| Norwegian | 122 | 1.2% |
| Palestinian | 17 | 0.2% |
| Polish | 858 | 8.6% |
| Portuguese | 50 | 0.5% |
| Puerto Rican | 133 | 1.3% |
| Russian | 54 | 0.5% |
| Scandinavian | 8 | 0.1% |
| Scotch-Irish | 33 | 0.3% |
| Scottish | 86 | 0.9% |
| Serbian | 23 | 0.2% |
| Slavic | 44 | 0.4% |
| South American | 125 | 1.3% |
| Spaniard | 32 | 0.3% |
| Spanish | 12 | 0.1% |
| Subsaharan African | 20 | 0.2% |
| Swedish | 185 | 1.8% |
| Swiss | 23 | 0.2% |
| Thai | 349 | 3.5% |
| Turkish | 80 | 0.8% |
| Ukrainian | 154 | 1.5% |
| Welsh | 23 | 0.2% |
| Yugoslavian | 8 | 0.1% | View All 60 Rows |
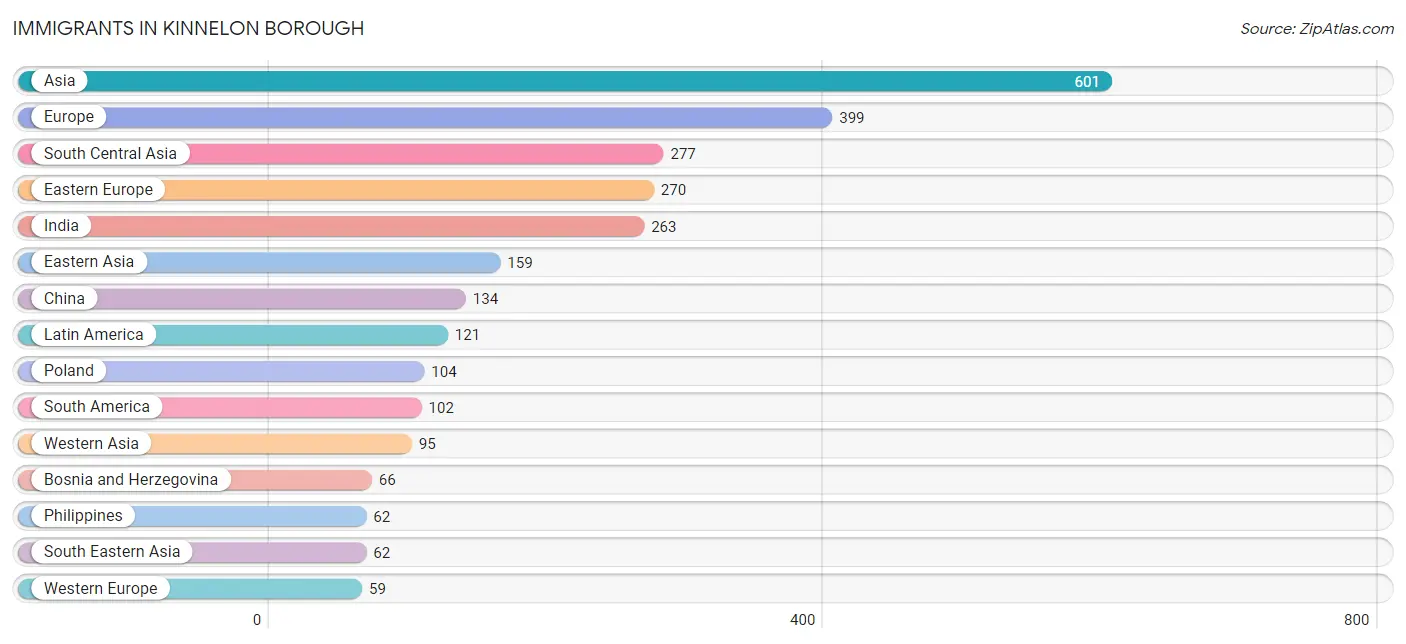
Immigrants in Kinnelon borough
The most numerous immigrant groups reported in Kinnelon borough came from Asia (601 | 6.0%), Europe (399 | 4.0%), South Central Asia (277 | 2.8%), Eastern Europe (270 | 2.7%), and India (263 | 2.6%), together accounting for 18.1% of all Kinnelon borough residents.
| Immigration Origin | # Population | % Population |
| Albania | 23 | 0.2% |
| Argentina | 12 | 0.1% |
| Asia | 601 | 6.0% |
| Austria | 20 | 0.2% |
| Bosnia and Herzegovina | 66 | 0.7% |
| Caribbean | 7 | 0.1% |
| Central America | 12 | 0.1% |
| China | 134 | 1.3% |
| Colombia | 46 | 0.5% |
| Costa Rica | 12 | 0.1% |
| Cuba | 7 | 0.1% |
| Eastern Asia | 159 | 1.6% |
| Eastern Europe | 270 | 2.7% |
| Ecuador | 44 | 0.4% |
| England | 25 | 0.3% |
| Europe | 399 | 4.0% |
| France | 9 | 0.1% |
| Germany | 21 | 0.2% |
| India | 263 | 2.6% |
| Israel | 28 | 0.3% |
| Italy | 27 | 0.3% |
| Japan | 12 | 0.1% |
| Jordan | 8 | 0.1% |
| Korea | 13 | 0.1% |
| Latin America | 121 | 1.2% |
| Moldova | 26 | 0.3% |
| Netherlands | 9 | 0.1% |
| Northern Europe | 42 | 0.4% |
| Pakistan | 14 | 0.1% |
| Philippines | 62 | 0.6% |
| Poland | 104 | 1.0% |
| Russia | 27 | 0.3% |
| South America | 102 | 1.0% |
| South Central Asia | 277 | 2.8% |
| South Eastern Asia | 62 | 0.6% |
| Southern Europe | 28 | 0.3% |
| Turkey | 40 | 0.4% |
| Ukraine | 24 | 0.2% |
| Western Asia | 95 | 0.9% |
| Western Europe | 59 | 0.6% |
| Yemen | 19 | 0.2% | View All 41 Rows |
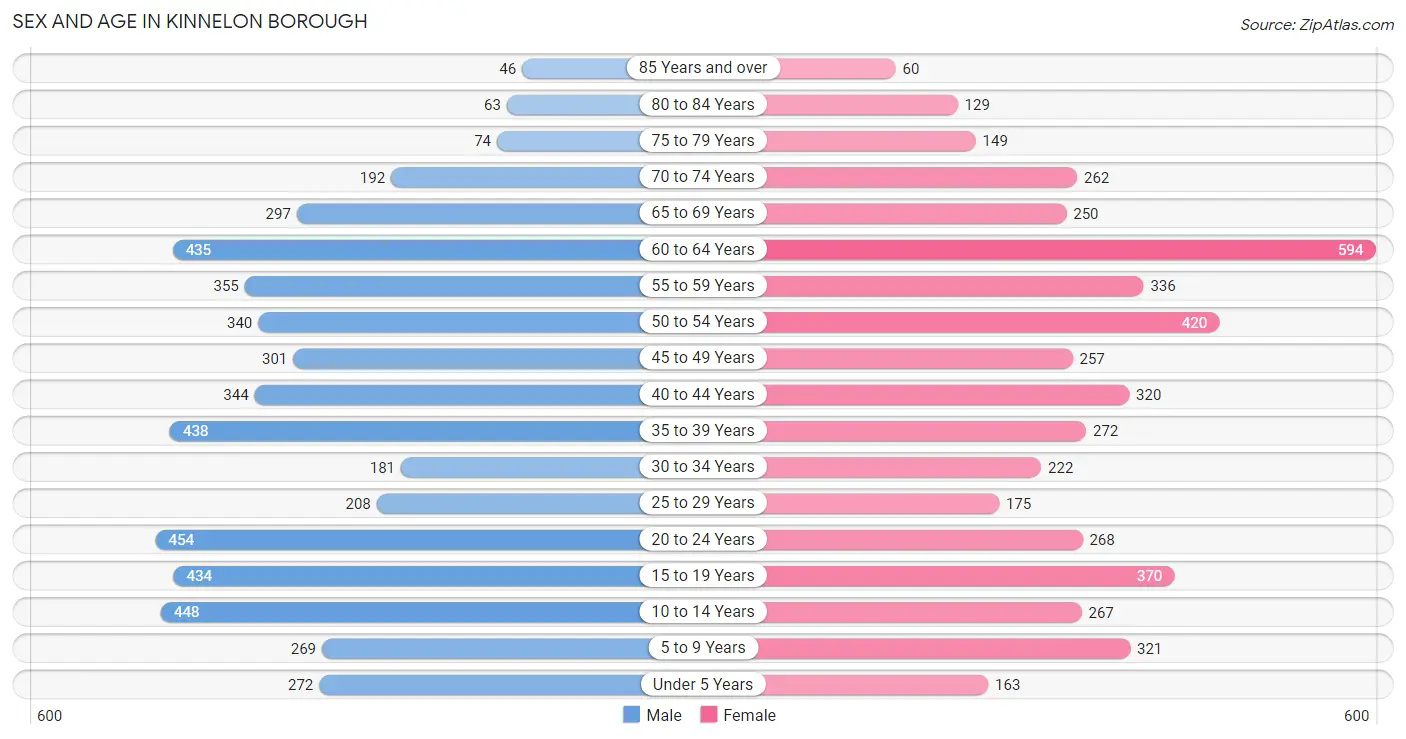
Sex and Age in Kinnelon borough
Sex and Age in Kinnelon borough
The most populous age groups in Kinnelon borough are 20 to 24 Years (454 | 8.8%) for men and 60 to 64 Years (594 | 12.3%) for women.
| Age Bracket | Male | Female |
| Under 5 Years | 272 (5.3%) | 163 (3.4%) |
| 5 to 9 Years | 269 (5.2%) | 321 (6.6%) |
| 10 to 14 Years | 448 (8.7%) | 267 (5.5%) |
| 15 to 19 Years | 434 (8.4%) | 370 (7.6%) |
| 20 to 24 Years | 454 (8.8%) | 268 (5.5%) |
| 25 to 29 Years | 208 (4.0%) | 175 (3.6%) |
| 30 to 34 Years | 181 (3.5%) | 222 (4.6%) |
| 35 to 39 Years | 438 (8.5%) | 272 (5.6%) |
| 40 to 44 Years | 344 (6.7%) | 320 (6.6%) |
| 45 to 49 Years | 301 (5.8%) | 257 (5.3%) |
| 50 to 54 Years | 340 (6.6%) | 420 (8.7%) |
| 55 to 59 Years | 355 (6.9%) | 336 (7.0%) |
| 60 to 64 Years | 435 (8.4%) | 594 (12.3%) |
| 65 to 69 Years | 297 (5.8%) | 250 (5.2%) |
| 70 to 74 Years | 192 (3.7%) | 262 (5.4%) |
| 75 to 79 Years | 74 (1.4%) | 149 (3.1%) |
| 80 to 84 Years | 63 (1.2%) | 129 (2.7%) |
| 85 Years and over | 46 (0.9%) | 60 (1.2%) |
| Total | 5,151 (100.0%) | 4,835 (100.0%) |
Families and Households in Kinnelon borough
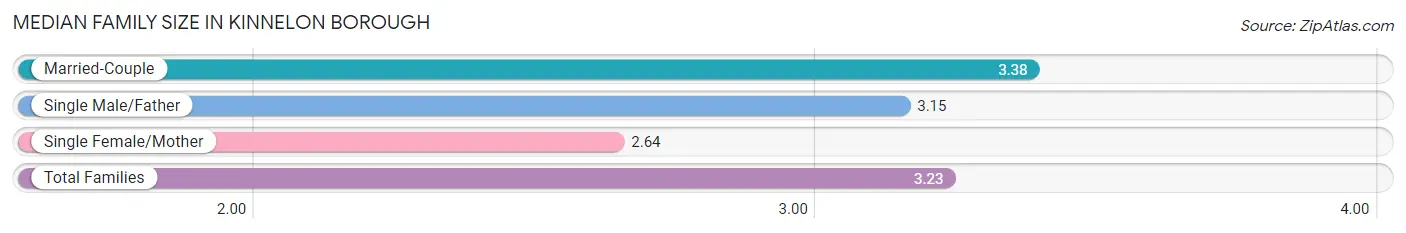
Median Family Size in Kinnelon borough
The median family size in Kinnelon borough is 3.23 persons per family, with married-couple families (2,242 | 77.4%) accounting for the largest median family size of 3.38 persons per family. On the other hand, single female/mother families (539 | 18.6%) represent the smallest median family size with 2.64 persons per family.
| Family Type | # Families | Family Size |
| Married-Couple | 2,242 (77.4%) | 3.38 |
| Single Male/Father | 114 (3.9%) | 3.15 |
| Single Female/Mother | 539 (18.6%) | 2.64 |
| Total Families | 2,895 (100.0%) | 3.23 |
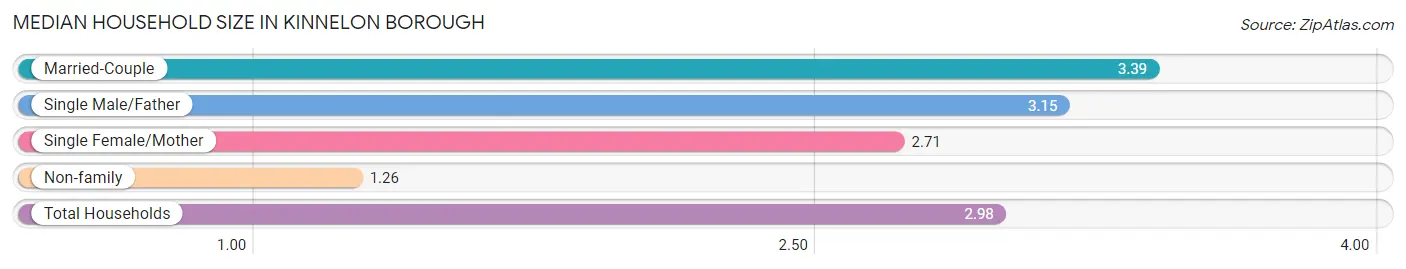
Median Household Size in Kinnelon borough
The median household size in Kinnelon borough is 2.98 persons per household, with married-couple households (2,242 | 67.0%) accounting for the largest median household size of 3.39 persons per household. non-family households (452 | 13.5%) represent the smallest median household size with 1.26 persons per household.
| Household Type | # Households | Household Size |
| Married-Couple | 2,242 (67.0%) | 3.39 |
| Single Male/Father | 114 (3.4%) | 3.15 |
| Single Female/Mother | 539 (16.1%) | 2.71 |
| Non-family | 452 (13.5%) | 1.26 |
| Total Households | 3,347 (100.0%) | 2.98 |
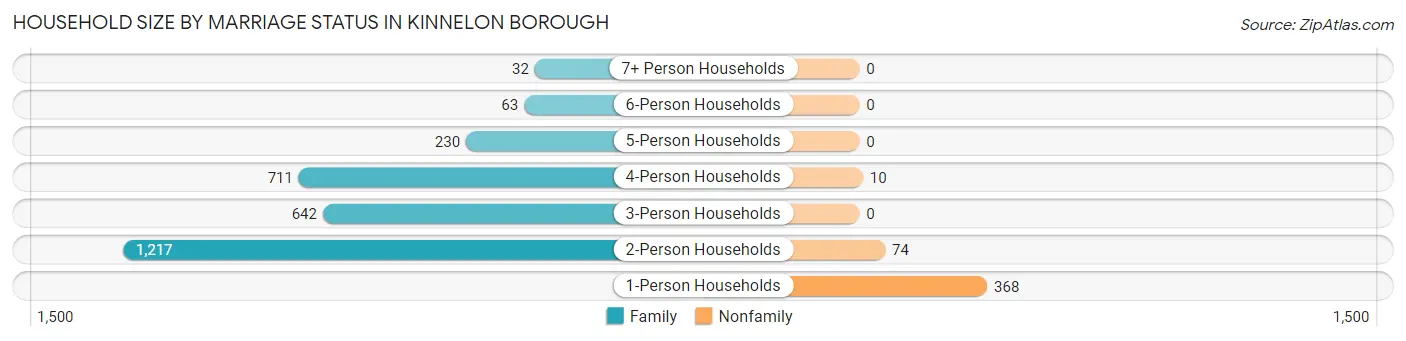
Household Size by Marriage Status in Kinnelon borough
Out of a total of 3,347 households in Kinnelon borough, 2,895 (86.5%) are family households, while 452 (13.5%) are nonfamily households. The most numerous type of family households are 2-person households, comprising 1,217, and the most common type of nonfamily households are 1-person households, comprising 368.
| Household Size | Family Households | Nonfamily Households |
| 1-Person Households | - | 368 (11.0%) |
| 2-Person Households | 1,217 (36.4%) | 74 (2.2%) |
| 3-Person Households | 642 (19.2%) | 0 (0.0%) |
| 4-Person Households | 711 (21.2%) | 10 (0.3%) |
| 5-Person Households | 230 (6.9%) | 0 (0.0%) |
| 6-Person Households | 63 (1.9%) | 0 (0.0%) |
| 7+ Person Households | 32 (1.0%) | 0 (0.0%) |
| Total | 2,895 (86.5%) | 452 (13.5%) |
Female Fertility in Kinnelon borough
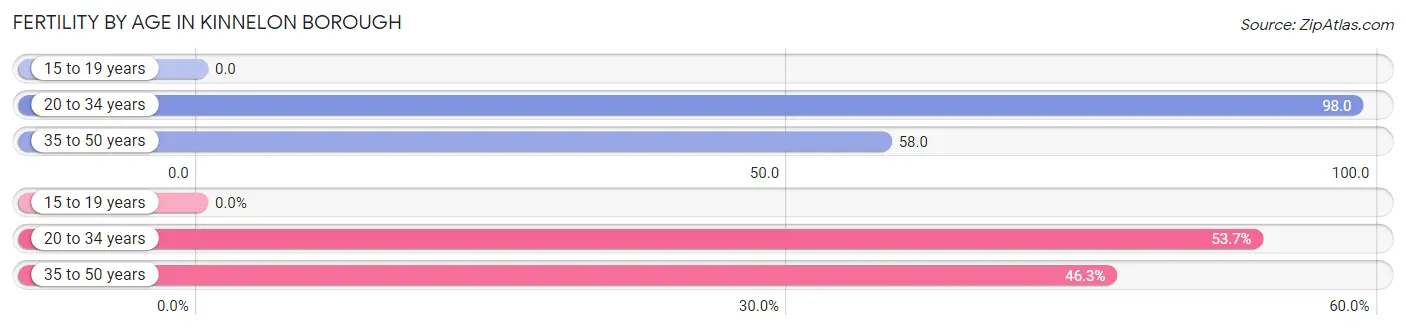
Fertility by Age in Kinnelon borough
Average fertility rate in Kinnelon borough is 61.0 births per 1,000 women. Women in the age bracket of 20 to 34 years have the highest fertility rate with 98.0 births per 1,000 women. Women in the age bracket of 20 to 34 years acount for 53.7% of all women with births.
| Age Bracket | Women with Births | Births / 1,000 Women |
| 15 to 19 years | 0 (0.0%) | 0.0 |
| 20 to 34 years | 65 (53.7%) | 98.0 |
| 35 to 50 years | 56 (46.3%) | 58.0 |
| Total | 121 (100.0%) | 61.0 |
Fertility by Age by Marriage Status in Kinnelon borough
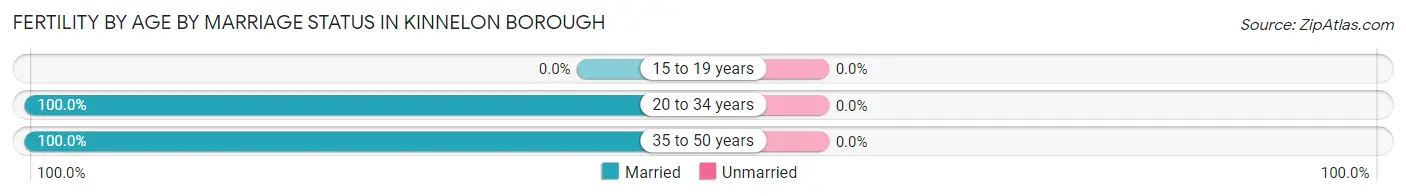
| Age Bracket | Married | Unmarried |
| 15 to 19 years | 0 (0.0%) | 0 (0.0%) |
| 20 to 34 years | 65 (100.0%) | 0 (0.0%) |
| 35 to 50 years | 56 (100.0%) | 0 (0.0%) |
| Total | 121 (100.0%) | 0 (0.0%) |
Fertility by Education in Kinnelon borough
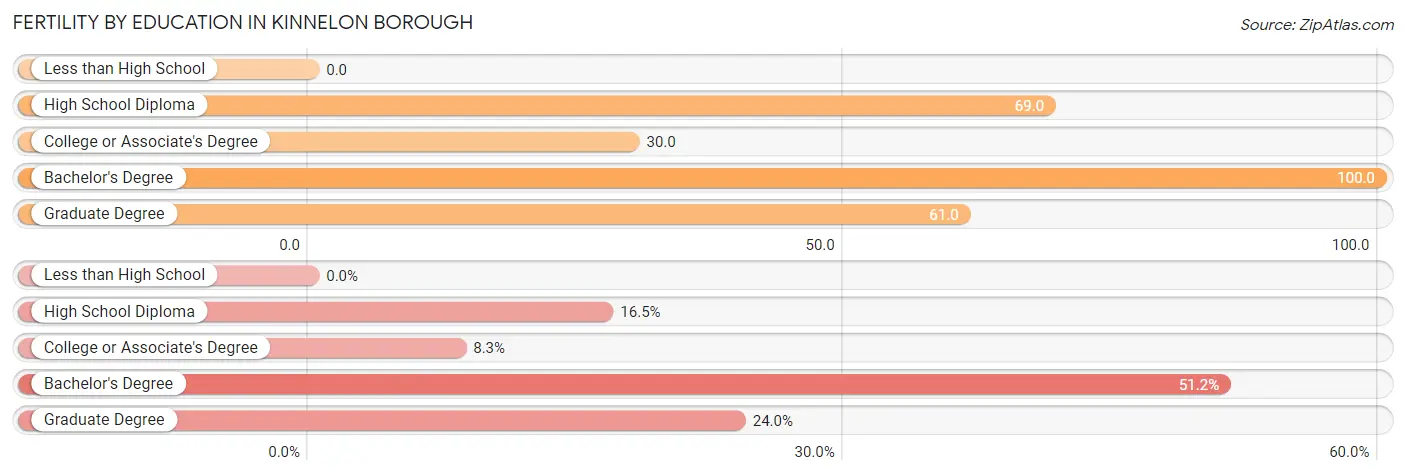
| Educational Attainment | Women with Births | Births / 1,000 Women |
| Less than High School | 0 (0.0%) | 0.0 |
| High School Diploma | 20 (16.5%) | 69.0 |
| College or Associate's Degree | 10 (8.3%) | 30.0 |
| Bachelor's Degree | 62 (51.2%) | 100.0 |
| Graduate Degree | 29 (24.0%) | 61.0 |
| Total | 121 (100.0%) | 61.0 |
Fertility by Education by Marriage Status in Kinnelon borough
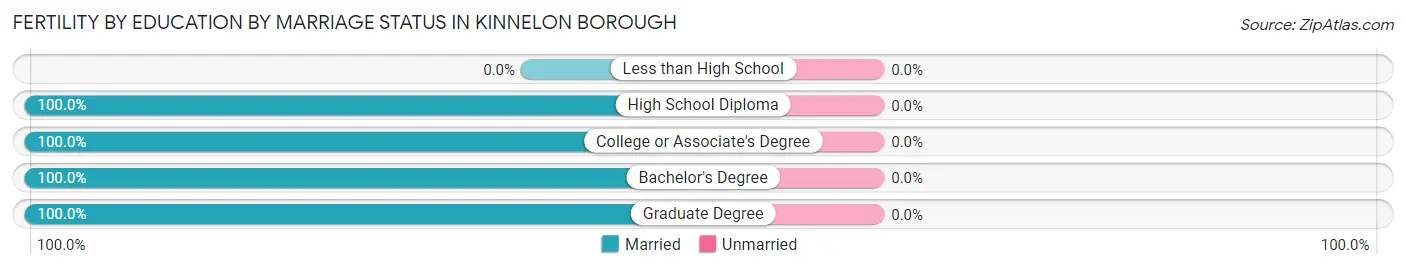
| Educational Attainment | Married | Unmarried |
| Less than High School | 0 (0.0%) | 0 (0.0%) |
| High School Diploma | 20 (100.0%) | 0 (0.0%) |
| College or Associate's Degree | 10 (100.0%) | 0 (0.0%) |
| Bachelor's Degree | 62 (100.0%) | 0 (0.0%) |
| Graduate Degree | 29 (100.0%) | 0 (0.0%) |
| Total | 121 (100.0%) | 0 (0.0%) |
Income in Kinnelon borough
Income Overview in Kinnelon borough
Per Capita Income in Kinnelon borough is $75,346, while median incomes of families and households are $184,125 and $170,905 respectively.
| Characteristic | Number | Measure |
| Per Capita Income | 9,986 | $75,346 |
| Median Family Income | 2,895 | $184,125 |
| Mean Family Income | 2,895 | $237,042 |
| Median Household Income | 3,347 | $170,905 |
| Mean Household Income | 3,347 | $220,367 |
| Income Deficit | 2,895 | $0 |
| Wage / Income Gap (%) | 9,986 | 29.57% |
| Wage / Income Gap ($) | 9,986 | 70.43¢ per $1 |
| Gini / Inequality Index | 9,986 | 0.43 |
Earnings by Sex in Kinnelon borough
Average Earnings in Kinnelon borough are $71,699, $85,768 for men and $60,404 for women, a difference of 29.6%.
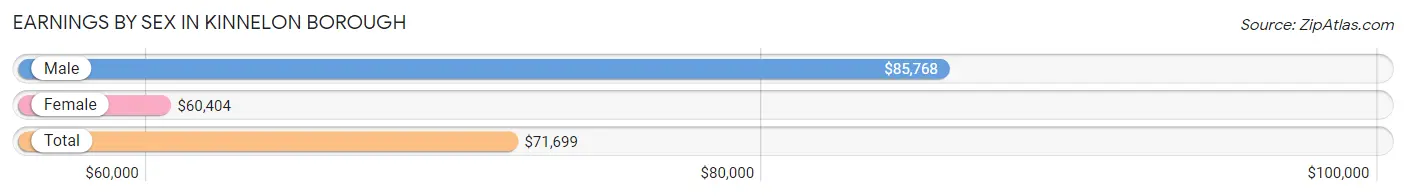
| Sex | Number | Average Earnings |
| Male | 3,131 (55.9%) | $85,768 |
| Female | 2,466 (44.1%) | $60,404 |
| Total | 5,597 (100.0%) | $71,699 |
Earnings by Sex by Income Bracket in Kinnelon borough
The most common earnings brackets in Kinnelon borough are $100,000+ for men (1,356 | 43.3%) and $100,000+ for women (637 | 25.8%).
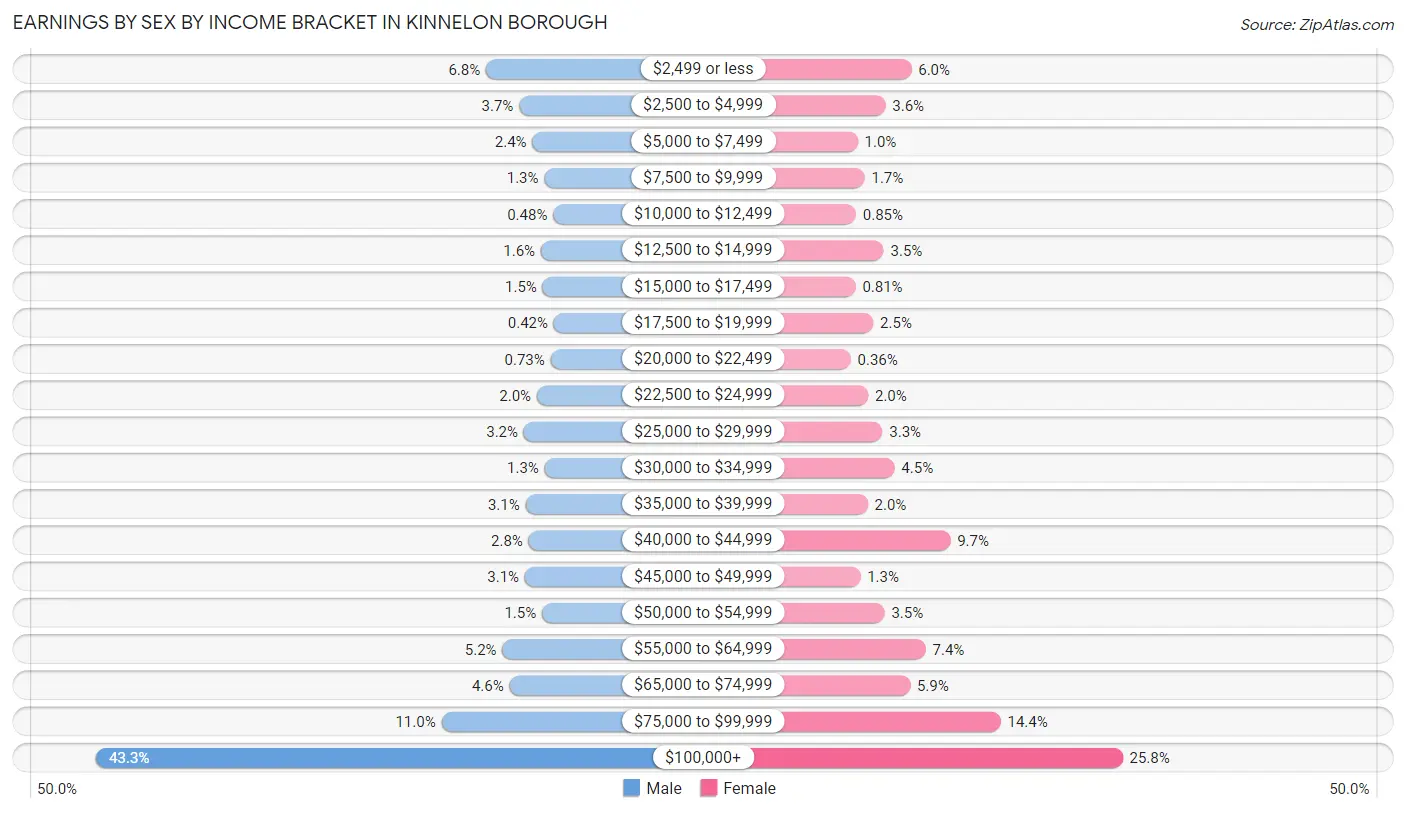
| Income | Male | Female |
| $2,499 or less | 212 (6.8%) | 149 (6.0%) |
| $2,500 to $4,999 | 115 (3.7%) | 89 (3.6%) |
| $5,000 to $7,499 | 76 (2.4%) | 25 (1.0%) |
| $7,500 to $9,999 | 41 (1.3%) | 41 (1.7%) |
| $10,000 to $12,499 | 15 (0.5%) | 21 (0.9%) |
| $12,500 to $14,999 | 51 (1.6%) | 85 (3.5%) |
| $15,000 to $17,499 | 46 (1.5%) | 20 (0.8%) |
| $17,500 to $19,999 | 13 (0.4%) | 61 (2.5%) |
| $20,000 to $22,499 | 23 (0.7%) | 9 (0.4%) |
| $22,500 to $24,999 | 63 (2.0%) | 49 (2.0%) |
| $25,000 to $29,999 | 101 (3.2%) | 82 (3.3%) |
| $30,000 to $34,999 | 40 (1.3%) | 110 (4.5%) |
| $35,000 to $39,999 | 96 (3.1%) | 48 (1.9%) |
| $40,000 to $44,999 | 87 (2.8%) | 239 (9.7%) |
| $45,000 to $49,999 | 98 (3.1%) | 31 (1.3%) |
| $50,000 to $54,999 | 48 (1.5%) | 87 (3.5%) |
| $55,000 to $64,999 | 164 (5.2%) | 182 (7.4%) |
| $65,000 to $74,999 | 143 (4.6%) | 146 (5.9%) |
| $75,000 to $99,999 | 343 (11.0%) | 355 (14.4%) |
| $100,000+ | 1,356 (43.3%) | 637 (25.8%) |
| Total | 3,131 (100.0%) | 2,466 (100.0%) |
Earnings by Sex by Educational Attainment in Kinnelon borough
Average earnings in Kinnelon borough are $110,102 for men and $68,920 for women, a difference of 37.4%. Men with an educational attainment of bachelor's degree enjoy the highest average annual earnings of $135,962, while those with less than high school education earn the least with $43,636. Women with an educational attainment of graduate degree earn the most with the average annual earnings of $103,382, while those with high school diploma education have the smallest earnings of $39,236.
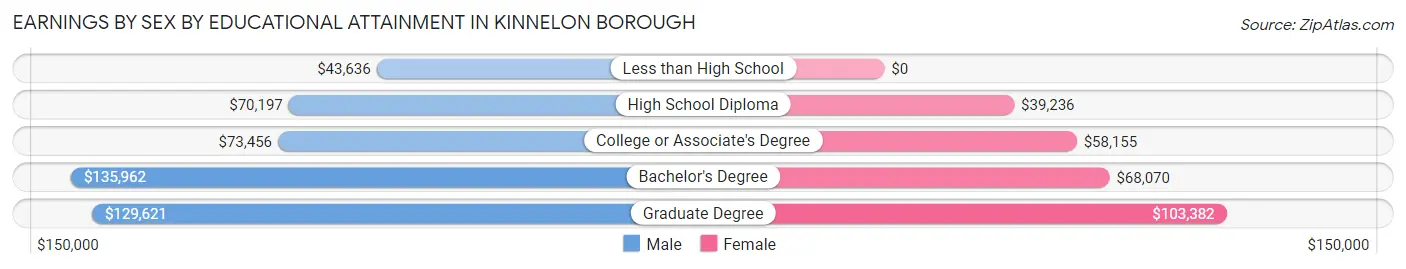
| Educational Attainment | Male Income | Female Income |
| Less than High School | $43,636 | $0 |
| High School Diploma | $70,197 | $39,236 |
| College or Associate's Degree | $73,456 | $58,155 |
| Bachelor's Degree | $135,962 | $68,070 |
| Graduate Degree | $129,621 | $103,382 |
| Total | $110,102 | $68,920 |
Family Income in Kinnelon borough
Family Income Brackets in Kinnelon borough
According to the Kinnelon borough family income data, there are 1,271 families falling into the $200,000+ income range, which is the most common income bracket and makes up 43.9% of all families.
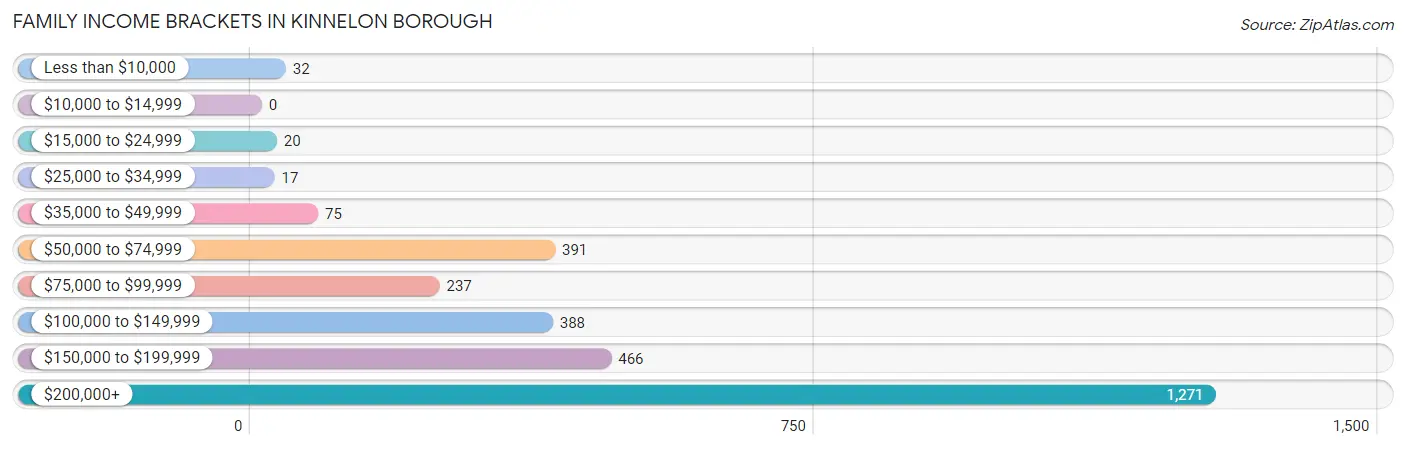
| Income Bracket | # Families | % Families |
| Less than $10,000 | 32 | 1.1% |
| $10,000 to $14,999 | 0 | 0.0% |
| $15,000 to $24,999 | 20 | 0.7% |
| $25,000 to $34,999 | 17 | 0.6% |
| $35,000 to $49,999 | 75 | 2.6% |
| $50,000 to $74,999 | 391 | 13.5% |
| $75,000 to $99,999 | 237 | 8.2% |
| $100,000 to $149,999 | 388 | 13.4% |
| $150,000 to $199,999 | 466 | 16.1% |
| $200,000+ | 1,271 | 43.9% |
Family Income by Famaliy Size in Kinnelon borough
6-person families (63 | 2.2%) account for the highest median family income in Kinnelon borough with $250,001 per family, while 3-person families (627 | 21.7%) have the highest median income of $74,625 per family member.
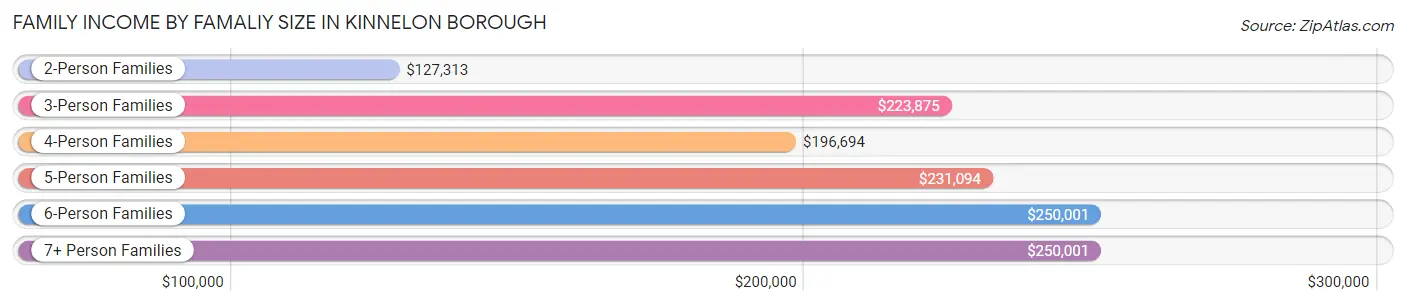
| Income Bracket | # Families | Median Income |
| 2-Person Families | 1,248 (43.1%) | $127,313 |
| 3-Person Families | 627 (21.7%) | $223,875 |
| 4-Person Families | 695 (24.0%) | $196,694 |
| 5-Person Families | 230 (7.9%) | $231,094 |
| 6-Person Families | 63 (2.2%) | $250,001 |
| 7+ Person Families | 32 (1.1%) | $250,001 |
| Total | 2,895 (100.0%) | $184,125 |
Family Income by Number of Earners in Kinnelon borough
The median family income in Kinnelon borough is $184,125, with families comprising 3+ earners (487) having the highest median family income of $250,001, while families with no earners (293) have the lowest median family income of $73,348, accounting for 16.8% and 10.1% of families, respectively.
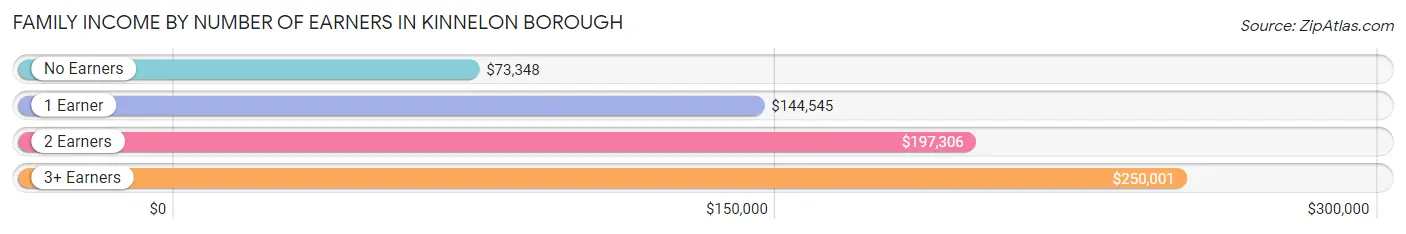
| Number of Earners | # Families | Median Income |
| No Earners | 293 (10.1%) | $73,348 |
| 1 Earner | 1,080 (37.3%) | $144,545 |
| 2 Earners | 1,035 (35.7%) | $197,306 |
| 3+ Earners | 487 (16.8%) | $250,001 |
| Total | 2,895 (100.0%) | $184,125 |
Household Income in Kinnelon borough
Household Income Brackets in Kinnelon borough
With 1,349 households falling in the category, the $200,000+ income range is the most frequent in Kinnelon borough, accounting for 40.3% of all households.
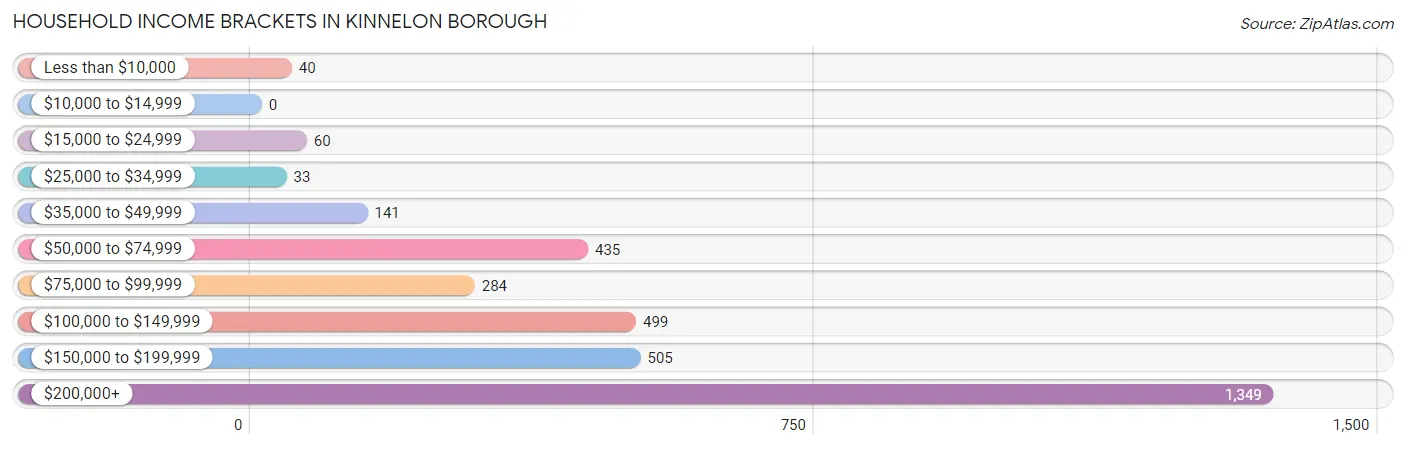
| Income Bracket | # Households | % Households |
| Less than $10,000 | 40 | 1.2% |
| $10,000 to $14,999 | 0 | 0.0% |
| $15,000 to $24,999 | 60 | 1.8% |
| $25,000 to $34,999 | 33 | 1.0% |
| $35,000 to $49,999 | 141 | 4.2% |
| $50,000 to $74,999 | 435 | 13.0% |
| $75,000 to $99,999 | 284 | 8.5% |
| $100,000 to $149,999 | 499 | 14.9% |
| $150,000 to $199,999 | 505 | 15.1% |
| $200,000+ | 1,349 | 40.3% |
Household Income by Householder Age in Kinnelon borough
The median household income in Kinnelon borough is $170,905, with the highest median household income of $199,176 found in the 45 to 64 years age bracket for the primary householder. A total of 1,711 households (51.1%) fall into this category.
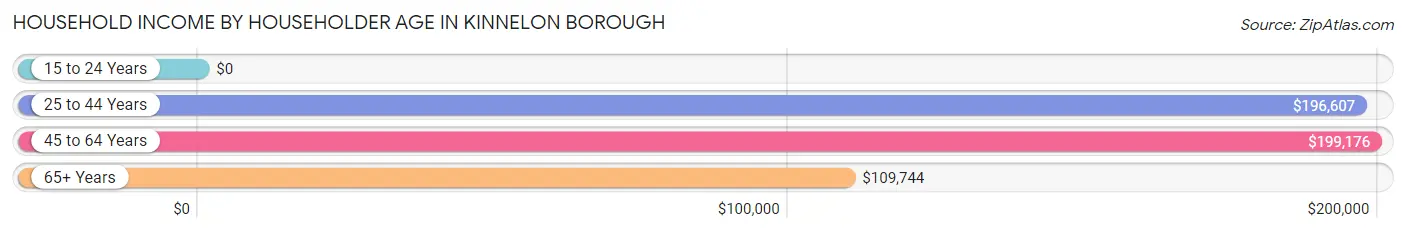
| Income Bracket | # Households | Median Income |
| 15 to 24 Years | 0 (0.0%) | $0 |
| 25 to 44 Years | 690 (20.6%) | $196,607 |
| 45 to 64 Years | 1,711 (51.1%) | $199,176 |
| 65+ Years | 946 (28.3%) | $109,744 |
| Total | 3,347 (100.0%) | $170,905 |
Poverty in Kinnelon borough
Income Below Poverty by Sex and Age in Kinnelon borough
With 1.6% poverty level for males and 3.2% for females among the residents of Kinnelon borough, 55 to 64 year old males and 12 to 14 year old females are the most vulnerable to poverty, with 30 males (3.8%) and 32 females (22.4%) in their respective age groups living below the poverty level.
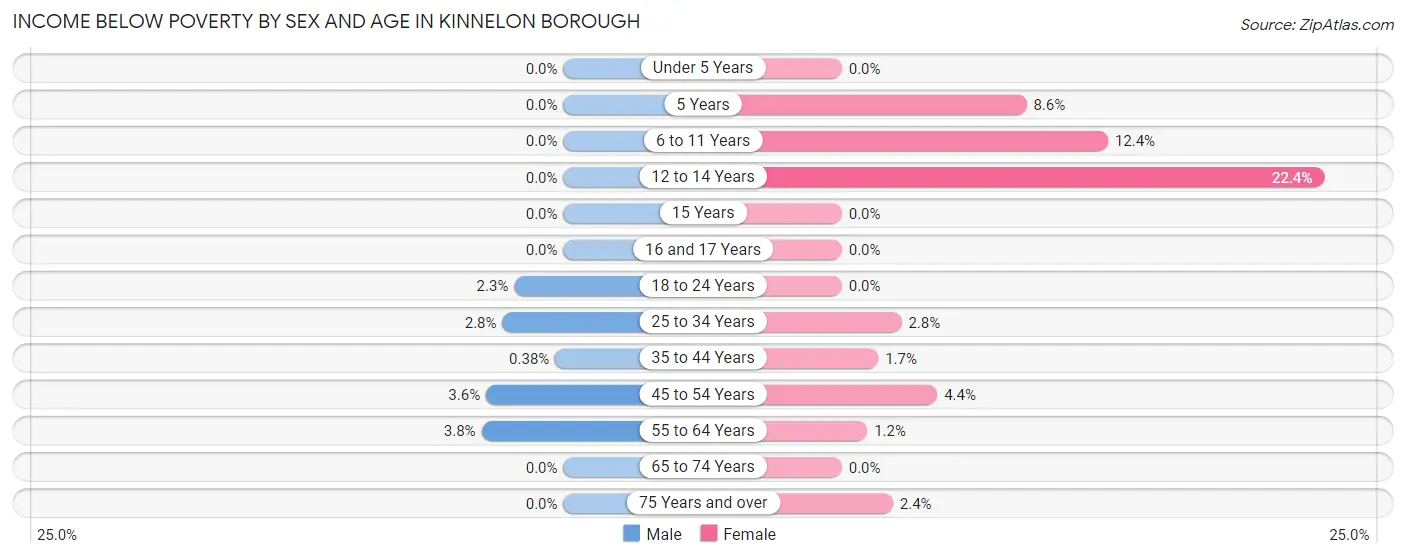
| Age Bracket | Male | Female |
| Under 5 Years | 0 (0.0%) | 0 (0.0%) |
| 5 Years | 0 (0.0%) | 9 (8.6%) |
| 6 to 11 Years | 0 (0.0%) | 42 (12.3%) |
| 12 to 14 Years | 0 (0.0%) | 32 (22.4%) |
| 15 Years | 0 (0.0%) | 0 (0.0%) |
| 16 and 17 Years | 0 (0.0%) | 0 (0.0%) |
| 18 to 24 Years | 15 (2.3%) | 0 (0.0%) |
| 25 to 34 Years | 11 (2.8%) | 11 (2.8%) |
| 35 to 44 Years | 3 (0.4%) | 10 (1.7%) |
| 45 to 54 Years | 23 (3.6%) | 30 (4.4%) |
| 55 to 64 Years | 30 (3.8%) | 11 (1.2%) |
| 65 to 74 Years | 0 (0.0%) | 0 (0.0%) |
| 75 Years and over | 0 (0.0%) | 8 (2.4%) |
| Total | 82 (1.6%) | 153 (3.2%) |
Income Above Poverty by Sex and Age in Kinnelon borough
According to the poverty statistics in Kinnelon borough, males aged under 5 years and females aged under 5 years are the age groups that are most secure financially, with 100.0% of males and 100.0% of females in these age groups living above the poverty line.
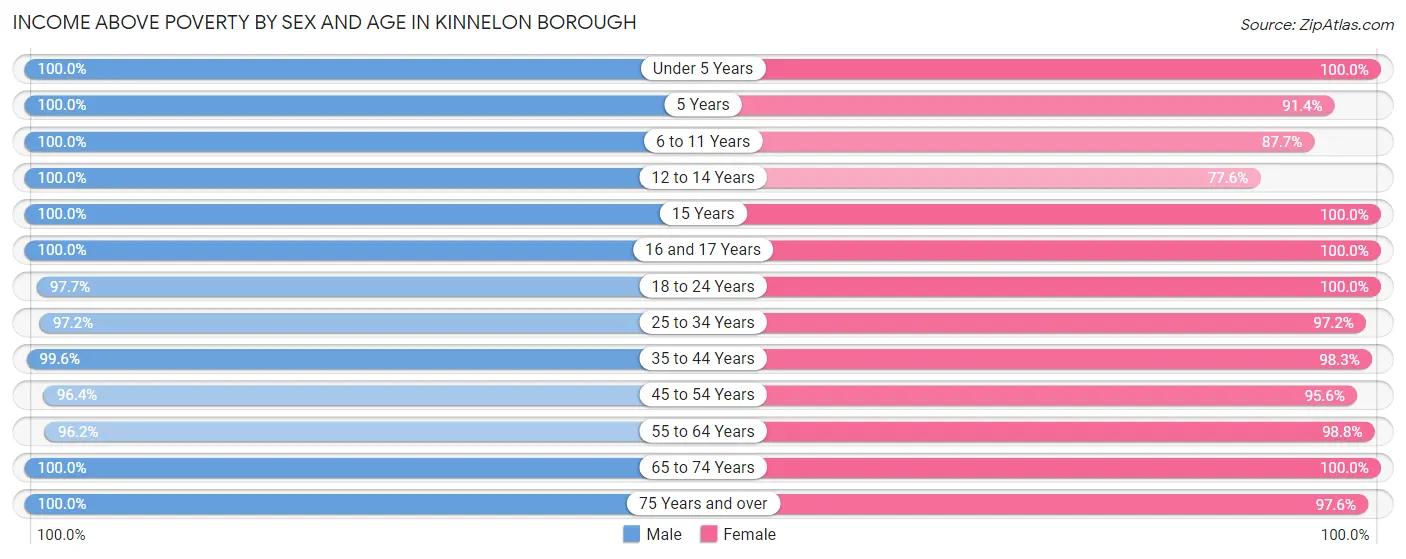
| Age Bracket | Male | Female |
| Under 5 Years | 272 (100.0%) | 163 (100.0%) |
| 5 Years | 62 (100.0%) | 96 (91.4%) |
| 6 to 11 Years | 361 (100.0%) | 298 (87.6%) |
| 12 to 14 Years | 294 (100.0%) | 111 (77.6%) |
| 15 Years | 45 (100.0%) | 71 (100.0%) |
| 16 and 17 Years | 184 (100.0%) | 119 (100.0%) |
| 18 to 24 Years | 644 (97.7%) | 448 (100.0%) |
| 25 to 34 Years | 378 (97.2%) | 386 (97.2%) |
| 35 to 44 Years | 779 (99.6%) | 582 (98.3%) |
| 45 to 54 Years | 618 (96.4%) | 647 (95.6%) |
| 55 to 64 Years | 760 (96.2%) | 919 (98.8%) |
| 65 to 74 Years | 489 (100.0%) | 512 (100.0%) |
| 75 Years and over | 183 (100.0%) | 330 (97.6%) |
| Total | 5,069 (98.4%) | 4,682 (96.8%) |
Income Below Poverty Among Married-Couple Families in Kinnelon borough
The poverty statistics for married-couple families in Kinnelon borough show that 1.3% or 30 of the total 2,242 families live below the poverty line. Families with 1 or 2 children have the highest poverty rate of 2.3%, comprising of 19 families. On the other hand, families with 3 or 4 children have the lowest poverty rate of 0.0%, which includes 0 families.
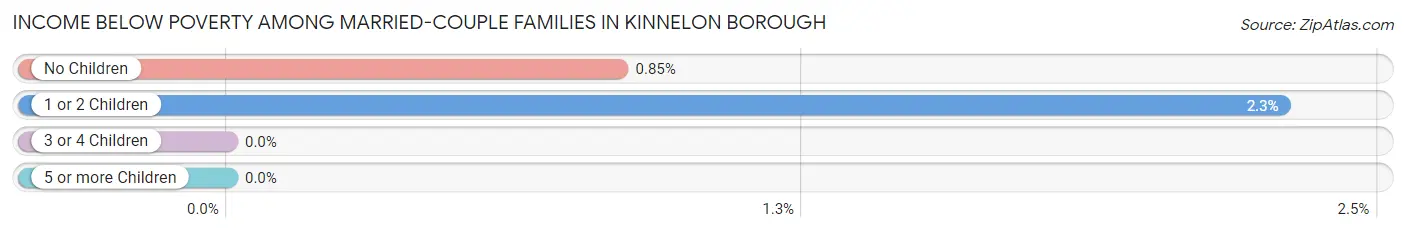
| Children | Above Poverty | Below Poverty |
| No Children | 1,285 (99.2%) | 11 (0.9%) |
| 1 or 2 Children | 809 (97.7%) | 19 (2.3%) |
| 3 or 4 Children | 103 (100.0%) | 0 (0.0%) |
| 5 or more Children | 15 (100.0%) | 0 (0.0%) |
| Total | 2,212 (98.7%) | 30 (1.3%) |
Income Below Poverty Among Single-Parent Households in Kinnelon borough
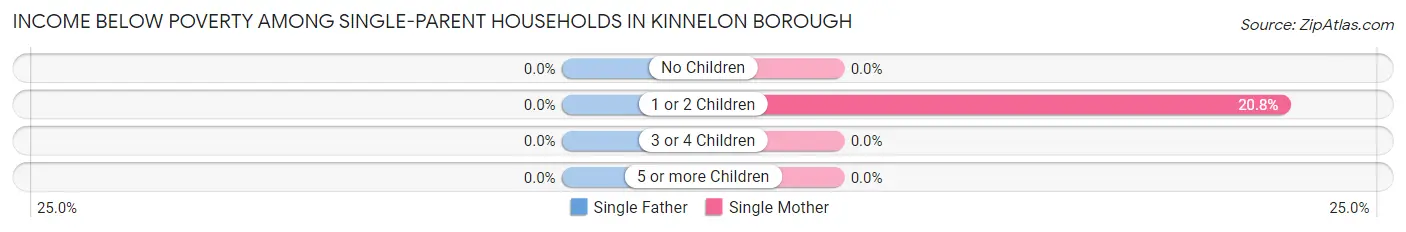
| Children | Single Father | Single Mother |
| No Children | 0 (0.0%) | 0 (0.0%) |
| 1 or 2 Children | 0 (0.0%) | 21 (20.8%) |
| 3 or 4 Children | 0 (0.0%) | 0 (0.0%) |
| 5 or more Children | 0 (0.0%) | 0 (0.0%) |
| Total | 0 (0.0%) | 21 (3.9%) |
Income Below Poverty Among Married-Couple vs Single-Parent Households in Kinnelon borough
The poverty data for Kinnelon borough shows that 30 of the married-couple family households (1.3%) and 21 of the single-parent households (3.2%) are living below the poverty level. Within the married-couple family households, those with 1 or 2 children have the highest poverty rate, with 19 households (2.3%) falling below the poverty line. Among the single-parent households, those with 1 or 2 children have the highest poverty rate, with 21 household (17.2%) living below poverty.
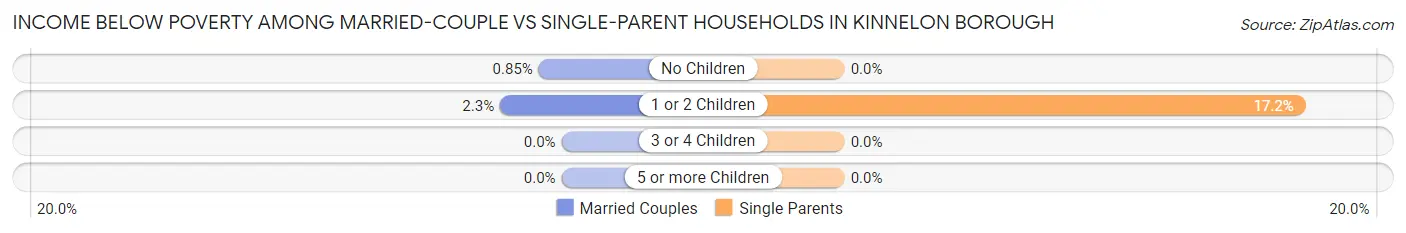
| Children | Married-Couple Families | Single-Parent Households |
| No Children | 11 (0.9%) | 0 (0.0%) |
| 1 or 2 Children | 19 (2.3%) | 21 (17.2%) |
| 3 or 4 Children | 0 (0.0%) | 0 (0.0%) |
| 5 or more Children | 0 (0.0%) | 0 (0.0%) |
| Total | 30 (1.3%) | 21 (3.2%) |
Employment Characteristics in Kinnelon borough
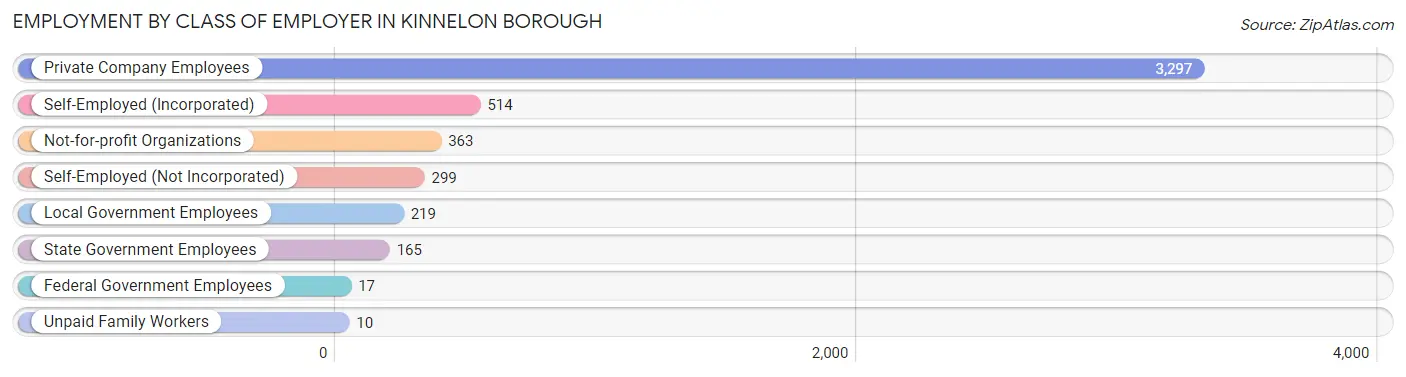
Employment by Class of Employer in Kinnelon borough
Among the 4,884 employed individuals in Kinnelon borough, private company employees (3,297 | 67.5%), self-employed (incorporated) (514 | 10.5%), and not-for-profit organizations (363 | 7.4%) make up the most common classes of employment.
| Employer Class | # Employees | % Employees |
| Private Company Employees | 3,297 | 67.5% |
| Self-Employed (Incorporated) | 514 | 10.5% |
| Self-Employed (Not Incorporated) | 299 | 6.1% |
| Not-for-profit Organizations | 363 | 7.4% |
| Local Government Employees | 219 | 4.5% |
| State Government Employees | 165 | 3.4% |
| Federal Government Employees | 17 | 0.4% |
| Unpaid Family Workers | 10 | 0.2% |
| Total | 4,884 | 100.0% |
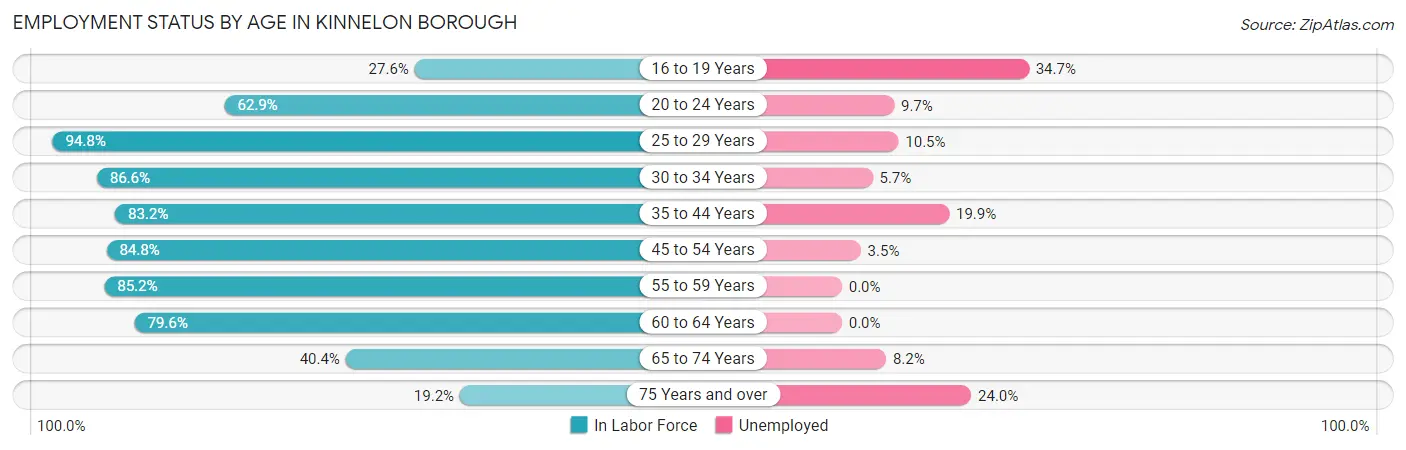
Employment Status by Age in Kinnelon borough
According to the labor force statistics for Kinnelon borough, out of the total population over 16 years of age (8,130), 68.0% or 5,528 individuals are in the labor force, with 8.9% or 492 of them unemployed. The age group with the highest labor force participation rate is 25 to 29 years, with 94.8% or 363 individuals in the labor force. Within the labor force, the 16 to 19 years age range has the highest percentage of unemployed individuals, with 34.7% or 66 of them being unemployed.
| Age Bracket | In Labor Force | Unemployed |
| 16 to 19 Years | 190 (27.6%) | 66 (34.7%) |
| 20 to 24 Years | 454 (62.9%) | 44 (9.7%) |
| 25 to 29 Years | 363 (94.8%) | 38 (10.5%) |
| 30 to 34 Years | 349 (86.6%) | 20 (5.7%) |
| 35 to 44 Years | 1,143 (83.2%) | 227 (19.9%) |
| 45 to 54 Years | 1,118 (84.8%) | 39 (3.5%) |
| 55 to 59 Years | 589 (85.2%) | 0 (0.0%) |
| 60 to 64 Years | 819 (79.6%) | 0 (0.0%) |
| 65 to 74 Years | 404 (40.4%) | 33 (8.2%) |
| 75 Years and over | 100 (19.2%) | 24 (24.0%) |
| Total | 5,528 (68.0%) | 492 (8.9%) |
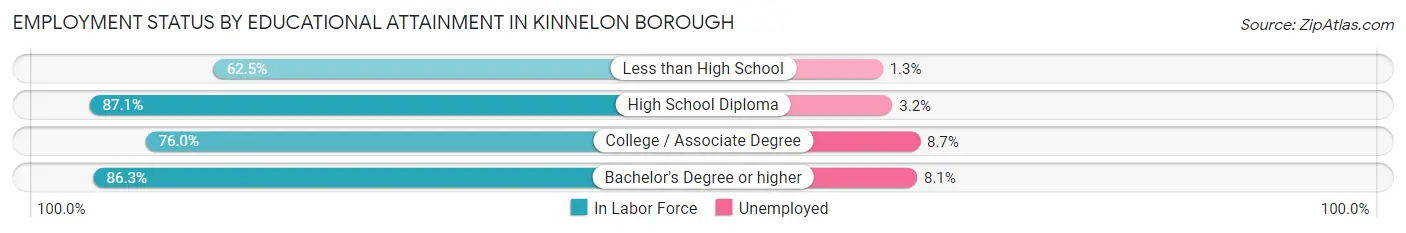
Employment Status by Educational Attainment in Kinnelon borough
According to labor force statistics for Kinnelon borough, 84.3% of individuals (4,382) out of the total population between 25 and 64 years of age (5,198) are in the labor force, with 7.4% or 324 of them being unemployed. The group with the highest labor force participation rate are those with the educational attainment of high school diploma, with 87.1% or 556 individuals in the labor force. Within the labor force, individuals with college / associate degree education have the highest percentage of unemployment, with 8.7% or 52 of them being unemployed.
| Educational Attainment | In Labor Force | Unemployed |
| Less than High School | 75 (62.5%) | 2 (1.3%) |
| High School Diploma | 556 (87.1%) | 20 (3.2%) |
| College / Associate Degree | 595 (76.0%) | 68 (8.7%) |
| Bachelor's Degree or higher | 3,156 (86.3%) | 296 (8.1%) |
| Total | 4,382 (84.3%) | 385 (7.4%) |
Employment Occupations by Sex in Kinnelon borough
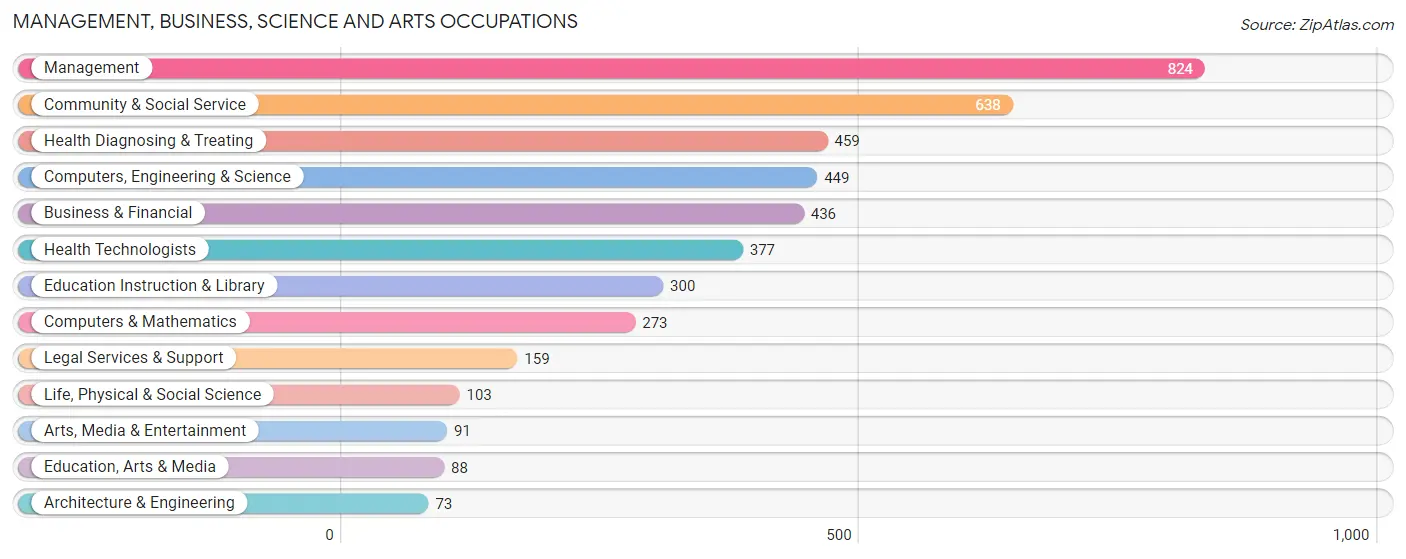
Management, Business, Science and Arts Occupations
The most common Management, Business, Science and Arts occupations in Kinnelon borough are Management (824 | 16.4%), Community & Social Service (638 | 12.7%), Health Diagnosing & Treating (459 | 9.1%), Computers, Engineering & Science (449 | 8.9%), and Business & Financial (436 | 8.7%).
Management, Business, Science and Arts Occupations by Sex
Within the Management, Business, Science and Arts occupations in Kinnelon borough, the most male-oriented occupations are Architecture & Engineering (87.7%), Business & Financial (69.3%), and Life, Physical & Social Science (67.0%), while the most female-oriented occupations are Education, Arts & Media (88.6%), Health Diagnosing & Treating (81.9%), and Health Technologists (80.6%).
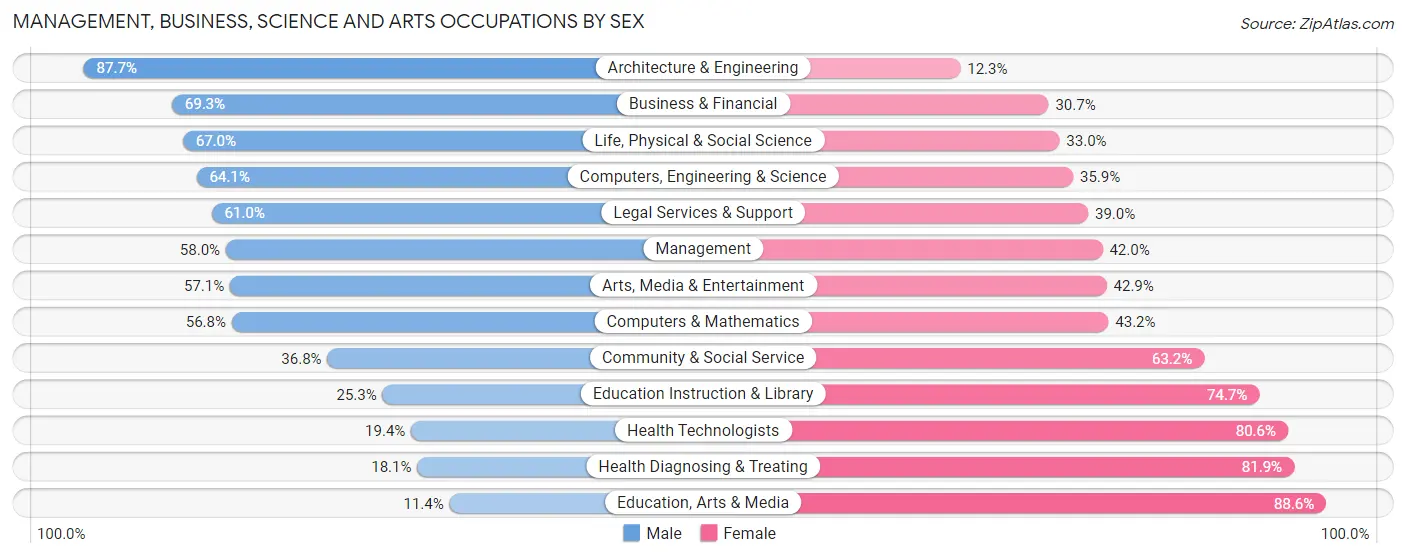
| Occupation | Male | Female |
| Management | 478 (58.0%) | 346 (42.0%) |
| Business & Financial | 302 (69.3%) | 134 (30.7%) |
| Computers, Engineering & Science | 288 (64.1%) | 161 (35.9%) |
| Computers & Mathematics | 155 (56.8%) | 118 (43.2%) |
| Architecture & Engineering | 64 (87.7%) | 9 (12.3%) |
| Life, Physical & Social Science | 69 (67.0%) | 34 (33.0%) |
| Community & Social Service | 235 (36.8%) | 403 (63.2%) |
| Education, Arts & Media | 10 (11.4%) | 78 (88.6%) |
| Legal Services & Support | 97 (61.0%) | 62 (39.0%) |
| Education Instruction & Library | 76 (25.3%) | 224 (74.7%) |
| Arts, Media & Entertainment | 52 (57.1%) | 39 (42.9%) |
| Health Diagnosing & Treating | 83 (18.1%) | 376 (81.9%) |
| Health Technologists | 73 (19.4%) | 304 (80.6%) |
| Total (Category) | 1,386 (49.4%) | 1,420 (50.6%) |
| Total (Overall) | 2,747 (54.5%) | 2,290 (45.5%) |
Services Occupations
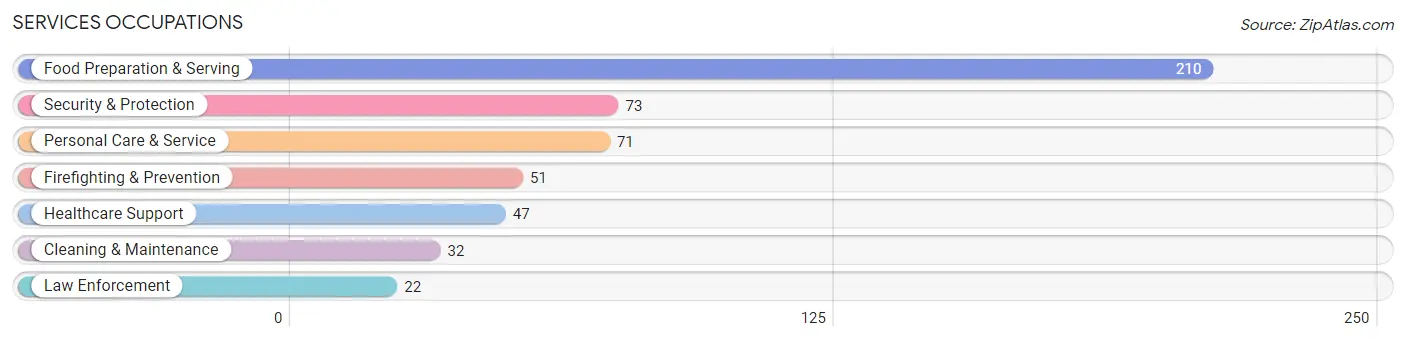
The most common Services occupations in Kinnelon borough are Food Preparation & Serving (210 | 4.2%), Security & Protection (73 | 1.5%), Personal Care & Service (71 | 1.4%), Firefighting & Prevention (51 | 1.0%), and Healthcare Support (47 | 0.9%).
Services Occupations by Sex
Within the Services occupations in Kinnelon borough, the most male-oriented occupations are Law Enforcement (100.0%), Cleaning & Maintenance (100.0%), and Security & Protection (82.2%), while the most female-oriented occupations are Personal Care & Service (100.0%), Healthcare Support (74.5%), and Food Preparation & Serving (47.1%).
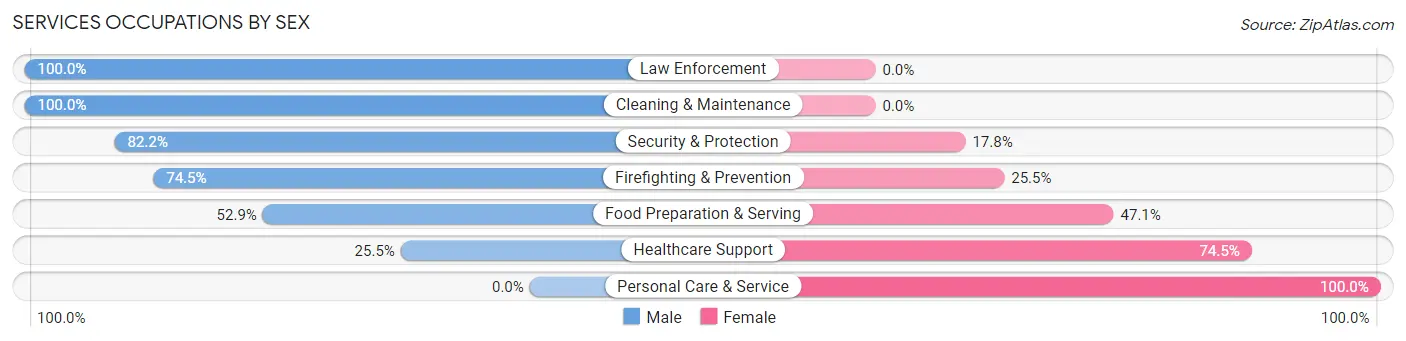
| Occupation | Male | Female |
| Healthcare Support | 12 (25.5%) | 35 (74.5%) |
| Security & Protection | 60 (82.2%) | 13 (17.8%) |
| Firefighting & Prevention | 38 (74.5%) | 13 (25.5%) |
| Law Enforcement | 22 (100.0%) | 0 (0.0%) |
| Food Preparation & Serving | 111 (52.9%) | 99 (47.1%) |
| Cleaning & Maintenance | 32 (100.0%) | 0 (0.0%) |
| Personal Care & Service | 0 (0.0%) | 71 (100.0%) |
| Total (Category) | 215 (49.6%) | 218 (50.3%) |
| Total (Overall) | 2,747 (54.5%) | 2,290 (45.5%) |
Sales and Office Occupations
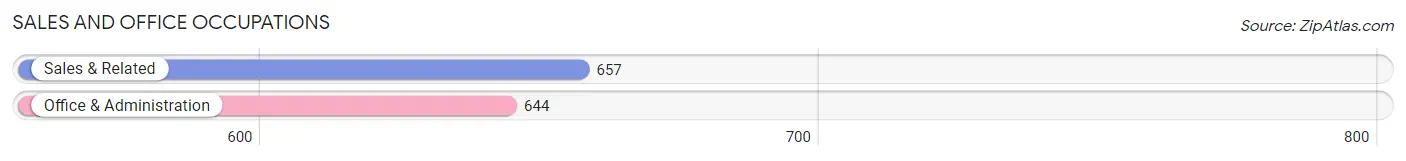
The most common Sales and Office occupations in Kinnelon borough are Sales & Related (657 | 13.0%), and Office & Administration (644 | 12.8%).
Sales and Office Occupations by Sex
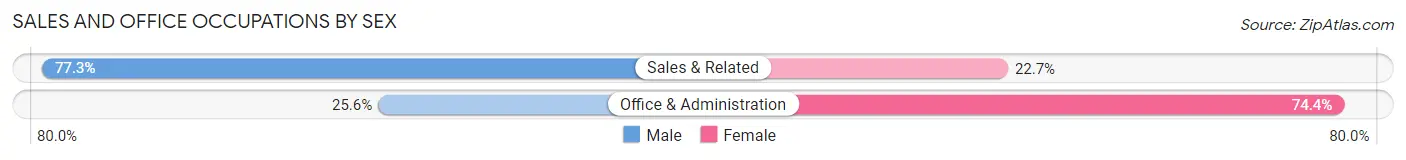
| Occupation | Male | Female |
| Sales & Related | 508 (77.3%) | 149 (22.7%) |
| Office & Administration | 165 (25.6%) | 479 (74.4%) |
| Total (Category) | 673 (51.7%) | 628 (48.3%) |
| Total (Overall) | 2,747 (54.5%) | 2,290 (45.5%) |
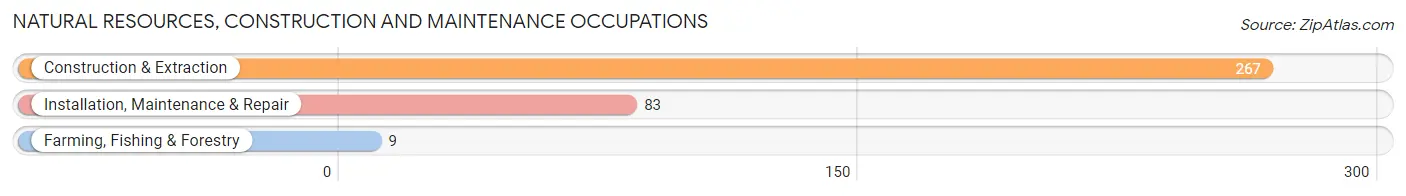
Natural Resources, Construction and Maintenance Occupations
The most common Natural Resources, Construction and Maintenance occupations in Kinnelon borough are Construction & Extraction (267 | 5.3%), Installation, Maintenance & Repair (83 | 1.7%), and Farming, Fishing & Forestry (9 | 0.2%).
Natural Resources, Construction and Maintenance Occupations by Sex
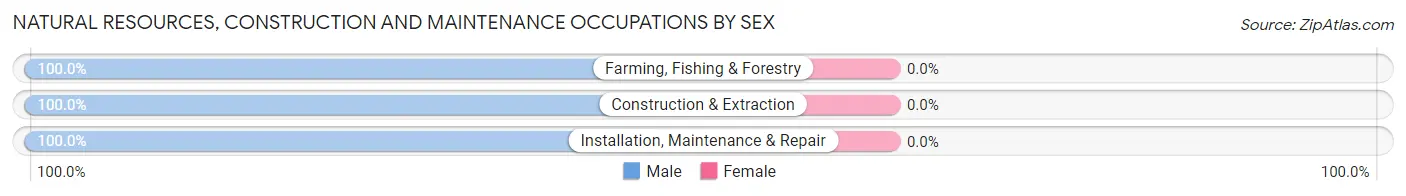
| Occupation | Male | Female |
| Farming, Fishing & Forestry | 9 (100.0%) | 0 (0.0%) |
| Construction & Extraction | 267 (100.0%) | 0 (0.0%) |
| Installation, Maintenance & Repair | 83 (100.0%) | 0 (0.0%) |
| Total (Category) | 359 (100.0%) | 0 (0.0%) |
| Total (Overall) | 2,747 (54.5%) | 2,290 (45.5%) |
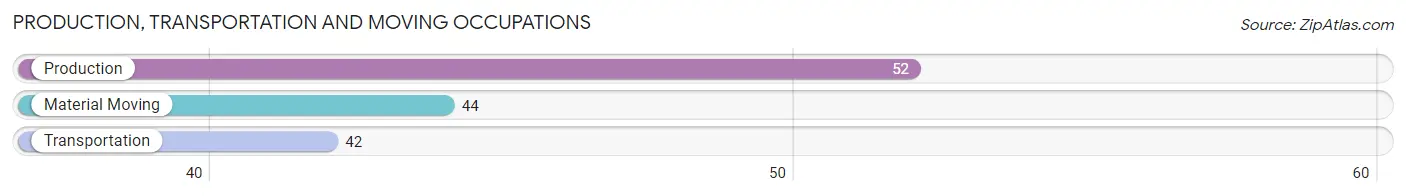
Production, Transportation and Moving Occupations
The most common Production, Transportation and Moving occupations in Kinnelon borough are Production (52 | 1.0%), Material Moving (44 | 0.9%), and Transportation (42 | 0.8%).
Production, Transportation and Moving Occupations by Sex
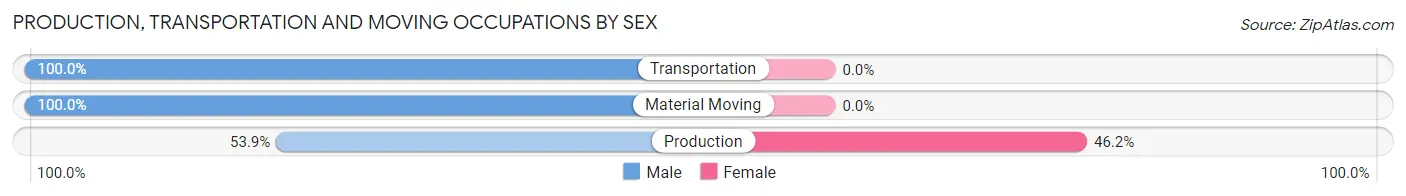
| Occupation | Male | Female |
| Production | 28 (53.8%) | 24 (46.2%) |
| Transportation | 42 (100.0%) | 0 (0.0%) |
| Material Moving | 44 (100.0%) | 0 (0.0%) |
| Total (Category) | 114 (82.6%) | 24 (17.4%) |
| Total (Overall) | 2,747 (54.5%) | 2,290 (45.5%) |
Employment Industries by Sex in Kinnelon borough
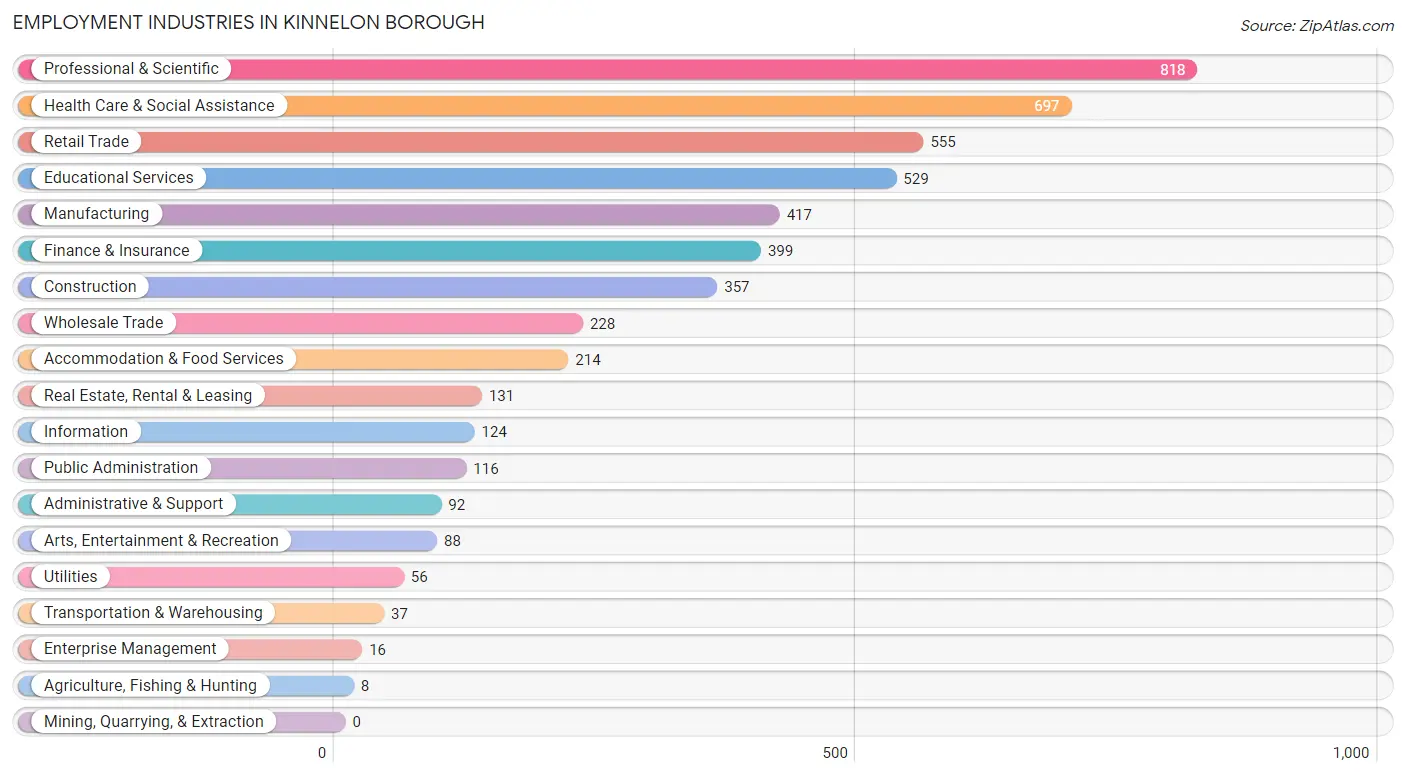
Employment Industries in Kinnelon borough
The major employment industries in Kinnelon borough include Professional & Scientific (818 | 16.2%), Health Care & Social Assistance (697 | 13.8%), Retail Trade (555 | 11.0%), Educational Services (529 | 10.5%), and Manufacturing (417 | 8.3%).
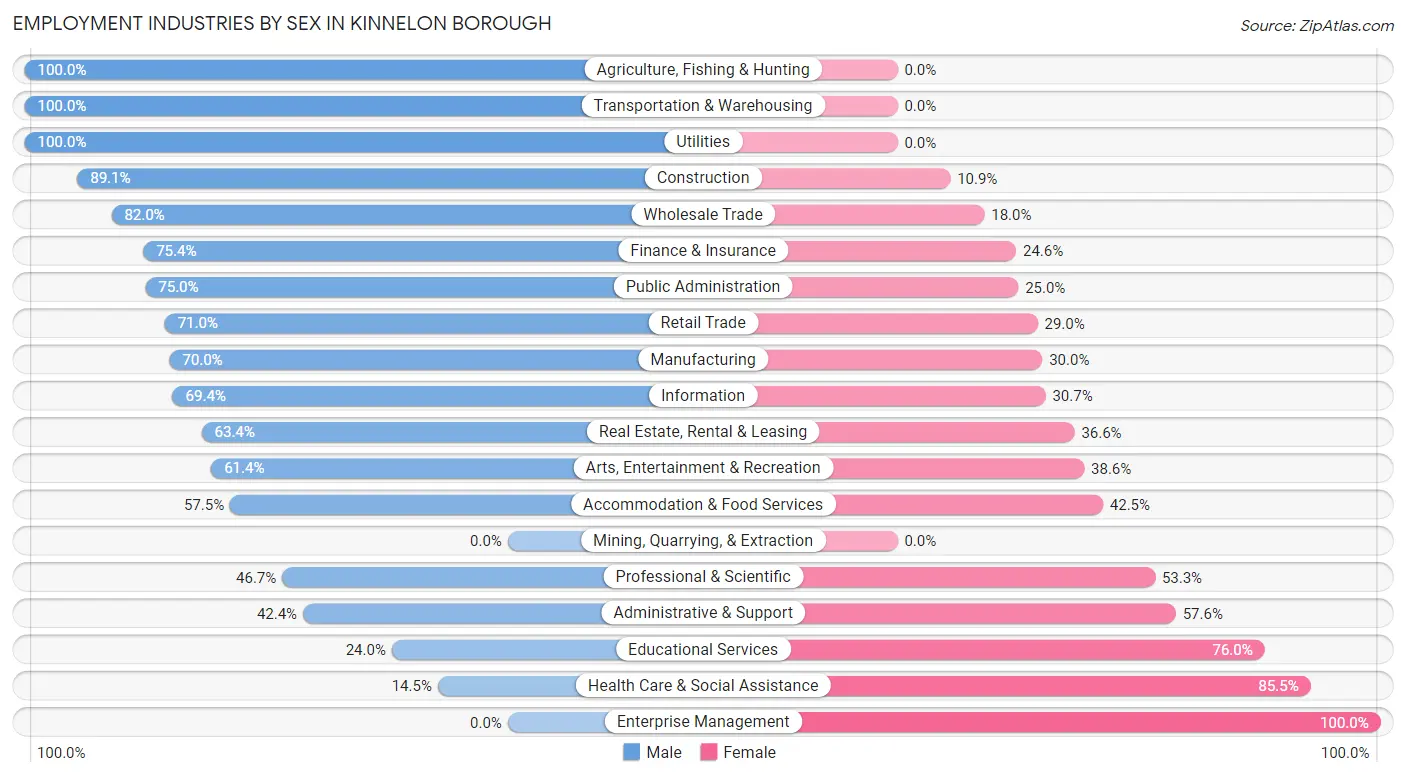
Employment Industries by Sex in Kinnelon borough
The Kinnelon borough industries that see more men than women are Agriculture, Fishing & Hunting (100.0%), Transportation & Warehousing (100.0%), and Utilities (100.0%), whereas the industries that tend to have a higher number of women are Enterprise Management (100.0%), Health Care & Social Assistance (85.5%), and Educational Services (76.0%).
| Industry | Male | Female |
| Agriculture, Fishing & Hunting | 8 (100.0%) | 0 (0.0%) |
| Mining, Quarrying, & Extraction | 0 (0.0%) | 0 (0.0%) |
| Construction | 318 (89.1%) | 39 (10.9%) |
| Manufacturing | 292 (70.0%) | 125 (30.0%) |
| Wholesale Trade | 187 (82.0%) | 41 (18.0%) |
| Retail Trade | 394 (71.0%) | 161 (29.0%) |
| Transportation & Warehousing | 37 (100.0%) | 0 (0.0%) |
| Utilities | 56 (100.0%) | 0 (0.0%) |
| Information | 86 (69.4%) | 38 (30.6%) |
| Finance & Insurance | 301 (75.4%) | 98 (24.6%) |
| Real Estate, Rental & Leasing | 83 (63.4%) | 48 (36.6%) |
| Professional & Scientific | 382 (46.7%) | 436 (53.3%) |
| Enterprise Management | 0 (0.0%) | 16 (100.0%) |
| Administrative & Support | 39 (42.4%) | 53 (57.6%) |
| Educational Services | 127 (24.0%) | 402 (76.0%) |
| Health Care & Social Assistance | 101 (14.5%) | 596 (85.5%) |
| Arts, Entertainment & Recreation | 54 (61.4%) | 34 (38.6%) |
| Accommodation & Food Services | 123 (57.5%) | 91 (42.5%) |
| Public Administration | 87 (75.0%) | 29 (25.0%) |
| Total | 2,747 (54.5%) | 2,290 (45.5%) |
Education in Kinnelon borough
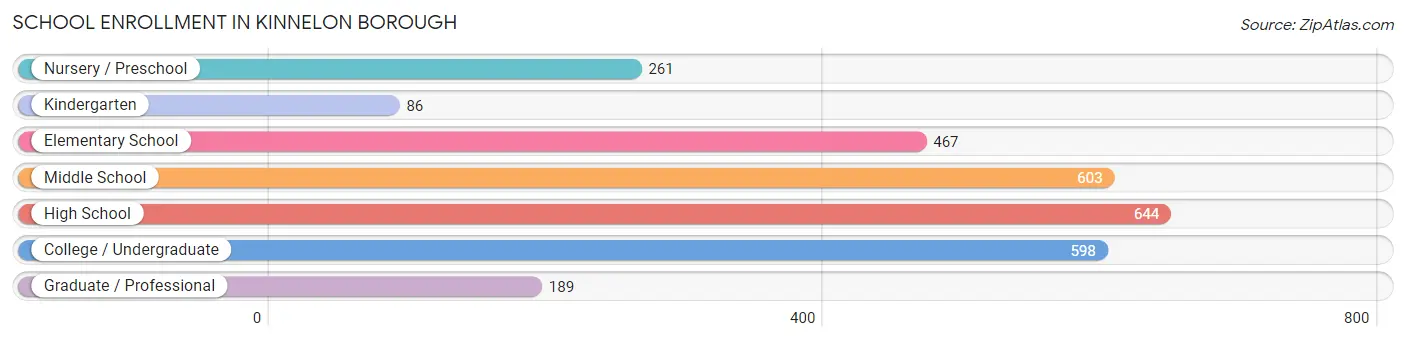
School Enrollment in Kinnelon borough
The most common levels of schooling among the 2,848 students in Kinnelon borough are high school (644 | 22.6%), middle school (603 | 21.2%), and college / undergraduate (598 | 21.0%).
| School Level | # Students | % Students |
| Nursery / Preschool | 261 | 9.2% |
| Kindergarten | 86 | 3.0% |
| Elementary School | 467 | 16.4% |
| Middle School | 603 | 21.2% |
| High School | 644 | 22.6% |
| College / Undergraduate | 598 | 21.0% |
| Graduate / Professional | 189 | 6.6% |
| Total | 2,848 | 100.0% |
School Enrollment by Age by Funding Source in Kinnelon borough
Out of a total of 2,848 students who are enrolled in schools in Kinnelon borough, 883 (31.0%) attend a private institution, while the remaining 1,965 (69.0%) are enrolled in public schools. The age group of 3 to 4 year olds has the highest likelihood of being enrolled in private schools, with 142 (72.1% in the age bracket) enrolled. Conversely, the age group of 15 to 17 year olds has the lowest likelihood of being enrolled in a private school, with 396 (94.5% in the age bracket) attending a public institution.
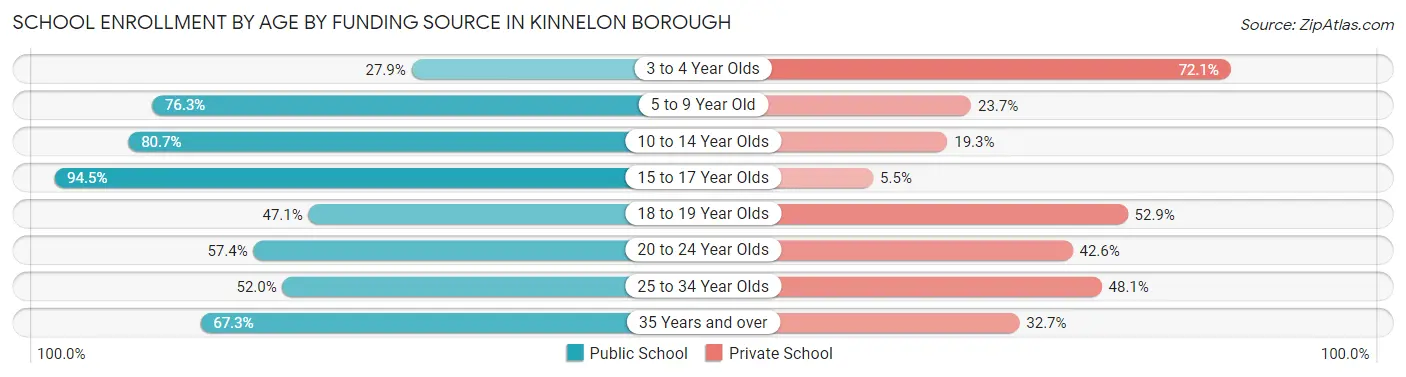
| Age Bracket | Public School | Private School |
| 3 to 4 Year Olds | 55 (27.9%) | 142 (72.1%) |
| 5 to 9 Year Old | 431 (76.3%) | 134 (23.7%) |
| 10 to 14 Year Olds | 577 (80.7%) | 138 (19.3%) |
| 15 to 17 Year Olds | 396 (94.5%) | 23 (5.5%) |
| 18 to 19 Year Olds | 171 (47.1%) | 192 (52.9%) |
| 20 to 24 Year Olds | 218 (57.4%) | 162 (42.6%) |
| 25 to 34 Year Olds | 80 (51.9%) | 74 (48.0%) |
| 35 Years and over | 37 (67.3%) | 18 (32.7%) |
| Total | 1,965 (69.0%) | 883 (31.0%) |
Educational Attainment by Field of Study in Kinnelon borough
Business (1,551 | 33.0%), education (475 | 10.1%), science & technology (417 | 8.9%), social sciences (356 | 7.6%), and engineering (271 | 5.8%) are the most common fields of study among 4,699 individuals in Kinnelon borough who have obtained a bachelor's degree or higher.
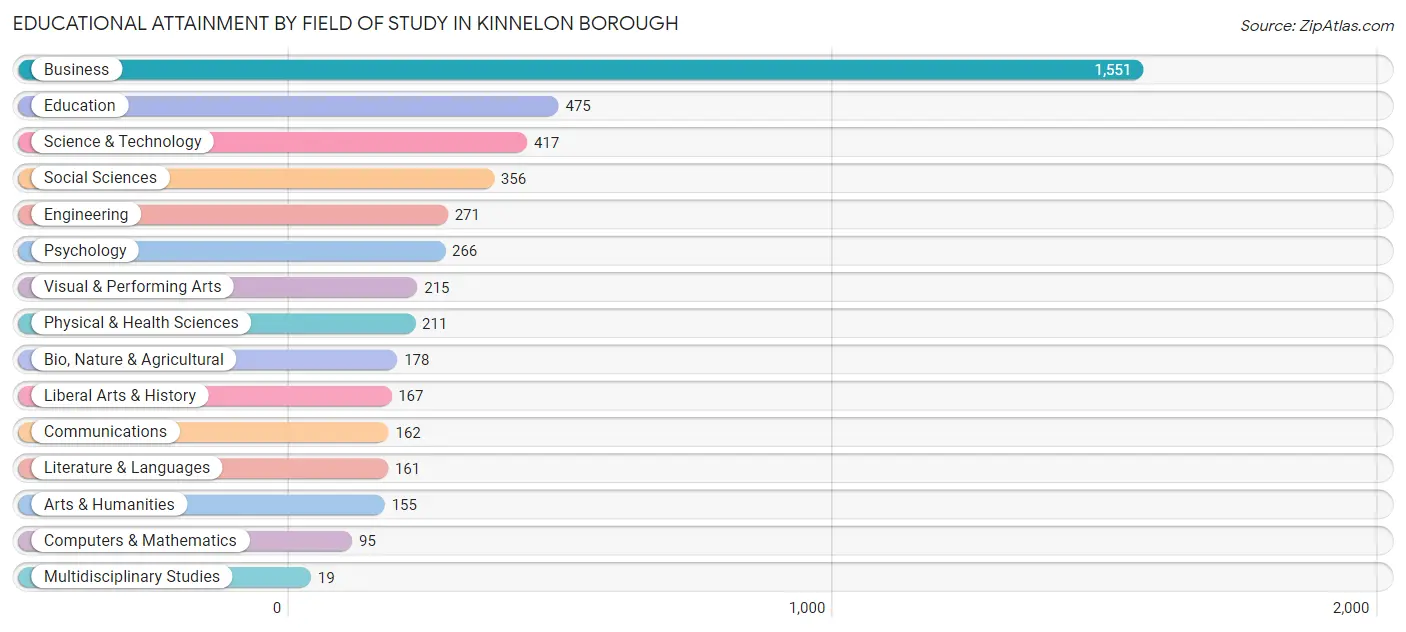
| Field of Study | # Graduates | % Graduates |
| Computers & Mathematics | 95 | 2.0% |
| Bio, Nature & Agricultural | 178 | 3.8% |
| Physical & Health Sciences | 211 | 4.5% |
| Psychology | 266 | 5.7% |
| Social Sciences | 356 | 7.6% |
| Engineering | 271 | 5.8% |
| Multidisciplinary Studies | 19 | 0.4% |
| Science & Technology | 417 | 8.9% |
| Business | 1,551 | 33.0% |
| Education | 475 | 10.1% |
| Literature & Languages | 161 | 3.4% |
| Liberal Arts & History | 167 | 3.5% |
| Visual & Performing Arts | 215 | 4.6% |
| Communications | 162 | 3.5% |
| Arts & Humanities | 155 | 3.3% |
| Total | 4,699 | 100.0% |
Transportation & Commute in Kinnelon borough
Vehicle Availability by Sex in Kinnelon borough
The most prevalent vehicle ownership categories in Kinnelon borough are males with 2 vehicles (833, accounting for 31.1%) and females with 2 vehicles (869, making up 37.9%).
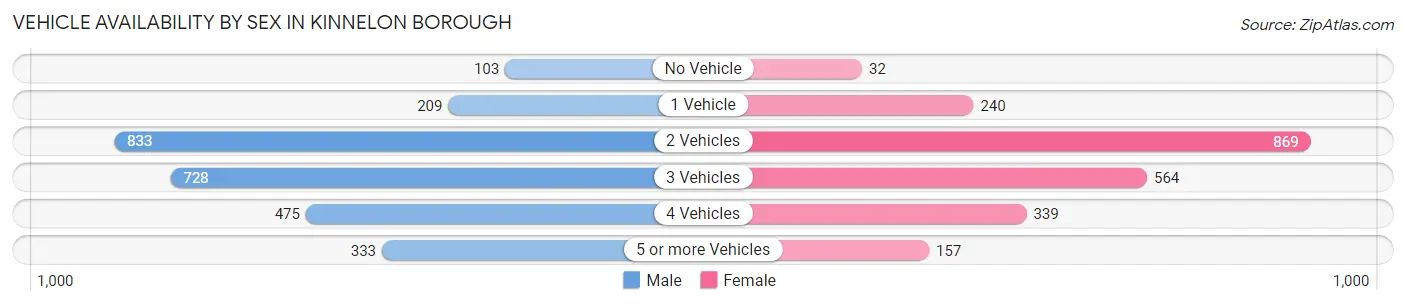
| Vehicles Available | Male | Female |
| No Vehicle | 103 (3.8%) | 32 (1.5%) |
| 1 Vehicle | 209 (7.8%) | 240 (10.9%) |
| 2 Vehicles | 833 (31.1%) | 869 (39.5%) |
| 3 Vehicles | 728 (27.2%) | 564 (25.6%) |
| 4 Vehicles | 475 (17.7%) | 339 (15.4%) |
| 5 or more Vehicles | 333 (12.4%) | 157 (7.1%) |
| Total | 2,681 (100.0%) | 2,201 (100.0%) |
Commute Time in Kinnelon borough
The most frequently occuring commute durations in Kinnelon borough are 30 to 34 minutes (692 commuters, 16.8%), 45 to 59 minutes (489 commuters, 11.9%), and 60 to 89 minutes (454 commuters, 11.0%).
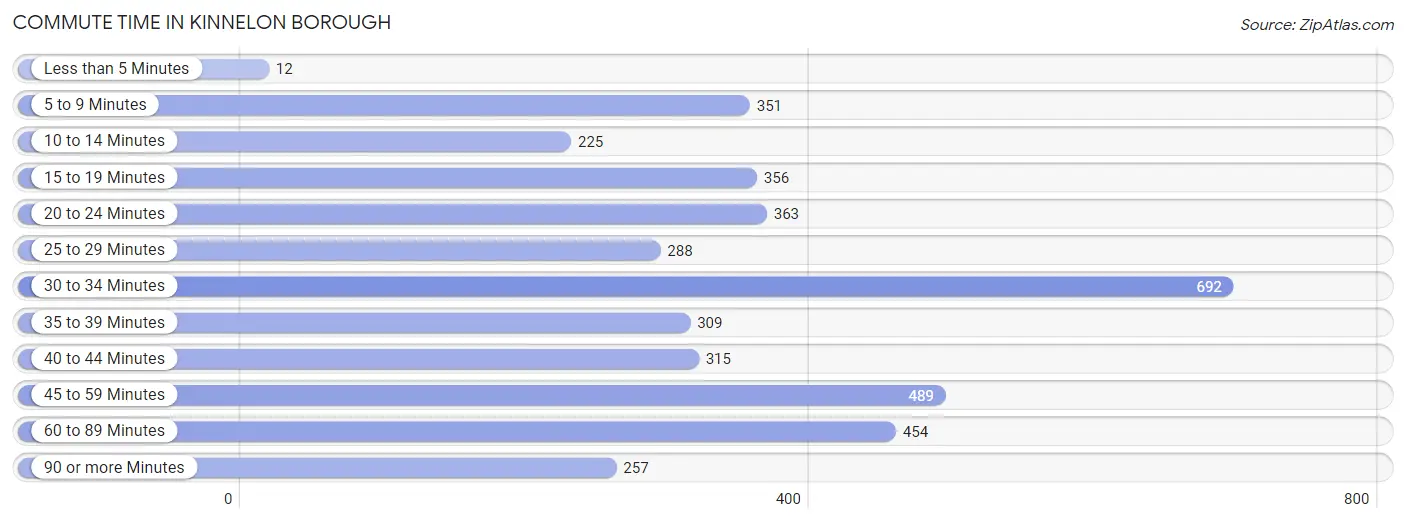
| Commute Time | # Commuters | % Commuters |
| Less than 5 Minutes | 12 | 0.3% |
| 5 to 9 Minutes | 351 | 8.5% |
| 10 to 14 Minutes | 225 | 5.5% |
| 15 to 19 Minutes | 356 | 8.7% |
| 20 to 24 Minutes | 363 | 8.8% |
| 25 to 29 Minutes | 288 | 7.0% |
| 30 to 34 Minutes | 692 | 16.8% |
| 35 to 39 Minutes | 309 | 7.5% |
| 40 to 44 Minutes | 315 | 7.7% |
| 45 to 59 Minutes | 489 | 11.9% |
| 60 to 89 Minutes | 454 | 11.0% |
| 90 or more Minutes | 257 | 6.2% |
Commute Time by Sex in Kinnelon borough
The most common commute times in Kinnelon borough are 60 to 89 minutes (396 commuters, 17.3%) for males and 30 to 34 minutes (312 commuters, 17.2%) for females.
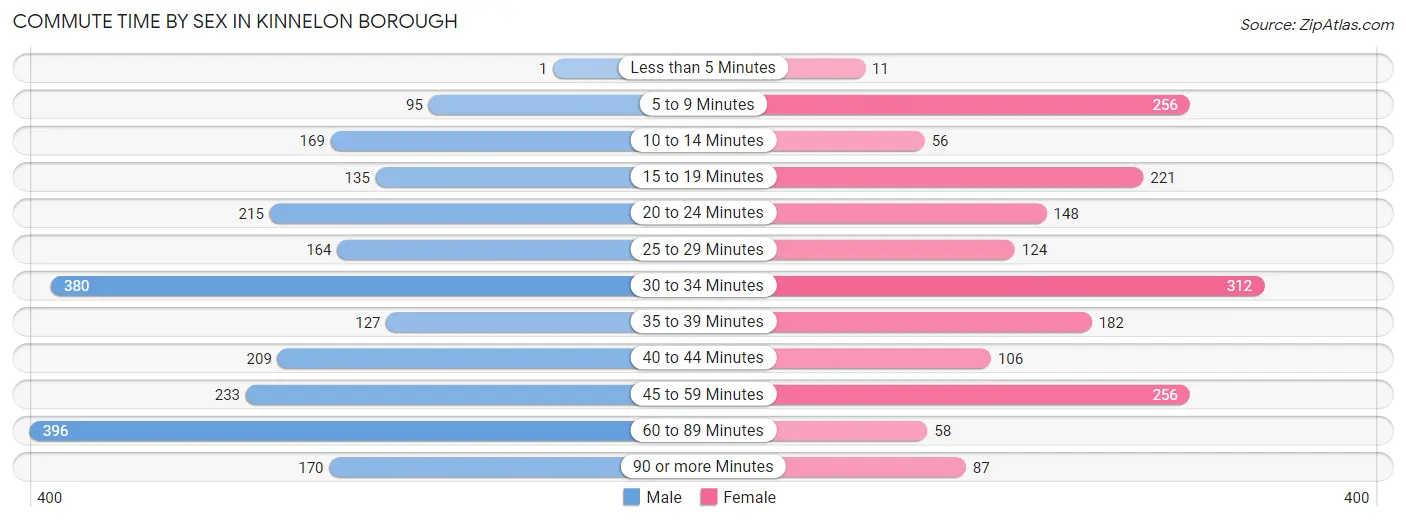
| Commute Time | Male | Female |
| Less than 5 Minutes | 1 (0.0%) | 11 (0.6%) |
| 5 to 9 Minutes | 95 (4.1%) | 256 (14.1%) |
| 10 to 14 Minutes | 169 (7.4%) | 56 (3.1%) |
| 15 to 19 Minutes | 135 (5.9%) | 221 (12.2%) |
| 20 to 24 Minutes | 215 (9.4%) | 148 (8.2%) |
| 25 to 29 Minutes | 164 (7.1%) | 124 (6.8%) |
| 30 to 34 Minutes | 380 (16.6%) | 312 (17.2%) |
| 35 to 39 Minutes | 127 (5.5%) | 182 (10.0%) |
| 40 to 44 Minutes | 209 (9.1%) | 106 (5.8%) |
| 45 to 59 Minutes | 233 (10.2%) | 256 (14.1%) |
| 60 to 89 Minutes | 396 (17.3%) | 58 (3.2%) |
| 90 or more Minutes | 170 (7.4%) | 87 (4.8%) |
Time of Departure to Work by Sex in Kinnelon borough
The most frequent times of departure to work in Kinnelon borough are 8:00 AM to 8:29 AM (419, 18.3%) for males and 9:00 AM to 9:59 AM (484, 26.6%) for females.
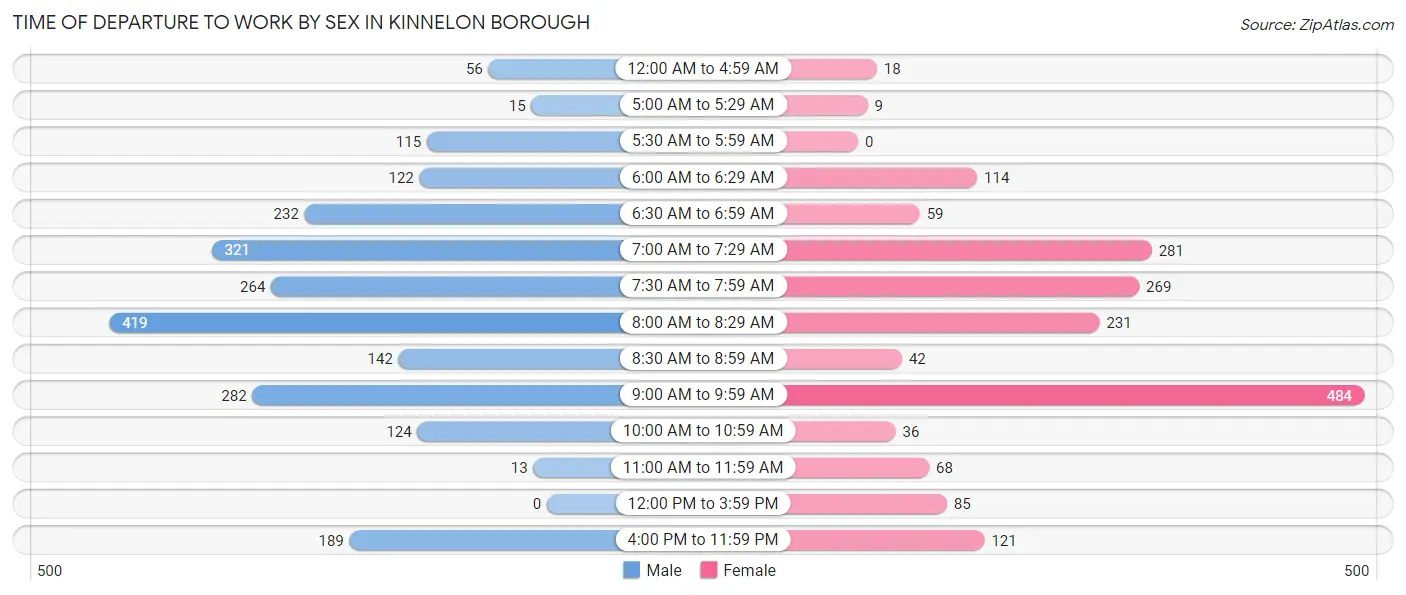
| Time of Departure | Male | Female |
| 12:00 AM to 4:59 AM | 56 (2.4%) | 18 (1.0%) |
| 5:00 AM to 5:29 AM | 15 (0.6%) | 9 (0.5%) |
| 5:30 AM to 5:59 AM | 115 (5.0%) | 0 (0.0%) |
| 6:00 AM to 6:29 AM | 122 (5.3%) | 114 (6.3%) |
| 6:30 AM to 6:59 AM | 232 (10.1%) | 59 (3.3%) |
| 7:00 AM to 7:29 AM | 321 (14.0%) | 281 (15.5%) |
| 7:30 AM to 7:59 AM | 264 (11.5%) | 269 (14.8%) |
| 8:00 AM to 8:29 AM | 419 (18.3%) | 231 (12.7%) |
| 8:30 AM to 8:59 AM | 142 (6.2%) | 42 (2.3%) |
| 9:00 AM to 9:59 AM | 282 (12.3%) | 484 (26.6%) |
| 10:00 AM to 10:59 AM | 124 (5.4%) | 36 (2.0%) |
| 11:00 AM to 11:59 AM | 13 (0.6%) | 68 (3.7%) |
| 12:00 PM to 3:59 PM | 0 (0.0%) | 85 (4.7%) |
| 4:00 PM to 11:59 PM | 189 (8.2%) | 121 (6.7%) |
| Total | 2,294 (100.0%) | 1,817 (100.0%) |
Housing Occupancy in Kinnelon borough
Occupancy by Ownership in Kinnelon borough
Of the total 3,347 dwellings in Kinnelon borough, owner-occupied units account for 3,084 (92.1%), while renter-occupied units make up 263 (7.9%).
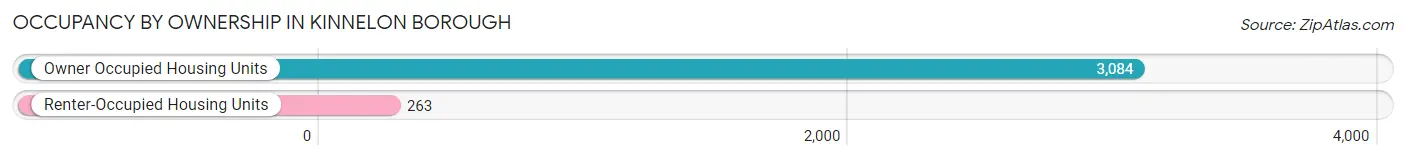
| Occupancy | # Housing Units | % Housing Units |
| Owner Occupied Housing Units | 3,084 | 92.1% |
| Renter-Occupied Housing Units | 263 | 7.9% |
| Total Occupied Housing Units | 3,347 | 100.0% |
Occupancy by Household Size in Kinnelon borough
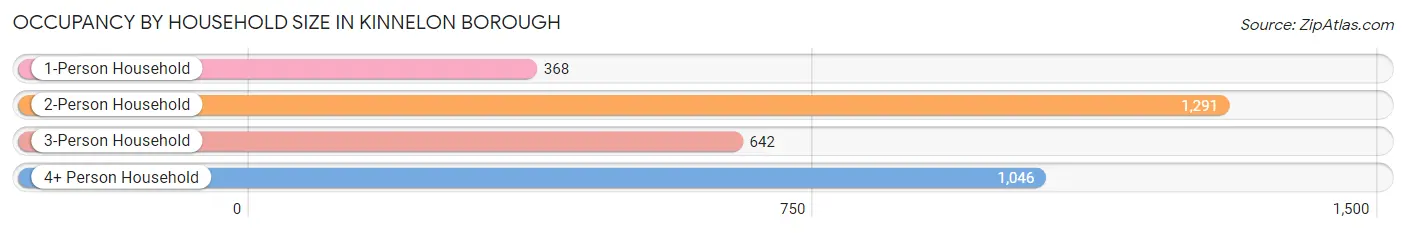
| Household Size | # Housing Units | % Housing Units |
| 1-Person Household | 368 | 11.0% |
| 2-Person Household | 1,291 | 38.6% |
| 3-Person Household | 642 | 19.2% |
| 4+ Person Household | 1,046 | 31.2% |
| Total Housing Units | 3,347 | 100.0% |
Occupancy by Ownership by Household Size in Kinnelon borough
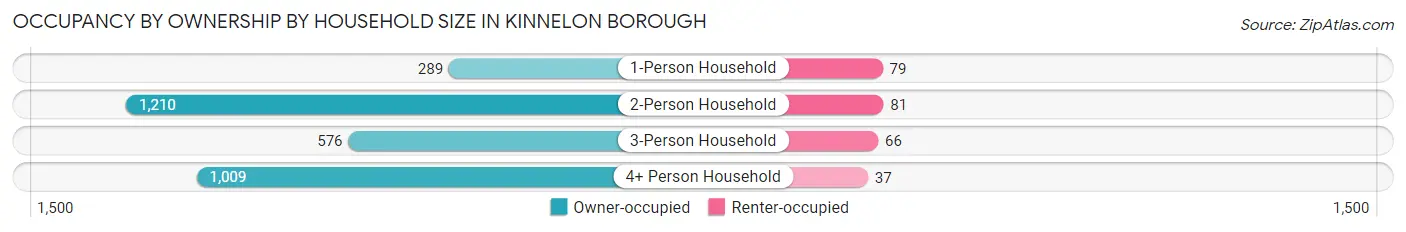
| Household Size | Owner-occupied | Renter-occupied |
| 1-Person Household | 289 (78.5%) | 79 (21.5%) |
| 2-Person Household | 1,210 (93.7%) | 81 (6.3%) |
| 3-Person Household | 576 (89.7%) | 66 (10.3%) |
| 4+ Person Household | 1,009 (96.5%) | 37 (3.5%) |
| Total Housing Units | 3,084 (92.1%) | 263 (7.9%) |
Occupancy by Educational Attainment in Kinnelon borough
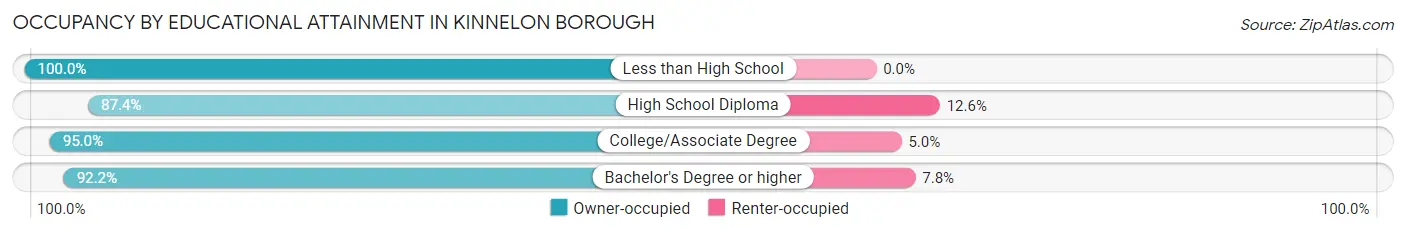
| Household Size | Owner-occupied | Renter-occupied |
| Less than High School | 30 (100.0%) | 0 (0.0%) |
| High School Diploma | 326 (87.4%) | 47 (12.6%) |
| College/Associate Degree | 436 (95.0%) | 23 (5.0%) |
| Bachelor's Degree or higher | 2,292 (92.2%) | 193 (7.8%) |
Occupancy by Age of Householder in Kinnelon borough
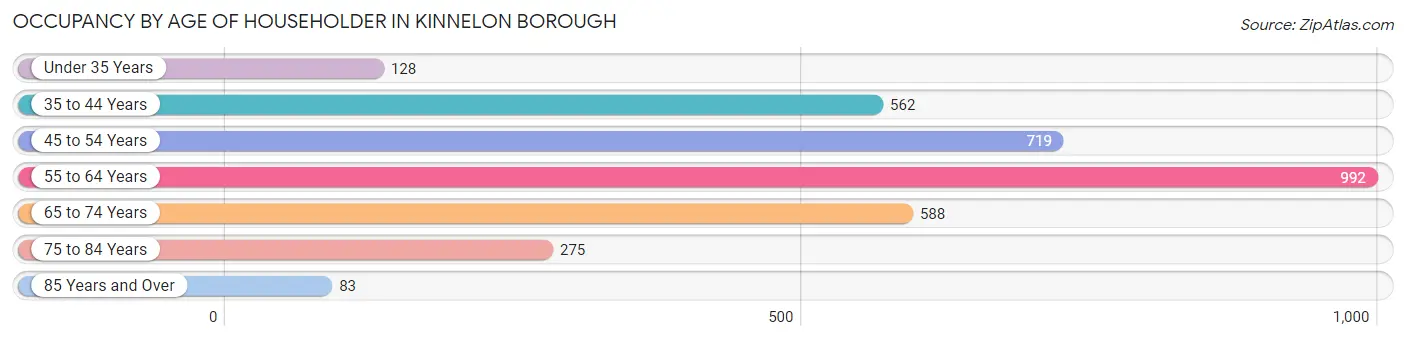
| Age Bracket | # Households | % Households |
| Under 35 Years | 128 | 3.8% |
| 35 to 44 Years | 562 | 16.8% |
| 45 to 54 Years | 719 | 21.5% |
| 55 to 64 Years | 992 | 29.6% |
| 65 to 74 Years | 588 | 17.6% |
| 75 to 84 Years | 275 | 8.2% |
| 85 Years and Over | 83 | 2.5% |
| Total | 3,347 | 100.0% |
Housing Finances in Kinnelon borough
Median Income by Occupancy in Kinnelon borough
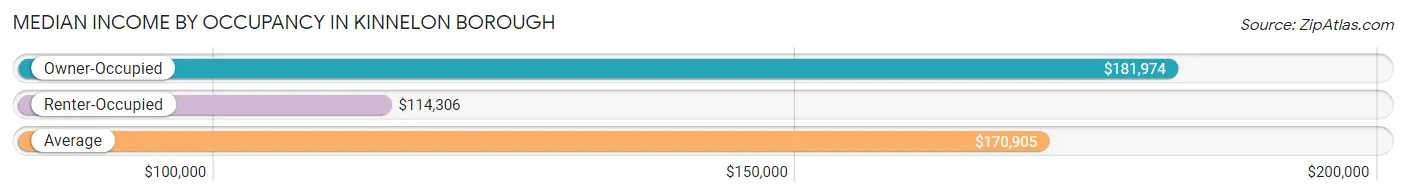
| Occupancy Type | # Households | Median Income |
| Owner-Occupied | 3,084 (92.1%) | $181,974 |
| Renter-Occupied | 263 (7.9%) | $114,306 |
| Average | 3,347 (100.0%) | $170,905 |
Occupancy by Householder Income Bracket in Kinnelon borough
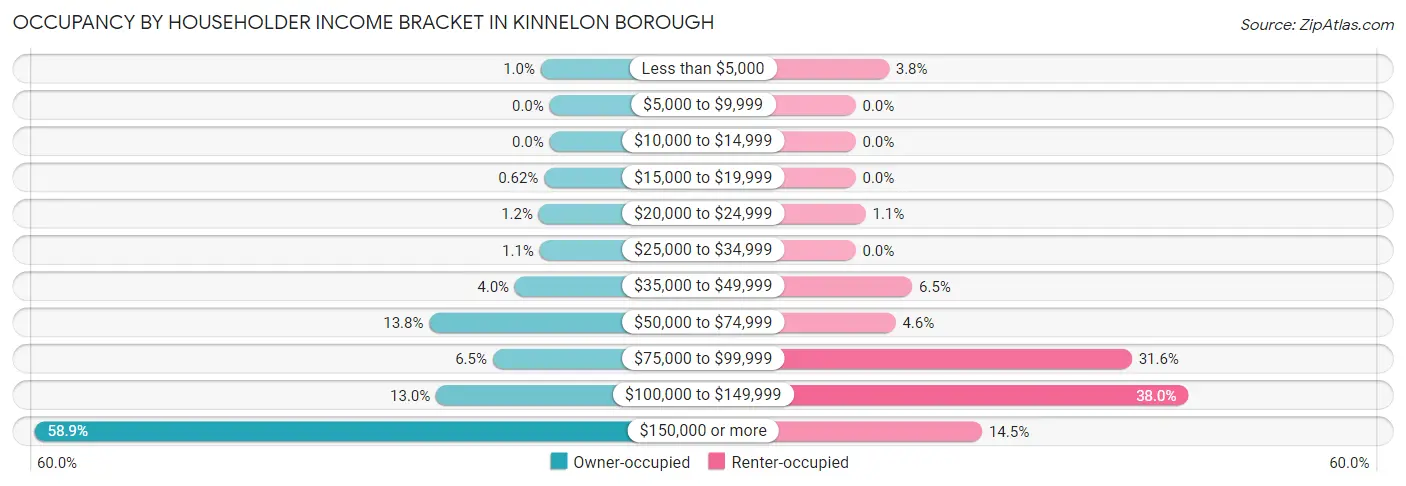
| Income Bracket | Owner-occupied | Renter-occupied |
| Less than $5,000 | 31 (1.0%) | 10 (3.8%) |
| $5,000 to $9,999 | 0 (0.0%) | 0 (0.0%) |
| $10,000 to $14,999 | 0 (0.0%) | 0 (0.0%) |
| $15,000 to $19,999 | 19 (0.6%) | 0 (0.0%) |
| $20,000 to $24,999 | 38 (1.2%) | 3 (1.1%) |
| $25,000 to $34,999 | 35 (1.1%) | 0 (0.0%) |
| $35,000 to $49,999 | 122 (4.0%) | 17 (6.5%) |
| $50,000 to $74,999 | 424 (13.8%) | 12 (4.6%) |
| $75,000 to $99,999 | 200 (6.5%) | 83 (31.6%) |
| $100,000 to $149,999 | 400 (13.0%) | 100 (38.0%) |
| $150,000 or more | 1,815 (58.9%) | 38 (14.4%) |
| Total | 3,084 (100.0%) | 263 (100.0%) |
Monthly Housing Cost Tiers in Kinnelon borough
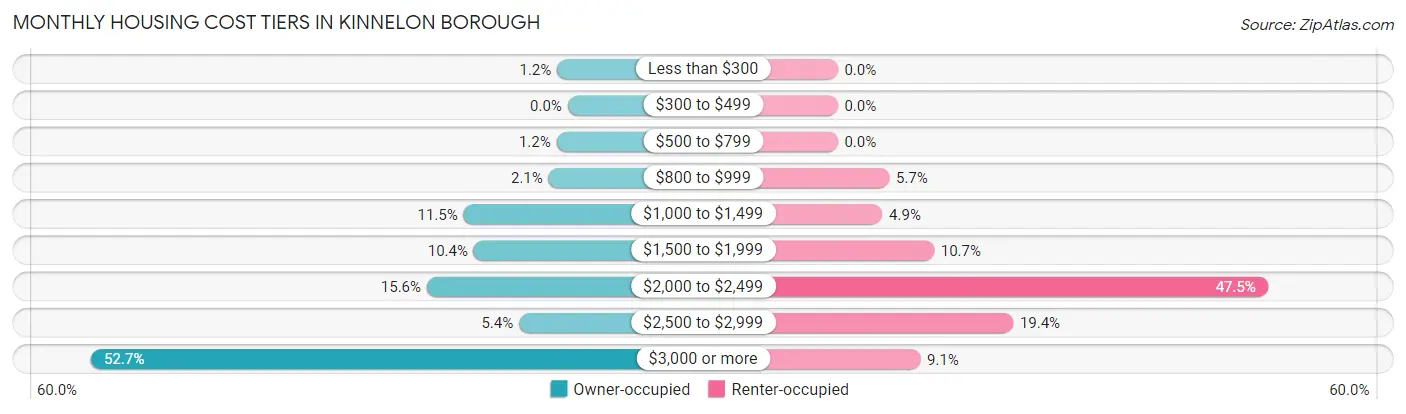
| Monthly Cost | Owner-occupied | Renter-occupied |
| Less than $300 | 36 (1.2%) | 0 (0.0%) |
| $300 to $499 | 0 (0.0%) | 0 (0.0%) |
| $500 to $799 | 38 (1.2%) | 0 (0.0%) |
| $800 to $999 | 65 (2.1%) | 15 (5.7%) |
| $1,000 to $1,499 | 355 (11.5%) | 13 (4.9%) |
| $1,500 to $1,999 | 320 (10.4%) | 28 (10.6%) |
| $2,000 to $2,499 | 480 (15.6%) | 125 (47.5%) |
| $2,500 to $2,999 | 166 (5.4%) | 51 (19.4%) |
| $3,000 or more | 1,624 (52.7%) | 24 (9.1%) |
| Total | 3,084 (100.0%) | 263 (100.0%) |
Physical Housing Characteristics in Kinnelon borough
Housing Structures in Kinnelon borough
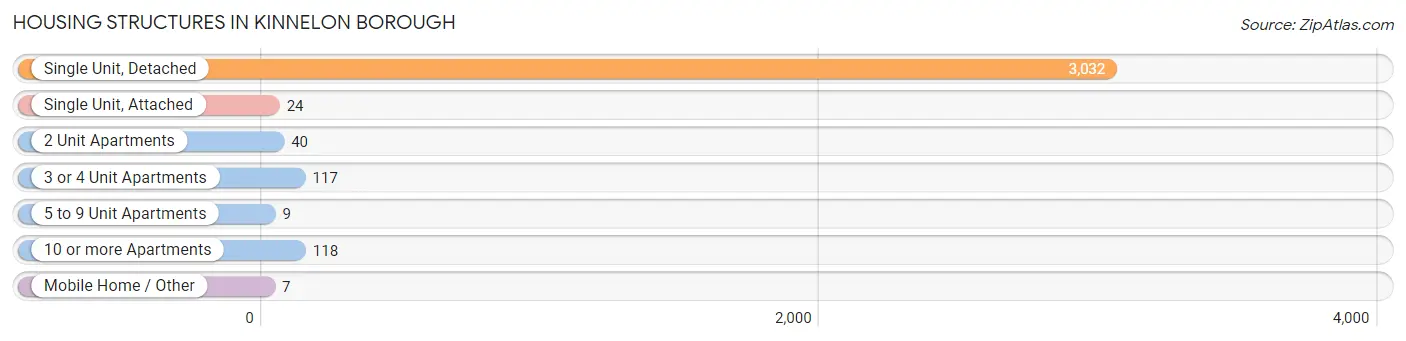
| Structure Type | # Housing Units | % Housing Units |
| Single Unit, Detached | 3,032 | 90.6% |
| Single Unit, Attached | 24 | 0.7% |
| 2 Unit Apartments | 40 | 1.2% |
| 3 or 4 Unit Apartments | 117 | 3.5% |
| 5 to 9 Unit Apartments | 9 | 0.3% |
| 10 or more Apartments | 118 | 3.5% |
| Mobile Home / Other | 7 | 0.2% |
| Total | 3,347 | 100.0% |
Housing Structures by Occupancy in Kinnelon borough
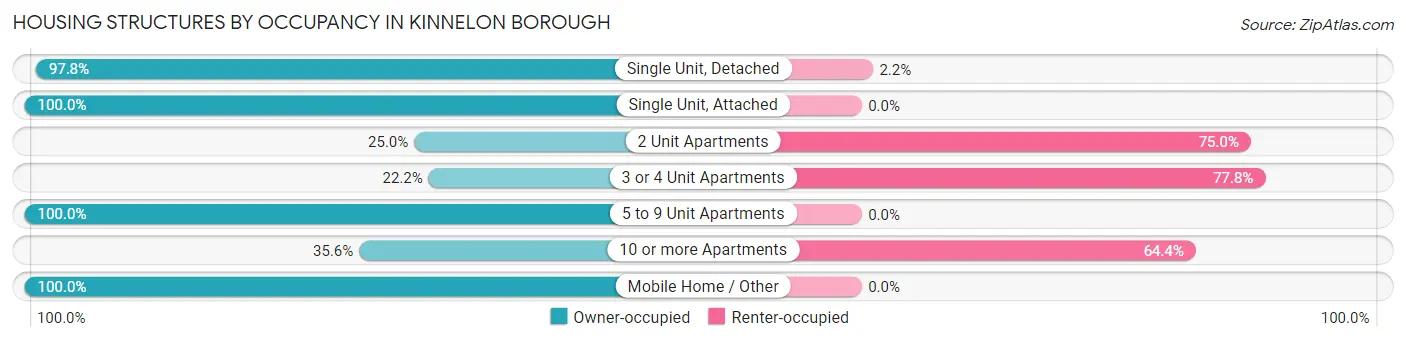
| Structure Type | Owner-occupied | Renter-occupied |
| Single Unit, Detached | 2,966 (97.8%) | 66 (2.2%) |
| Single Unit, Attached | 24 (100.0%) | 0 (0.0%) |
| 2 Unit Apartments | 10 (25.0%) | 30 (75.0%) |
| 3 or 4 Unit Apartments | 26 (22.2%) | 91 (77.8%) |
| 5 to 9 Unit Apartments | 9 (100.0%) | 0 (0.0%) |
| 10 or more Apartments | 42 (35.6%) | 76 (64.4%) |
| Mobile Home / Other | 7 (100.0%) | 0 (0.0%) |
| Total | 3,084 (92.1%) | 263 (7.9%) |
Housing Structures by Number of Rooms in Kinnelon borough
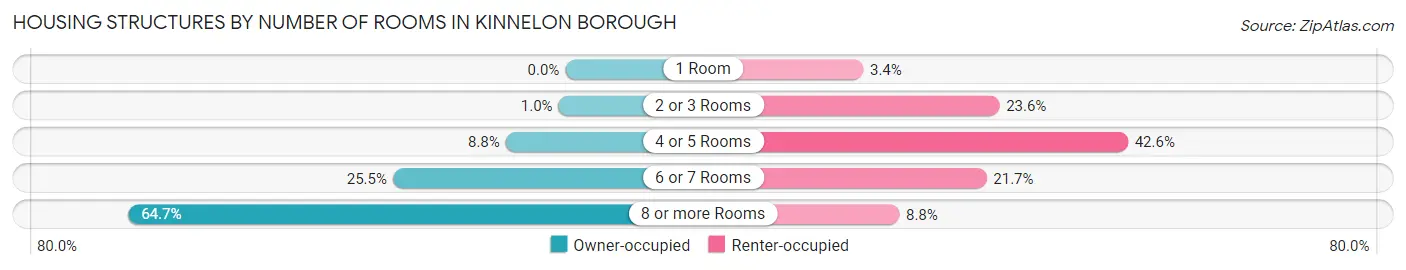
| Number of Rooms | Owner-occupied | Renter-occupied |
| 1 Room | 0 (0.0%) | 9 (3.4%) |
| 2 or 3 Rooms | 31 (1.0%) | 62 (23.6%) |
| 4 or 5 Rooms | 272 (8.8%) | 112 (42.6%) |
| 6 or 7 Rooms | 787 (25.5%) | 57 (21.7%) |
| 8 or more Rooms | 1,994 (64.7%) | 23 (8.7%) |
| Total | 3,084 (100.0%) | 263 (100.0%) |
Housing Structure by Heating Type in Kinnelon borough
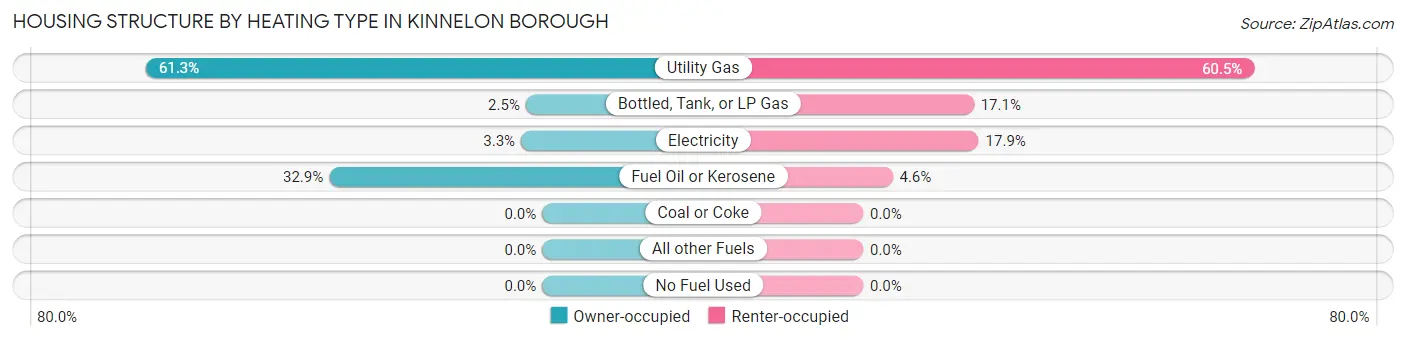
| Heating Type | Owner-occupied | Renter-occupied |
| Utility Gas | 1,889 (61.3%) | 159 (60.5%) |
| Bottled, Tank, or LP Gas | 78 (2.5%) | 45 (17.1%) |
| Electricity | 101 (3.3%) | 47 (17.9%) |
| Fuel Oil or Kerosene | 1,016 (32.9%) | 12 (4.6%) |
| Coal or Coke | 0 (0.0%) | 0 (0.0%) |
| All other Fuels | 0 (0.0%) | 0 (0.0%) |
| No Fuel Used | 0 (0.0%) | 0 (0.0%) |
| Total | 3,084 (100.0%) | 263 (100.0%) |
Household Vehicle Usage in Kinnelon borough
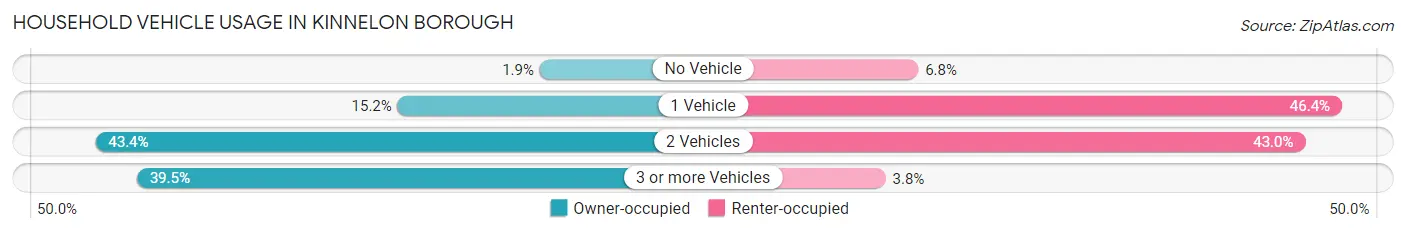
| Vehicles per Household | Owner-occupied | Renter-occupied |
| No Vehicle | 59 (1.9%) | 18 (6.8%) |
| 1 Vehicle | 468 (15.2%) | 122 (46.4%) |
| 2 Vehicles | 1,338 (43.4%) | 113 (43.0%) |
| 3 or more Vehicles | 1,219 (39.5%) | 10 (3.8%) |
| Total | 3,084 (100.0%) | 263 (100.0%) |
Real Estate & Mortgages in Kinnelon borough
Real Estate and Mortgage Overview in Kinnelon borough
| Characteristic | Without Mortgage | With Mortgage |
| Housing Units | 1,160 | 1,924 |
| Median Property Value | $722,500 | $668,900 |
| Median Household Income | $118,971 | $1,331 |
| Monthly Housing Costs | $1,501 | $1,571 |
| Real Estate Taxes | $10,001 | $6 |
Property Value by Mortgage Status in Kinnelon borough
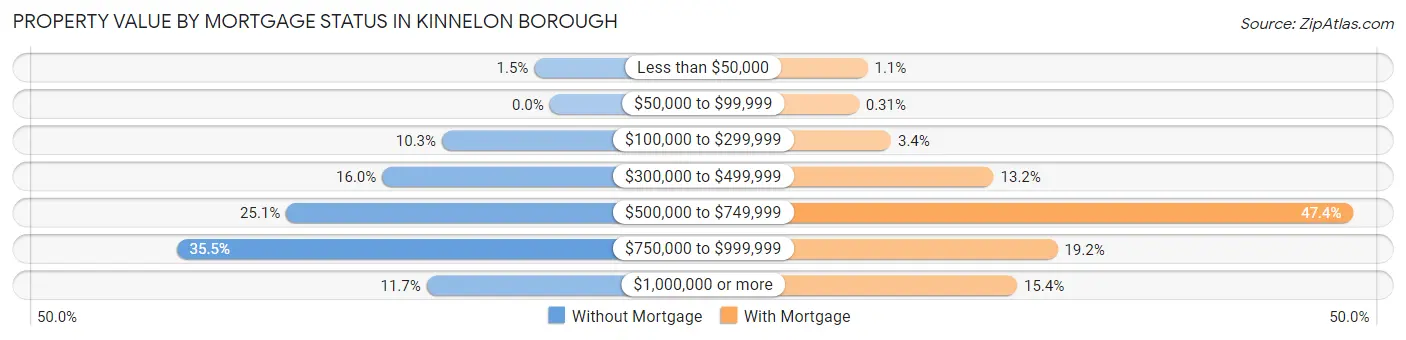
| Property Value | Without Mortgage | With Mortgage |
| Less than $50,000 | 17 (1.5%) | 22 (1.1%) |
| $50,000 to $99,999 | 0 (0.0%) | 6 (0.3%) |
| $100,000 to $299,999 | 119 (10.3%) | 65 (3.4%) |
| $300,000 to $499,999 | 185 (16.0%) | 253 (13.2%) |
| $500,000 to $749,999 | 291 (25.1%) | 912 (47.4%) |
| $750,000 to $999,999 | 412 (35.5%) | 370 (19.2%) |
| $1,000,000 or more | 136 (11.7%) | 296 (15.4%) |
| Total | 1,160 (100.0%) | 1,924 (100.0%) |
Household Income by Mortgage Status in Kinnelon borough
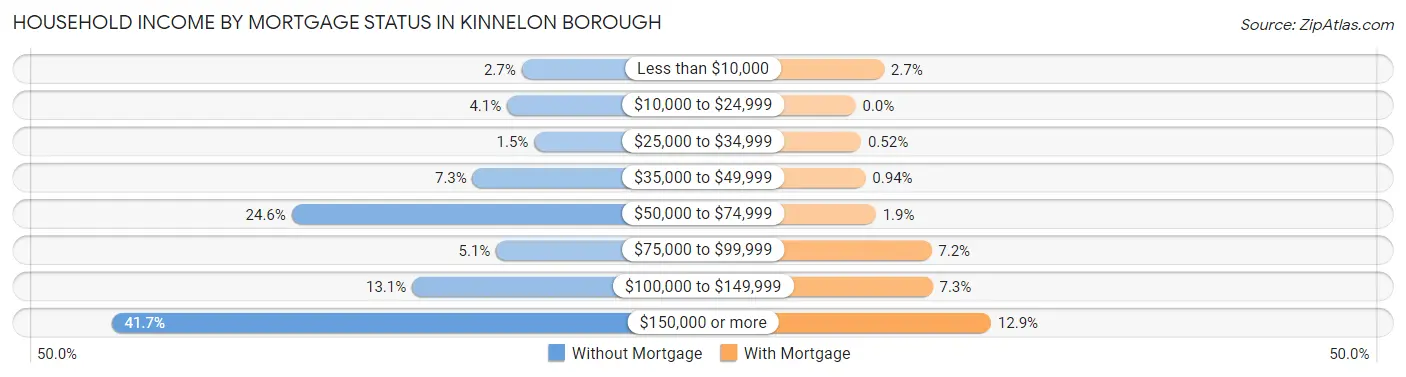
| Household Income | Without Mortgage | With Mortgage |
| Less than $10,000 | 31 (2.7%) | 52 (2.7%) |
| $10,000 to $24,999 | 47 (4.1%) | 0 (0.0%) |
| $25,000 to $34,999 | 17 (1.5%) | 10 (0.5%) |
| $35,000 to $49,999 | 85 (7.3%) | 18 (0.9%) |
| $50,000 to $74,999 | 285 (24.6%) | 37 (1.9%) |
| $75,000 to $99,999 | 59 (5.1%) | 139 (7.2%) |
| $100,000 to $149,999 | 152 (13.1%) | 141 (7.3%) |
| $150,000 or more | 484 (41.7%) | 248 (12.9%) |
| Total | 1,160 (100.0%) | 1,924 (100.0%) |
Property Value to Household Income Ratio in Kinnelon borough
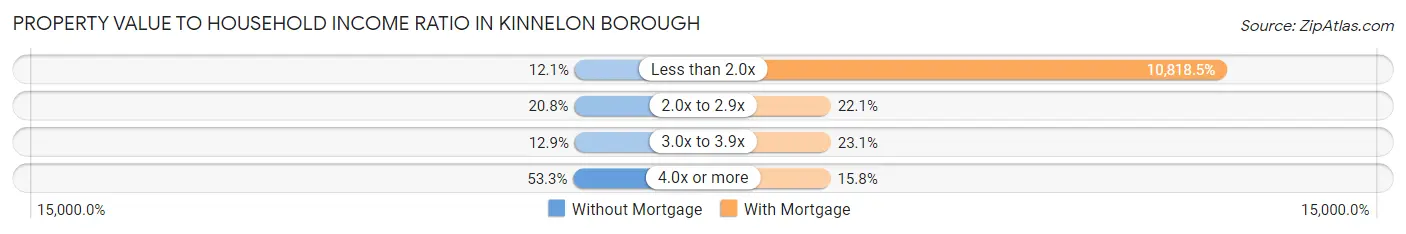
| Value-to-Income Ratio | Without Mortgage | With Mortgage |
| Less than 2.0x | 140 (12.1%) | 208,148 (10,818.5%) |
| 2.0x to 2.9x | 241 (20.8%) | 426 (22.1%) |
| 3.0x to 3.9x | 150 (12.9%) | 445 (23.1%) |
| 4.0x or more | 618 (53.3%) | 303 (15.8%) |
| Total | 1,160 (100.0%) | 1,924 (100.0%) |
Real Estate Taxes by Mortgage Status in Kinnelon borough
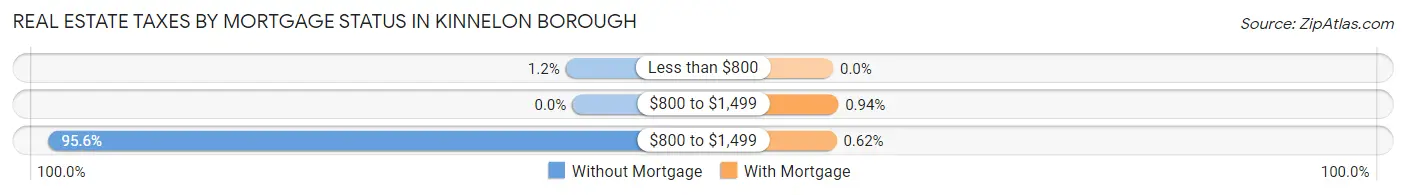
| Property Taxes | Without Mortgage | With Mortgage |
| Less than $800 | 14 (1.2%) | 0 (0.0%) |
| $800 to $1,499 | 0 (0.0%) | 18 (0.9%) |
| $800 to $1,499 | 1,109 (95.6%) | 12 (0.6%) |
| Total | 1,160 (100.0%) | 1,924 (100.0%) |
Health & Disability in Kinnelon borough
Health Insurance Coverage by Age in Kinnelon borough
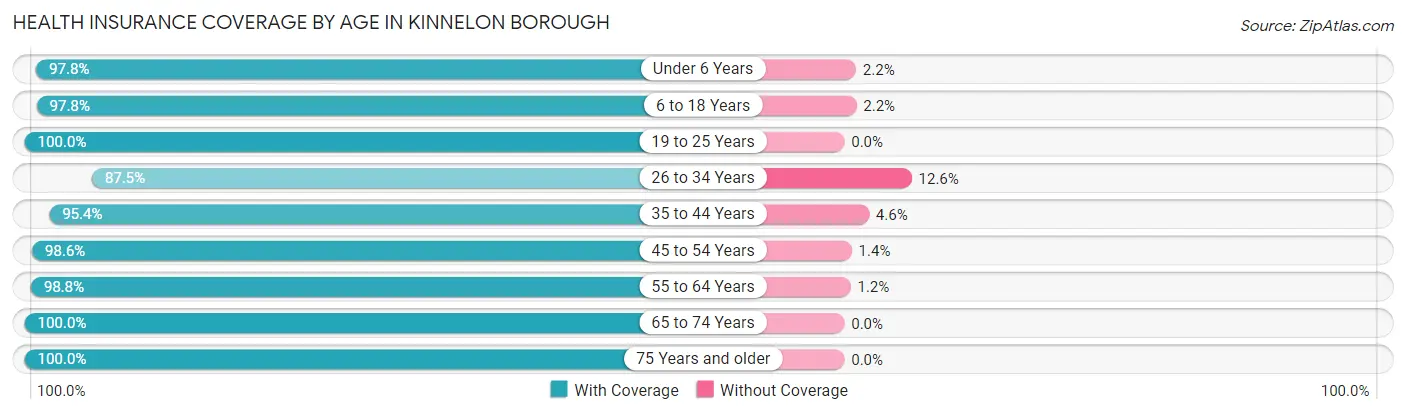
| Age Bracket | With Coverage | Without Coverage |
| Under 6 Years | 589 (97.8%) | 13 (2.2%) |
| 6 to 18 Years | 1,702 (97.8%) | 39 (2.2%) |
| 19 to 25 Years | 1,024 (100.0%) | 0 (0.0%) |
| 26 to 34 Years | 599 (87.5%) | 86 (12.6%) |
| 35 to 44 Years | 1,311 (95.4%) | 63 (4.6%) |
| 45 to 54 Years | 1,300 (98.6%) | 18 (1.4%) |
| 55 to 64 Years | 1,700 (98.8%) | 20 (1.2%) |
| 65 to 74 Years | 1,001 (100.0%) | 0 (0.0%) |
| 75 Years and older | 521 (100.0%) | 0 (0.0%) |
| Total | 9,747 (97.6%) | 239 (2.4%) |
Health Insurance Coverage by Citizenship Status in Kinnelon borough
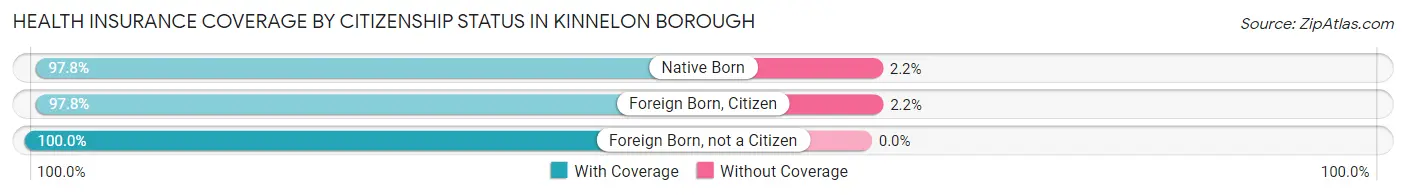
| Citizenship Status | With Coverage | Without Coverage |
| Native Born | 589 (97.8%) | 13 (2.2%) |
| Foreign Born, Citizen | 1,702 (97.8%) | 39 (2.2%) |
| Foreign Born, not a Citizen | 1,024 (100.0%) | 0 (0.0%) |
Health Insurance Coverage by Household Income in Kinnelon borough
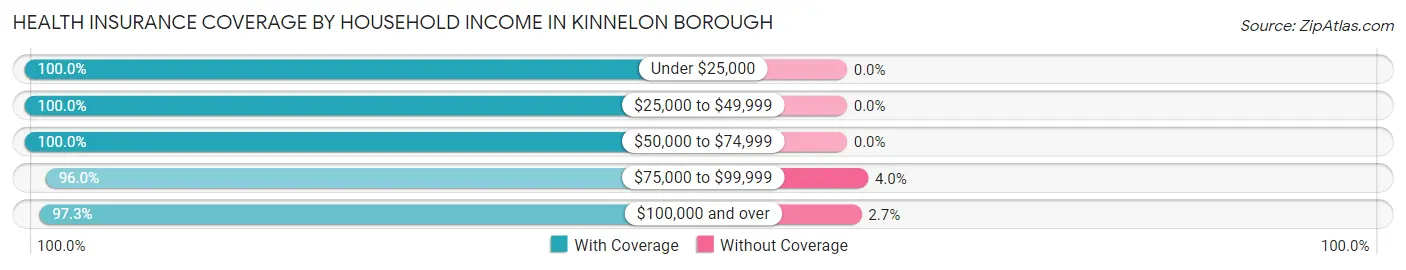
| Household Income | With Coverage | Without Coverage |
| Under $25,000 | 240 (100.0%) | 0 (0.0%) |
| $25,000 to $49,999 | 309 (100.0%) | 0 (0.0%) |
| $50,000 to $74,999 | 1,058 (100.0%) | 0 (0.0%) |
| $75,000 to $99,999 | 726 (96.0%) | 30 (4.0%) |
| $100,000 and over | 7,408 (97.3%) | 209 (2.7%) |
Public vs Private Health Insurance Coverage by Age in Kinnelon borough
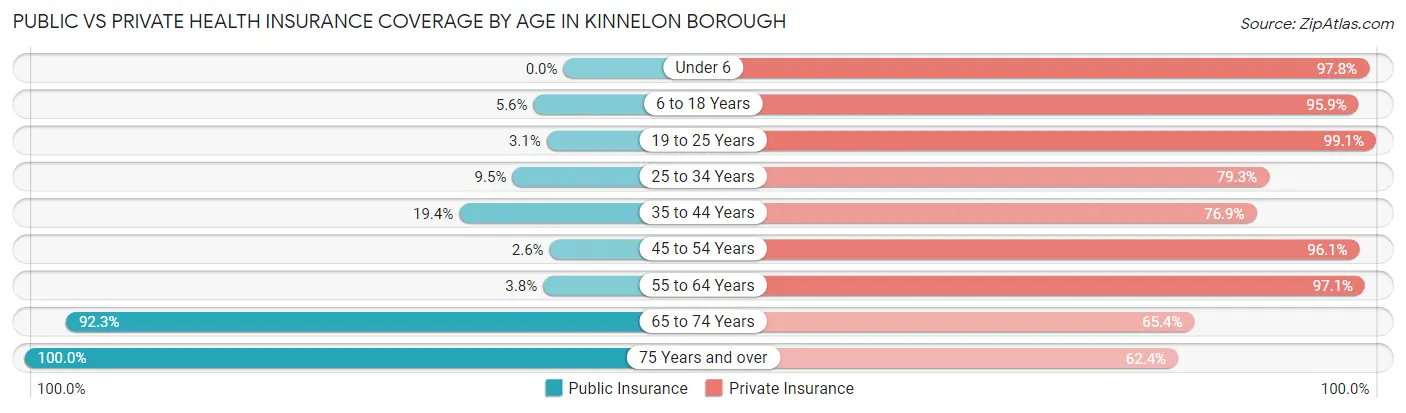
| Age Bracket | Public Insurance | Private Insurance |
| Under 6 | 0 (0.0%) | 589 (97.8%) |
| 6 to 18 Years | 97 (5.6%) | 1,670 (95.9%) |
| 19 to 25 Years | 32 (3.1%) | 1,015 (99.1%) |
| 25 to 34 Years | 65 (9.5%) | 543 (79.3%) |
| 35 to 44 Years | 266 (19.4%) | 1,057 (76.9%) |
| 45 to 54 Years | 34 (2.6%) | 1,266 (96.1%) |
| 55 to 64 Years | 65 (3.8%) | 1,670 (97.1%) |
| 65 to 74 Years | 924 (92.3%) | 655 (65.4%) |
| 75 Years and over | 521 (100.0%) | 325 (62.4%) |
| Total | 2,004 (20.1%) | 8,790 (88.0%) |
Disability Status by Sex by Age in Kinnelon borough
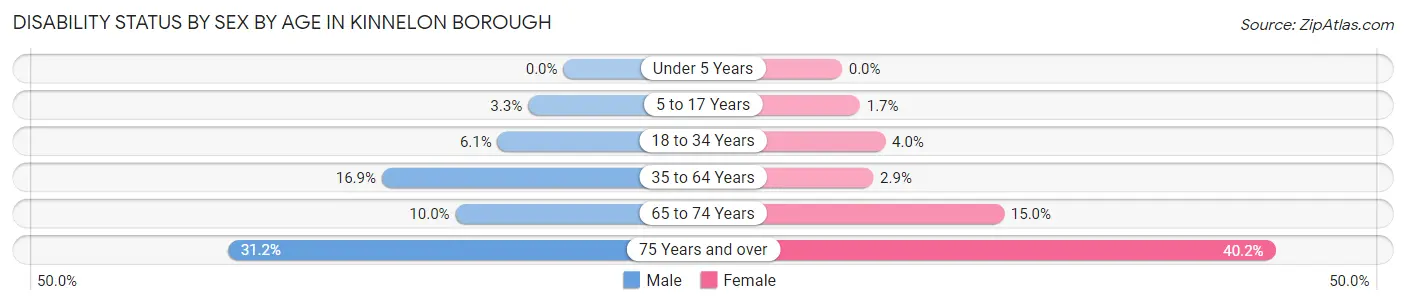
| Age Bracket | Male | Female |
| Under 5 Years | 0 (0.0%) | 0 (0.0%) |
| 5 to 17 Years | 31 (3.3%) | 13 (1.7%) |
| 18 to 34 Years | 64 (6.1%) | 34 (4.0%) |
| 35 to 64 Years | 373 (16.9%) | 64 (2.9%) |
| 65 to 74 Years | 49 (10.0%) | 77 (15.0%) |
| 75 Years and over | 57 (31.1%) | 136 (40.2%) |
Disability Class by Sex by Age in Kinnelon borough
Disability Class: Hearing Difficulty
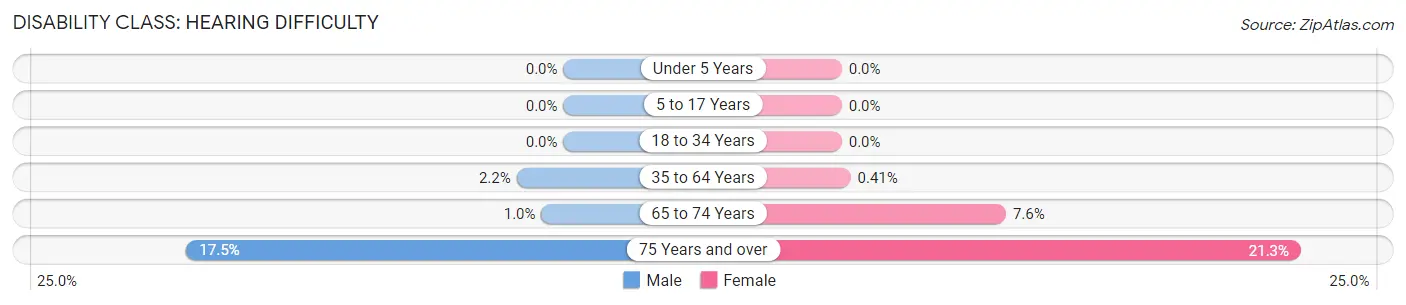
| Age Bracket | Male | Female |
| Under 5 Years | 0 (0.0%) | 0 (0.0%) |
| 5 to 17 Years | 0 (0.0%) | 0 (0.0%) |
| 18 to 34 Years | 0 (0.0%) | 0 (0.0%) |
| 35 to 64 Years | 48 (2.2%) | 9 (0.4%) |
| 65 to 74 Years | 5 (1.0%) | 39 (7.6%) |
| 75 Years and over | 32 (17.5%) | 72 (21.3%) |
Disability Class: Vision Difficulty
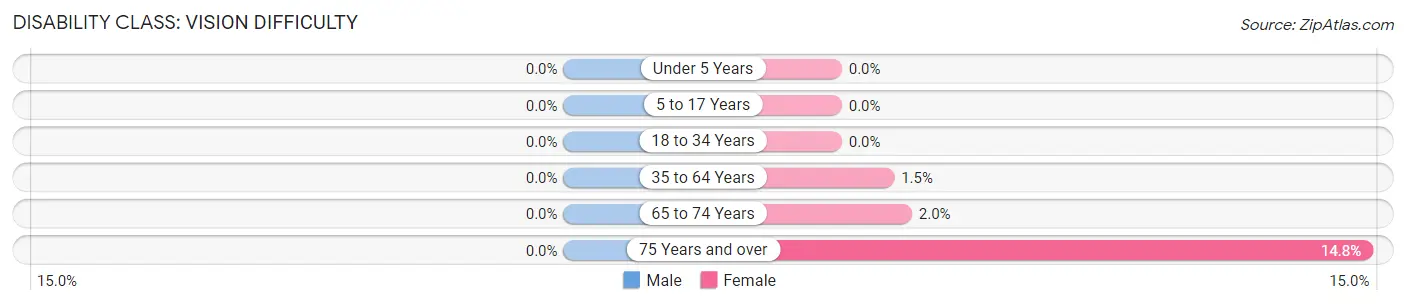
| Age Bracket | Male | Female |
| Under 5 Years | 0 (0.0%) | 0 (0.0%) |
| 5 to 17 Years | 0 (0.0%) | 0 (0.0%) |
| 18 to 34 Years | 0 (0.0%) | 0 (0.0%) |
| 35 to 64 Years | 0 (0.0%) | 32 (1.5%) |
| 65 to 74 Years | 0 (0.0%) | 10 (1.9%) |
| 75 Years and over | 0 (0.0%) | 50 (14.8%) |
Disability Class: Cognitive Difficulty
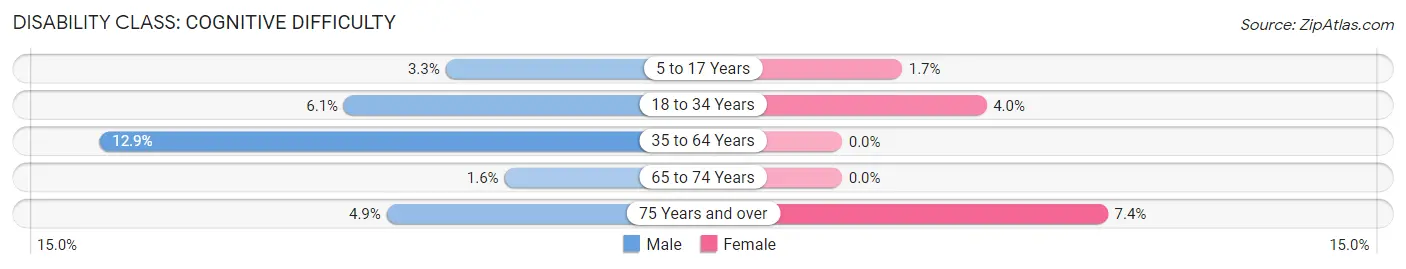
| Age Bracket | Male | Female |
| 5 to 17 Years | 31 (3.3%) | 13 (1.7%) |
| 18 to 34 Years | 64 (6.1%) | 34 (4.0%) |
| 35 to 64 Years | 286 (12.9%) | 0 (0.0%) |
| 65 to 74 Years | 8 (1.6%) | 0 (0.0%) |
| 75 Years and over | 9 (4.9%) | 25 (7.4%) |
Disability Class: Ambulatory Difficulty
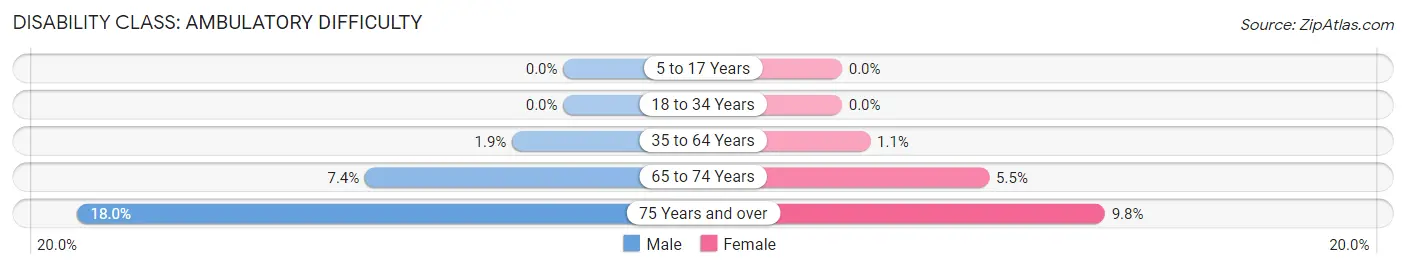
| Age Bracket | Male | Female |
| 5 to 17 Years | 0 (0.0%) | 0 (0.0%) |
| 18 to 34 Years | 0 (0.0%) | 0 (0.0%) |
| 35 to 64 Years | 42 (1.9%) | 23 (1.1%) |
| 65 to 74 Years | 36 (7.4%) | 28 (5.5%) |
| 75 Years and over | 33 (18.0%) | 33 (9.8%) |
Disability Class: Self-Care Difficulty
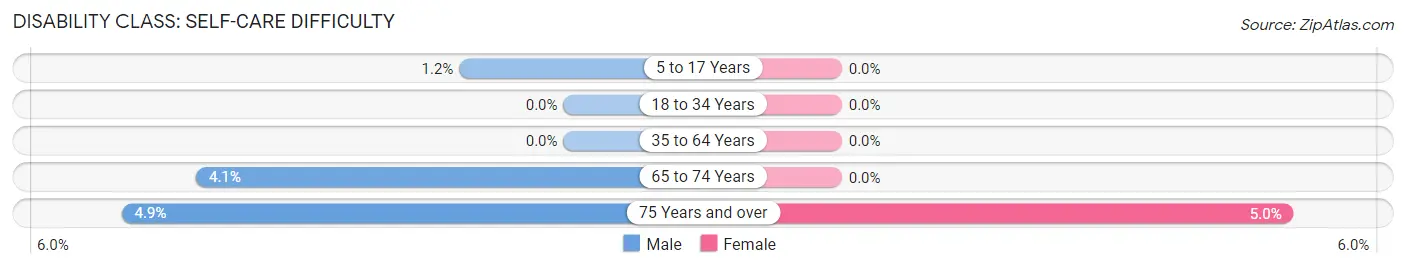
| Age Bracket | Male | Female |
| 5 to 17 Years | 11 (1.2%) | 0 (0.0%) |
| 18 to 34 Years | 0 (0.0%) | 0 (0.0%) |
| 35 to 64 Years | 0 (0.0%) | 0 (0.0%) |
| 65 to 74 Years | 20 (4.1%) | 0 (0.0%) |
| 75 Years and over | 9 (4.9%) | 17 (5.0%) |
Technology Access in Kinnelon borough
Computing Device Access in Kinnelon borough
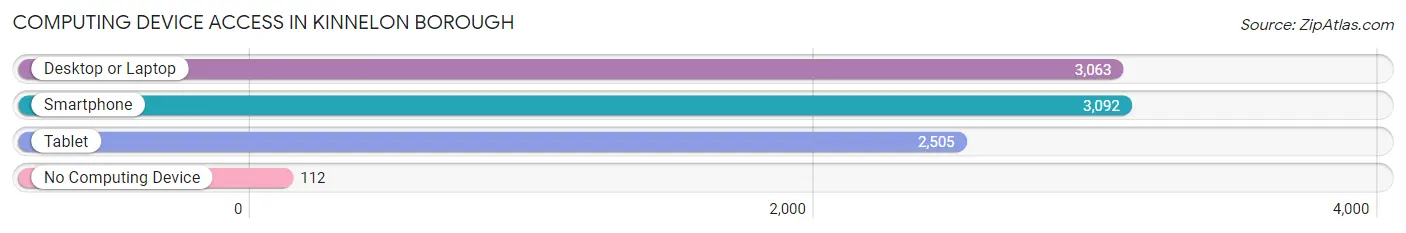
| Device Type | # Households | % Households |
| Desktop or Laptop | 3,063 | 91.5% |
| Smartphone | 3,092 | 92.4% |
| Tablet | 2,505 | 74.8% |
| No Computing Device | 112 | 3.4% |
| Total | 3,347 | 100.0% |
Internet Access in Kinnelon borough
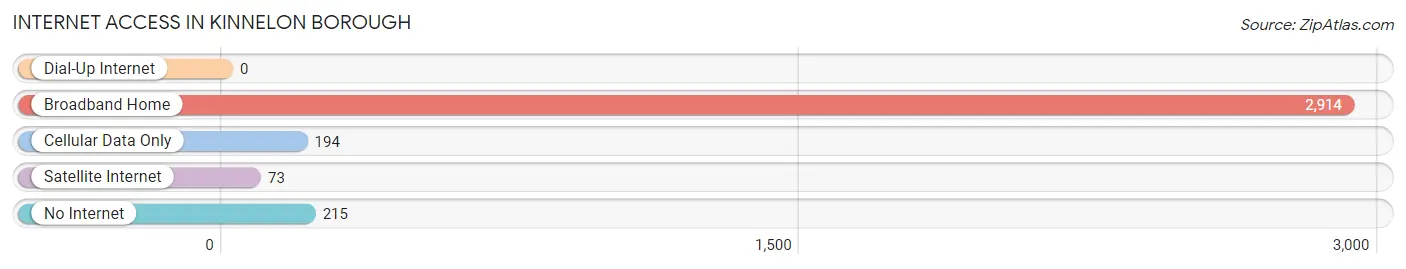
| Internet Type | # Households | % Households |
| Dial-Up Internet | 0 | 0.0% |
| Broadband Home | 2,914 | 87.1% |
| Cellular Data Only | 194 | 5.8% |
| Satellite Internet | 73 | 2.2% |
| No Internet | 215 | 6.4% |
| Total | 3,347 | 100.0% |
Kinnelon borough Summary
Kinnelon Borough is a small borough located in Morris County, New Jersey. It is situated in the Ramapo Mountains and is part of the New York metropolitan area. The borough has a population of approximately 9,000 people and covers an area of 8.3 square miles.
History
Kinnelon was originally inhabited by the Lenni Lenape Native Americans. The first European settlers arrived in the area in the late 17th century. The area was part of the Horseneck Tract, which was purchased by the Dutch in 1676. The area was then sold to the English in 1702.
In the late 18th century, the area was part of the Morris Township. In 1866, the area was incorporated as the Borough of Kinnelon. The borough was named after the Kinnelon family, who were early settlers in the area.
Geography
Kinnelon is located in the Ramapo Mountains in Morris County, New Jersey. It is situated in the northern part of the state, about 25 miles northwest of New York City. The borough covers an area of 8.3 square miles and is bordered by Butler, Bloomingdale, and Riverdale.
The borough is located in a hilly region and is home to several lakes, including Lake Kinnelon, Lake Telemark, and Lake Wanda. The borough is also home to several parks, including Kinnelon Park, Telemark Park, and Wanda Park.
Economy
Kinnelon’s economy is largely based on the service industry. The borough is home to several small businesses, including restaurants, retail stores, and professional services. The borough is also home to several large corporations, including AT&T, Verizon, and Prudential Financial.
Demographics
As of the 2010 census, the population of Kinnelon was 8,493. The racial makeup of the borough was 94.3% White, 1.3% African American, 0.2% Native American, 2.2% Asian, and 1.9% from other races. Hispanic or Latino of any race were 5.2% of the population.
The median household income in Kinnelon was $107,917, and the median family income was $118,917. The per capita income was $45,917. About 2.3% of families and 3.2% of the population were below the poverty line.
Kinnelon is a small borough with a diverse population. The borough is home to a variety of businesses and is a popular destination for outdoor recreation. The borough is also home to several large corporations, which provide employment opportunities for residents.
Common Questions
What is the Total Population of Kinnelon borough?
Total Population of Kinnelon borough is 9,986.
What is the Total Male Population of Kinnelon borough?
Total Male Population of Kinnelon borough is 5,151.
What is the Total Female Population of Kinnelon borough?
Total Female Population of Kinnelon borough is 4,835.
What is the Ratio of Males per 100 Females in Kinnelon borough?
There are 106.54 Males per 100 Females in Kinnelon borough.
What is the Ratio of Females per 100 Males in Kinnelon borough?
There are 93.87 Females per 100 Males in Kinnelon borough.
What is the Median Population Age in Kinnelon borough?
Median Population Age in Kinnelon borough is 41.8 Years.
What is the Average Family Size in Kinnelon borough
Average Family Size in Kinnelon borough is 3.2 People.
What is the Average Household Size in Kinnelon borough
Average Household Size in Kinnelon borough is 3.0 People.
What is Per Capita Income in Kinnelon borough?
Per Capita income in Kinnelon borough is $75,346.
What is the Median Family Income in Kinnelon borough?
Median Family Income in Kinnelon borough is $184,125.
What is the Median Household income in Kinnelon borough?
Median Household Income in Kinnelon borough is $170,905.
What is Income or Wage Gap in Kinnelon borough?
Income or Wage Gap in Kinnelon borough is 29.6%.
Women in Kinnelon borough earn 70.4 cents for every dollar earned by a man.
What is Inequality or Gini Index in Kinnelon borough?
Inequality or Gini Index in Kinnelon borough is 0.43.
How Large is the Labor Force in Kinnelon borough?
There are 5,528 People in the Labor Forcein in Kinnelon borough.
What is the Percentage of People in the Labor Force in Kinnelon borough?
68.0% of People are in the Labor Force in Kinnelon borough.
What is the Unemployment Rate in Kinnelon borough?
Unemployment Rate in Kinnelon borough is 8.9%.