Salt Creek Commons, IN
Salt Creek Commons Map
Salt Creek Commons Overview
1,854
TOTAL POPULATION
1,000
MALE POPULATION
854
FEMALE POPULATION
117.10
MALES / 100 FEMALES
85.40
FEMALES / 100 MALES
33.0
MEDIAN AGE
3.5
AVG FAMILY SIZE
3.2
AVG HOUSEHOLD SIZE
$26,735
PER CAPITA INCOME
$82,361
AVG FAMILY INCOME
$78,155
AVG HOUSEHOLD INCOME
53.1%
WAGE / INCOME GAP [ % ]
46.9¢/ $1
WAGE / INCOME GAP [ $ ]
0.31
INEQUALITY / GINI INDEX
847
LABOR FORCE [ PEOPLE ]
60.9%
PERCENT IN LABOR FORCE
2.7%
UNEMPLOYMENT RATE
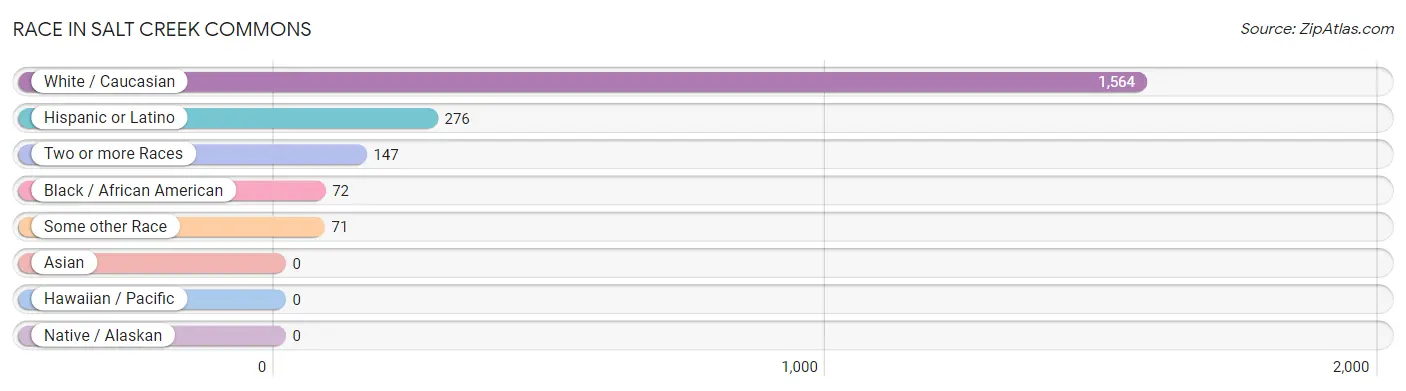
Race in Salt Creek Commons
The most populous races in Salt Creek Commons are White / Caucasian (1,564 | 84.4%), Hispanic or Latino (276 | 14.9%), and Two or more Races (147 | 7.9%).
| Race | # Population | % Population |
| Asian | 0 | 0.0% |
| Black / African American | 72 | 3.9% |
| Hawaiian / Pacific | 0 | 0.0% |
| Hispanic or Latino | 276 | 14.9% |
| Native / Alaskan | 0 | 0.0% |
| White / Caucasian | 1,564 | 84.4% |
| Two or more Races | 147 | 7.9% |
| Some other Race | 71 | 3.8% |
| Total | 1,854 | 100.0% |
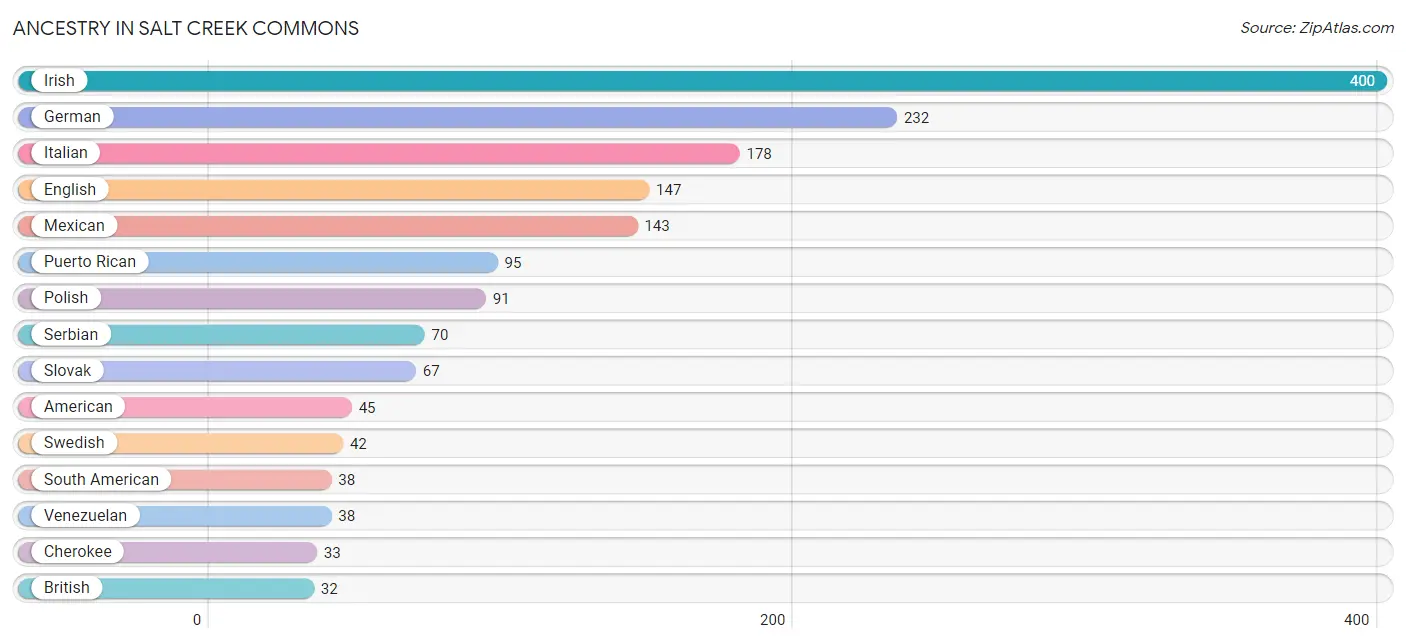
Ancestry in Salt Creek Commons
The most populous ancestries reported in Salt Creek Commons are Irish (400 | 21.6%), German (232 | 12.5%), Italian (178 | 9.6%), English (147 | 7.9%), and Mexican (143 | 7.7%), together accounting for 59.3% of all Salt Creek Commons residents.
| Ancestry | # Population | % Population |
| American | 45 | 2.4% |
| British | 32 | 1.7% |
| Cherokee | 33 | 1.8% |
| Croatian | 16 | 0.9% |
| Danish | 10 | 0.5% |
| Dutch | 6 | 0.3% |
| English | 147 | 7.9% |
| French | 28 | 1.5% |
| German | 232 | 12.5% |
| Greek | 8 | 0.4% |
| Hungarian | 19 | 1.0% |
| Irish | 400 | 21.6% |
| Italian | 178 | 9.6% |
| Lithuanian | 14 | 0.8% |
| Mexican | 143 | 7.7% |
| Polish | 91 | 4.9% |
| Portuguese | 14 | 0.8% |
| Puerto Rican | 95 | 5.1% |
| Scotch-Irish | 4 | 0.2% |
| Serbian | 70 | 3.8% |
| Slovak | 67 | 3.6% |
| South American | 38 | 2.1% |
| Swedish | 42 | 2.3% |
| Venezuelan | 38 | 2.1% | View All 24 Rows |
Immigrants in Salt Creek Commons

| Immigration Origin | # Population | % Population | View All 0 Rows |
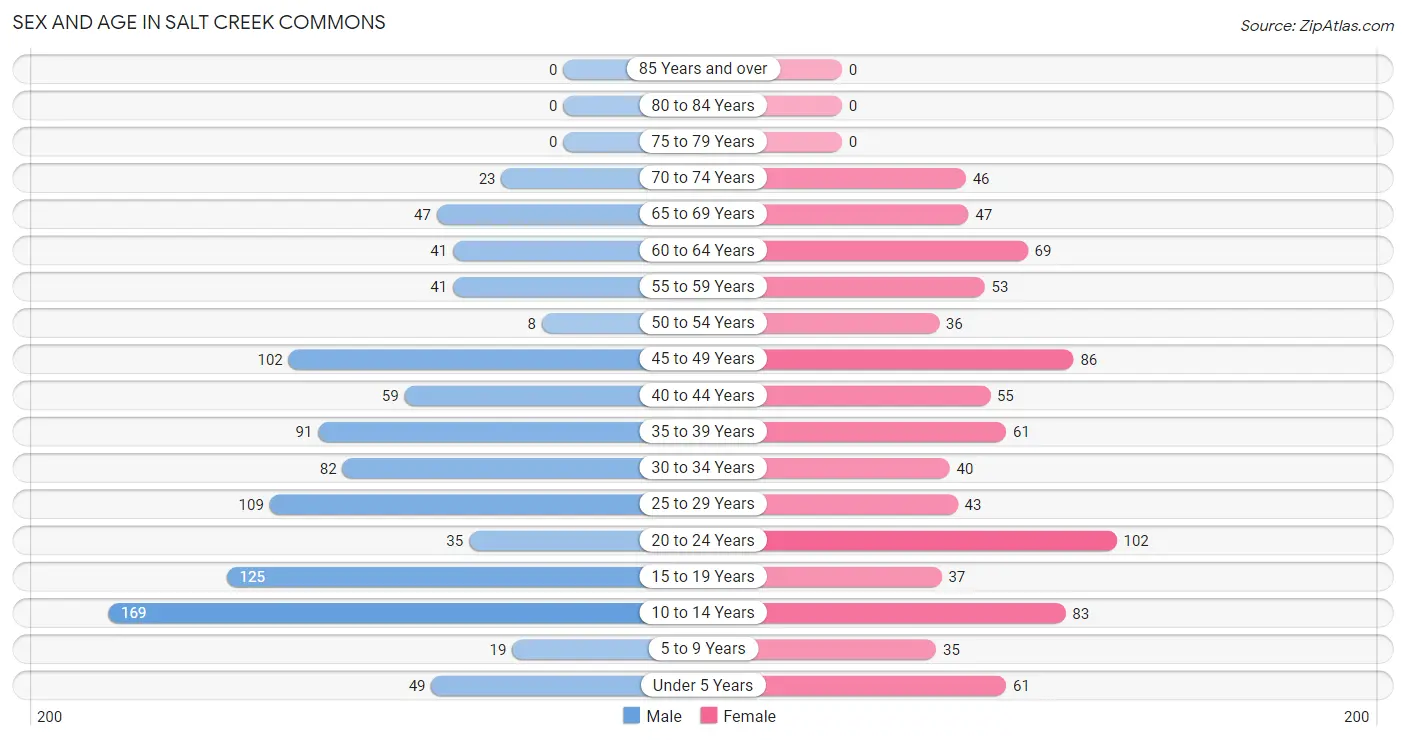
Sex and Age in Salt Creek Commons
Sex and Age in Salt Creek Commons
The most populous age groups in Salt Creek Commons are 10 to 14 Years (169 | 16.9%) for men and 20 to 24 Years (102 | 11.9%) for women.
| Age Bracket | Male | Female |
| Under 5 Years | 49 (4.9%) | 61 (7.1%) |
| 5 to 9 Years | 19 (1.9%) | 35 (4.1%) |
| 10 to 14 Years | 169 (16.9%) | 83 (9.7%) |
| 15 to 19 Years | 125 (12.5%) | 37 (4.3%) |
| 20 to 24 Years | 35 (3.5%) | 102 (11.9%) |
| 25 to 29 Years | 109 (10.9%) | 43 (5.0%) |
| 30 to 34 Years | 82 (8.2%) | 40 (4.7%) |
| 35 to 39 Years | 91 (9.1%) | 61 (7.1%) |
| 40 to 44 Years | 59 (5.9%) | 55 (6.4%) |
| 45 to 49 Years | 102 (10.2%) | 86 (10.1%) |
| 50 to 54 Years | 8 (0.8%) | 36 (4.2%) |
| 55 to 59 Years | 41 (4.1%) | 53 (6.2%) |
| 60 to 64 Years | 41 (4.1%) | 69 (8.1%) |
| 65 to 69 Years | 47 (4.7%) | 47 (5.5%) |
| 70 to 74 Years | 23 (2.3%) | 46 (5.4%) |
| 75 to 79 Years | 0 (0.0%) | 0 (0.0%) |
| 80 to 84 Years | 0 (0.0%) | 0 (0.0%) |
| 85 Years and over | 0 (0.0%) | 0 (0.0%) |
| Total | 1,000 (100.0%) | 854 (100.0%) |
Families and Households in Salt Creek Commons
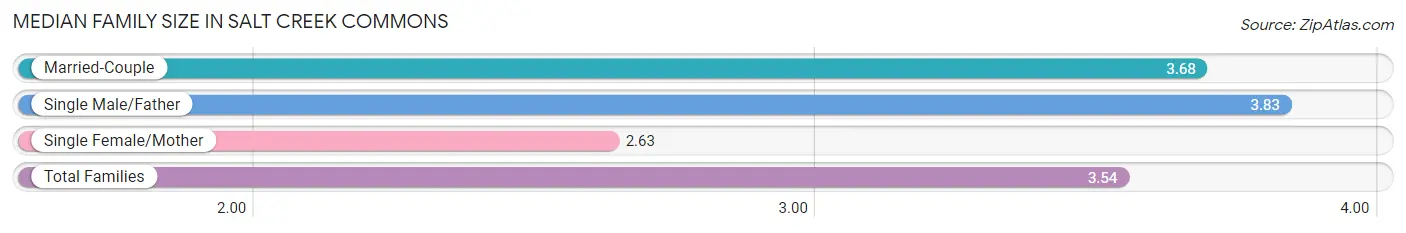
Median Family Size in Salt Creek Commons
The median family size in Salt Creek Commons is 3.54 persons per family, with single male/father families (29 | 6.2%) accounting for the largest median family size of 3.83 persons per family. On the other hand, single female/mother families (63 | 13.6%) represent the smallest median family size with 2.63 persons per family.
| Family Type | # Families | Family Size |
| Married-Couple | 373 (80.2%) | 3.68 |
| Single Male/Father | 29 (6.2%) | 3.83 |
| Single Female/Mother | 63 (13.6%) | 2.63 |
| Total Families | 465 (100.0%) | 3.54 |
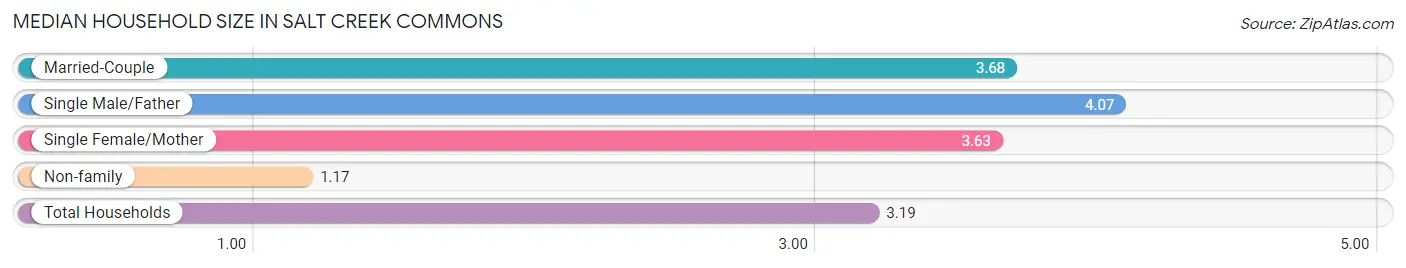
Median Household Size in Salt Creek Commons
The median household size in Salt Creek Commons is 3.19 persons per household, with single male/father households (29 | 5.0%) accounting for the largest median household size of 4.07 persons per household. non-family households (116 | 20.0%) represent the smallest median household size with 1.17 persons per household.
| Household Type | # Households | Household Size |
| Married-Couple | 373 (64.2%) | 3.68 |
| Single Male/Father | 29 (5.0%) | 4.07 |
| Single Female/Mother | 63 (10.8%) | 3.63 |
| Non-family | 116 (20.0%) | 1.17 |
| Total Households | 581 (100.0%) | 3.19 |
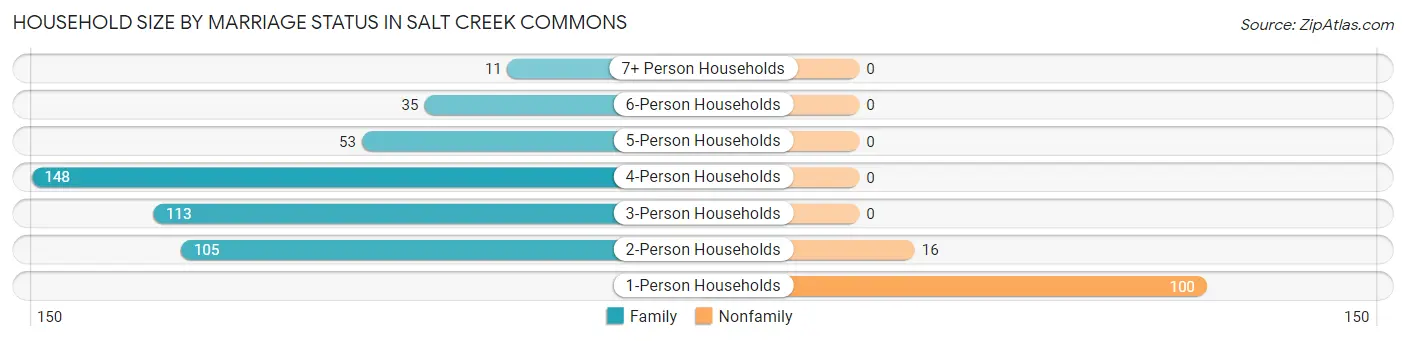
Household Size by Marriage Status in Salt Creek Commons
Out of a total of 581 households in Salt Creek Commons, 465 (80.0%) are family households, while 116 (20.0%) are nonfamily households. The most numerous type of family households are 4-person households, comprising 148, and the most common type of nonfamily households are 1-person households, comprising 100.
| Household Size | Family Households | Nonfamily Households |
| 1-Person Households | - | 100 (17.2%) |
| 2-Person Households | 105 (18.1%) | 16 (2.8%) |
| 3-Person Households | 113 (19.5%) | 0 (0.0%) |
| 4-Person Households | 148 (25.5%) | 0 (0.0%) |
| 5-Person Households | 53 (9.1%) | 0 (0.0%) |
| 6-Person Households | 35 (6.0%) | 0 (0.0%) |
| 7+ Person Households | 11 (1.9%) | 0 (0.0%) |
| Total | 465 (80.0%) | 116 (20.0%) |
Female Fertility in Salt Creek Commons
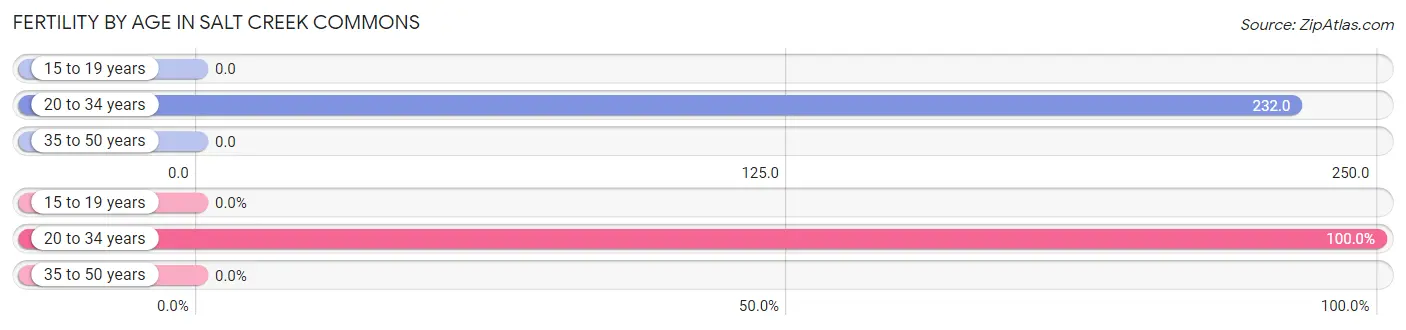
Fertility by Age in Salt Creek Commons
Average fertility rate in Salt Creek Commons is 99.0 births per 1,000 women. Women in the age bracket of 20 to 34 years have the highest fertility rate with 232.0 births per 1,000 women. Women in the age bracket of 20 to 34 years acount for 100.0% of all women with births.
| Age Bracket | Women with Births | Births / 1,000 Women |
| 15 to 19 years | 0 (0.0%) | 0.0 |
| 20 to 34 years | 43 (100.0%) | 232.0 |
| 35 to 50 years | 0 (0.0%) | 0.0 |
| Total | 43 (100.0%) | 99.0 |
Fertility by Age by Marriage Status in Salt Creek Commons
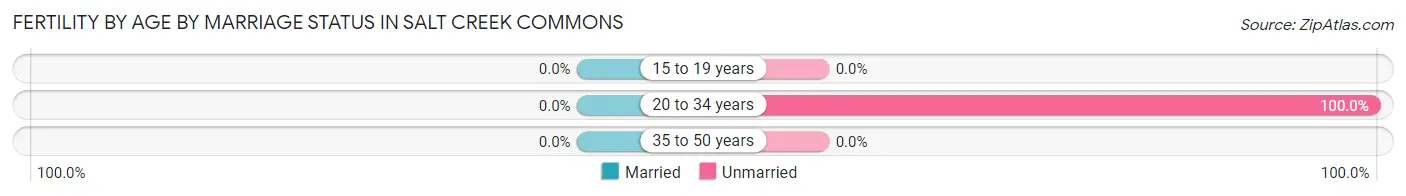
| Age Bracket | Married | Unmarried |
| 15 to 19 years | 0 (0.0%) | 0 (0.0%) |
| 20 to 34 years | 0 (0.0%) | 43 (100.0%) |
| 35 to 50 years | 0 (0.0%) | 0 (0.0%) |
| Total | 0 (0.0%) | 43 (100.0%) |
Fertility by Education in Salt Creek Commons
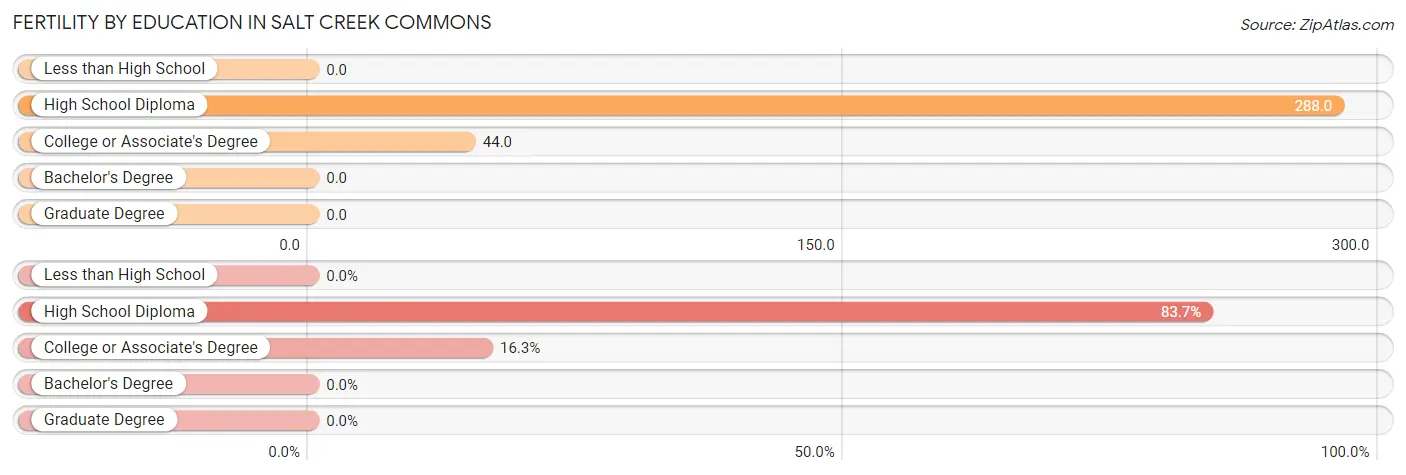
| Educational Attainment | Women with Births | Births / 1,000 Women |
| Less than High School | 0 (0.0%) | 0.0 |
| High School Diploma | 36 (83.7%) | 288.0 |
| College or Associate's Degree | 7 (16.3%) | 44.0 |
| Bachelor's Degree | 0 (0.0%) | 0.0 |
| Graduate Degree | 0 (0.0%) | 0.0 |
| Total | 43 (100.0%) | 99.0 |
Fertility by Education by Marriage Status in Salt Creek Commons
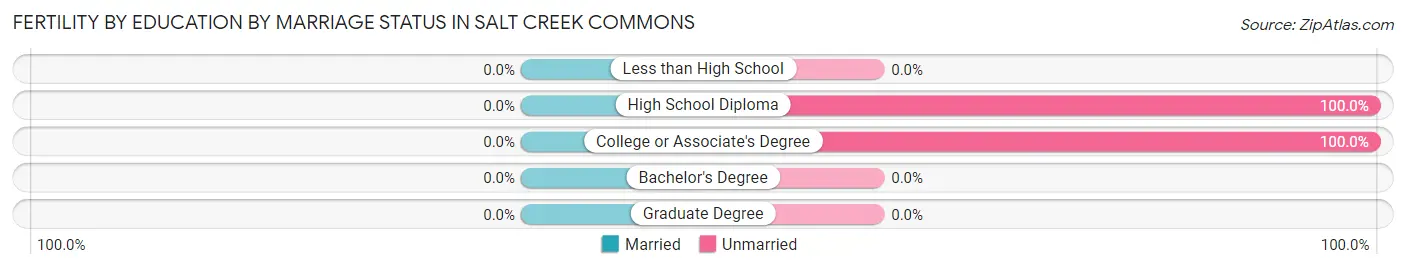
| Educational Attainment | Married | Unmarried |
| Less than High School | 0 (0.0%) | 0 (0.0%) |
| High School Diploma | 0 (0.0%) | 36 (100.0%) |
| College or Associate's Degree | 0 (0.0%) | 7 (100.0%) |
| Bachelor's Degree | 0 (0.0%) | 0 (0.0%) |
| Graduate Degree | 0 (0.0%) | 0 (0.0%) |
| Total | 0 (0.0%) | 43 (100.0%) |
Income in Salt Creek Commons
Income Overview in Salt Creek Commons
Per Capita Income in Salt Creek Commons is $26,735, while median incomes of families and households are $82,361 and $78,155 respectively.
| Characteristic | Number | Measure |
| Per Capita Income | 1,854 | $26,735 |
| Median Family Income | 465 | $82,361 |
| Mean Family Income | 465 | $84,898 |
| Median Household Income | 581 | $78,155 |
| Mean Household Income | 581 | $82,328 |
| Income Deficit | 465 | $0 |
| Wage / Income Gap (%) | 1,854 | 53.12% |
| Wage / Income Gap ($) | 1,854 | 46.88¢ per $1 |
| Gini / Inequality Index | 1,854 | 0.31 |
Earnings by Sex in Salt Creek Commons
Average Earnings in Salt Creek Commons are $45,625, $55,327 for men and $25,938 for women, a difference of 53.1%.
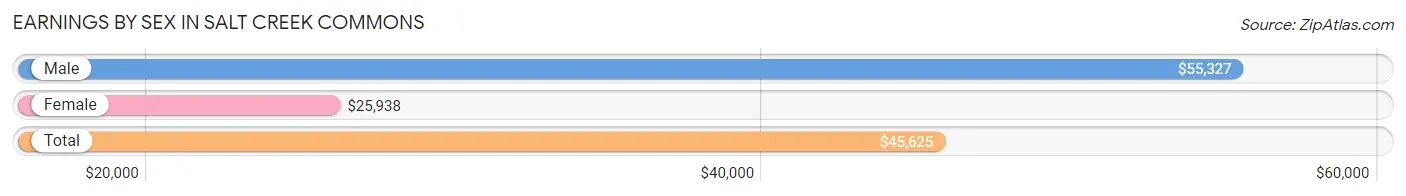
| Sex | Number | Average Earnings |
| Male | 500 (57.9%) | $55,327 |
| Female | 364 (42.1%) | $25,938 |
| Total | 864 (100.0%) | $45,625 |
Earnings by Sex by Income Bracket in Salt Creek Commons
The most common earnings brackets in Salt Creek Commons are $55,000 to $64,999 for men (124 | 24.8%) and $10,000 to $12,499 for women (45 | 12.4%).
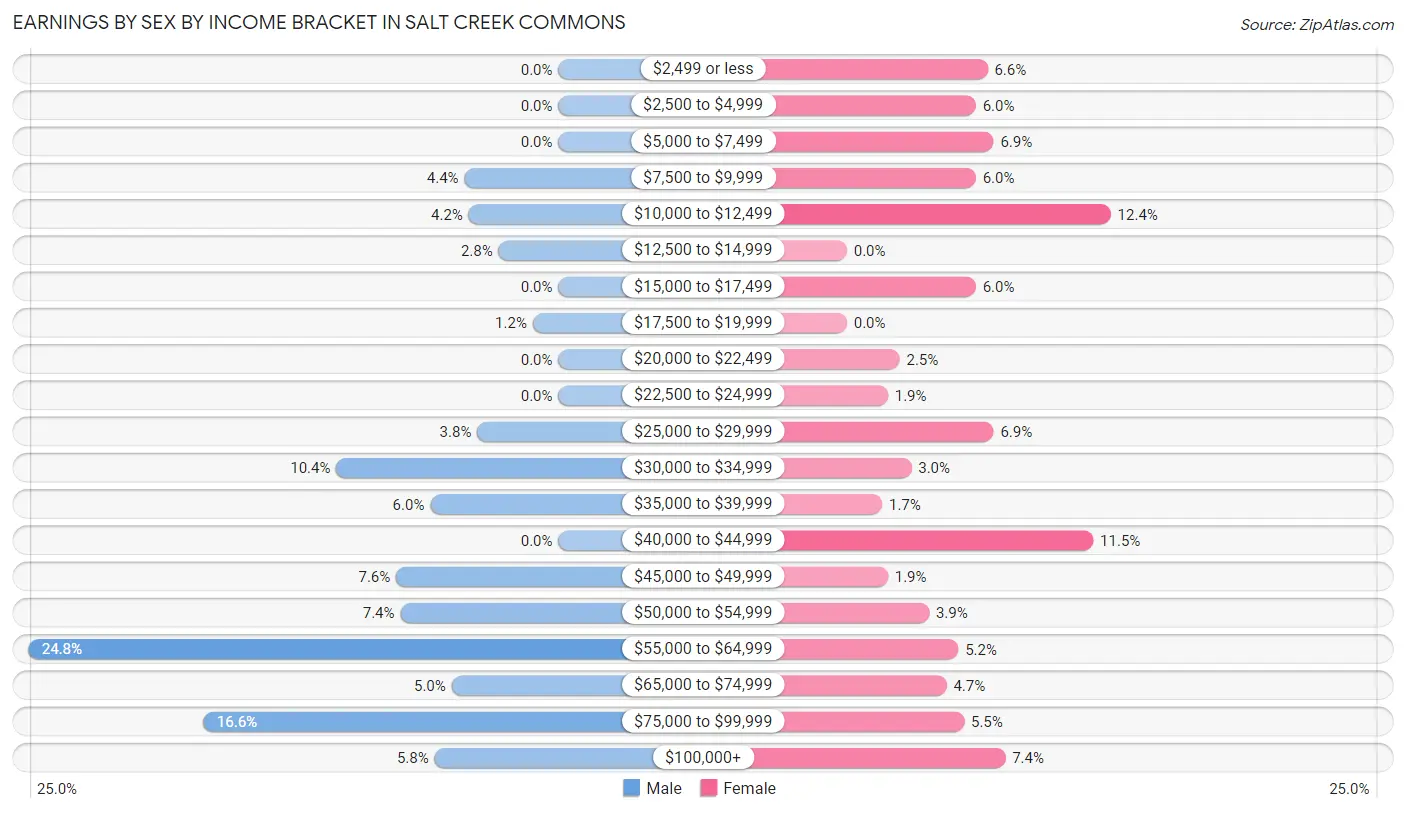
| Income | Male | Female |
| $2,499 or less | 0 (0.0%) | 24 (6.6%) |
| $2,500 to $4,999 | 0 (0.0%) | 22 (6.0%) |
| $5,000 to $7,499 | 0 (0.0%) | 25 (6.9%) |
| $7,500 to $9,999 | 22 (4.4%) | 22 (6.0%) |
| $10,000 to $12,499 | 21 (4.2%) | 45 (12.4%) |
| $12,500 to $14,999 | 14 (2.8%) | 0 (0.0%) |
| $15,000 to $17,499 | 0 (0.0%) | 22 (6.0%) |
| $17,500 to $19,999 | 6 (1.2%) | 0 (0.0%) |
| $20,000 to $22,499 | 0 (0.0%) | 9 (2.5%) |
| $22,500 to $24,999 | 0 (0.0%) | 7 (1.9%) |
| $25,000 to $29,999 | 19 (3.8%) | 25 (6.9%) |
| $30,000 to $34,999 | 52 (10.4%) | 11 (3.0%) |
| $35,000 to $39,999 | 30 (6.0%) | 6 (1.7%) |
| $40,000 to $44,999 | 0 (0.0%) | 42 (11.5%) |
| $45,000 to $49,999 | 38 (7.6%) | 7 (1.9%) |
| $50,000 to $54,999 | 37 (7.4%) | 14 (3.8%) |
| $55,000 to $64,999 | 124 (24.8%) | 19 (5.2%) |
| $65,000 to $74,999 | 25 (5.0%) | 17 (4.7%) |
| $75,000 to $99,999 | 83 (16.6%) | 20 (5.5%) |
| $100,000+ | 29 (5.8%) | 27 (7.4%) |
| Total | 500 (100.0%) | 364 (100.0%) |
Earnings by Sex by Educational Attainment in Salt Creek Commons
Average earnings in Salt Creek Commons are $55,729 for men and $29,167 for women, a difference of 47.7%. Men with an educational attainment of college or associate's degree enjoy the highest average annual earnings of $73,661, while those with high school diploma education earn the least with $46,350. Women with an educational attainment of college or associate's degree earn the most with the average annual earnings of $40,363, while those with high school diploma education have the smallest earnings of $15,192.
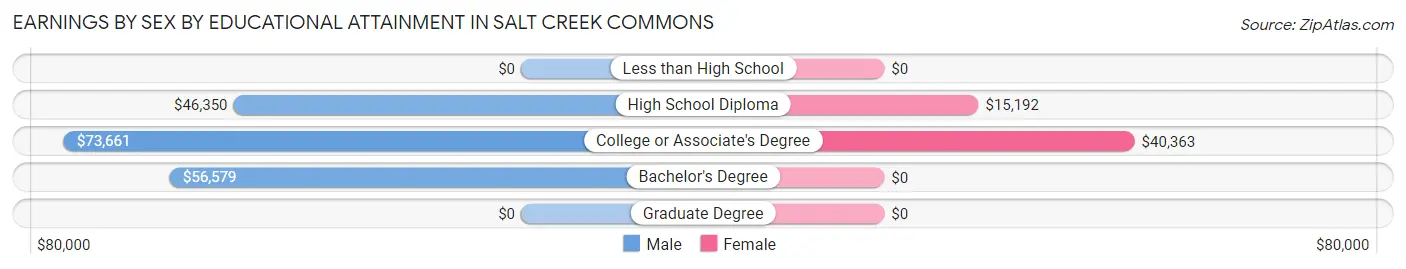
| Educational Attainment | Male Income | Female Income |
| Less than High School | - | - |
| High School Diploma | $46,350 | $15,192 |
| College or Associate's Degree | $73,661 | $40,363 |
| Bachelor's Degree | $56,579 | $0 |
| Graduate Degree | - | - |
| Total | $55,729 | $29,167 |
Family Income in Salt Creek Commons
Family Income Brackets in Salt Creek Commons
According to the Salt Creek Commons family income data, there are 109 families falling into the $100,000 to $149,999 income range, which is the most common income bracket and makes up 23.4% of all families. Conversely, the $200,000+ income bracket is the least frequent group with only 2 families (0.4%) belonging to this category.
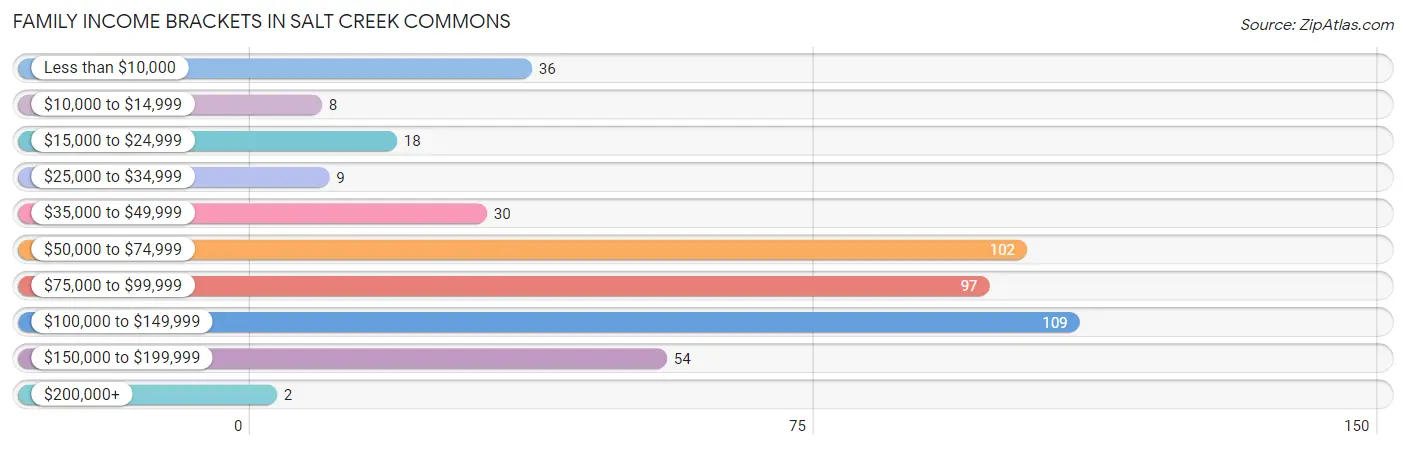
| Income Bracket | # Families | % Families |
| Less than $10,000 | 36 | 7.7% |
| $10,000 to $14,999 | 8 | 1.7% |
| $15,000 to $24,999 | 18 | 3.9% |
| $25,000 to $34,999 | 9 | 1.9% |
| $35,000 to $49,999 | 30 | 6.5% |
| $50,000 to $74,999 | 102 | 21.9% |
| $75,000 to $99,999 | 97 | 20.9% |
| $100,000 to $149,999 | 109 | 23.4% |
| $150,000 to $199,999 | 54 | 11.6% |
| $200,000+ | 2 | 0.4% |
Family Income by Famaliy Size in Salt Creek Commons
6-person families (35 | 7.5%) account for the highest median family income in Salt Creek Commons with $130,875 per family, while 2-person families (119 | 25.6%) have the highest median income of $49,514 per family member.
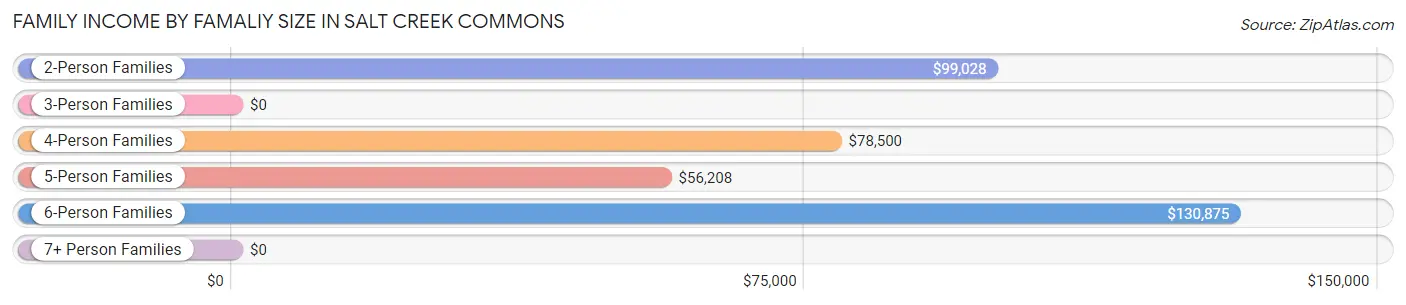
| Income Bracket | # Families | Median Income |
| 2-Person Families | 119 (25.6%) | $99,028 |
| 3-Person Families | 135 (29.0%) | $0 |
| 4-Person Families | 112 (24.1%) | $78,500 |
| 5-Person Families | 53 (11.4%) | $56,208 |
| 6-Person Families | 35 (7.5%) | $130,875 |
| 7+ Person Families | 11 (2.4%) | $0 |
| Total | 465 (100.0%) | $82,361 |
Family Income by Number of Earners in Salt Creek Commons
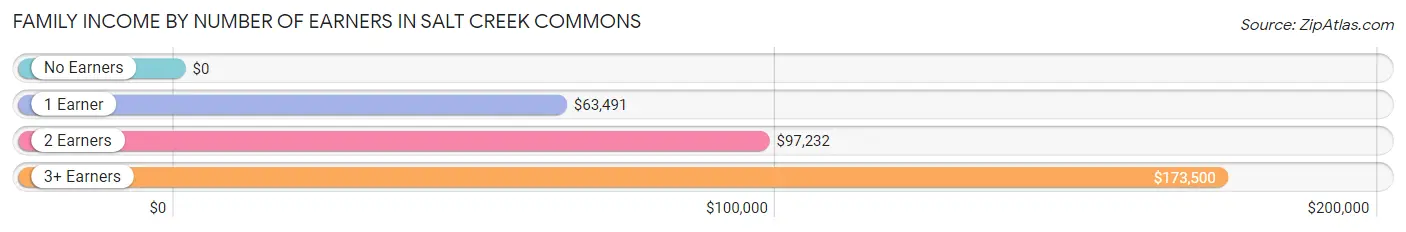
| Number of Earners | # Families | Median Income |
| No Earners | 77 (16.6%) | $0 |
| 1 Earner | 143 (30.7%) | $63,491 |
| 2 Earners | 207 (44.5%) | $97,232 |
| 3+ Earners | 38 (8.2%) | $173,500 |
| Total | 465 (100.0%) | $82,361 |
Household Income in Salt Creek Commons
Household Income Brackets in Salt Creek Commons
With 137 households falling in the category, the $50,000 to $74,999 income range is the most frequent in Salt Creek Commons, accounting for 23.6% of all households. In contrast, only 8 households (1.4%) fall into the $10,000 to $14,999 income bracket, making it the least populous group.
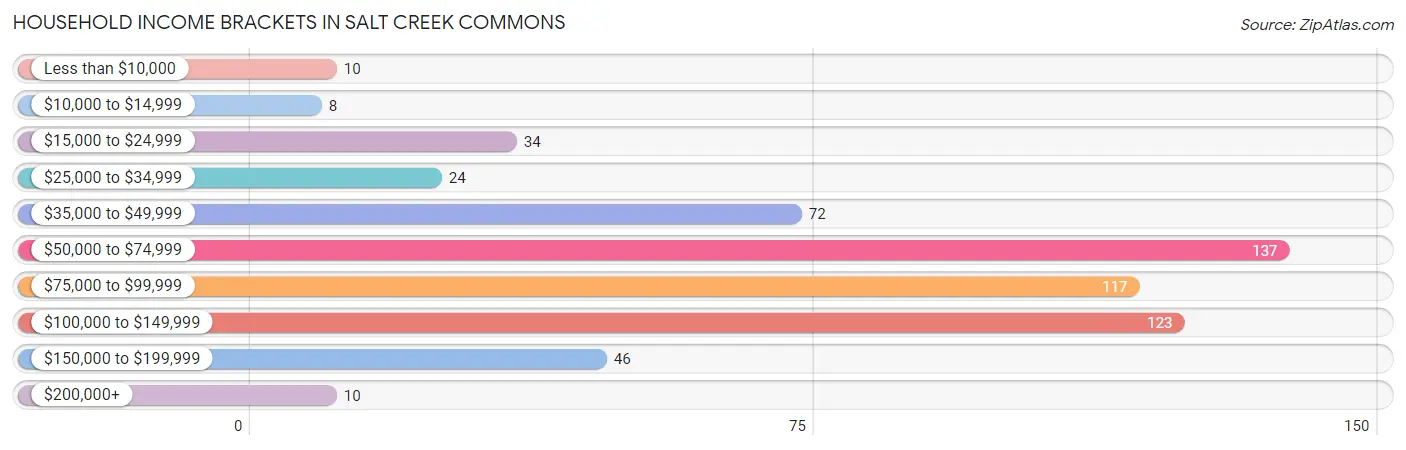
| Income Bracket | # Households | % Households |
| Less than $10,000 | 10 | 1.7% |
| $10,000 to $14,999 | 8 | 1.4% |
| $15,000 to $24,999 | 34 | 5.9% |
| $25,000 to $34,999 | 24 | 4.1% |
| $35,000 to $49,999 | 72 | 12.4% |
| $50,000 to $74,999 | 137 | 23.6% |
| $75,000 to $99,999 | 117 | 20.1% |
| $100,000 to $149,999 | 123 | 21.2% |
| $150,000 to $199,999 | 46 | 7.9% |
| $200,000+ | 10 | 1.7% |
Household Income by Householder Age in Salt Creek Commons
The median household income in Salt Creek Commons is $78,155, with the highest median household income of $82,434 found in the 45 to 64 years age bracket for the primary householder. A total of 243 households (41.8%) fall into this category. Meanwhile, the 15 to 24 years age bracket for the primary householder has the lowest median household income of $0, with 44 households (7.6%) in this group.
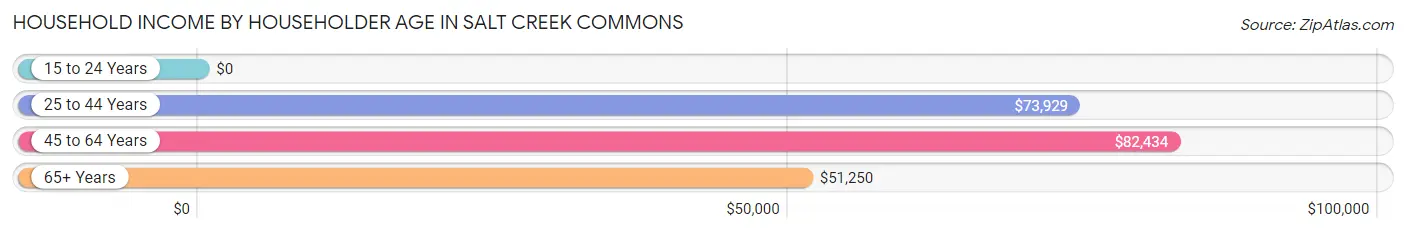
| Income Bracket | # Households | Median Income |
| 15 to 24 Years | 44 (7.6%) | $0 |
| 25 to 44 Years | 202 (34.8%) | $73,929 |
| 45 to 64 Years | 243 (41.8%) | $82,434 |
| 65+ Years | 92 (15.8%) | $51,250 |
| Total | 581 (100.0%) | $78,155 |
Poverty in Salt Creek Commons
Income Below Poverty by Sex and Age in Salt Creek Commons
With 7.3% poverty level for males and 17.0% for females among the residents of Salt Creek Commons, 16 and 17 year old males and under 5 year old females are the most vulnerable to poverty, with 12 males (17.9%) and 54 females (88.5%) in their respective age groups living below the poverty level.
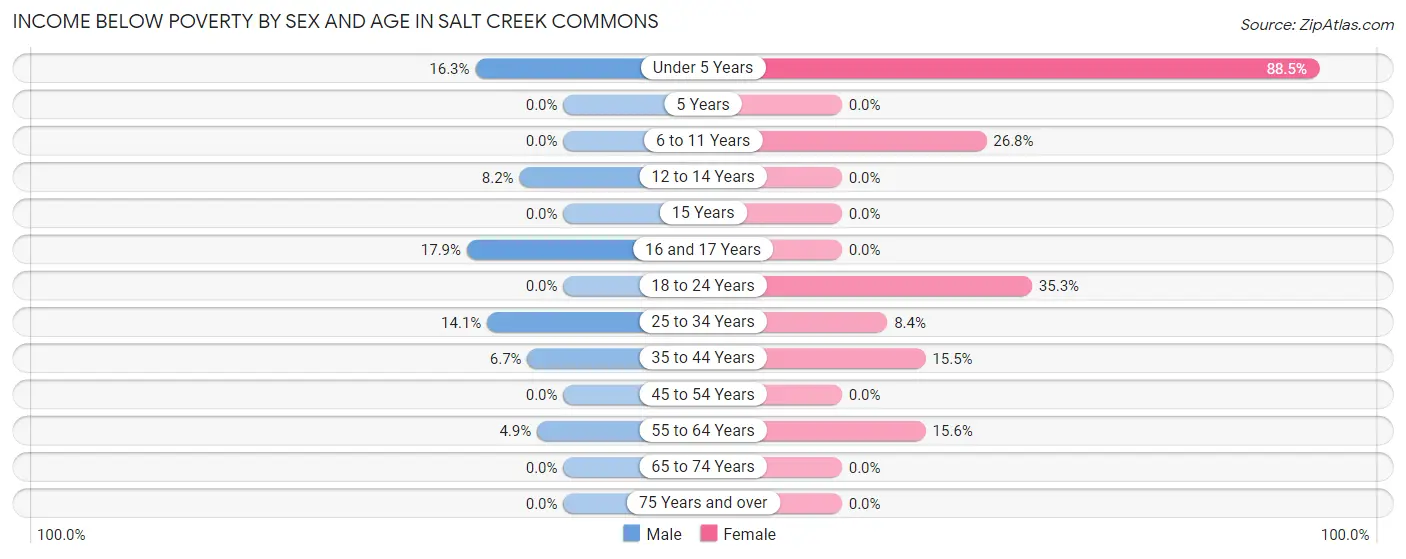
| Age Bracket | Male | Female |
| Under 5 Years | 8 (16.3%) | 54 (88.5%) |
| 5 Years | 0 (0.0%) | 0 (0.0%) |
| 6 to 11 Years | 0 (0.0%) | 11 (26.8%) |
| 12 to 14 Years | 12 (8.2%) | 0 (0.0%) |
| 15 Years | 0 (0.0%) | 0 (0.0%) |
| 16 and 17 Years | 12 (17.9%) | 0 (0.0%) |
| 18 to 24 Years | 0 (0.0%) | 36 (35.3%) |
| 25 to 34 Years | 27 (14.1%) | 7 (8.4%) |
| 35 to 44 Years | 10 (6.7%) | 18 (15.5%) |
| 45 to 54 Years | 0 (0.0%) | 0 (0.0%) |
| 55 to 64 Years | 4 (4.9%) | 19 (15.6%) |
| 65 to 74 Years | 0 (0.0%) | 0 (0.0%) |
| 75 Years and over | 0 (0.0%) | 0 (0.0%) |
| Total | 73 (7.3%) | 145 (17.0%) |
Income Above Poverty by Sex and Age in Salt Creek Commons
According to the poverty statistics in Salt Creek Commons, males aged 6 to 11 years and females aged 12 to 14 years are the age groups that are most secure financially, with 100.0% of males and 100.0% of females in these age groups living above the poverty line.

| Age Bracket | Male | Female |
| Under 5 Years | 41 (83.7%) | 7 (11.5%) |
| 5 Years | 0 (0.0%) | 0 (0.0%) |
| 6 to 11 Years | 41 (100.0%) | 30 (73.2%) |
| 12 to 14 Years | 135 (91.8%) | 77 (100.0%) |
| 15 Years | 11 (100.0%) | 37 (100.0%) |
| 16 and 17 Years | 55 (82.1%) | 0 (0.0%) |
| 18 to 24 Years | 82 (100.0%) | 66 (64.7%) |
| 25 to 34 Years | 164 (85.9%) | 76 (91.6%) |
| 35 to 44 Years | 140 (93.3%) | 98 (84.5%) |
| 45 to 54 Years | 110 (100.0%) | 122 (100.0%) |
| 55 to 64 Years | 78 (95.1%) | 103 (84.4%) |
| 65 to 74 Years | 70 (100.0%) | 93 (100.0%) |
| 75 Years and over | 0 (0.0%) | 0 (0.0%) |
| Total | 927 (92.7%) | 709 (83.0%) |
Income Below Poverty Among Married-Couple Families in Salt Creek Commons
The poverty statistics for married-couple families in Salt Creek Commons show that 3.2% or 12 of the total 373 families live below the poverty line. Families with 3 or 4 children have the highest poverty rate of 25.5%, comprising of 12 families. On the other hand, families with no children have the lowest poverty rate of 0.0%, which includes 0 families.
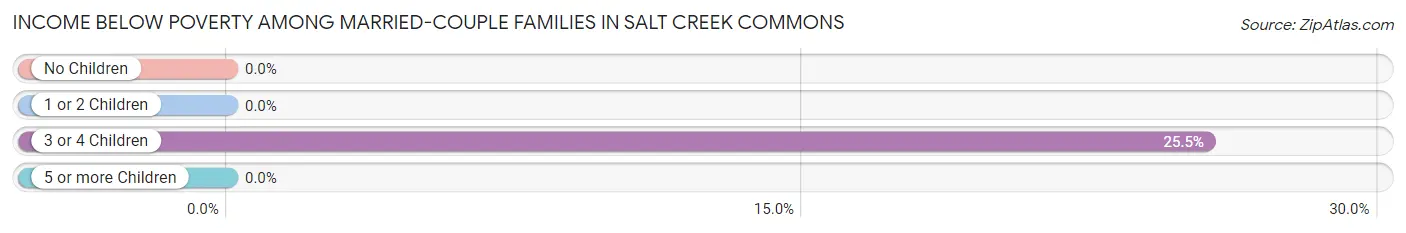
| Children | Above Poverty | Below Poverty |
| No Children | 118 (100.0%) | 0 (0.0%) |
| 1 or 2 Children | 208 (100.0%) | 0 (0.0%) |
| 3 or 4 Children | 35 (74.5%) | 12 (25.5%) |
| 5 or more Children | 0 (0.0%) | 0 (0.0%) |
| Total | 361 (96.8%) | 12 (3.2%) |
Income Below Poverty Among Single-Parent Households in Salt Creek Commons
According to the poverty data in Salt Creek Commons, 20.7% or 6 single-father households and 69.8% or 44 single-mother households are living below the poverty line. Among single-father households, those with 1 or 2 children have the highest poverty rate, with 6 households (33.3%) experiencing poverty. Likewise, among single-mother households, those with 1 or 2 children have the highest poverty rate, with 36 households (100.0%) falling below the poverty line.
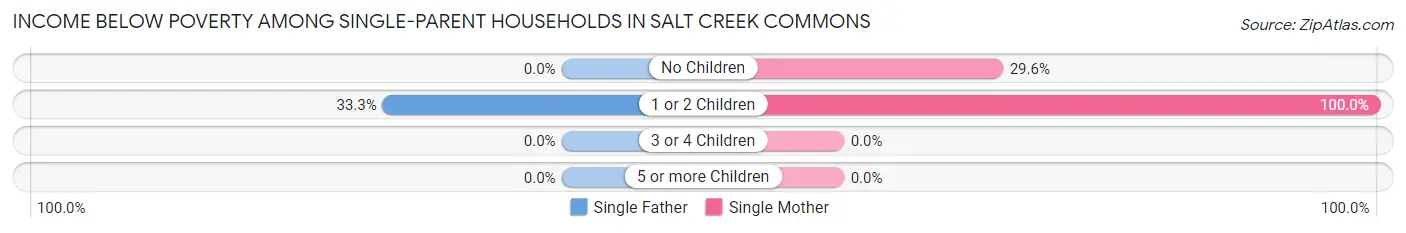
| Children | Single Father | Single Mother |
| No Children | 0 (0.0%) | 8 (29.6%) |
| 1 or 2 Children | 6 (33.3%) | 36 (100.0%) |
| 3 or 4 Children | 0 (0.0%) | 0 (0.0%) |
| 5 or more Children | 0 (0.0%) | 0 (0.0%) |
| Total | 6 (20.7%) | 44 (69.8%) |
Income Below Poverty Among Married-Couple vs Single-Parent Households in Salt Creek Commons
The poverty data for Salt Creek Commons shows that 12 of the married-couple family households (3.2%) and 50 of the single-parent households (54.3%) are living below the poverty level. Within the married-couple family households, those with 3 or 4 children have the highest poverty rate, with 12 households (25.5%) falling below the poverty line. Among the single-parent households, those with 1 or 2 children have the highest poverty rate, with 42 household (77.8%) living below poverty.
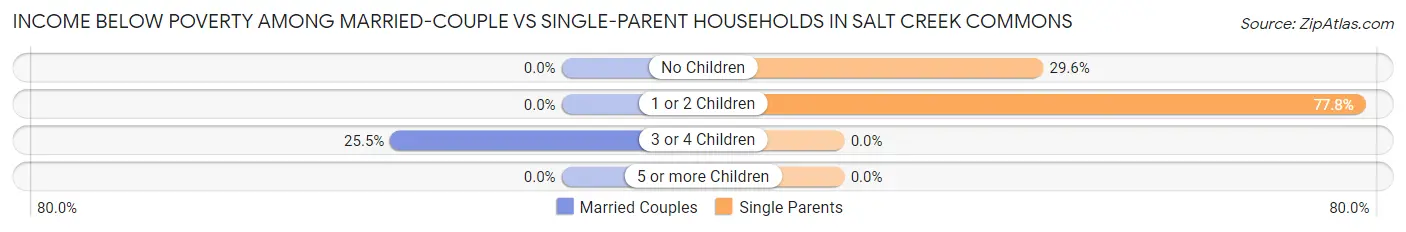
| Children | Married-Couple Families | Single-Parent Households |
| No Children | 0 (0.0%) | 8 (29.6%) |
| 1 or 2 Children | 0 (0.0%) | 42 (77.8%) |
| 3 or 4 Children | 12 (25.5%) | 0 (0.0%) |
| 5 or more Children | 0 (0.0%) | 0 (0.0%) |
| Total | 12 (3.2%) | 50 (54.3%) |
Employment Characteristics in Salt Creek Commons
Employment by Class of Employer in Salt Creek Commons
Among the 823 employed individuals in Salt Creek Commons, private company employees (691 | 84.0%), not-for-profit organizations (37 | 4.5%), and self-employed (not incorporated) (35 | 4.3%) make up the most common classes of employment.
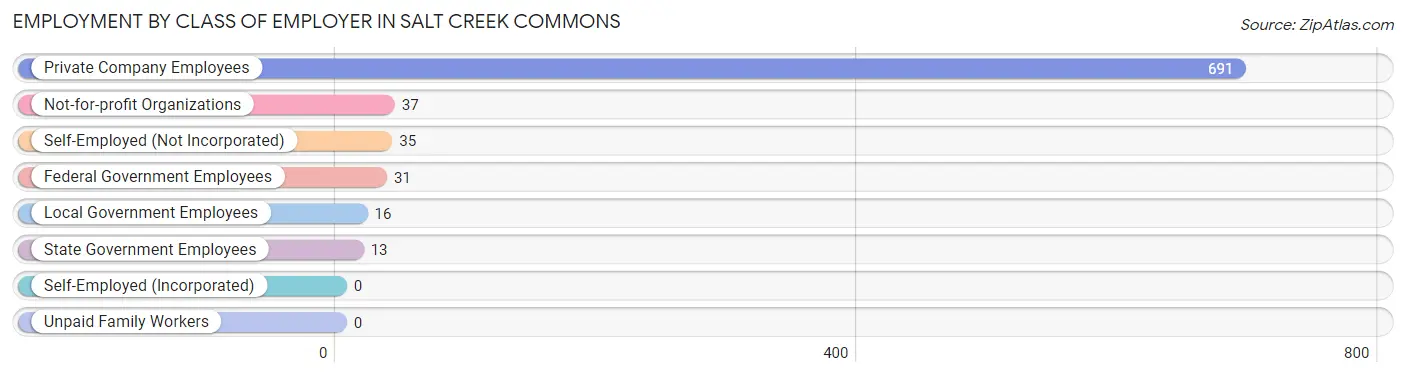
| Employer Class | # Employees | % Employees |
| Private Company Employees | 691 | 84.0% |
| Self-Employed (Incorporated) | 0 | 0.0% |
| Self-Employed (Not Incorporated) | 35 | 4.3% |
| Not-for-profit Organizations | 37 | 4.5% |
| Local Government Employees | 16 | 1.9% |
| State Government Employees | 13 | 1.6% |
| Federal Government Employees | 31 | 3.8% |
| Unpaid Family Workers | 0 | 0.0% |
| Total | 823 | 100.0% |
Employment Status by Age in Salt Creek Commons
According to the labor force statistics for Salt Creek Commons, out of the total population over 16 years of age (1,390), 60.9% or 847 individuals are in the labor force, with 2.7% or 23 of them unemployed. The age group with the highest labor force participation rate is 30 to 34 years, with 87.7% or 107 individuals in the labor force. Within the labor force, the 45 to 54 years age range has the highest percentage of unemployed individuals, with 8.6% or 16 of them being unemployed.
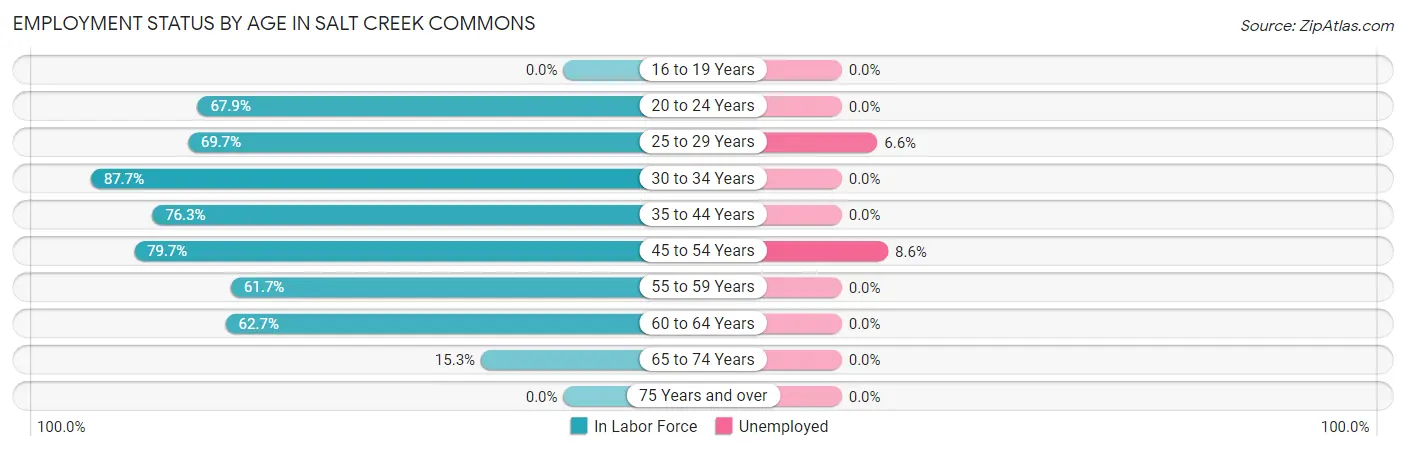
| Age Bracket | In Labor Force | Unemployed |
| 16 to 19 Years | 0 (0.0%) | 0 (0.0%) |
| 20 to 24 Years | 93 (67.9%) | 0 (0.0%) |
| 25 to 29 Years | 106 (69.7%) | 7 (6.6%) |
| 30 to 34 Years | 107 (87.7%) | 0 (0.0%) |
| 35 to 44 Years | 203 (76.3%) | 0 (0.0%) |
| 45 to 54 Years | 185 (79.7%) | 16 (8.6%) |
| 55 to 59 Years | 58 (61.7%) | 0 (0.0%) |
| 60 to 64 Years | 69 (62.7%) | 0 (0.0%) |
| 65 to 74 Years | 25 (15.3%) | 0 (0.0%) |
| 75 Years and over | 0 (0.0%) | 0 (0.0%) |
| Total | 847 (60.9%) | 23 (2.7%) |
Employment Status by Educational Attainment in Salt Creek Commons
According to labor force statistics for Salt Creek Commons, 74.6% of individuals (728) out of the total population between 25 and 64 years of age (976) are in the labor force, with 3.2% or 23 of them being unemployed. The group with the highest labor force participation rate are those with the educational attainment of college / associate degree, with 90.6% or 280 individuals in the labor force. Within the labor force, individuals with college / associate degree education have the highest percentage of unemployment, with 6.1% or 17 of them being unemployed.

| Educational Attainment | In Labor Force | Unemployed |
| Less than High School | 53 (57.6%) | 0 (0.0%) |
| High School Diploma | 289 (69.8%) | 9 (2.1%) |
| College / Associate Degree | 280 (90.6%) | 19 (6.1%) |
| Bachelor's Degree or higher | 106 (65.8%) | 0 (0.0%) |
| Total | 728 (74.6%) | 31 (3.2%) |
Employment Occupations by Sex in Salt Creek Commons
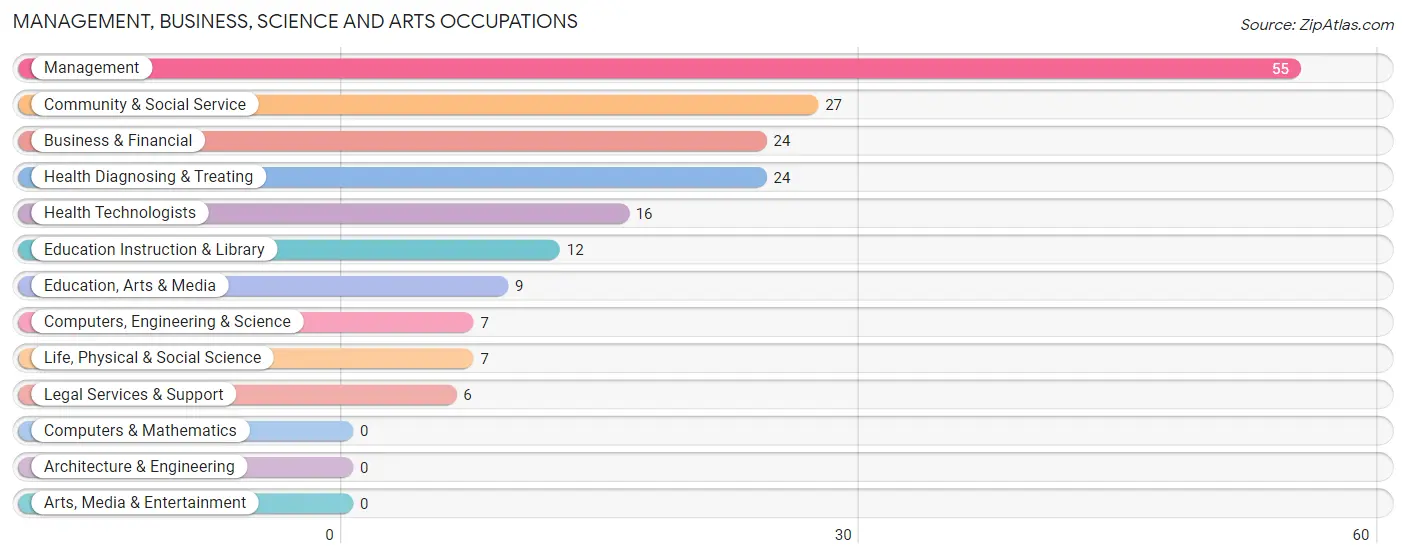
Management, Business, Science and Arts Occupations
The most common Management, Business, Science and Arts occupations in Salt Creek Commons are Management (55 | 6.7%), Community & Social Service (27 | 3.3%), Business & Financial (24 | 2.9%), Health Diagnosing & Treating (24 | 2.9%), and Health Technologists (16 | 1.9%).
Management, Business, Science and Arts Occupations by Sex
Within the Management, Business, Science and Arts occupations in Salt Creek Commons, the most male-oriented occupations are Management (83.6%), and Business & Financial (58.3%), while the most female-oriented occupations are Computers, Engineering & Science (100.0%), Life, Physical & Social Science (100.0%), and Community & Social Service (100.0%).
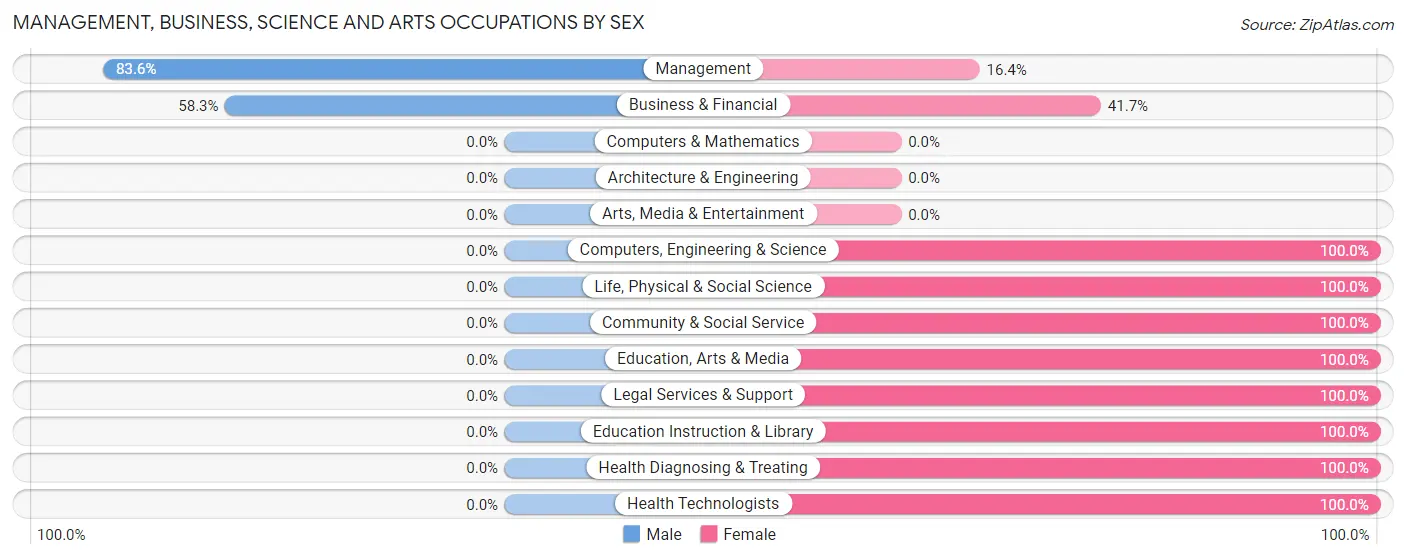
| Occupation | Male | Female |
| Management | 46 (83.6%) | 9 (16.4%) |
| Business & Financial | 14 (58.3%) | 10 (41.7%) |
| Computers, Engineering & Science | 0 (0.0%) | 7 (100.0%) |
| Computers & Mathematics | 0 (0.0%) | 0 (0.0%) |
| Architecture & Engineering | 0 (0.0%) | 0 (0.0%) |
| Life, Physical & Social Science | 0 (0.0%) | 7 (100.0%) |
| Community & Social Service | 0 (0.0%) | 27 (100.0%) |
| Education, Arts & Media | 0 (0.0%) | 9 (100.0%) |
| Legal Services & Support | 0 (0.0%) | 6 (100.0%) |
| Education Instruction & Library | 0 (0.0%) | 12 (100.0%) |
| Arts, Media & Entertainment | 0 (0.0%) | 0 (0.0%) |
| Health Diagnosing & Treating | 0 (0.0%) | 24 (100.0%) |
| Health Technologists | 0 (0.0%) | 16 (100.0%) |
| Total (Category) | 60 (43.8%) | 77 (56.2%) |
| Total (Overall) | 475 (57.7%) | 348 (42.3%) |
Services Occupations
The most common Services occupations in Salt Creek Commons are Cleaning & Maintenance (53 | 6.4%), Healthcare Support (50 | 6.1%), and Food Preparation & Serving (49 | 5.9%).
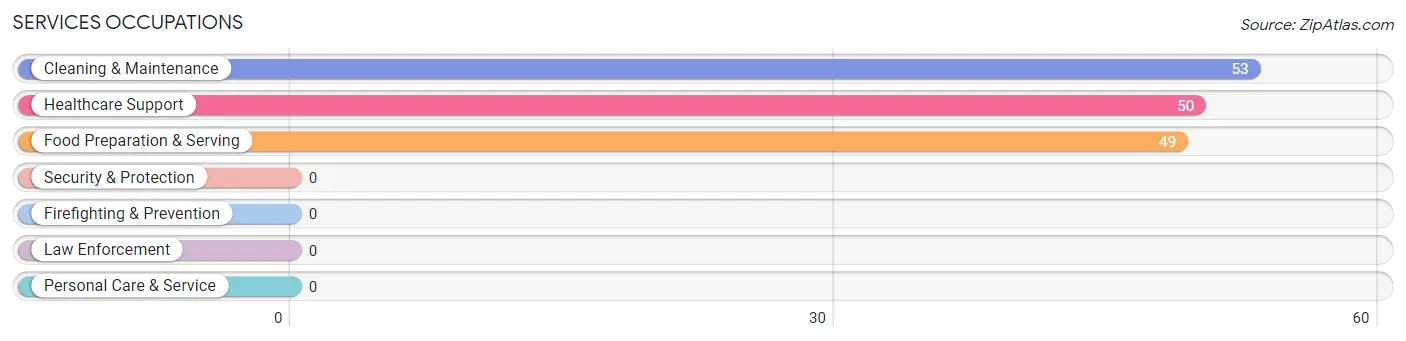
Services Occupations by Sex
Within the Services occupations in Salt Creek Commons, the most male-oriented occupations are Cleaning & Maintenance (86.8%), and Food Preparation & Serving (24.5%), while the most female-oriented occupations are Healthcare Support (100.0%), Food Preparation & Serving (75.5%), and Cleaning & Maintenance (13.2%).
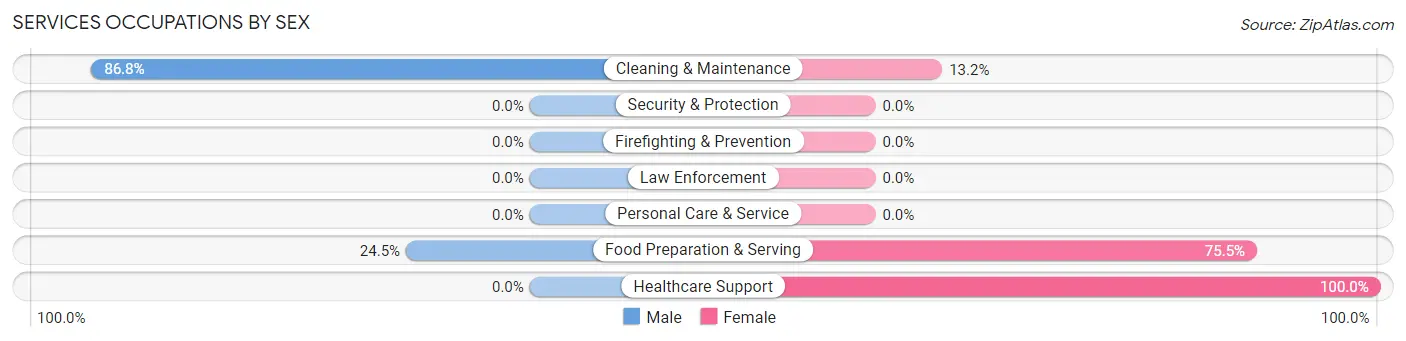
| Occupation | Male | Female |
| Healthcare Support | 0 (0.0%) | 50 (100.0%) |
| Security & Protection | 0 (0.0%) | 0 (0.0%) |
| Firefighting & Prevention | 0 (0.0%) | 0 (0.0%) |
| Law Enforcement | 0 (0.0%) | 0 (0.0%) |
| Food Preparation & Serving | 12 (24.5%) | 37 (75.5%) |
| Cleaning & Maintenance | 46 (86.8%) | 7 (13.2%) |
| Personal Care & Service | 0 (0.0%) | 0 (0.0%) |
| Total (Category) | 58 (38.2%) | 94 (61.8%) |
| Total (Overall) | 475 (57.7%) | 348 (42.3%) |
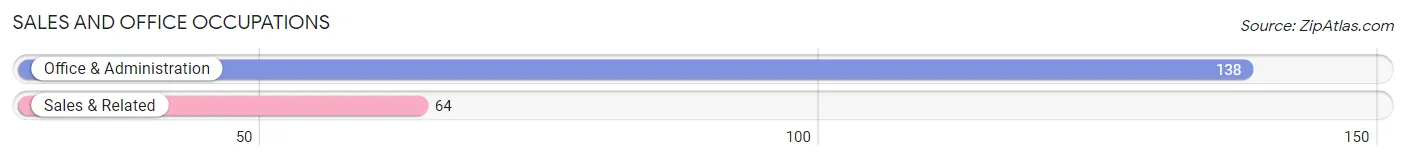
Sales and Office Occupations
The most common Sales and Office occupations in Salt Creek Commons are Office & Administration (138 | 16.8%), and Sales & Related (64 | 7.8%).
Sales and Office Occupations by Sex
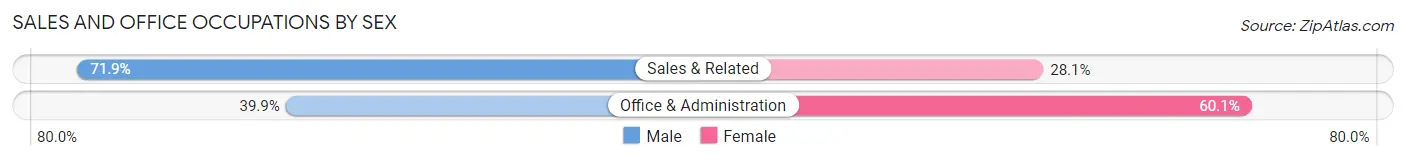
| Occupation | Male | Female |
| Sales & Related | 46 (71.9%) | 18 (28.1%) |
| Office & Administration | 55 (39.9%) | 83 (60.1%) |
| Total (Category) | 101 (50.0%) | 101 (50.0%) |
| Total (Overall) | 475 (57.7%) | 348 (42.3%) |
Natural Resources, Construction and Maintenance Occupations
The most common Natural Resources, Construction and Maintenance occupations in Salt Creek Commons are Construction & Extraction (125 | 15.2%), and Installation, Maintenance & Repair (24 | 2.9%).

Natural Resources, Construction and Maintenance Occupations by Sex
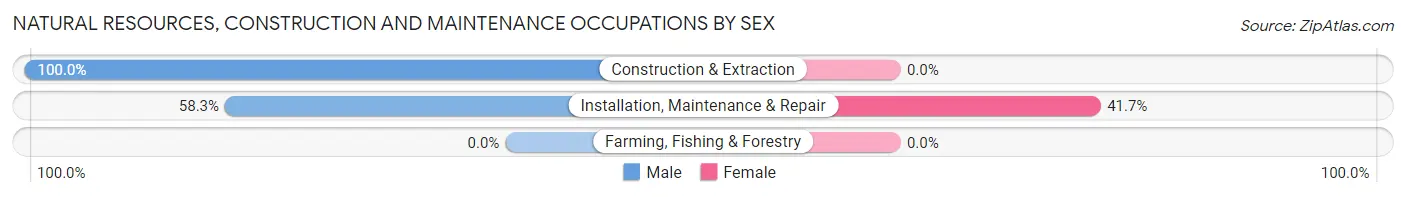
| Occupation | Male | Female |
| Farming, Fishing & Forestry | 0 (0.0%) | 0 (0.0%) |
| Construction & Extraction | 125 (100.0%) | 0 (0.0%) |
| Installation, Maintenance & Repair | 14 (58.3%) | 10 (41.7%) |
| Total (Category) | 139 (93.3%) | 10 (6.7%) |
| Total (Overall) | 475 (57.7%) | 348 (42.3%) |
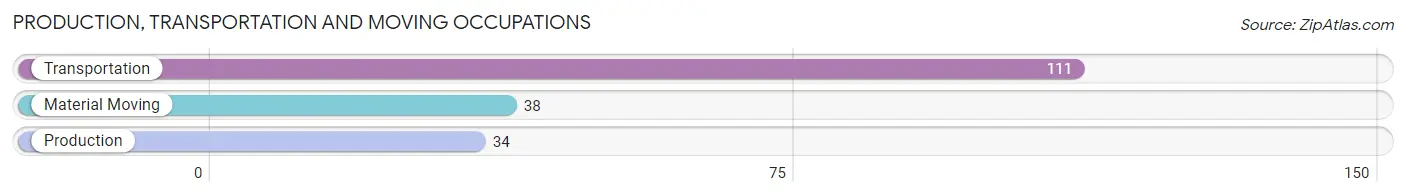
Production, Transportation and Moving Occupations
The most common Production, Transportation and Moving occupations in Salt Creek Commons are Transportation (111 | 13.5%), Material Moving (38 | 4.6%), and Production (34 | 4.1%).
Production, Transportation and Moving Occupations by Sex
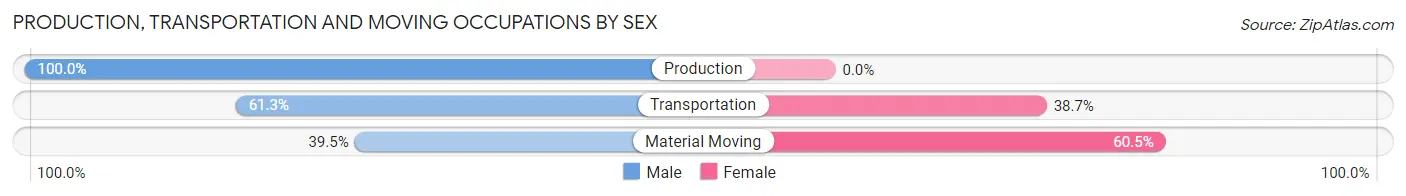
| Occupation | Male | Female |
| Production | 34 (100.0%) | 0 (0.0%) |
| Transportation | 68 (61.3%) | 43 (38.7%) |
| Material Moving | 15 (39.5%) | 23 (60.5%) |
| Total (Category) | 117 (63.9%) | 66 (36.1%) |
| Total (Overall) | 475 (57.7%) | 348 (42.3%) |
Employment Industries by Sex in Salt Creek Commons
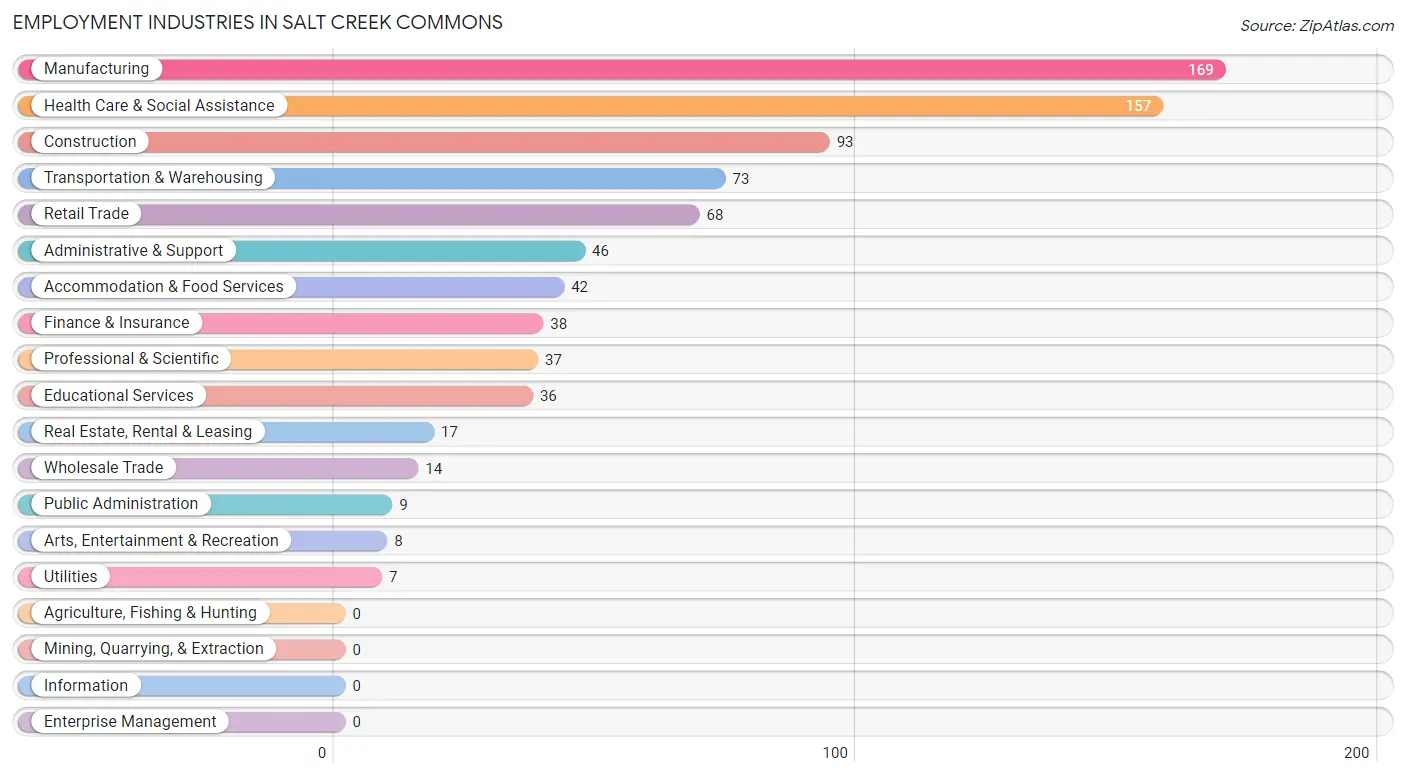
Employment Industries in Salt Creek Commons
The major employment industries in Salt Creek Commons include Manufacturing (169 | 20.5%), Health Care & Social Assistance (157 | 19.1%), Construction (93 | 11.3%), Transportation & Warehousing (73 | 8.9%), and Retail Trade (68 | 8.3%).
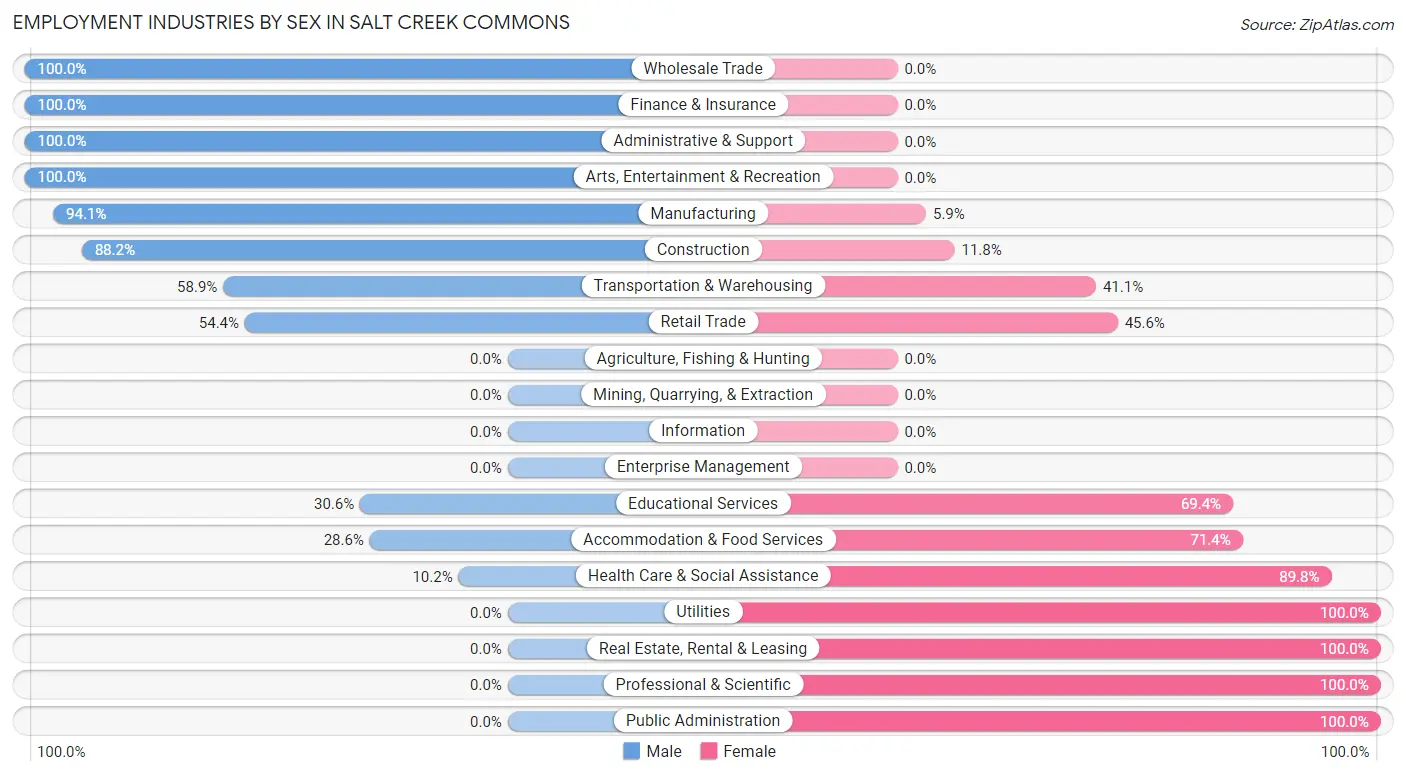
Employment Industries by Sex in Salt Creek Commons
The Salt Creek Commons industries that see more men than women are Wholesale Trade (100.0%), Finance & Insurance (100.0%), and Administrative & Support (100.0%), whereas the industries that tend to have a higher number of women are Utilities (100.0%), Real Estate, Rental & Leasing (100.0%), and Professional & Scientific (100.0%).
| Industry | Male | Female |
| Agriculture, Fishing & Hunting | 0 (0.0%) | 0 (0.0%) |
| Mining, Quarrying, & Extraction | 0 (0.0%) | 0 (0.0%) |
| Construction | 82 (88.2%) | 11 (11.8%) |
| Manufacturing | 159 (94.1%) | 10 (5.9%) |
| Wholesale Trade | 14 (100.0%) | 0 (0.0%) |
| Retail Trade | 37 (54.4%) | 31 (45.6%) |
| Transportation & Warehousing | 43 (58.9%) | 30 (41.1%) |
| Utilities | 0 (0.0%) | 7 (100.0%) |
| Information | 0 (0.0%) | 0 (0.0%) |
| Finance & Insurance | 38 (100.0%) | 0 (0.0%) |
| Real Estate, Rental & Leasing | 0 (0.0%) | 17 (100.0%) |
| Professional & Scientific | 0 (0.0%) | 37 (100.0%) |
| Enterprise Management | 0 (0.0%) | 0 (0.0%) |
| Administrative & Support | 46 (100.0%) | 0 (0.0%) |
| Educational Services | 11 (30.6%) | 25 (69.4%) |
| Health Care & Social Assistance | 16 (10.2%) | 141 (89.8%) |
| Arts, Entertainment & Recreation | 8 (100.0%) | 0 (0.0%) |
| Accommodation & Food Services | 12 (28.6%) | 30 (71.4%) |
| Public Administration | 0 (0.0%) | 9 (100.0%) |
| Total | 475 (57.7%) | 348 (42.3%) |
Education in Salt Creek Commons
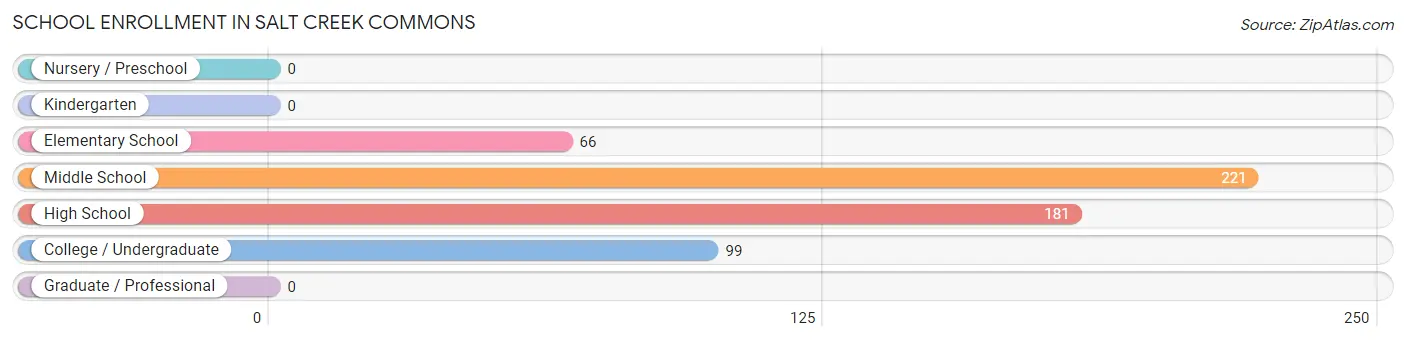
School Enrollment in Salt Creek Commons
The most common levels of schooling among the 567 students in Salt Creek Commons are middle school (221 | 39.0%), high school (181 | 31.9%), and college / undergraduate (99 | 17.5%).
| School Level | # Students | % Students |
| Nursery / Preschool | 0 | 0.0% |
| Kindergarten | 0 | 0.0% |
| Elementary School | 66 | 11.6% |
| Middle School | 221 | 39.0% |
| High School | 181 | 31.9% |
| College / Undergraduate | 99 | 17.5% |
| Graduate / Professional | 0 | 0.0% |
| Total | 567 | 100.0% |
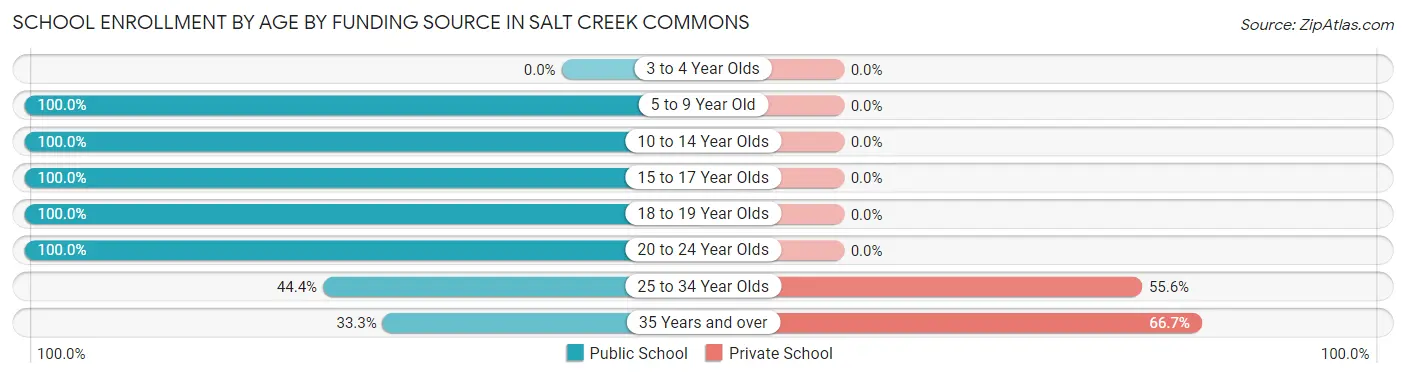
School Enrollment by Age by Funding Source in Salt Creek Commons
Out of a total of 567 students who are enrolled in schools in Salt Creek Commons, 22 (3.9%) attend a private institution, while the remaining 545 (96.1%) are enrolled in public schools. The age group of 35 years and over has the highest likelihood of being enrolled in private schools, with 12 (66.7% in the age bracket) enrolled. Conversely, the age group of 5 to 9 year old has the lowest likelihood of being enrolled in a private school, with 54 (100.0% in the age bracket) attending a public institution.
| Age Bracket | Public School | Private School |
| 3 to 4 Year Olds | 0 (0.0%) | 0 (0.0%) |
| 5 to 9 Year Old | 54 (100.0%) | 0 (0.0%) |
| 10 to 14 Year Olds | 252 (100.0%) | 0 (0.0%) |
| 15 to 17 Year Olds | 115 (100.0%) | 0 (0.0%) |
| 18 to 19 Year Olds | 47 (100.0%) | 0 (0.0%) |
| 20 to 24 Year Olds | 63 (100.0%) | 0 (0.0%) |
| 25 to 34 Year Olds | 8 (44.4%) | 10 (55.6%) |
| 35 Years and over | 6 (33.3%) | 12 (66.7%) |
| Total | 545 (96.1%) | 22 (3.9%) |
Educational Attainment by Field of Study in Salt Creek Commons
Education (52 | 23.8%), social sciences (47 | 21.6%), science & technology (31 | 14.2%), liberal arts & history (29 | 13.3%), and arts & humanities (26 | 11.9%) are the most common fields of study among 218 individuals in Salt Creek Commons who have obtained a bachelor's degree or higher.
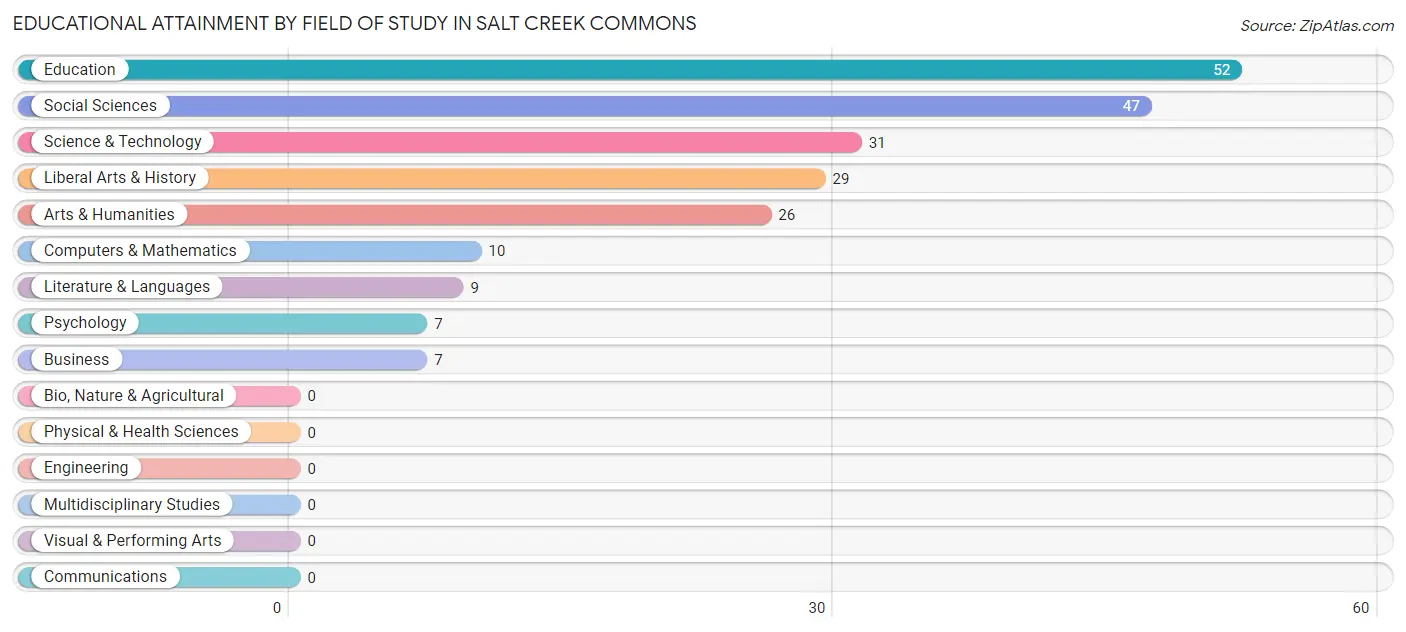
| Field of Study | # Graduates | % Graduates |
| Computers & Mathematics | 10 | 4.6% |
| Bio, Nature & Agricultural | 0 | 0.0% |
| Physical & Health Sciences | 0 | 0.0% |
| Psychology | 7 | 3.2% |
| Social Sciences | 47 | 21.6% |
| Engineering | 0 | 0.0% |
| Multidisciplinary Studies | 0 | 0.0% |
| Science & Technology | 31 | 14.2% |
| Business | 7 | 3.2% |
| Education | 52 | 23.8% |
| Literature & Languages | 9 | 4.1% |
| Liberal Arts & History | 29 | 13.3% |
| Visual & Performing Arts | 0 | 0.0% |
| Communications | 0 | 0.0% |
| Arts & Humanities | 26 | 11.9% |
| Total | 218 | 100.0% |
Transportation & Commute in Salt Creek Commons
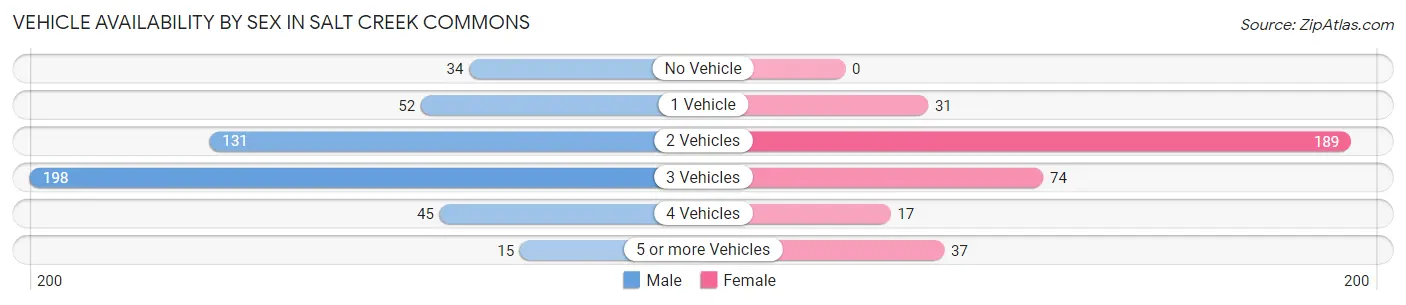
Vehicle Availability by Sex in Salt Creek Commons
The most prevalent vehicle ownership categories in Salt Creek Commons are males with 3 vehicles (198, accounting for 41.7%) and females with 3 vehicles (74, making up 56.9%).
| Vehicles Available | Male | Female |
| No Vehicle | 34 (7.2%) | 0 (0.0%) |
| 1 Vehicle | 52 (11.0%) | 31 (8.9%) |
| 2 Vehicles | 131 (27.6%) | 189 (54.3%) |
| 3 Vehicles | 198 (41.7%) | 74 (21.3%) |
| 4 Vehicles | 45 (9.5%) | 17 (4.9%) |
| 5 or more Vehicles | 15 (3.2%) | 37 (10.6%) |
| Total | 475 (100.0%) | 348 (100.0%) |
Commute Time in Salt Creek Commons
The most frequently occuring commute durations in Salt Creek Commons are 30 to 34 minutes (190 commuters, 23.6%), 15 to 19 minutes (160 commuters, 19.9%), and 45 to 59 minutes (135 commuters, 16.8%).

| Commute Time | # Commuters | % Commuters |
| Less than 5 Minutes | 0 | 0.0% |
| 5 to 9 Minutes | 7 | 0.9% |
| 10 to 14 Minutes | 82 | 10.2% |
| 15 to 19 Minutes | 160 | 19.9% |
| 20 to 24 Minutes | 112 | 13.9% |
| 25 to 29 Minutes | 51 | 6.3% |
| 30 to 34 Minutes | 190 | 23.6% |
| 35 to 39 Minutes | 9 | 1.1% |
| 40 to 44 Minutes | 31 | 3.8% |
| 45 to 59 Minutes | 135 | 16.8% |
| 60 to 89 Minutes | 21 | 2.6% |
| 90 or more Minutes | 7 | 0.9% |
Commute Time by Sex in Salt Creek Commons
The most common commute times in Salt Creek Commons are 30 to 34 minutes (133 commuters, 28.0%) for males and 15 to 19 minutes (76 commuters, 23.0%) for females.
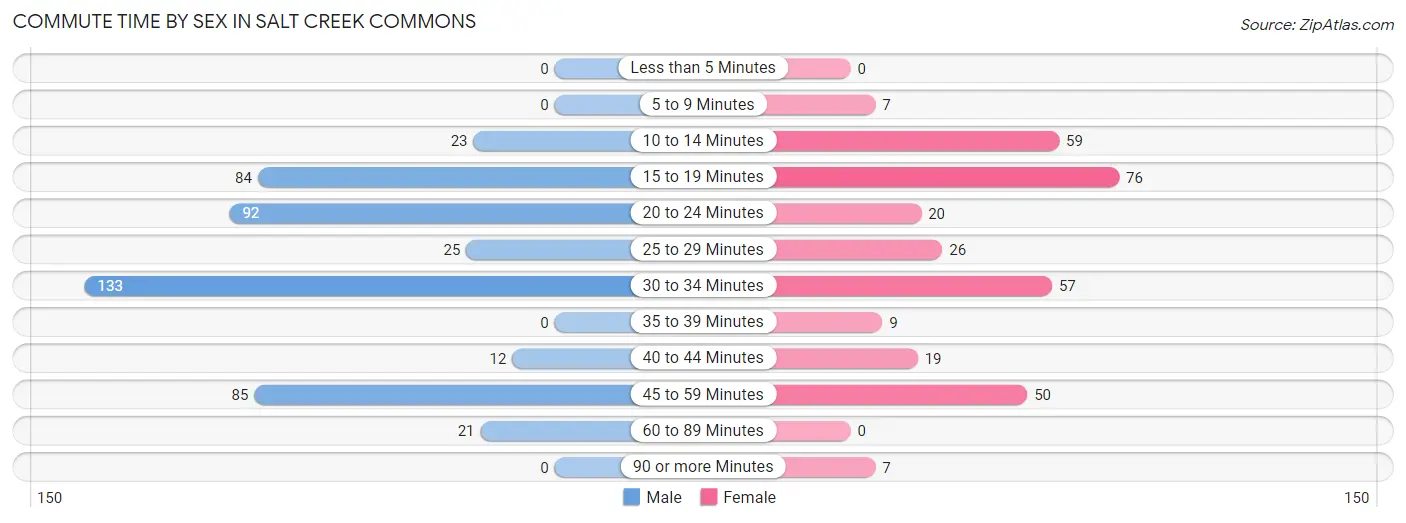
| Commute Time | Male | Female |
| Less than 5 Minutes | 0 (0.0%) | 0 (0.0%) |
| 5 to 9 Minutes | 0 (0.0%) | 7 (2.1%) |
| 10 to 14 Minutes | 23 (4.8%) | 59 (17.9%) |
| 15 to 19 Minutes | 84 (17.7%) | 76 (23.0%) |
| 20 to 24 Minutes | 92 (19.4%) | 20 (6.1%) |
| 25 to 29 Minutes | 25 (5.3%) | 26 (7.9%) |
| 30 to 34 Minutes | 133 (28.0%) | 57 (17.3%) |
| 35 to 39 Minutes | 0 (0.0%) | 9 (2.7%) |
| 40 to 44 Minutes | 12 (2.5%) | 19 (5.8%) |
| 45 to 59 Minutes | 85 (17.9%) | 50 (15.1%) |
| 60 to 89 Minutes | 21 (4.4%) | 0 (0.0%) |
| 90 or more Minutes | 0 (0.0%) | 7 (2.1%) |
Time of Departure to Work by Sex in Salt Creek Commons
The most frequent times of departure to work in Salt Creek Commons are 6:30 AM to 6:59 AM (129, 27.2%) for males and 6:00 AM to 6:29 AM (74, 22.4%) for females.
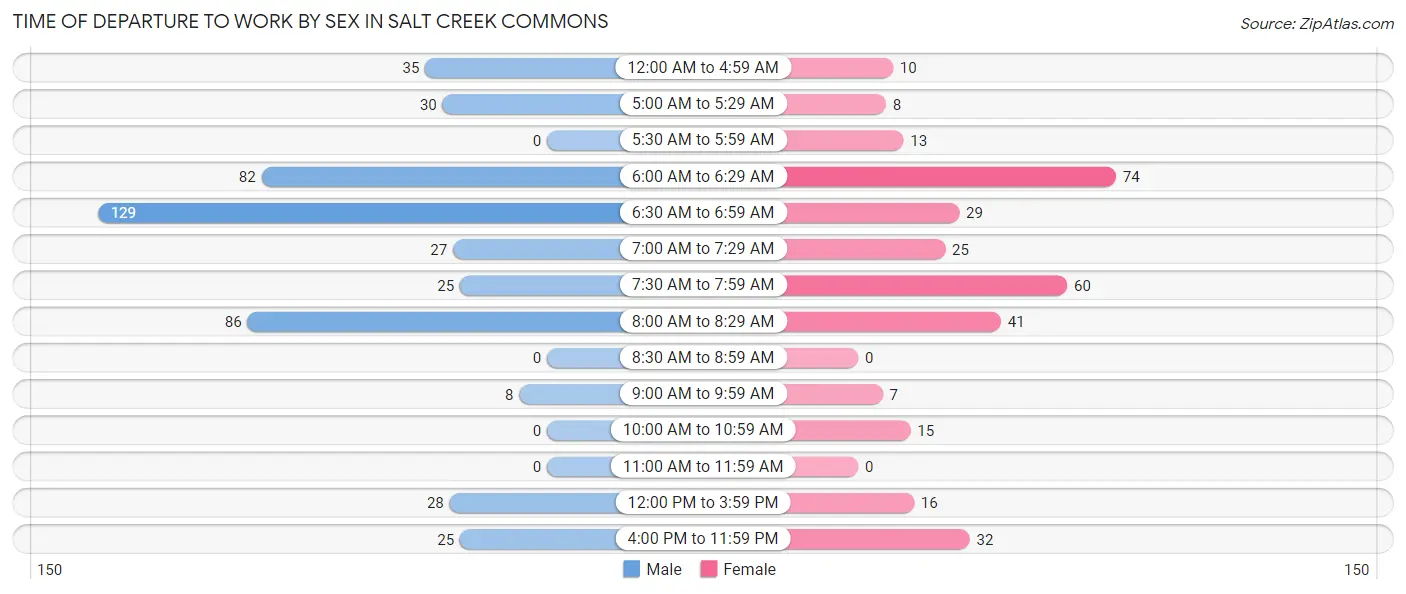
| Time of Departure | Male | Female |
| 12:00 AM to 4:59 AM | 35 (7.4%) | 10 (3.0%) |
| 5:00 AM to 5:29 AM | 30 (6.3%) | 8 (2.4%) |
| 5:30 AM to 5:59 AM | 0 (0.0%) | 13 (3.9%) |
| 6:00 AM to 6:29 AM | 82 (17.3%) | 74 (22.4%) |
| 6:30 AM to 6:59 AM | 129 (27.2%) | 29 (8.8%) |
| 7:00 AM to 7:29 AM | 27 (5.7%) | 25 (7.6%) |
| 7:30 AM to 7:59 AM | 25 (5.3%) | 60 (18.2%) |
| 8:00 AM to 8:29 AM | 86 (18.1%) | 41 (12.4%) |
| 8:30 AM to 8:59 AM | 0 (0.0%) | 0 (0.0%) |
| 9:00 AM to 9:59 AM | 8 (1.7%) | 7 (2.1%) |
| 10:00 AM to 10:59 AM | 0 (0.0%) | 15 (4.5%) |
| 11:00 AM to 11:59 AM | 0 (0.0%) | 0 (0.0%) |
| 12:00 PM to 3:59 PM | 28 (5.9%) | 16 (4.9%) |
| 4:00 PM to 11:59 PM | 25 (5.3%) | 32 (9.7%) |
| Total | 475 (100.0%) | 330 (100.0%) |
Housing Occupancy in Salt Creek Commons
Occupancy by Ownership in Salt Creek Commons
Of the total 581 dwellings in Salt Creek Commons, owner-occupied units account for 513 (88.3%), while renter-occupied units make up 68 (11.7%).
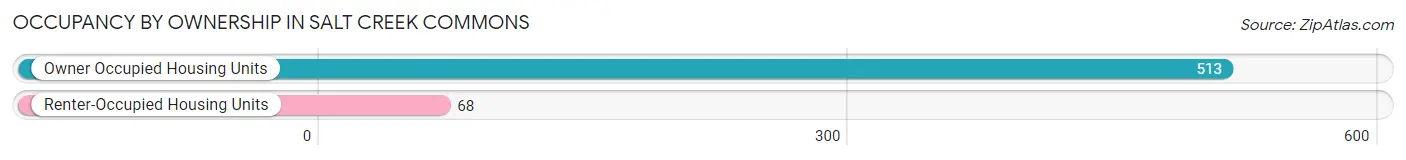
| Occupancy | # Housing Units | % Housing Units |
| Owner Occupied Housing Units | 513 | 88.3% |
| Renter-Occupied Housing Units | 68 | 11.7% |
| Total Occupied Housing Units | 581 | 100.0% |
Occupancy by Household Size in Salt Creek Commons
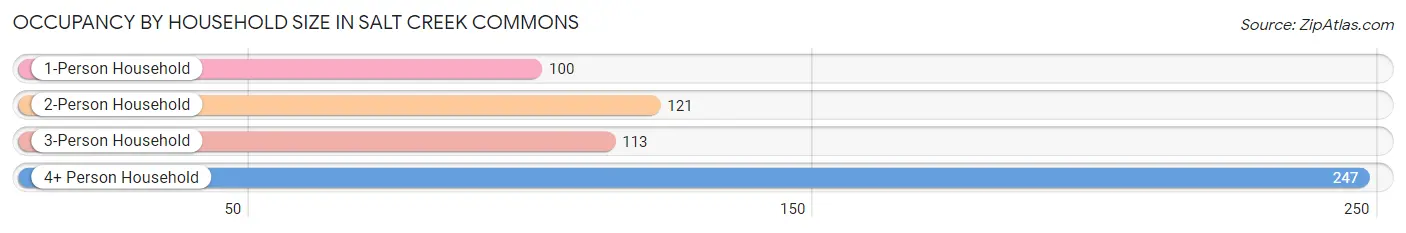
| Household Size | # Housing Units | % Housing Units |
| 1-Person Household | 100 | 17.2% |
| 2-Person Household | 121 | 20.8% |
| 3-Person Household | 113 | 19.5% |
| 4+ Person Household | 247 | 42.5% |
| Total Housing Units | 581 | 100.0% |
Occupancy by Ownership by Household Size in Salt Creek Commons

| Household Size | Owner-occupied | Renter-occupied |
| 1-Person Household | 94 (94.0%) | 6 (6.0%) |
| 2-Person Household | 121 (100.0%) | 0 (0.0%) |
| 3-Person Household | 99 (87.6%) | 14 (12.4%) |
| 4+ Person Household | 199 (80.6%) | 48 (19.4%) |
| Total Housing Units | 513 (88.3%) | 68 (11.7%) |
Occupancy by Educational Attainment in Salt Creek Commons
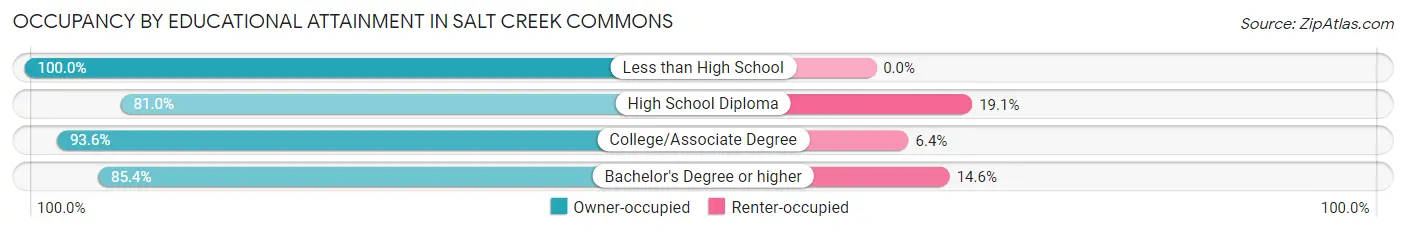
| Household Size | Owner-occupied | Renter-occupied |
| Less than High School | 16 (100.0%) | 0 (0.0%) |
| High School Diploma | 153 (80.9%) | 36 (19.1%) |
| College/Associate Degree | 262 (93.6%) | 18 (6.4%) |
| Bachelor's Degree or higher | 82 (85.4%) | 14 (14.6%) |
Occupancy by Age of Householder in Salt Creek Commons
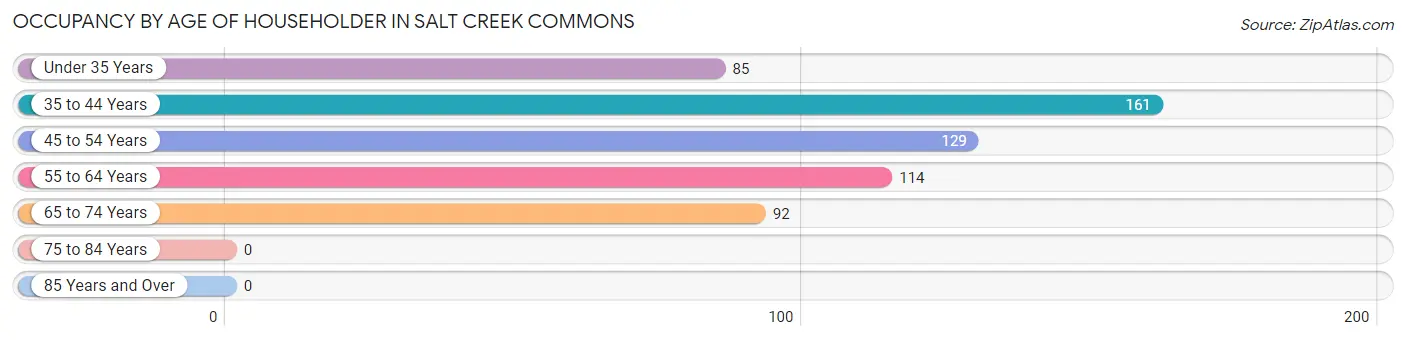
| Age Bracket | # Households | % Households |
| Under 35 Years | 85 | 14.6% |
| 35 to 44 Years | 161 | 27.7% |
| 45 to 54 Years | 129 | 22.2% |
| 55 to 64 Years | 114 | 19.6% |
| 65 to 74 Years | 92 | 15.8% |
| 75 to 84 Years | 0 | 0.0% |
| 85 Years and Over | 0 | 0.0% |
| Total | 581 | 100.0% |
Housing Finances in Salt Creek Commons
Median Income by Occupancy in Salt Creek Commons
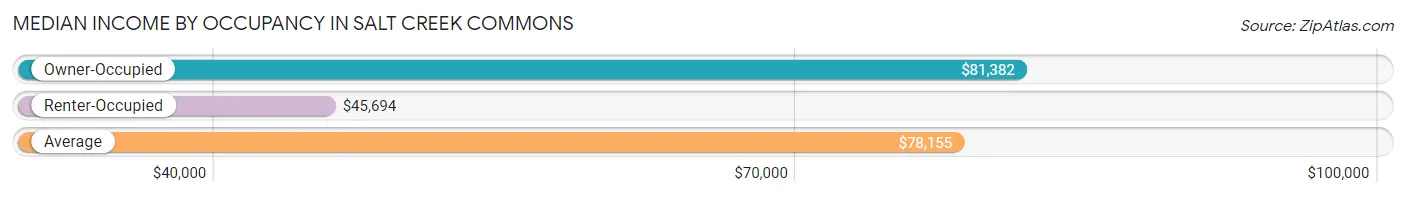
| Occupancy Type | # Households | Median Income |
| Owner-Occupied | 513 (88.3%) | $81,382 |
| Renter-Occupied | 68 (11.7%) | $45,694 |
| Average | 581 (100.0%) | $78,155 |
Occupancy by Householder Income Bracket in Salt Creek Commons

| Income Bracket | Owner-occupied | Renter-occupied |
| Less than $5,000 | 0 (0.0%) | 6 (8.8%) |
| $5,000 to $9,999 | 4 (0.8%) | 0 (0.0%) |
| $10,000 to $14,999 | 8 (1.6%) | 0 (0.0%) |
| $15,000 to $19,999 | 0 (0.0%) | 12 (17.6%) |
| $20,000 to $24,999 | 22 (4.3%) | 0 (0.0%) |
| $25,000 to $34,999 | 18 (3.5%) | 6 (8.8%) |
| $35,000 to $49,999 | 36 (7.0%) | 36 (52.9%) |
| $50,000 to $74,999 | 137 (26.7%) | 0 (0.0%) |
| $75,000 to $99,999 | 117 (22.8%) | 0 (0.0%) |
| $100,000 to $149,999 | 123 (24.0%) | 0 (0.0%) |
| $150,000 or more | 48 (9.4%) | 8 (11.8%) |
| Total | 513 (100.0%) | 68 (100.0%) |
Monthly Housing Cost Tiers in Salt Creek Commons
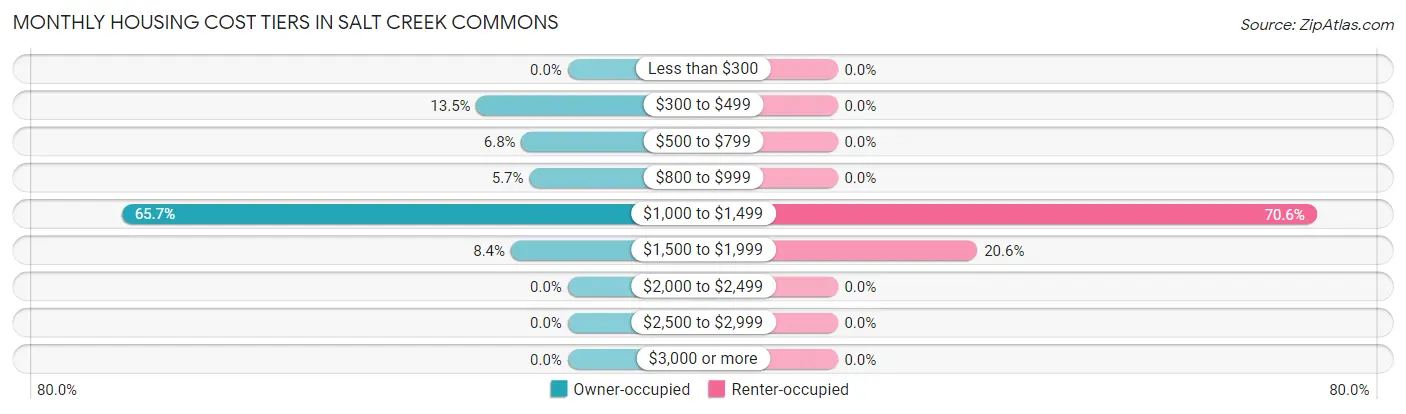
| Monthly Cost | Owner-occupied | Renter-occupied |
| Less than $300 | 0 (0.0%) | 0 (0.0%) |
| $300 to $499 | 69 (13.5%) | 0 (0.0%) |
| $500 to $799 | 35 (6.8%) | 0 (0.0%) |
| $800 to $999 | 29 (5.7%) | 0 (0.0%) |
| $1,000 to $1,499 | 337 (65.7%) | 48 (70.6%) |
| $1,500 to $1,999 | 43 (8.4%) | 14 (20.6%) |
| $2,000 to $2,499 | 0 (0.0%) | 0 (0.0%) |
| $2,500 to $2,999 | 0 (0.0%) | 0 (0.0%) |
| $3,000 or more | 0 (0.0%) | 0 (0.0%) |
| Total | 513 (100.0%) | 68 (100.0%) |
Physical Housing Characteristics in Salt Creek Commons
Housing Structures in Salt Creek Commons
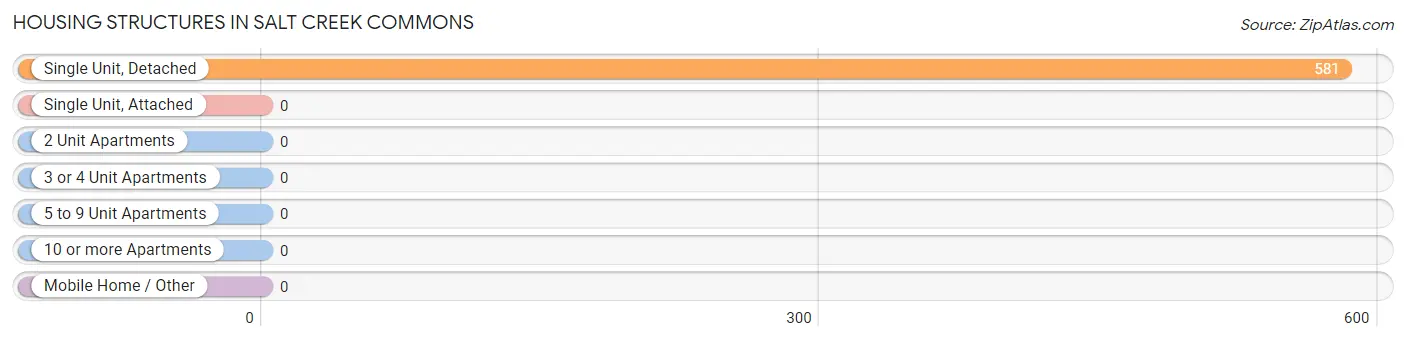
| Structure Type | # Housing Units | % Housing Units |
| Single Unit, Detached | 581 | 100.0% |
| Single Unit, Attached | 0 | 0.0% |
| 2 Unit Apartments | 0 | 0.0% |
| 3 or 4 Unit Apartments | 0 | 0.0% |
| 5 to 9 Unit Apartments | 0 | 0.0% |
| 10 or more Apartments | 0 | 0.0% |
| Mobile Home / Other | 0 | 0.0% |
| Total | 581 | 100.0% |
Housing Structures by Occupancy in Salt Creek Commons
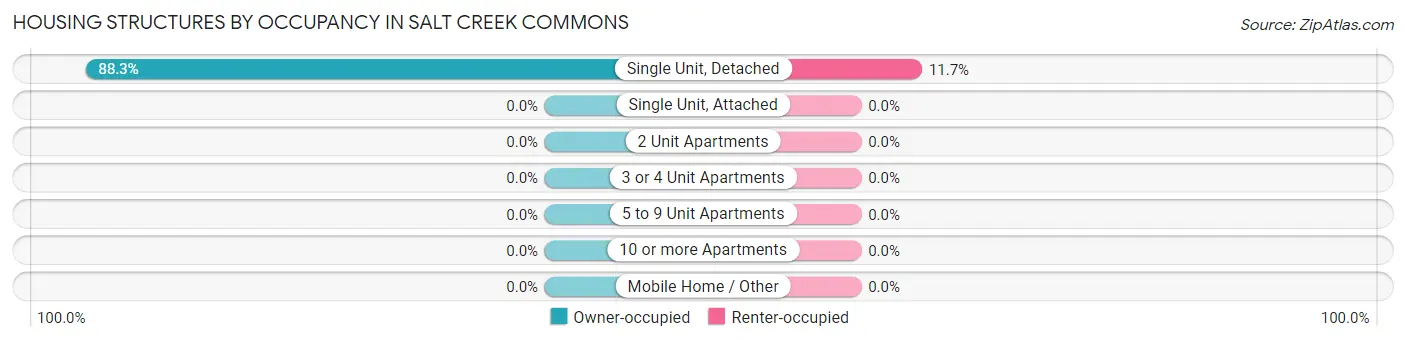
| Structure Type | Owner-occupied | Renter-occupied |
| Single Unit, Detached | 513 (88.3%) | 68 (11.7%) |
| Single Unit, Attached | 0 (0.0%) | 0 (0.0%) |
| 2 Unit Apartments | 0 (0.0%) | 0 (0.0%) |
| 3 or 4 Unit Apartments | 0 (0.0%) | 0 (0.0%) |
| 5 to 9 Unit Apartments | 0 (0.0%) | 0 (0.0%) |
| 10 or more Apartments | 0 (0.0%) | 0 (0.0%) |
| Mobile Home / Other | 0 (0.0%) | 0 (0.0%) |
| Total | 513 (88.3%) | 68 (11.7%) |
Housing Structures by Number of Rooms in Salt Creek Commons
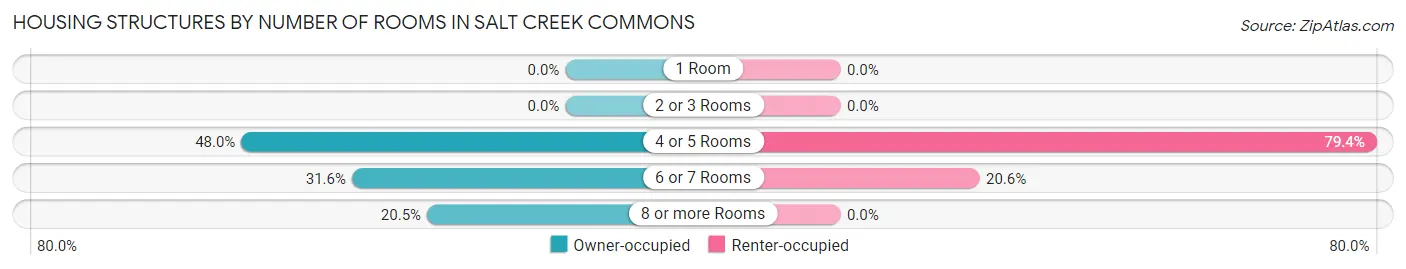
| Number of Rooms | Owner-occupied | Renter-occupied |
| 1 Room | 0 (0.0%) | 0 (0.0%) |
| 2 or 3 Rooms | 0 (0.0%) | 0 (0.0%) |
| 4 or 5 Rooms | 246 (47.9%) | 54 (79.4%) |
| 6 or 7 Rooms | 162 (31.6%) | 14 (20.6%) |
| 8 or more Rooms | 105 (20.5%) | 0 (0.0%) |
| Total | 513 (100.0%) | 68 (100.0%) |
Housing Structure by Heating Type in Salt Creek Commons
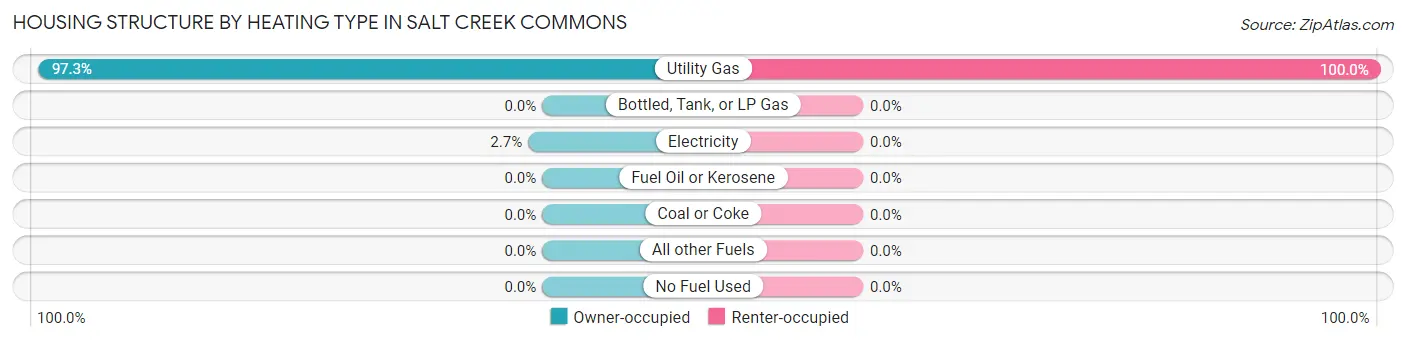
| Heating Type | Owner-occupied | Renter-occupied |
| Utility Gas | 499 (97.3%) | 68 (100.0%) |
| Bottled, Tank, or LP Gas | 0 (0.0%) | 0 (0.0%) |
| Electricity | 14 (2.7%) | 0 (0.0%) |
| Fuel Oil or Kerosene | 0 (0.0%) | 0 (0.0%) |
| Coal or Coke | 0 (0.0%) | 0 (0.0%) |
| All other Fuels | 0 (0.0%) | 0 (0.0%) |
| No Fuel Used | 0 (0.0%) | 0 (0.0%) |
| Total | 513 (100.0%) | 68 (100.0%) |
Household Vehicle Usage in Salt Creek Commons
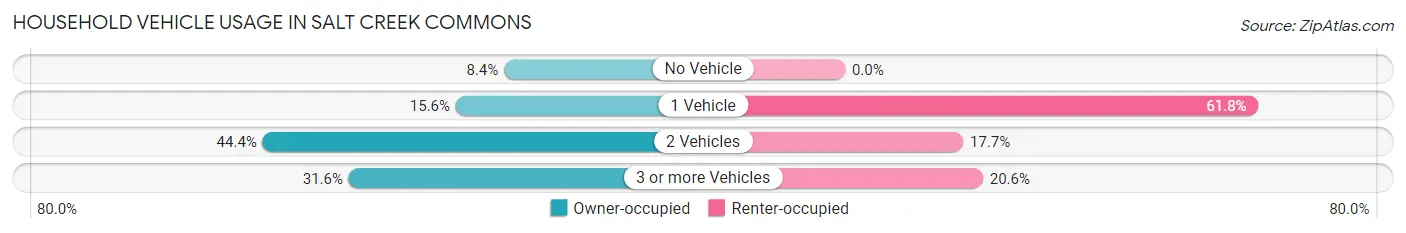
| Vehicles per Household | Owner-occupied | Renter-occupied |
| No Vehicle | 43 (8.4%) | 0 (0.0%) |
| 1 Vehicle | 80 (15.6%) | 42 (61.8%) |
| 2 Vehicles | 228 (44.4%) | 12 (17.6%) |
| 3 or more Vehicles | 162 (31.6%) | 14 (20.6%) |
| Total | 513 (100.0%) | 68 (100.0%) |
Real Estate & Mortgages in Salt Creek Commons
Real Estate and Mortgage Overview in Salt Creek Commons
| Characteristic | Without Mortgage | With Mortgage |
| Housing Units | 89 | 424 |
| Median Property Value | $179,400 | $162,400 |
| Median Household Income | $45,972 | $48 |
| Monthly Housing Costs | $448 | $0 |
| Real Estate Taxes | $850 | $2 |
Property Value by Mortgage Status in Salt Creek Commons
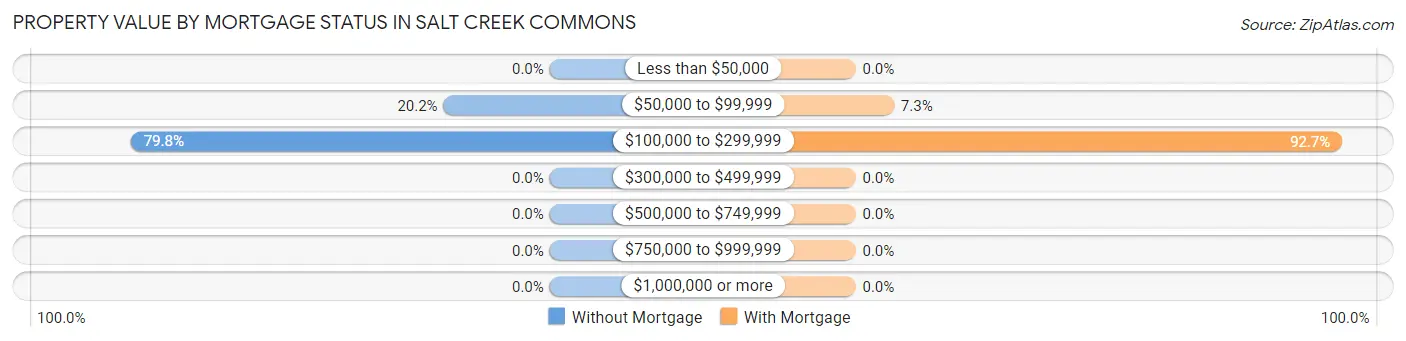
| Property Value | Without Mortgage | With Mortgage |
| Less than $50,000 | 0 (0.0%) | 0 (0.0%) |
| $50,000 to $99,999 | 18 (20.2%) | 31 (7.3%) |
| $100,000 to $299,999 | 71 (79.8%) | 393 (92.7%) |
| $300,000 to $499,999 | 0 (0.0%) | 0 (0.0%) |
| $500,000 to $749,999 | 0 (0.0%) | 0 (0.0%) |
| $750,000 to $999,999 | 0 (0.0%) | 0 (0.0%) |
| $1,000,000 or more | 0 (0.0%) | 0 (0.0%) |
| Total | 89 (100.0%) | 424 (100.0%) |
Household Income by Mortgage Status in Salt Creek Commons
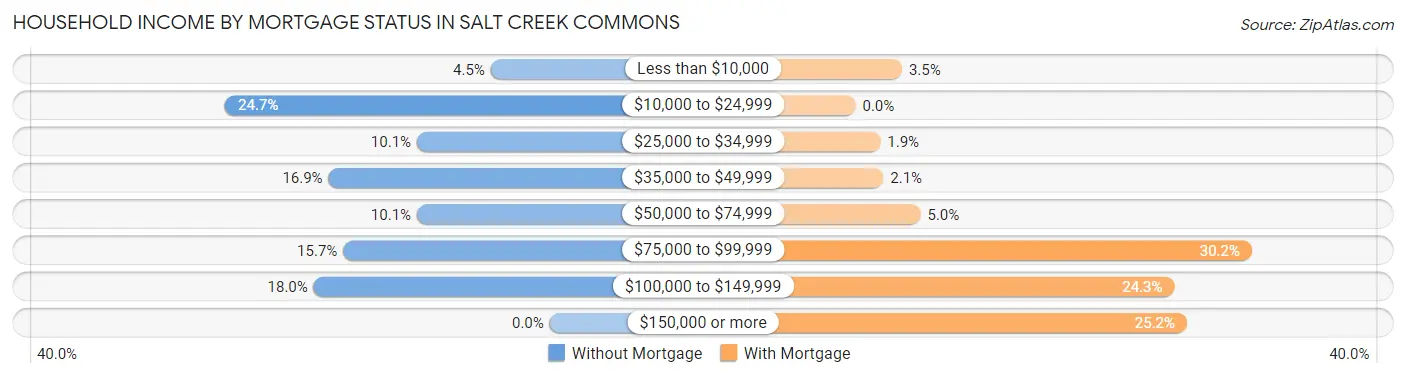
| Household Income | Without Mortgage | With Mortgage |
| Less than $10,000 | 4 (4.5%) | 15 (3.5%) |
| $10,000 to $24,999 | 22 (24.7%) | 0 (0.0%) |
| $25,000 to $34,999 | 9 (10.1%) | 8 (1.9%) |
| $35,000 to $49,999 | 15 (16.9%) | 9 (2.1%) |
| $50,000 to $74,999 | 9 (10.1%) | 21 (5.0%) |
| $75,000 to $99,999 | 14 (15.7%) | 128 (30.2%) |
| $100,000 to $149,999 | 16 (18.0%) | 103 (24.3%) |
| $150,000 or more | 0 (0.0%) | 107 (25.2%) |
| Total | 89 (100.0%) | 424 (100.0%) |
Property Value to Household Income Ratio in Salt Creek Commons
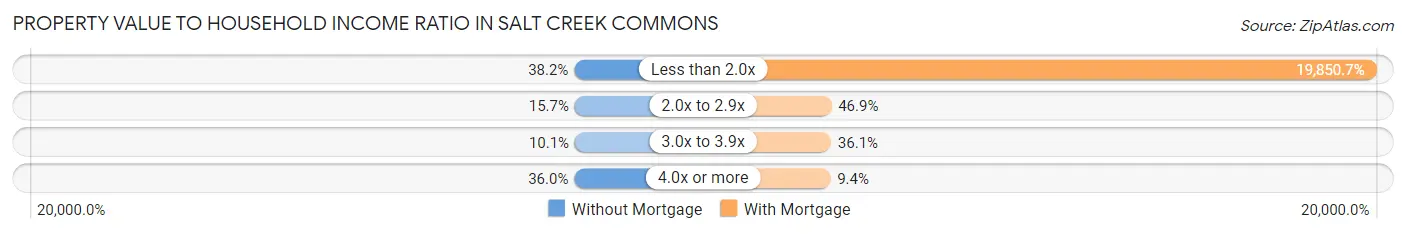
| Value-to-Income Ratio | Without Mortgage | With Mortgage |
| Less than 2.0x | 34 (38.2%) | 84,167 (19,850.7%) |
| 2.0x to 2.9x | 14 (15.7%) | 199 (46.9%) |
| 3.0x to 3.9x | 9 (10.1%) | 153 (36.1%) |
| 4.0x or more | 32 (36.0%) | 40 (9.4%) |
| Total | 89 (100.0%) | 424 (100.0%) |
Real Estate Taxes by Mortgage Status in Salt Creek Commons
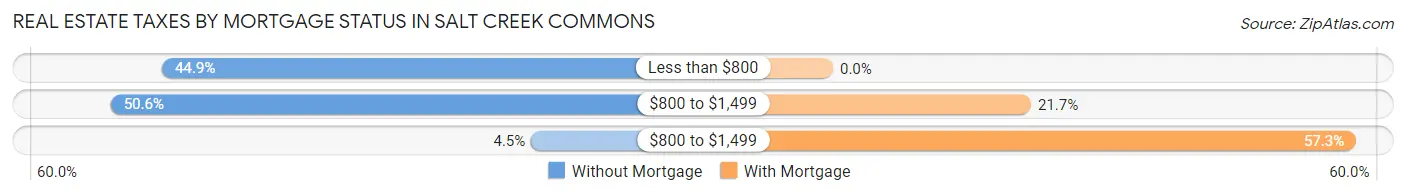
| Property Taxes | Without Mortgage | With Mortgage |
| Less than $800 | 40 (44.9%) | 0 (0.0%) |
| $800 to $1,499 | 45 (50.6%) | 92 (21.7%) |
| $800 to $1,499 | 4 (4.5%) | 243 (57.3%) |
| Total | 89 (100.0%) | 424 (100.0%) |
Health & Disability in Salt Creek Commons
Health Insurance Coverage by Age in Salt Creek Commons
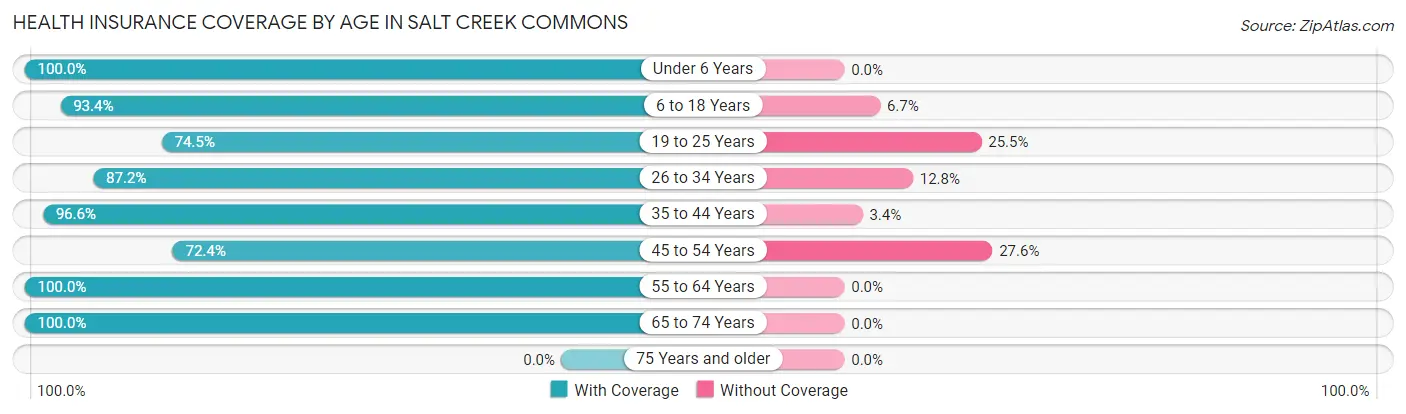
| Age Bracket | With Coverage | Without Coverage |
| Under 6 Years | 110 (100.0%) | 0 (0.0%) |
| 6 to 18 Years | 393 (93.3%) | 28 (6.7%) |
| 19 to 25 Years | 137 (74.5%) | 47 (25.5%) |
| 26 to 34 Years | 239 (87.2%) | 35 (12.8%) |
| 35 to 44 Years | 257 (96.6%) | 9 (3.4%) |
| 45 to 54 Years | 168 (72.4%) | 64 (27.6%) |
| 55 to 64 Years | 204 (100.0%) | 0 (0.0%) |
| 65 to 74 Years | 163 (100.0%) | 0 (0.0%) |
| 75 Years and older | 0 (0.0%) | 0 (0.0%) |
| Total | 1,671 (90.1%) | 183 (9.9%) |
Health Insurance Coverage by Citizenship Status in Salt Creek Commons
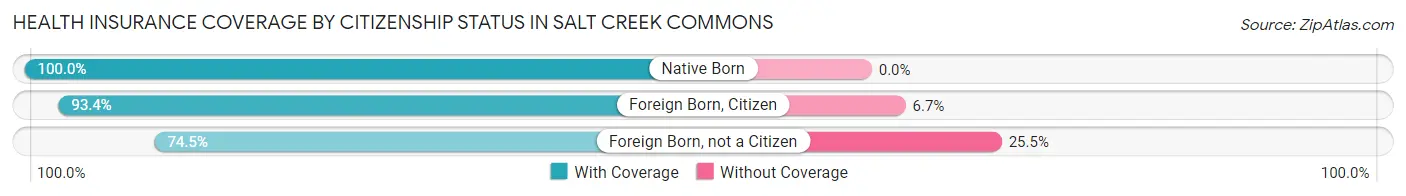
| Citizenship Status | With Coverage | Without Coverage |
| Native Born | 110 (100.0%) | 0 (0.0%) |
| Foreign Born, Citizen | 393 (93.3%) | 28 (6.7%) |
| Foreign Born, not a Citizen | 137 (74.5%) | 47 (25.5%) |
Health Insurance Coverage by Household Income in Salt Creek Commons
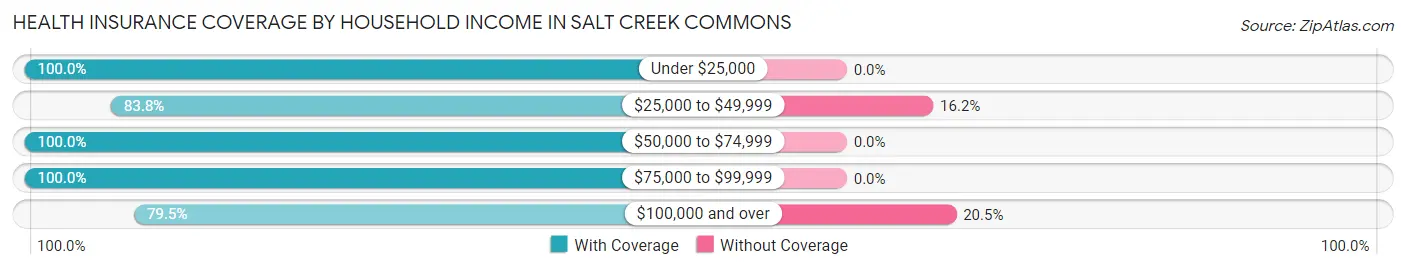
| Household Income | With Coverage | Without Coverage |
| Under $25,000 | 118 (100.0%) | 0 (0.0%) |
| $25,000 to $49,999 | 228 (83.8%) | 44 (16.2%) |
| $50,000 to $74,999 | 466 (100.0%) | 0 (0.0%) |
| $75,000 to $99,999 | 320 (100.0%) | 0 (0.0%) |
| $100,000 and over | 539 (79.5%) | 139 (20.5%) |
Public vs Private Health Insurance Coverage by Age in Salt Creek Commons
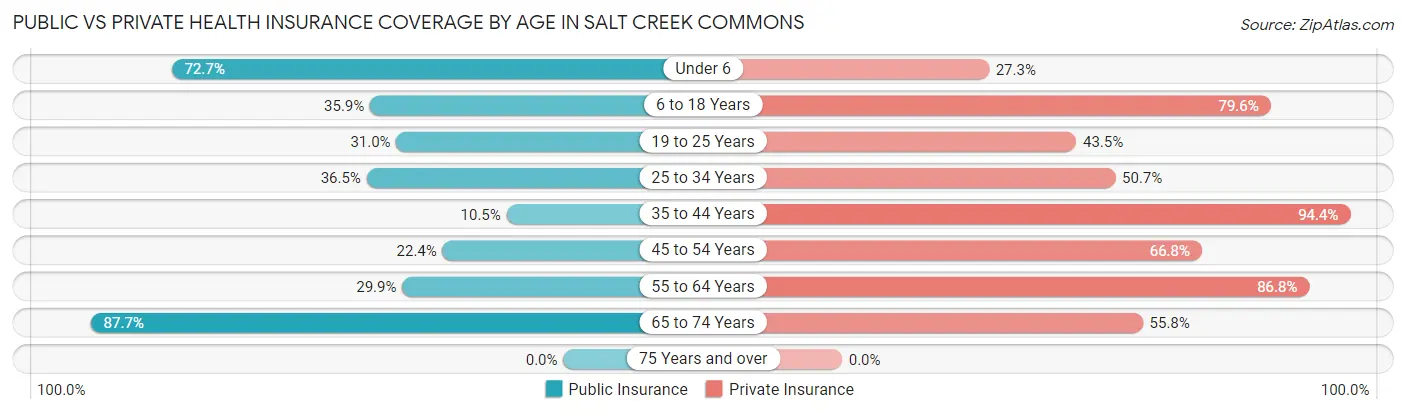
| Age Bracket | Public Insurance | Private Insurance |
| Under 6 | 80 (72.7%) | 30 (27.3%) |
| 6 to 18 Years | 151 (35.9%) | 335 (79.6%) |
| 19 to 25 Years | 57 (31.0%) | 80 (43.5%) |
| 25 to 34 Years | 100 (36.5%) | 139 (50.7%) |
| 35 to 44 Years | 28 (10.5%) | 251 (94.4%) |
| 45 to 54 Years | 52 (22.4%) | 155 (66.8%) |
| 55 to 64 Years | 61 (29.9%) | 177 (86.8%) |
| 65 to 74 Years | 143 (87.7%) | 91 (55.8%) |
| 75 Years and over | 0 (0.0%) | 0 (0.0%) |
| Total | 672 (36.2%) | 1,258 (67.8%) |
Disability Status by Sex by Age in Salt Creek Commons
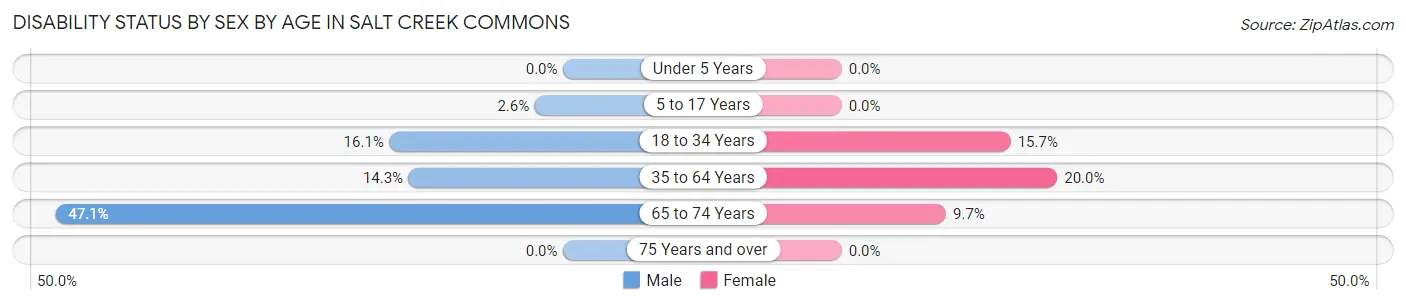
| Age Bracket | Male | Female |
| Under 5 Years | 0 (0.0%) | 0 (0.0%) |
| 5 to 17 Years | 7 (2.6%) | 0 (0.0%) |
| 18 to 34 Years | 44 (16.1%) | 29 (15.7%) |
| 35 to 64 Years | 49 (14.3%) | 72 (20.0%) |
| 65 to 74 Years | 33 (47.1%) | 9 (9.7%) |
| 75 Years and over | 0 (0.0%) | 0 (0.0%) |
Disability Class by Sex by Age in Salt Creek Commons
Disability Class: Hearing Difficulty
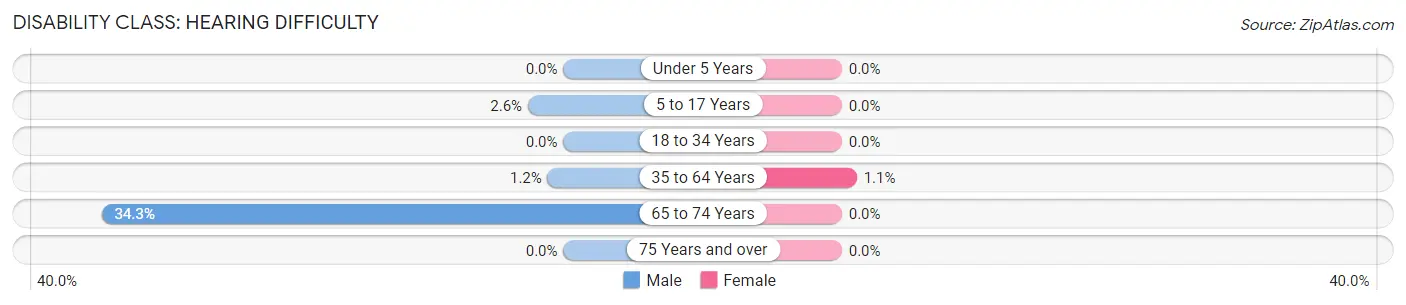
| Age Bracket | Male | Female |
| Under 5 Years | 0 (0.0%) | 0 (0.0%) |
| 5 to 17 Years | 7 (2.6%) | 0 (0.0%) |
| 18 to 34 Years | 0 (0.0%) | 0 (0.0%) |
| 35 to 64 Years | 4 (1.2%) | 4 (1.1%) |
| 65 to 74 Years | 24 (34.3%) | 0 (0.0%) |
| 75 Years and over | 0 (0.0%) | 0 (0.0%) |
Disability Class: Vision Difficulty
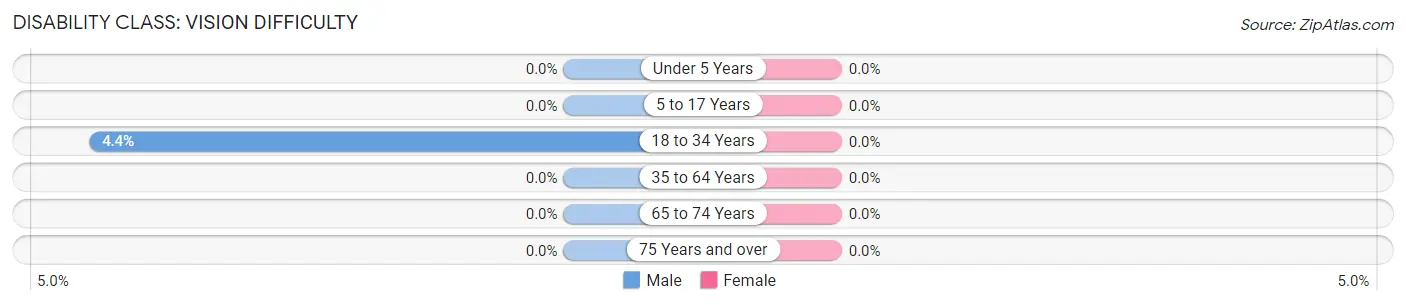
| Age Bracket | Male | Female |
| Under 5 Years | 0 (0.0%) | 0 (0.0%) |
| 5 to 17 Years | 0 (0.0%) | 0 (0.0%) |
| 18 to 34 Years | 12 (4.4%) | 0 (0.0%) |
| 35 to 64 Years | 0 (0.0%) | 0 (0.0%) |
| 65 to 74 Years | 0 (0.0%) | 0 (0.0%) |
| 75 Years and over | 0 (0.0%) | 0 (0.0%) |
Disability Class: Cognitive Difficulty
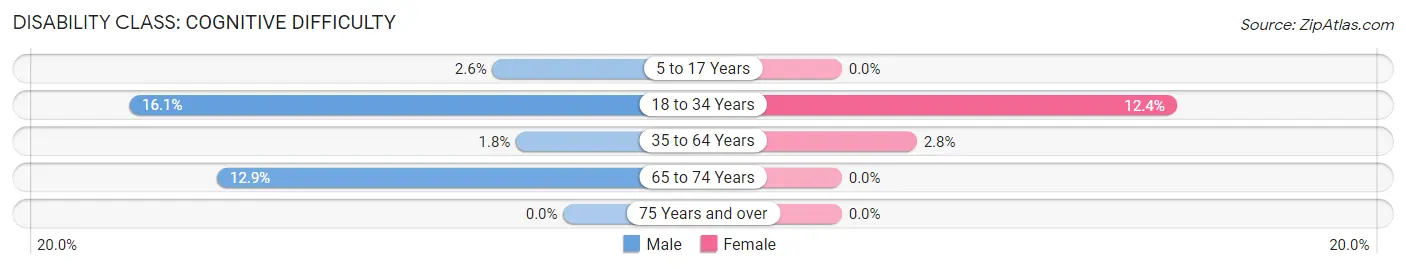
| Age Bracket | Male | Female |
| 5 to 17 Years | 7 (2.6%) | 0 (0.0%) |
| 18 to 34 Years | 44 (16.1%) | 23 (12.4%) |
| 35 to 64 Years | 6 (1.8%) | 10 (2.8%) |
| 65 to 74 Years | 9 (12.9%) | 0 (0.0%) |
| 75 Years and over | 0 (0.0%) | 0 (0.0%) |
Disability Class: Ambulatory Difficulty
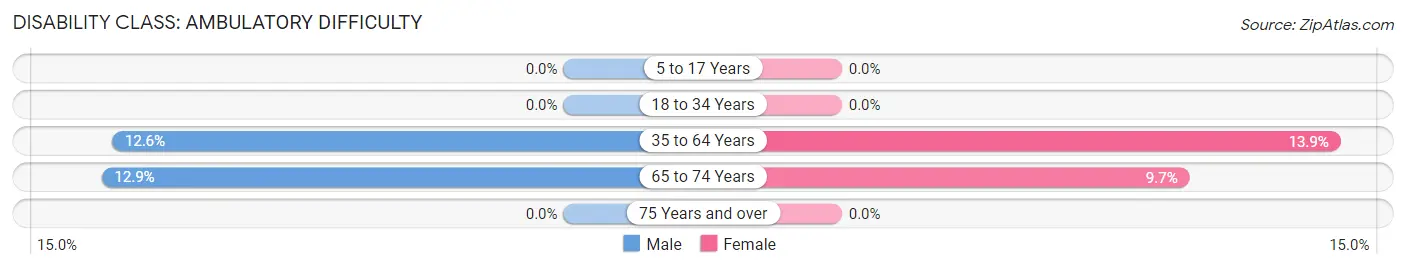
| Age Bracket | Male | Female |
| 5 to 17 Years | 0 (0.0%) | 0 (0.0%) |
| 18 to 34 Years | 0 (0.0%) | 0 (0.0%) |
| 35 to 64 Years | 43 (12.6%) | 50 (13.9%) |
| 65 to 74 Years | 9 (12.9%) | 9 (9.7%) |
| 75 Years and over | 0 (0.0%) | 0 (0.0%) |
Disability Class: Self-Care Difficulty
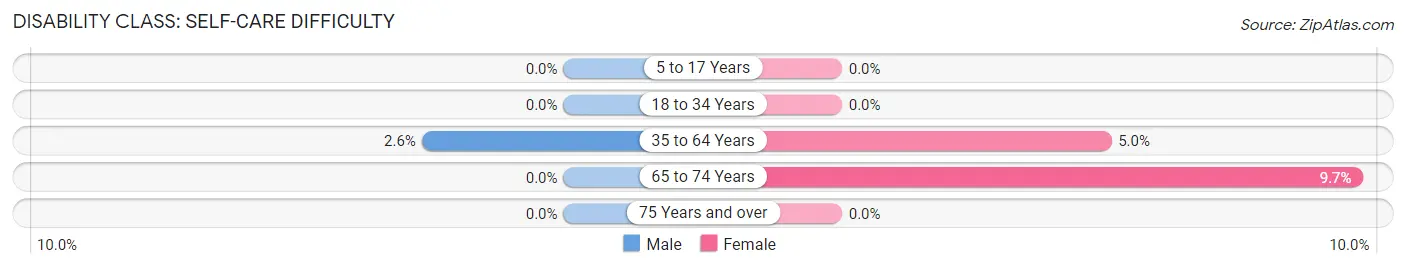
| Age Bracket | Male | Female |
| 5 to 17 Years | 0 (0.0%) | 0 (0.0%) |
| 18 to 34 Years | 0 (0.0%) | 0 (0.0%) |
| 35 to 64 Years | 9 (2.6%) | 18 (5.0%) |
| 65 to 74 Years | 0 (0.0%) | 9 (9.7%) |
| 75 Years and over | 0 (0.0%) | 0 (0.0%) |
Technology Access in Salt Creek Commons
Computing Device Access in Salt Creek Commons
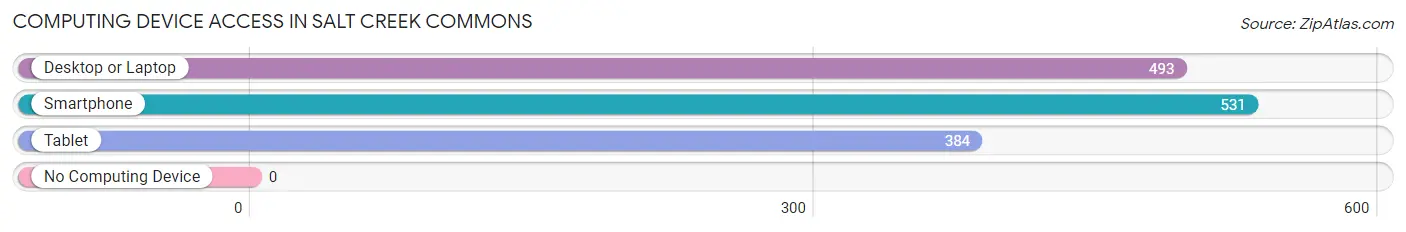
| Device Type | # Households | % Households |
| Desktop or Laptop | 493 | 84.9% |
| Smartphone | 531 | 91.4% |
| Tablet | 384 | 66.1% |
| No Computing Device | 0 | 0.0% |
| Total | 581 | 100.0% |
Internet Access in Salt Creek Commons
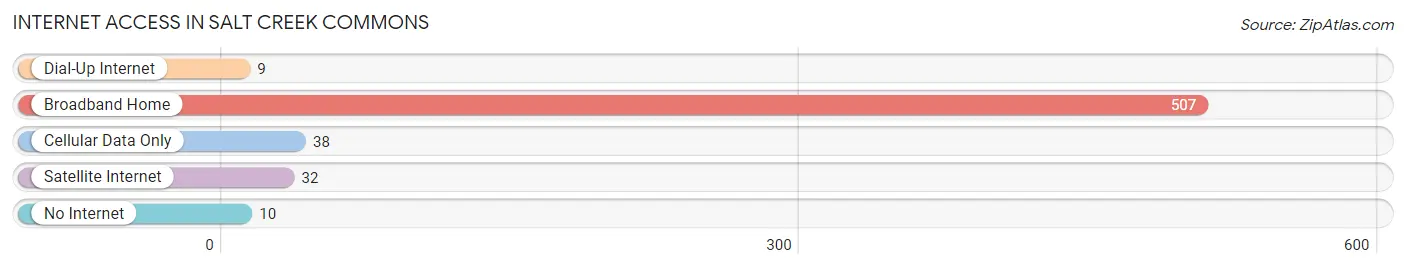
| Internet Type | # Households | % Households |
| Dial-Up Internet | 9 | 1.5% |
| Broadband Home | 507 | 87.3% |
| Cellular Data Only | 38 | 6.5% |
| Satellite Internet | 32 | 5.5% |
| No Internet | 10 | 1.7% |
| Total | 581 | 100.0% |
Salt Creek Commons Summary
History
Situated in the heart of Indiana, Salt Creek Commons is a small unincorporated community located in the southeastern part of the state. The area was first settled in the early 1800s by a group of settlers from Kentucky and Tennessee. The settlers were attracted to the area due to its abundance of natural resources, including salt springs, which gave the area its name. The area was originally part of the Miami Indian Reservation, but was later ceded to the United States government in 1818.
The area was primarily used for farming and timber production until the late 19th century, when the railroad was built through the area. This allowed for the development of the area as a small rural community. The town of Salt Creek Commons was officially established in 1891, and the first post office was opened in 1892.
Geography
Salt Creek Commons is located in the southeastern part of Indiana, in the county of Jackson. It is situated in a rural area, surrounded by rolling hills and farmland. The area is known for its abundance of natural resources, including salt springs, which gave the area its name. The area is also home to several small lakes and streams, which provide recreational opportunities for residents and visitors alike.
The climate in the area is generally mild, with hot summers and cold winters. The average annual temperature is around 50 degrees Fahrenheit, with an average annual precipitation of around 40 inches.
Economy
The economy of Salt Creek Commons is primarily based on agriculture and timber production. The area is home to several small farms, which produce a variety of crops, including corn, soybeans, wheat, and hay. The area is also home to several small businesses, including a general store, a hardware store, and a few restaurants.
The area is also home to several small manufacturing companies, which produce a variety of products, including furniture, clothing, and automotive parts. The area is also home to several small service businesses, including a gas station, a post office, and a few banks.
Demographics
As of the 2010 census, the population of Salt Creek Commons was 1,845. The population is primarily white (97.3%), with a small percentage of African Americans (1.2%) and Hispanics (1.5%). The median household income in the area is $45,000, and the median home value is $125,000. The area is served by the Jackson County School District, which includes two elementary schools, one middle school, and one high school.
Common Questions
What is the Total Population of Salt Creek Commons?
Total Population of Salt Creek Commons is 1,854.
What is the Total Male Population of Salt Creek Commons?
Total Male Population of Salt Creek Commons is 1,000.
What is the Total Female Population of Salt Creek Commons?
Total Female Population of Salt Creek Commons is 854.
What is the Ratio of Males per 100 Females in Salt Creek Commons?
There are 117.10 Males per 100 Females in Salt Creek Commons.
What is the Ratio of Females per 100 Males in Salt Creek Commons?
There are 85.40 Females per 100 Males in Salt Creek Commons.
What is the Median Population Age in Salt Creek Commons?
Median Population Age in Salt Creek Commons is 33.0 Years.
What is the Average Family Size in Salt Creek Commons
Average Family Size in Salt Creek Commons is 3.5 People.
What is the Average Household Size in Salt Creek Commons
Average Household Size in Salt Creek Commons is 3.2 People.
What is Per Capita Income in Salt Creek Commons?
Per Capita income in Salt Creek Commons is $26,735.
What is the Median Family Income in Salt Creek Commons?
Median Family Income in Salt Creek Commons is $82,361.
What is the Median Household income in Salt Creek Commons?
Median Household Income in Salt Creek Commons is $78,155.
What is Income or Wage Gap in Salt Creek Commons?
Income or Wage Gap in Salt Creek Commons is 53.1%.
Women in Salt Creek Commons earn 46.9 cents for every dollar earned by a man.
What is Inequality or Gini Index in Salt Creek Commons?
Inequality or Gini Index in Salt Creek Commons is 0.31.
How Large is the Labor Force in Salt Creek Commons?
There are 847 People in the Labor Forcein in Salt Creek Commons.
What is the Percentage of People in the Labor Force in Salt Creek Commons?
60.9% of People are in the Labor Force in Salt Creek Commons.
What is the Unemployment Rate in Salt Creek Commons?
Unemployment Rate in Salt Creek Commons is 2.7%.