Dawson, GA
Dawson Map
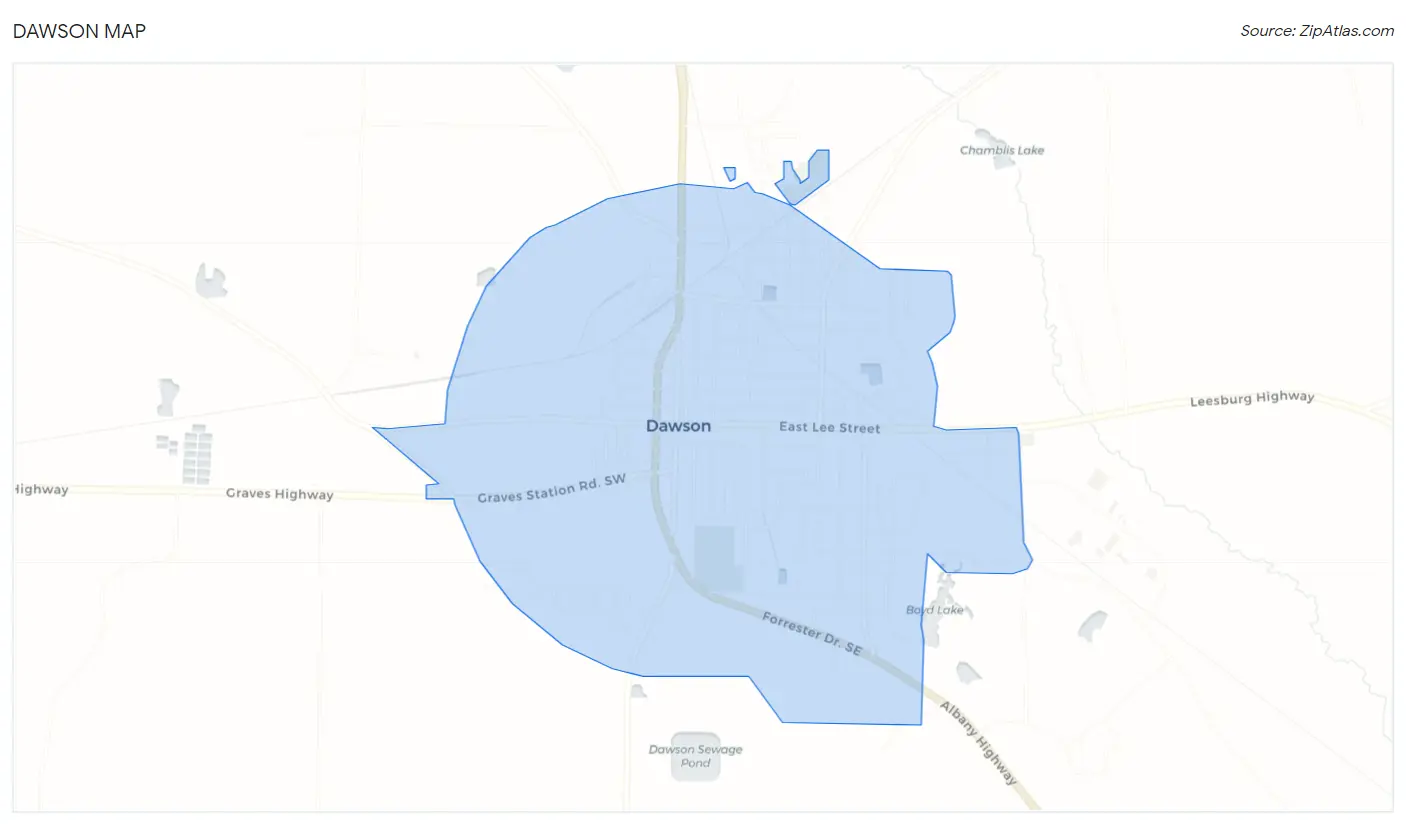
Dawson Overview
4,342
TOTAL POPULATION
2,156
MALE POPULATION
2,186
FEMALE POPULATION
98.63
MALES / 100 FEMALES
101.39
FEMALES / 100 MALES
33.4
MEDIAN AGE
3.7
AVG FAMILY SIZE
2.8
AVG HOUSEHOLD SIZE
$16,957
PER CAPITA INCOME
$34,394
AVG FAMILY INCOME
$31,310
AVG HOUSEHOLD INCOME
3.1%
WAGE / INCOME GAP [ % ]
96.9¢/ $1
WAGE / INCOME GAP [ $ ]
0.50
INEQUALITY / GINI INDEX
1,532
LABOR FORCE [ PEOPLE ]
48.3%
PERCENT IN LABOR FORCE
13.6%
UNEMPLOYMENT RATE
Dawson Zip Codes
Dawson Area Codes
Race in Dawson
The most populous races in Dawson are Black / African American (3,571 | 82.2%), White / Caucasian (662 | 15.2%), and Asian (106 | 2.4%).
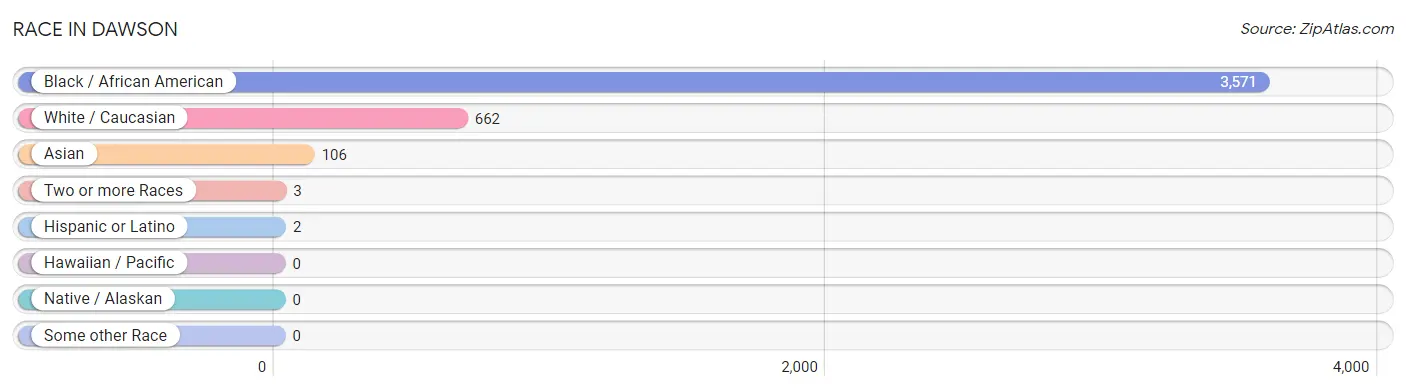
| Race | # Population | % Population |
| Asian | 106 | 2.4% |
| Black / African American | 3,571 | 82.2% |
| Hawaiian / Pacific | 0 | 0.0% |
| Hispanic or Latino | 2 | 0.1% |
| Native / Alaskan | 0 | 0.0% |
| White / Caucasian | 662 | 15.2% |
| Two or more Races | 3 | 0.1% |
| Some other Race | 0 | 0.0% |
| Total | 4,342 | 100.0% |
Ancestry in Dawson
The most populous ancestries reported in Dawson are American (179 | 4.1%), Scotch-Irish (107 | 2.5%), Indian (Asian) (106 | 2.4%), English (52 | 1.2%), and German (41 | 0.9%), together accounting for 11.2% of all Dawson residents.
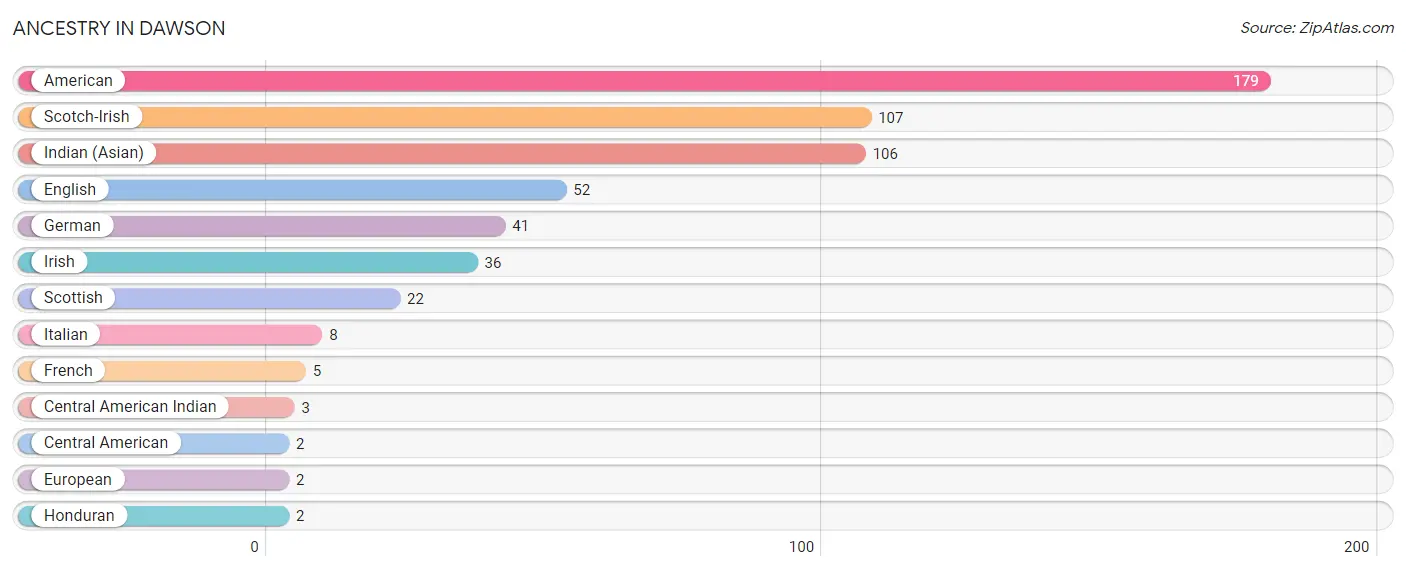
| Ancestry | # Population | % Population |
| American | 179 | 4.1% |
| Central American | 2 | 0.1% |
| Central American Indian | 3 | 0.1% |
| English | 52 | 1.2% |
| European | 2 | 0.1% |
| French | 5 | 0.1% |
| German | 41 | 0.9% |
| Honduran | 2 | 0.1% |
| Indian (Asian) | 106 | 2.4% |
| Irish | 36 | 0.8% |
| Italian | 8 | 0.2% |
| Scotch-Irish | 107 | 2.5% |
| Scottish | 22 | 0.5% | View All 13 Rows |
Immigrants in Dawson
The most numerous immigrant groups reported in Dawson came from Asia (52 | 1.2%), China (52 | 1.2%), Eastern Asia (52 | 1.2%), Central America (2 | 0.1%), and Honduras (2 | 0.1%), together accounting for 3.7% of all Dawson residents.
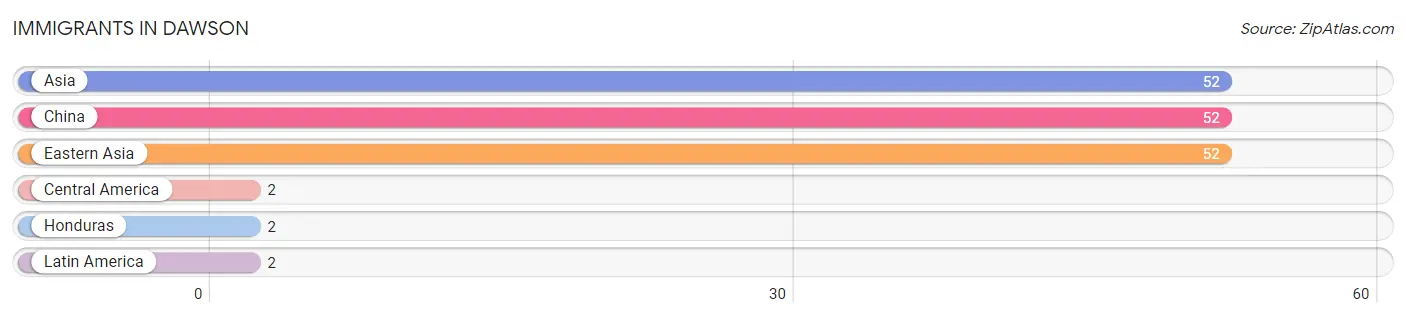
| Immigration Origin | # Population | % Population |
| Asia | 52 | 1.2% |
| Central America | 2 | 0.1% |
| China | 52 | 1.2% |
| Eastern Asia | 52 | 1.2% |
| Honduras | 2 | 0.1% |
| Latin America | 2 | 0.1% | View All 6 Rows |
Sex and Age in Dawson
Sex and Age in Dawson
The most populous age groups in Dawson are Under 5 Years (263 | 12.2%) for men and 5 to 9 Years (210 | 9.6%) for women.
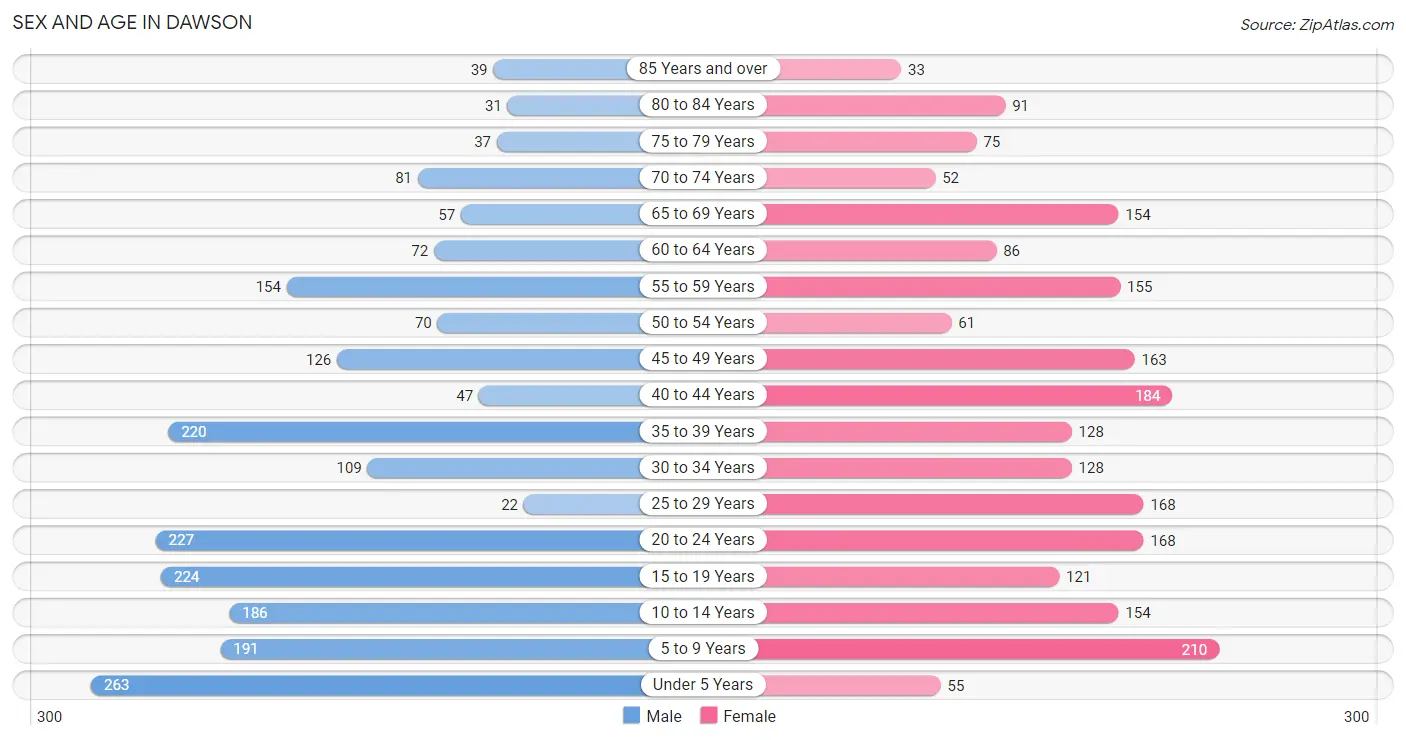
| Age Bracket | Male | Female |
| Under 5 Years | 263 (12.2%) | 55 (2.5%) |
| 5 to 9 Years | 191 (8.9%) | 210 (9.6%) |
| 10 to 14 Years | 186 (8.6%) | 154 (7.0%) |
| 15 to 19 Years | 224 (10.4%) | 121 (5.5%) |
| 20 to 24 Years | 227 (10.5%) | 168 (7.7%) |
| 25 to 29 Years | 22 (1.0%) | 168 (7.7%) |
| 30 to 34 Years | 109 (5.1%) | 128 (5.9%) |
| 35 to 39 Years | 220 (10.2%) | 128 (5.9%) |
| 40 to 44 Years | 47 (2.2%) | 184 (8.4%) |
| 45 to 49 Years | 126 (5.8%) | 163 (7.5%) |
| 50 to 54 Years | 70 (3.3%) | 61 (2.8%) |
| 55 to 59 Years | 154 (7.1%) | 155 (7.1%) |
| 60 to 64 Years | 72 (3.3%) | 86 (3.9%) |
| 65 to 69 Years | 57 (2.6%) | 154 (7.0%) |
| 70 to 74 Years | 81 (3.8%) | 52 (2.4%) |
| 75 to 79 Years | 37 (1.7%) | 75 (3.4%) |
| 80 to 84 Years | 31 (1.4%) | 91 (4.2%) |
| 85 Years and over | 39 (1.8%) | 33 (1.5%) |
| Total | 2,156 (100.0%) | 2,186 (100.0%) |
Families and Households in Dawson
Median Family Size in Dawson
The median family size in Dawson is 3.69 persons per family, with married-couple families (380 | 38.9%) accounting for the largest median family size of 4.05 persons per family. On the other hand, single male/father families (95 | 9.7%) represent the smallest median family size with 2.59 persons per family.
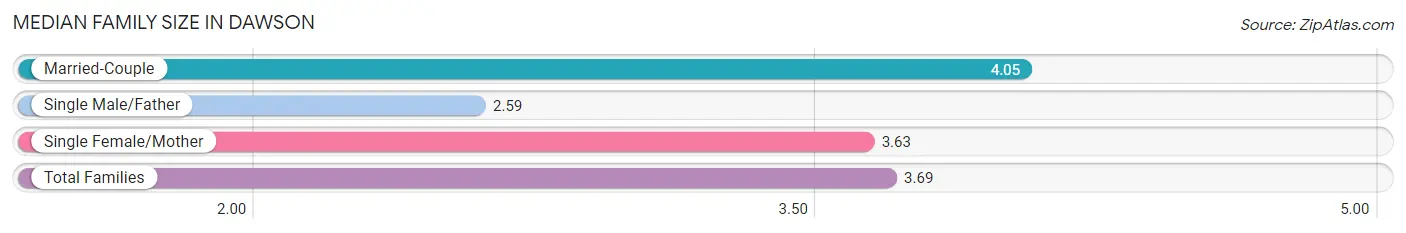
| Family Type | # Families | Family Size |
| Married-Couple | 380 (38.9%) | 4.05 |
| Single Male/Father | 95 (9.7%) | 2.59 |
| Single Female/Mother | 503 (51.4%) | 3.63 |
| Total Families | 978 (100.0%) | 3.69 |
Median Household Size in Dawson
The median household size in Dawson is 2.81 persons per household, with married-couple households (380 | 25.1%) accounting for the largest median household size of 4.05 persons per household. non-family households (538 | 35.5%) represent the smallest median household size with 1.08 persons per household.
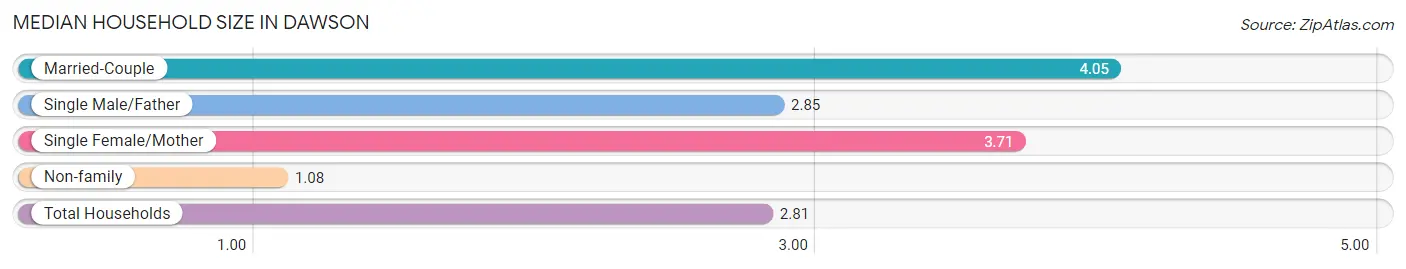
| Household Type | # Households | Household Size |
| Married-Couple | 380 (25.1%) | 4.05 |
| Single Male/Father | 95 (6.3%) | 2.85 |
| Single Female/Mother | 503 (33.2%) | 3.71 |
| Non-family | 538 (35.5%) | 1.08 |
| Total Households | 1,516 (100.0%) | 2.81 |
Household Size by Marriage Status in Dawson
Out of a total of 1,516 households in Dawson, 978 (64.5%) are family households, while 538 (35.5%) are nonfamily households. The most numerous type of family households are 2-person households, comprising 371, and the most common type of nonfamily households are 1-person households, comprising 501.
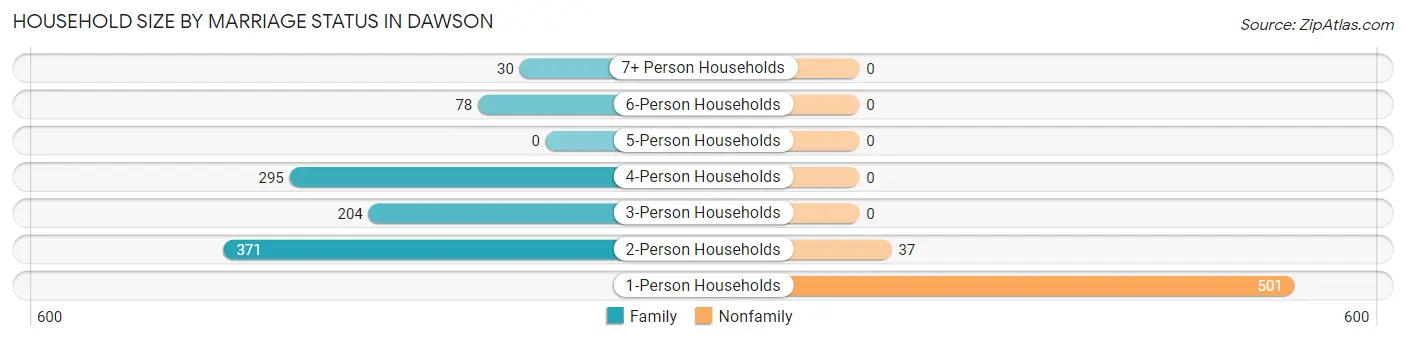
| Household Size | Family Households | Nonfamily Households |
| 1-Person Households | - | 501 (33.1%) |
| 2-Person Households | 371 (24.5%) | 37 (2.4%) |
| 3-Person Households | 204 (13.5%) | 0 (0.0%) |
| 4-Person Households | 295 (19.5%) | 0 (0.0%) |
| 5-Person Households | 0 (0.0%) | 0 (0.0%) |
| 6-Person Households | 78 (5.1%) | 0 (0.0%) |
| 7+ Person Households | 30 (2.0%) | 0 (0.0%) |
| Total | 978 (64.5%) | 538 (35.5%) |
Female Fertility in Dawson
Fertility by Age in Dawson
Average fertility rate in Dawson is 107.0 births per 1,000 women. Women in the age bracket of 35 to 50 years have the highest fertility rate with 133.0 births per 1,000 women. Women in the age bracket of 35 to 50 years acount for 55.7% of all women with births.
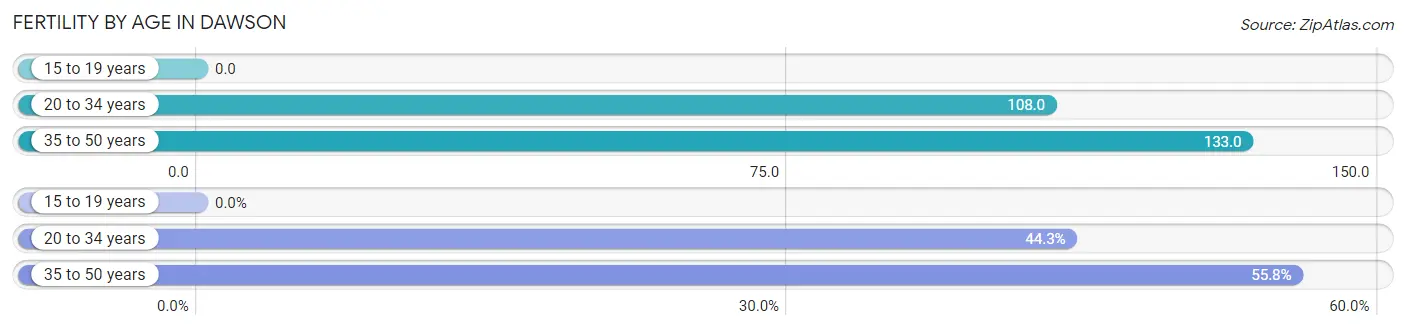
| Age Bracket | Women with Births | Births / 1,000 Women |
| 15 to 19 years | 0 (0.0%) | 0.0 |
| 20 to 34 years | 50 (44.3%) | 108.0 |
| 35 to 50 years | 63 (55.7%) | 133.0 |
| Total | 113 (100.0%) | 107.0 |
Fertility by Age by Marriage Status in Dawson
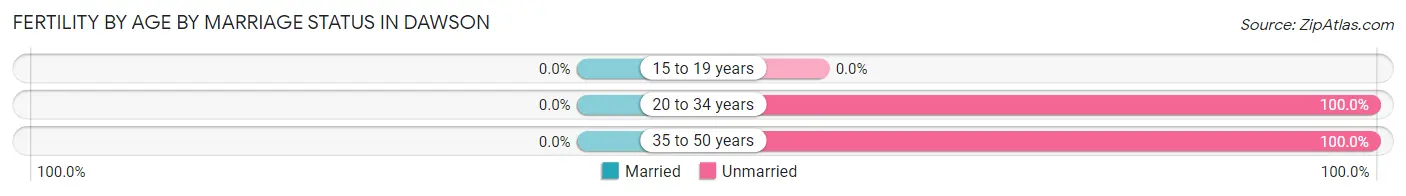
| Age Bracket | Married | Unmarried |
| 15 to 19 years | 0 (0.0%) | 0 (0.0%) |
| 20 to 34 years | 0 (0.0%) | 50 (100.0%) |
| 35 to 50 years | 0 (0.0%) | 63 (100.0%) |
| Total | 0 (0.0%) | 113 (100.0%) |
Fertility by Education in Dawson
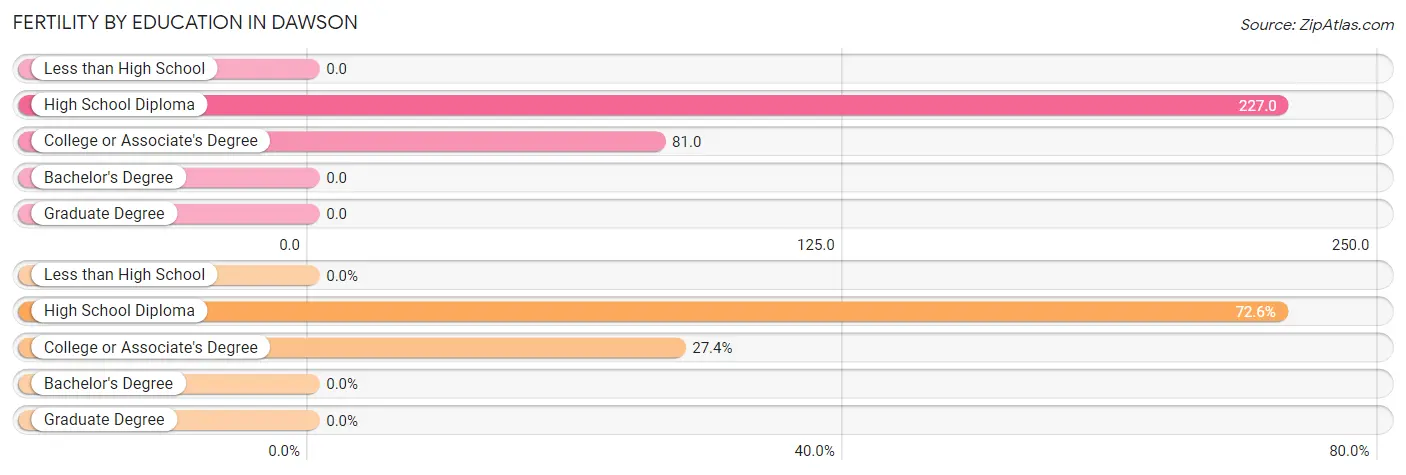
| Educational Attainment | Women with Births | Births / 1,000 Women |
| Less than High School | 0 (0.0%) | 0.0 |
| High School Diploma | 82 (72.6%) | 227.0 |
| College or Associate's Degree | 31 (27.4%) | 81.0 |
| Bachelor's Degree | 0 (0.0%) | 0.0 |
| Graduate Degree | 0 (0.0%) | 0.0 |
| Total | 113 (100.0%) | 107.0 |
Fertility by Education by Marriage Status in Dawson
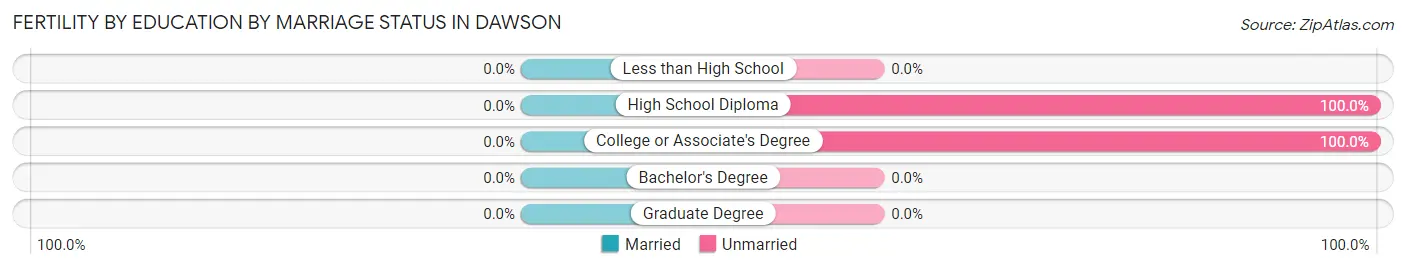
| Educational Attainment | Married | Unmarried |
| Less than High School | 0 (0.0%) | 0 (0.0%) |
| High School Diploma | 0 (0.0%) | 82 (100.0%) |
| College or Associate's Degree | 0 (0.0%) | 31 (100.0%) |
| Bachelor's Degree | 0 (0.0%) | 0 (0.0%) |
| Graduate Degree | 0 (0.0%) | 0 (0.0%) |
| Total | 0 (0.0%) | 113 (100.0%) |
Income in Dawson
Income Overview in Dawson
Per Capita Income in Dawson is $16,957, while median incomes of families and households are $34,394 and $31,310 respectively.
| Characteristic | Number | Measure |
| Per Capita Income | 4,342 | $16,957 |
| Median Family Income | 978 | $34,394 |
| Mean Family Income | 978 | $51,608 |
| Median Household Income | 1,516 | $31,310 |
| Mean Household Income | 1,516 | $44,473 |
| Income Deficit | 978 | $0 |
| Wage / Income Gap (%) | 4,342 | 3.08% |
| Wage / Income Gap ($) | 4,342 | 96.92¢ per $1 |
| Gini / Inequality Index | 4,342 | 0.50 |
Earnings by Sex in Dawson
Average Earnings in Dawson are $24,405, $24,769 for men and $24,005 for women, a difference of 3.1%.
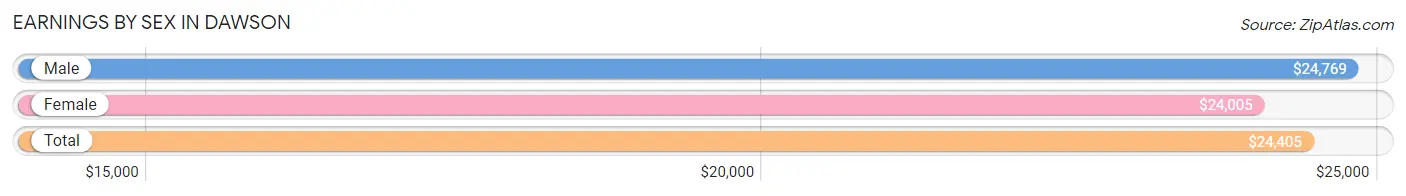
| Sex | Number | Average Earnings |
| Male | 792 (43.3%) | $24,769 |
| Female | 1,039 (56.7%) | $24,005 |
| Total | 1,831 (100.0%) | $24,405 |
Earnings by Sex by Income Bracket in Dawson
The most common earnings brackets in Dawson are $5,000 to $7,499 for men (167 | 21.1%) and $2,500 to $4,999 for women (143 | 13.8%).
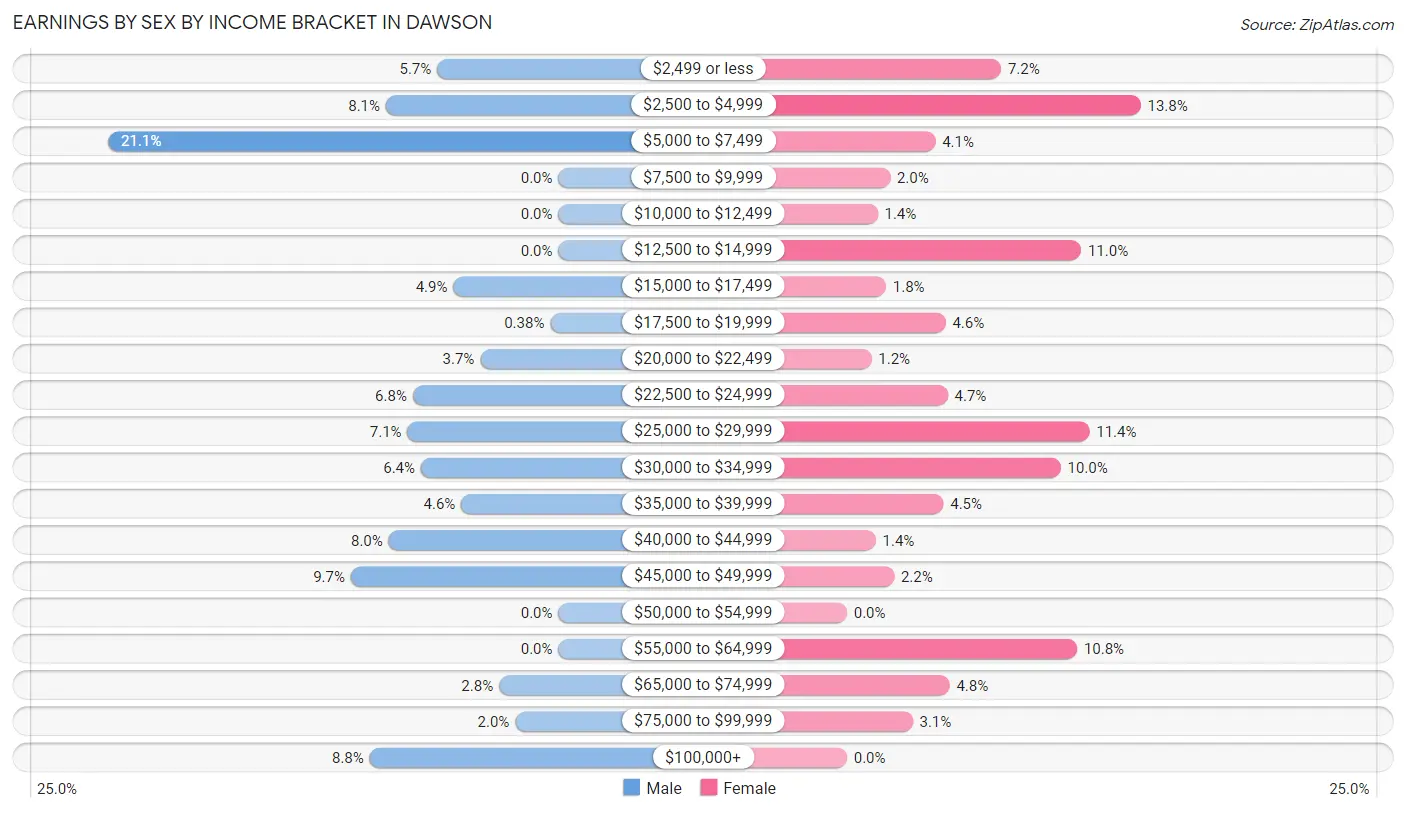
| Income | Male | Female |
| $2,499 or less | 45 (5.7%) | 75 (7.2%) |
| $2,500 to $4,999 | 64 (8.1%) | 143 (13.8%) |
| $5,000 to $7,499 | 167 (21.1%) | 43 (4.1%) |
| $7,500 to $9,999 | 0 (0.0%) | 21 (2.0%) |
| $10,000 to $12,499 | 0 (0.0%) | 15 (1.4%) |
| $12,500 to $14,999 | 0 (0.0%) | 114 (11.0%) |
| $15,000 to $17,499 | 39 (4.9%) | 19 (1.8%) |
| $17,500 to $19,999 | 3 (0.4%) | 48 (4.6%) |
| $20,000 to $22,499 | 29 (3.7%) | 12 (1.1%) |
| $22,500 to $24,999 | 54 (6.8%) | 49 (4.7%) |
| $25,000 to $29,999 | 56 (7.1%) | 118 (11.4%) |
| $30,000 to $34,999 | 51 (6.4%) | 104 (10.0%) |
| $35,000 to $39,999 | 36 (4.5%) | 47 (4.5%) |
| $40,000 to $44,999 | 63 (8.0%) | 14 (1.3%) |
| $45,000 to $49,999 | 77 (9.7%) | 23 (2.2%) |
| $50,000 to $54,999 | 0 (0.0%) | 0 (0.0%) |
| $55,000 to $64,999 | 0 (0.0%) | 112 (10.8%) |
| $65,000 to $74,999 | 22 (2.8%) | 50 (4.8%) |
| $75,000 to $99,999 | 16 (2.0%) | 32 (3.1%) |
| $100,000+ | 70 (8.8%) | 0 (0.0%) |
| Total | 792 (100.0%) | 1,039 (100.0%) |
Earnings by Sex by Educational Attainment in Dawson
Average earnings in Dawson are $30,917 for men and $28,796 for women, a difference of 6.9%. Men with an educational attainment of college or associate's degree enjoy the highest average annual earnings of $39,028, while those with less than high school education earn the least with $17,404. Women with an educational attainment of bachelor's degree earn the most with the average annual earnings of $60,365, while those with college or associate's degree education have the smallest earnings of $24,566.
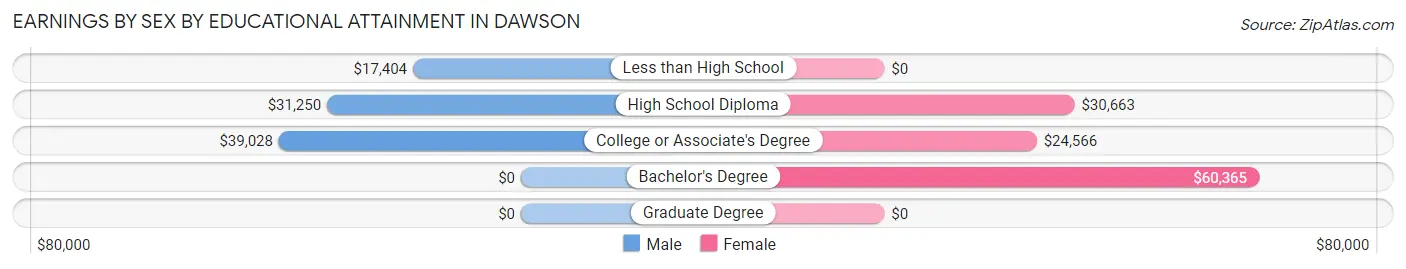
| Educational Attainment | Male Income | Female Income |
| Less than High School | $17,404 | $0 |
| High School Diploma | $31,250 | $30,663 |
| College or Associate's Degree | $39,028 | $24,566 |
| Bachelor's Degree | - | - |
| Graduate Degree | - | - |
| Total | $30,917 | $28,796 |
Family Income in Dawson
Family Income Brackets in Dawson
According to the Dawson family income data, there are 164 families falling into the $15,000 to $24,999 income range, which is the most common income bracket and makes up 16.8% of all families. Conversely, the $200,000+ income bracket is the least frequent group with only 6 families (0.6%) belonging to this category.
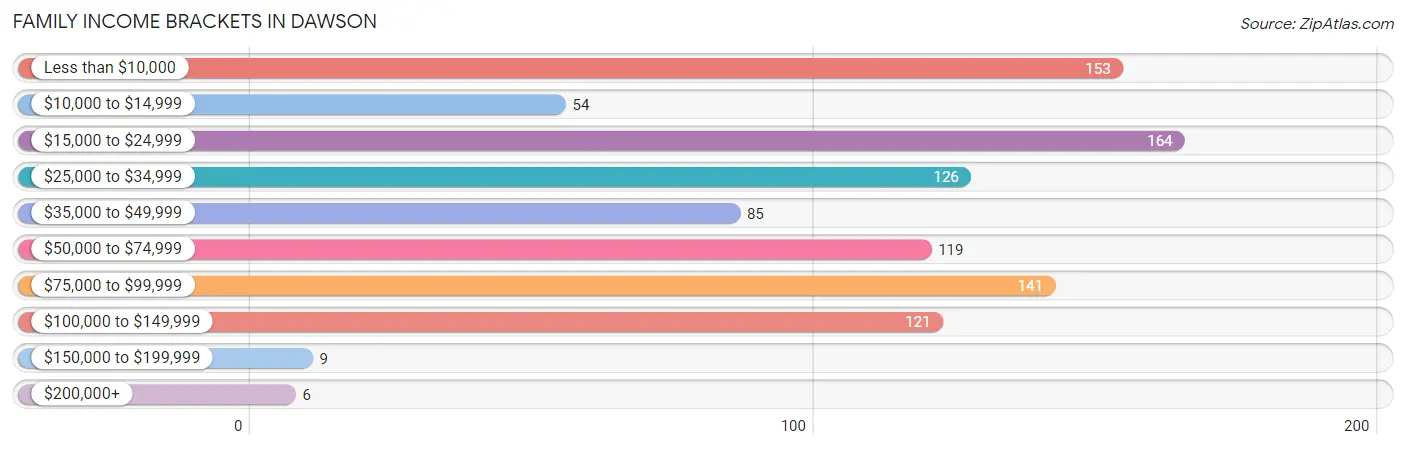
| Income Bracket | # Families | % Families |
| Less than $10,000 | 153 | 15.6% |
| $10,000 to $14,999 | 54 | 5.5% |
| $15,000 to $24,999 | 164 | 16.8% |
| $25,000 to $34,999 | 126 | 12.9% |
| $35,000 to $49,999 | 85 | 8.7% |
| $50,000 to $74,999 | 119 | 12.2% |
| $75,000 to $99,999 | 141 | 14.4% |
| $100,000 to $149,999 | 121 | 12.4% |
| $150,000 to $199,999 | 9 | 0.9% |
| $200,000+ | 6 | 0.6% |
Family Income by Famaliy Size in Dawson
2-person families (414 | 42.3%) account for the highest median family income in Dawson with $49,375 per family, while 2-person families (414 | 42.3%) have the highest median income of $24,688 per family member.
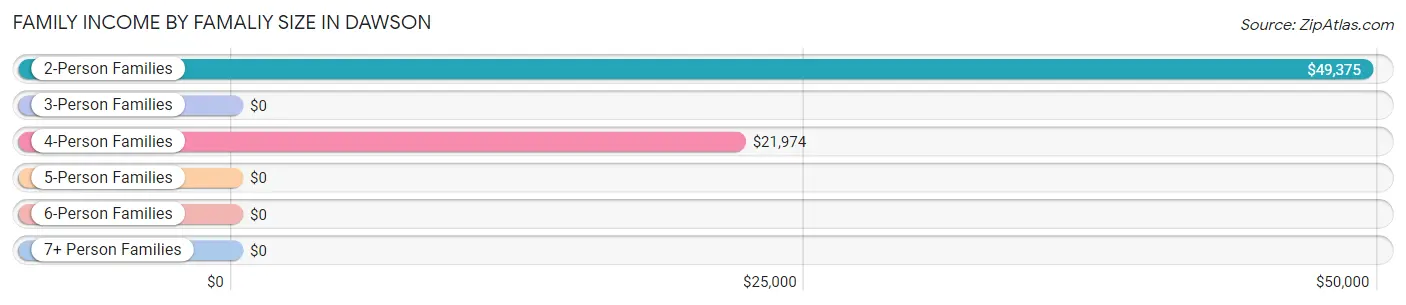
| Income Bracket | # Families | Median Income |
| 2-Person Families | 414 (42.3%) | $49,375 |
| 3-Person Families | 192 (19.6%) | $0 |
| 4-Person Families | 264 (27.0%) | $21,974 |
| 5-Person Families | 0 (0.0%) | $0 |
| 6-Person Families | 78 (8.0%) | $0 |
| 7+ Person Families | 30 (3.1%) | $0 |
| Total | 978 (100.0%) | $34,394 |
Family Income by Number of Earners in Dawson
The median family income in Dawson is $34,394, with families comprising 3+ earners (128) having the highest median family income of $115,729, while families with no earners (257) have the lowest median family income of $15,903, accounting for 13.1% and 26.3% of families, respectively.
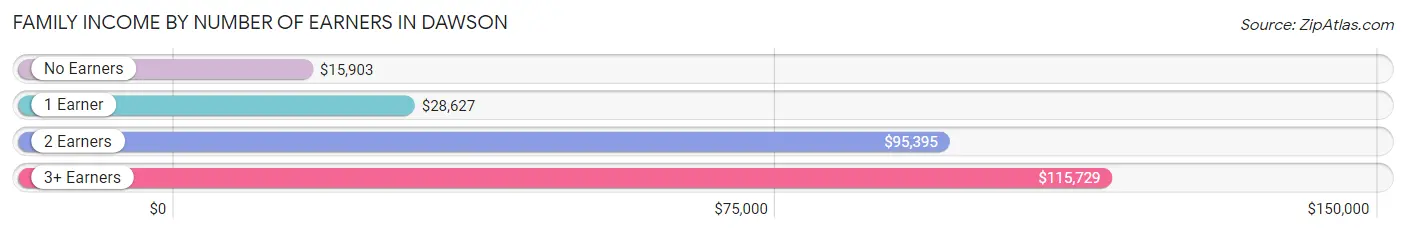
| Number of Earners | # Families | Median Income |
| No Earners | 257 (26.3%) | $15,903 |
| 1 Earner | 385 (39.4%) | $28,627 |
| 2 Earners | 208 (21.3%) | $95,395 |
| 3+ Earners | 128 (13.1%) | $115,729 |
| Total | 978 (100.0%) | $34,394 |
Household Income in Dawson
Household Income Brackets in Dawson
With 318 households falling in the category, the less than $10,000 income range is the most frequent in Dawson, accounting for 21.0% of all households. In contrast, only 6 households (0.4%) fall into the $200,000+ income bracket, making it the least populous group.
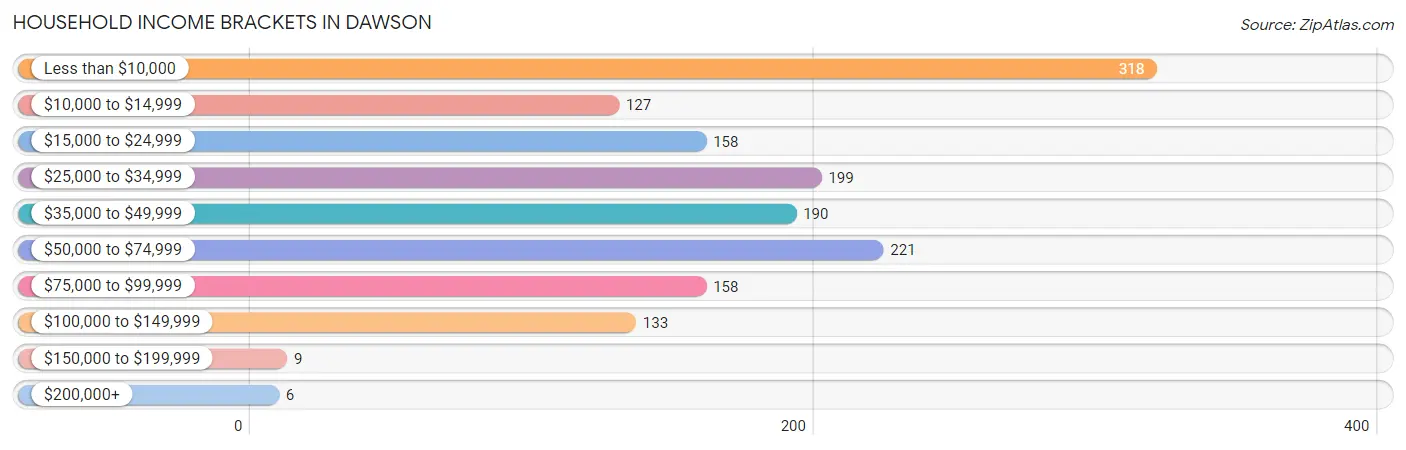
| Income Bracket | # Households | % Households |
| Less than $10,000 | 318 | 21.0% |
| $10,000 to $14,999 | 127 | 8.4% |
| $15,000 to $24,999 | 158 | 10.4% |
| $25,000 to $34,999 | 199 | 13.1% |
| $35,000 to $49,999 | 190 | 12.5% |
| $50,000 to $74,999 | 221 | 14.6% |
| $75,000 to $99,999 | 158 | 10.4% |
| $100,000 to $149,999 | 133 | 8.8% |
| $150,000 to $199,999 | 9 | 0.6% |
| $200,000+ | 6 | 0.4% |
Household Income by Householder Age in Dawson
The median household income in Dawson is $31,310, with the highest median household income of $35,216 found in the 45 to 64 years age bracket for the primary householder. A total of 562 households (37.1%) fall into this category.
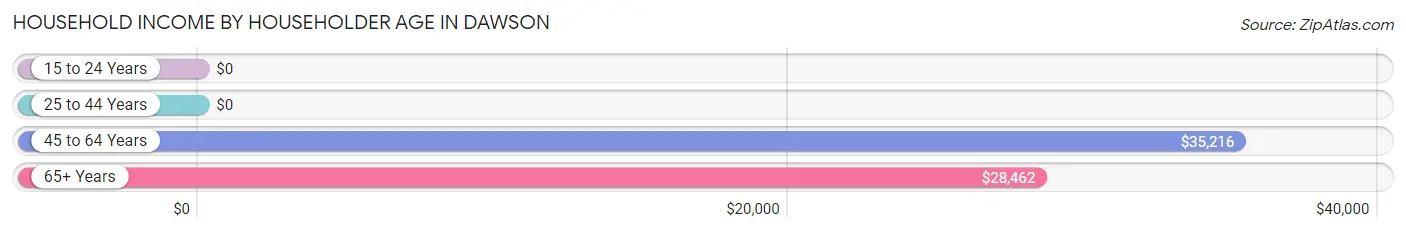
| Income Bracket | # Households | Median Income |
| 15 to 24 Years | 0 (0.0%) | $0 |
| 25 to 44 Years | 518 (34.2%) | $0 |
| 45 to 64 Years | 562 (37.1%) | $35,216 |
| 65+ Years | 436 (28.8%) | $28,462 |
| Total | 1,516 (100.0%) | $31,310 |
Poverty in Dawson
Income Below Poverty by Sex and Age in Dawson
With 48.9% poverty level for males and 45.2% for females among the residents of Dawson, 5 year old males and under 5 year old females are the most vulnerable to poverty, with 38 males (100.0%) and 55 females (100.0%) in their respective age groups living below the poverty level.
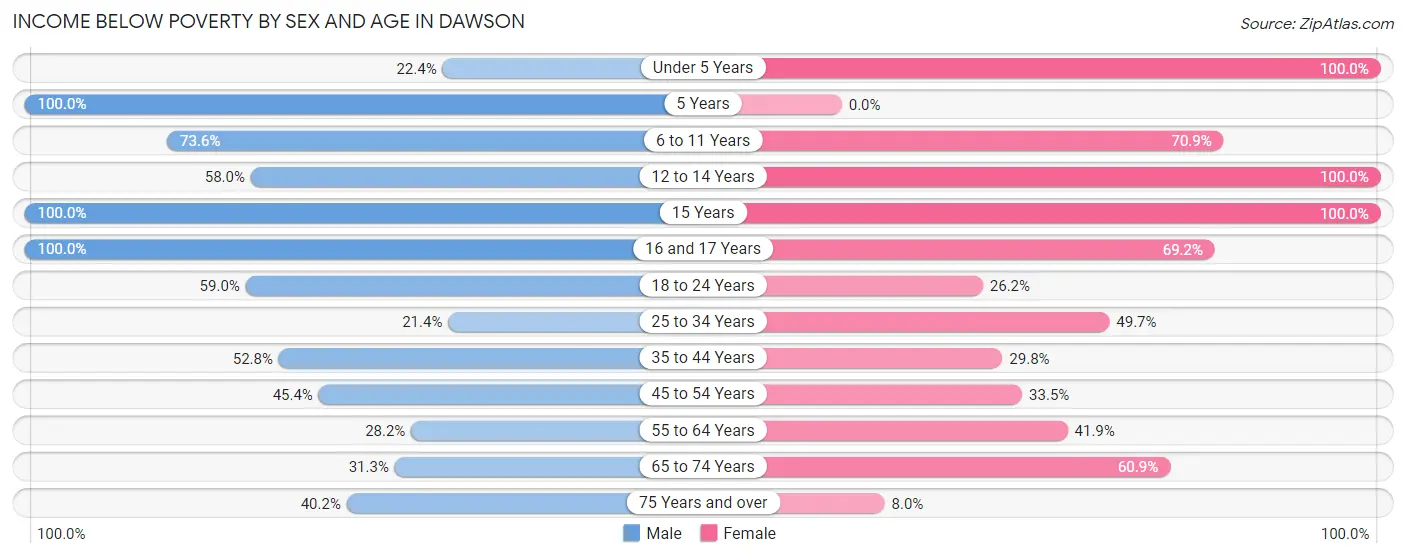
| Age Bracket | Male | Female |
| Under 5 Years | 59 (22.4%) | 55 (100.0%) |
| 5 Years | 38 (100.0%) | 0 (0.0%) |
| 6 to 11 Years | 153 (73.6%) | 209 (70.9%) |
| 12 to 14 Years | 76 (58.0%) | 45 (100.0%) |
| 15 Years | 95 (100.0%) | 17 (100.0%) |
| 16 and 17 Years | 27 (100.0%) | 27 (69.2%) |
| 18 to 24 Years | 194 (59.0%) | 61 (26.2%) |
| 25 to 34 Years | 28 (21.4%) | 147 (49.7%) |
| 35 to 44 Years | 141 (52.8%) | 93 (29.8%) |
| 45 to 54 Years | 89 (45.4%) | 75 (33.5%) |
| 55 to 64 Years | 61 (28.2%) | 101 (41.9%) |
| 65 to 74 Years | 41 (31.3%) | 120 (60.9%) |
| 75 Years and over | 39 (40.2%) | 12 (8.0%) |
| Total | 1,041 (48.9%) | 962 (45.2%) |
Income Above Poverty by Sex and Age in Dawson
According to the poverty statistics in Dawson, males aged 25 to 34 years and females aged 5 years are the age groups that are most secure financially, with 78.6% of males and 100.0% of females in these age groups living above the poverty line.
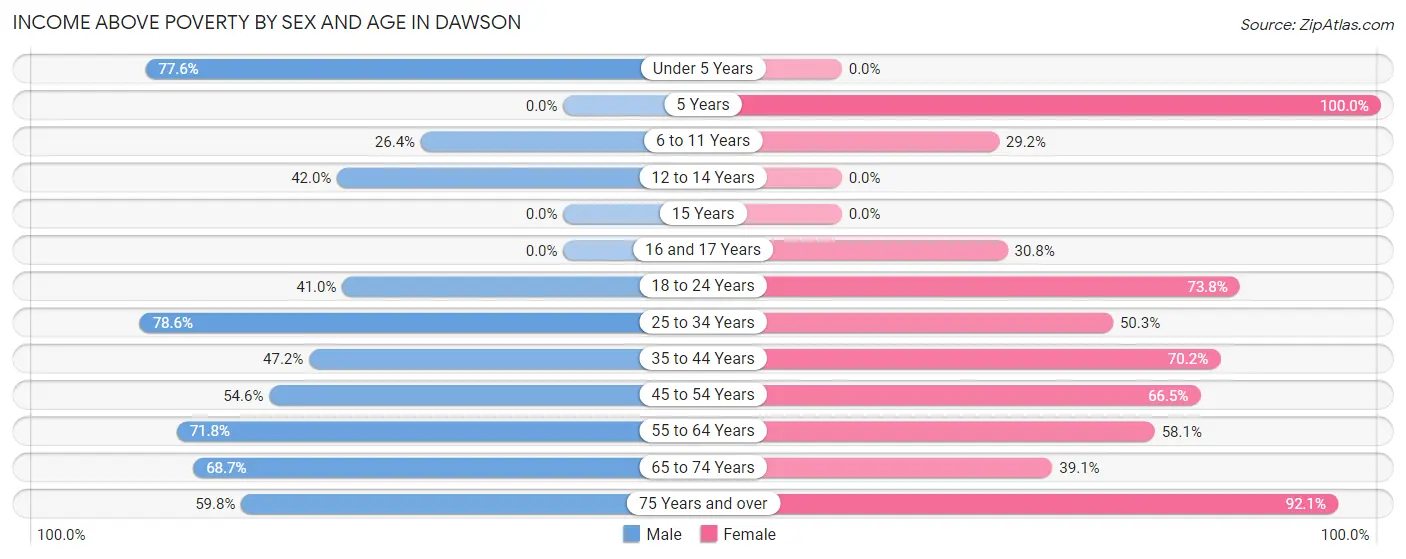
| Age Bracket | Male | Female |
| Under 5 Years | 204 (77.6%) | 0 (0.0%) |
| 5 Years | 0 (0.0%) | 24 (100.0%) |
| 6 to 11 Years | 55 (26.4%) | 86 (29.1%) |
| 12 to 14 Years | 55 (42.0%) | 0 (0.0%) |
| 15 Years | 0 (0.0%) | 0 (0.0%) |
| 16 and 17 Years | 0 (0.0%) | 12 (30.8%) |
| 18 to 24 Years | 135 (41.0%) | 172 (73.8%) |
| 25 to 34 Years | 103 (78.6%) | 149 (50.3%) |
| 35 to 44 Years | 126 (47.2%) | 219 (70.2%) |
| 45 to 54 Years | 107 (54.6%) | 149 (66.5%) |
| 55 to 64 Years | 155 (71.8%) | 140 (58.1%) |
| 65 to 74 Years | 90 (68.7%) | 77 (39.1%) |
| 75 Years and over | 58 (59.8%) | 139 (92.0%) |
| Total | 1,088 (51.1%) | 1,167 (54.8%) |
Income Below Poverty Among Married-Couple Families in Dawson
The poverty statistics for married-couple families in Dawson show that 26.6% or 101 of the total 380 families live below the poverty line. Families with 3 or 4 children have the highest poverty rate of 100.0%, comprising of 31 families. On the other hand, families with 1 or 2 children have the lowest poverty rate of 19.2%, which includes 27 families.
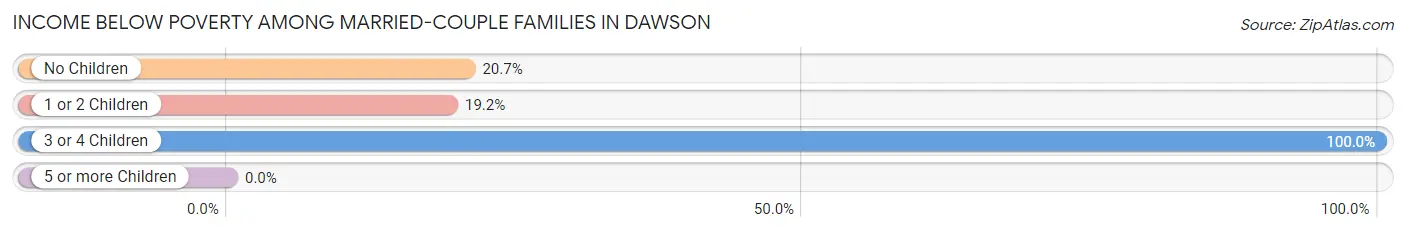
| Children | Above Poverty | Below Poverty |
| No Children | 165 (79.3%) | 43 (20.7%) |
| 1 or 2 Children | 114 (80.8%) | 27 (19.2%) |
| 3 or 4 Children | 0 (0.0%) | 31 (100.0%) |
| 5 or more Children | 0 (0.0%) | 0 (0.0%) |
| Total | 279 (73.4%) | 101 (26.6%) |
Income Below Poverty Among Single-Parent Households in Dawson
According to the poverty data in Dawson, 52.6% or 50 single-father households and 53.3% or 268 single-mother households are living below the poverty line. Among single-father households, those with no children have the highest poverty rate, with 50 households (80.6%) experiencing poverty. Likewise, among single-mother households, those with 3 or 4 children have the highest poverty rate, with 139 households (82.3%) falling below the poverty line.
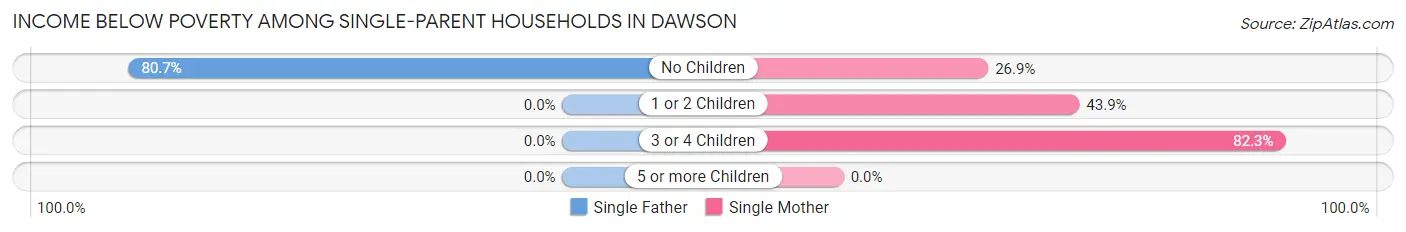
| Children | Single Father | Single Mother |
| No Children | 50 (80.6%) | 28 (26.9%) |
| 1 or 2 Children | 0 (0.0%) | 101 (43.9%) |
| 3 or 4 Children | 0 (0.0%) | 139 (82.3%) |
| 5 or more Children | 0 (0.0%) | 0 (0.0%) |
| Total | 50 (52.6%) | 268 (53.3%) |
Income Below Poverty Among Married-Couple vs Single-Parent Households in Dawson
The poverty data for Dawson shows that 101 of the married-couple family households (26.6%) and 318 of the single-parent households (53.2%) are living below the poverty level. Within the married-couple family households, those with 3 or 4 children have the highest poverty rate, with 31 households (100.0%) falling below the poverty line. Among the single-parent households, those with 3 or 4 children have the highest poverty rate, with 139 household (82.3%) living below poverty.
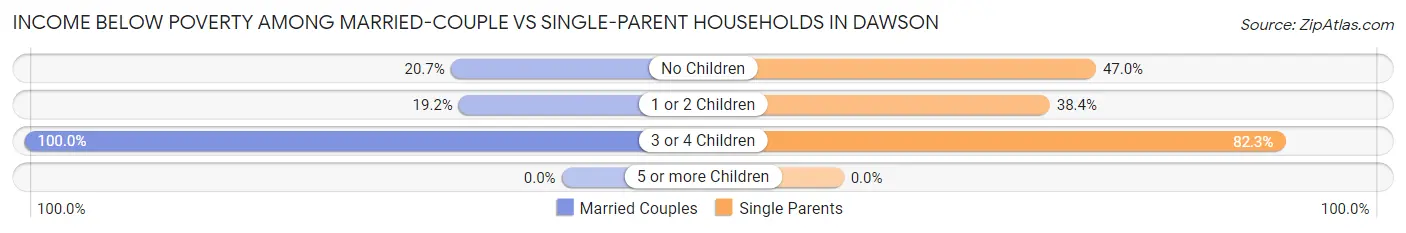
| Children | Married-Couple Families | Single-Parent Households |
| No Children | 43 (20.7%) | 78 (47.0%) |
| 1 or 2 Children | 27 (19.2%) | 101 (38.4%) |
| 3 or 4 Children | 31 (100.0%) | 139 (82.3%) |
| 5 or more Children | 0 (0.0%) | 0 (0.0%) |
| Total | 101 (26.6%) | 318 (53.2%) |
Employment Characteristics in Dawson
Employment by Class of Employer in Dawson
Among the 1,277 employed individuals in Dawson, private company employees (662 | 51.8%), local government employees (235 | 18.4%), and self-employed (not incorporated) (116 | 9.1%) make up the most common classes of employment.
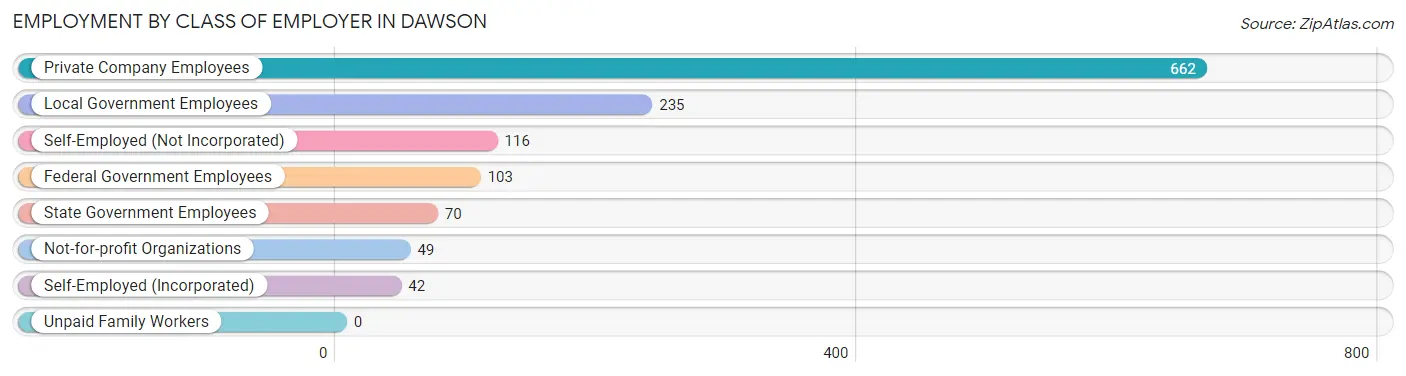
| Employer Class | # Employees | % Employees |
| Private Company Employees | 662 | 51.8% |
| Self-Employed (Incorporated) | 42 | 3.3% |
| Self-Employed (Not Incorporated) | 116 | 9.1% |
| Not-for-profit Organizations | 49 | 3.8% |
| Local Government Employees | 235 | 18.4% |
| State Government Employees | 70 | 5.5% |
| Federal Government Employees | 103 | 8.1% |
| Unpaid Family Workers | 0 | 0.0% |
| Total | 1,277 | 100.0% |
Employment Status by Age in Dawson
According to the labor force statistics for Dawson, out of the total population over 16 years of age (3,171), 48.3% or 1,532 individuals are in the labor force, with 13.6% or 208 of them unemployed. The age group with the highest labor force participation rate is 25 to 29 years, with 100.0% or 190 individuals in the labor force. Within the labor force, the 30 to 34 years age range has the highest percentage of unemployed individuals, with 59.4% or 98 of them being unemployed.
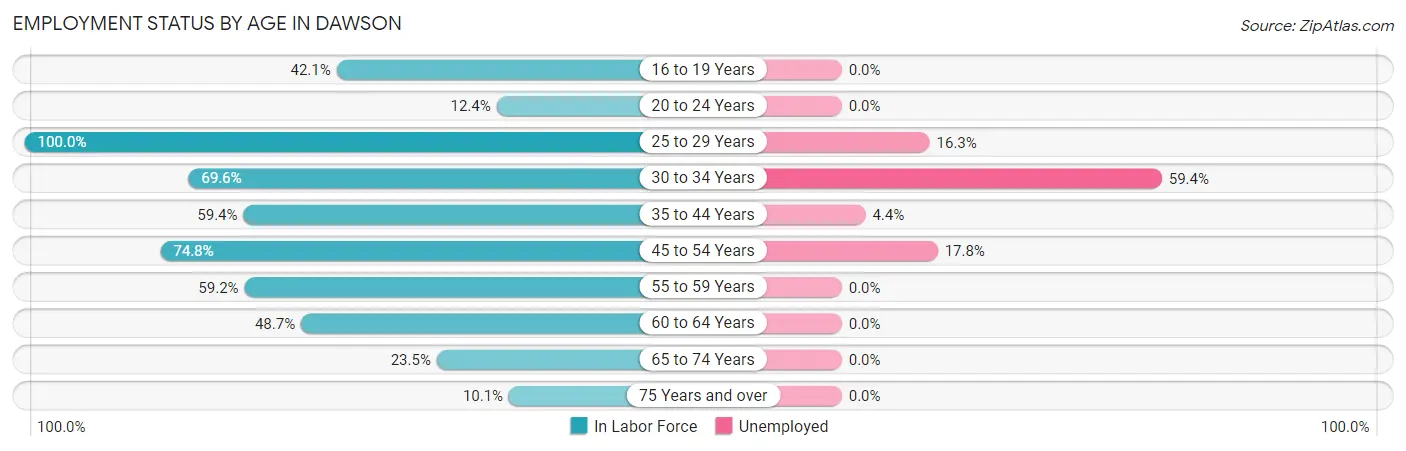
| Age Bracket | In Labor Force | Unemployed |
| 16 to 19 Years | 98 (42.1%) | 0 (0.0%) |
| 20 to 24 Years | 49 (12.4%) | 0 (0.0%) |
| 25 to 29 Years | 190 (100.0%) | 31 (16.3%) |
| 30 to 34 Years | 165 (69.6%) | 98 (59.4%) |
| 35 to 44 Years | 344 (59.4%) | 15 (4.4%) |
| 45 to 54 Years | 314 (74.8%) | 56 (17.8%) |
| 55 to 59 Years | 183 (59.2%) | 0 (0.0%) |
| 60 to 64 Years | 77 (48.7%) | 0 (0.0%) |
| 65 to 74 Years | 81 (23.5%) | 0 (0.0%) |
| 75 Years and over | 31 (10.1%) | 0 (0.0%) |
| Total | 1,532 (48.3%) | 208 (13.6%) |
Employment Status by Educational Attainment in Dawson
According to labor force statistics for Dawson, 67.2% of individuals (1,272) out of the total population between 25 and 64 years of age (1,893) are in the labor force, with 15.7% or 200 of them being unemployed. The group with the highest labor force participation rate are those with the educational attainment of college / associate degree, with 79.0% or 437 individuals in the labor force. Within the labor force, individuals with high school diploma education have the highest percentage of unemployment, with 25.6% or 118 of them being unemployed.
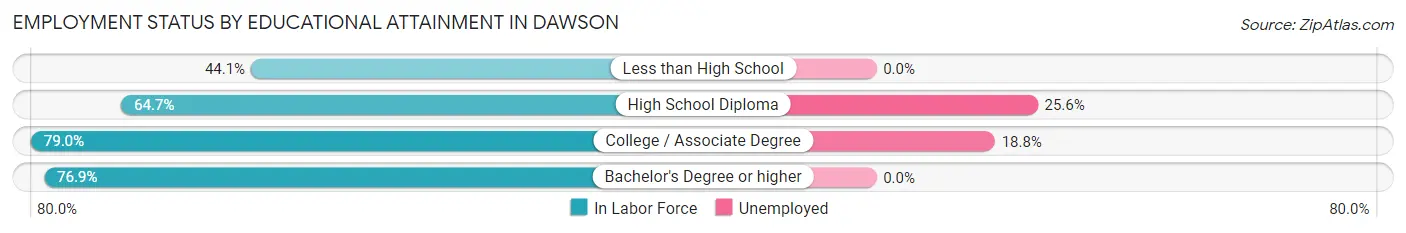
| Educational Attainment | In Labor Force | Unemployed |
| Less than High School | 145 (44.1%) | 0 (0.0%) |
| High School Diploma | 461 (64.7%) | 182 (25.6%) |
| College / Associate Degree | 437 (79.0%) | 104 (18.8%) |
| Bachelor's Degree or higher | 230 (76.9%) | 0 (0.0%) |
| Total | 1,272 (67.2%) | 297 (15.7%) |
Employment Occupations by Sex in Dawson
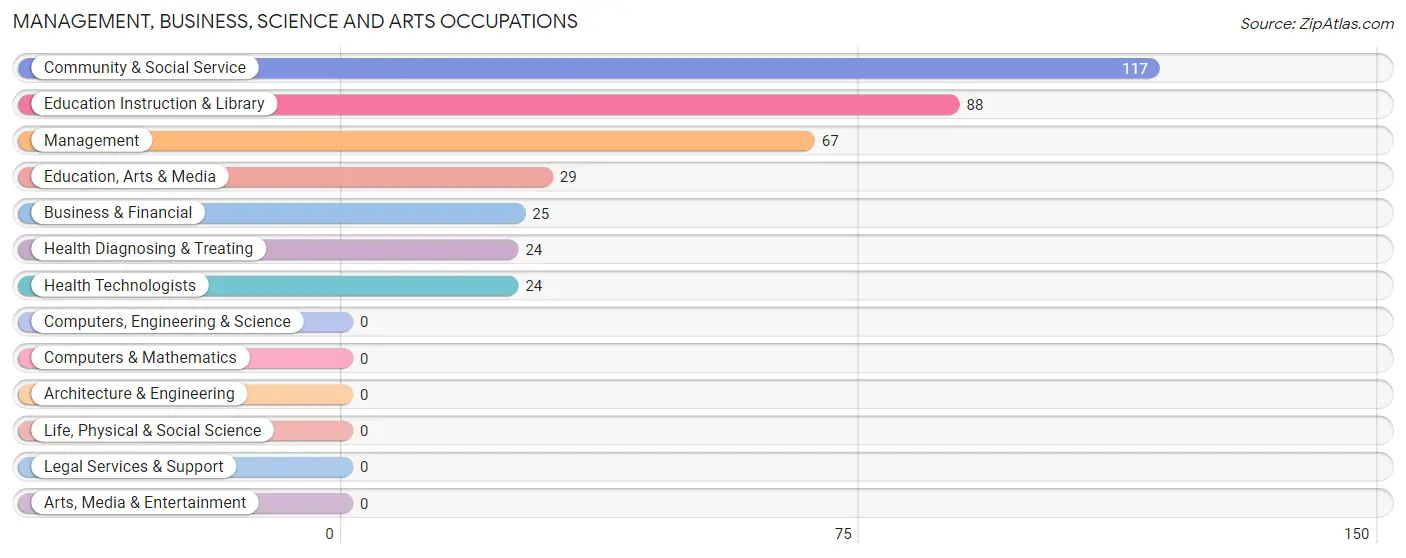
Management, Business, Science and Arts Occupations
The most common Management, Business, Science and Arts occupations in Dawson are Community & Social Service (117 | 9.2%), Education Instruction & Library (88 | 7.0%), Management (67 | 5.3%), Education, Arts & Media (29 | 2.3%), and Business & Financial (25 | 2.0%).
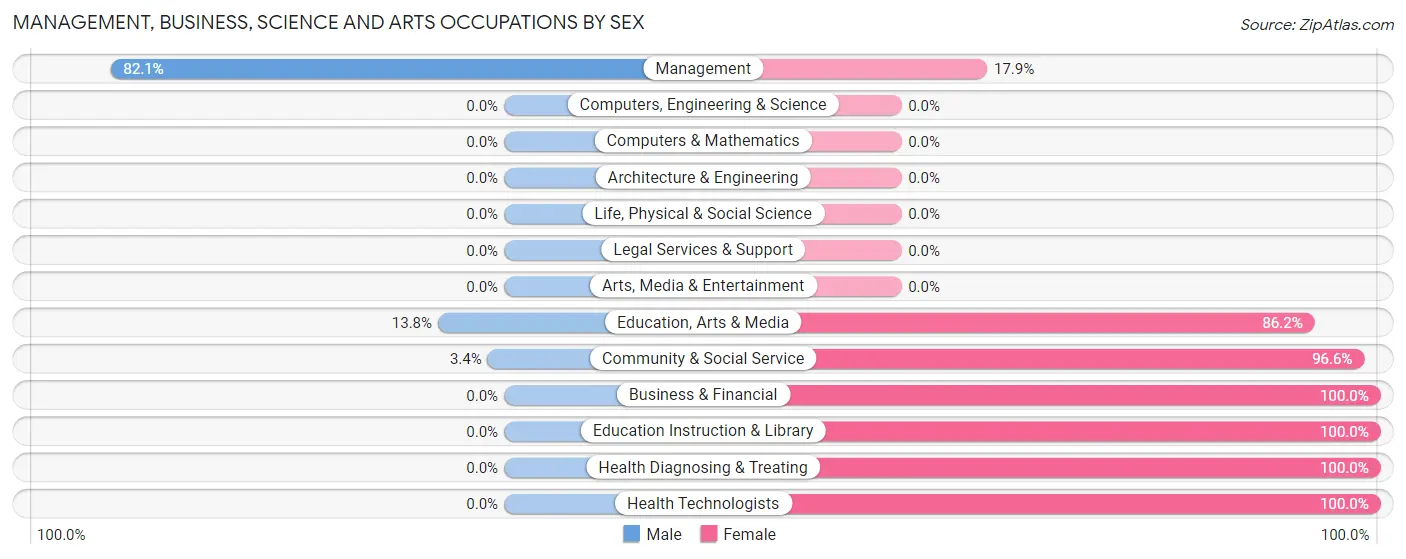
Management, Business, Science and Arts Occupations by Sex
Within the Management, Business, Science and Arts occupations in Dawson, the most male-oriented occupations are Management (82.1%), Education, Arts & Media (13.8%), and Community & Social Service (3.4%), while the most female-oriented occupations are Business & Financial (100.0%), Education Instruction & Library (100.0%), and Health Diagnosing & Treating (100.0%).
| Occupation | Male | Female |
| Management | 55 (82.1%) | 12 (17.9%) |
| Business & Financial | 0 (0.0%) | 25 (100.0%) |
| Computers, Engineering & Science | 0 (0.0%) | 0 (0.0%) |
| Computers & Mathematics | 0 (0.0%) | 0 (0.0%) |
| Architecture & Engineering | 0 (0.0%) | 0 (0.0%) |
| Life, Physical & Social Science | 0 (0.0%) | 0 (0.0%) |
| Community & Social Service | 4 (3.4%) | 113 (96.6%) |
| Education, Arts & Media | 4 (13.8%) | 25 (86.2%) |
| Legal Services & Support | 0 (0.0%) | 0 (0.0%) |
| Education Instruction & Library | 0 (0.0%) | 88 (100.0%) |
| Arts, Media & Entertainment | 0 (0.0%) | 0 (0.0%) |
| Health Diagnosing & Treating | 0 (0.0%) | 24 (100.0%) |
| Health Technologists | 0 (0.0%) | 24 (100.0%) |
| Total (Category) | 59 (25.3%) | 174 (74.7%) |
| Total (Overall) | 595 (47.0%) | 672 (53.0%) |
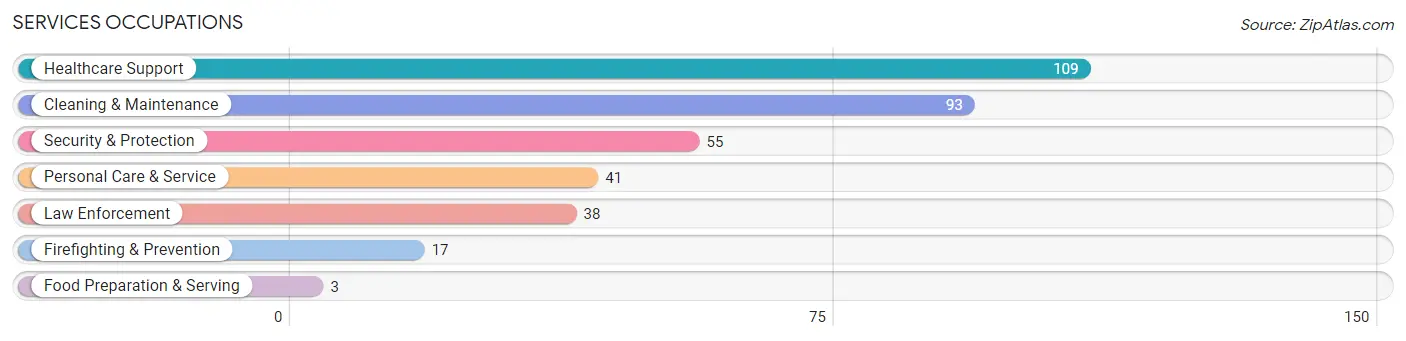
Services Occupations
The most common Services occupations in Dawson are Healthcare Support (109 | 8.6%), Cleaning & Maintenance (93 | 7.3%), Security & Protection (55 | 4.3%), Personal Care & Service (41 | 3.2%), and Law Enforcement (38 | 3.0%).
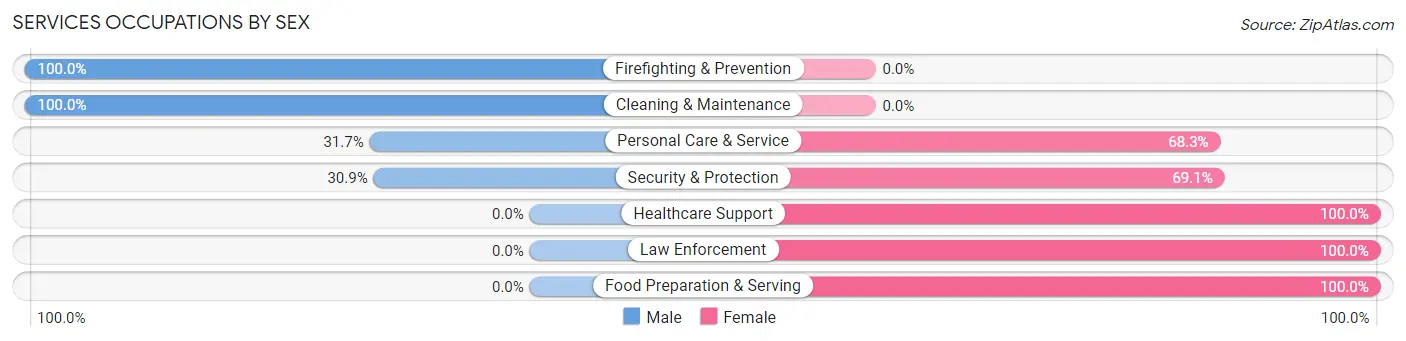
Services Occupations by Sex
Within the Services occupations in Dawson, the most male-oriented occupations are Firefighting & Prevention (100.0%), Cleaning & Maintenance (100.0%), and Personal Care & Service (31.7%), while the most female-oriented occupations are Healthcare Support (100.0%), Law Enforcement (100.0%), and Food Preparation & Serving (100.0%).
| Occupation | Male | Female |
| Healthcare Support | 0 (0.0%) | 109 (100.0%) |
| Security & Protection | 17 (30.9%) | 38 (69.1%) |
| Firefighting & Prevention | 17 (100.0%) | 0 (0.0%) |
| Law Enforcement | 0 (0.0%) | 38 (100.0%) |
| Food Preparation & Serving | 0 (0.0%) | 3 (100.0%) |
| Cleaning & Maintenance | 93 (100.0%) | 0 (0.0%) |
| Personal Care & Service | 13 (31.7%) | 28 (68.3%) |
| Total (Category) | 123 (40.9%) | 178 (59.1%) |
| Total (Overall) | 595 (47.0%) | 672 (53.0%) |
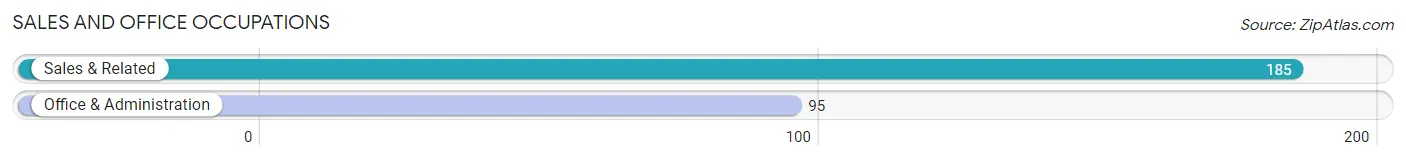
Sales and Office Occupations
The most common Sales and Office occupations in Dawson are Sales & Related (185 | 14.6%), and Office & Administration (95 | 7.5%).
Sales and Office Occupations by Sex
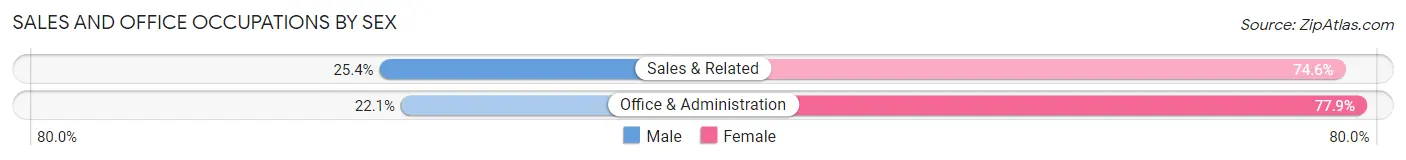
| Occupation | Male | Female |
| Sales & Related | 47 (25.4%) | 138 (74.6%) |
| Office & Administration | 21 (22.1%) | 74 (77.9%) |
| Total (Category) | 68 (24.3%) | 212 (75.7%) |
| Total (Overall) | 595 (47.0%) | 672 (53.0%) |
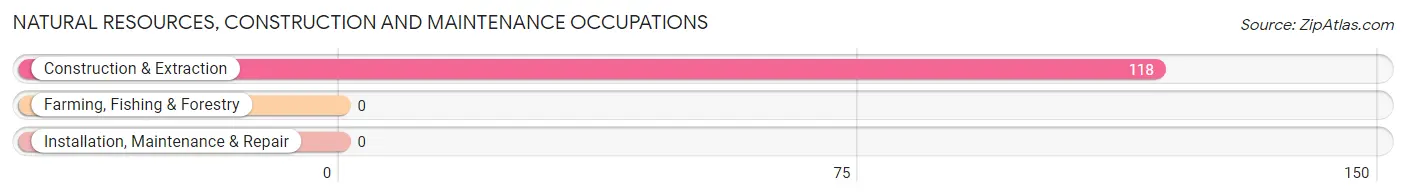
Natural Resources, Construction and Maintenance Occupations
The most common Natural Resources, Construction and Maintenance occupations in Dawson are , and Construction & Extraction (118 | 9.3%).
Natural Resources, Construction and Maintenance Occupations by Sex
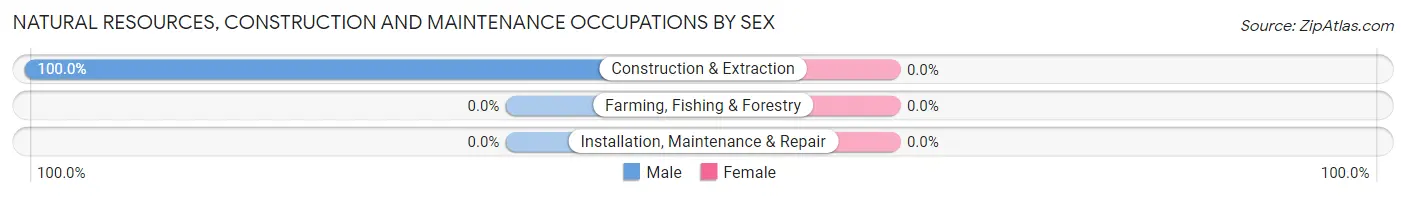
| Occupation | Male | Female |
| Farming, Fishing & Forestry | 0 (0.0%) | 0 (0.0%) |
| Construction & Extraction | 118 (100.0%) | 0 (0.0%) |
| Installation, Maintenance & Repair | 0 (0.0%) | 0 (0.0%) |
| Total (Category) | 118 (100.0%) | 0 (0.0%) |
| Total (Overall) | 595 (47.0%) | 672 (53.0%) |
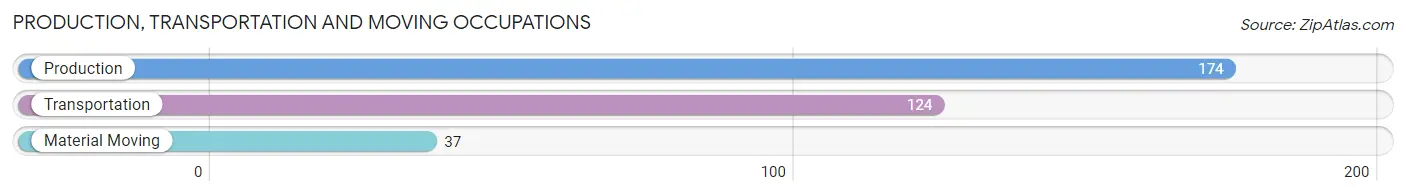
Production, Transportation and Moving Occupations
The most common Production, Transportation and Moving occupations in Dawson are Production (174 | 13.7%), Transportation (124 | 9.8%), and Material Moving (37 | 2.9%).
Production, Transportation and Moving Occupations by Sex
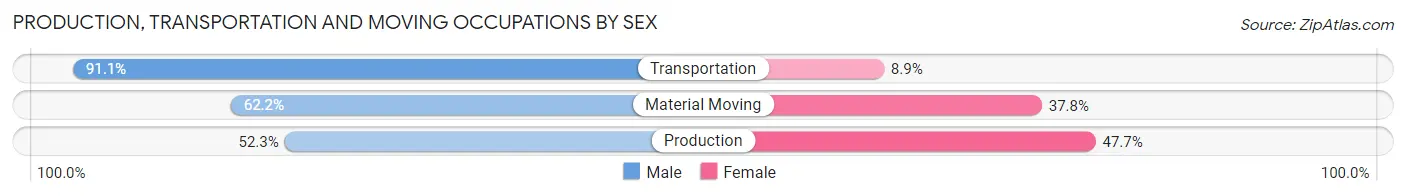
| Occupation | Male | Female |
| Production | 91 (52.3%) | 83 (47.7%) |
| Transportation | 113 (91.1%) | 11 (8.9%) |
| Material Moving | 23 (62.2%) | 14 (37.8%) |
| Total (Category) | 227 (67.8%) | 108 (32.2%) |
| Total (Overall) | 595 (47.0%) | 672 (53.0%) |
Employment Industries by Sex in Dawson
Employment Industries in Dawson
The major employment industries in Dawson include Health Care & Social Assistance (200 | 15.8%), Manufacturing (169 | 13.3%), Public Administration (159 | 12.6%), Retail Trade (108 | 8.5%), and Transportation & Warehousing (101 | 8.0%).
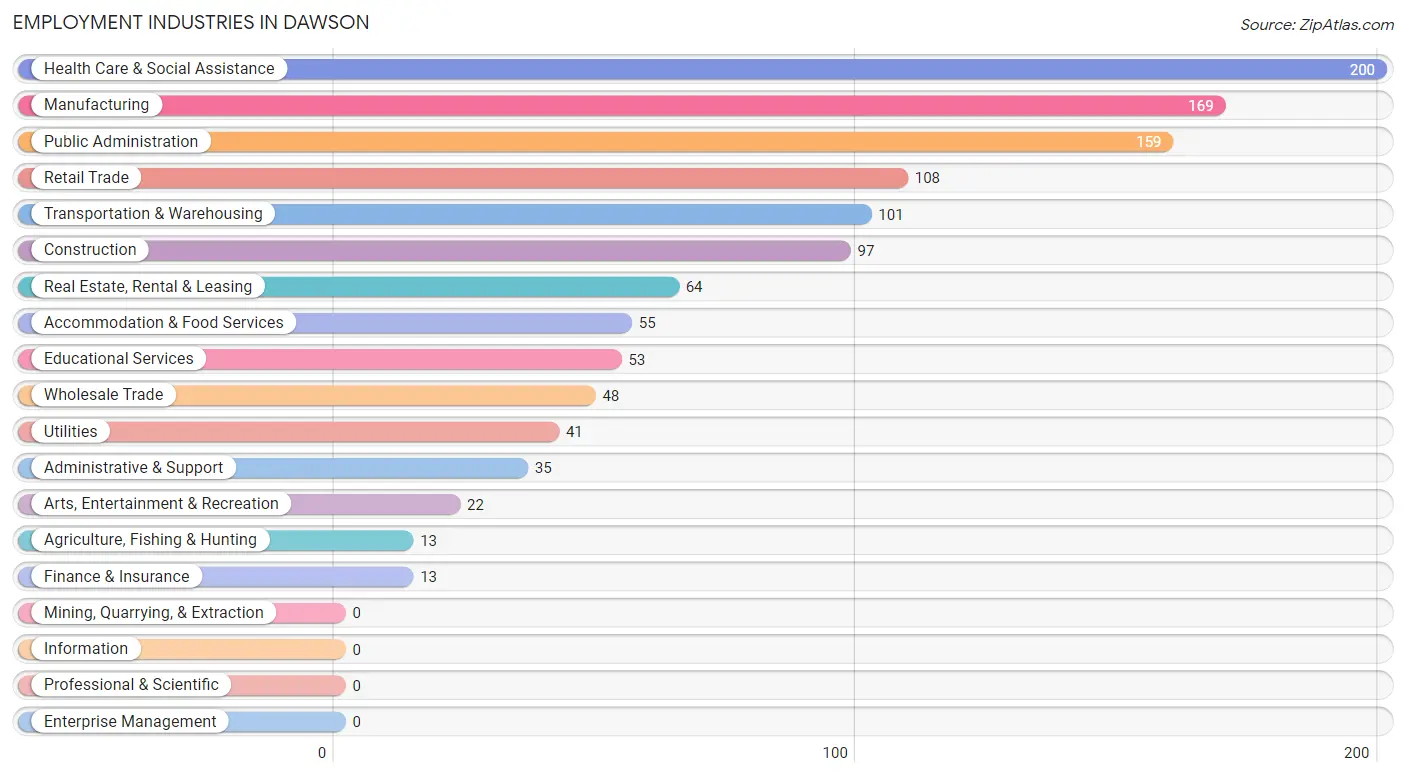
Employment Industries by Sex in Dawson
The Dawson industries that see more men than women are Agriculture, Fishing & Hunting (100.0%), Construction (100.0%), and Transportation & Warehousing (100.0%), whereas the industries that tend to have a higher number of women are Educational Services (100.0%), Arts, Entertainment & Recreation (100.0%), and Wholesale Trade (97.9%).
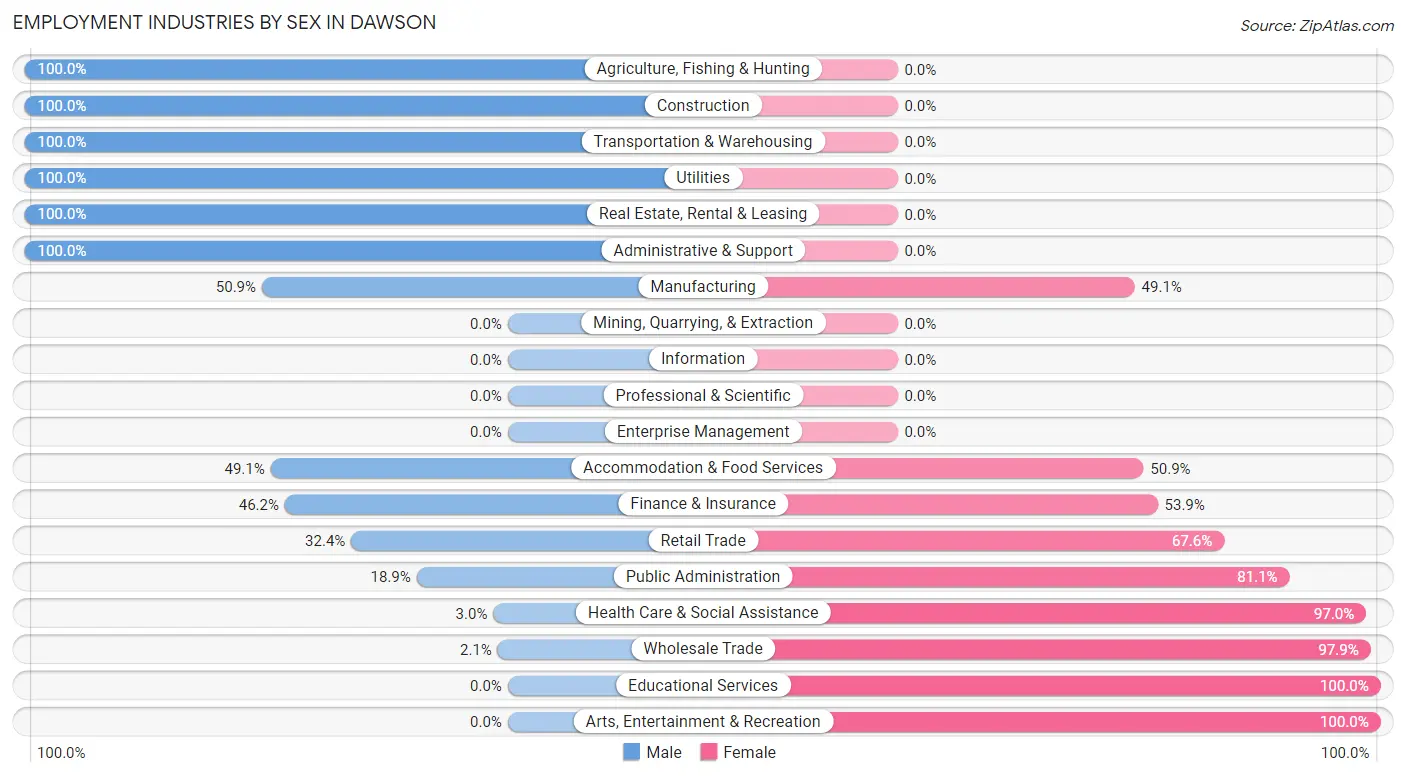
| Industry | Male | Female |
| Agriculture, Fishing & Hunting | 13 (100.0%) | 0 (0.0%) |
| Mining, Quarrying, & Extraction | 0 (0.0%) | 0 (0.0%) |
| Construction | 97 (100.0%) | 0 (0.0%) |
| Manufacturing | 86 (50.9%) | 83 (49.1%) |
| Wholesale Trade | 1 (2.1%) | 47 (97.9%) |
| Retail Trade | 35 (32.4%) | 73 (67.6%) |
| Transportation & Warehousing | 101 (100.0%) | 0 (0.0%) |
| Utilities | 41 (100.0%) | 0 (0.0%) |
| Information | 0 (0.0%) | 0 (0.0%) |
| Finance & Insurance | 6 (46.2%) | 7 (53.8%) |
| Real Estate, Rental & Leasing | 64 (100.0%) | 0 (0.0%) |
| Professional & Scientific | 0 (0.0%) | 0 (0.0%) |
| Enterprise Management | 0 (0.0%) | 0 (0.0%) |
| Administrative & Support | 35 (100.0%) | 0 (0.0%) |
| Educational Services | 0 (0.0%) | 53 (100.0%) |
| Health Care & Social Assistance | 6 (3.0%) | 194 (97.0%) |
| Arts, Entertainment & Recreation | 0 (0.0%) | 22 (100.0%) |
| Accommodation & Food Services | 27 (49.1%) | 28 (50.9%) |
| Public Administration | 30 (18.9%) | 129 (81.1%) |
| Total | 595 (47.0%) | 672 (53.0%) |
Education in Dawson
School Enrollment in Dawson
The most common levels of schooling among the 1,154 students in Dawson are elementary school (386 | 33.5%), high school (301 | 26.1%), and middle school (215 | 18.6%).
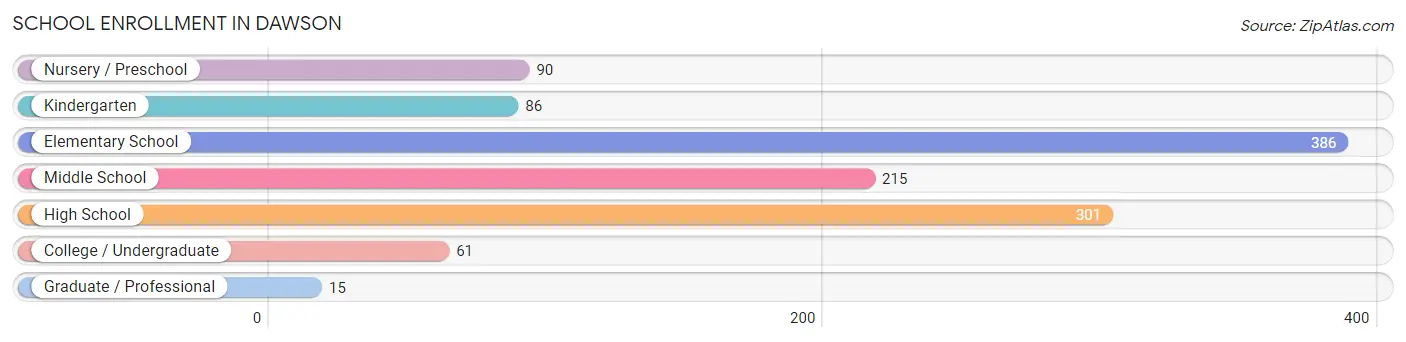
| School Level | # Students | % Students |
| Nursery / Preschool | 90 | 7.8% |
| Kindergarten | 86 | 7.4% |
| Elementary School | 386 | 33.5% |
| Middle School | 215 | 18.6% |
| High School | 301 | 26.1% |
| College / Undergraduate | 61 | 5.3% |
| Graduate / Professional | 15 | 1.3% |
| Total | 1,154 | 100.0% |
School Enrollment by Age by Funding Source in Dawson
Out of a total of 1,154 students who are enrolled in schools in Dawson, 45 (3.9%) attend a private institution, while the remaining 1,109 (96.1%) are enrolled in public schools. The age group of 20 to 24 year olds has the highest likelihood of being enrolled in private schools, with 31 (50.8% in the age bracket) enrolled. Conversely, the age group of 3 to 4 year olds has the lowest likelihood of being enrolled in a private school, with 90 (100.0% in the age bracket) attending a public institution.
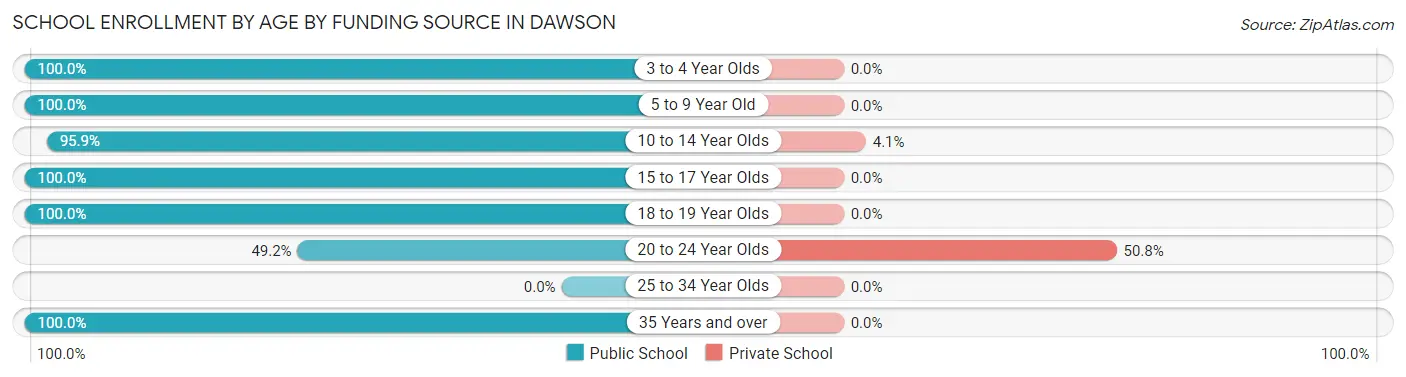
| Age Bracket | Public School | Private School |
| 3 to 4 Year Olds | 90 (100.0%) | 0 (0.0%) |
| 5 to 9 Year Old | 401 (100.0%) | 0 (0.0%) |
| 10 to 14 Year Olds | 326 (95.9%) | 14 (4.1%) |
| 15 to 17 Year Olds | 178 (100.0%) | 0 (0.0%) |
| 18 to 19 Year Olds | 69 (100.0%) | 0 (0.0%) |
| 20 to 24 Year Olds | 30 (49.2%) | 31 (50.8%) |
| 25 to 34 Year Olds | 0 (0.0%) | 0 (0.0%) |
| 35 Years and over | 15 (100.0%) | 0 (0.0%) |
| Total | 1,109 (96.1%) | 45 (3.9%) |
Educational Attainment by Field of Study in Dawson
Business (113 | 29.1%), education (67 | 17.3%), psychology (57 | 14.7%), social sciences (47 | 12.1%), and science & technology (45 | 11.6%) are the most common fields of study among 388 individuals in Dawson who have obtained a bachelor's degree or higher.
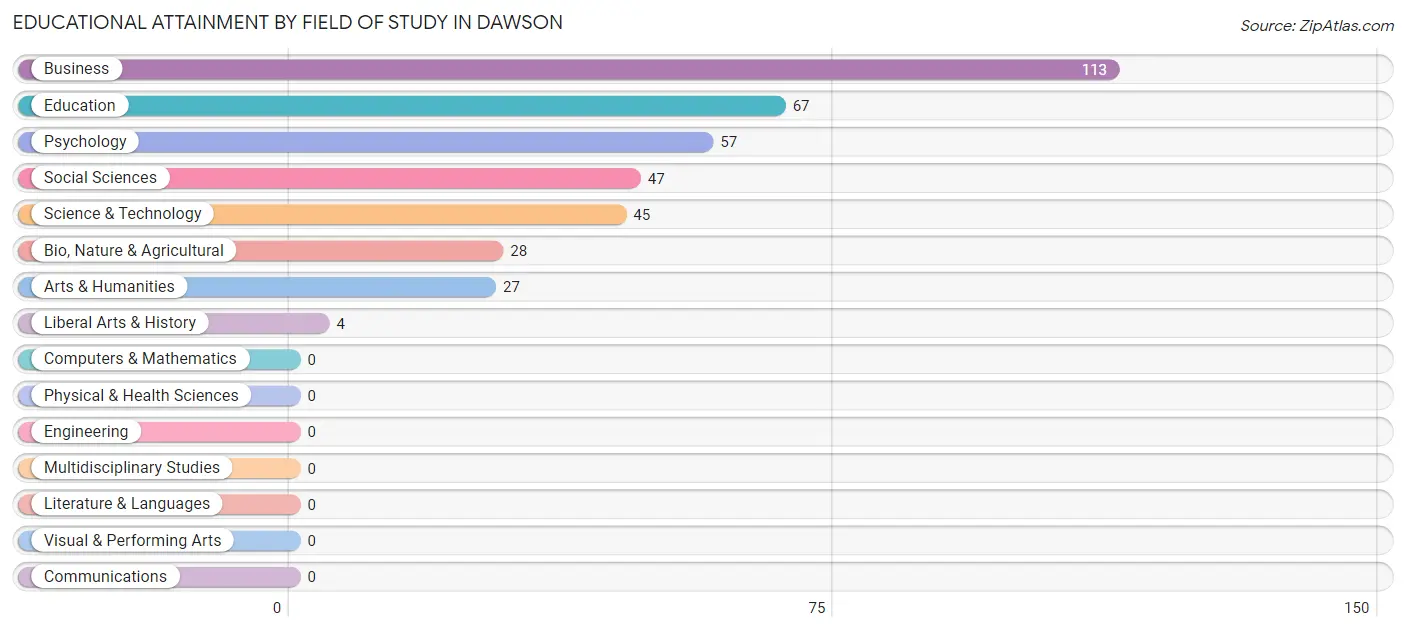
| Field of Study | # Graduates | % Graduates |
| Computers & Mathematics | 0 | 0.0% |
| Bio, Nature & Agricultural | 28 | 7.2% |
| Physical & Health Sciences | 0 | 0.0% |
| Psychology | 57 | 14.7% |
| Social Sciences | 47 | 12.1% |
| Engineering | 0 | 0.0% |
| Multidisciplinary Studies | 0 | 0.0% |
| Science & Technology | 45 | 11.6% |
| Business | 113 | 29.1% |
| Education | 67 | 17.3% |
| Literature & Languages | 0 | 0.0% |
| Liberal Arts & History | 4 | 1.0% |
| Visual & Performing Arts | 0 | 0.0% |
| Communications | 0 | 0.0% |
| Arts & Humanities | 27 | 7.0% |
| Total | 388 | 100.0% |
Transportation & Commute in Dawson
Vehicle Availability by Sex in Dawson
The most prevalent vehicle ownership categories in Dawson are males with 2 vehicles (258, accounting for 46.1%) and females with 2 vehicles (391, making up 36.0%).
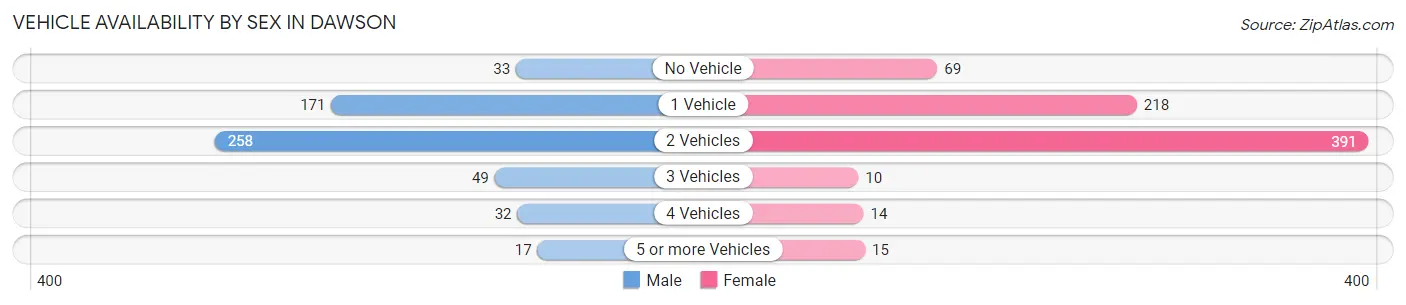
| Vehicles Available | Male | Female |
| No Vehicle | 33 (5.9%) | 69 (9.6%) |
| 1 Vehicle | 171 (30.5%) | 218 (30.4%) |
| 2 Vehicles | 258 (46.1%) | 391 (54.5%) |
| 3 Vehicles | 49 (8.7%) | 10 (1.4%) |
| 4 Vehicles | 32 (5.7%) | 14 (1.9%) |
| 5 or more Vehicles | 17 (3.0%) | 15 (2.1%) |
| Total | 560 (100.0%) | 717 (100.0%) |
Commute Time in Dawson
The most frequently occuring commute durations in Dawson are 30 to 34 minutes (377 commuters, 32.4%), 5 to 9 minutes (286 commuters, 24.6%), and 10 to 14 minutes (105 commuters, 9.0%).
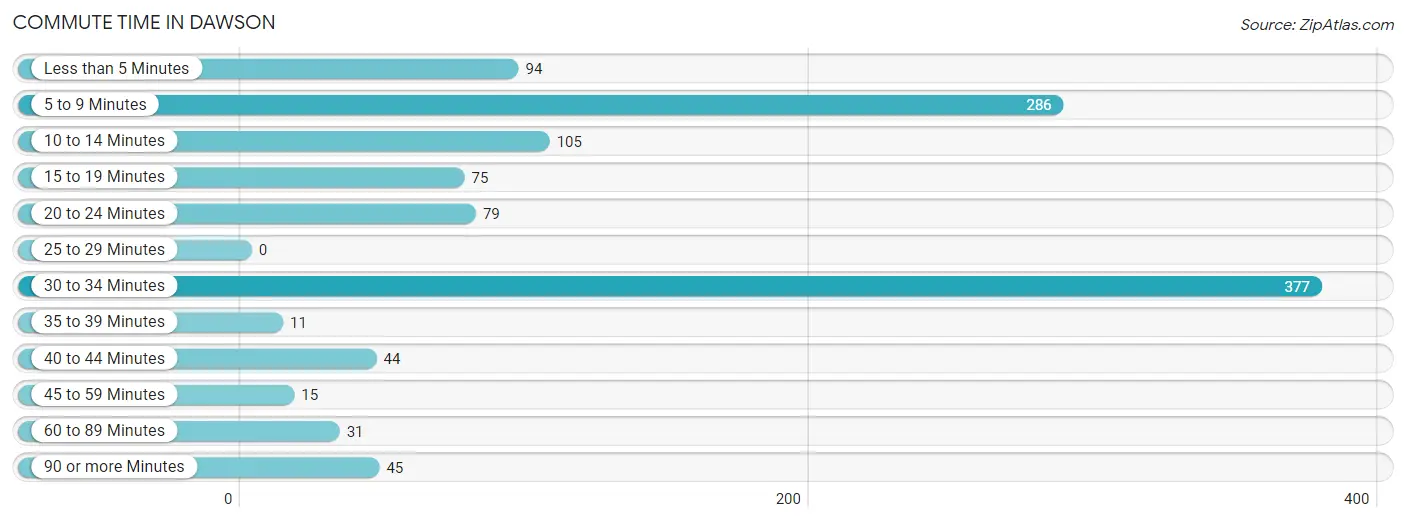
| Commute Time | # Commuters | % Commuters |
| Less than 5 Minutes | 94 | 8.1% |
| 5 to 9 Minutes | 286 | 24.6% |
| 10 to 14 Minutes | 105 | 9.0% |
| 15 to 19 Minutes | 75 | 6.5% |
| 20 to 24 Minutes | 79 | 6.8% |
| 25 to 29 Minutes | 0 | 0.0% |
| 30 to 34 Minutes | 377 | 32.4% |
| 35 to 39 Minutes | 11 | 0.9% |
| 40 to 44 Minutes | 44 | 3.8% |
| 45 to 59 Minutes | 15 | 1.3% |
| 60 to 89 Minutes | 31 | 2.7% |
| 90 or more Minutes | 45 | 3.9% |
Commute Time by Sex in Dawson
The most common commute times in Dawson are 30 to 34 minutes (240 commuters, 44.6%) for males and 30 to 34 minutes (137 commuters, 22.0%) for females.
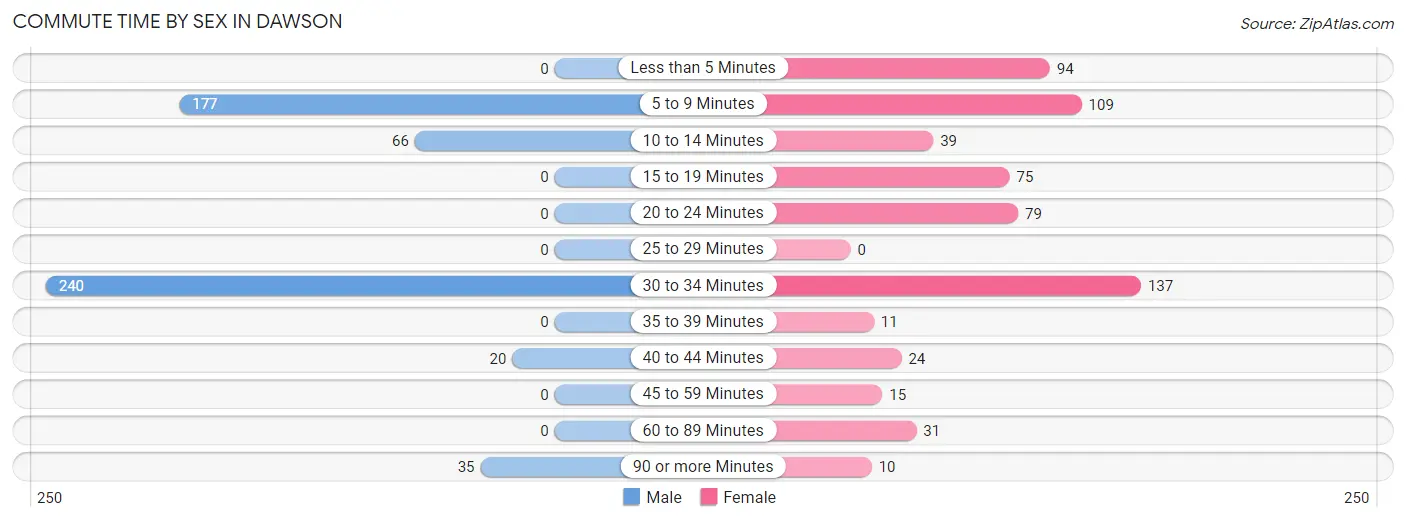
| Commute Time | Male | Female |
| Less than 5 Minutes | 0 (0.0%) | 94 (15.1%) |
| 5 to 9 Minutes | 177 (32.9%) | 109 (17.5%) |
| 10 to 14 Minutes | 66 (12.3%) | 39 (6.2%) |
| 15 to 19 Minutes | 0 (0.0%) | 75 (12.0%) |
| 20 to 24 Minutes | 0 (0.0%) | 79 (12.7%) |
| 25 to 29 Minutes | 0 (0.0%) | 0 (0.0%) |
| 30 to 34 Minutes | 240 (44.6%) | 137 (22.0%) |
| 35 to 39 Minutes | 0 (0.0%) | 11 (1.8%) |
| 40 to 44 Minutes | 20 (3.7%) | 24 (3.8%) |
| 45 to 59 Minutes | 0 (0.0%) | 15 (2.4%) |
| 60 to 89 Minutes | 0 (0.0%) | 31 (5.0%) |
| 90 or more Minutes | 35 (6.5%) | 10 (1.6%) |
Time of Departure to Work by Sex in Dawson
The most frequent times of departure to work in Dawson are 7:00 AM to 7:29 AM (157, 29.2%) for males and 6:30 AM to 6:59 AM (165, 26.4%) for females.
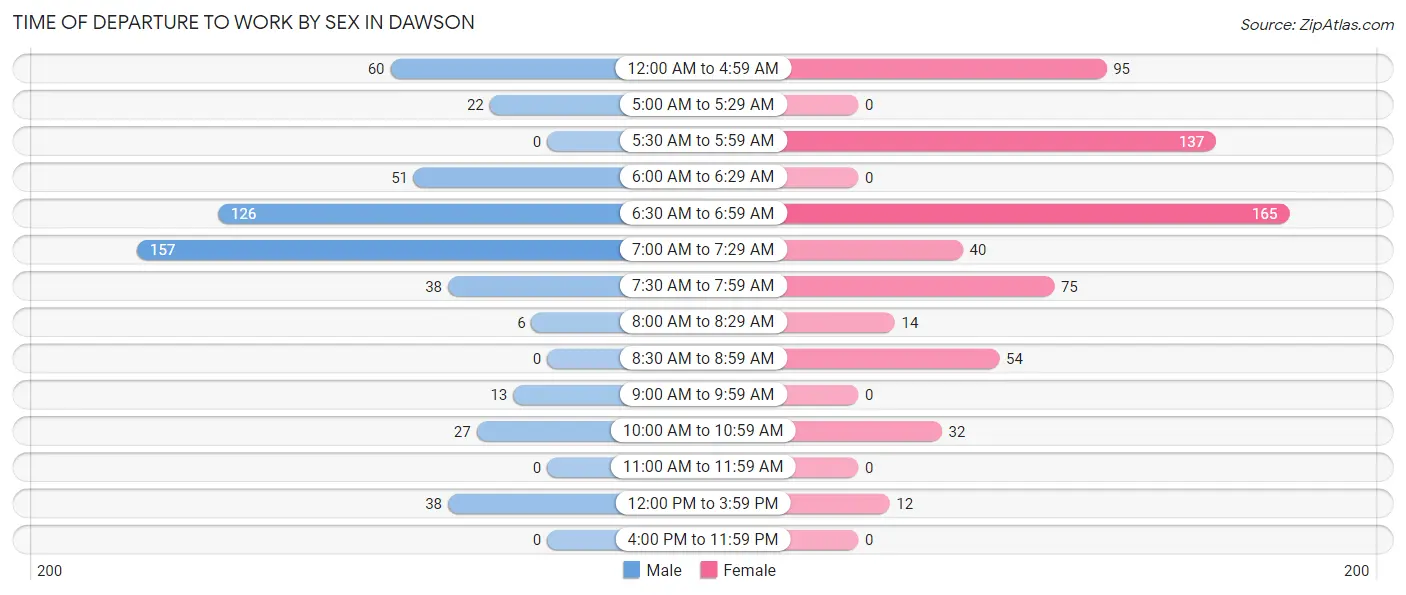
| Time of Departure | Male | Female |
| 12:00 AM to 4:59 AM | 60 (11.2%) | 95 (15.2%) |
| 5:00 AM to 5:29 AM | 22 (4.1%) | 0 (0.0%) |
| 5:30 AM to 5:59 AM | 0 (0.0%) | 137 (22.0%) |
| 6:00 AM to 6:29 AM | 51 (9.5%) | 0 (0.0%) |
| 6:30 AM to 6:59 AM | 126 (23.4%) | 165 (26.4%) |
| 7:00 AM to 7:29 AM | 157 (29.2%) | 40 (6.4%) |
| 7:30 AM to 7:59 AM | 38 (7.1%) | 75 (12.0%) |
| 8:00 AM to 8:29 AM | 6 (1.1%) | 14 (2.2%) |
| 8:30 AM to 8:59 AM | 0 (0.0%) | 54 (8.6%) |
| 9:00 AM to 9:59 AM | 13 (2.4%) | 0 (0.0%) |
| 10:00 AM to 10:59 AM | 27 (5.0%) | 32 (5.1%) |
| 11:00 AM to 11:59 AM | 0 (0.0%) | 0 (0.0%) |
| 12:00 PM to 3:59 PM | 38 (7.1%) | 12 (1.9%) |
| 4:00 PM to 11:59 PM | 0 (0.0%) | 0 (0.0%) |
| Total | 538 (100.0%) | 624 (100.0%) |
Housing Occupancy in Dawson
Occupancy by Ownership in Dawson
Of the total 1,516 dwellings in Dawson, owner-occupied units account for 482 (31.8%), while renter-occupied units make up 1,034 (68.2%).
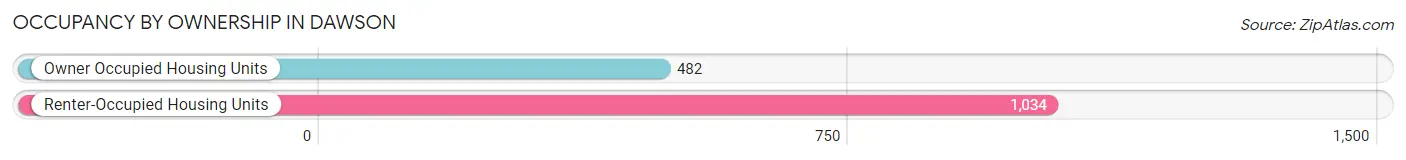
| Occupancy | # Housing Units | % Housing Units |
| Owner Occupied Housing Units | 482 | 31.8% |
| Renter-Occupied Housing Units | 1,034 | 68.2% |
| Total Occupied Housing Units | 1,516 | 100.0% |
Occupancy by Household Size in Dawson
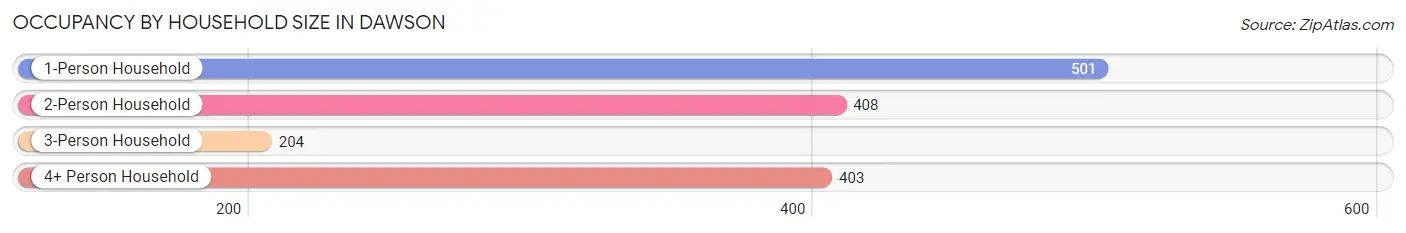
| Household Size | # Housing Units | % Housing Units |
| 1-Person Household | 501 | 33.1% |
| 2-Person Household | 408 | 26.9% |
| 3-Person Household | 204 | 13.5% |
| 4+ Person Household | 403 | 26.6% |
| Total Housing Units | 1,516 | 100.0% |
Occupancy by Ownership by Household Size in Dawson
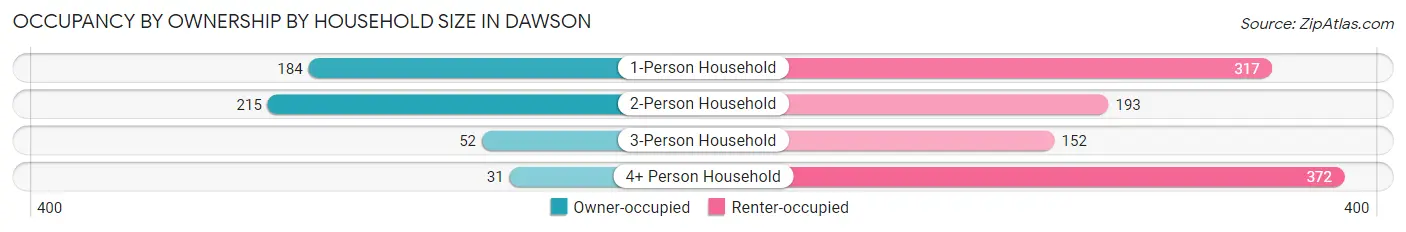
| Household Size | Owner-occupied | Renter-occupied |
| 1-Person Household | 184 (36.7%) | 317 (63.3%) |
| 2-Person Household | 215 (52.7%) | 193 (47.3%) |
| 3-Person Household | 52 (25.5%) | 152 (74.5%) |
| 4+ Person Household | 31 (7.7%) | 372 (92.3%) |
| Total Housing Units | 482 (31.8%) | 1,034 (68.2%) |
Occupancy by Educational Attainment in Dawson
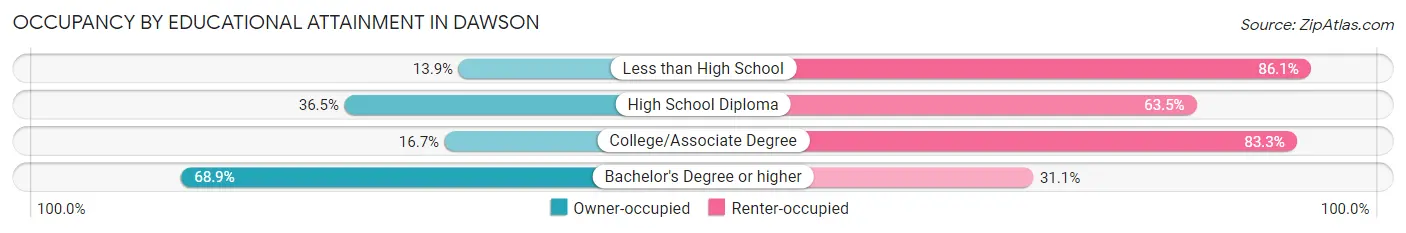
| Household Size | Owner-occupied | Renter-occupied |
| Less than High School | 35 (13.9%) | 217 (86.1%) |
| High School Diploma | 206 (36.5%) | 358 (63.5%) |
| College/Associate Degree | 77 (16.7%) | 385 (83.3%) |
| Bachelor's Degree or higher | 164 (68.9%) | 74 (31.1%) |
Occupancy by Age of Householder in Dawson
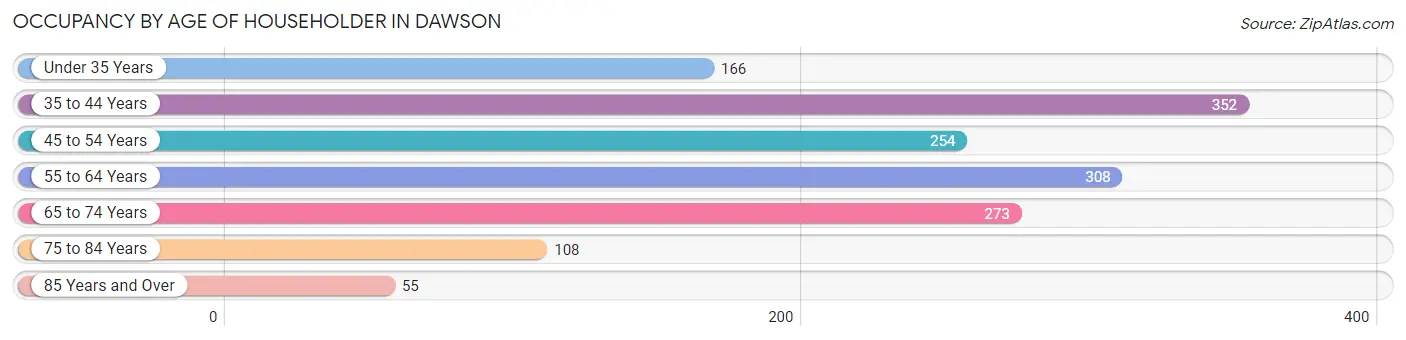
| Age Bracket | # Households | % Households |
| Under 35 Years | 166 | 11.0% |
| 35 to 44 Years | 352 | 23.2% |
| 45 to 54 Years | 254 | 16.8% |
| 55 to 64 Years | 308 | 20.3% |
| 65 to 74 Years | 273 | 18.0% |
| 75 to 84 Years | 108 | 7.1% |
| 85 Years and Over | 55 | 3.6% |
| Total | 1,516 | 100.0% |
Housing Finances in Dawson
Median Income by Occupancy in Dawson
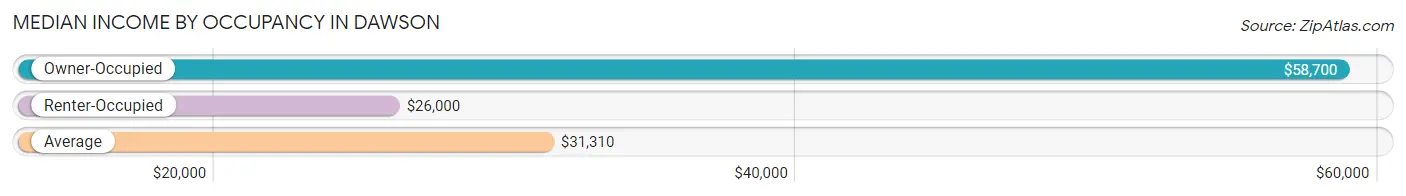
| Occupancy Type | # Households | Median Income |
| Owner-Occupied | 482 (31.8%) | $58,700 |
| Renter-Occupied | 1,034 (68.2%) | $26,000 |
| Average | 1,516 (100.0%) | $31,310 |
Occupancy by Householder Income Bracket in Dawson
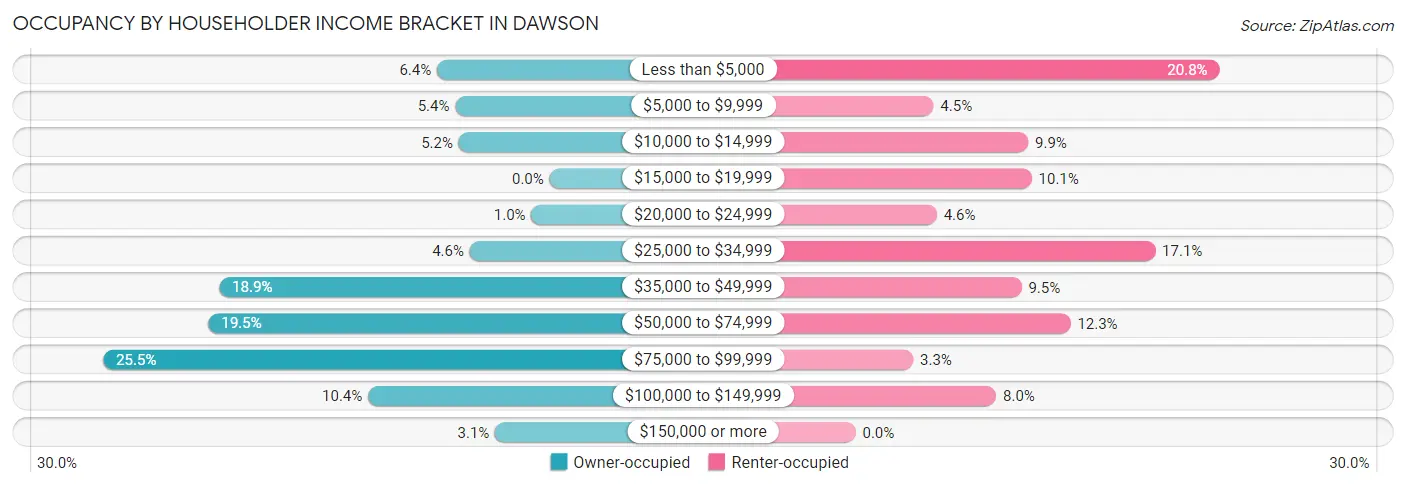
| Income Bracket | Owner-occupied | Renter-occupied |
| Less than $5,000 | 31 (6.4%) | 215 (20.8%) |
| $5,000 to $9,999 | 26 (5.4%) | 46 (4.4%) |
| $10,000 to $14,999 | 25 (5.2%) | 102 (9.9%) |
| $15,000 to $19,999 | 0 (0.0%) | 104 (10.1%) |
| $20,000 to $24,999 | 5 (1.0%) | 48 (4.6%) |
| $25,000 to $34,999 | 22 (4.6%) | 177 (17.1%) |
| $35,000 to $49,999 | 91 (18.9%) | 98 (9.5%) |
| $50,000 to $74,999 | 94 (19.5%) | 127 (12.3%) |
| $75,000 to $99,999 | 123 (25.5%) | 34 (3.3%) |
| $100,000 to $149,999 | 50 (10.4%) | 83 (8.0%) |
| $150,000 or more | 15 (3.1%) | 0 (0.0%) |
| Total | 482 (100.0%) | 1,034 (100.0%) |
Monthly Housing Cost Tiers in Dawson
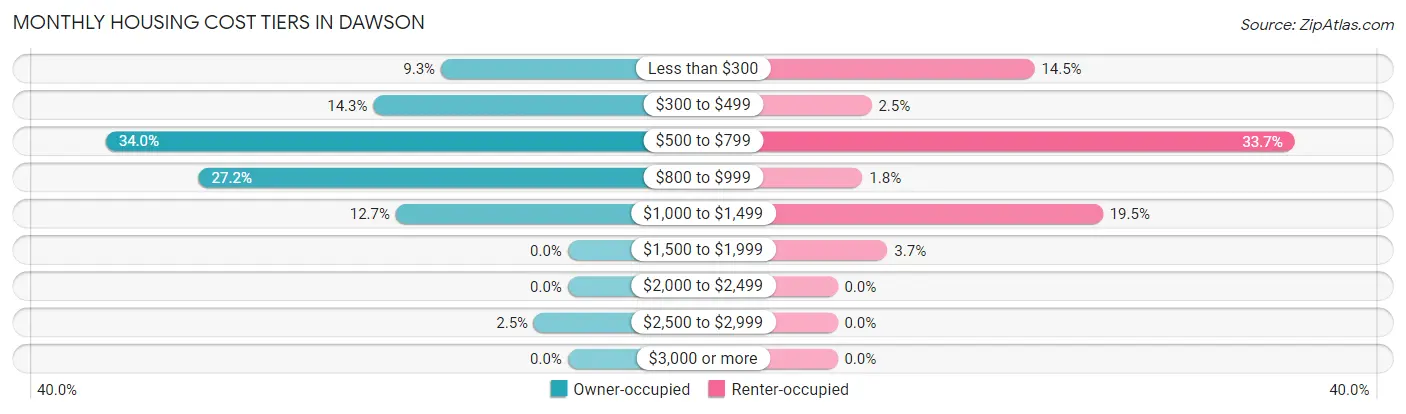
| Monthly Cost | Owner-occupied | Renter-occupied |
| Less than $300 | 45 (9.3%) | 150 (14.5%) |
| $300 to $499 | 69 (14.3%) | 26 (2.5%) |
| $500 to $799 | 164 (34.0%) | 348 (33.7%) |
| $800 to $999 | 131 (27.2%) | 19 (1.8%) |
| $1,000 to $1,499 | 61 (12.7%) | 202 (19.5%) |
| $1,500 to $1,999 | 0 (0.0%) | 38 (3.7%) |
| $2,000 to $2,499 | 0 (0.0%) | 0 (0.0%) |
| $2,500 to $2,999 | 12 (2.5%) | 0 (0.0%) |
| $3,000 or more | 0 (0.0%) | 0 (0.0%) |
| Total | 482 (100.0%) | 1,034 (100.0%) |
Physical Housing Characteristics in Dawson
Housing Structures in Dawson
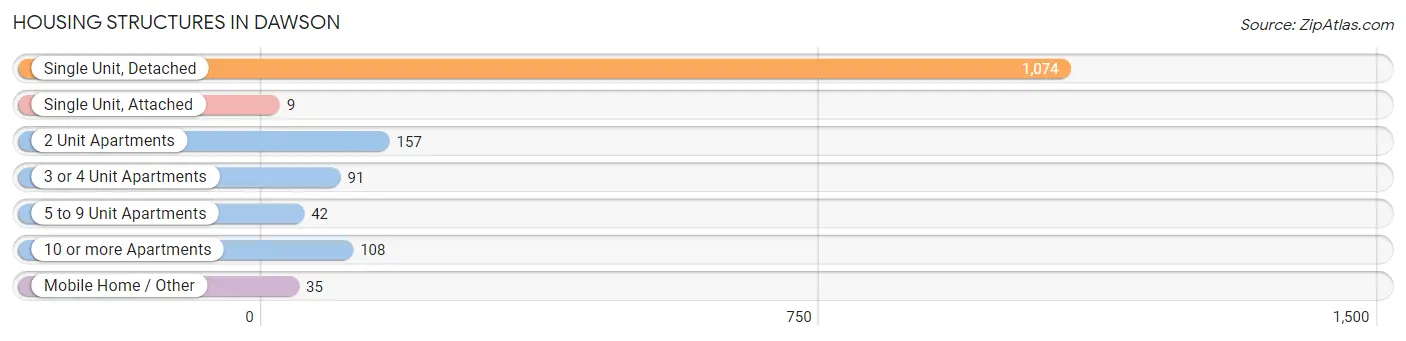
| Structure Type | # Housing Units | % Housing Units |
| Single Unit, Detached | 1,074 | 70.8% |
| Single Unit, Attached | 9 | 0.6% |
| 2 Unit Apartments | 157 | 10.4% |
| 3 or 4 Unit Apartments | 91 | 6.0% |
| 5 to 9 Unit Apartments | 42 | 2.8% |
| 10 or more Apartments | 108 | 7.1% |
| Mobile Home / Other | 35 | 2.3% |
| Total | 1,516 | 100.0% |
Housing Structures by Occupancy in Dawson
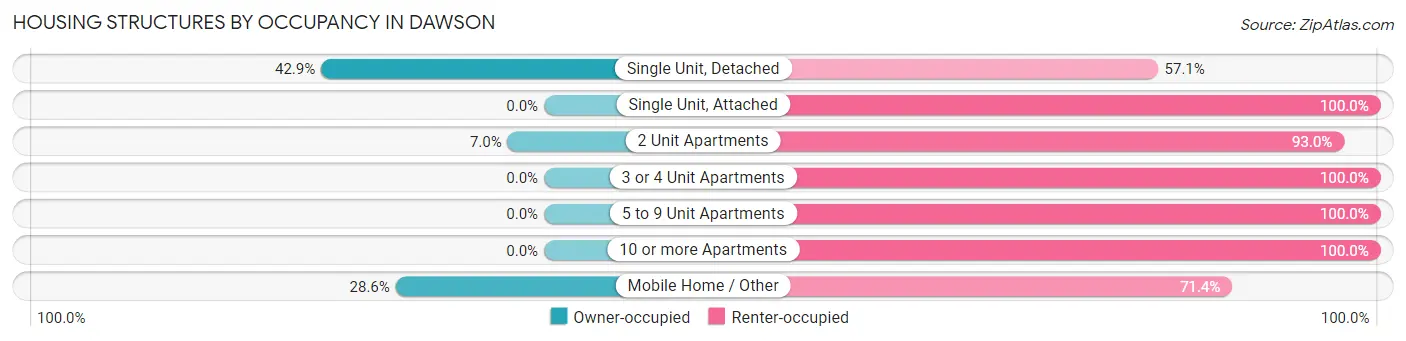
| Structure Type | Owner-occupied | Renter-occupied |
| Single Unit, Detached | 461 (42.9%) | 613 (57.1%) |
| Single Unit, Attached | 0 (0.0%) | 9 (100.0%) |
| 2 Unit Apartments | 11 (7.0%) | 146 (93.0%) |
| 3 or 4 Unit Apartments | 0 (0.0%) | 91 (100.0%) |
| 5 to 9 Unit Apartments | 0 (0.0%) | 42 (100.0%) |
| 10 or more Apartments | 0 (0.0%) | 108 (100.0%) |
| Mobile Home / Other | 10 (28.6%) | 25 (71.4%) |
| Total | 482 (31.8%) | 1,034 (68.2%) |
Housing Structures by Number of Rooms in Dawson
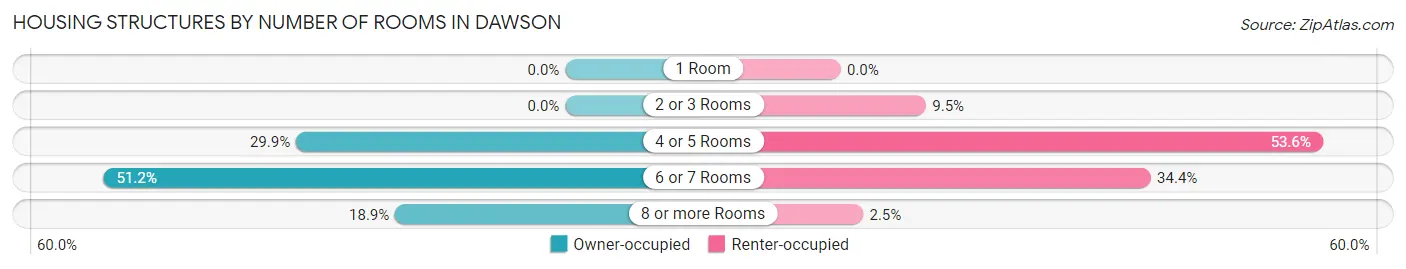
| Number of Rooms | Owner-occupied | Renter-occupied |
| 1 Room | 0 (0.0%) | 0 (0.0%) |
| 2 or 3 Rooms | 0 (0.0%) | 98 (9.5%) |
| 4 or 5 Rooms | 144 (29.9%) | 554 (53.6%) |
| 6 or 7 Rooms | 247 (51.2%) | 356 (34.4%) |
| 8 or more Rooms | 91 (18.9%) | 26 (2.5%) |
| Total | 482 (100.0%) | 1,034 (100.0%) |
Housing Structure by Heating Type in Dawson
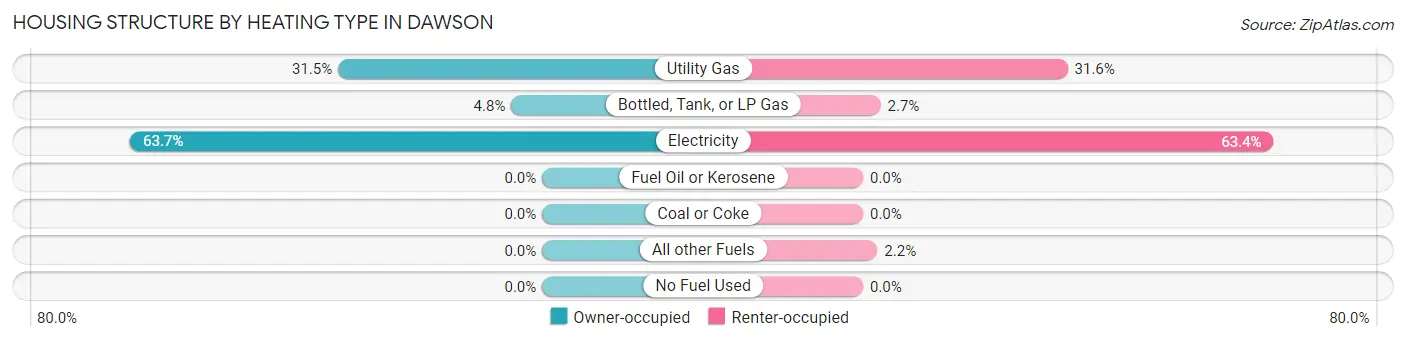
| Heating Type | Owner-occupied | Renter-occupied |
| Utility Gas | 152 (31.5%) | 327 (31.6%) |
| Bottled, Tank, or LP Gas | 23 (4.8%) | 28 (2.7%) |
| Electricity | 307 (63.7%) | 656 (63.4%) |
| Fuel Oil or Kerosene | 0 (0.0%) | 0 (0.0%) |
| Coal or Coke | 0 (0.0%) | 0 (0.0%) |
| All other Fuels | 0 (0.0%) | 23 (2.2%) |
| No Fuel Used | 0 (0.0%) | 0 (0.0%) |
| Total | 482 (100.0%) | 1,034 (100.0%) |
Household Vehicle Usage in Dawson
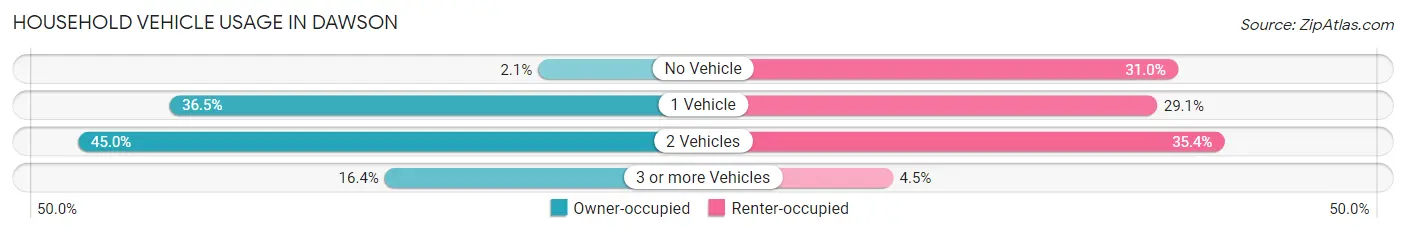
| Vehicles per Household | Owner-occupied | Renter-occupied |
| No Vehicle | 10 (2.1%) | 321 (31.0%) |
| 1 Vehicle | 176 (36.5%) | 301 (29.1%) |
| 2 Vehicles | 217 (45.0%) | 366 (35.4%) |
| 3 or more Vehicles | 79 (16.4%) | 46 (4.4%) |
| Total | 482 (100.0%) | 1,034 (100.0%) |
Real Estate & Mortgages in Dawson
Real Estate and Mortgage Overview in Dawson
| Characteristic | Without Mortgage | With Mortgage |
| Housing Units | 282 | 200 |
| Median Property Value | $86,300 | $72,600 |
| Median Household Income | $69,000 | $0 |
| Monthly Housing Costs | $567 | $0 |
| Real Estate Taxes | $1,602 | $1 |
Property Value by Mortgage Status in Dawson
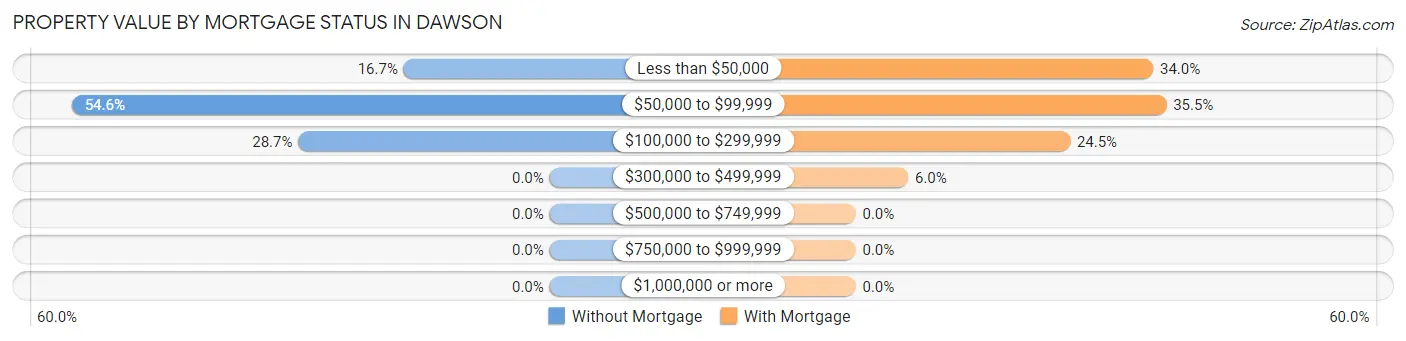
| Property Value | Without Mortgage | With Mortgage |
| Less than $50,000 | 47 (16.7%) | 68 (34.0%) |
| $50,000 to $99,999 | 154 (54.6%) | 71 (35.5%) |
| $100,000 to $299,999 | 81 (28.7%) | 49 (24.5%) |
| $300,000 to $499,999 | 0 (0.0%) | 12 (6.0%) |
| $500,000 to $749,999 | 0 (0.0%) | 0 (0.0%) |
| $750,000 to $999,999 | 0 (0.0%) | 0 (0.0%) |
| $1,000,000 or more | 0 (0.0%) | 0 (0.0%) |
| Total | 282 (100.0%) | 200 (100.0%) |
Household Income by Mortgage Status in Dawson
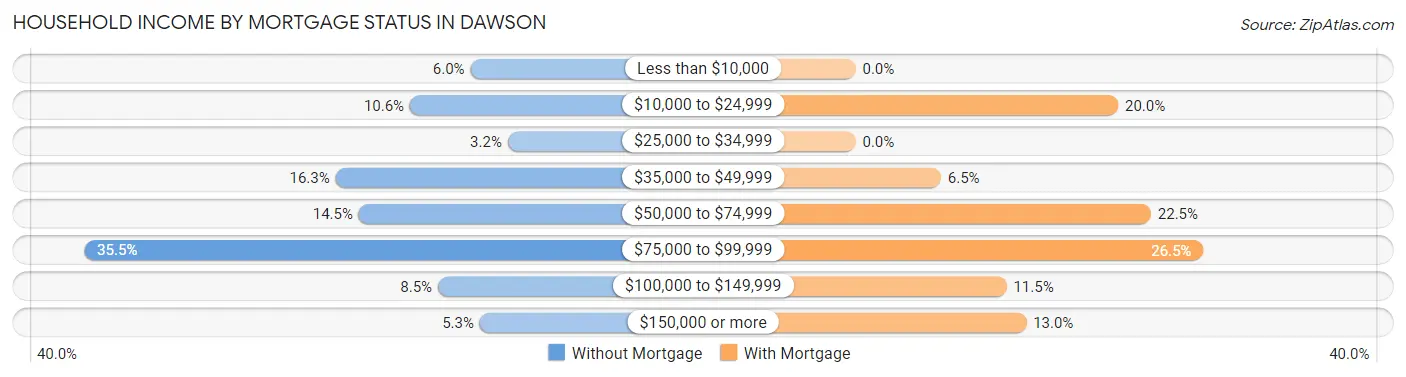
| Household Income | Without Mortgage | With Mortgage |
| Less than $10,000 | 17 (6.0%) | 0 (0.0%) |
| $10,000 to $24,999 | 30 (10.6%) | 40 (20.0%) |
| $25,000 to $34,999 | 9 (3.2%) | 0 (0.0%) |
| $35,000 to $49,999 | 46 (16.3%) | 13 (6.5%) |
| $50,000 to $74,999 | 41 (14.5%) | 45 (22.5%) |
| $75,000 to $99,999 | 100 (35.5%) | 53 (26.5%) |
| $100,000 to $149,999 | 24 (8.5%) | 23 (11.5%) |
| $150,000 or more | 15 (5.3%) | 26 (13.0%) |
| Total | 282 (100.0%) | 200 (100.0%) |
Property Value to Household Income Ratio in Dawson
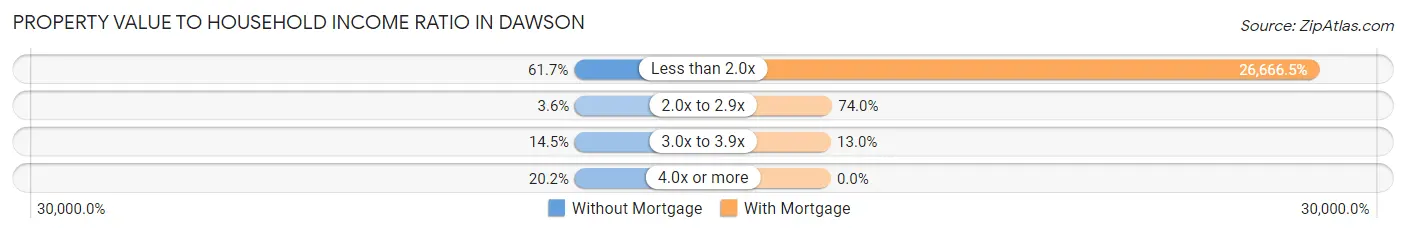
| Value-to-Income Ratio | Without Mortgage | With Mortgage |
| Less than 2.0x | 174 (61.7%) | 53,333 (26,666.5%) |
| 2.0x to 2.9x | 10 (3.5%) | 148 (74.0%) |
| 3.0x to 3.9x | 41 (14.5%) | 26 (13.0%) |
| 4.0x or more | 57 (20.2%) | 0 (0.0%) |
| Total | 282 (100.0%) | 200 (100.0%) |
Real Estate Taxes by Mortgage Status in Dawson
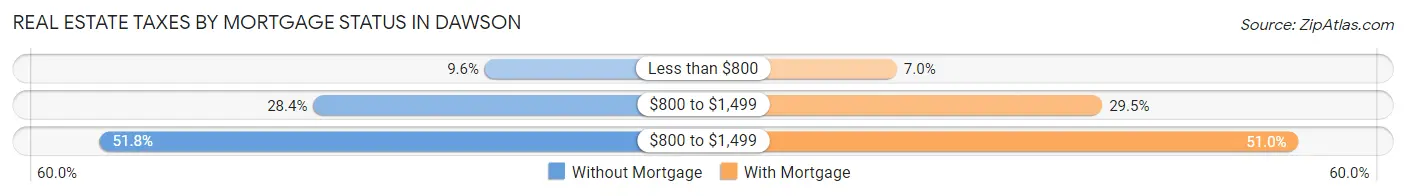
| Property Taxes | Without Mortgage | With Mortgage |
| Less than $800 | 27 (9.6%) | 14 (7.0%) |
| $800 to $1,499 | 80 (28.4%) | 59 (29.5%) |
| $800 to $1,499 | 146 (51.8%) | 102 (51.0%) |
| Total | 282 (100.0%) | 200 (100.0%) |
Health & Disability in Dawson
Health Insurance Coverage by Age in Dawson
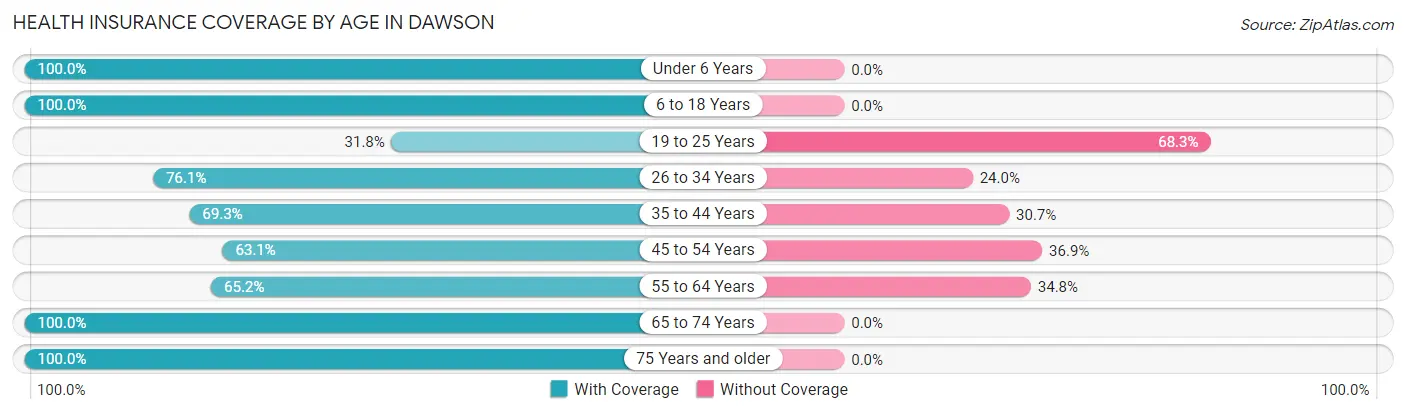
| Age Bracket | With Coverage | Without Coverage |
| Under 6 Years | 380 (100.0%) | 0 (0.0%) |
| 6 to 18 Years | 913 (100.0%) | 0 (0.0%) |
| 19 to 25 Years | 147 (31.8%) | 316 (68.2%) |
| 26 to 34 Years | 308 (76.0%) | 97 (23.9%) |
| 35 to 44 Years | 401 (69.3%) | 178 (30.7%) |
| 45 to 54 Years | 265 (63.1%) | 155 (36.9%) |
| 55 to 64 Years | 298 (65.2%) | 159 (34.8%) |
| 65 to 74 Years | 328 (100.0%) | 0 (0.0%) |
| 75 Years and older | 248 (100.0%) | 0 (0.0%) |
| Total | 3,288 (78.4%) | 905 (21.6%) |
Health Insurance Coverage by Citizenship Status in Dawson
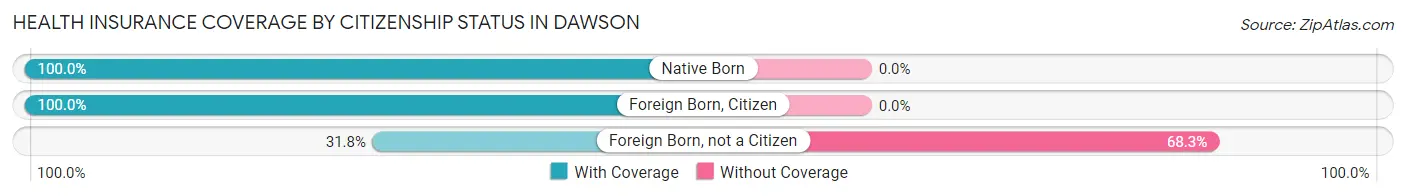
| Citizenship Status | With Coverage | Without Coverage |
| Native Born | 380 (100.0%) | 0 (0.0%) |
| Foreign Born, Citizen | 913 (100.0%) | 0 (0.0%) |
| Foreign Born, not a Citizen | 147 (31.8%) | 316 (68.2%) |
Health Insurance Coverage by Household Income in Dawson
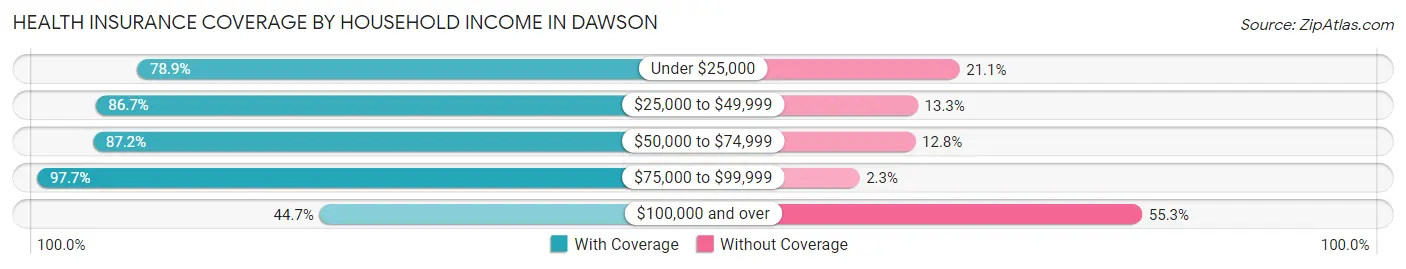
| Household Income | With Coverage | Without Coverage |
| Under $25,000 | 1,340 (78.9%) | 358 (21.1%) |
| $25,000 to $49,999 | 791 (86.7%) | 121 (13.3%) |
| $50,000 to $74,999 | 361 (87.2%) | 53 (12.8%) |
| $75,000 to $99,999 | 504 (97.7%) | 12 (2.3%) |
| $100,000 and over | 292 (44.7%) | 361 (55.3%) |
Public vs Private Health Insurance Coverage by Age in Dawson
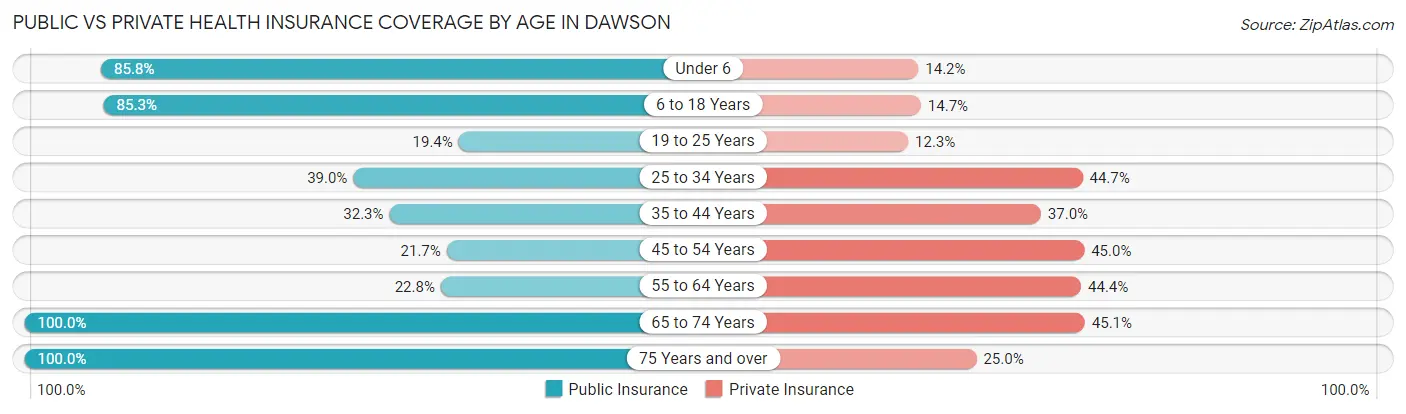
| Age Bracket | Public Insurance | Private Insurance |
| Under 6 | 326 (85.8%) | 54 (14.2%) |
| 6 to 18 Years | 779 (85.3%) | 134 (14.7%) |
| 19 to 25 Years | 90 (19.4%) | 57 (12.3%) |
| 25 to 34 Years | 158 (39.0%) | 181 (44.7%) |
| 35 to 44 Years | 187 (32.3%) | 214 (37.0%) |
| 45 to 54 Years | 91 (21.7%) | 189 (45.0%) |
| 55 to 64 Years | 104 (22.8%) | 203 (44.4%) |
| 65 to 74 Years | 328 (100.0%) | 148 (45.1%) |
| 75 Years and over | 248 (100.0%) | 62 (25.0%) |
| Total | 2,311 (55.1%) | 1,242 (29.6%) |
Disability Status by Sex by Age in Dawson
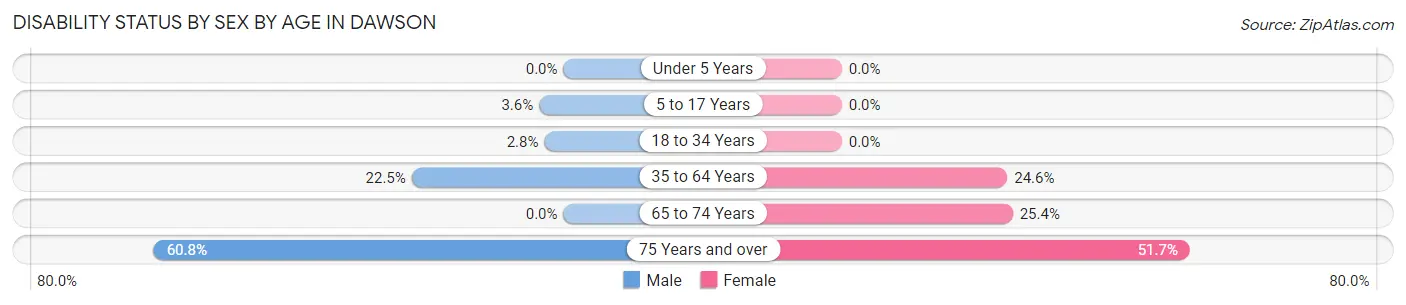
| Age Bracket | Male | Female |
| Under 5 Years | 0 (0.0%) | 0 (0.0%) |
| 5 to 17 Years | 18 (3.6%) | 0 (0.0%) |
| 18 to 34 Years | 13 (2.8%) | 0 (0.0%) |
| 35 to 64 Years | 153 (22.5%) | 191 (24.6%) |
| 65 to 74 Years | 0 (0.0%) | 50 (25.4%) |
| 75 Years and over | 59 (60.8%) | 78 (51.7%) |
Disability Class by Sex by Age in Dawson
Disability Class: Hearing Difficulty
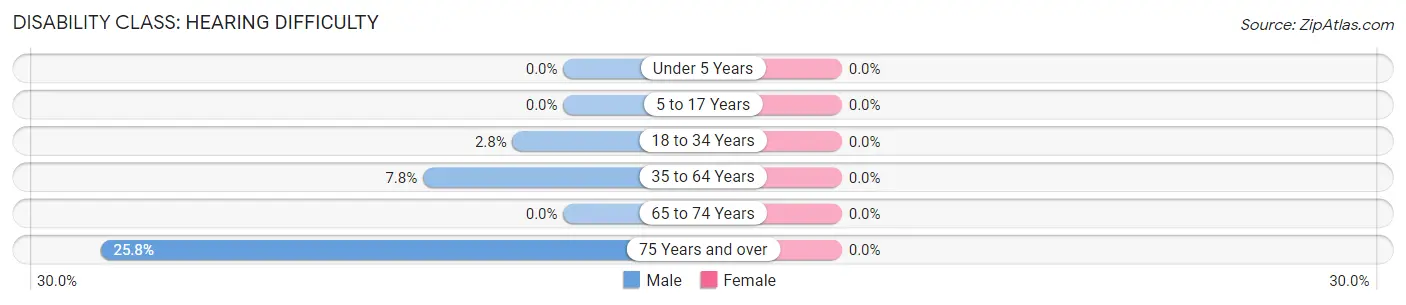
| Age Bracket | Male | Female |
| Under 5 Years | 0 (0.0%) | 0 (0.0%) |
| 5 to 17 Years | 0 (0.0%) | 0 (0.0%) |
| 18 to 34 Years | 13 (2.8%) | 0 (0.0%) |
| 35 to 64 Years | 53 (7.8%) | 0 (0.0%) |
| 65 to 74 Years | 0 (0.0%) | 0 (0.0%) |
| 75 Years and over | 25 (25.8%) | 0 (0.0%) |
Disability Class: Vision Difficulty
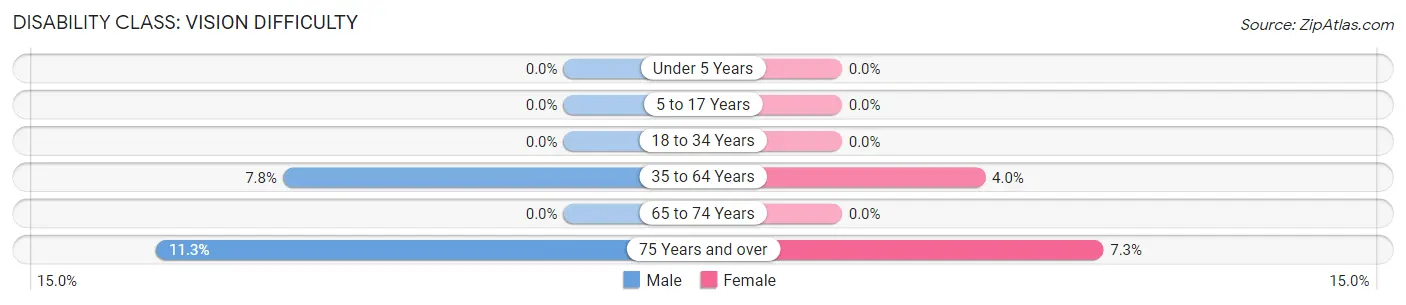
| Age Bracket | Male | Female |
| Under 5 Years | 0 (0.0%) | 0 (0.0%) |
| 5 to 17 Years | 0 (0.0%) | 0 (0.0%) |
| 18 to 34 Years | 0 (0.0%) | 0 (0.0%) |
| 35 to 64 Years | 53 (7.8%) | 31 (4.0%) |
| 65 to 74 Years | 0 (0.0%) | 0 (0.0%) |
| 75 Years and over | 11 (11.3%) | 11 (7.3%) |
Disability Class: Cognitive Difficulty
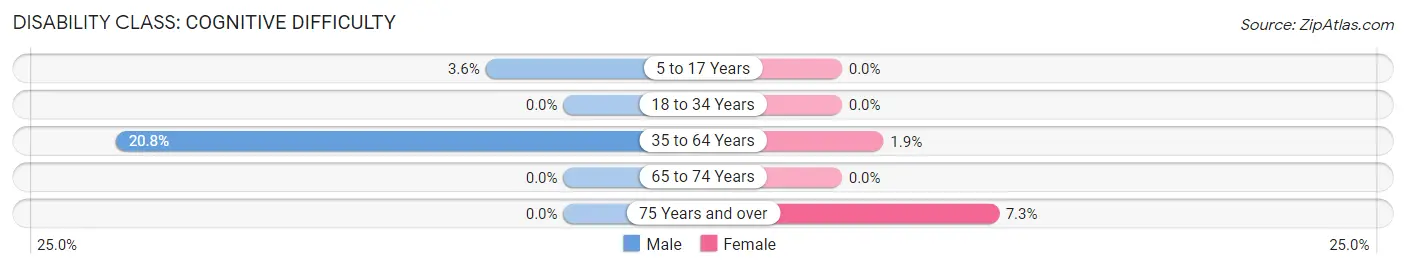
| Age Bracket | Male | Female |
| 5 to 17 Years | 18 (3.6%) | 0 (0.0%) |
| 18 to 34 Years | 0 (0.0%) | 0 (0.0%) |
| 35 to 64 Years | 141 (20.8%) | 15 (1.9%) |
| 65 to 74 Years | 0 (0.0%) | 0 (0.0%) |
| 75 Years and over | 0 (0.0%) | 11 (7.3%) |
Disability Class: Ambulatory Difficulty
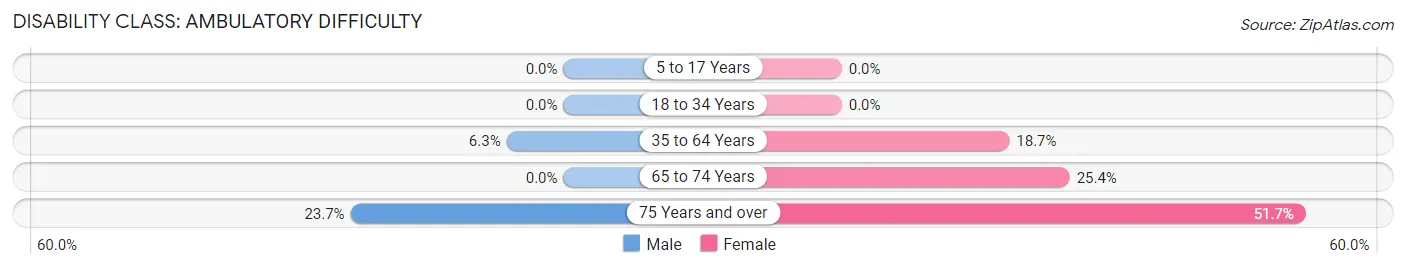
| Age Bracket | Male | Female |
| 5 to 17 Years | 0 (0.0%) | 0 (0.0%) |
| 18 to 34 Years | 0 (0.0%) | 0 (0.0%) |
| 35 to 64 Years | 43 (6.3%) | 145 (18.7%) |
| 65 to 74 Years | 0 (0.0%) | 50 (25.4%) |
| 75 Years and over | 23 (23.7%) | 78 (51.7%) |
Disability Class: Self-Care Difficulty
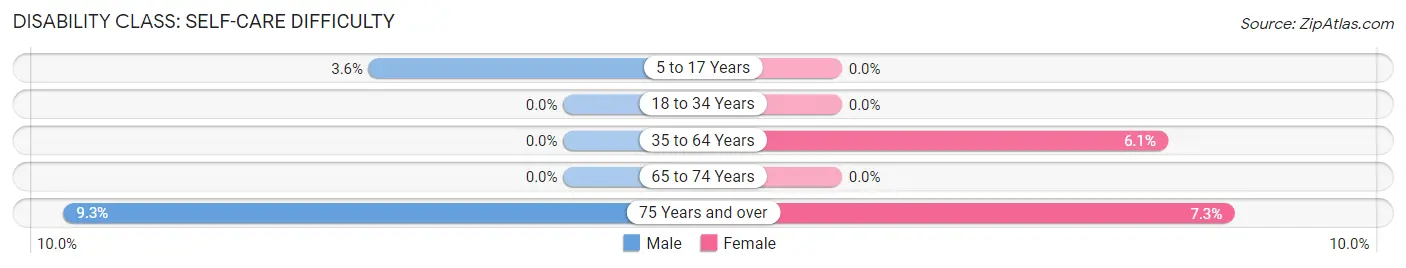
| Age Bracket | Male | Female |
| 5 to 17 Years | 18 (3.6%) | 0 (0.0%) |
| 18 to 34 Years | 0 (0.0%) | 0 (0.0%) |
| 35 to 64 Years | 0 (0.0%) | 47 (6.0%) |
| 65 to 74 Years | 0 (0.0%) | 0 (0.0%) |
| 75 Years and over | 9 (9.3%) | 11 (7.3%) |
Technology Access in Dawson
Computing Device Access in Dawson
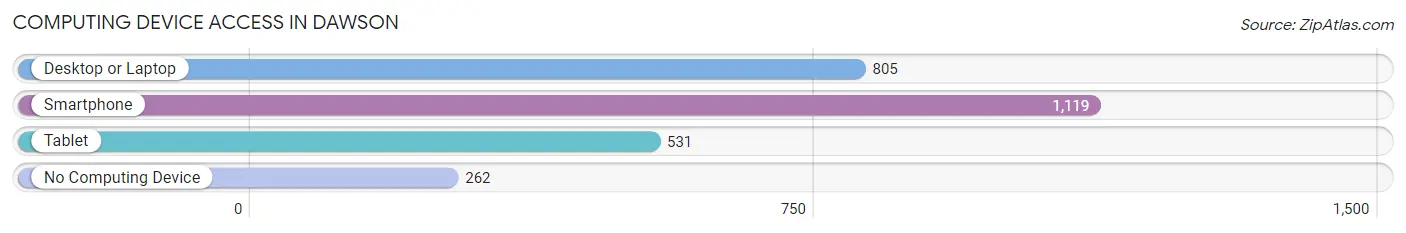
| Device Type | # Households | % Households |
| Desktop or Laptop | 805 | 53.1% |
| Smartphone | 1,119 | 73.8% |
| Tablet | 531 | 35.0% |
| No Computing Device | 262 | 17.3% |
| Total | 1,516 | 100.0% |
Internet Access in Dawson
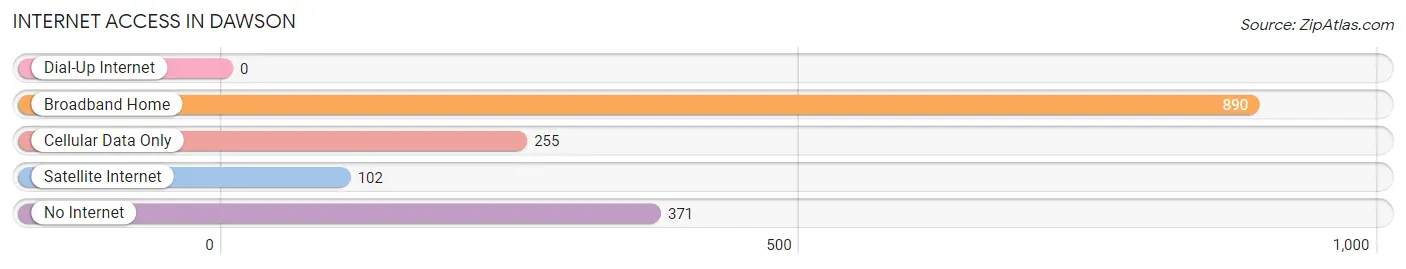
| Internet Type | # Households | % Households |
| Dial-Up Internet | 0 | 0.0% |
| Broadband Home | 890 | 58.7% |
| Cellular Data Only | 255 | 16.8% |
| Satellite Internet | 102 | 6.7% |
| No Internet | 371 | 24.5% |
| Total | 1,516 | 100.0% |
Dawson Summary
Dawson, Georgia is a small city located in Terrell County in the southwestern part of the state. It is situated along the Flint River, about 30 miles south of Albany and about 90 miles north of Columbus. The city has a population of approximately 3,000 people and covers an area of about 4.5 square miles.
History
The area that is now Dawson was first settled in the early 1800s by settlers from the Creek Nation. The town was originally known as "Creek Stand" and was located near the Flint River. In 1854, the town was renamed "Dawson" after William C. Dawson, a prominent local politician.
In the late 1800s, Dawson became a major center for the production of cotton and other agricultural products. The town was also home to several sawmills and gristmills. In the early 1900s, the town began to experience a period of growth and development. The Georgia State Railroad was extended to Dawson in 1906, and the town was incorporated in 1907.
In the 1920s, Dawson experienced a period of economic decline due to the Great Depression. However, the town was able to recover and experienced a period of growth in the 1950s and 1960s. During this time, the town was home to several manufacturing plants, including a cotton mill and a furniture factory.
Geography
Dawson is located in southwestern Georgia, about 30 miles south of Albany and about 90 miles north of Columbus. The city is situated along the Flint River, which flows through the city. The terrain of the area is mostly flat, with some rolling hills. The climate is humid subtropical, with hot, humid summers and mild winters.
Economy
Dawson's economy is largely based on agriculture and manufacturing. The city is home to several farms, which produce cotton, corn, soybeans, and other crops. The city is also home to several manufacturing plants, including a cotton mill and a furniture factory. In addition, the city is home to several retail stores and restaurants.
Demographics
As of the 2010 census, Dawson had a population of 3,000 people. The racial makeup of the city was 65.3% White, 28.3% African American, 0.3% Native American, 0.7% Asian, and 5.3% from other races. The median household income was $30,000, and the median family income was $35,000. The per capita income was $14,000.
Conclusion
Dawson, Georgia is a small city located in Terrell County in the southwestern part of the state. It is situated along the Flint River, about 30 miles south of Albany and about 90 miles north of Columbus. The city has a population of approximately 3,000 people and covers an area of about 4.5 square miles. The economy of Dawson is largely based on agriculture and manufacturing, and the city is home to several farms, manufacturing plants, retail stores, and restaurants. The racial makeup of the city is 65.3% White, 28.3% African American, 0.3% Native American, 0.7% Asian, and 5.3% from other races. The median household income was $30,000, and the median family income was $35,000.
Common Questions
What is the Total Population of Dawson?
Total Population of Dawson is 4,342.
What is the Total Male Population of Dawson?
Total Male Population of Dawson is 2,156.
What is the Total Female Population of Dawson?
Total Female Population of Dawson is 2,186.
What is the Ratio of Males per 100 Females in Dawson?
There are 98.63 Males per 100 Females in Dawson.
What is the Ratio of Females per 100 Males in Dawson?
There are 101.39 Females per 100 Males in Dawson.
What is the Median Population Age in Dawson?
Median Population Age in Dawson is 33.4 Years.
What is the Average Family Size in Dawson
Average Family Size in Dawson is 3.7 People.
What is the Average Household Size in Dawson
Average Household Size in Dawson is 2.8 People.
What is Per Capita Income in Dawson?
Per Capita income in Dawson is $16,957.
What is the Median Family Income in Dawson?
Median Family Income in Dawson is $34,394.
What is the Median Household income in Dawson?
Median Household Income in Dawson is $31,310.
What is Income or Wage Gap in Dawson?
Income or Wage Gap in Dawson is 3.1%.
Women in Dawson earn 96.9 cents for every dollar earned by a man.
What is Inequality or Gini Index in Dawson?
Inequality or Gini Index in Dawson is 0.50.
How Large is the Labor Force in Dawson?
There are 1,532 People in the Labor Forcein in Dawson.
What is the Percentage of People in the Labor Force in Dawson?
48.3% of People are in the Labor Force in Dawson.
What is the Unemployment Rate in Dawson?
Unemployment Rate in Dawson is 13.6%.