Funston, GA
Funston Map
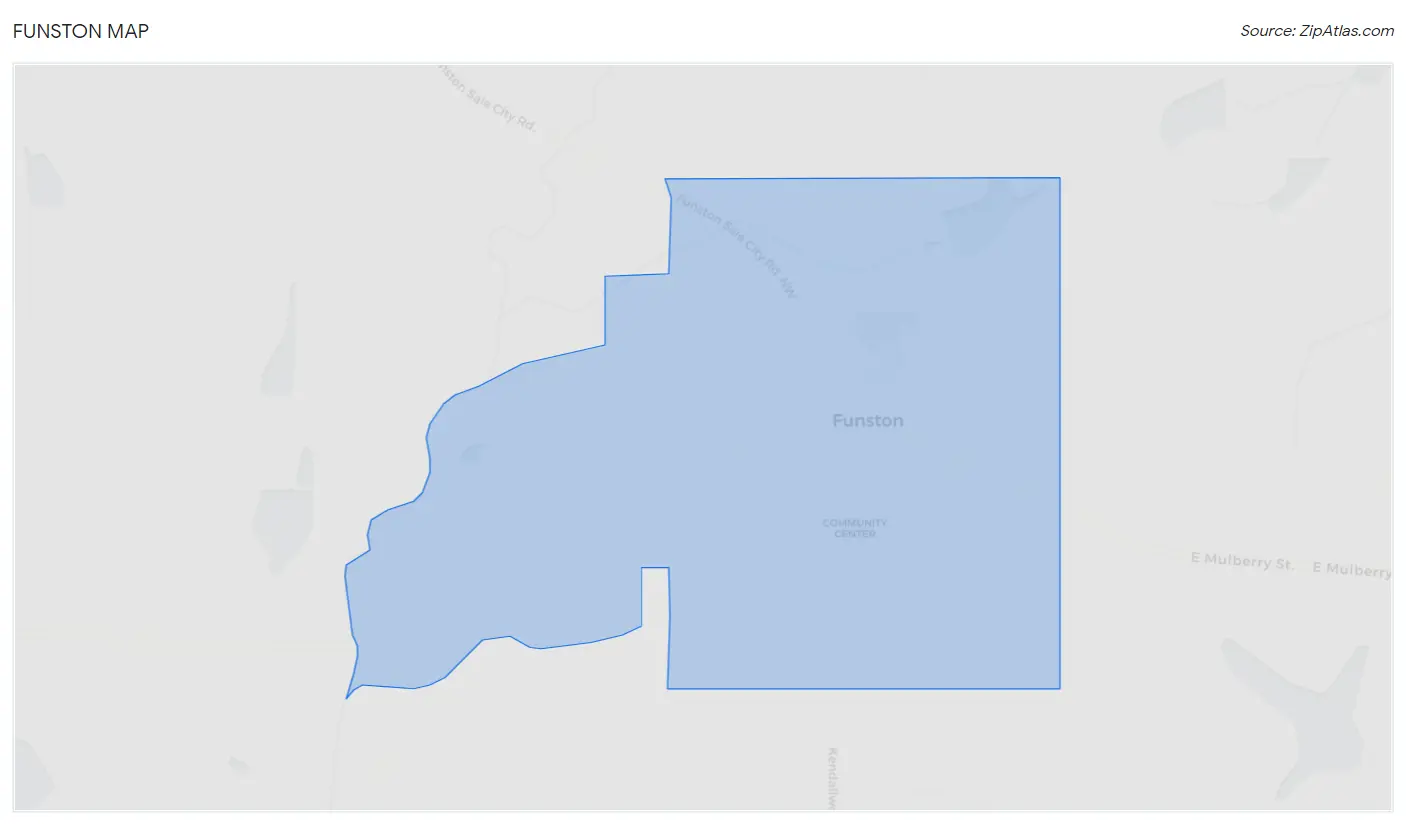
Funston Overview
838
TOTAL POPULATION
421
MALE POPULATION
417
FEMALE POPULATION
100.96
MALES / 100 FEMALES
99.05
FEMALES / 100 MALES
34.4
MEDIAN AGE
4.1
AVG FAMILY SIZE
3.3
AVG HOUSEHOLD SIZE
$20,430
PER CAPITA INCOME
$65,833
AVG FAMILY INCOME
$56,563
AVG HOUSEHOLD INCOME
43.2%
WAGE / INCOME GAP [ % ]
56.8¢/ $1
WAGE / INCOME GAP [ $ ]
0.38
INEQUALITY / GINI INDEX
388
LABOR FORCE [ PEOPLE ]
65.5%
PERCENT IN LABOR FORCE
Funston Zip Codes
Funston Area Codes
Race in Funston
The most populous races in Funston are White / Caucasian (485 | 57.9%), Hispanic or Latino (152 | 18.1%), and Black / African American (125 | 14.9%).
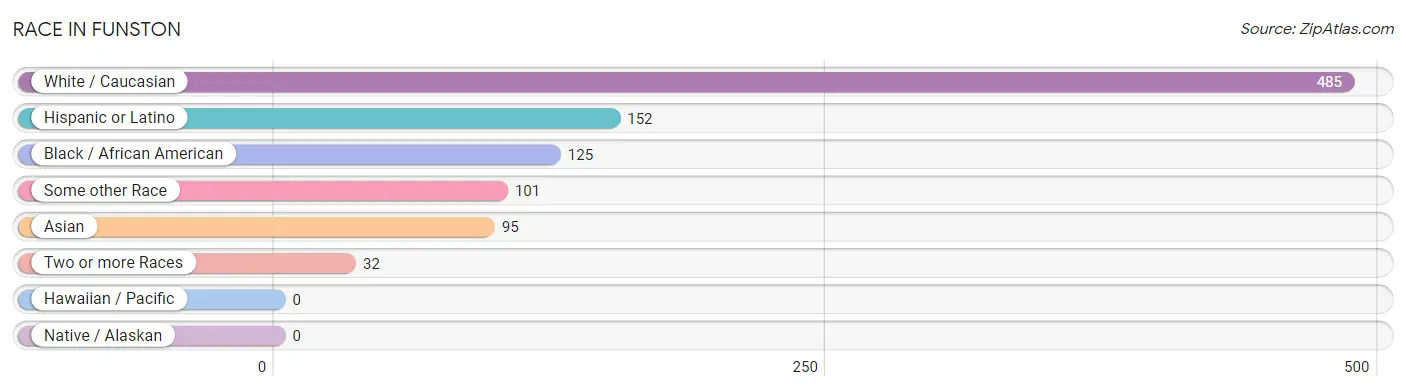
| Race | # Population | % Population |
| Asian | 95 | 11.3% |
| Black / African American | 125 | 14.9% |
| Hawaiian / Pacific | 0 | 0.0% |
| Hispanic or Latino | 152 | 18.1% |
| Native / Alaskan | 0 | 0.0% |
| White / Caucasian | 485 | 57.9% |
| Two or more Races | 32 | 3.8% |
| Some other Race | 101 | 12.0% |
| Total | 838 | 100.0% |
Ancestry in Funston
The most populous ancestries reported in Funston are American (141 | 16.8%), Mexican (124 | 14.8%), Indian (Asian) (95 | 11.3%), Irish (82 | 9.8%), and English (80 | 9.6%), together accounting for 62.3% of all Funston residents.
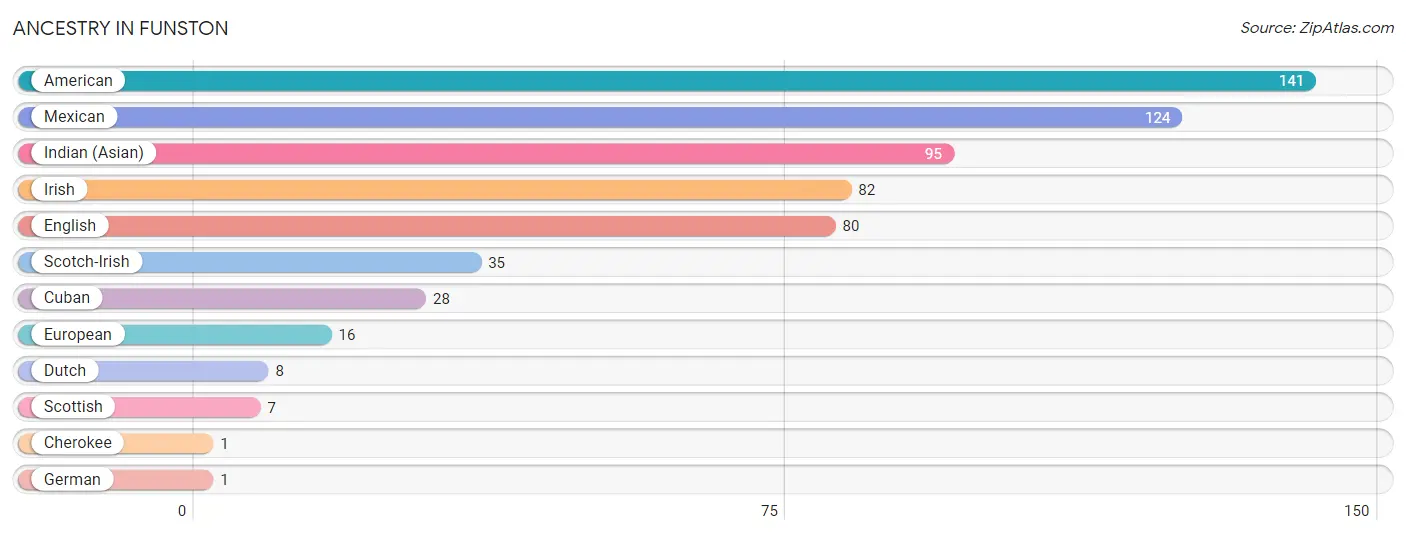
| Ancestry | # Population | % Population |
| American | 141 | 16.8% |
| Cherokee | 1 | 0.1% |
| Cuban | 28 | 3.3% |
| Dutch | 8 | 0.9% |
| English | 80 | 9.6% |
| European | 16 | 1.9% |
| German | 1 | 0.1% |
| Indian (Asian) | 95 | 11.3% |
| Irish | 82 | 9.8% |
| Mexican | 124 | 14.8% |
| Scotch-Irish | 35 | 4.2% |
| Scottish | 7 | 0.8% | View All 12 Rows |
Immigrants in Funston
The most numerous immigrant groups reported in Funston came from Latin America (74 | 8.8%), Asia (54 | 6.4%), China (54 | 6.4%), Eastern Asia (54 | 6.4%), and Central America (46 | 5.5%), together accounting for 33.6% of all Funston residents.
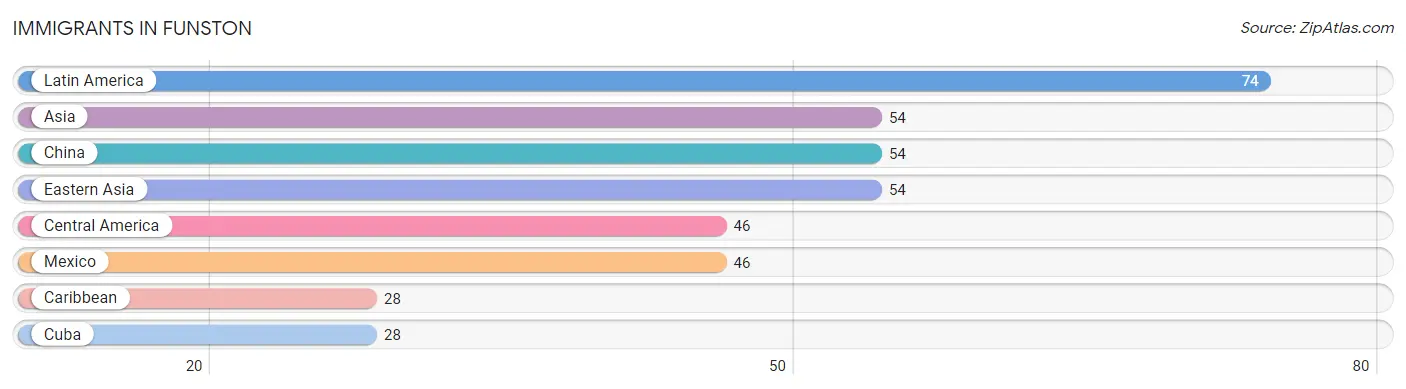
| Immigration Origin | # Population | % Population |
| Asia | 54 | 6.4% |
| Caribbean | 28 | 3.3% |
| Central America | 46 | 5.5% |
| China | 54 | 6.4% |
| Cuba | 28 | 3.3% |
| Eastern Asia | 54 | 6.4% |
| Latin America | 74 | 8.8% |
| Mexico | 46 | 5.5% | View All 8 Rows |
Sex and Age in Funston
Sex and Age in Funston
The most populous age groups in Funston are Under 5 Years (55 | 13.1%) for men and 45 to 49 Years (83 | 19.9%) for women.
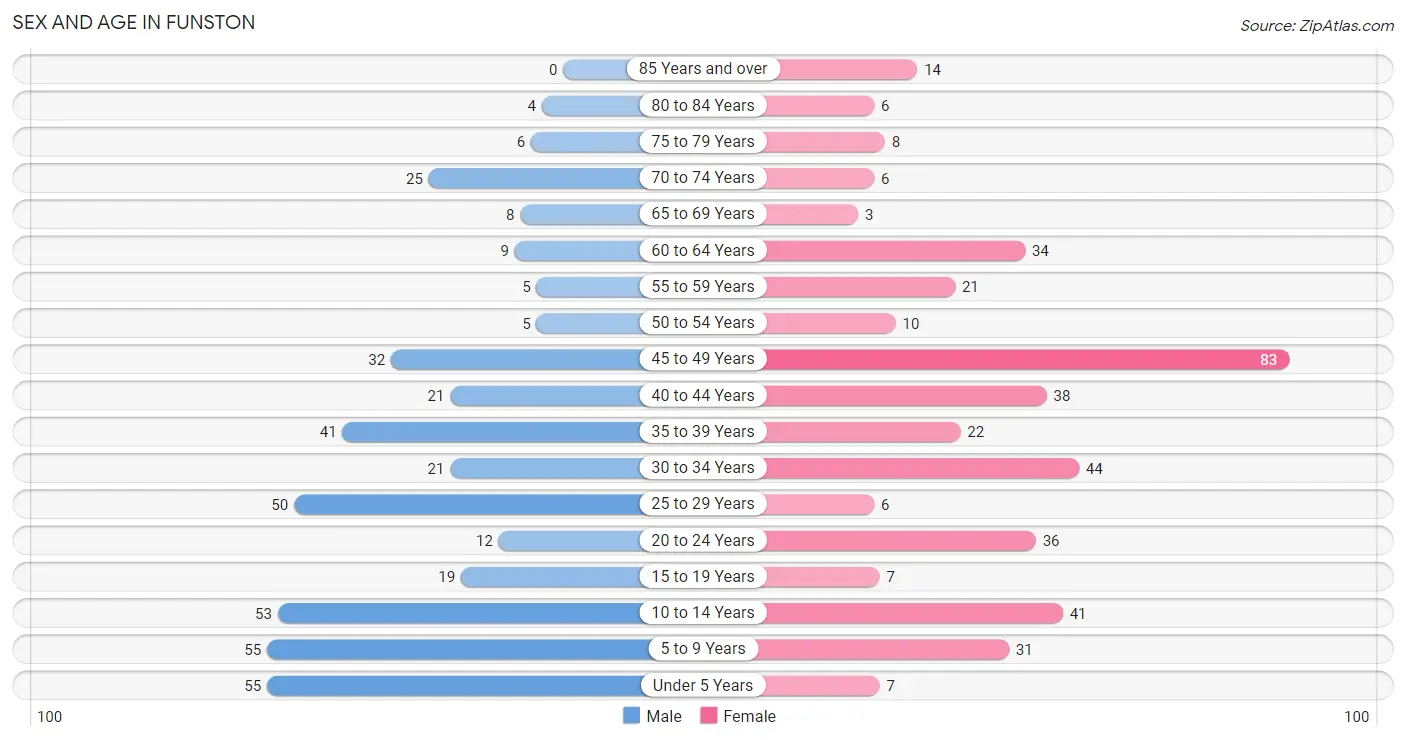
| Age Bracket | Male | Female |
| Under 5 Years | 55 (13.1%) | 7 (1.7%) |
| 5 to 9 Years | 55 (13.1%) | 31 (7.4%) |
| 10 to 14 Years | 53 (12.6%) | 41 (9.8%) |
| 15 to 19 Years | 19 (4.5%) | 7 (1.7%) |
| 20 to 24 Years | 12 (2.9%) | 36 (8.6%) |
| 25 to 29 Years | 50 (11.9%) | 6 (1.4%) |
| 30 to 34 Years | 21 (5.0%) | 44 (10.5%) |
| 35 to 39 Years | 41 (9.7%) | 22 (5.3%) |
| 40 to 44 Years | 21 (5.0%) | 38 (9.1%) |
| 45 to 49 Years | 32 (7.6%) | 83 (19.9%) |
| 50 to 54 Years | 5 (1.2%) | 10 (2.4%) |
| 55 to 59 Years | 5 (1.2%) | 21 (5.0%) |
| 60 to 64 Years | 9 (2.1%) | 34 (8.2%) |
| 65 to 69 Years | 8 (1.9%) | 3 (0.7%) |
| 70 to 74 Years | 25 (5.9%) | 6 (1.4%) |
| 75 to 79 Years | 6 (1.4%) | 8 (1.9%) |
| 80 to 84 Years | 4 (0.9%) | 6 (1.4%) |
| 85 Years and over | 0 (0.0%) | 14 (3.4%) |
| Total | 421 (100.0%) | 417 (100.0%) |
Families and Households in Funston
Median Family Size in Funston
The median family size in Funston is 4.11 persons per family, with single female/mother families (31 | 17.2%) accounting for the largest median family size of 6 persons per family. On the other hand, single male/father families (9 | 5.0%) represent the smallest median family size with 2.11 persons per family.
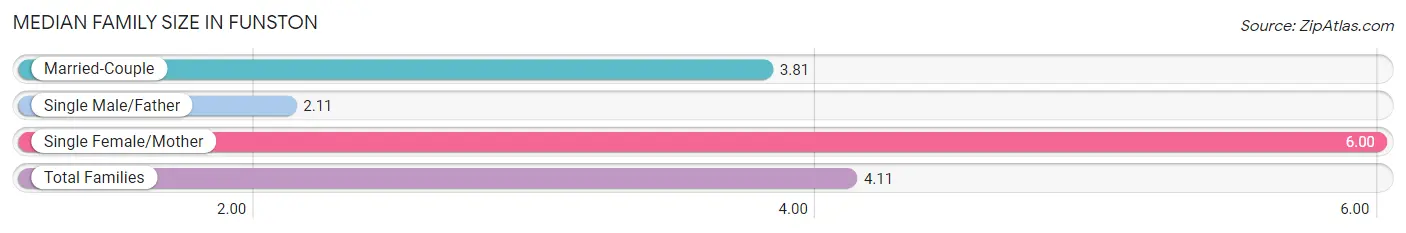
| Family Type | # Families | Family Size |
| Married-Couple | 140 (77.8%) | 3.81 |
| Single Male/Father | 9 (5.0%) | 2.11 |
| Single Female/Mother | 31 (17.2%) | 6.00 |
| Total Families | 180 (100.0%) | 4.11 |
Median Household Size in Funston
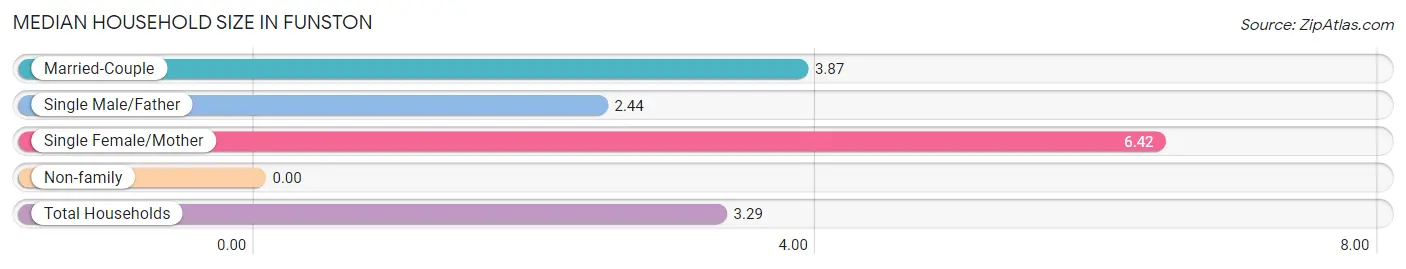
| Household Type | # Households | Household Size |
| Married-Couple | 140 (54.9%) | 3.87 |
| Single Male/Father | 9 (3.5%) | 2.44 |
| Single Female/Mother | 31 (12.2%) | 6.42 |
| Non-family | 75 (29.4%) | - |
| Total Households | 255 (100.0%) | 3.29 |
Household Size by Marriage Status in Funston
Out of a total of 255 households in Funston, 180 (70.6%) are family households, while 75 (29.4%) are nonfamily households. The most numerous type of family households are 2-person households, comprising 69, and the most common type of nonfamily households are 1-person households, comprising 75.
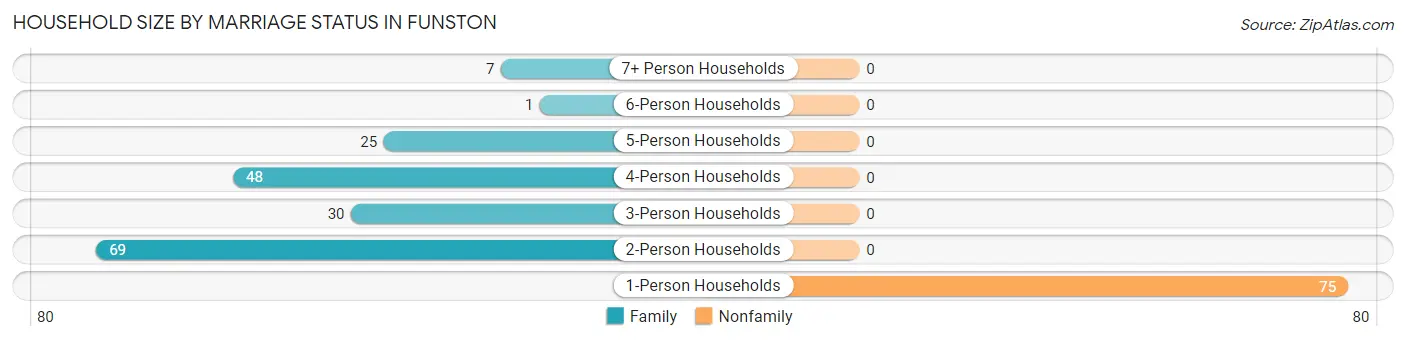
| Household Size | Family Households | Nonfamily Households |
| 1-Person Households | - | 75 (29.4%) |
| 2-Person Households | 69 (27.1%) | 0 (0.0%) |
| 3-Person Households | 30 (11.8%) | 0 (0.0%) |
| 4-Person Households | 48 (18.8%) | 0 (0.0%) |
| 5-Person Households | 25 (9.8%) | 0 (0.0%) |
| 6-Person Households | 1 (0.4%) | 0 (0.0%) |
| 7+ Person Households | 7 (2.8%) | 0 (0.0%) |
| Total | 180 (70.6%) | 75 (29.4%) |
Female Fertility in Funston
Fertility by Age in Funston
Average fertility rate in Funston is 50.0 births per 1,000 women. Women in the age bracket of 20 to 34 years have the highest fertility rate with 140.0 births per 1,000 women. Women in the age bracket of 20 to 34 years acount for 100.0% of all women with births.
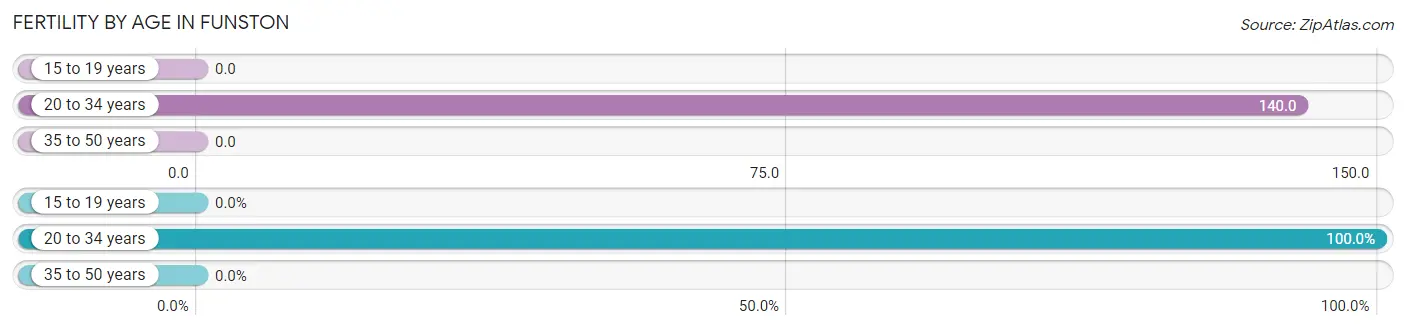
| Age Bracket | Women with Births | Births / 1,000 Women |
| 15 to 19 years | 0 (0.0%) | 0.0 |
| 20 to 34 years | 12 (100.0%) | 140.0 |
| 35 to 50 years | 0 (0.0%) | 0.0 |
| Total | 12 (100.0%) | 50.0 |
Fertility by Age by Marriage Status in Funston
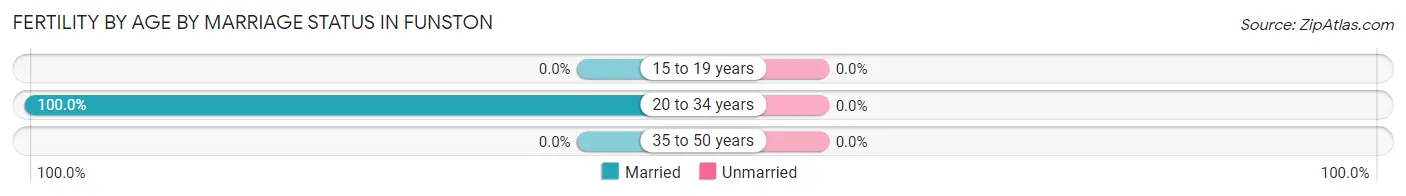
| Age Bracket | Married | Unmarried |
| 15 to 19 years | 0 (0.0%) | 0 (0.0%) |
| 20 to 34 years | 12 (100.0%) | 0 (0.0%) |
| 35 to 50 years | 0 (0.0%) | 0 (0.0%) |
| Total | 12 (100.0%) | 0 (0.0%) |
Fertility by Education in Funston
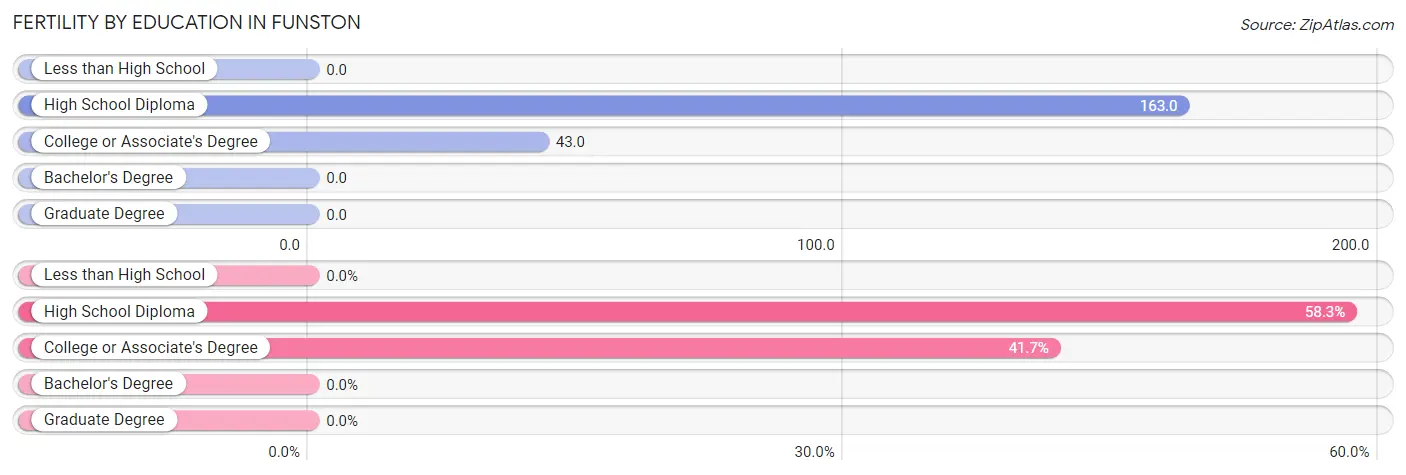
| Educational Attainment | Women with Births | Births / 1,000 Women |
| Less than High School | 0 (0.0%) | 0.0 |
| High School Diploma | 7 (58.3%) | 163.0 |
| College or Associate's Degree | 5 (41.7%) | 43.0 |
| Bachelor's Degree | 0 (0.0%) | 0.0 |
| Graduate Degree | 0 (0.0%) | 0.0 |
| Total | 12 (100.0%) | 50.0 |
Fertility by Education by Marriage Status in Funston
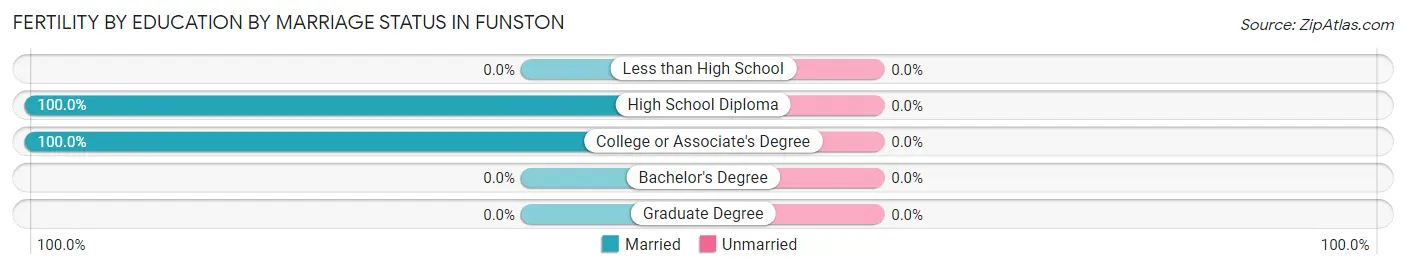
| Educational Attainment | Married | Unmarried |
| Less than High School | 0 (0.0%) | 0 (0.0%) |
| High School Diploma | 7 (100.0%) | 0 (0.0%) |
| College or Associate's Degree | 5 (100.0%) | 0 (0.0%) |
| Bachelor's Degree | 0 (0.0%) | 0 (0.0%) |
| Graduate Degree | 0 (0.0%) | 0 (0.0%) |
| Total | 12 (100.0%) | 0 (0.0%) |
Income in Funston
Income Overview in Funston
Per Capita Income in Funston is $20,430, while median incomes of families and households are $65,833 and $56,563 respectively.
| Characteristic | Number | Measure |
| Per Capita Income | 838 | $20,430 |
| Median Family Income | 180 | $65,833 |
| Mean Family Income | 180 | $71,001 |
| Median Household Income | 255 | $56,563 |
| Mean Household Income | 255 | $62,315 |
| Income Deficit | 180 | $0 |
| Wage / Income Gap (%) | 838 | 43.15% |
| Wage / Income Gap ($) | 838 | 56.85¢ per $1 |
| Gini / Inequality Index | 838 | 0.38 |
Earnings by Sex in Funston
Average Earnings in Funston are $32,310, $37,717 for men and $21,442 for women, a difference of 43.1%.
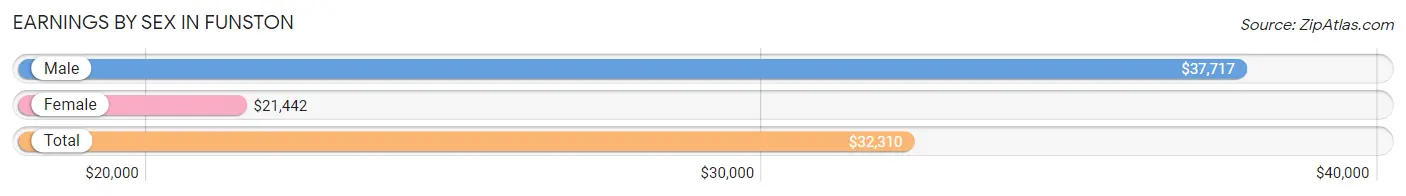
| Sex | Number | Average Earnings |
| Male | 190 (46.5%) | $37,717 |
| Female | 219 (53.5%) | $21,442 |
| Total | 409 (100.0%) | $32,310 |
Earnings by Sex by Income Bracket in Funston
The most common earnings brackets in Funston are $30,000 to $34,999 for men (47 | 24.7%) and $15,000 to $17,499 for women (47 | 21.5%).
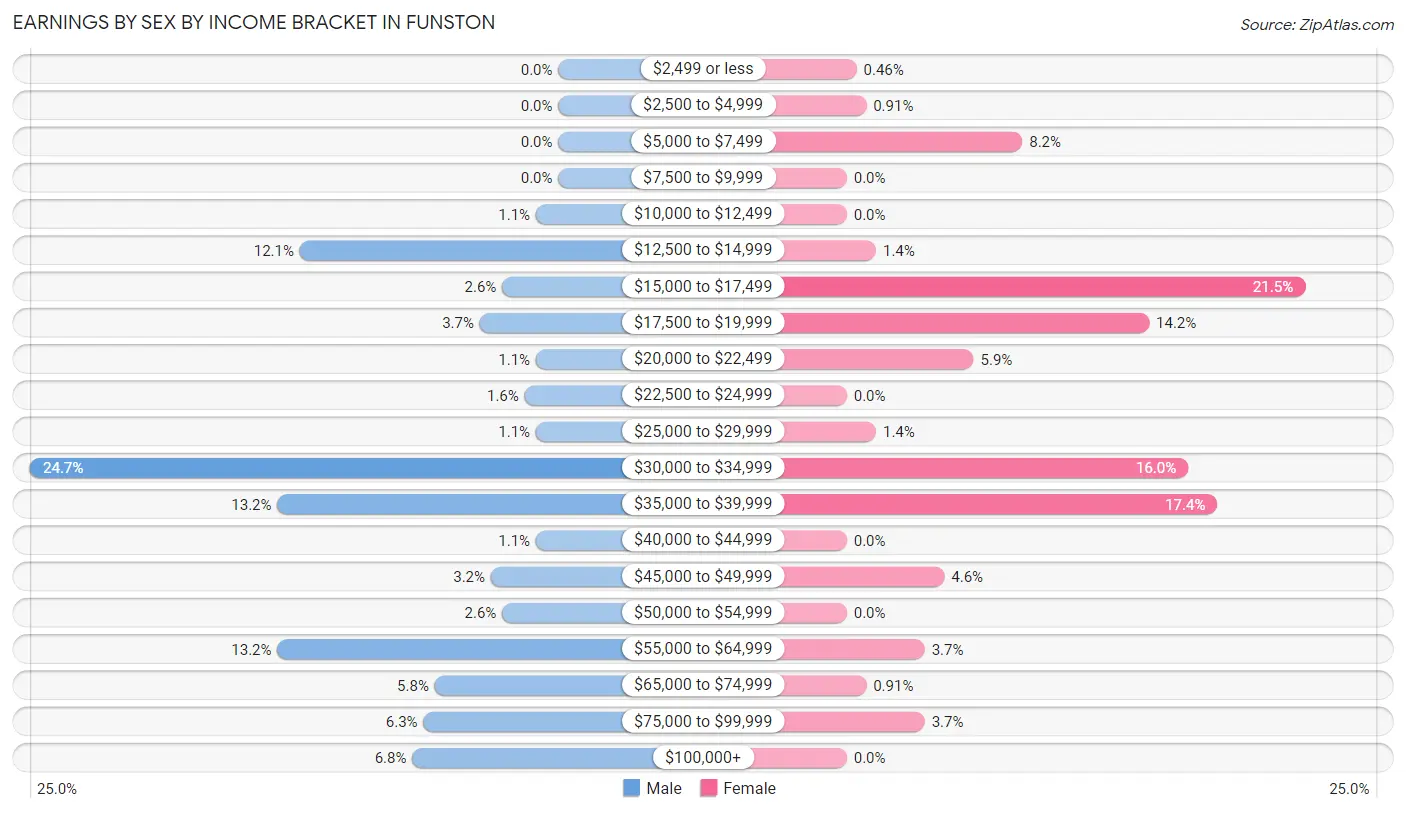
| Income | Male | Female |
| $2,499 or less | 0 (0.0%) | 1 (0.5%) |
| $2,500 to $4,999 | 0 (0.0%) | 2 (0.9%) |
| $5,000 to $7,499 | 0 (0.0%) | 18 (8.2%) |
| $7,500 to $9,999 | 0 (0.0%) | 0 (0.0%) |
| $10,000 to $12,499 | 2 (1.1%) | 0 (0.0%) |
| $12,500 to $14,999 | 23 (12.1%) | 3 (1.4%) |
| $15,000 to $17,499 | 5 (2.6%) | 47 (21.5%) |
| $17,500 to $19,999 | 7 (3.7%) | 31 (14.2%) |
| $20,000 to $22,499 | 2 (1.1%) | 13 (5.9%) |
| $22,500 to $24,999 | 3 (1.6%) | 0 (0.0%) |
| $25,000 to $29,999 | 2 (1.1%) | 3 (1.4%) |
| $30,000 to $34,999 | 47 (24.7%) | 35 (16.0%) |
| $35,000 to $39,999 | 25 (13.2%) | 38 (17.3%) |
| $40,000 to $44,999 | 2 (1.1%) | 0 (0.0%) |
| $45,000 to $49,999 | 6 (3.2%) | 10 (4.6%) |
| $50,000 to $54,999 | 5 (2.6%) | 0 (0.0%) |
| $55,000 to $64,999 | 25 (13.2%) | 8 (3.6%) |
| $65,000 to $74,999 | 11 (5.8%) | 2 (0.9%) |
| $75,000 to $99,999 | 12 (6.3%) | 8 (3.6%) |
| $100,000+ | 13 (6.8%) | 0 (0.0%) |
| Total | 190 (100.0%) | 219 (100.0%) |
Earnings by Sex by Educational Attainment in Funston
Average earnings in Funston are $37,717 for men and $31,071 for women, a difference of 17.6%. Men with an educational attainment of less than high school enjoy the highest average annual earnings of $38,235, while those with less than high school education earn the least with $38,235. Women with an educational attainment of high school diploma earn the most with the average annual earnings of $32,917, while those with college or associate's degree education have the smallest earnings of $20,481.
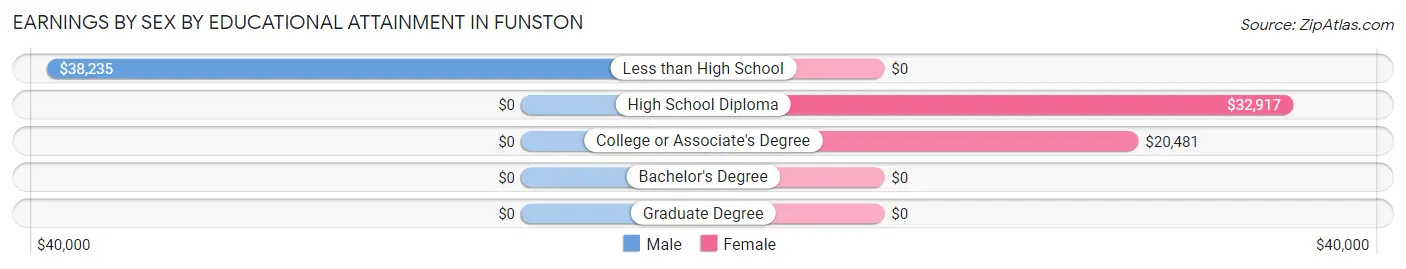
| Educational Attainment | Male Income | Female Income |
| Less than High School | $38,235 | $0 |
| High School Diploma | - | - |
| College or Associate's Degree | - | - |
| Bachelor's Degree | - | - |
| Graduate Degree | - | - |
| Total | $37,717 | $31,071 |
Family Income in Funston
Family Income Brackets in Funston
According to the Funston family income data, there are 58 families falling into the $50,000 to $74,999 income range, which is the most common income bracket and makes up 32.2% of all families.
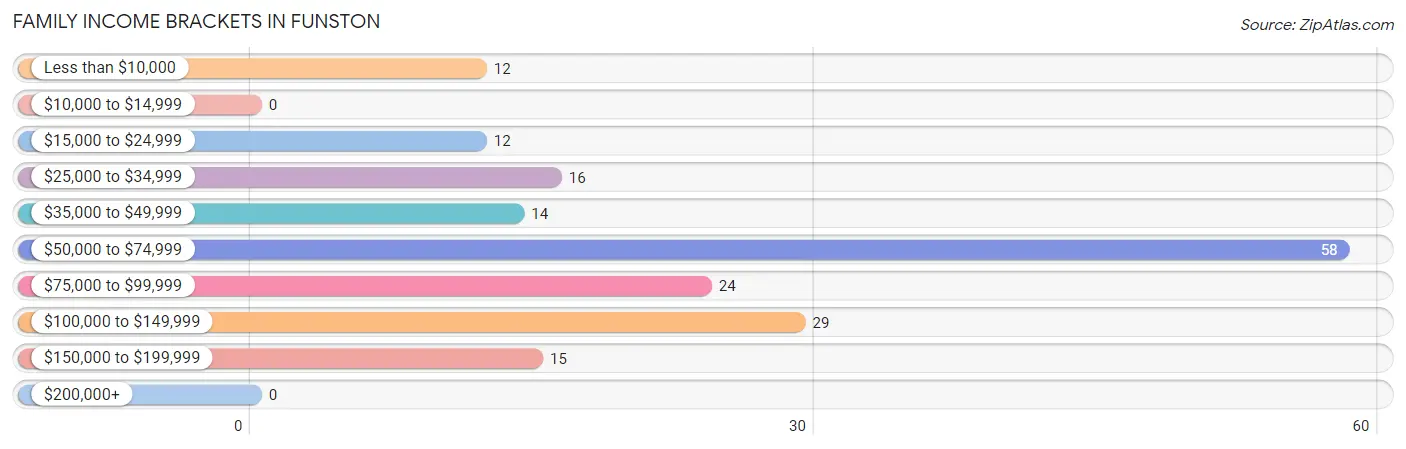
| Income Bracket | # Families | % Families |
| Less than $10,000 | 12 | 6.7% |
| $10,000 to $14,999 | 0 | 0.0% |
| $15,000 to $24,999 | 12 | 6.7% |
| $25,000 to $34,999 | 16 | 8.9% |
| $35,000 to $49,999 | 14 | 7.8% |
| $50,000 to $74,999 | 58 | 32.2% |
| $75,000 to $99,999 | 24 | 13.3% |
| $100,000 to $149,999 | 29 | 16.1% |
| $150,000 to $199,999 | 15 | 8.3% |
| $200,000+ | 0 | 0.0% |
Family Income by Famaliy Size in Funston
4-person families (34 | 18.9%) account for the highest median family income in Funston with $83,333 per family, while 4-person families (34 | 18.9%) have the highest median income of $20,833 per family member.
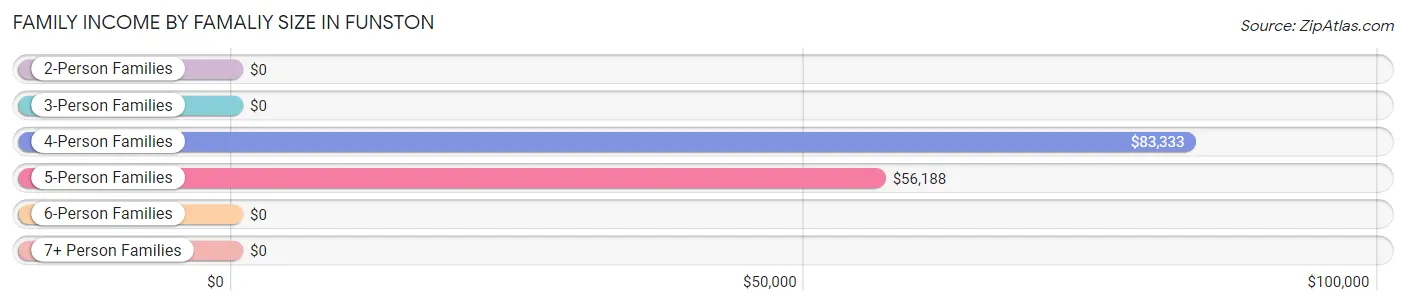
| Income Bracket | # Families | Median Income |
| 2-Person Families | 72 (40.0%) | $0 |
| 3-Person Families | 41 (22.8%) | $0 |
| 4-Person Families | 34 (18.9%) | $83,333 |
| 5-Person Families | 25 (13.9%) | $56,188 |
| 6-Person Families | 1 (0.6%) | $0 |
| 7+ Person Families | 7 (3.9%) | $0 |
| Total | 180 (100.0%) | $65,833 |
Family Income by Number of Earners in Funston
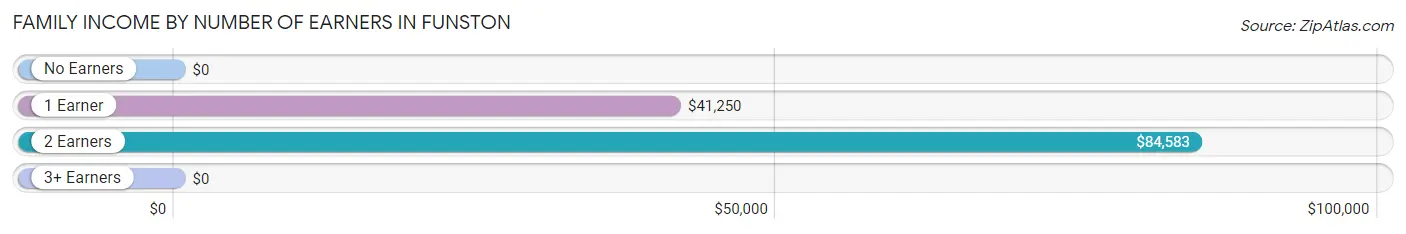
| Number of Earners | # Families | Median Income |
| No Earners | 32 (17.8%) | $0 |
| 1 Earner | 35 (19.4%) | $41,250 |
| 2 Earners | 104 (57.8%) | $84,583 |
| 3+ Earners | 9 (5.0%) | $0 |
| Total | 180 (100.0%) | $65,833 |
Household Income in Funston
Household Income Brackets in Funston
With 61 households falling in the category, the $50,000 to $74,999 income range is the most frequent in Funston, accounting for 23.9% of all households.
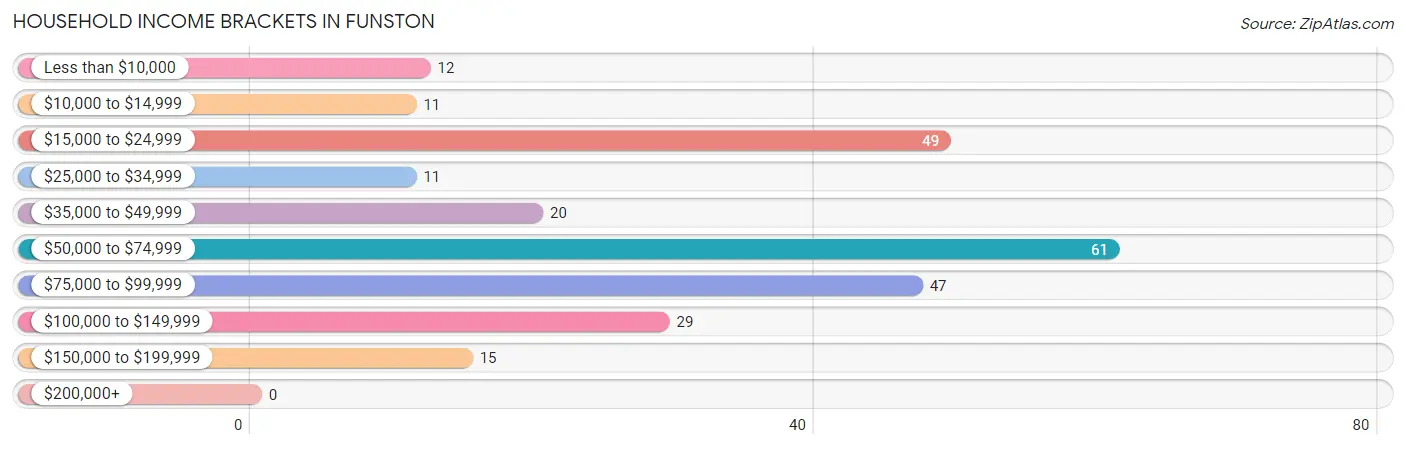
| Income Bracket | # Households | % Households |
| Less than $10,000 | 12 | 4.7% |
| $10,000 to $14,999 | 11 | 4.3% |
| $15,000 to $24,999 | 49 | 19.2% |
| $25,000 to $34,999 | 11 | 4.3% |
| $35,000 to $49,999 | 20 | 7.8% |
| $50,000 to $74,999 | 61 | 23.9% |
| $75,000 to $99,999 | 47 | 18.4% |
| $100,000 to $149,999 | 29 | 11.4% |
| $150,000 to $199,999 | 15 | 5.9% |
| $200,000+ | 0 | 0.0% |
Household Income by Householder Age in Funston
The median household income in Funston is $56,563, with the highest median household income of $76,750 found in the 25 to 44 years age bracket for the primary householder. A total of 95 households (37.2%) fall into this category. Meanwhile, the 15 to 24 years age bracket for the primary householder has the lowest median household income of $0, with 3 households (1.2%) in this group.
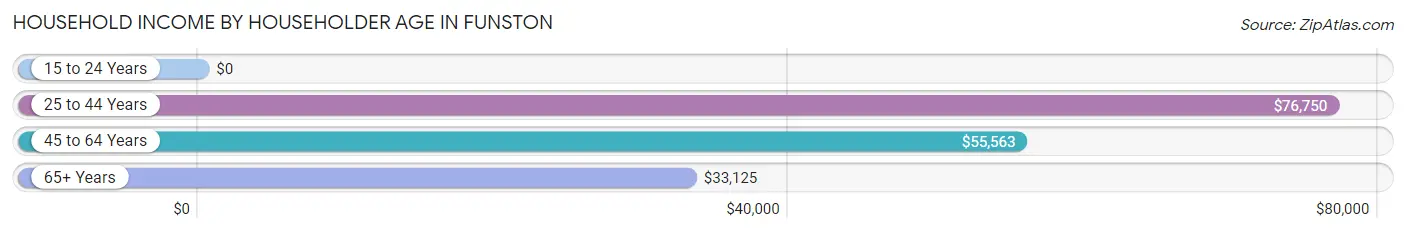
| Income Bracket | # Households | Median Income |
| 15 to 24 Years | 3 (1.2%) | $0 |
| 25 to 44 Years | 95 (37.2%) | $76,750 |
| 45 to 64 Years | 113 (44.3%) | $55,563 |
| 65+ Years | 44 (17.2%) | $33,125 |
| Total | 255 (100.0%) | $56,563 |
Poverty in Funston
Income Below Poverty by Sex and Age in Funston
With 6.2% poverty level for males and 11.0% for females among the residents of Funston, 15 year old males and under 5 year old females are the most vulnerable to poverty, with 4 males (100.0%) and 4 females (57.1%) in their respective age groups living below the poverty level.
| Age Bracket | Male | Female |
| Under 5 Years | 2 (3.6%) | 4 (57.1%) |
| 5 Years | 0 (0.0%) | 0 (0.0%) |
| 6 to 11 Years | 2 (2.9%) | 0 (0.0%) |
| 12 to 14 Years | 0 (0.0%) | 0 (0.0%) |
| 15 Years | 4 (100.0%) | 0 (0.0%) |
| 16 and 17 Years | 0 (0.0%) | 0 (0.0%) |
| 18 to 24 Years | 0 (0.0%) | 0 (0.0%) |
| 25 to 34 Years | 8 (11.3%) | 9 (18.0%) |
| 35 to 44 Years | 9 (14.5%) | 13 (21.7%) |
| 45 to 54 Years | 1 (2.7%) | 7 (7.5%) |
| 55 to 64 Years | 0 (0.0%) | 4 (7.3%) |
| 65 to 74 Years | 0 (0.0%) | 5 (55.6%) |
| 75 Years and over | 0 (0.0%) | 4 (14.3%) |
| Total | 26 (6.2%) | 46 (11.0%) |
Income Above Poverty by Sex and Age in Funston
According to the poverty statistics in Funston, males aged 5 years and females aged 5 years are the age groups that are most secure financially, with 100.0% of males and 100.0% of females in these age groups living above the poverty line.
| Age Bracket | Male | Female |
| Under 5 Years | 53 (96.4%) | 3 (42.9%) |
| 5 Years | 20 (100.0%) | 13 (100.0%) |
| 6 to 11 Years | 66 (97.1%) | 35 (100.0%) |
| 12 to 14 Years | 20 (100.0%) | 24 (100.0%) |
| 15 Years | 0 (0.0%) | 0 (0.0%) |
| 16 and 17 Years | 0 (0.0%) | 0 (0.0%) |
| 18 to 24 Years | 27 (100.0%) | 43 (100.0%) |
| 25 to 34 Years | 63 (88.7%) | 41 (82.0%) |
| 35 to 44 Years | 53 (85.5%) | 47 (78.3%) |
| 45 to 54 Years | 36 (97.3%) | 86 (92.5%) |
| 55 to 64 Years | 14 (100.0%) | 51 (92.7%) |
| 65 to 74 Years | 33 (100.0%) | 4 (44.4%) |
| 75 Years and over | 10 (100.0%) | 24 (85.7%) |
| Total | 395 (93.8%) | 371 (89.0%) |
Income Below Poverty Among Married-Couple Families in Funston
The poverty statistics for married-couple families in Funston show that 0.7% or 1 of the total 140 families live below the poverty line. Families with 1 or 2 children have the highest poverty rate of 1.7%, comprising of 1 families. On the other hand, families with no children have the lowest poverty rate of 0.0%, which includes 0 families.
| Children | Above Poverty | Below Poverty |
| No Children | 70 (100.0%) | 0 (0.0%) |
| 1 or 2 Children | 59 (98.3%) | 1 (1.7%) |
| 3 or 4 Children | 10 (100.0%) | 0 (0.0%) |
| 5 or more Children | 0 (0.0%) | 0 (0.0%) |
| Total | 139 (99.3%) | 1 (0.7%) |
Income Below Poverty Among Single-Parent Households in Funston
According to the poverty data in Funston, 66.7% or 6 single-father households and 45.2% or 14 single-mother households are living below the poverty line. Among single-father households, those with no children have the highest poverty rate, with 6 households (100.0%) experiencing poverty. Likewise, among single-mother households, those with no children have the highest poverty rate, with 2 households (100.0%) falling below the poverty line.
| Children | Single Father | Single Mother |
| No Children | 6 (100.0%) | 2 (100.0%) |
| 1 or 2 Children | 0 (0.0%) | 12 (41.4%) |
| 3 or 4 Children | 0 (0.0%) | 0 (0.0%) |
| 5 or more Children | 0 (0.0%) | 0 (0.0%) |
| Total | 6 (66.7%) | 14 (45.2%) |
Income Below Poverty Among Married-Couple vs Single-Parent Households in Funston
The poverty data for Funston shows that 1 of the married-couple family households (0.7%) and 20 of the single-parent households (50.0%) are living below the poverty level. Within the married-couple family households, those with 1 or 2 children have the highest poverty rate, with 1 households (1.7%) falling below the poverty line. Among the single-parent households, those with no children have the highest poverty rate, with 8 household (100.0%) living below poverty.
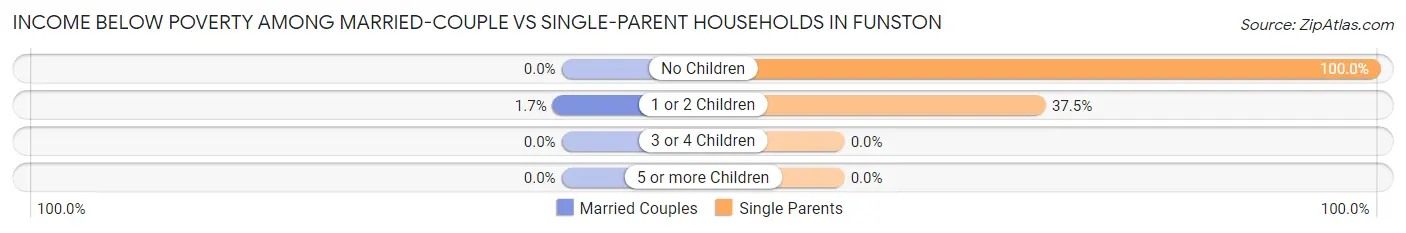
| Children | Married-Couple Families | Single-Parent Households |
| No Children | 0 (0.0%) | 8 (100.0%) |
| 1 or 2 Children | 1 (1.7%) | 12 (37.5%) |
| 3 or 4 Children | 0 (0.0%) | 0 (0.0%) |
| 5 or more Children | 0 (0.0%) | 0 (0.0%) |
| Total | 1 (0.7%) | 20 (50.0%) |
Employment Characteristics in Funston
Employment by Class of Employer in Funston
Among the 388 employed individuals in Funston, private company employees (263 | 67.8%), state government employees (42 | 10.8%), and self-employed (incorporated) (31 | 8.0%) make up the most common classes of employment.
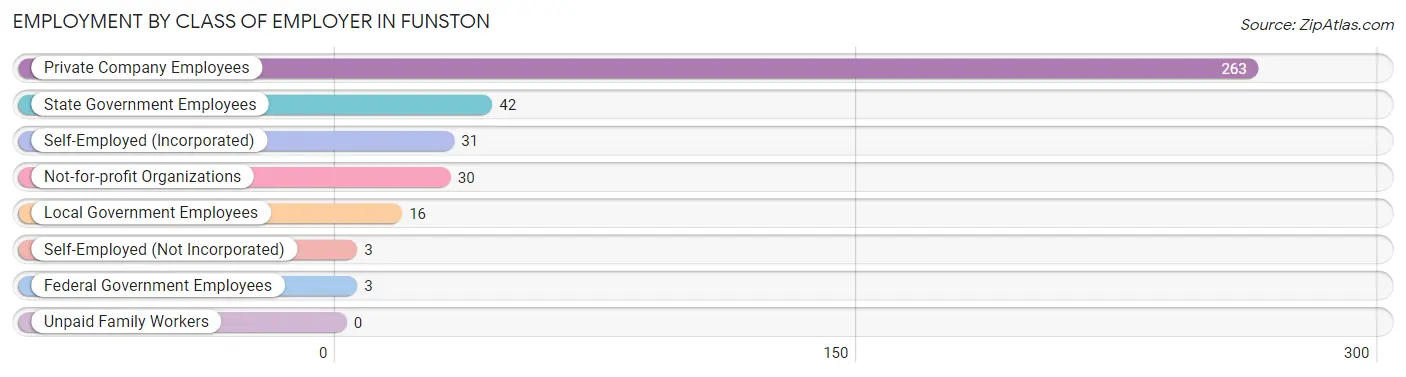
| Employer Class | # Employees | % Employees |
| Private Company Employees | 263 | 67.8% |
| Self-Employed (Incorporated) | 31 | 8.0% |
| Self-Employed (Not Incorporated) | 3 | 0.8% |
| Not-for-profit Organizations | 30 | 7.7% |
| Local Government Employees | 16 | 4.1% |
| State Government Employees | 42 | 10.8% |
| Federal Government Employees | 3 | 0.8% |
| Unpaid Family Workers | 0 | 0.0% |
| Total | 388 | 100.0% |
Employment Status by Age in Funston
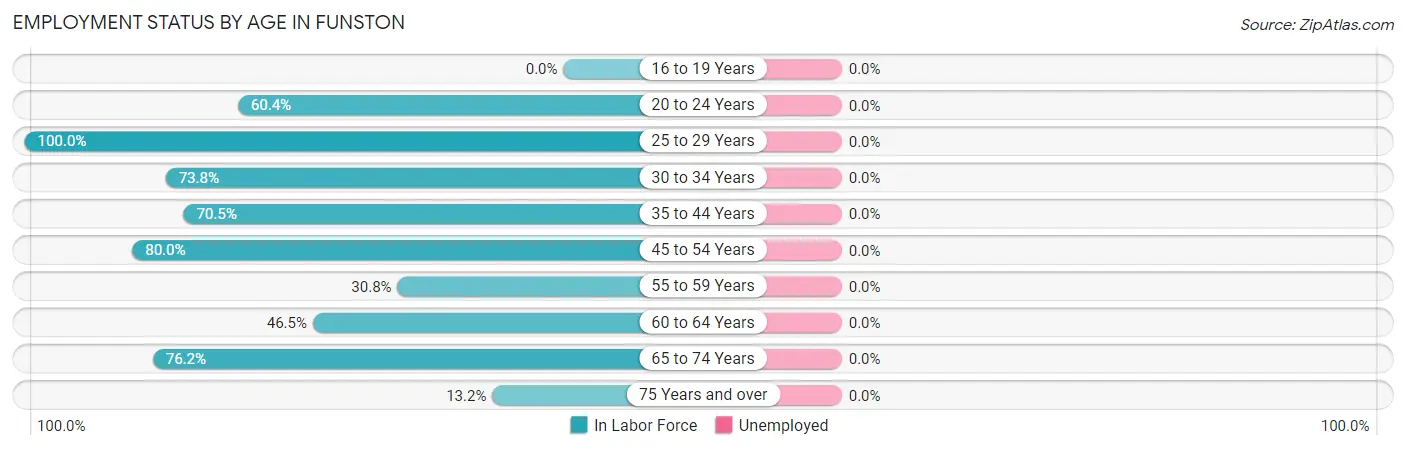
| Age Bracket | In Labor Force | Unemployed |
| 16 to 19 Years | 0 (0.0%) | 0 (0.0%) |
| 20 to 24 Years | 29 (60.4%) | 0 (0.0%) |
| 25 to 29 Years | 56 (100.0%) | 0 (0.0%) |
| 30 to 34 Years | 48 (73.8%) | 0 (0.0%) |
| 35 to 44 Years | 86 (70.5%) | 0 (0.0%) |
| 45 to 54 Years | 104 (80.0%) | 0 (0.0%) |
| 55 to 59 Years | 8 (30.8%) | 0 (0.0%) |
| 60 to 64 Years | 20 (46.5%) | 0 (0.0%) |
| 65 to 74 Years | 32 (76.2%) | 0 (0.0%) |
| 75 Years and over | 5 (13.2%) | 0 (0.0%) |
| Total | 388 (65.5%) | 0 (0.0%) |
Employment Status by Educational Attainment in Funston
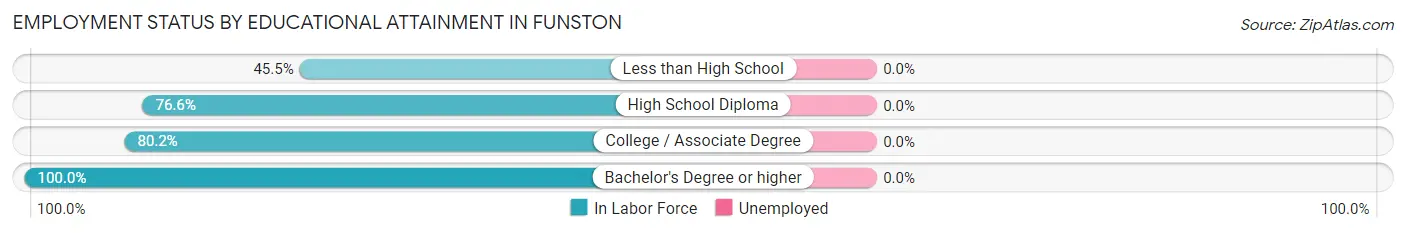
| Educational Attainment | In Labor Force | Unemployed |
| Less than High School | 46 (45.5%) | 0 (0.0%) |
| High School Diploma | 105 (76.6%) | 0 (0.0%) |
| College / Associate Degree | 134 (80.2%) | 0 (0.0%) |
| Bachelor's Degree or higher | 37 (100.0%) | 0 (0.0%) |
| Total | 322 (72.9%) | 0 (0.0%) |
Employment Occupations by Sex in Funston
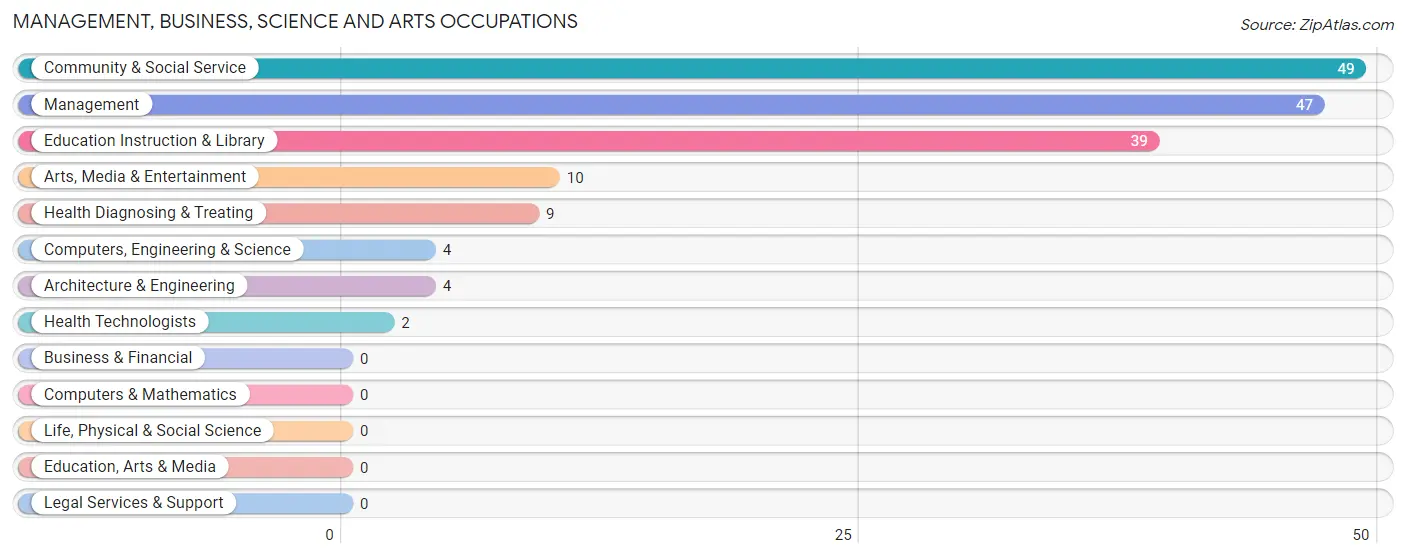
Management, Business, Science and Arts Occupations
The most common Management, Business, Science and Arts occupations in Funston are Community & Social Service (49 | 12.6%), Management (47 | 12.1%), Education Instruction & Library (39 | 10.1%), Arts, Media & Entertainment (10 | 2.6%), and Health Diagnosing & Treating (9 | 2.3%).
Management, Business, Science and Arts Occupations by Sex
Within the Management, Business, Science and Arts occupations in Funston, the most male-oriented occupations are Computers, Engineering & Science (100.0%), Architecture & Engineering (100.0%), and Arts, Media & Entertainment (100.0%), while the most female-oriented occupations are Education Instruction & Library (100.0%), Health Diagnosing & Treating (100.0%), and Health Technologists (100.0%).
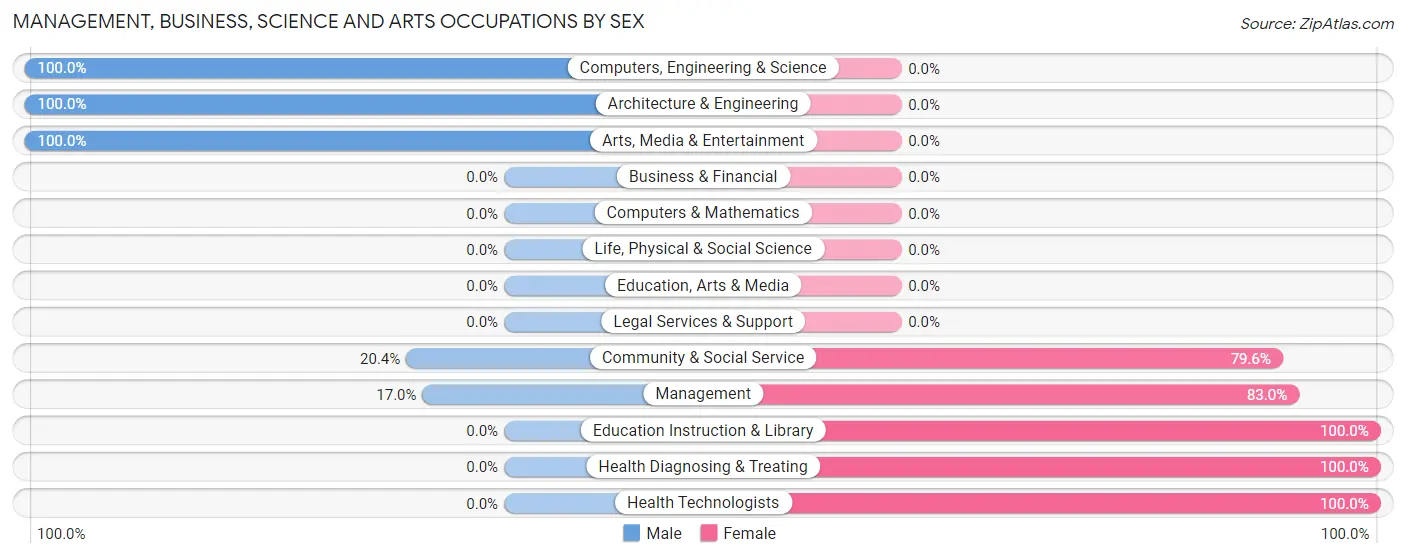
| Occupation | Male | Female |
| Management | 8 (17.0%) | 39 (83.0%) |
| Business & Financial | 0 (0.0%) | 0 (0.0%) |
| Computers, Engineering & Science | 4 (100.0%) | 0 (0.0%) |
| Computers & Mathematics | 0 (0.0%) | 0 (0.0%) |
| Architecture & Engineering | 4 (100.0%) | 0 (0.0%) |
| Life, Physical & Social Science | 0 (0.0%) | 0 (0.0%) |
| Community & Social Service | 10 (20.4%) | 39 (79.6%) |
| Education, Arts & Media | 0 (0.0%) | 0 (0.0%) |
| Legal Services & Support | 0 (0.0%) | 0 (0.0%) |
| Education Instruction & Library | 0 (0.0%) | 39 (100.0%) |
| Arts, Media & Entertainment | 10 (100.0%) | 0 (0.0%) |
| Health Diagnosing & Treating | 0 (0.0%) | 9 (100.0%) |
| Health Technologists | 0 (0.0%) | 2 (100.0%) |
| Total (Category) | 22 (20.2%) | 87 (79.8%) |
| Total (Overall) | 186 (47.9%) | 202 (52.1%) |
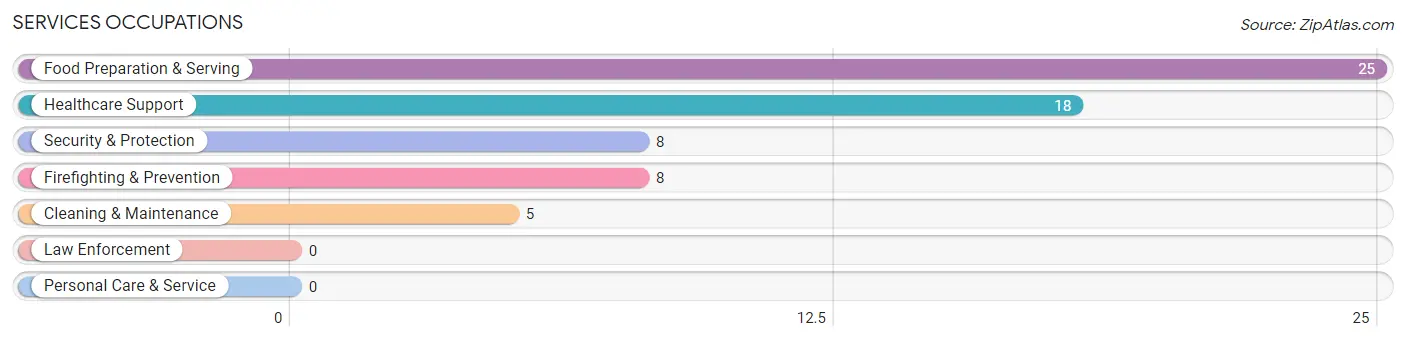
Services Occupations
The most common Services occupations in Funston are Food Preparation & Serving (25 | 6.4%), Healthcare Support (18 | 4.6%), Security & Protection (8 | 2.1%), Firefighting & Prevention (8 | 2.1%), and Cleaning & Maintenance (5 | 1.3%).
Services Occupations by Sex
Within the Services occupations in Funston, the most male-oriented occupations are Security & Protection (100.0%), Firefighting & Prevention (100.0%), and Cleaning & Maintenance (100.0%), while the most female-oriented occupations are Healthcare Support (100.0%), and Food Preparation & Serving (12.0%).
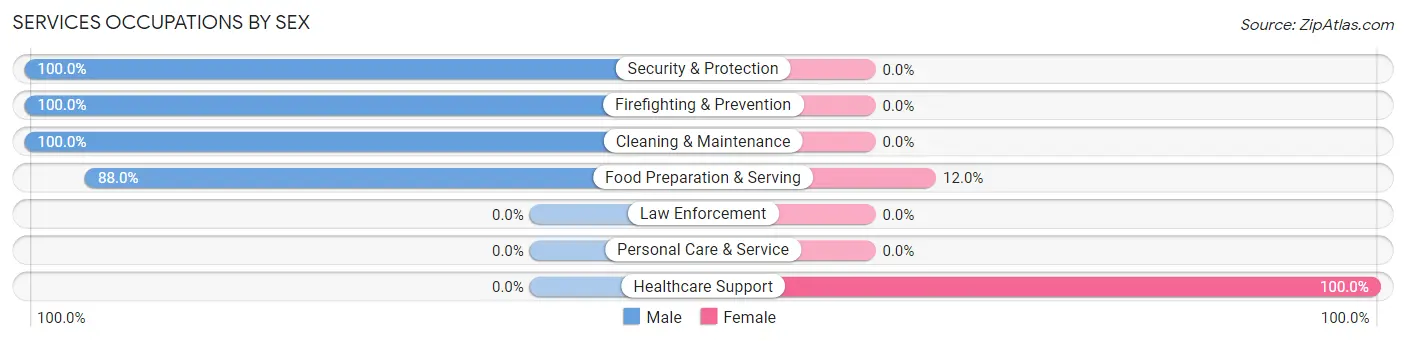
| Occupation | Male | Female |
| Healthcare Support | 0 (0.0%) | 18 (100.0%) |
| Security & Protection | 8 (100.0%) | 0 (0.0%) |
| Firefighting & Prevention | 8 (100.0%) | 0 (0.0%) |
| Law Enforcement | 0 (0.0%) | 0 (0.0%) |
| Food Preparation & Serving | 22 (88.0%) | 3 (12.0%) |
| Cleaning & Maintenance | 5 (100.0%) | 0 (0.0%) |
| Personal Care & Service | 0 (0.0%) | 0 (0.0%) |
| Total (Category) | 35 (62.5%) | 21 (37.5%) |
| Total (Overall) | 186 (47.9%) | 202 (52.1%) |
Sales and Office Occupations
The most common Sales and Office occupations in Funston are Sales & Related (55 | 14.2%), and Office & Administration (54 | 13.9%).
Sales and Office Occupations by Sex
| Occupation | Male | Female |
| Sales & Related | 39 (70.9%) | 16 (29.1%) |
| Office & Administration | 4 (7.4%) | 50 (92.6%) |
| Total (Category) | 43 (39.5%) | 66 (60.6%) |
| Total (Overall) | 186 (47.9%) | 202 (52.1%) |
Natural Resources, Construction and Maintenance Occupations
The most common Natural Resources, Construction and Maintenance occupations in Funston are Installation, Maintenance & Repair (21 | 5.4%), Farming, Fishing & Forestry (13 | 3.4%), and Construction & Extraction (8 | 2.1%).
Natural Resources, Construction and Maintenance Occupations by Sex
| Occupation | Male | Female |
| Farming, Fishing & Forestry | 13 (100.0%) | 0 (0.0%) |
| Construction & Extraction | 8 (100.0%) | 0 (0.0%) |
| Installation, Maintenance & Repair | 21 (100.0%) | 0 (0.0%) |
| Total (Category) | 42 (100.0%) | 0 (0.0%) |
| Total (Overall) | 186 (47.9%) | 202 (52.1%) |
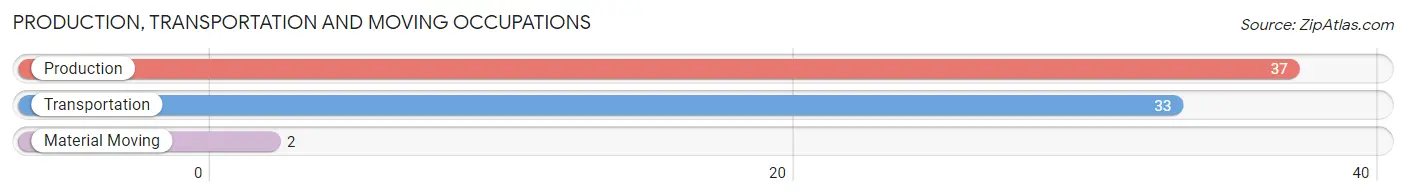
Production, Transportation and Moving Occupations
The most common Production, Transportation and Moving occupations in Funston are Production (37 | 9.5%), Transportation (33 | 8.5%), and Material Moving (2 | 0.5%).
Production, Transportation and Moving Occupations by Sex
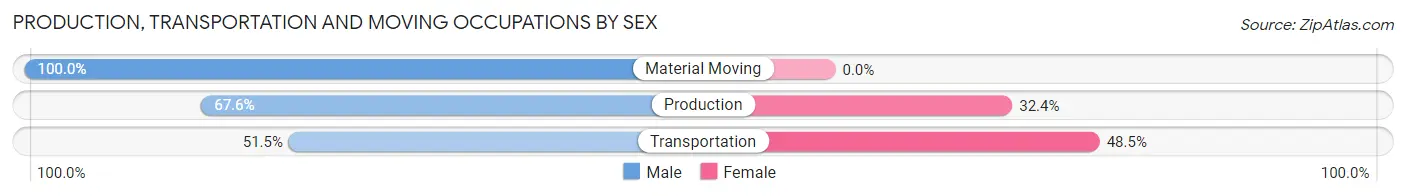
| Occupation | Male | Female |
| Production | 25 (67.6%) | 12 (32.4%) |
| Transportation | 17 (51.5%) | 16 (48.5%) |
| Material Moving | 2 (100.0%) | 0 (0.0%) |
| Total (Category) | 44 (61.1%) | 28 (38.9%) |
| Total (Overall) | 186 (47.9%) | 202 (52.1%) |
Employment Industries by Sex in Funston
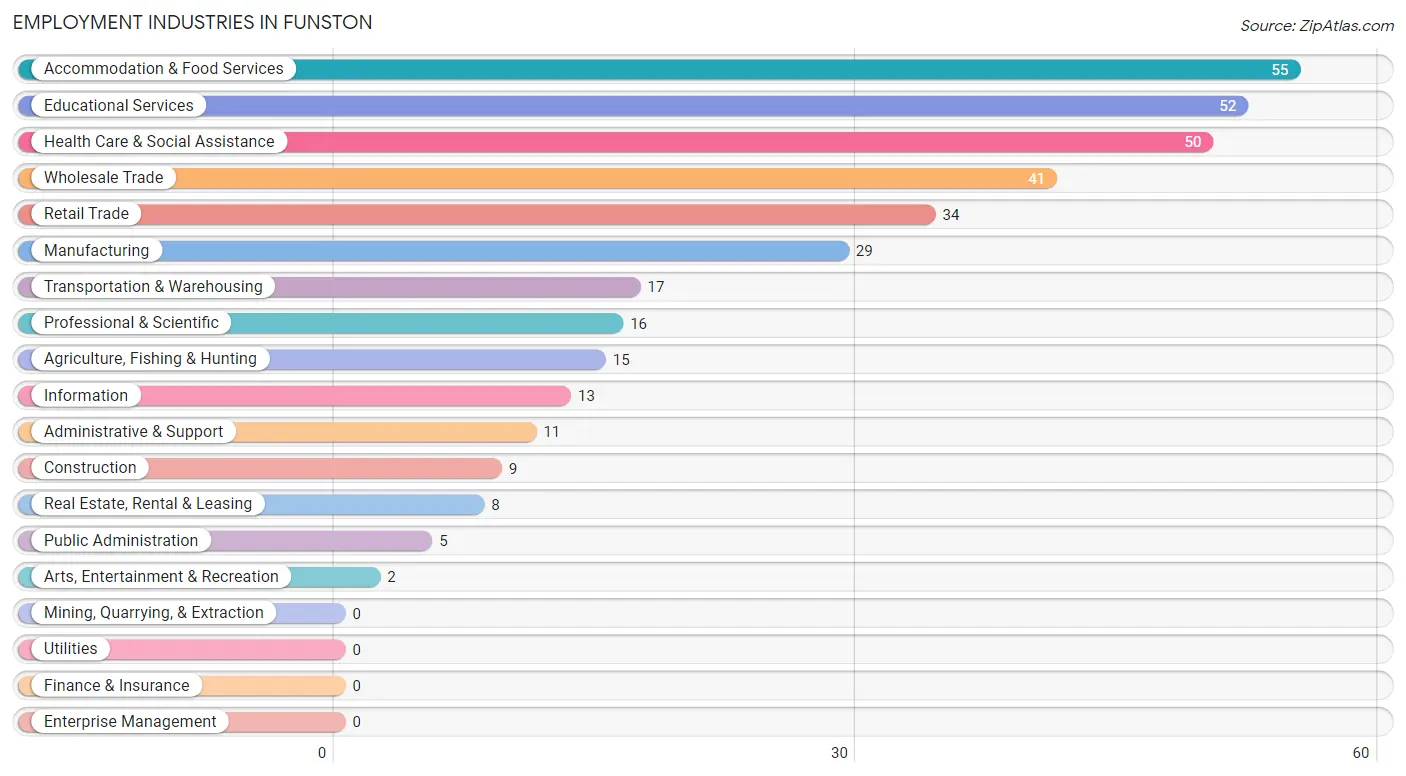
Employment Industries in Funston
The major employment industries in Funston include Accommodation & Food Services (55 | 14.2%), Educational Services (52 | 13.4%), Health Care & Social Assistance (50 | 12.9%), Wholesale Trade (41 | 10.6%), and Retail Trade (34 | 8.8%).
Employment Industries by Sex in Funston
The Funston industries that see more men than women are Agriculture, Fishing & Hunting (100.0%), Transportation & Warehousing (100.0%), and Information (100.0%), whereas the industries that tend to have a higher number of women are Real Estate, Rental & Leasing (100.0%), Educational Services (88.5%), and Professional & Scientific (87.5%).
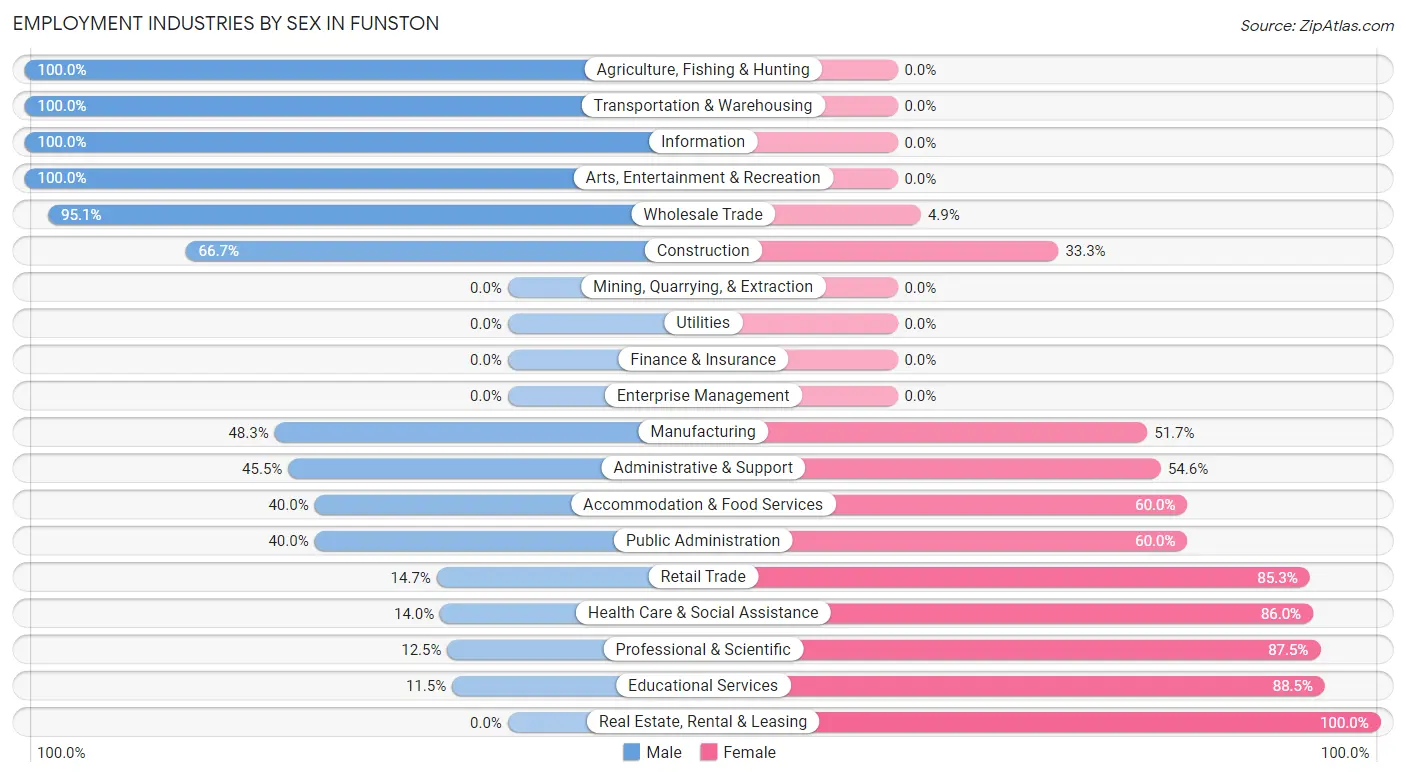
| Industry | Male | Female |
| Agriculture, Fishing & Hunting | 15 (100.0%) | 0 (0.0%) |
| Mining, Quarrying, & Extraction | 0 (0.0%) | 0 (0.0%) |
| Construction | 6 (66.7%) | 3 (33.3%) |
| Manufacturing | 14 (48.3%) | 15 (51.7%) |
| Wholesale Trade | 39 (95.1%) | 2 (4.9%) |
| Retail Trade | 5 (14.7%) | 29 (85.3%) |
| Transportation & Warehousing | 17 (100.0%) | 0 (0.0%) |
| Utilities | 0 (0.0%) | 0 (0.0%) |
| Information | 13 (100.0%) | 0 (0.0%) |
| Finance & Insurance | 0 (0.0%) | 0 (0.0%) |
| Real Estate, Rental & Leasing | 0 (0.0%) | 8 (100.0%) |
| Professional & Scientific | 2 (12.5%) | 14 (87.5%) |
| Enterprise Management | 0 (0.0%) | 0 (0.0%) |
| Administrative & Support | 5 (45.5%) | 6 (54.5%) |
| Educational Services | 6 (11.5%) | 46 (88.5%) |
| Health Care & Social Assistance | 7 (14.0%) | 43 (86.0%) |
| Arts, Entertainment & Recreation | 2 (100.0%) | 0 (0.0%) |
| Accommodation & Food Services | 22 (40.0%) | 33 (60.0%) |
| Public Administration | 2 (40.0%) | 3 (60.0%) |
| Total | 186 (47.9%) | 202 (52.1%) |
Education in Funston
School Enrollment in Funston
The most common levels of schooling among the 240 students in Funston are elementary school (82 | 34.2%), middle school (51 | 21.2%), and college / undergraduate (40 | 16.7%).
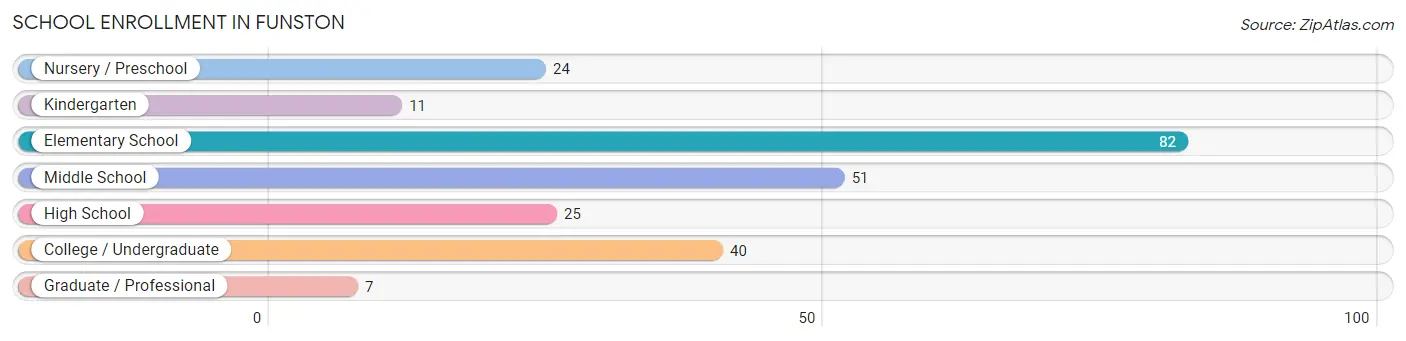
| School Level | # Students | % Students |
| Nursery / Preschool | 24 | 10.0% |
| Kindergarten | 11 | 4.6% |
| Elementary School | 82 | 34.2% |
| Middle School | 51 | 21.2% |
| High School | 25 | 10.4% |
| College / Undergraduate | 40 | 16.7% |
| Graduate / Professional | 7 | 2.9% |
| Total | 240 | 100.0% |
School Enrollment by Age by Funding Source in Funston
Out of a total of 240 students who are enrolled in schools in Funston, 9 (3.8%) attend a private institution, while the remaining 231 (96.2%) are enrolled in public schools. The age group of 25 to 34 year olds has the highest likelihood of being enrolled in private schools, with 2 (100.0% in the age bracket) enrolled. Conversely, the age group of 3 to 4 year olds has the lowest likelihood of being enrolled in a private school, with 2 (100.0% in the age bracket) attending a public institution.
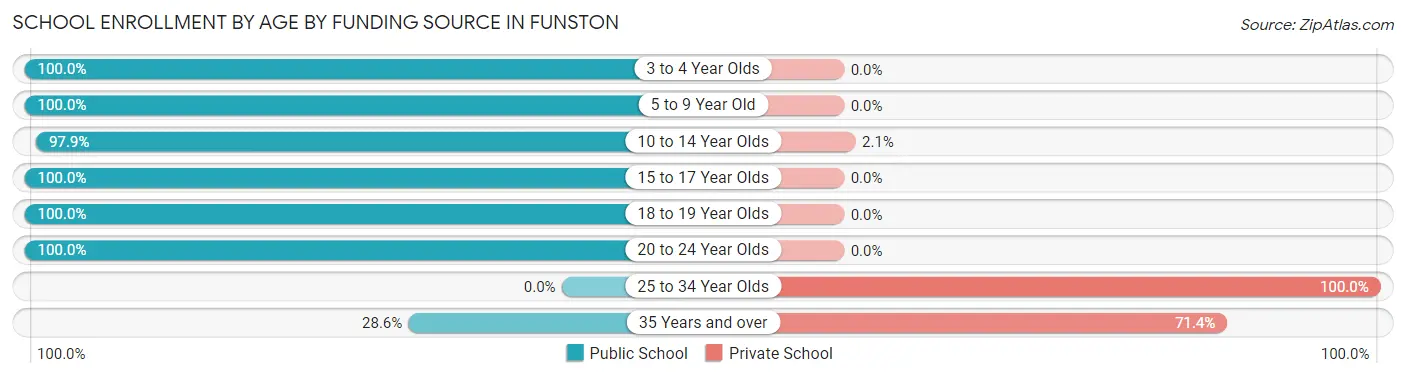
| Age Bracket | Public School | Private School |
| 3 to 4 Year Olds | 2 (100.0%) | 0 (0.0%) |
| 5 to 9 Year Old | 86 (100.0%) | 0 (0.0%) |
| 10 to 14 Year Olds | 92 (97.9%) | 2 (2.1%) |
| 15 to 17 Year Olds | 4 (100.0%) | 0 (0.0%) |
| 18 to 19 Year Olds | 22 (100.0%) | 0 (0.0%) |
| 20 to 24 Year Olds | 23 (100.0%) | 0 (0.0%) |
| 25 to 34 Year Olds | 0 (0.0%) | 2 (100.0%) |
| 35 Years and over | 2 (28.6%) | 5 (71.4%) |
| Total | 231 (96.3%) | 9 (3.8%) |
Educational Attainment by Field of Study in Funston
Literature & languages (28 | 52.8%), education (12 | 22.6%), multidisciplinary studies (6 | 11.3%), science & technology (5 | 9.4%), and liberal arts & history (2 | 3.8%) are the most common fields of study among 53 individuals in Funston who have obtained a bachelor's degree or higher.
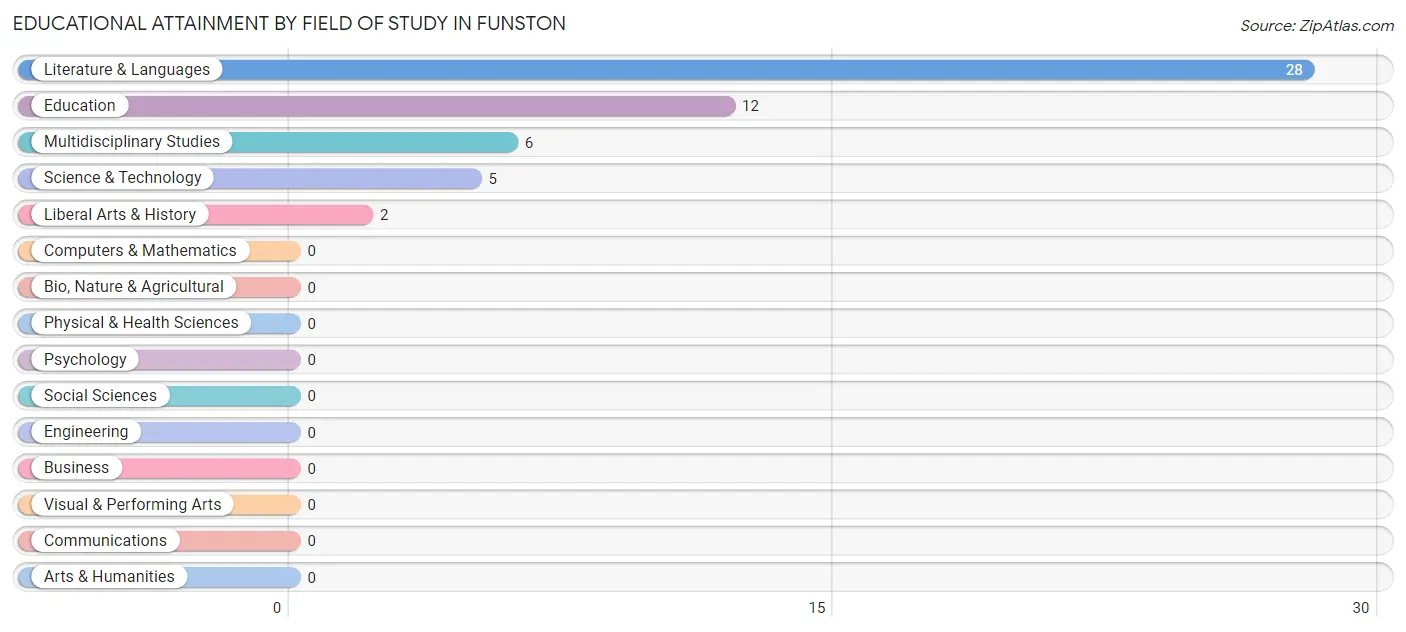
| Field of Study | # Graduates | % Graduates |
| Computers & Mathematics | 0 | 0.0% |
| Bio, Nature & Agricultural | 0 | 0.0% |
| Physical & Health Sciences | 0 | 0.0% |
| Psychology | 0 | 0.0% |
| Social Sciences | 0 | 0.0% |
| Engineering | 0 | 0.0% |
| Multidisciplinary Studies | 6 | 11.3% |
| Science & Technology | 5 | 9.4% |
| Business | 0 | 0.0% |
| Education | 12 | 22.6% |
| Literature & Languages | 28 | 52.8% |
| Liberal Arts & History | 2 | 3.8% |
| Visual & Performing Arts | 0 | 0.0% |
| Communications | 0 | 0.0% |
| Arts & Humanities | 0 | 0.0% |
| Total | 53 | 100.0% |
Transportation & Commute in Funston
Vehicle Availability by Sex in Funston
The most prevalent vehicle ownership categories in Funston are males with 2 vehicles (85, accounting for 45.7%) and females with 2 vehicles (54, making up 42.1%).
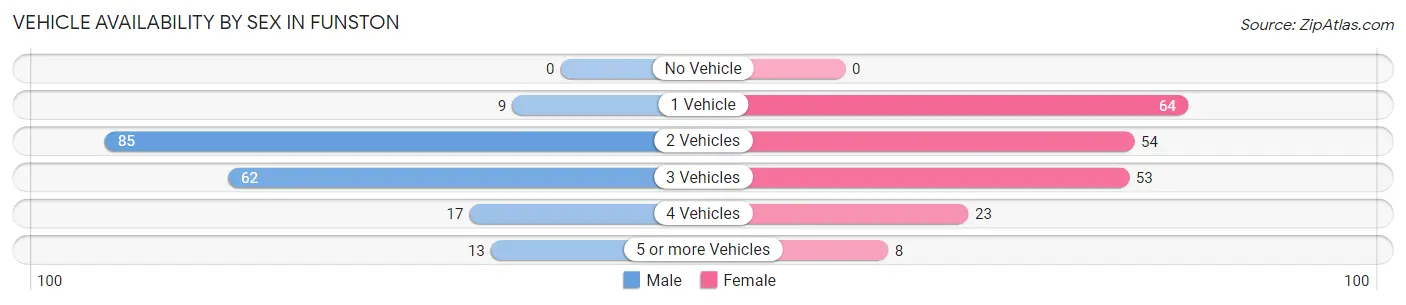
| Vehicles Available | Male | Female |
| No Vehicle | 0 (0.0%) | 0 (0.0%) |
| 1 Vehicle | 9 (4.8%) | 64 (31.7%) |
| 2 Vehicles | 85 (45.7%) | 54 (26.7%) |
| 3 Vehicles | 62 (33.3%) | 53 (26.2%) |
| 4 Vehicles | 17 (9.1%) | 23 (11.4%) |
| 5 or more Vehicles | 13 (7.0%) | 8 (4.0%) |
| Total | 186 (100.0%) | 202 (100.0%) |
Commute Time in Funston
The most frequently occuring commute durations in Funston are 15 to 19 minutes (100 commuters, 27.0%), 20 to 24 minutes (71 commuters, 19.1%), and 10 to 14 minutes (59 commuters, 15.9%).
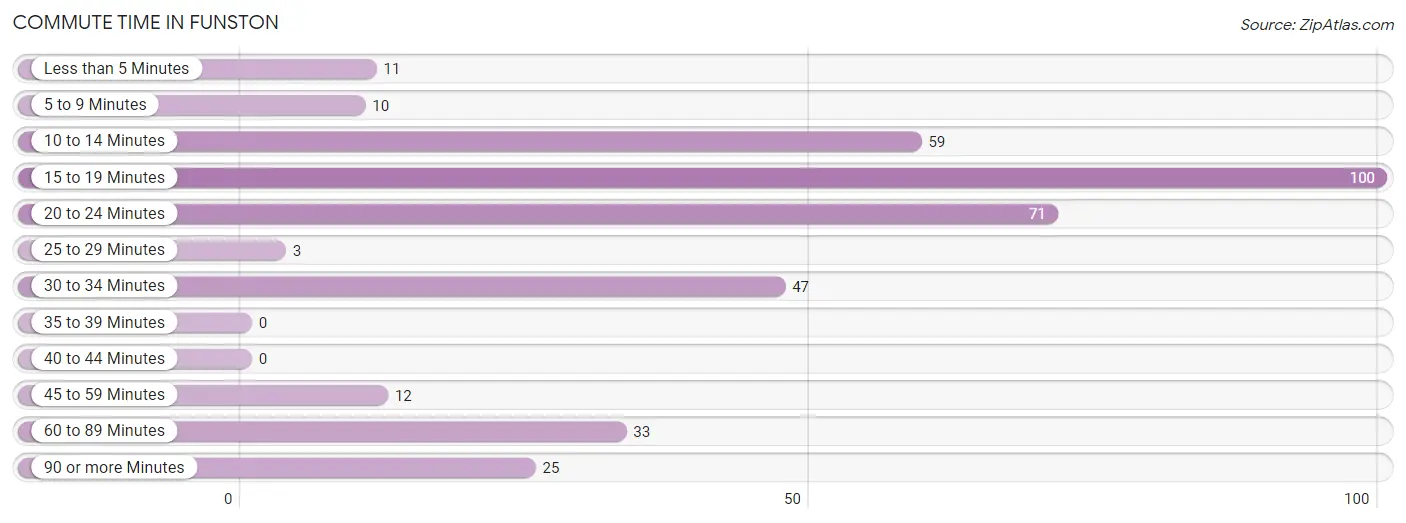
| Commute Time | # Commuters | % Commuters |
| Less than 5 Minutes | 11 | 3.0% |
| 5 to 9 Minutes | 10 | 2.7% |
| 10 to 14 Minutes | 59 | 15.9% |
| 15 to 19 Minutes | 100 | 27.0% |
| 20 to 24 Minutes | 71 | 19.1% |
| 25 to 29 Minutes | 3 | 0.8% |
| 30 to 34 Minutes | 47 | 12.7% |
| 35 to 39 Minutes | 0 | 0.0% |
| 40 to 44 Minutes | 0 | 0.0% |
| 45 to 59 Minutes | 12 | 3.2% |
| 60 to 89 Minutes | 33 | 8.9% |
| 90 or more Minutes | 25 | 6.7% |
Commute Time by Sex in Funston
The most common commute times in Funston are 15 to 19 minutes (62 commuters, 33.3%) for males and 10 to 14 minutes (51 commuters, 27.6%) for females.
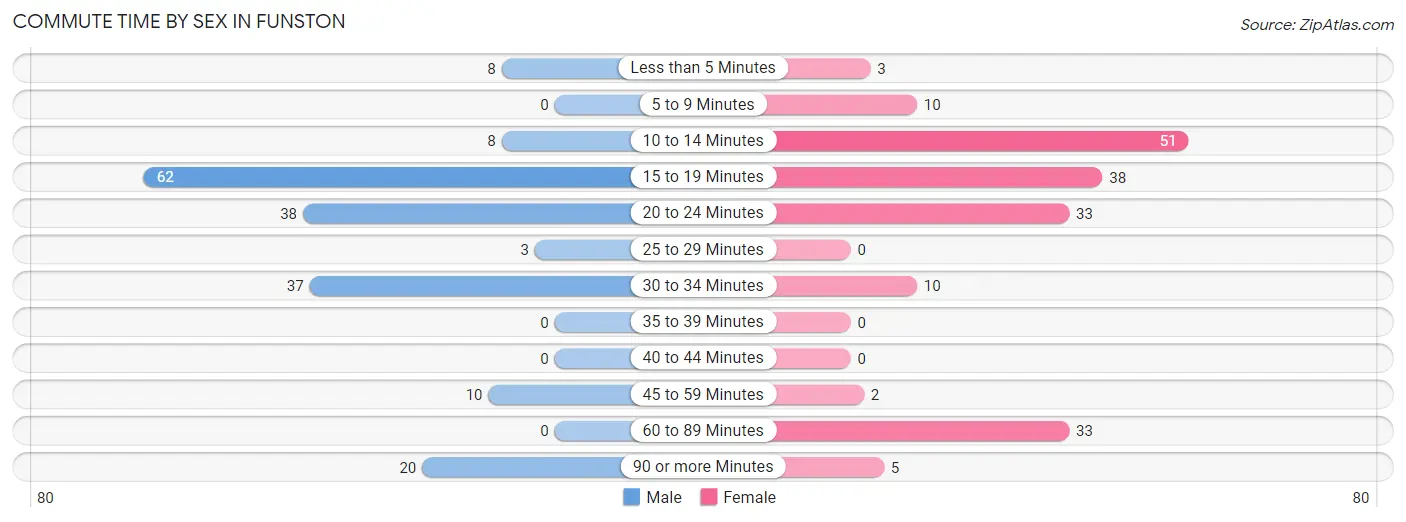
| Commute Time | Male | Female |
| Less than 5 Minutes | 8 (4.3%) | 3 (1.6%) |
| 5 to 9 Minutes | 0 (0.0%) | 10 (5.4%) |
| 10 to 14 Minutes | 8 (4.3%) | 51 (27.6%) |
| 15 to 19 Minutes | 62 (33.3%) | 38 (20.5%) |
| 20 to 24 Minutes | 38 (20.4%) | 33 (17.8%) |
| 25 to 29 Minutes | 3 (1.6%) | 0 (0.0%) |
| 30 to 34 Minutes | 37 (19.9%) | 10 (5.4%) |
| 35 to 39 Minutes | 0 (0.0%) | 0 (0.0%) |
| 40 to 44 Minutes | 0 (0.0%) | 0 (0.0%) |
| 45 to 59 Minutes | 10 (5.4%) | 2 (1.1%) |
| 60 to 89 Minutes | 0 (0.0%) | 33 (17.8%) |
| 90 or more Minutes | 20 (10.7%) | 5 (2.7%) |
Time of Departure to Work by Sex in Funston
The most frequent times of departure to work in Funston are 7:30 AM to 7:59 AM (56, 30.1%) for males and 6:30 AM to 6:59 AM (57, 30.8%) for females.
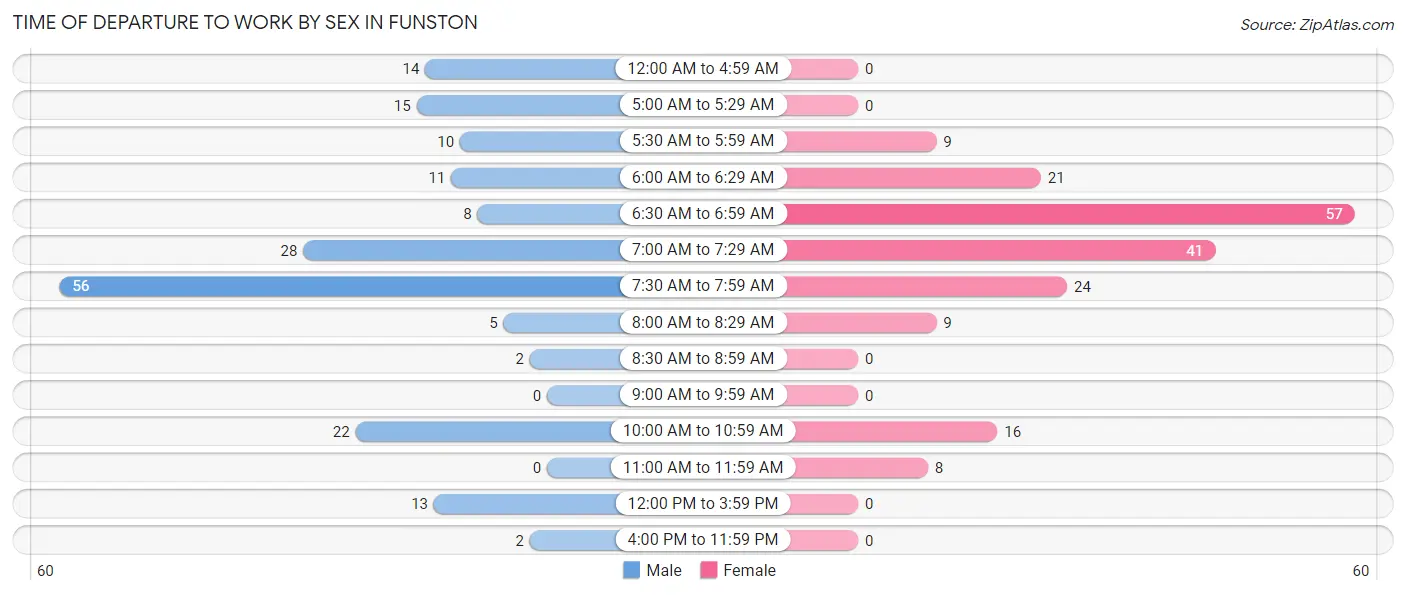
| Time of Departure | Male | Female |
| 12:00 AM to 4:59 AM | 14 (7.5%) | 0 (0.0%) |
| 5:00 AM to 5:29 AM | 15 (8.1%) | 0 (0.0%) |
| 5:30 AM to 5:59 AM | 10 (5.4%) | 9 (4.9%) |
| 6:00 AM to 6:29 AM | 11 (5.9%) | 21 (11.4%) |
| 6:30 AM to 6:59 AM | 8 (4.3%) | 57 (30.8%) |
| 7:00 AM to 7:29 AM | 28 (15.0%) | 41 (22.2%) |
| 7:30 AM to 7:59 AM | 56 (30.1%) | 24 (13.0%) |
| 8:00 AM to 8:29 AM | 5 (2.7%) | 9 (4.9%) |
| 8:30 AM to 8:59 AM | 2 (1.1%) | 0 (0.0%) |
| 9:00 AM to 9:59 AM | 0 (0.0%) | 0 (0.0%) |
| 10:00 AM to 10:59 AM | 22 (11.8%) | 16 (8.6%) |
| 11:00 AM to 11:59 AM | 0 (0.0%) | 8 (4.3%) |
| 12:00 PM to 3:59 PM | 13 (7.0%) | 0 (0.0%) |
| 4:00 PM to 11:59 PM | 2 (1.1%) | 0 (0.0%) |
| Total | 186 (100.0%) | 185 (100.0%) |
Housing Occupancy in Funston
Occupancy by Ownership in Funston
Of the total 255 dwellings in Funston, owner-occupied units account for 190 (74.5%), while renter-occupied units make up 65 (25.5%).
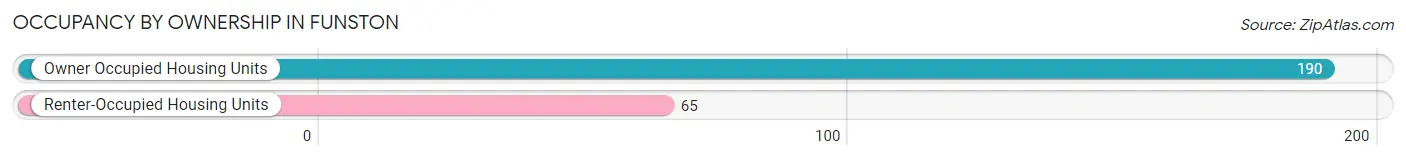
| Occupancy | # Housing Units | % Housing Units |
| Owner Occupied Housing Units | 190 | 74.5% |
| Renter-Occupied Housing Units | 65 | 25.5% |
| Total Occupied Housing Units | 255 | 100.0% |
Occupancy by Household Size in Funston
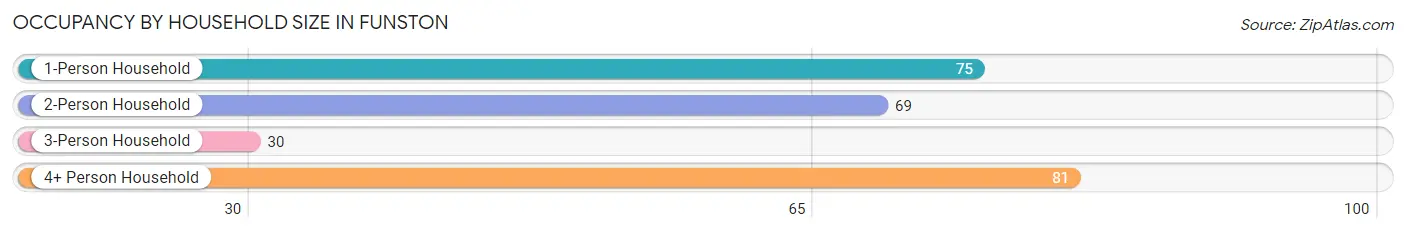
| Household Size | # Housing Units | % Housing Units |
| 1-Person Household | 75 | 29.4% |
| 2-Person Household | 69 | 27.1% |
| 3-Person Household | 30 | 11.8% |
| 4+ Person Household | 81 | 31.8% |
| Total Housing Units | 255 | 100.0% |
Occupancy by Ownership by Household Size in Funston
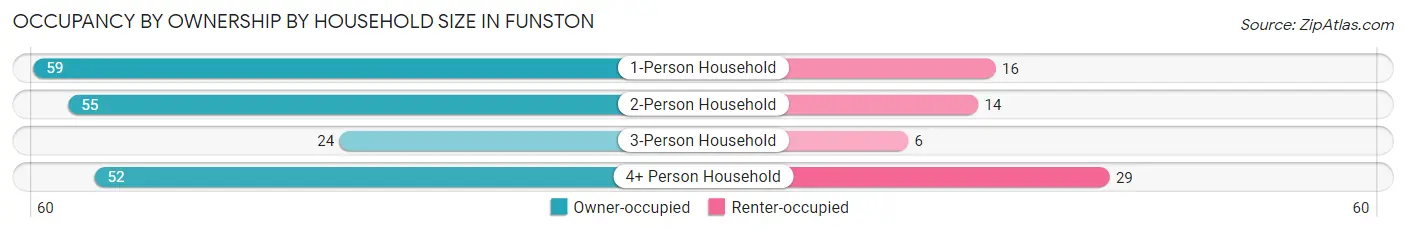
| Household Size | Owner-occupied | Renter-occupied |
| 1-Person Household | 59 (78.7%) | 16 (21.3%) |
| 2-Person Household | 55 (79.7%) | 14 (20.3%) |
| 3-Person Household | 24 (80.0%) | 6 (20.0%) |
| 4+ Person Household | 52 (64.2%) | 29 (35.8%) |
| Total Housing Units | 190 (74.5%) | 65 (25.5%) |
Occupancy by Educational Attainment in Funston
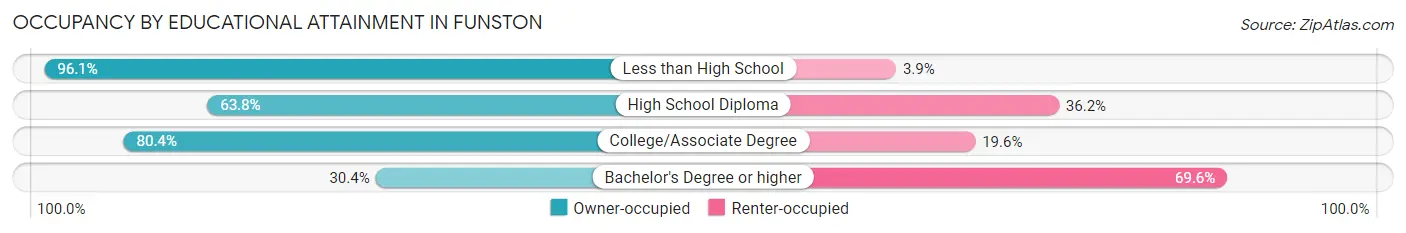
| Household Size | Owner-occupied | Renter-occupied |
| Less than High School | 49 (96.1%) | 2 (3.9%) |
| High School Diploma | 44 (63.8%) | 25 (36.2%) |
| College/Associate Degree | 90 (80.4%) | 22 (19.6%) |
| Bachelor's Degree or higher | 7 (30.4%) | 16 (69.6%) |
Occupancy by Age of Householder in Funston
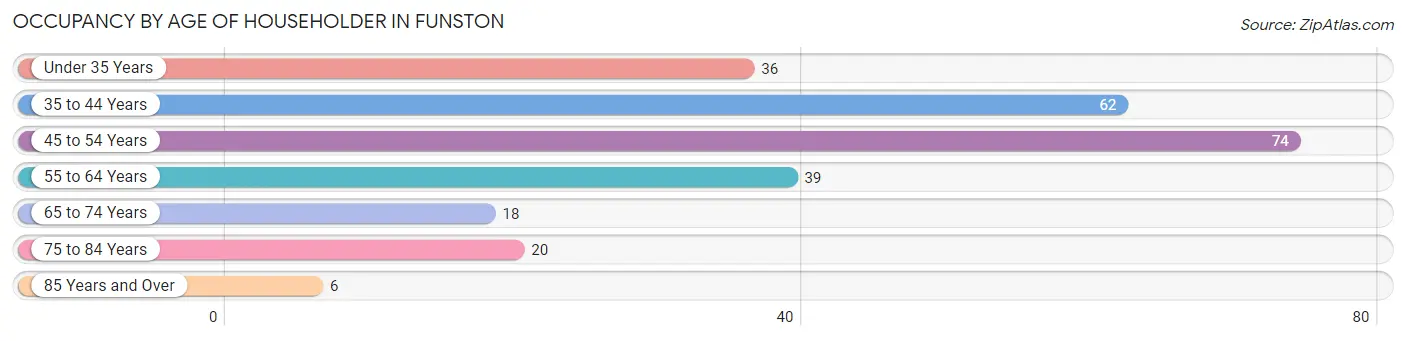
| Age Bracket | # Households | % Households |
| Under 35 Years | 36 | 14.1% |
| 35 to 44 Years | 62 | 24.3% |
| 45 to 54 Years | 74 | 29.0% |
| 55 to 64 Years | 39 | 15.3% |
| 65 to 74 Years | 18 | 7.1% |
| 75 to 84 Years | 20 | 7.8% |
| 85 Years and Over | 6 | 2.4% |
| Total | 255 | 100.0% |
Housing Finances in Funston
Median Income by Occupancy in Funston
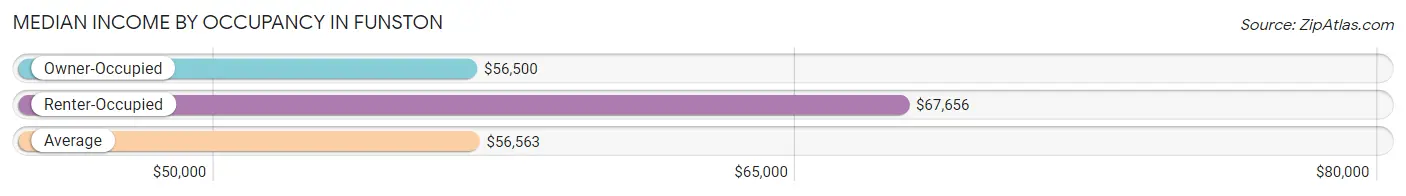
| Occupancy Type | # Households | Median Income |
| Owner-Occupied | 190 (74.5%) | $56,500 |
| Renter-Occupied | 65 (25.5%) | $67,656 |
| Average | 255 (100.0%) | $56,563 |
Occupancy by Householder Income Bracket in Funston
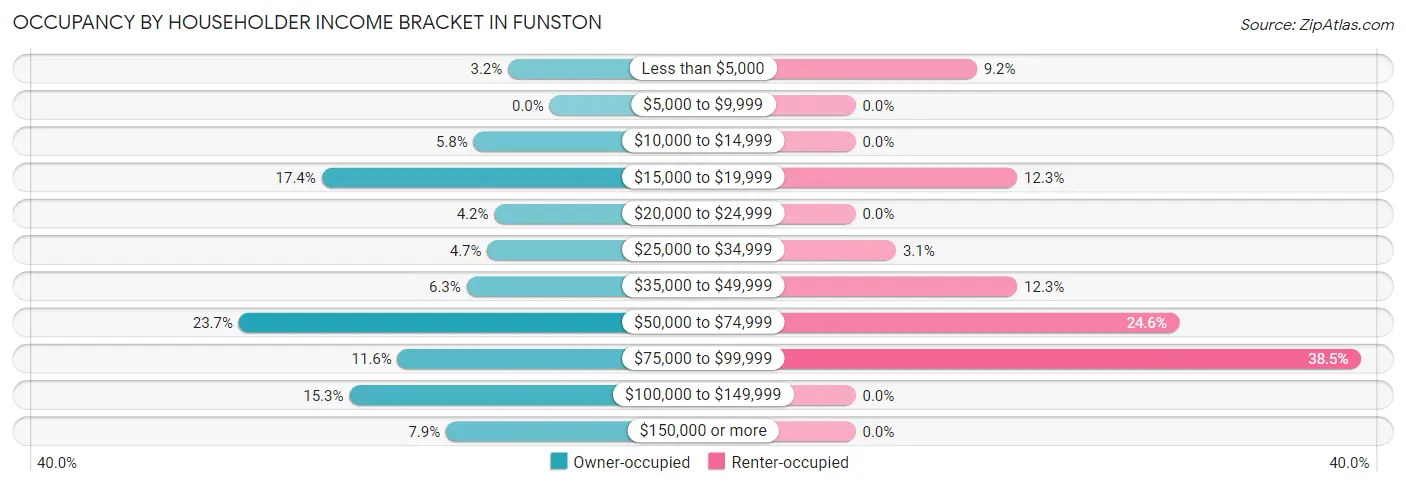
| Income Bracket | Owner-occupied | Renter-occupied |
| Less than $5,000 | 6 (3.2%) | 6 (9.2%) |
| $5,000 to $9,999 | 0 (0.0%) | 0 (0.0%) |
| $10,000 to $14,999 | 11 (5.8%) | 0 (0.0%) |
| $15,000 to $19,999 | 33 (17.4%) | 8 (12.3%) |
| $20,000 to $24,999 | 8 (4.2%) | 0 (0.0%) |
| $25,000 to $34,999 | 9 (4.7%) | 2 (3.1%) |
| $35,000 to $49,999 | 12 (6.3%) | 8 (12.3%) |
| $50,000 to $74,999 | 45 (23.7%) | 16 (24.6%) |
| $75,000 to $99,999 | 22 (11.6%) | 25 (38.5%) |
| $100,000 to $149,999 | 29 (15.3%) | 0 (0.0%) |
| $150,000 or more | 15 (7.9%) | 0 (0.0%) |
| Total | 190 (100.0%) | 65 (100.0%) |
Monthly Housing Cost Tiers in Funston

| Monthly Cost | Owner-occupied | Renter-occupied |
| Less than $300 | 51 (26.8%) | 0 (0.0%) |
| $300 to $499 | 61 (32.1%) | 2 (3.1%) |
| $500 to $799 | 72 (37.9%) | 22 (33.9%) |
| $800 to $999 | 0 (0.0%) | 6 (9.2%) |
| $1,000 to $1,499 | 6 (3.2%) | 16 (24.6%) |
| $1,500 to $1,999 | 0 (0.0%) | 6 (9.2%) |
| $2,000 to $2,499 | 0 (0.0%) | 0 (0.0%) |
| $2,500 to $2,999 | 0 (0.0%) | 0 (0.0%) |
| $3,000 or more | 0 (0.0%) | 0 (0.0%) |
| Total | 190 (100.0%) | 65 (100.0%) |
Physical Housing Characteristics in Funston
Housing Structures in Funston
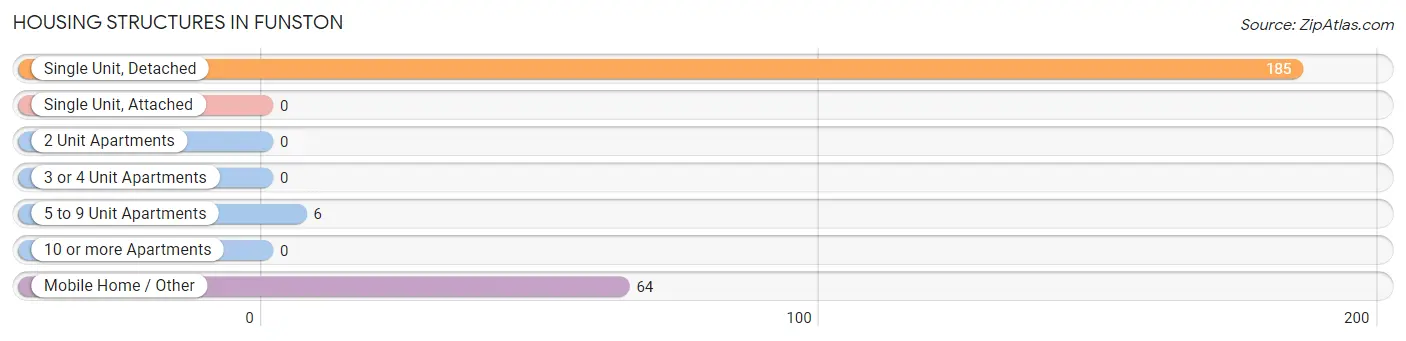
| Structure Type | # Housing Units | % Housing Units |
| Single Unit, Detached | 185 | 72.6% |
| Single Unit, Attached | 0 | 0.0% |
| 2 Unit Apartments | 0 | 0.0% |
| 3 or 4 Unit Apartments | 0 | 0.0% |
| 5 to 9 Unit Apartments | 6 | 2.4% |
| 10 or more Apartments | 0 | 0.0% |
| Mobile Home / Other | 64 | 25.1% |
| Total | 255 | 100.0% |
Housing Structures by Occupancy in Funston
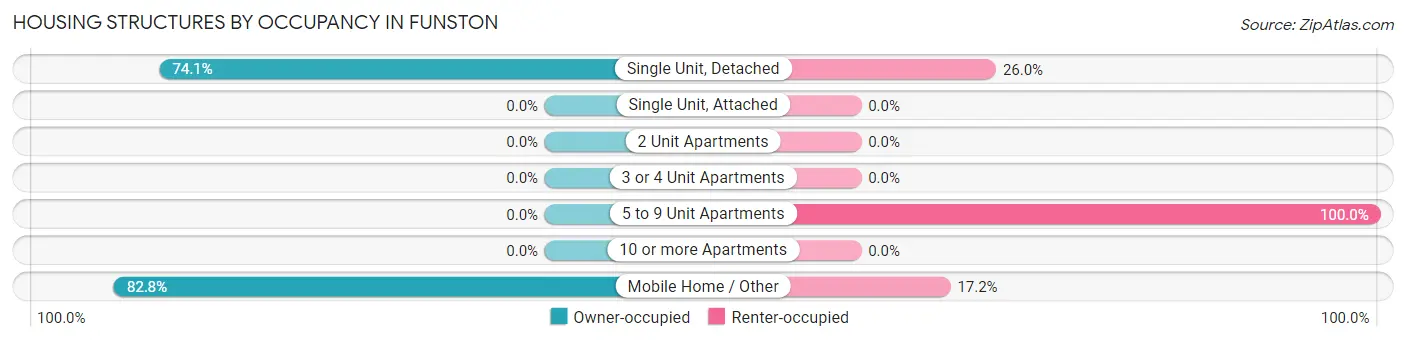
| Structure Type | Owner-occupied | Renter-occupied |
| Single Unit, Detached | 137 (74.1%) | 48 (26.0%) |
| Single Unit, Attached | 0 (0.0%) | 0 (0.0%) |
| 2 Unit Apartments | 0 (0.0%) | 0 (0.0%) |
| 3 or 4 Unit Apartments | 0 (0.0%) | 0 (0.0%) |
| 5 to 9 Unit Apartments | 0 (0.0%) | 6 (100.0%) |
| 10 or more Apartments | 0 (0.0%) | 0 (0.0%) |
| Mobile Home / Other | 53 (82.8%) | 11 (17.2%) |
| Total | 190 (74.5%) | 65 (25.5%) |
Housing Structures by Number of Rooms in Funston
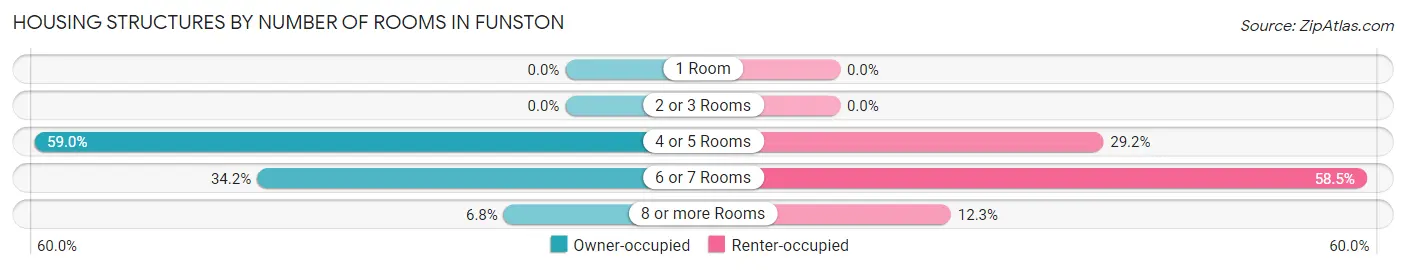
| Number of Rooms | Owner-occupied | Renter-occupied |
| 1 Room | 0 (0.0%) | 0 (0.0%) |
| 2 or 3 Rooms | 0 (0.0%) | 0 (0.0%) |
| 4 or 5 Rooms | 112 (59.0%) | 19 (29.2%) |
| 6 or 7 Rooms | 65 (34.2%) | 38 (58.5%) |
| 8 or more Rooms | 13 (6.8%) | 8 (12.3%) |
| Total | 190 (100.0%) | 65 (100.0%) |
Housing Structure by Heating Type in Funston
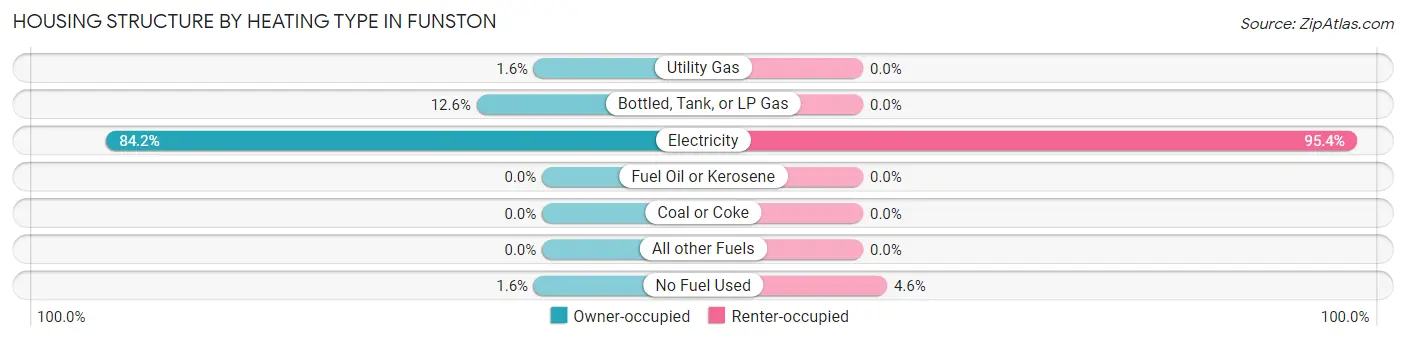
| Heating Type | Owner-occupied | Renter-occupied |
| Utility Gas | 3 (1.6%) | 0 (0.0%) |
| Bottled, Tank, or LP Gas | 24 (12.6%) | 0 (0.0%) |
| Electricity | 160 (84.2%) | 62 (95.4%) |
| Fuel Oil or Kerosene | 0 (0.0%) | 0 (0.0%) |
| Coal or Coke | 0 (0.0%) | 0 (0.0%) |
| All other Fuels | 0 (0.0%) | 0 (0.0%) |
| No Fuel Used | 3 (1.6%) | 3 (4.6%) |
| Total | 190 (100.0%) | 65 (100.0%) |
Household Vehicle Usage in Funston
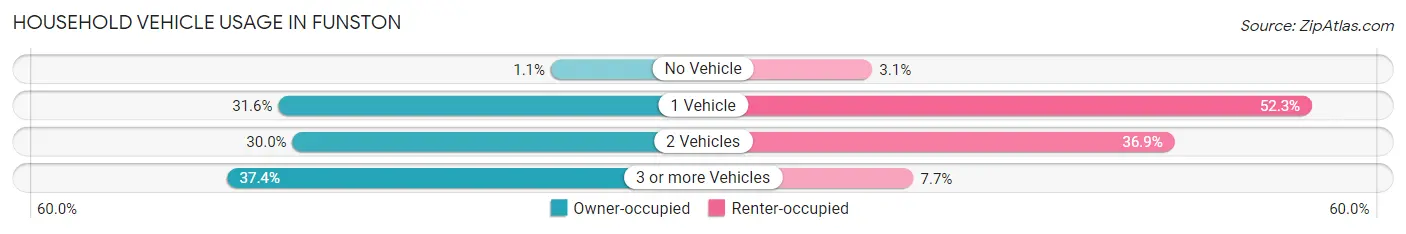
| Vehicles per Household | Owner-occupied | Renter-occupied |
| No Vehicle | 2 (1.1%) | 2 (3.1%) |
| 1 Vehicle | 60 (31.6%) | 34 (52.3%) |
| 2 Vehicles | 57 (30.0%) | 24 (36.9%) |
| 3 or more Vehicles | 71 (37.4%) | 5 (7.7%) |
| Total | 190 (100.0%) | 65 (100.0%) |
Real Estate & Mortgages in Funston
Real Estate and Mortgage Overview in Funston
| Characteristic | Without Mortgage | With Mortgage |
| Housing Units | 141 | 49 |
| Median Property Value | $87,200 | $93,600 |
| Median Household Income | $72,604 | $0 |
| Monthly Housing Costs | $336 | $0 |
| Real Estate Taxes | $682 | $0 |
Property Value by Mortgage Status in Funston
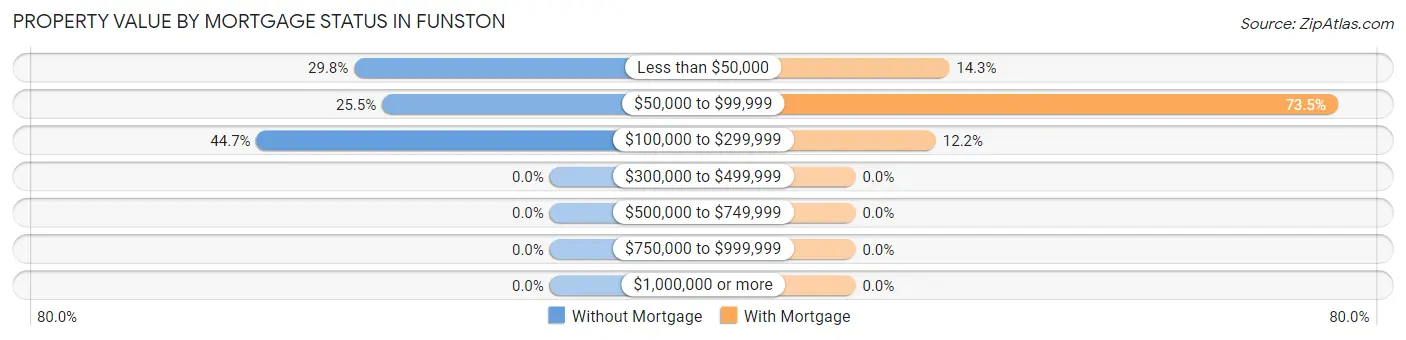
| Property Value | Without Mortgage | With Mortgage |
| Less than $50,000 | 42 (29.8%) | 7 (14.3%) |
| $50,000 to $99,999 | 36 (25.5%) | 36 (73.5%) |
| $100,000 to $299,999 | 63 (44.7%) | 6 (12.2%) |
| $300,000 to $499,999 | 0 (0.0%) | 0 (0.0%) |
| $500,000 to $749,999 | 0 (0.0%) | 0 (0.0%) |
| $750,000 to $999,999 | 0 (0.0%) | 0 (0.0%) |
| $1,000,000 or more | 0 (0.0%) | 0 (0.0%) |
| Total | 141 (100.0%) | 49 (100.0%) |
Household Income by Mortgage Status in Funston
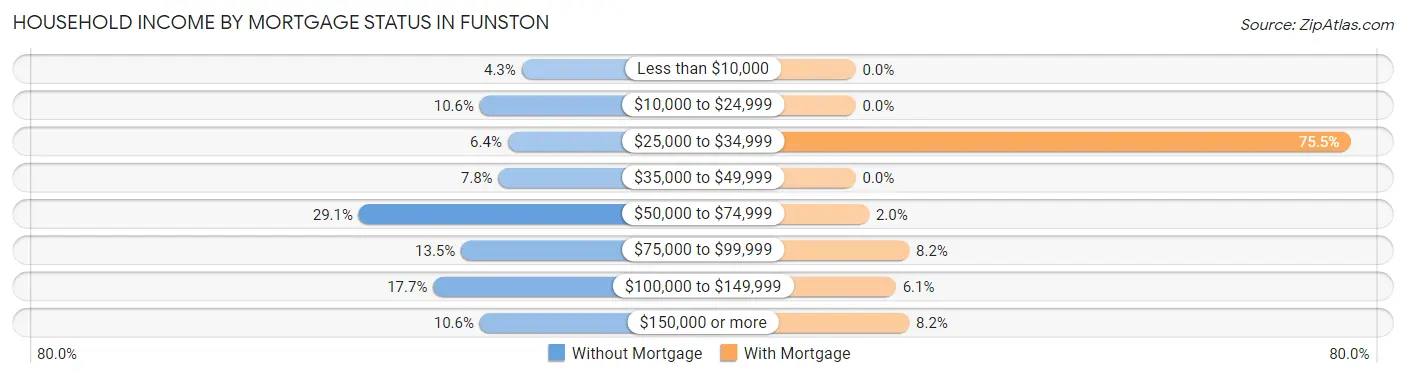
| Household Income | Without Mortgage | With Mortgage |
| Less than $10,000 | 6 (4.3%) | 0 (0.0%) |
| $10,000 to $24,999 | 15 (10.6%) | 0 (0.0%) |
| $25,000 to $34,999 | 9 (6.4%) | 37 (75.5%) |
| $35,000 to $49,999 | 11 (7.8%) | 0 (0.0%) |
| $50,000 to $74,999 | 41 (29.1%) | 1 (2.0%) |
| $75,000 to $99,999 | 19 (13.5%) | 4 (8.2%) |
| $100,000 to $149,999 | 25 (17.7%) | 3 (6.1%) |
| $150,000 or more | 15 (10.6%) | 4 (8.2%) |
| Total | 141 (100.0%) | 49 (100.0%) |
Property Value to Household Income Ratio in Funston
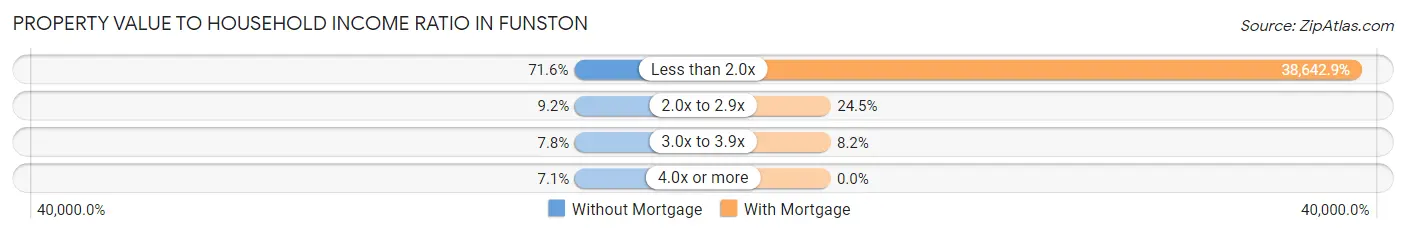
| Value-to-Income Ratio | Without Mortgage | With Mortgage |
| Less than 2.0x | 101 (71.6%) | 18,935 (38,642.9%) |
| 2.0x to 2.9x | 13 (9.2%) | 12 (24.5%) |
| 3.0x to 3.9x | 11 (7.8%) | 4 (8.2%) |
| 4.0x or more | 10 (7.1%) | 0 (0.0%) |
| Total | 141 (100.0%) | 49 (100.0%) |
Real Estate Taxes by Mortgage Status in Funston
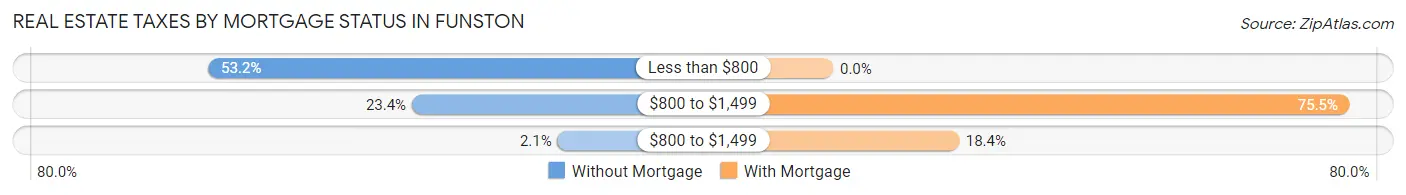
| Property Taxes | Without Mortgage | With Mortgage |
| Less than $800 | 75 (53.2%) | 0 (0.0%) |
| $800 to $1,499 | 33 (23.4%) | 37 (75.5%) |
| $800 to $1,499 | 3 (2.1%) | 9 (18.4%) |
| Total | 141 (100.0%) | 49 (100.0%) |
Health & Disability in Funston
Health Insurance Coverage by Age in Funston
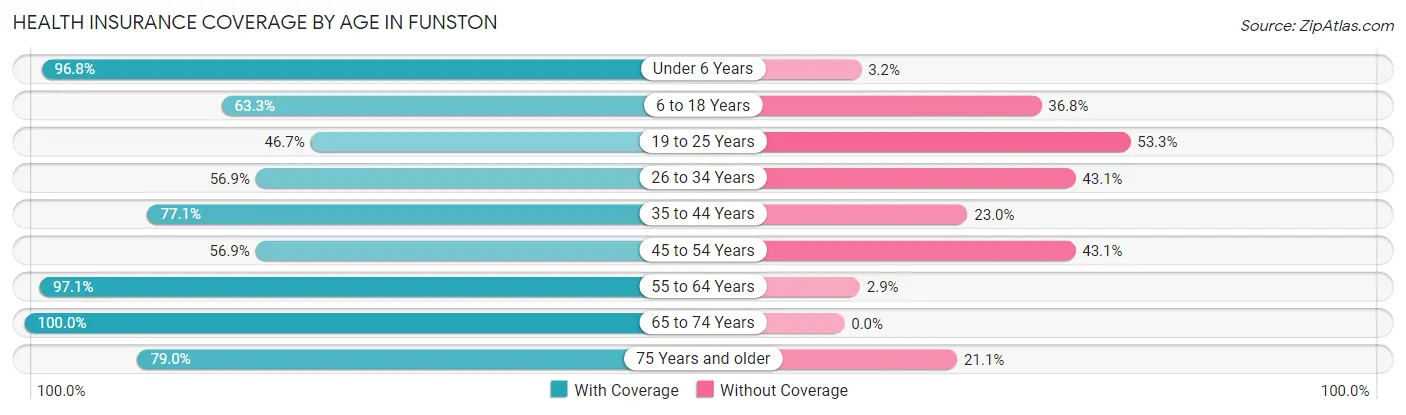
| Age Bracket | With Coverage | Without Coverage |
| Under 6 Years | 92 (96.8%) | 3 (3.2%) |
| 6 to 18 Years | 105 (63.2%) | 61 (36.7%) |
| 19 to 25 Years | 28 (46.7%) | 32 (53.3%) |
| 26 to 34 Years | 66 (56.9%) | 50 (43.1%) |
| 35 to 44 Years | 94 (77.0%) | 28 (23.0%) |
| 45 to 54 Years | 74 (56.9%) | 56 (43.1%) |
| 55 to 64 Years | 67 (97.1%) | 2 (2.9%) |
| 65 to 74 Years | 42 (100.0%) | 0 (0.0%) |
| 75 Years and older | 30 (78.9%) | 8 (21.0%) |
| Total | 598 (71.4%) | 240 (28.6%) |
Health Insurance Coverage by Citizenship Status in Funston
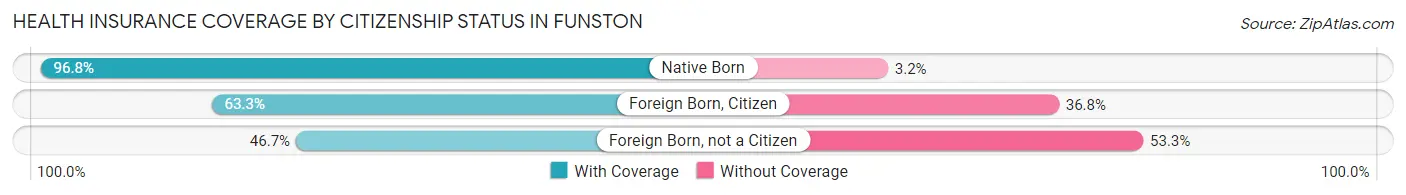
| Citizenship Status | With Coverage | Without Coverage |
| Native Born | 92 (96.8%) | 3 (3.2%) |
| Foreign Born, Citizen | 105 (63.2%) | 61 (36.7%) |
| Foreign Born, not a Citizen | 28 (46.7%) | 32 (53.3%) |
Health Insurance Coverage by Household Income in Funston
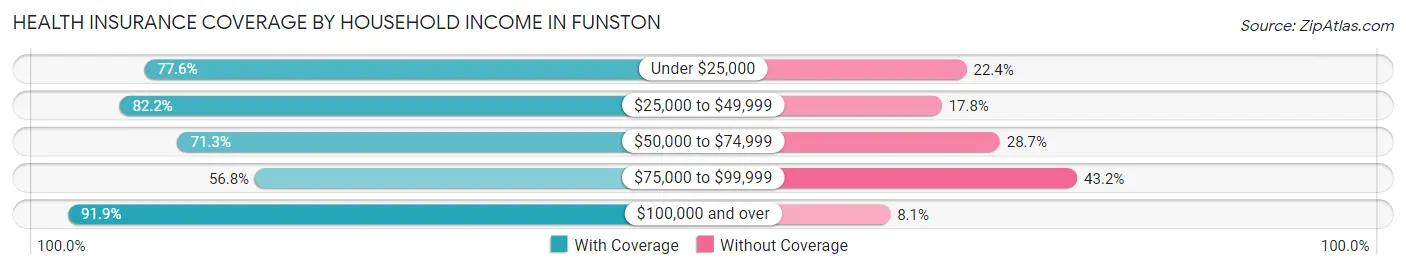
| Household Income | With Coverage | Without Coverage |
| Under $25,000 | 83 (77.6%) | 24 (22.4%) |
| $25,000 to $49,999 | 74 (82.2%) | 16 (17.8%) |
| $50,000 to $74,999 | 229 (71.3%) | 92 (28.7%) |
| $75,000 to $99,999 | 133 (56.8%) | 101 (43.2%) |
| $100,000 and over | 79 (91.9%) | 7 (8.1%) |
Public vs Private Health Insurance Coverage by Age in Funston
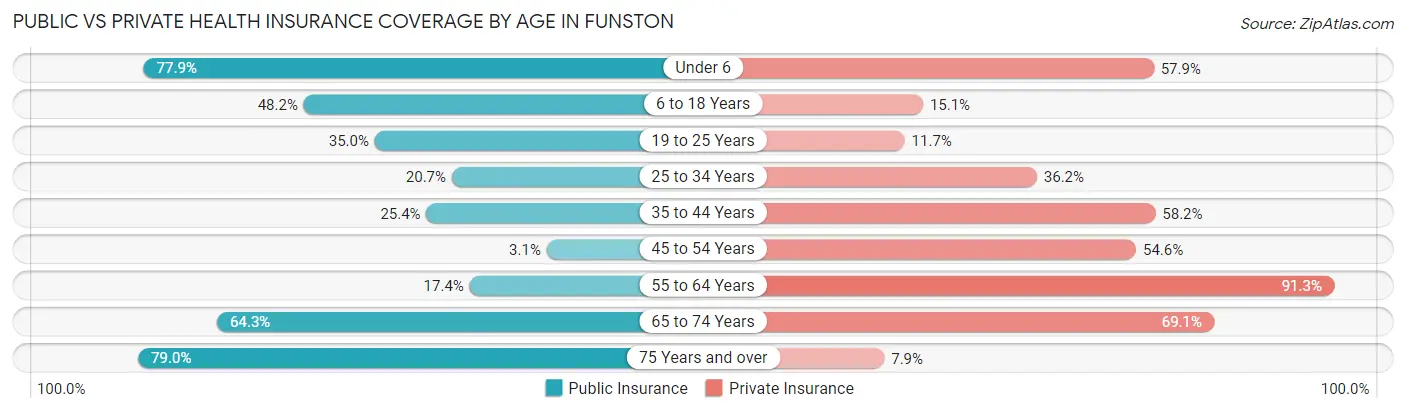
| Age Bracket | Public Insurance | Private Insurance |
| Under 6 | 74 (77.9%) | 55 (57.9%) |
| 6 to 18 Years | 80 (48.2%) | 25 (15.1%) |
| 19 to 25 Years | 21 (35.0%) | 7 (11.7%) |
| 25 to 34 Years | 24 (20.7%) | 42 (36.2%) |
| 35 to 44 Years | 31 (25.4%) | 71 (58.2%) |
| 45 to 54 Years | 4 (3.1%) | 71 (54.6%) |
| 55 to 64 Years | 12 (17.4%) | 63 (91.3%) |
| 65 to 74 Years | 27 (64.3%) | 29 (69.1%) |
| 75 Years and over | 30 (78.9%) | 3 (7.9%) |
| Total | 303 (36.2%) | 366 (43.7%) |
Disability Status by Sex by Age in Funston
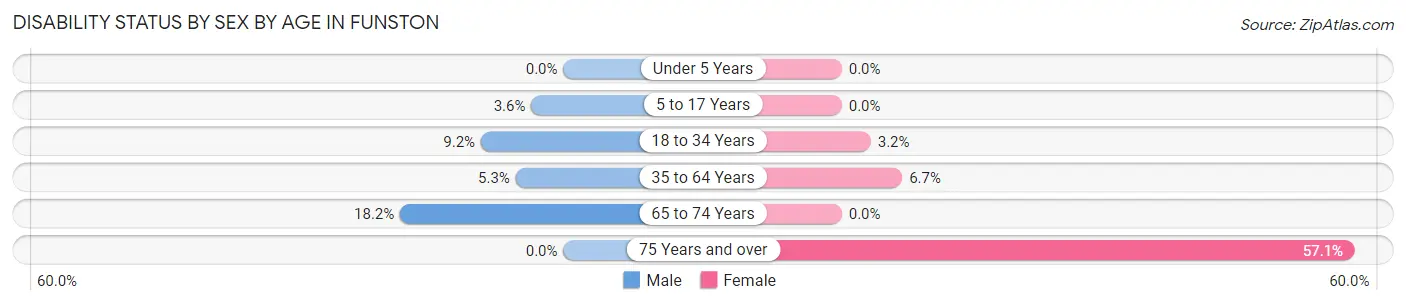
| Age Bracket | Male | Female |
| Under 5 Years | 0 (0.0%) | 0 (0.0%) |
| 5 to 17 Years | 4 (3.6%) | 0 (0.0%) |
| 18 to 34 Years | 9 (9.2%) | 3 (3.2%) |
| 35 to 64 Years | 6 (5.3%) | 14 (6.7%) |
| 65 to 74 Years | 6 (18.2%) | 0 (0.0%) |
| 75 Years and over | 0 (0.0%) | 16 (57.1%) |
Disability Class by Sex by Age in Funston
Disability Class: Hearing Difficulty
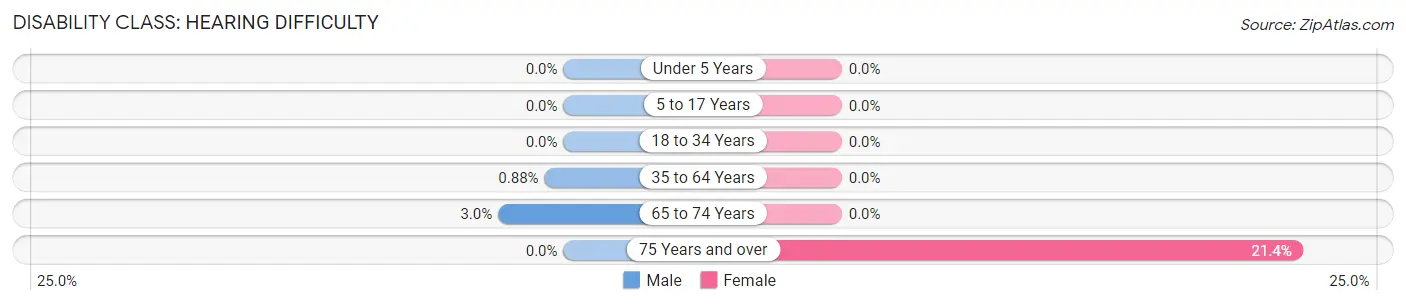
| Age Bracket | Male | Female |
| Under 5 Years | 0 (0.0%) | 0 (0.0%) |
| 5 to 17 Years | 0 (0.0%) | 0 (0.0%) |
| 18 to 34 Years | 0 (0.0%) | 0 (0.0%) |
| 35 to 64 Years | 1 (0.9%) | 0 (0.0%) |
| 65 to 74 Years | 1 (3.0%) | 0 (0.0%) |
| 75 Years and over | 0 (0.0%) | 6 (21.4%) |
Disability Class: Vision Difficulty
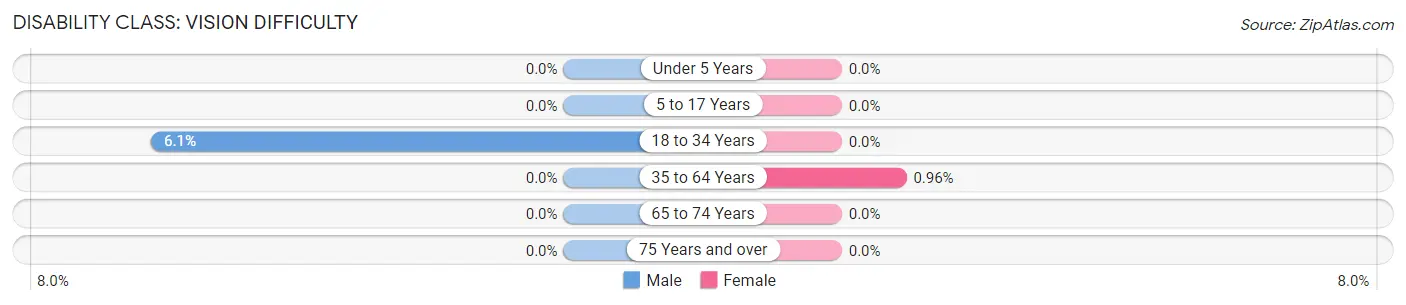
| Age Bracket | Male | Female |
| Under 5 Years | 0 (0.0%) | 0 (0.0%) |
| 5 to 17 Years | 0 (0.0%) | 0 (0.0%) |
| 18 to 34 Years | 6 (6.1%) | 0 (0.0%) |
| 35 to 64 Years | 0 (0.0%) | 2 (1.0%) |
| 65 to 74 Years | 0 (0.0%) | 0 (0.0%) |
| 75 Years and over | 0 (0.0%) | 0 (0.0%) |
Disability Class: Cognitive Difficulty
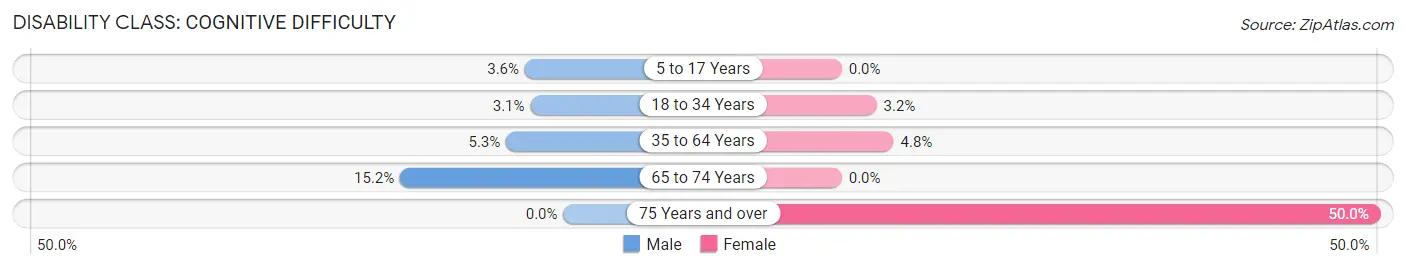
| Age Bracket | Male | Female |
| 5 to 17 Years | 4 (3.6%) | 0 (0.0%) |
| 18 to 34 Years | 3 (3.1%) | 3 (3.2%) |
| 35 to 64 Years | 6 (5.3%) | 10 (4.8%) |
| 65 to 74 Years | 5 (15.1%) | 0 (0.0%) |
| 75 Years and over | 0 (0.0%) | 14 (50.0%) |
Disability Class: Ambulatory Difficulty
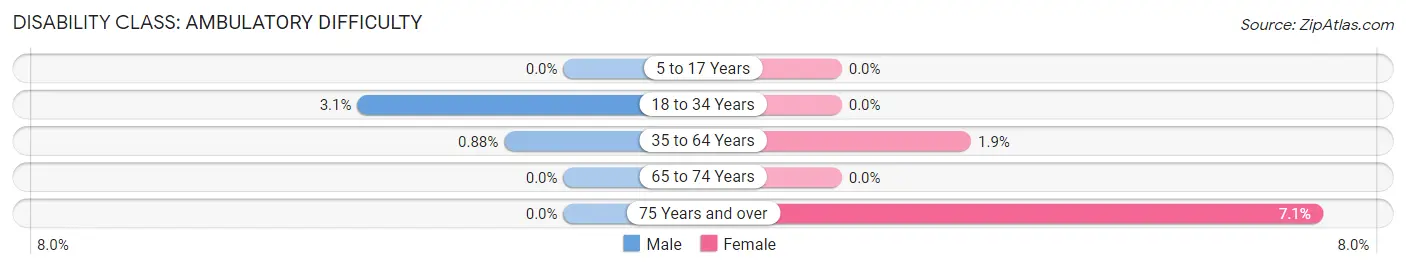
| Age Bracket | Male | Female |
| 5 to 17 Years | 0 (0.0%) | 0 (0.0%) |
| 18 to 34 Years | 3 (3.1%) | 0 (0.0%) |
| 35 to 64 Years | 1 (0.9%) | 4 (1.9%) |
| 65 to 74 Years | 0 (0.0%) | 0 (0.0%) |
| 75 Years and over | 0 (0.0%) | 2 (7.1%) |
Disability Class: Self-Care Difficulty
| Age Bracket | Male | Female |
| 5 to 17 Years | 0 (0.0%) | 0 (0.0%) |
| 18 to 34 Years | 3 (3.1%) | 0 (0.0%) |
| 35 to 64 Years | 0 (0.0%) | 0 (0.0%) |
| 65 to 74 Years | 0 (0.0%) | 0 (0.0%) |
| 75 Years and over | 0 (0.0%) | 0 (0.0%) |
Technology Access in Funston
Computing Device Access in Funston
| Device Type | # Households | % Households |
| Desktop or Laptop | 163 | 63.9% |
| Smartphone | 219 | 85.9% |
| Tablet | 105 | 41.2% |
| No Computing Device | 23 | 9.0% |
| Total | 255 | 100.0% |
Internet Access in Funston
| Internet Type | # Households | % Households |
| Dial-Up Internet | 0 | 0.0% |
| Broadband Home | 135 | 52.9% |
| Cellular Data Only | 65 | 25.5% |
| Satellite Internet | 32 | 12.6% |
| No Internet | 35 | 13.7% |
| Total | 255 | 100.0% |
Funston Summary
Funston, Georgia is a small town located in the southeastern corner of the state, in Colquitt County. It is situated on the banks of the Flint River, and is home to a population of just over 500 people. The town was founded in 1883, and has a rich history of farming, timber, and railroad industries.
Geography
Funston is located in the southeastern corner of Colquitt County, Georgia, and is situated on the banks of the Flint River. The town is located approximately 20 miles south of Moultrie, the county seat, and is bordered by the towns of Berlin, Doerun, and Norman Park. Funston is located in the Coastal Plain region of Georgia, and is characterized by flat terrain and sandy soils. The town is located in a humid subtropical climate, with hot, humid summers and mild winters.
Economy
Funston’s economy is largely based on agriculture and timber production. The town is home to several farms, which produce a variety of crops, including cotton, corn, soybeans, and peanuts. The timber industry is also an important part of the local economy, with several sawmills located in the area. In addition, Funston is home to several small businesses, including a grocery store, a hardware store, and a restaurant.
Demographics
As of the 2010 census, Funston had a population of 517 people. The racial makeup of the town was 79.2% White, 17.7% African American, 0.4% Native American, 0.4% Asian, and 2.3% from other races. The median household income was $30,938, and the median family income was $37,500. The per capita income was $14,945.
Education
Funston is served by the Colquitt County School District, which operates two elementary schools, one middle school, and one high school. The town is also home to a branch of the Moultrie Technical College, which offers a variety of vocational and technical courses.
Conclusion
Funston, Georgia is a small town located in the southeastern corner of the state, in Colquitt County. It is situated on the banks of the Flint River, and is home to a population of just over 500 people. The town was founded in 1883, and has a rich history of farming, timber, and railroad industries. The economy of Funston is largely based on agriculture and timber production, and the town is served by the Colquitt County School District. Funston is a small, rural town with a rich history and a bright future.
Common Questions
What is the Total Population of Funston?
Total Population of Funston is 838.
What is the Total Male Population of Funston?
Total Male Population of Funston is 421.
What is the Total Female Population of Funston?
Total Female Population of Funston is 417.
What is the Ratio of Males per 100 Females in Funston?
There are 100.96 Males per 100 Females in Funston.
What is the Ratio of Females per 100 Males in Funston?
There are 99.05 Females per 100 Males in Funston.
What is the Median Population Age in Funston?
Median Population Age in Funston is 34.4 Years.
What is the Average Family Size in Funston
Average Family Size in Funston is 4.1 People.
What is the Average Household Size in Funston
Average Household Size in Funston is 3.3 People.
What is Per Capita Income in Funston?
Per Capita income in Funston is $20,430.
What is the Median Family Income in Funston?
Median Family Income in Funston is $65,833.
What is the Median Household income in Funston?
Median Household Income in Funston is $56,563.
What is Income or Wage Gap in Funston?
Income or Wage Gap in Funston is 43.2%.
Women in Funston earn 56.8 cents for every dollar earned by a man.
What is Inequality or Gini Index in Funston?
Inequality or Gini Index in Funston is 0.38.
How Large is the Labor Force in Funston?
There are 388 People in the Labor Forcein in Funston.
What is the Percentage of People in the Labor Force in Funston?
65.5% of People are in the Labor Force in Funston.