Porterdale, GA
Porterdale Map
Porterdale Overview
1,602
TOTAL POPULATION
782
MALE POPULATION
820
FEMALE POPULATION
95.37
MALES / 100 FEMALES
104.86
FEMALES / 100 MALES
42.7
MEDIAN AGE
3.4
AVG FAMILY SIZE
2.5
AVG HOUSEHOLD SIZE
$18,265
PER CAPITA INCOME
$44,375
AVG FAMILY INCOME
$36,563
AVG HOUSEHOLD INCOME
9.0%
WAGE / INCOME GAP [ % ]
91.0¢/ $1
WAGE / INCOME GAP [ $ ]
0.44
INEQUALITY / GINI INDEX
579
LABOR FORCE [ PEOPLE ]
46.4%
PERCENT IN LABOR FORCE
3.8%
UNEMPLOYMENT RATE
Porterdale Zip Codes
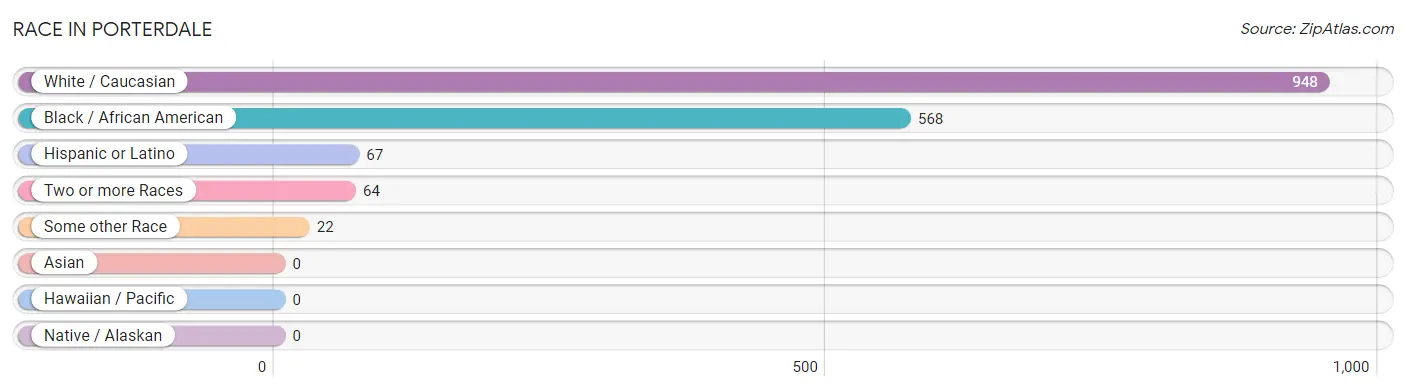
Race in Porterdale
The most populous races in Porterdale are White / Caucasian (948 | 59.2%), Black / African American (568 | 35.5%), and Hispanic or Latino (67 | 4.2%).
| Race | # Population | % Population |
| Asian | 0 | 0.0% |
| Black / African American | 568 | 35.5% |
| Hawaiian / Pacific | 0 | 0.0% |
| Hispanic or Latino | 67 | 4.2% |
| Native / Alaskan | 0 | 0.0% |
| White / Caucasian | 948 | 59.2% |
| Two or more Races | 64 | 4.0% |
| Some other Race | 22 | 1.4% |
| Total | 1,602 | 100.0% |
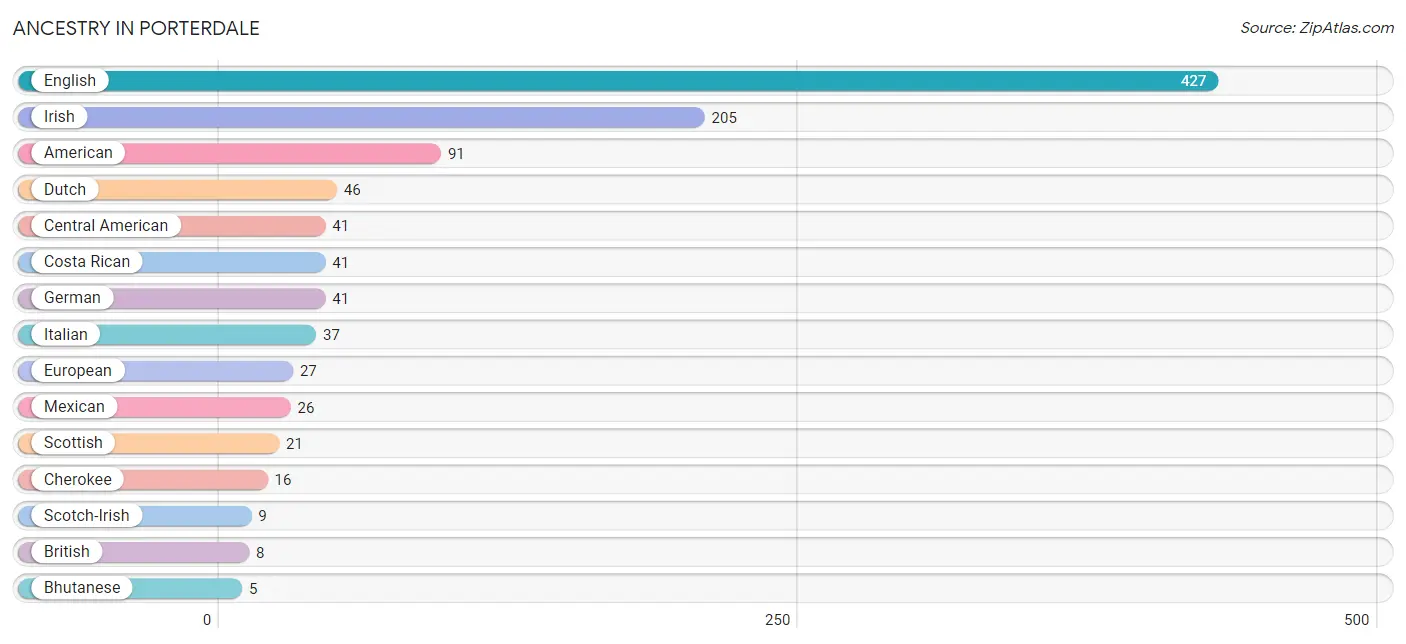
Ancestry in Porterdale
The most populous ancestries reported in Porterdale are English (427 | 26.7%), Irish (205 | 12.8%), American (91 | 5.7%), Dutch (46 | 2.9%), and Central American (41 | 2.6%), together accounting for 50.6% of all Porterdale residents.
| Ancestry | # Population | % Population |
| American | 91 | 5.7% |
| Bhutanese | 5 | 0.3% |
| British | 8 | 0.5% |
| Central American | 41 | 2.6% |
| Cherokee | 16 | 1.0% |
| Costa Rican | 41 | 2.6% |
| Dutch | 46 | 2.9% |
| English | 427 | 26.7% |
| European | 27 | 1.7% |
| French | 4 | 0.3% |
| German | 41 | 2.6% |
| Irish | 205 | 12.8% |
| Italian | 37 | 2.3% |
| Jamaican | 3 | 0.2% |
| Mexican | 26 | 1.6% |
| Polish | 4 | 0.3% |
| Romanian | 4 | 0.3% |
| Scotch-Irish | 9 | 0.6% |
| Scottish | 21 | 1.3% |
| Welsh | 1 | 0.1% | View All 20 Rows |
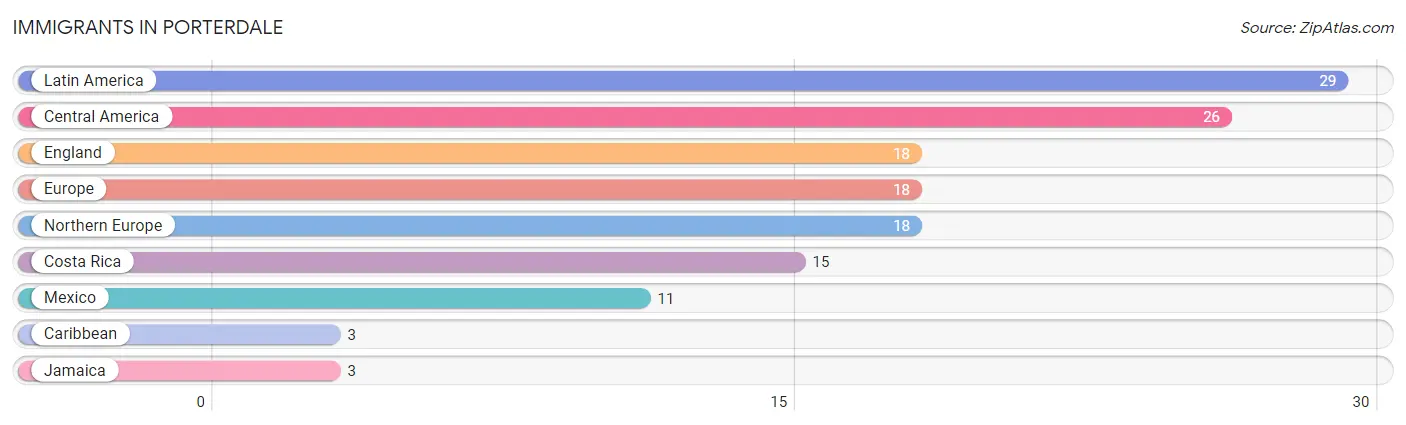
Immigrants in Porterdale
The most numerous immigrant groups reported in Porterdale came from Latin America (29 | 1.8%), Central America (26 | 1.6%), England (18 | 1.1%), Europe (18 | 1.1%), and Northern Europe (18 | 1.1%), together accounting for 6.8% of all Porterdale residents.
| Immigration Origin | # Population | % Population |
| Caribbean | 3 | 0.2% |
| Central America | 26 | 1.6% |
| Costa Rica | 15 | 0.9% |
| England | 18 | 1.1% |
| Europe | 18 | 1.1% |
| Jamaica | 3 | 0.2% |
| Latin America | 29 | 1.8% |
| Mexico | 11 | 0.7% |
| Northern Europe | 18 | 1.1% | View All 9 Rows |
Sex and Age in Porterdale
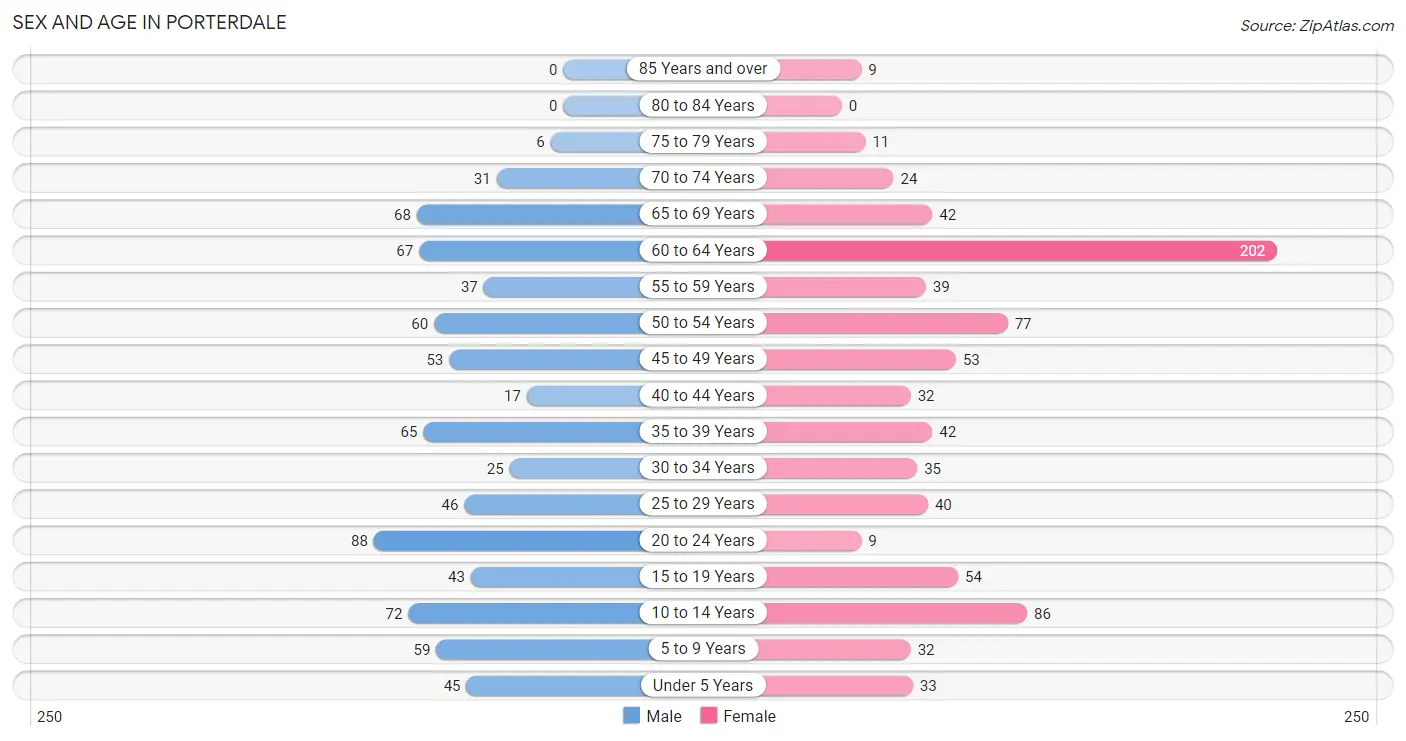
Sex and Age in Porterdale
The most populous age groups in Porterdale are 20 to 24 Years (88 | 11.3%) for men and 60 to 64 Years (202 | 24.6%) for women.
| Age Bracket | Male | Female |
| Under 5 Years | 45 (5.8%) | 33 (4.0%) |
| 5 to 9 Years | 59 (7.5%) | 32 (3.9%) |
| 10 to 14 Years | 72 (9.2%) | 86 (10.5%) |
| 15 to 19 Years | 43 (5.5%) | 54 (6.6%) |
| 20 to 24 Years | 88 (11.3%) | 9 (1.1%) |
| 25 to 29 Years | 46 (5.9%) | 40 (4.9%) |
| 30 to 34 Years | 25 (3.2%) | 35 (4.3%) |
| 35 to 39 Years | 65 (8.3%) | 42 (5.1%) |
| 40 to 44 Years | 17 (2.2%) | 32 (3.9%) |
| 45 to 49 Years | 53 (6.8%) | 53 (6.5%) |
| 50 to 54 Years | 60 (7.7%) | 77 (9.4%) |
| 55 to 59 Years | 37 (4.7%) | 39 (4.8%) |
| 60 to 64 Years | 67 (8.6%) | 202 (24.6%) |
| 65 to 69 Years | 68 (8.7%) | 42 (5.1%) |
| 70 to 74 Years | 31 (4.0%) | 24 (2.9%) |
| 75 to 79 Years | 6 (0.8%) | 11 (1.3%) |
| 80 to 84 Years | 0 (0.0%) | 0 (0.0%) |
| 85 Years and over | 0 (0.0%) | 9 (1.1%) |
| Total | 782 (100.0%) | 820 (100.0%) |
Families and Households in Porterdale
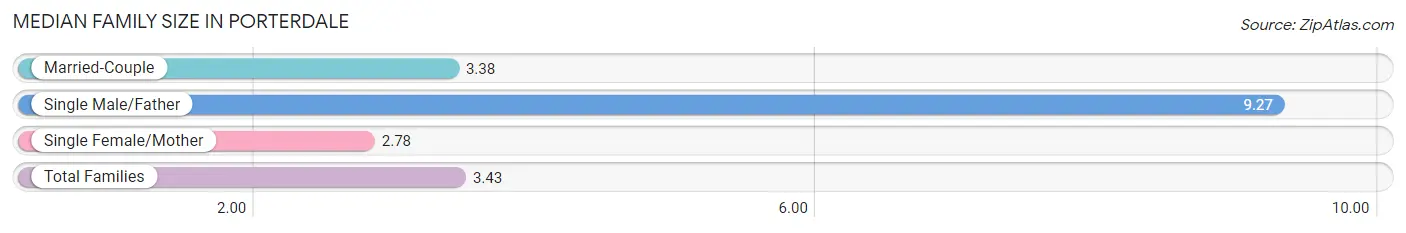
Median Family Size in Porterdale
The median family size in Porterdale is 3.43 persons per family, with single male/father families (11 | 3.0%) accounting for the largest median family size of 9.27 persons per family. On the other hand, single female/mother families (76 | 21.0%) represent the smallest median family size with 2.78 persons per family.
| Family Type | # Families | Family Size |
| Married-Couple | 275 (76.0%) | 3.38 |
| Single Male/Father | 11 (3.0%) | 9.27 |
| Single Female/Mother | 76 (21.0%) | 2.78 |
| Total Families | 362 (100.0%) | 3.43 |
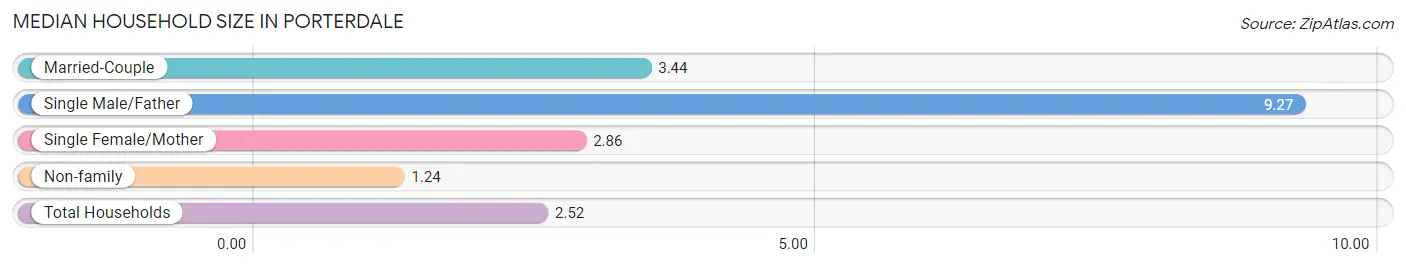
Median Household Size in Porterdale
The median household size in Porterdale is 2.52 persons per household, with single male/father households (11 | 1.7%) accounting for the largest median household size of 9.27 persons per household. non-family households (273 | 43.0%) represent the smallest median household size with 1.24 persons per household.
| Household Type | # Households | Household Size |
| Married-Couple | 275 (43.3%) | 3.44 |
| Single Male/Father | 11 (1.7%) | 9.27 |
| Single Female/Mother | 76 (12.0%) | 2.86 |
| Non-family | 273 (43.0%) | 1.24 |
| Total Households | 635 (100.0%) | 2.52 |
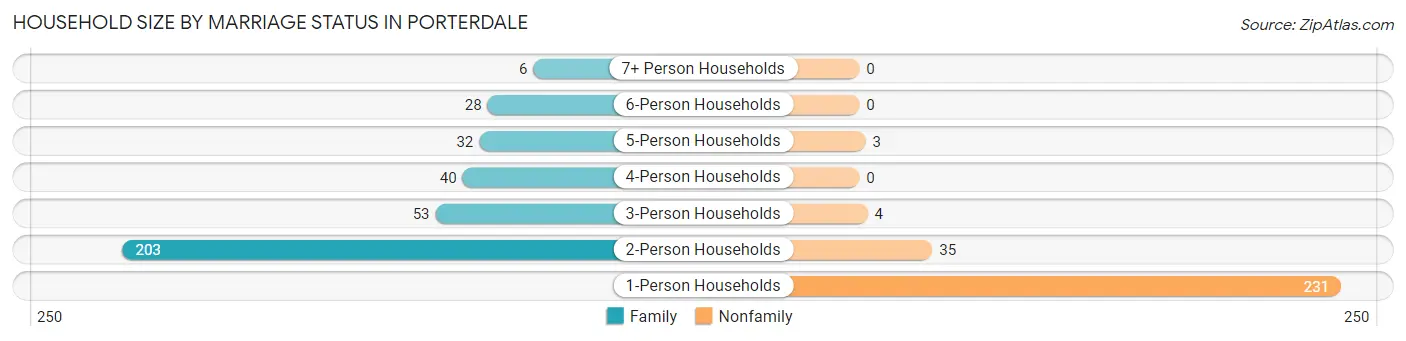
Household Size by Marriage Status in Porterdale
Out of a total of 635 households in Porterdale, 362 (57.0%) are family households, while 273 (43.0%) are nonfamily households. The most numerous type of family households are 2-person households, comprising 203, and the most common type of nonfamily households are 1-person households, comprising 231.
| Household Size | Family Households | Nonfamily Households |
| 1-Person Households | - | 231 (36.4%) |
| 2-Person Households | 203 (32.0%) | 35 (5.5%) |
| 3-Person Households | 53 (8.4%) | 4 (0.6%) |
| 4-Person Households | 40 (6.3%) | 0 (0.0%) |
| 5-Person Households | 32 (5.0%) | 3 (0.5%) |
| 6-Person Households | 28 (4.4%) | 0 (0.0%) |
| 7+ Person Households | 6 (0.9%) | 0 (0.0%) |
| Total | 362 (57.0%) | 273 (43.0%) |
Female Fertility in Porterdale
Fertility by Age in Porterdale
Average fertility rate in Porterdale is 19.0 births per 1,000 women. Women in the age bracket of 20 to 34 years have the highest fertility rate with 60.0 births per 1,000 women. Women in the age bracket of 20 to 34 years acount for 100.0% of all women with births.
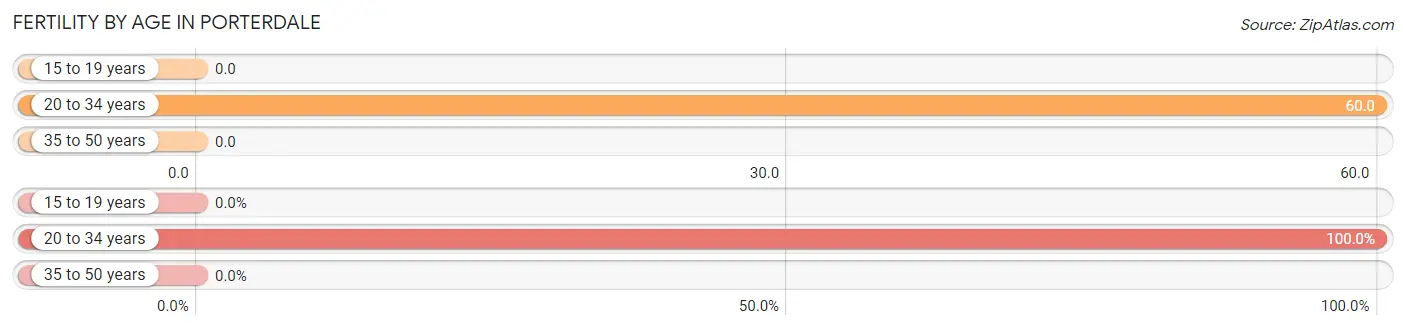
| Age Bracket | Women with Births | Births / 1,000 Women |
| 15 to 19 years | 0 (0.0%) | 0.0 |
| 20 to 34 years | 5 (100.0%) | 60.0 |
| 35 to 50 years | 0 (0.0%) | 0.0 |
| Total | 5 (100.0%) | 19.0 |
Fertility by Age by Marriage Status in Porterdale
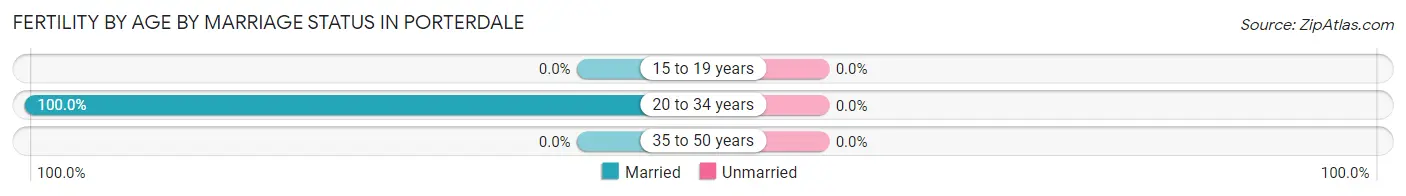
| Age Bracket | Married | Unmarried |
| 15 to 19 years | 0 (0.0%) | 0 (0.0%) |
| 20 to 34 years | 5 (100.0%) | 0 (0.0%) |
| 35 to 50 years | 0 (0.0%) | 0 (0.0%) |
| Total | 5 (100.0%) | 0 (0.0%) |
Fertility by Education in Porterdale
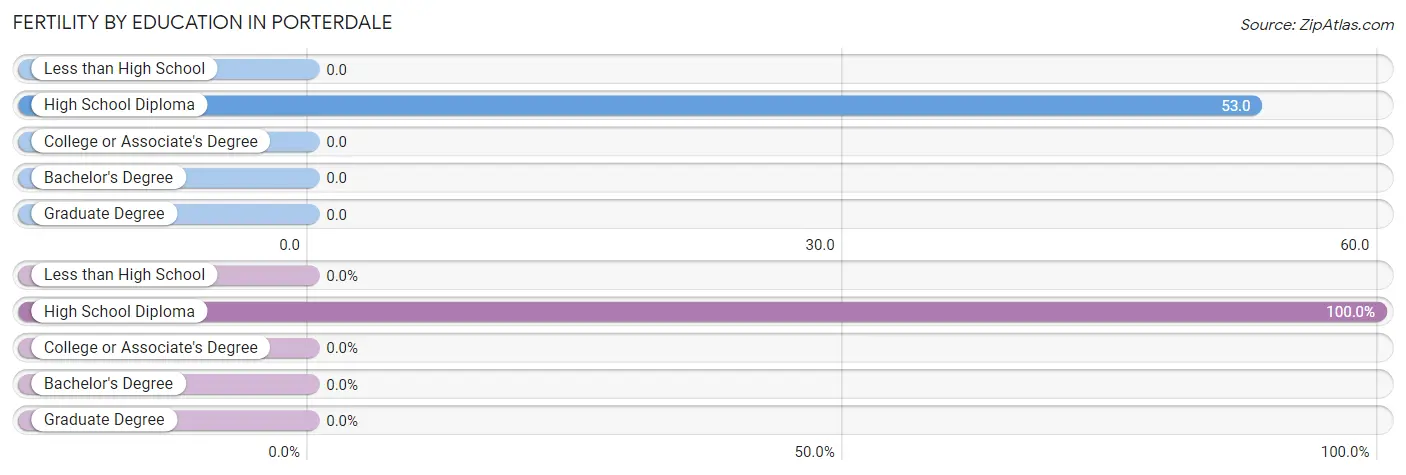
| Educational Attainment | Women with Births | Births / 1,000 Women |
| Less than High School | 0 (0.0%) | 0.0 |
| High School Diploma | 5 (100.0%) | 53.0 |
| College or Associate's Degree | 0 (0.0%) | 0.0 |
| Bachelor's Degree | 0 (0.0%) | 0.0 |
| Graduate Degree | 0 (0.0%) | 0.0 |
| Total | 5 (100.0%) | 19.0 |
Fertility by Education by Marriage Status in Porterdale
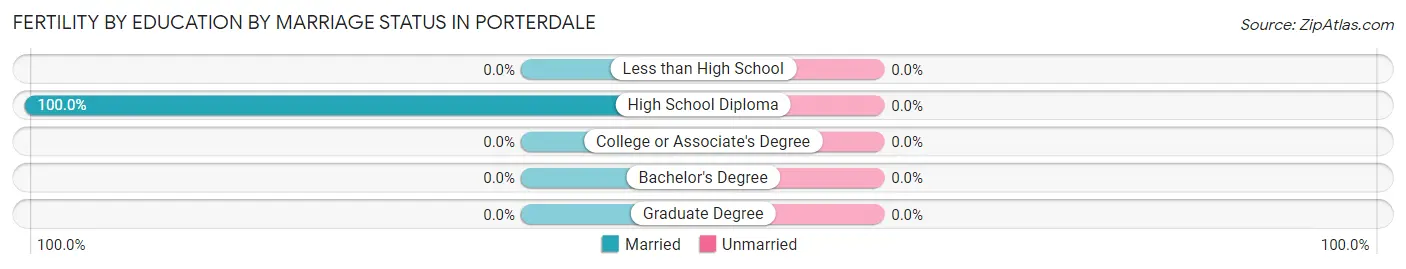
| Educational Attainment | Married | Unmarried |
| Less than High School | 0 (0.0%) | 0 (0.0%) |
| High School Diploma | 5 (100.0%) | 0 (0.0%) |
| College or Associate's Degree | 0 (0.0%) | 0 (0.0%) |
| Bachelor's Degree | 0 (0.0%) | 0 (0.0%) |
| Graduate Degree | 0 (0.0%) | 0 (0.0%) |
| Total | 5 (100.0%) | 0 (0.0%) |
Income in Porterdale
Income Overview in Porterdale
Per Capita Income in Porterdale is $18,265, while median incomes of families and households are $44,375 and $36,563 respectively.
| Characteristic | Number | Measure |
| Per Capita Income | 1,602 | $18,265 |
| Median Family Income | 362 | $44,375 |
| Mean Family Income | 362 | $52,834 |
| Median Household Income | 635 | $36,563 |
| Mean Household Income | 635 | $44,290 |
| Income Deficit | 362 | $0 |
| Wage / Income Gap (%) | 1,602 | 9.04% |
| Wage / Income Gap ($) | 1,602 | 90.96¢ per $1 |
| Gini / Inequality Index | 1,602 | 0.44 |
Earnings by Sex in Porterdale
Average Earnings in Porterdale are $28,867, $26,935 for men and $29,612 for women, a difference of 9.0%.
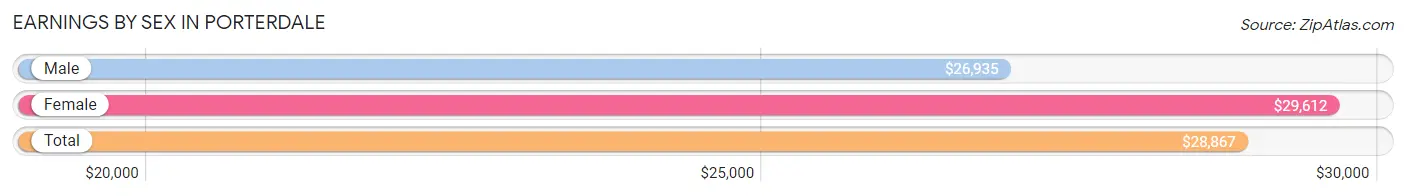
| Sex | Number | Average Earnings |
| Male | 360 (58.0%) | $26,935 |
| Female | 261 (42.0%) | $29,612 |
| Total | 621 (100.0%) | $28,867 |
Earnings by Sex by Income Bracket in Porterdale
The most common earnings brackets in Porterdale are $22,500 to $24,999 for men (69 | 19.2%) and $25,000 to $29,999 for women (29 | 11.1%).
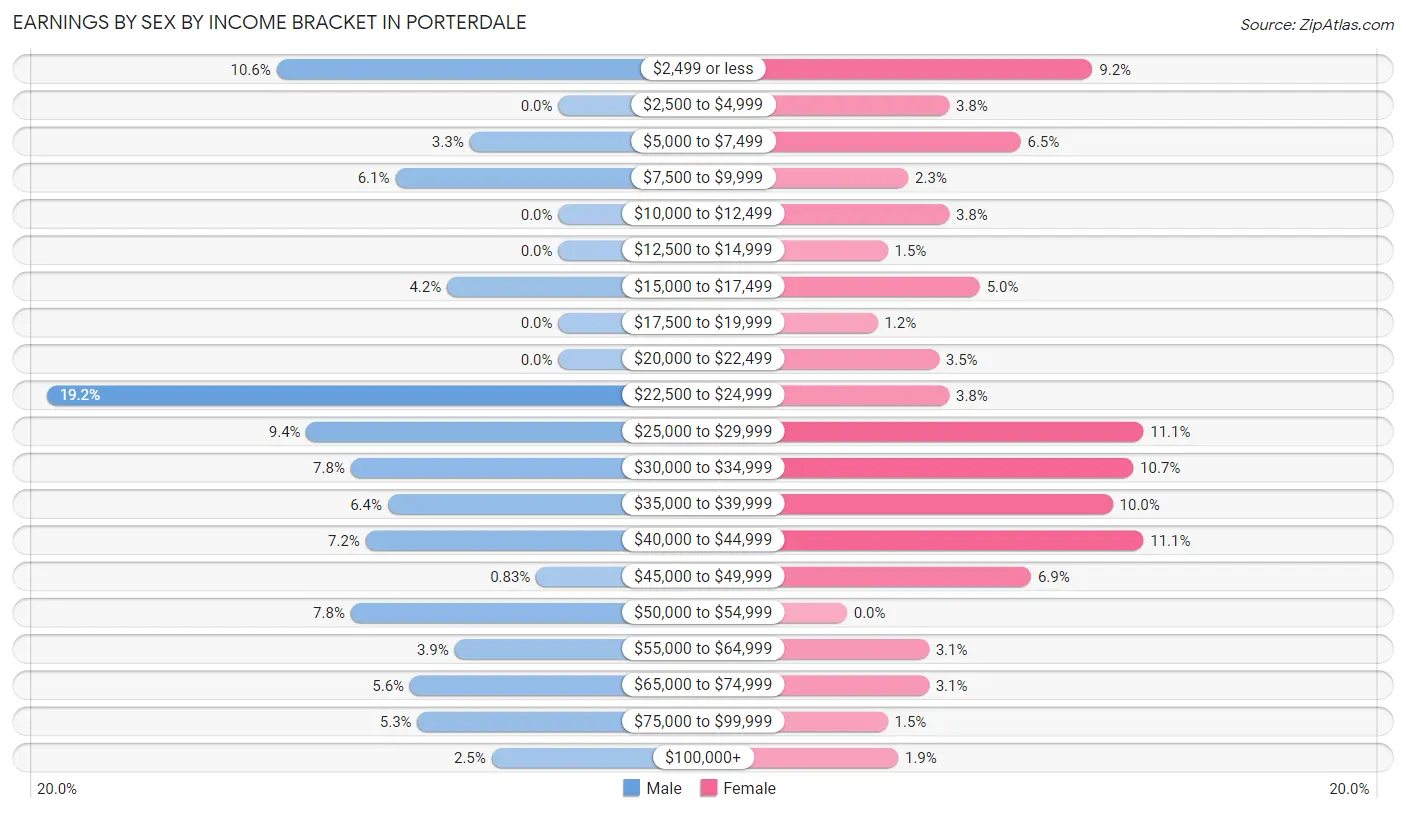
| Income | Male | Female |
| $2,499 or less | 38 (10.6%) | 24 (9.2%) |
| $2,500 to $4,999 | 0 (0.0%) | 10 (3.8%) |
| $5,000 to $7,499 | 12 (3.3%) | 17 (6.5%) |
| $7,500 to $9,999 | 22 (6.1%) | 6 (2.3%) |
| $10,000 to $12,499 | 0 (0.0%) | 10 (3.8%) |
| $12,500 to $14,999 | 0 (0.0%) | 4 (1.5%) |
| $15,000 to $17,499 | 15 (4.2%) | 13 (5.0%) |
| $17,500 to $19,999 | 0 (0.0%) | 3 (1.1%) |
| $20,000 to $22,499 | 0 (0.0%) | 9 (3.5%) |
| $22,500 to $24,999 | 69 (19.2%) | 10 (3.8%) |
| $25,000 to $29,999 | 34 (9.4%) | 29 (11.1%) |
| $30,000 to $34,999 | 28 (7.8%) | 28 (10.7%) |
| $35,000 to $39,999 | 23 (6.4%) | 26 (10.0%) |
| $40,000 to $44,999 | 26 (7.2%) | 29 (11.1%) |
| $45,000 to $49,999 | 3 (0.8%) | 18 (6.9%) |
| $50,000 to $54,999 | 28 (7.8%) | 0 (0.0%) |
| $55,000 to $64,999 | 14 (3.9%) | 8 (3.1%) |
| $65,000 to $74,999 | 20 (5.6%) | 8 (3.1%) |
| $75,000 to $99,999 | 19 (5.3%) | 4 (1.5%) |
| $100,000+ | 9 (2.5%) | 5 (1.9%) |
| Total | 360 (100.0%) | 261 (100.0%) |
Earnings by Sex by Educational Attainment in Porterdale
Average earnings in Porterdale are $31,607 for men and $30,000 for women, a difference of 5.1%. Men with an educational attainment of college or associate's degree enjoy the highest average annual earnings of $52,596, while those with less than high school education earn the least with $26,000. Women with an educational attainment of high school diploma earn the most with the average annual earnings of $37,788, while those with college or associate's degree education have the smallest earnings of $23,281.
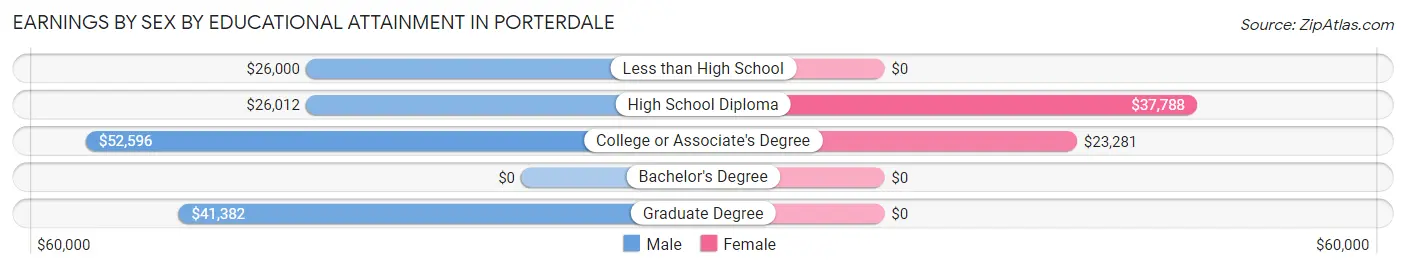
| Educational Attainment | Male Income | Female Income |
| Less than High School | $26,000 | $0 |
| High School Diploma | $26,012 | $37,788 |
| College or Associate's Degree | $52,596 | $23,281 |
| Bachelor's Degree | - | - |
| Graduate Degree | $41,382 | $0 |
| Total | $31,607 | $30,000 |
Family Income in Porterdale
Family Income Brackets in Porterdale
According to the Porterdale family income data, there are 113 families falling into the $10,000 to $14,999 income range, which is the most common income bracket and makes up 31.2% of all families.
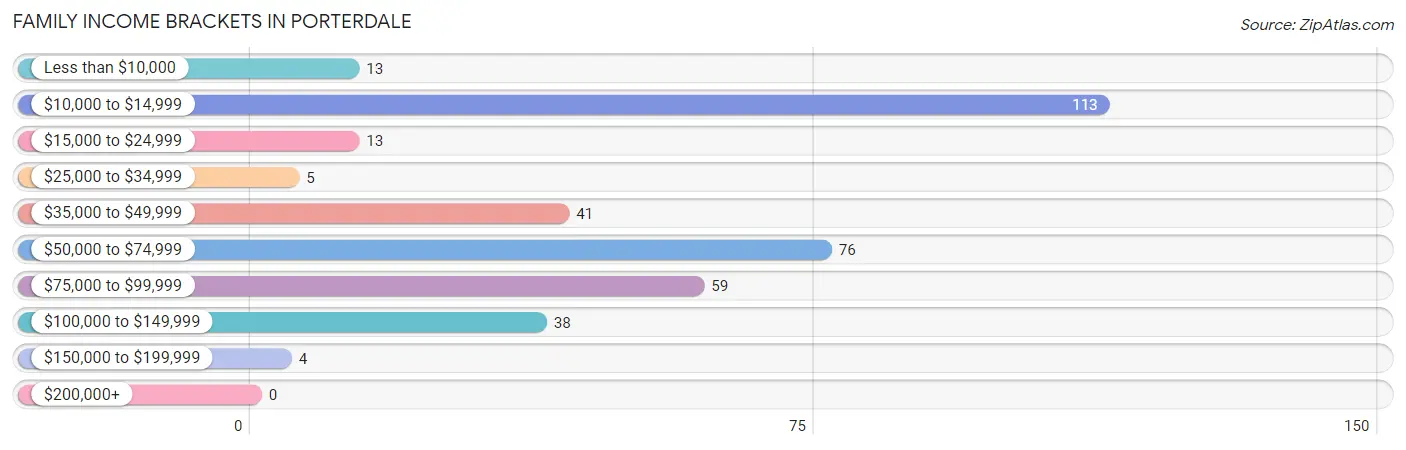
| Income Bracket | # Families | % Families |
| Less than $10,000 | 13 | 3.6% |
| $10,000 to $14,999 | 113 | 31.2% |
| $15,000 to $24,999 | 13 | 3.6% |
| $25,000 to $34,999 | 5 | 1.4% |
| $35,000 to $49,999 | 41 | 11.3% |
| $50,000 to $74,999 | 76 | 21.0% |
| $75,000 to $99,999 | 59 | 16.3% |
| $100,000 to $149,999 | 38 | 10.5% |
| $150,000 to $199,999 | 4 | 1.1% |
| $200,000+ | 0 | 0.0% |
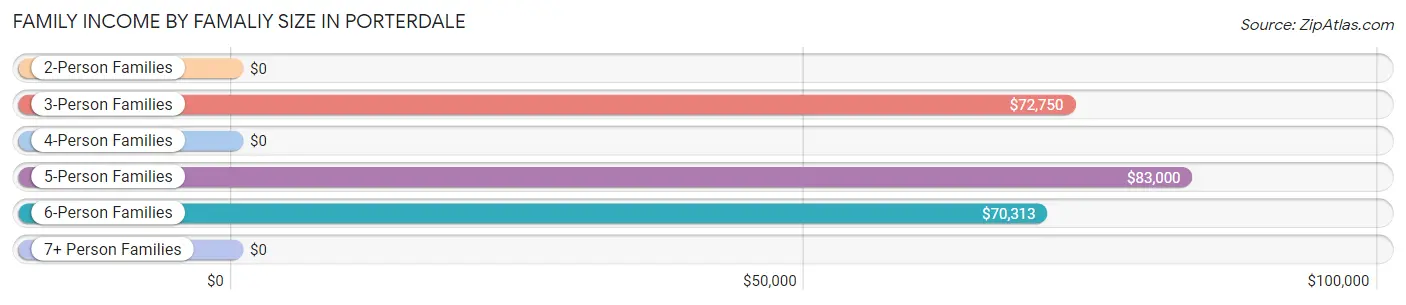
Family Income by Famaliy Size in Porterdale
5-person families (32 | 8.8%) account for the highest median family income in Porterdale with $83,000 per family, while 3-person families (47 | 13.0%) have the highest median income of $24,250 per family member.
| Income Bracket | # Families | Median Income |
| 2-Person Families | 215 (59.4%) | $0 |
| 3-Person Families | 47 (13.0%) | $72,750 |
| 4-Person Families | 34 (9.4%) | $0 |
| 5-Person Families | 32 (8.8%) | $83,000 |
| 6-Person Families | 28 (7.7%) | $70,313 |
| 7+ Person Families | 6 (1.7%) | $0 |
| Total | 362 (100.0%) | $44,375 |
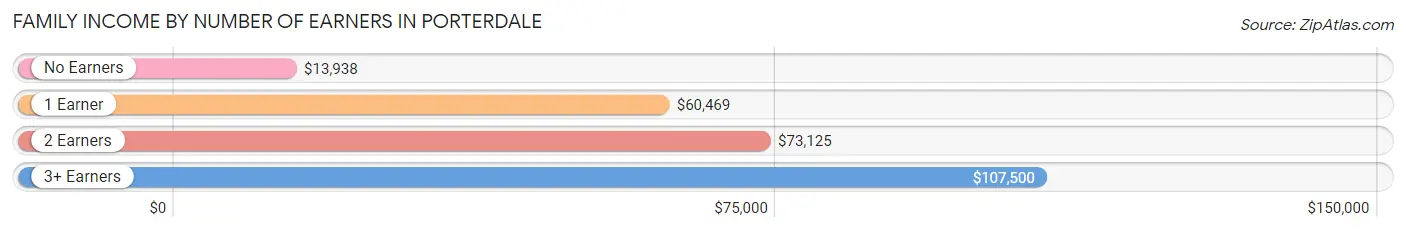
Family Income by Number of Earners in Porterdale
The median family income in Porterdale is $44,375, with families comprising 3+ earners (14) having the highest median family income of $107,500, while families with no earners (135) have the lowest median family income of $13,938, accounting for 3.9% and 37.3% of families, respectively.
| Number of Earners | # Families | Median Income |
| No Earners | 135 (37.3%) | $13,938 |
| 1 Earner | 105 (29.0%) | $60,469 |
| 2 Earners | 108 (29.8%) | $73,125 |
| 3+ Earners | 14 (3.9%) | $107,500 |
| Total | 362 (100.0%) | $44,375 |
Household Income in Porterdale
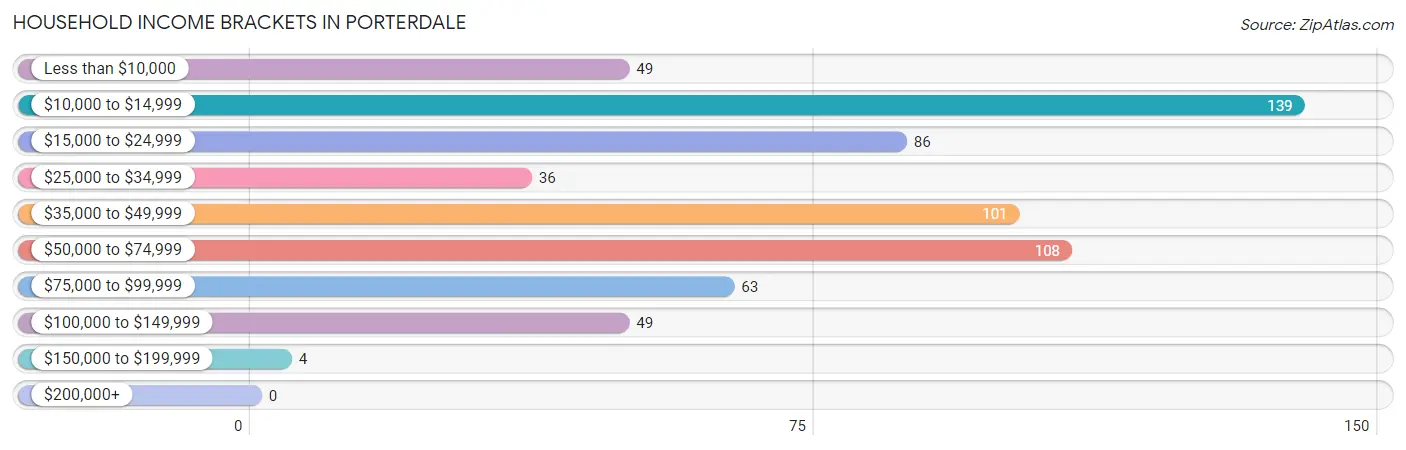
Household Income Brackets in Porterdale
With 139 households falling in the category, the $10,000 to $14,999 income range is the most frequent in Porterdale, accounting for 21.9% of all households.
| Income Bracket | # Households | % Households |
| Less than $10,000 | 49 | 7.7% |
| $10,000 to $14,999 | 139 | 21.9% |
| $15,000 to $24,999 | 86 | 13.5% |
| $25,000 to $34,999 | 36 | 5.7% |
| $35,000 to $49,999 | 101 | 15.9% |
| $50,000 to $74,999 | 108 | 17.0% |
| $75,000 to $99,999 | 63 | 9.9% |
| $100,000 to $149,999 | 49 | 7.7% |
| $150,000 to $199,999 | 4 | 0.6% |
| $200,000+ | 0 | 0.0% |
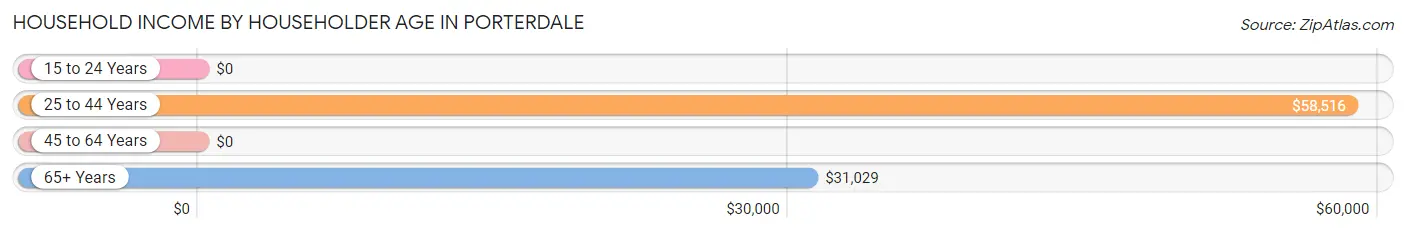
Household Income by Householder Age in Porterdale
The median household income in Porterdale is $36,563, with the highest median household income of $58,516 found in the 25 to 44 years age bracket for the primary householder. A total of 135 households (21.3%) fall into this category. Meanwhile, the 15 to 24 years age bracket for the primary householder has the lowest median household income of $0, with 4 households (0.6%) in this group.
| Income Bracket | # Households | Median Income |
| 15 to 24 Years | 4 (0.6%) | $0 |
| 25 to 44 Years | 135 (21.3%) | $58,516 |
| 45 to 64 Years | 354 (55.7%) | $0 |
| 65+ Years | 142 (22.4%) | $31,029 |
| Total | 635 (100.0%) | $36,563 |
Poverty in Porterdale
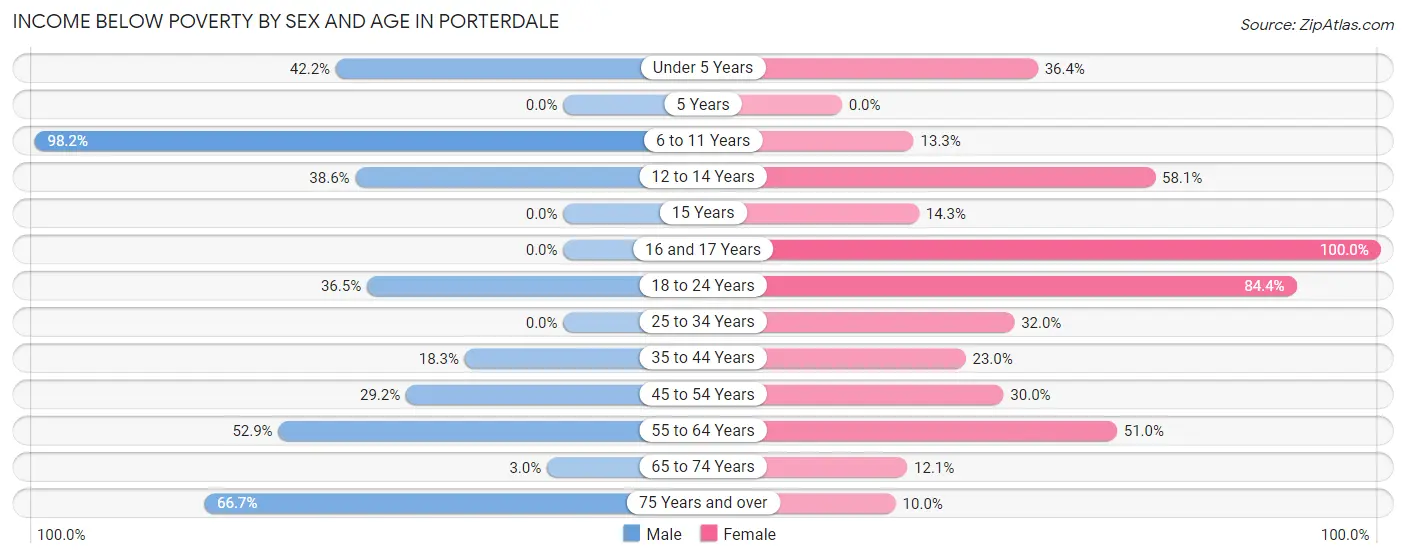
Income Below Poverty by Sex and Age in Porterdale
With 31.1% poverty level for males and 35.8% for females among the residents of Porterdale, 6 to 11 year old males and 16 and 17 year old females are the most vulnerable to poverty, with 53 males (98.2%) and 3 females (100.0%) in their respective age groups living below the poverty level.
| Age Bracket | Male | Female |
| Under 5 Years | 19 (42.2%) | 12 (36.4%) |
| 5 Years | 0 (0.0%) | 0 (0.0%) |
| 6 to 11 Years | 53 (98.2%) | 10 (13.3%) |
| 12 to 14 Years | 22 (38.6%) | 25 (58.1%) |
| 15 Years | 0 (0.0%) | 4 (14.3%) |
| 16 and 17 Years | 0 (0.0%) | 3 (100.0%) |
| 18 to 24 Years | 39 (36.4%) | 27 (84.4%) |
| 25 to 34 Years | 0 (0.0%) | 24 (32.0%) |
| 35 to 44 Years | 15 (18.3%) | 17 (23.0%) |
| 45 to 54 Years | 33 (29.2%) | 39 (30.0%) |
| 55 to 64 Years | 55 (52.9%) | 123 (51.0%) |
| 65 to 74 Years | 3 (3.0%) | 8 (12.1%) |
| 75 Years and over | 4 (66.7%) | 2 (10.0%) |
| Total | 243 (31.1%) | 294 (35.8%) |
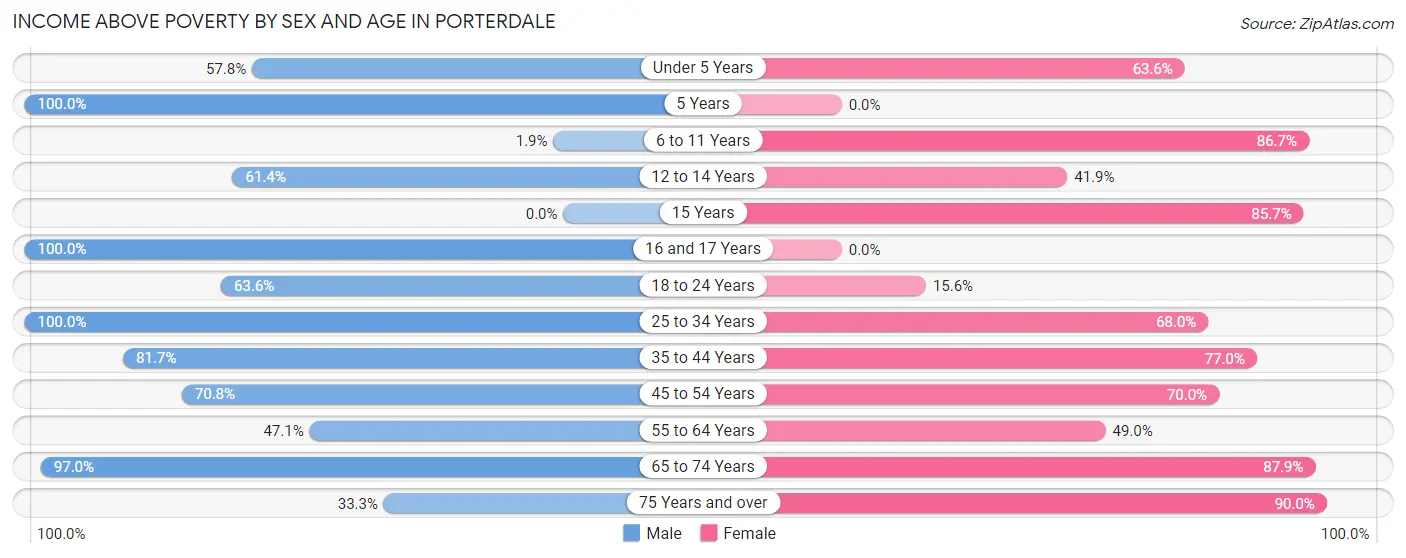
Income Above Poverty by Sex and Age in Porterdale
According to the poverty statistics in Porterdale, males aged 5 years and females aged 75 years and over are the age groups that are most secure financially, with 100.0% of males and 90.0% of females in these age groups living above the poverty line.
| Age Bracket | Male | Female |
| Under 5 Years | 26 (57.8%) | 21 (63.6%) |
| 5 Years | 20 (100.0%) | 0 (0.0%) |
| 6 to 11 Years | 1 (1.8%) | 65 (86.7%) |
| 12 to 14 Years | 35 (61.4%) | 18 (41.9%) |
| 15 Years | 0 (0.0%) | 24 (85.7%) |
| 16 and 17 Years | 24 (100.0%) | 0 (0.0%) |
| 18 to 24 Years | 68 (63.5%) | 5 (15.6%) |
| 25 to 34 Years | 71 (100.0%) | 51 (68.0%) |
| 35 to 44 Years | 67 (81.7%) | 57 (77.0%) |
| 45 to 54 Years | 80 (70.8%) | 91 (70.0%) |
| 55 to 64 Years | 49 (47.1%) | 118 (49.0%) |
| 65 to 74 Years | 96 (97.0%) | 58 (87.9%) |
| 75 Years and over | 2 (33.3%) | 18 (90.0%) |
| Total | 539 (68.9%) | 526 (64.1%) |
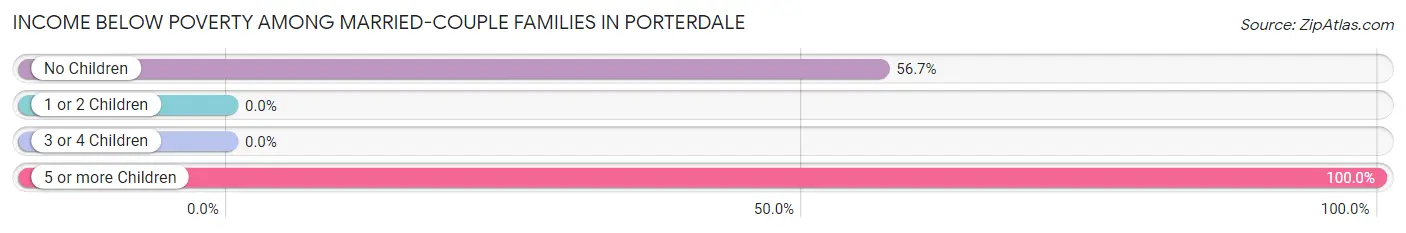
Income Below Poverty Among Married-Couple Families in Porterdale
The poverty statistics for married-couple families in Porterdale show that 41.1% or 113 of the total 275 families live below the poverty line. Families with 5 or more children have the highest poverty rate of 100.0%, comprising of 3 families. On the other hand, families with 1 or 2 children have the lowest poverty rate of 0.0%, which includes 0 families.
| Children | Above Poverty | Below Poverty |
| No Children | 84 (43.3%) | 110 (56.7%) |
| 1 or 2 Children | 47 (100.0%) | 0 (0.0%) |
| 3 or 4 Children | 31 (100.0%) | 0 (0.0%) |
| 5 or more Children | 0 (0.0%) | 3 (100.0%) |
| Total | 162 (58.9%) | 113 (41.1%) |
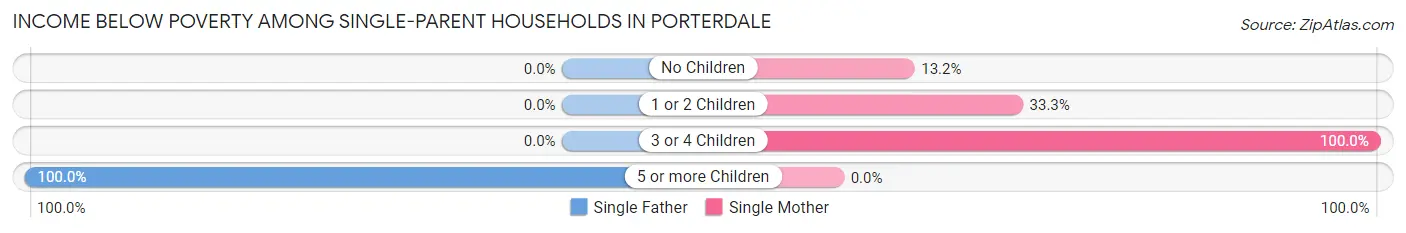
Income Below Poverty Among Single-Parent Households in Porterdale
According to the poverty data in Porterdale, 27.3% or 3 single-father households and 27.6% or 21 single-mother households are living below the poverty line. Among single-father households, those with 5 or more children have the highest poverty rate, with 3 households (100.0%) experiencing poverty. Likewise, among single-mother households, those with 3 or 4 children have the highest poverty rate, with 5 households (100.0%) falling below the poverty line.
| Children | Single Father | Single Mother |
| No Children | 0 (0.0%) | 5 (13.2%) |
| 1 or 2 Children | 0 (0.0%) | 11 (33.3%) |
| 3 or 4 Children | 0 (0.0%) | 5 (100.0%) |
| 5 or more Children | 3 (100.0%) | 0 (0.0%) |
| Total | 3 (27.3%) | 21 (27.6%) |
Income Below Poverty Among Married-Couple vs Single-Parent Households in Porterdale
The poverty data for Porterdale shows that 113 of the married-couple family households (41.1%) and 24 of the single-parent households (27.6%) are living below the poverty level. Within the married-couple family households, those with 5 or more children have the highest poverty rate, with 3 households (100.0%) falling below the poverty line. Among the single-parent households, those with 3 or 4 children have the highest poverty rate, with 5 household (100.0%) living below poverty.
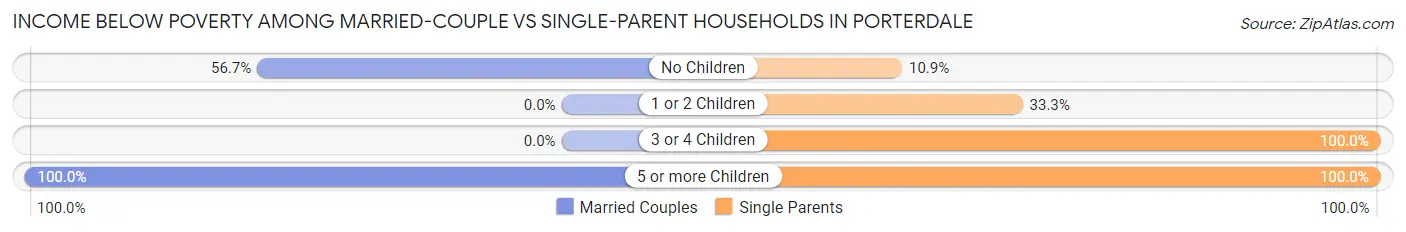
| Children | Married-Couple Families | Single-Parent Households |
| No Children | 110 (56.7%) | 5 (10.9%) |
| 1 or 2 Children | 0 (0.0%) | 11 (33.3%) |
| 3 or 4 Children | 0 (0.0%) | 5 (100.0%) |
| 5 or more Children | 3 (100.0%) | 3 (100.0%) |
| Total | 113 (41.1%) | 24 (27.6%) |
Employment Characteristics in Porterdale
Employment by Class of Employer in Porterdale
Among the 556 employed individuals in Porterdale, private company employees (403 | 72.5%), self-employed (not incorporated) (36 | 6.5%), and not-for-profit organizations (35 | 6.3%) make up the most common classes of employment.
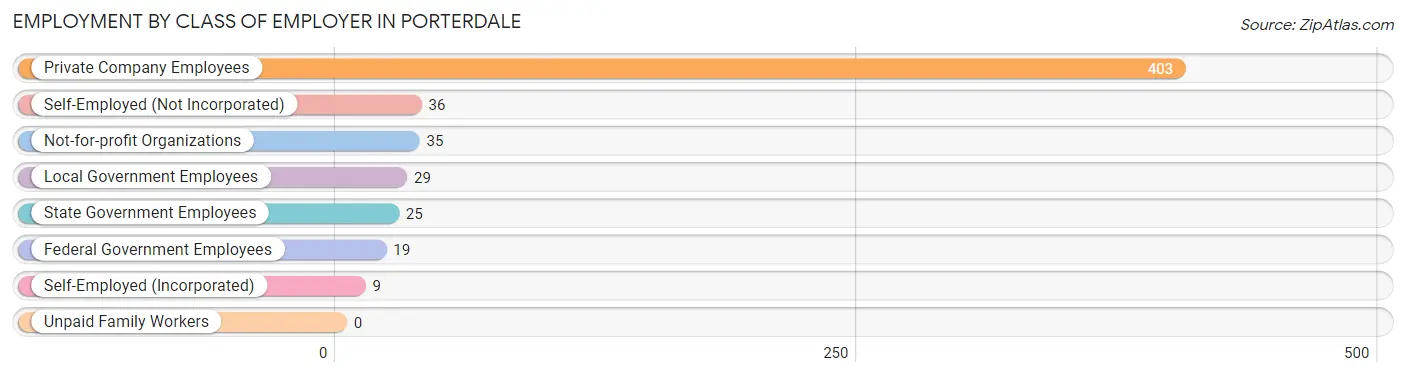
| Employer Class | # Employees | % Employees |
| Private Company Employees | 403 | 72.5% |
| Self-Employed (Incorporated) | 9 | 1.6% |
| Self-Employed (Not Incorporated) | 36 | 6.5% |
| Not-for-profit Organizations | 35 | 6.3% |
| Local Government Employees | 29 | 5.2% |
| State Government Employees | 25 | 4.5% |
| Federal Government Employees | 19 | 3.4% |
| Unpaid Family Workers | 0 | 0.0% |
| Total | 556 | 100.0% |
Employment Status by Age in Porterdale
According to the labor force statistics for Porterdale, out of the total population over 16 years of age (1,247), 46.4% or 579 individuals are in the labor force, with 3.8% or 22 of them unemployed. The age group with the highest labor force participation rate is 35 to 44 years, with 82.7% or 129 individuals in the labor force. Within the labor force, the 16 to 19 years age range has the highest percentage of unemployed individuals, with 38.1% or 8 of them being unemployed.
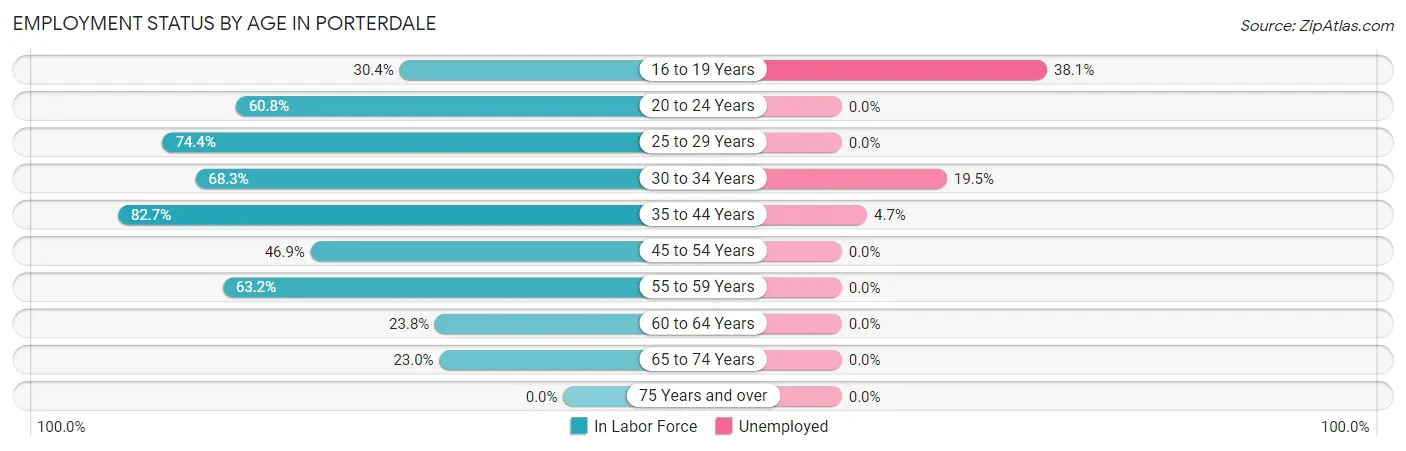
| Age Bracket | In Labor Force | Unemployed |
| 16 to 19 Years | 21 (30.4%) | 8 (38.1%) |
| 20 to 24 Years | 59 (60.8%) | 0 (0.0%) |
| 25 to 29 Years | 64 (74.4%) | 0 (0.0%) |
| 30 to 34 Years | 41 (68.3%) | 8 (19.5%) |
| 35 to 44 Years | 129 (82.7%) | 6 (4.7%) |
| 45 to 54 Years | 114 (46.9%) | 0 (0.0%) |
| 55 to 59 Years | 48 (63.2%) | 0 (0.0%) |
| 60 to 64 Years | 64 (23.8%) | 0 (0.0%) |
| 65 to 74 Years | 38 (23.0%) | 0 (0.0%) |
| 75 Years and over | 0 (0.0%) | 0 (0.0%) |
| Total | 579 (46.4%) | 22 (3.8%) |
Employment Status by Educational Attainment in Porterdale
According to labor force statistics for Porterdale, 51.7% of individuals (460) out of the total population between 25 and 64 years of age (890) are in the labor force, with 3.0% or 14 of them being unemployed. The group with the highest labor force participation rate are those with the educational attainment of bachelor's degree or higher, with 77.6% or 97 individuals in the labor force. Within the labor force, individuals with less than high school education have the highest percentage of unemployment, with 8.5% or 8 of them being unemployed.
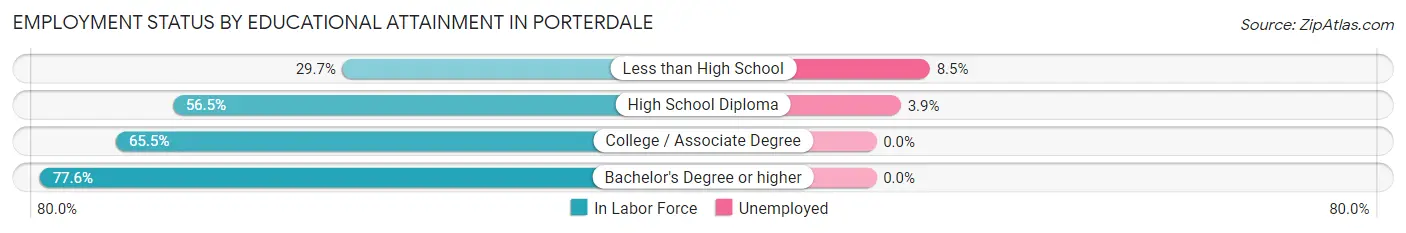
| Educational Attainment | In Labor Force | Unemployed |
| Less than High School | 94 (29.7%) | 27 (8.5%) |
| High School Diploma | 153 (56.5%) | 11 (3.9%) |
| College / Associate Degree | 116 (65.5%) | 0 (0.0%) |
| Bachelor's Degree or higher | 97 (77.6%) | 0 (0.0%) |
| Total | 460 (51.7%) | 27 (3.0%) |
Employment Occupations by Sex in Porterdale
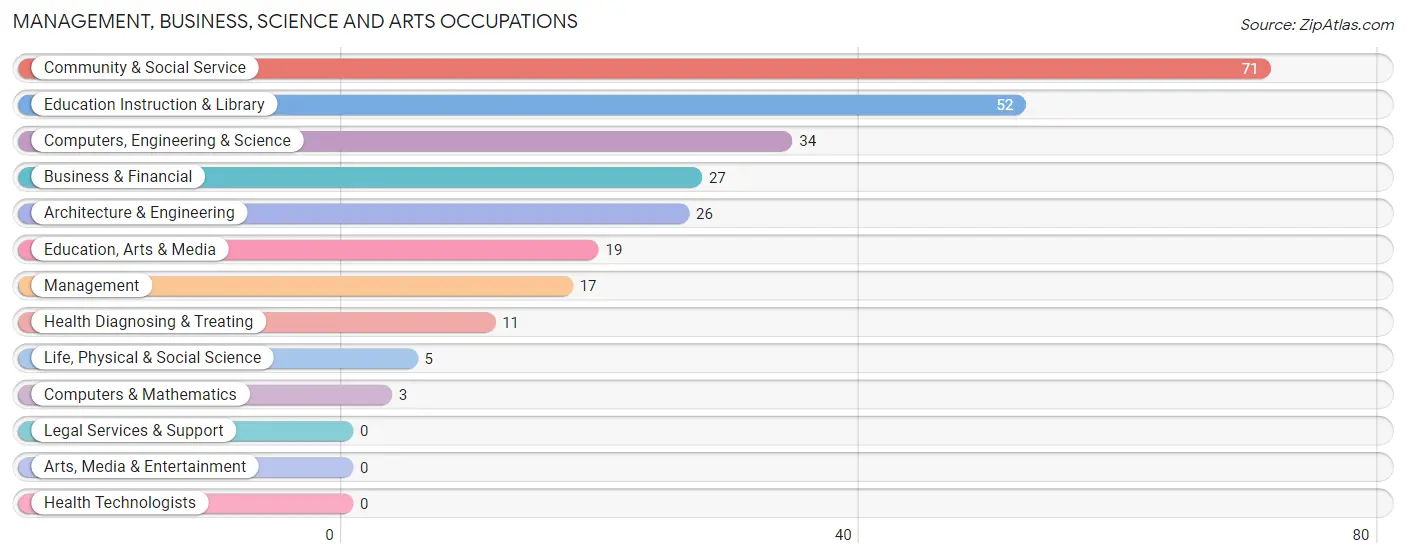
Management, Business, Science and Arts Occupations
The most common Management, Business, Science and Arts occupations in Porterdale are Community & Social Service (71 | 12.8%), Education Instruction & Library (52 | 9.3%), Computers, Engineering & Science (34 | 6.1%), Business & Financial (27 | 4.9%), and Architecture & Engineering (26 | 4.7%).
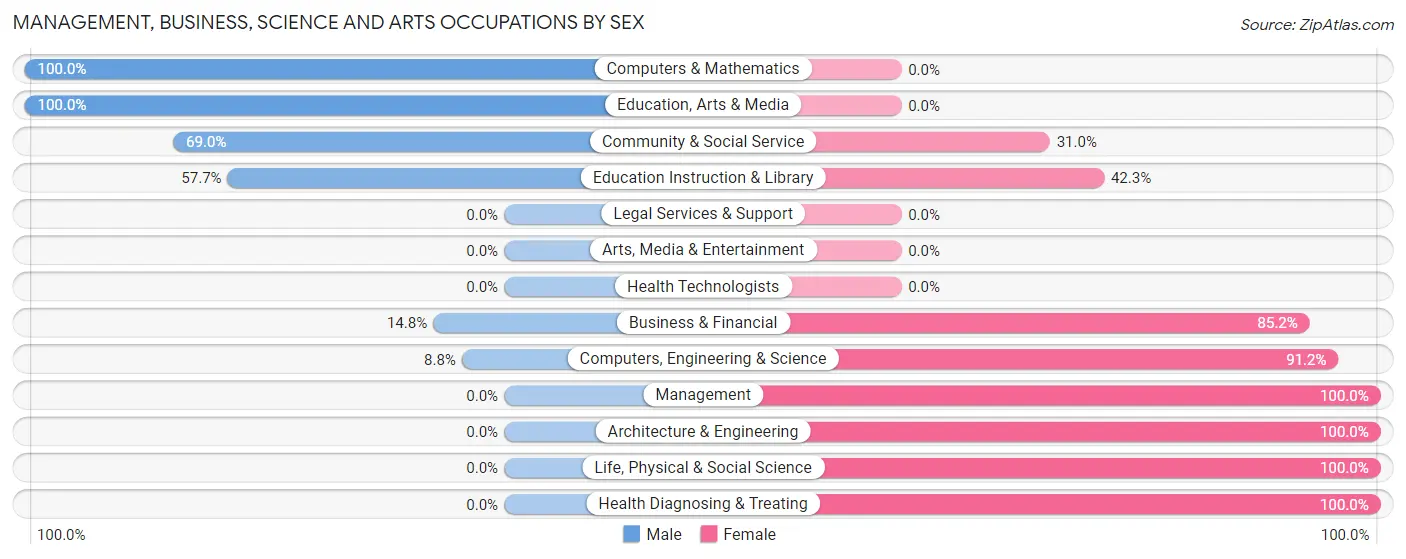
Management, Business, Science and Arts Occupations by Sex
Within the Management, Business, Science and Arts occupations in Porterdale, the most male-oriented occupations are Computers & Mathematics (100.0%), Education, Arts & Media (100.0%), and Community & Social Service (69.0%), while the most female-oriented occupations are Management (100.0%), Architecture & Engineering (100.0%), and Life, Physical & Social Science (100.0%).
| Occupation | Male | Female |
| Management | 0 (0.0%) | 17 (100.0%) |
| Business & Financial | 4 (14.8%) | 23 (85.2%) |
| Computers, Engineering & Science | 3 (8.8%) | 31 (91.2%) |
| Computers & Mathematics | 3 (100.0%) | 0 (0.0%) |
| Architecture & Engineering | 0 (0.0%) | 26 (100.0%) |
| Life, Physical & Social Science | 0 (0.0%) | 5 (100.0%) |
| Community & Social Service | 49 (69.0%) | 22 (31.0%) |
| Education, Arts & Media | 19 (100.0%) | 0 (0.0%) |
| Legal Services & Support | 0 (0.0%) | 0 (0.0%) |
| Education Instruction & Library | 30 (57.7%) | 22 (42.3%) |
| Arts, Media & Entertainment | 0 (0.0%) | 0 (0.0%) |
| Health Diagnosing & Treating | 0 (0.0%) | 11 (100.0%) |
| Health Technologists | 0 (0.0%) | 0 (0.0%) |
| Total (Category) | 56 (35.0%) | 104 (65.0%) |
| Total (Overall) | 343 (61.7%) | 213 (38.3%) |
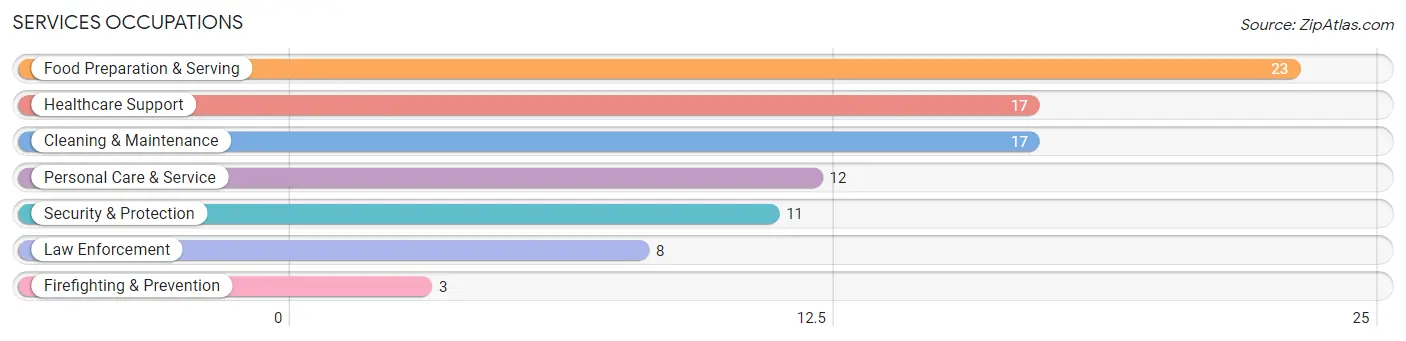
Services Occupations
The most common Services occupations in Porterdale are Food Preparation & Serving (23 | 4.1%), Healthcare Support (17 | 3.1%), Cleaning & Maintenance (17 | 3.1%), Personal Care & Service (12 | 2.2%), and Security & Protection (11 | 2.0%).
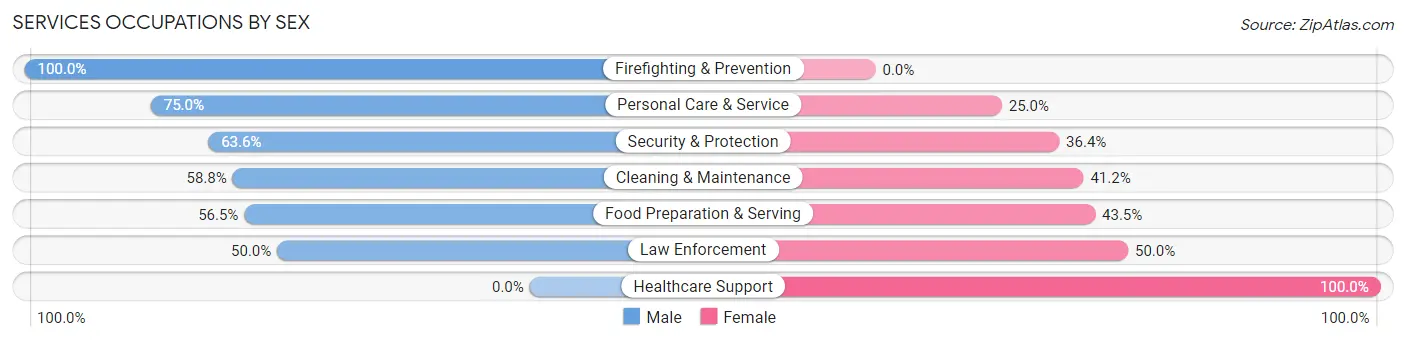
Services Occupations by Sex
Within the Services occupations in Porterdale, the most male-oriented occupations are Firefighting & Prevention (100.0%), Personal Care & Service (75.0%), and Security & Protection (63.6%), while the most female-oriented occupations are Healthcare Support (100.0%), Law Enforcement (50.0%), and Food Preparation & Serving (43.5%).
| Occupation | Male | Female |
| Healthcare Support | 0 (0.0%) | 17 (100.0%) |
| Security & Protection | 7 (63.6%) | 4 (36.4%) |
| Firefighting & Prevention | 3 (100.0%) | 0 (0.0%) |
| Law Enforcement | 4 (50.0%) | 4 (50.0%) |
| Food Preparation & Serving | 13 (56.5%) | 10 (43.5%) |
| Cleaning & Maintenance | 10 (58.8%) | 7 (41.2%) |
| Personal Care & Service | 9 (75.0%) | 3 (25.0%) |
| Total (Category) | 39 (48.7%) | 41 (51.2%) |
| Total (Overall) | 343 (61.7%) | 213 (38.3%) |
Sales and Office Occupations
The most common Sales and Office occupations in Porterdale are Office & Administration (95 | 17.1%), and Sales & Related (21 | 3.8%).
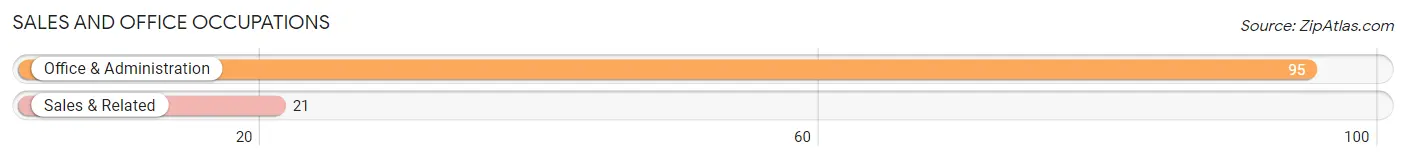
Sales and Office Occupations by Sex
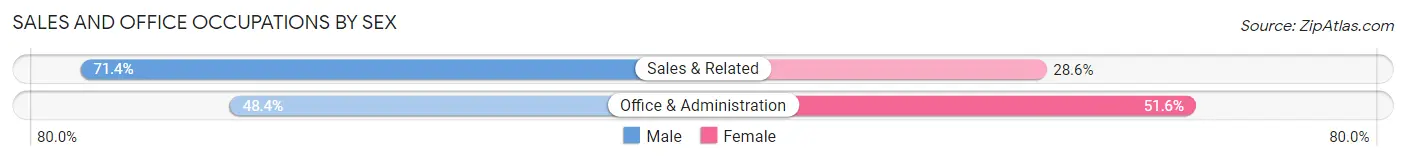
| Occupation | Male | Female |
| Sales & Related | 15 (71.4%) | 6 (28.6%) |
| Office & Administration | 46 (48.4%) | 49 (51.6%) |
| Total (Category) | 61 (52.6%) | 55 (47.4%) |
| Total (Overall) | 343 (61.7%) | 213 (38.3%) |
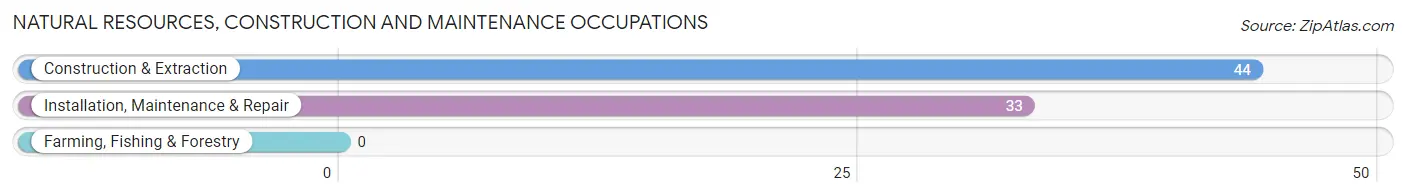
Natural Resources, Construction and Maintenance Occupations
The most common Natural Resources, Construction and Maintenance occupations in Porterdale are Construction & Extraction (44 | 7.9%), and Installation, Maintenance & Repair (33 | 5.9%).
Natural Resources, Construction and Maintenance Occupations by Sex

| Occupation | Male | Female |
| Farming, Fishing & Forestry | 0 (0.0%) | 0 (0.0%) |
| Construction & Extraction | 44 (100.0%) | 0 (0.0%) |
| Installation, Maintenance & Repair | 33 (100.0%) | 0 (0.0%) |
| Total (Category) | 77 (100.0%) | 0 (0.0%) |
| Total (Overall) | 343 (61.7%) | 213 (38.3%) |
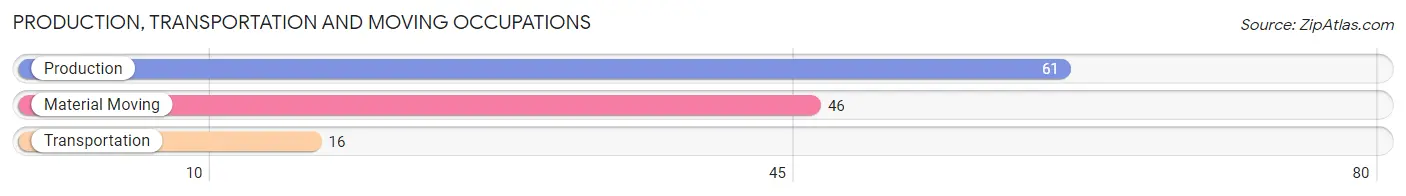
Production, Transportation and Moving Occupations
The most common Production, Transportation and Moving occupations in Porterdale are Production (61 | 11.0%), Material Moving (46 | 8.3%), and Transportation (16 | 2.9%).
Production, Transportation and Moving Occupations by Sex
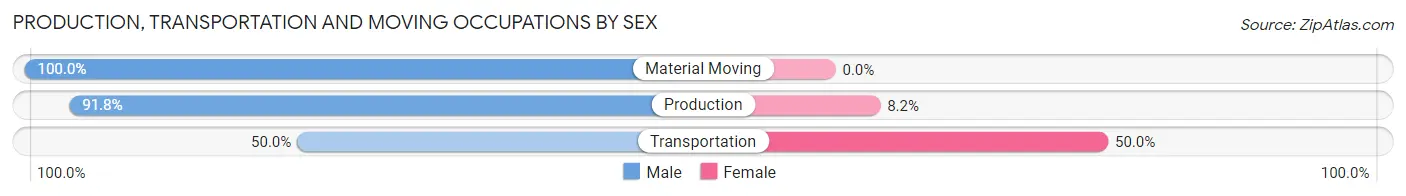
| Occupation | Male | Female |
| Production | 56 (91.8%) | 5 (8.2%) |
| Transportation | 8 (50.0%) | 8 (50.0%) |
| Material Moving | 46 (100.0%) | 0 (0.0%) |
| Total (Category) | 110 (89.4%) | 13 (10.6%) |
| Total (Overall) | 343 (61.7%) | 213 (38.3%) |
Employment Industries by Sex in Porterdale
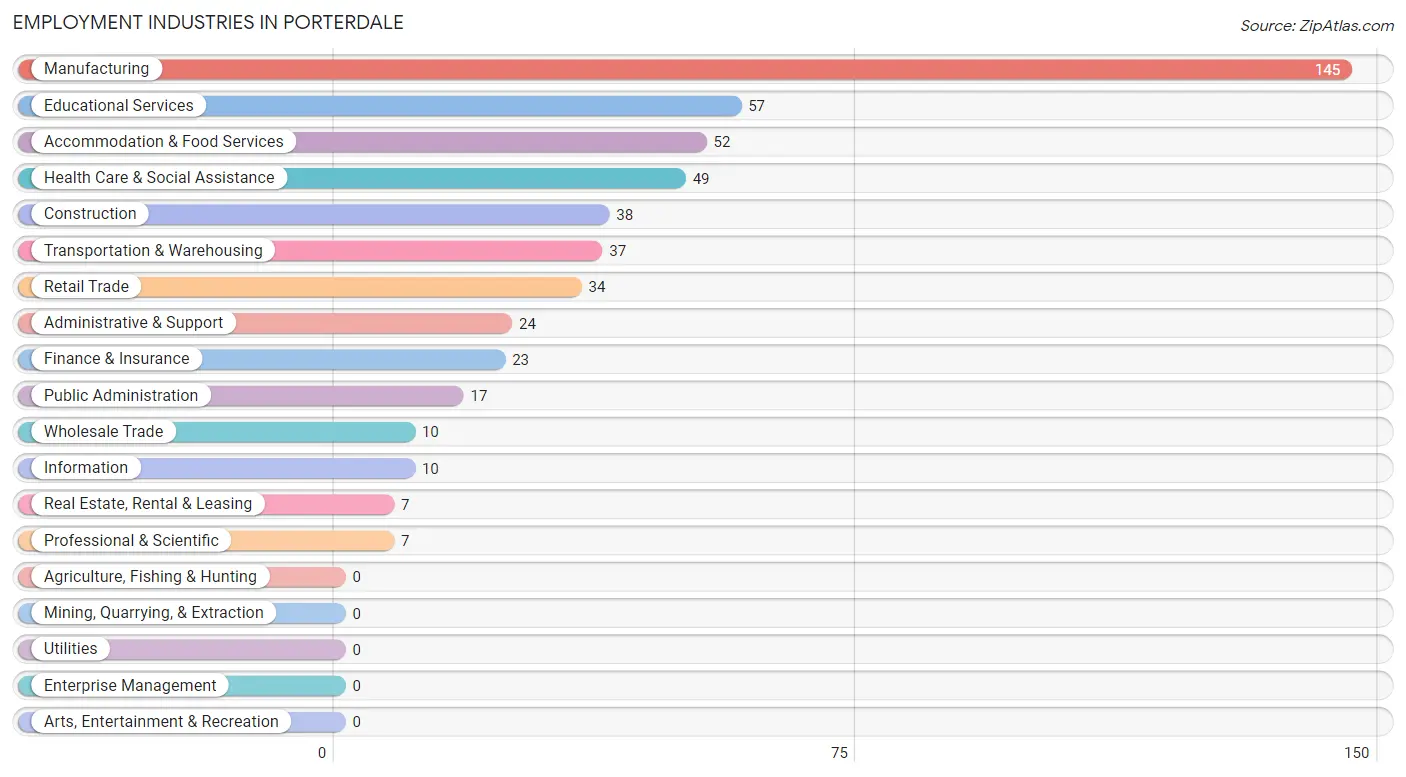
Employment Industries in Porterdale
The major employment industries in Porterdale include Manufacturing (145 | 26.1%), Educational Services (57 | 10.2%), Accommodation & Food Services (52 | 9.3%), Health Care & Social Assistance (49 | 8.8%), and Construction (38 | 6.8%).
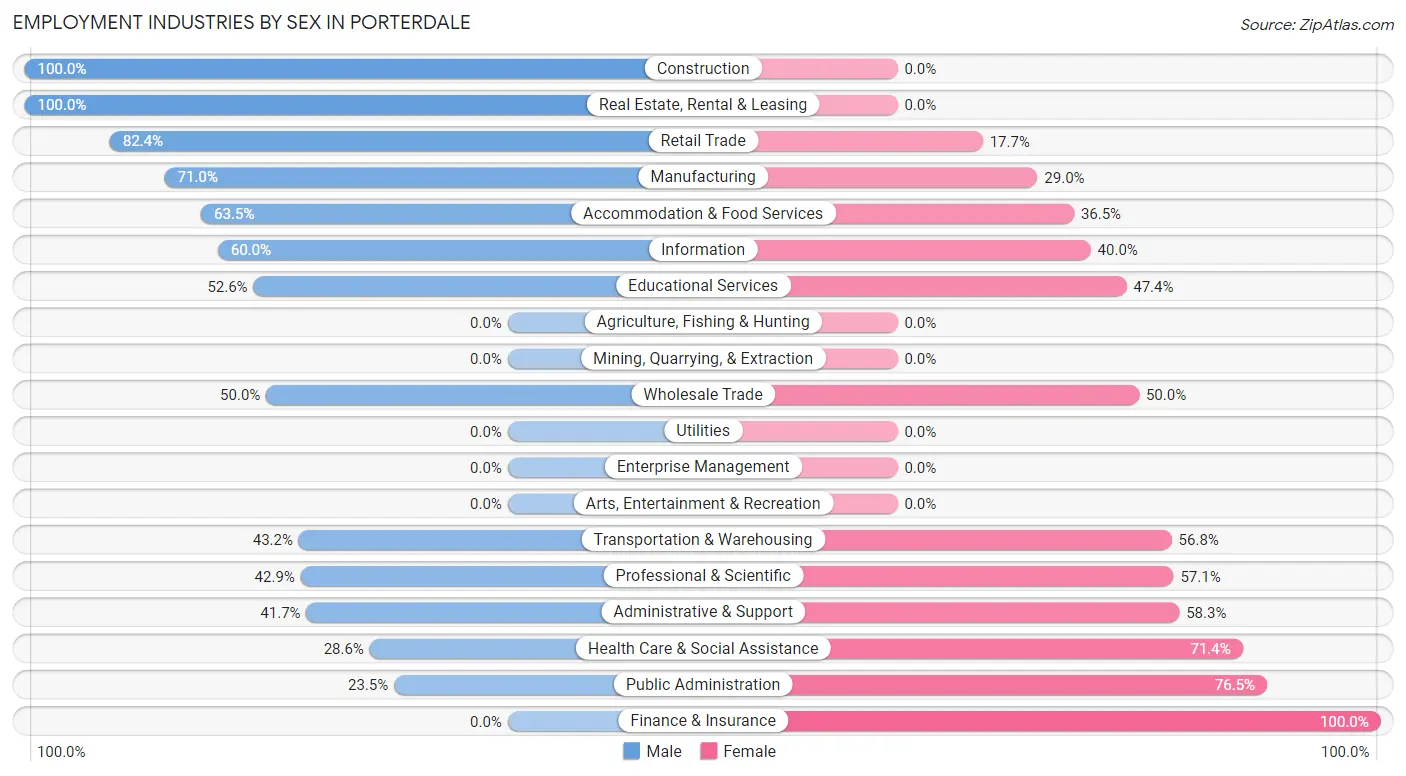
Employment Industries by Sex in Porterdale
The Porterdale industries that see more men than women are Construction (100.0%), Real Estate, Rental & Leasing (100.0%), and Retail Trade (82.4%), whereas the industries that tend to have a higher number of women are Finance & Insurance (100.0%), Public Administration (76.5%), and Health Care & Social Assistance (71.4%).
| Industry | Male | Female |
| Agriculture, Fishing & Hunting | 0 (0.0%) | 0 (0.0%) |
| Mining, Quarrying, & Extraction | 0 (0.0%) | 0 (0.0%) |
| Construction | 38 (100.0%) | 0 (0.0%) |
| Manufacturing | 103 (71.0%) | 42 (29.0%) |
| Wholesale Trade | 5 (50.0%) | 5 (50.0%) |
| Retail Trade | 28 (82.4%) | 6 (17.6%) |
| Transportation & Warehousing | 16 (43.2%) | 21 (56.8%) |
| Utilities | 0 (0.0%) | 0 (0.0%) |
| Information | 6 (60.0%) | 4 (40.0%) |
| Finance & Insurance | 0 (0.0%) | 23 (100.0%) |
| Real Estate, Rental & Leasing | 7 (100.0%) | 0 (0.0%) |
| Professional & Scientific | 3 (42.9%) | 4 (57.1%) |
| Enterprise Management | 0 (0.0%) | 0 (0.0%) |
| Administrative & Support | 10 (41.7%) | 14 (58.3%) |
| Educational Services | 30 (52.6%) | 27 (47.4%) |
| Health Care & Social Assistance | 14 (28.6%) | 35 (71.4%) |
| Arts, Entertainment & Recreation | 0 (0.0%) | 0 (0.0%) |
| Accommodation & Food Services | 33 (63.5%) | 19 (36.5%) |
| Public Administration | 4 (23.5%) | 13 (76.5%) |
| Total | 343 (61.7%) | 213 (38.3%) |
Education in Porterdale
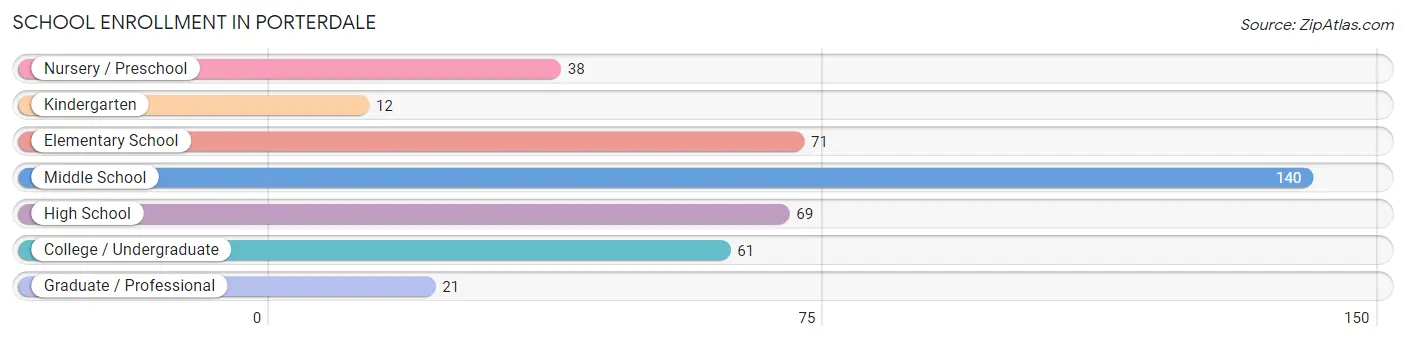
School Enrollment in Porterdale
The most common levels of schooling among the 412 students in Porterdale are middle school (140 | 34.0%), elementary school (71 | 17.2%), and high school (69 | 16.8%).
| School Level | # Students | % Students |
| Nursery / Preschool | 38 | 9.2% |
| Kindergarten | 12 | 2.9% |
| Elementary School | 71 | 17.2% |
| Middle School | 140 | 34.0% |
| High School | 69 | 16.8% |
| College / Undergraduate | 61 | 14.8% |
| Graduate / Professional | 21 | 5.1% |
| Total | 412 | 100.0% |
School Enrollment by Age by Funding Source in Porterdale
Out of a total of 412 students who are enrolled in schools in Porterdale, 110 (26.7%) attend a private institution, while the remaining 302 (73.3%) are enrolled in public schools. The age group of 3 to 4 year olds has the highest likelihood of being enrolled in private schools, with 21 (100.0% in the age bracket) enrolled. Conversely, the age group of 18 to 19 year olds has the lowest likelihood of being enrolled in a private school, with 37 (100.0% in the age bracket) attending a public institution.
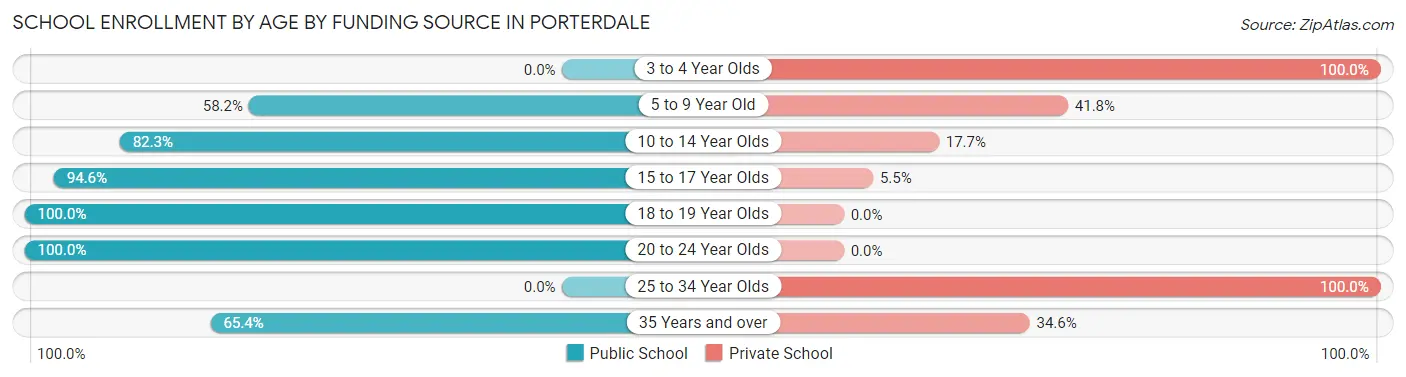
| Age Bracket | Public School | Private School |
| 3 to 4 Year Olds | 0 (0.0%) | 21 (100.0%) |
| 5 to 9 Year Old | 53 (58.2%) | 38 (41.8%) |
| 10 to 14 Year Olds | 130 (82.3%) | 28 (17.7%) |
| 15 to 17 Year Olds | 52 (94.6%) | 3 (5.4%) |
| 18 to 19 Year Olds | 37 (100.0%) | 0 (0.0%) |
| 20 to 24 Year Olds | 13 (100.0%) | 0 (0.0%) |
| 25 to 34 Year Olds | 0 (0.0%) | 11 (100.0%) |
| 35 Years and over | 17 (65.4%) | 9 (34.6%) |
| Total | 302 (73.3%) | 110 (26.7%) |
Educational Attainment by Field of Study in Porterdale
Liberal arts & history (35 | 23.8%), business (27 | 18.4%), social sciences (24 | 16.3%), literature & languages (19 | 12.9%), and arts & humanities (13 | 8.8%) are the most common fields of study among 147 individuals in Porterdale who have obtained a bachelor's degree or higher.
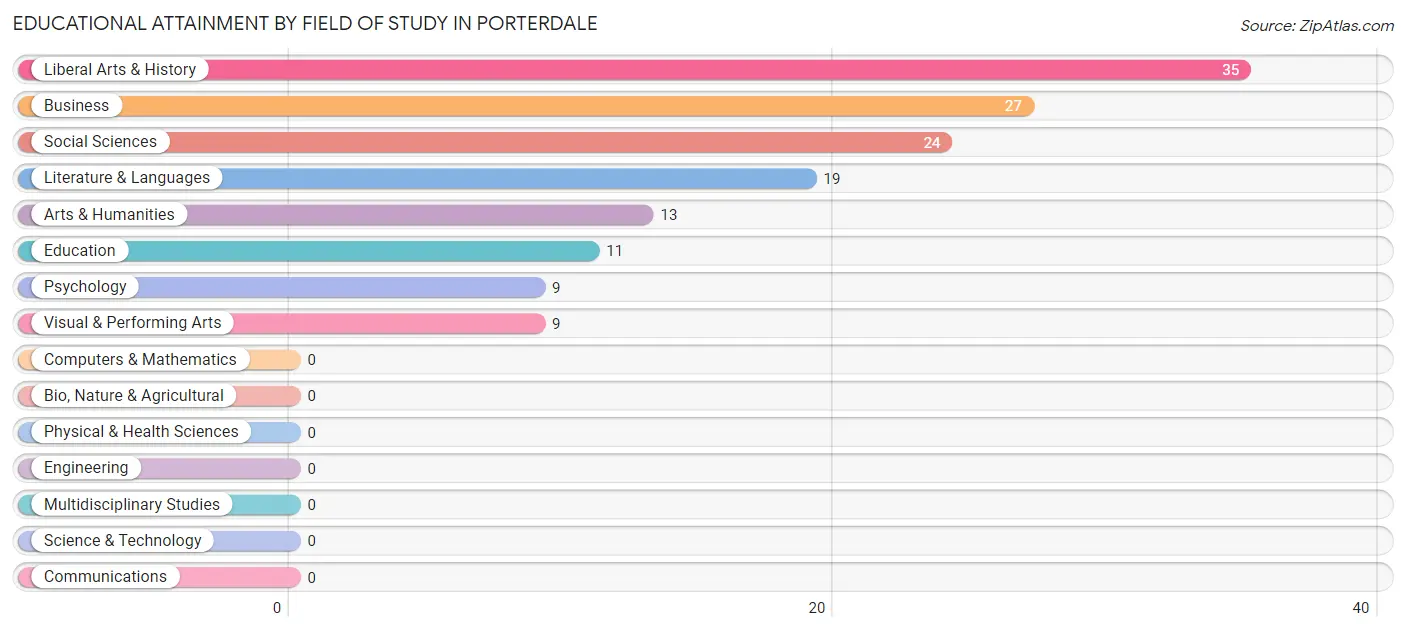
| Field of Study | # Graduates | % Graduates |
| Computers & Mathematics | 0 | 0.0% |
| Bio, Nature & Agricultural | 0 | 0.0% |
| Physical & Health Sciences | 0 | 0.0% |
| Psychology | 9 | 6.1% |
| Social Sciences | 24 | 16.3% |
| Engineering | 0 | 0.0% |
| Multidisciplinary Studies | 0 | 0.0% |
| Science & Technology | 0 | 0.0% |
| Business | 27 | 18.4% |
| Education | 11 | 7.5% |
| Literature & Languages | 19 | 12.9% |
| Liberal Arts & History | 35 | 23.8% |
| Visual & Performing Arts | 9 | 6.1% |
| Communications | 0 | 0.0% |
| Arts & Humanities | 13 | 8.8% |
| Total | 147 | 100.0% |
Transportation & Commute in Porterdale
Vehicle Availability by Sex in Porterdale
The most prevalent vehicle ownership categories in Porterdale are males with 2 vehicles (216, accounting for 63.0%) and females with 2 vehicles (69, making up 101.4%).
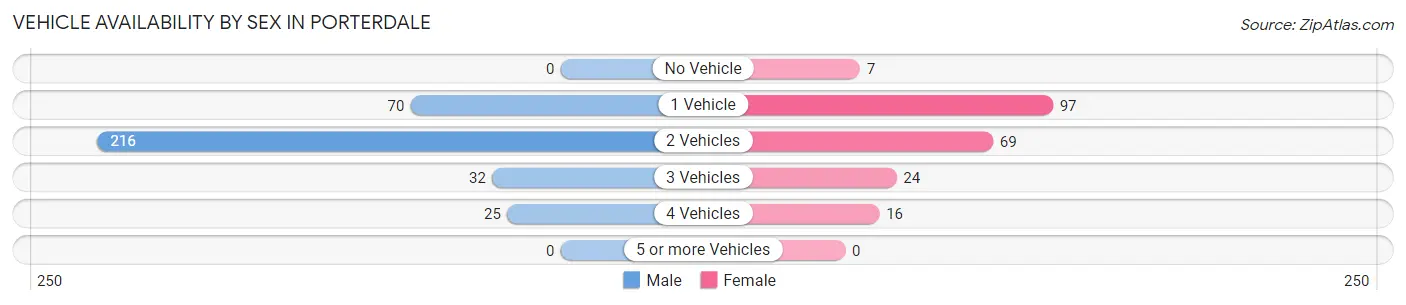
| Vehicles Available | Male | Female |
| No Vehicle | 0 (0.0%) | 7 (3.3%) |
| 1 Vehicle | 70 (20.4%) | 97 (45.5%) |
| 2 Vehicles | 216 (63.0%) | 69 (32.4%) |
| 3 Vehicles | 32 (9.3%) | 24 (11.3%) |
| 4 Vehicles | 25 (7.3%) | 16 (7.5%) |
| 5 or more Vehicles | 0 (0.0%) | 0 (0.0%) |
| Total | 343 (100.0%) | 213 (100.0%) |
Commute Time in Porterdale
The most frequently occuring commute durations in Porterdale are 15 to 19 minutes (133 commuters, 26.0%), 10 to 14 minutes (60 commuters, 11.7%), and 20 to 24 minutes (52 commuters, 10.2%).
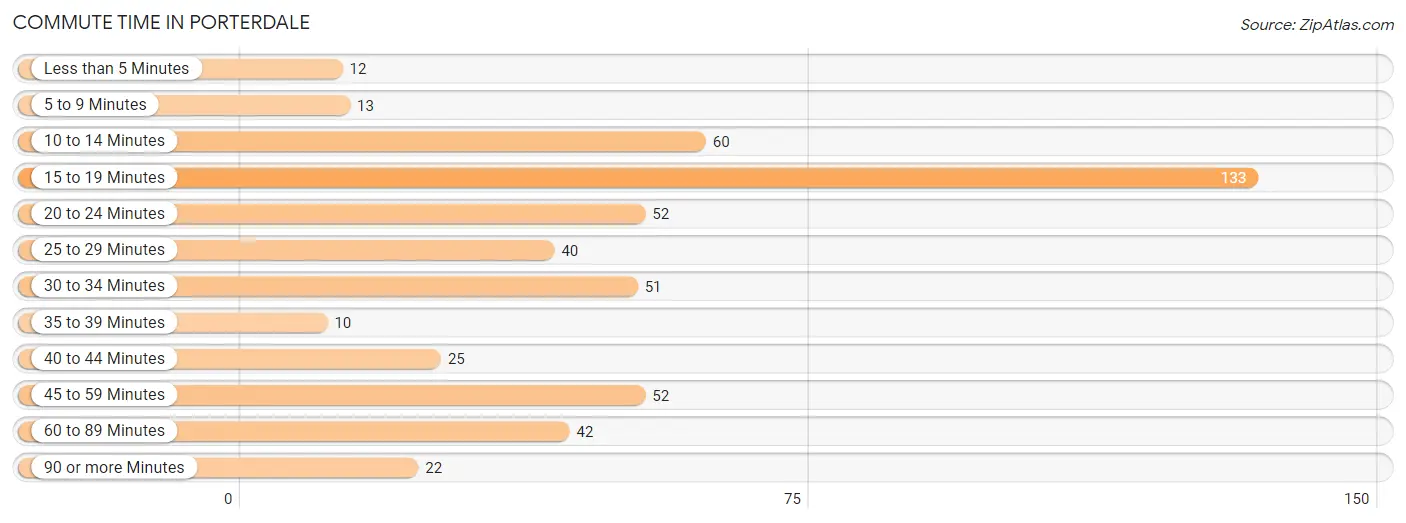
| Commute Time | # Commuters | % Commuters |
| Less than 5 Minutes | 12 | 2.3% |
| 5 to 9 Minutes | 13 | 2.5% |
| 10 to 14 Minutes | 60 | 11.7% |
| 15 to 19 Minutes | 133 | 26.0% |
| 20 to 24 Minutes | 52 | 10.2% |
| 25 to 29 Minutes | 40 | 7.8% |
| 30 to 34 Minutes | 51 | 10.0% |
| 35 to 39 Minutes | 10 | 1.9% |
| 40 to 44 Minutes | 25 | 4.9% |
| 45 to 59 Minutes | 52 | 10.2% |
| 60 to 89 Minutes | 42 | 8.2% |
| 90 or more Minutes | 22 | 4.3% |
Commute Time by Sex in Porterdale
The most common commute times in Porterdale are 15 to 19 minutes (104 commuters, 31.6%) for males and 10 to 14 minutes (29 commuters, 15.9%) for females.
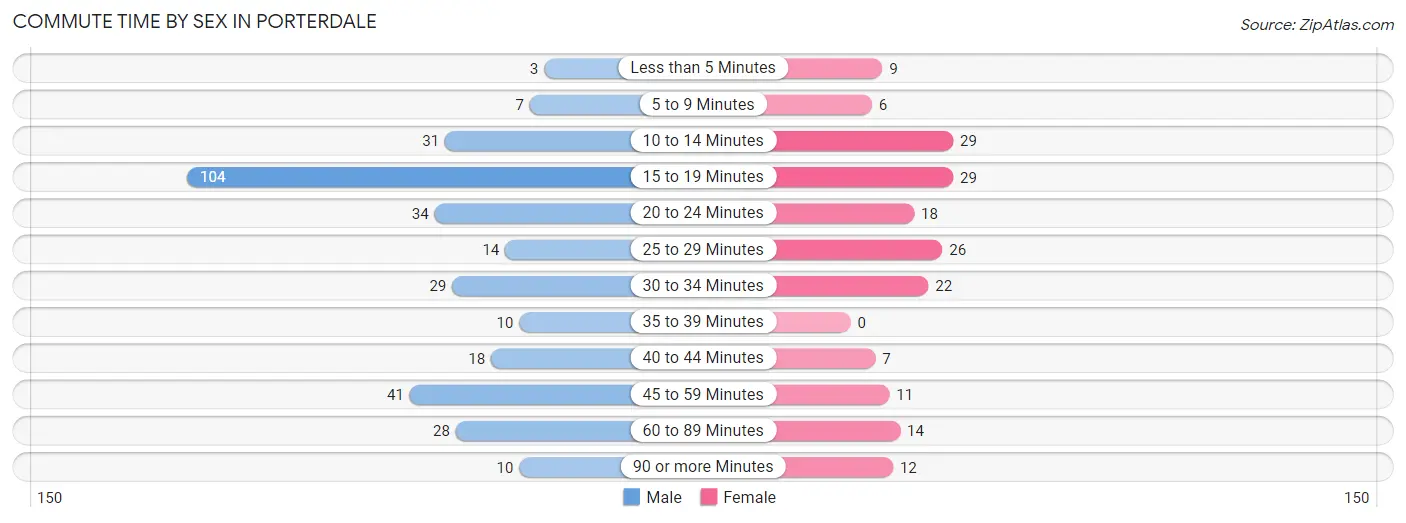
| Commute Time | Male | Female |
| Less than 5 Minutes | 3 (0.9%) | 9 (4.9%) |
| 5 to 9 Minutes | 7 (2.1%) | 6 (3.3%) |
| 10 to 14 Minutes | 31 (9.4%) | 29 (15.9%) |
| 15 to 19 Minutes | 104 (31.6%) | 29 (15.9%) |
| 20 to 24 Minutes | 34 (10.3%) | 18 (9.8%) |
| 25 to 29 Minutes | 14 (4.3%) | 26 (14.2%) |
| 30 to 34 Minutes | 29 (8.8%) | 22 (12.0%) |
| 35 to 39 Minutes | 10 (3.0%) | 0 (0.0%) |
| 40 to 44 Minutes | 18 (5.5%) | 7 (3.8%) |
| 45 to 59 Minutes | 41 (12.5%) | 11 (6.0%) |
| 60 to 89 Minutes | 28 (8.5%) | 14 (7.6%) |
| 90 or more Minutes | 10 (3.0%) | 12 (6.6%) |
Time of Departure to Work by Sex in Porterdale
The most frequent times of departure to work in Porterdale are 4:00 PM to 11:59 PM (82, 24.9%) for males and 7:00 AM to 7:29 AM (43, 23.5%) for females.
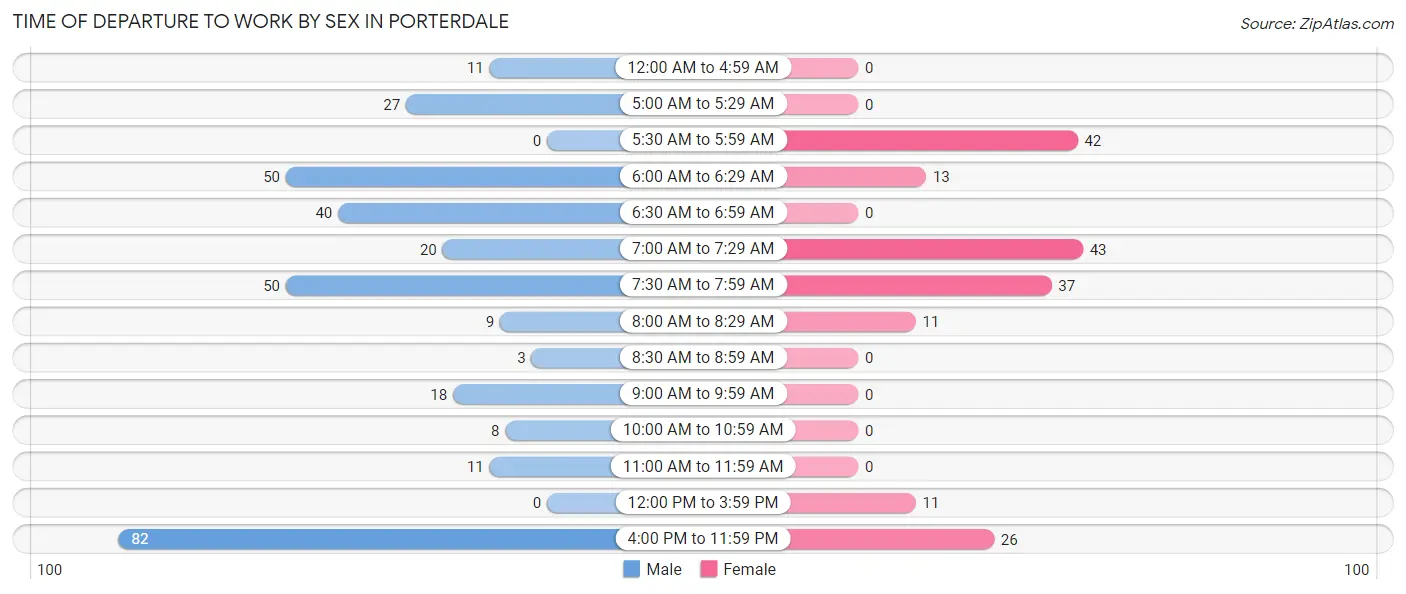
| Time of Departure | Male | Female |
| 12:00 AM to 4:59 AM | 11 (3.3%) | 0 (0.0%) |
| 5:00 AM to 5:29 AM | 27 (8.2%) | 0 (0.0%) |
| 5:30 AM to 5:59 AM | 0 (0.0%) | 42 (23.0%) |
| 6:00 AM to 6:29 AM | 50 (15.2%) | 13 (7.1%) |
| 6:30 AM to 6:59 AM | 40 (12.2%) | 0 (0.0%) |
| 7:00 AM to 7:29 AM | 20 (6.1%) | 43 (23.5%) |
| 7:30 AM to 7:59 AM | 50 (15.2%) | 37 (20.2%) |
| 8:00 AM to 8:29 AM | 9 (2.7%) | 11 (6.0%) |
| 8:30 AM to 8:59 AM | 3 (0.9%) | 0 (0.0%) |
| 9:00 AM to 9:59 AM | 18 (5.5%) | 0 (0.0%) |
| 10:00 AM to 10:59 AM | 8 (2.4%) | 0 (0.0%) |
| 11:00 AM to 11:59 AM | 11 (3.3%) | 0 (0.0%) |
| 12:00 PM to 3:59 PM | 0 (0.0%) | 11 (6.0%) |
| 4:00 PM to 11:59 PM | 82 (24.9%) | 26 (14.2%) |
| Total | 329 (100.0%) | 183 (100.0%) |
Housing Occupancy in Porterdale
Occupancy by Ownership in Porterdale
Of the total 635 dwellings in Porterdale, owner-occupied units account for 237 (37.3%), while renter-occupied units make up 398 (62.7%).
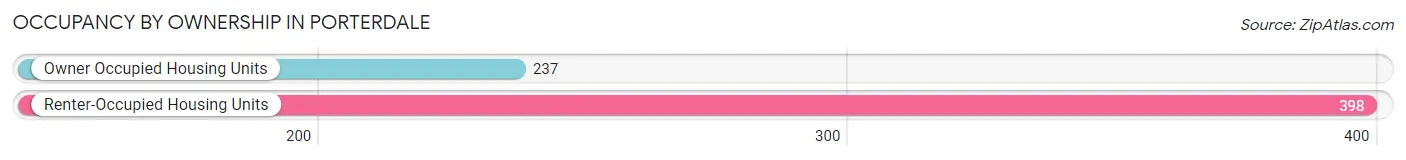
| Occupancy | # Housing Units | % Housing Units |
| Owner Occupied Housing Units | 237 | 37.3% |
| Renter-Occupied Housing Units | 398 | 62.7% |
| Total Occupied Housing Units | 635 | 100.0% |
Occupancy by Household Size in Porterdale
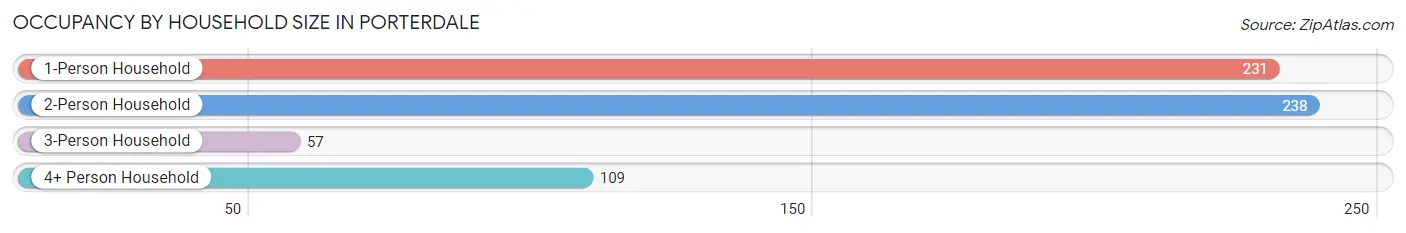
| Household Size | # Housing Units | % Housing Units |
| 1-Person Household | 231 | 36.4% |
| 2-Person Household | 238 | 37.5% |
| 3-Person Household | 57 | 9.0% |
| 4+ Person Household | 109 | 17.2% |
| Total Housing Units | 635 | 100.0% |
Occupancy by Ownership by Household Size in Porterdale
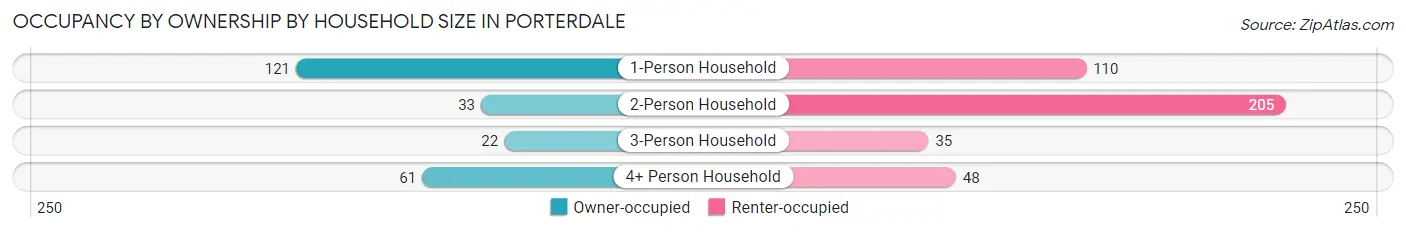
| Household Size | Owner-occupied | Renter-occupied |
| 1-Person Household | 121 (52.4%) | 110 (47.6%) |
| 2-Person Household | 33 (13.9%) | 205 (86.1%) |
| 3-Person Household | 22 (38.6%) | 35 (61.4%) |
| 4+ Person Household | 61 (56.0%) | 48 (44.0%) |
| Total Housing Units | 237 (37.3%) | 398 (62.7%) |
Occupancy by Educational Attainment in Porterdale
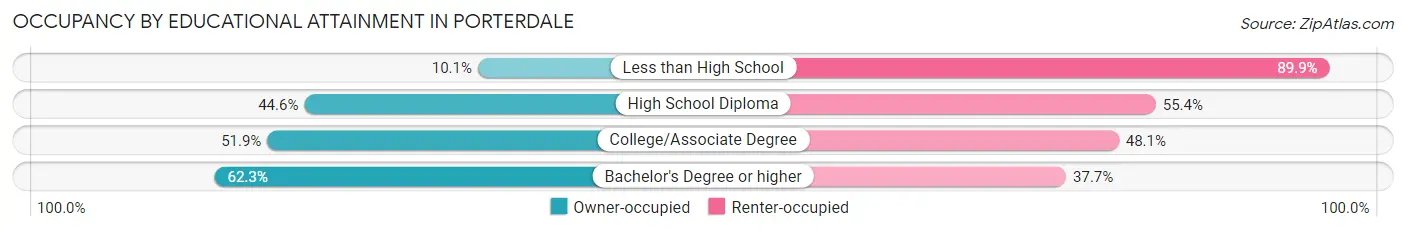
| Household Size | Owner-occupied | Renter-occupied |
| Less than High School | 21 (10.1%) | 186 (89.9%) |
| High School Diploma | 86 (44.6%) | 107 (55.4%) |
| College/Associate Degree | 82 (51.9%) | 76 (48.1%) |
| Bachelor's Degree or higher | 48 (62.3%) | 29 (37.7%) |
Occupancy by Age of Householder in Porterdale
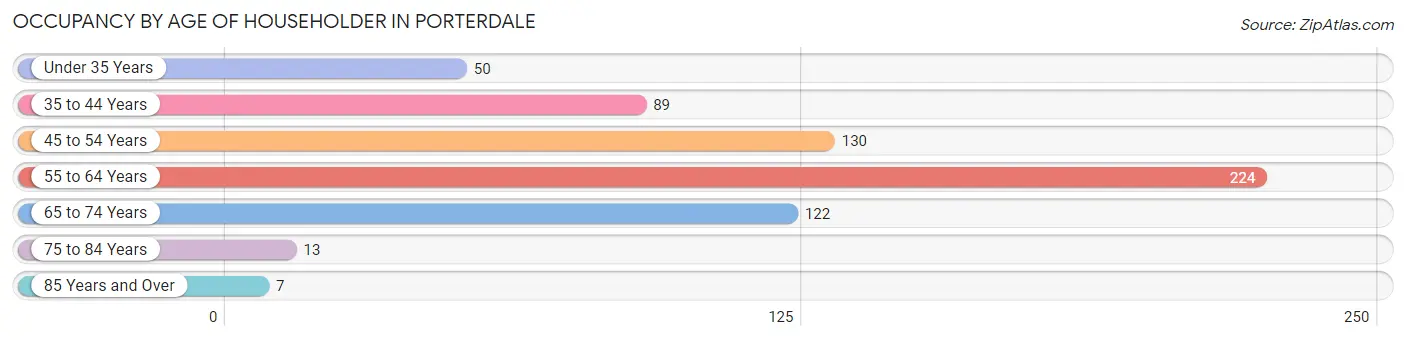
| Age Bracket | # Households | % Households |
| Under 35 Years | 50 | 7.9% |
| 35 to 44 Years | 89 | 14.0% |
| 45 to 54 Years | 130 | 20.5% |
| 55 to 64 Years | 224 | 35.3% |
| 65 to 74 Years | 122 | 19.2% |
| 75 to 84 Years | 13 | 2.1% |
| 85 Years and Over | 7 | 1.1% |
| Total | 635 | 100.0% |
Housing Finances in Porterdale
Median Income by Occupancy in Porterdale
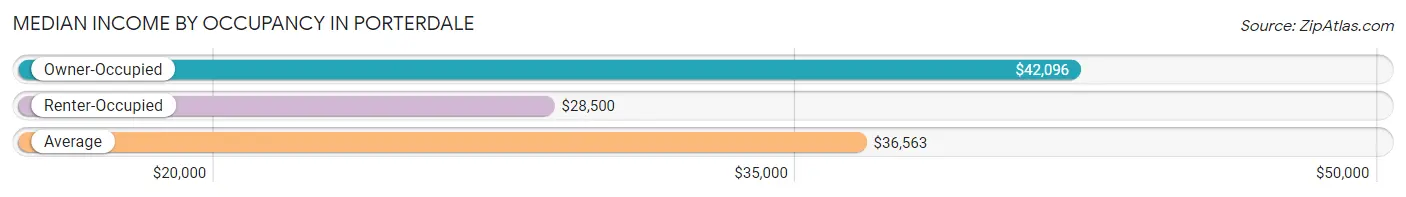
| Occupancy Type | # Households | Median Income |
| Owner-Occupied | 237 (37.3%) | $42,096 |
| Renter-Occupied | 398 (62.7%) | $28,500 |
| Average | 635 (100.0%) | $36,563 |
Occupancy by Householder Income Bracket in Porterdale
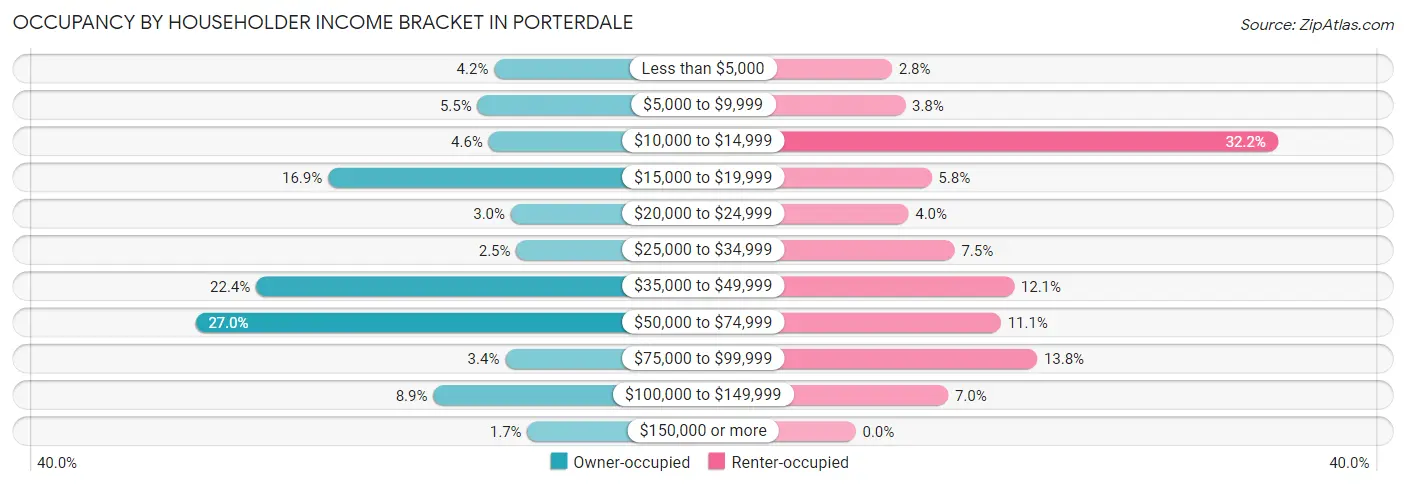
| Income Bracket | Owner-occupied | Renter-occupied |
| Less than $5,000 | 10 (4.2%) | 11 (2.8%) |
| $5,000 to $9,999 | 13 (5.5%) | 15 (3.8%) |
| $10,000 to $14,999 | 11 (4.6%) | 128 (32.2%) |
| $15,000 to $19,999 | 40 (16.9%) | 23 (5.8%) |
| $20,000 to $24,999 | 7 (2.9%) | 16 (4.0%) |
| $25,000 to $34,999 | 6 (2.5%) | 30 (7.5%) |
| $35,000 to $49,999 | 53 (22.4%) | 48 (12.1%) |
| $50,000 to $74,999 | 64 (27.0%) | 44 (11.1%) |
| $75,000 to $99,999 | 8 (3.4%) | 55 (13.8%) |
| $100,000 to $149,999 | 21 (8.9%) | 28 (7.0%) |
| $150,000 or more | 4 (1.7%) | 0 (0.0%) |
| Total | 237 (100.0%) | 398 (100.0%) |
Monthly Housing Cost Tiers in Porterdale
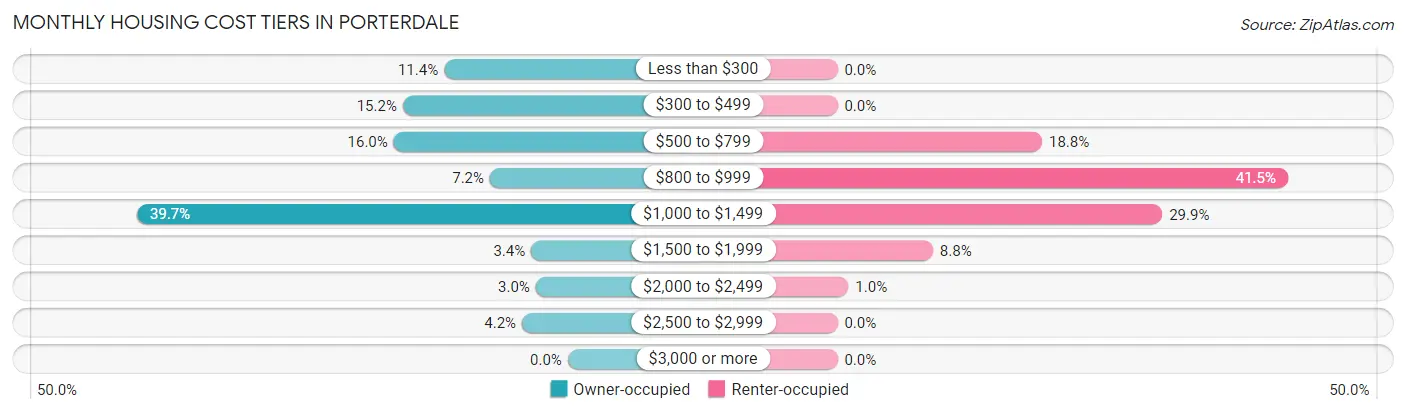
| Monthly Cost | Owner-occupied | Renter-occupied |
| Less than $300 | 27 (11.4%) | 0 (0.0%) |
| $300 to $499 | 36 (15.2%) | 0 (0.0%) |
| $500 to $799 | 38 (16.0%) | 75 (18.8%) |
| $800 to $999 | 17 (7.2%) | 165 (41.5%) |
| $1,000 to $1,499 | 94 (39.7%) | 119 (29.9%) |
| $1,500 to $1,999 | 8 (3.4%) | 35 (8.8%) |
| $2,000 to $2,499 | 7 (2.9%) | 4 (1.0%) |
| $2,500 to $2,999 | 10 (4.2%) | 0 (0.0%) |
| $3,000 or more | 0 (0.0%) | 0 (0.0%) |
| Total | 237 (100.0%) | 398 (100.0%) |
Physical Housing Characteristics in Porterdale
Housing Structures in Porterdale
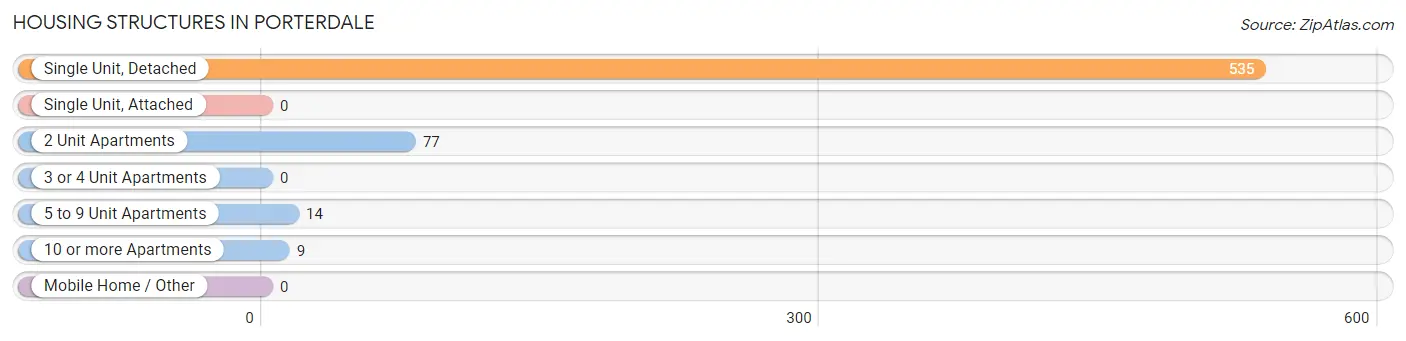
| Structure Type | # Housing Units | % Housing Units |
| Single Unit, Detached | 535 | 84.3% |
| Single Unit, Attached | 0 | 0.0% |
| 2 Unit Apartments | 77 | 12.1% |
| 3 or 4 Unit Apartments | 0 | 0.0% |
| 5 to 9 Unit Apartments | 14 | 2.2% |
| 10 or more Apartments | 9 | 1.4% |
| Mobile Home / Other | 0 | 0.0% |
| Total | 635 | 100.0% |
Housing Structures by Occupancy in Porterdale
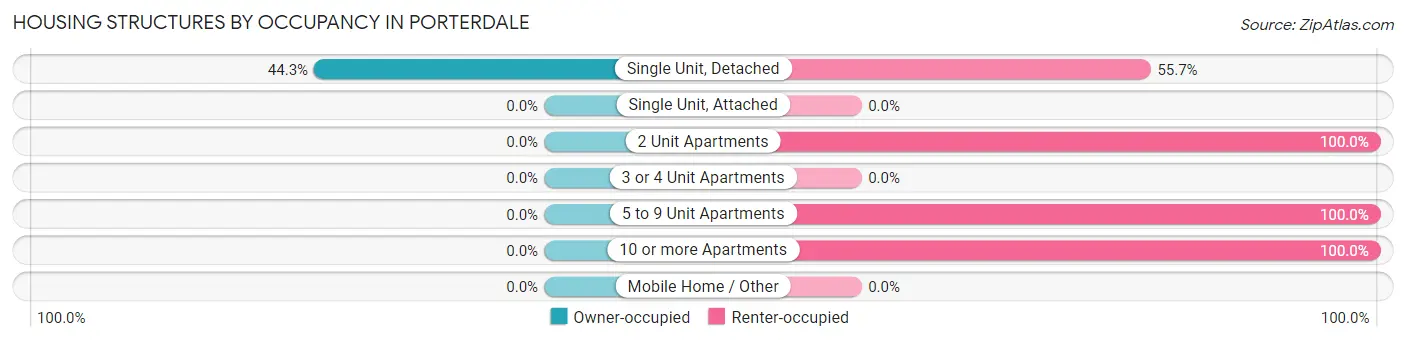
| Structure Type | Owner-occupied | Renter-occupied |
| Single Unit, Detached | 237 (44.3%) | 298 (55.7%) |
| Single Unit, Attached | 0 (0.0%) | 0 (0.0%) |
| 2 Unit Apartments | 0 (0.0%) | 77 (100.0%) |
| 3 or 4 Unit Apartments | 0 (0.0%) | 0 (0.0%) |
| 5 to 9 Unit Apartments | 0 (0.0%) | 14 (100.0%) |
| 10 or more Apartments | 0 (0.0%) | 9 (100.0%) |
| Mobile Home / Other | 0 (0.0%) | 0 (0.0%) |
| Total | 237 (37.3%) | 398 (62.7%) |
Housing Structures by Number of Rooms in Porterdale
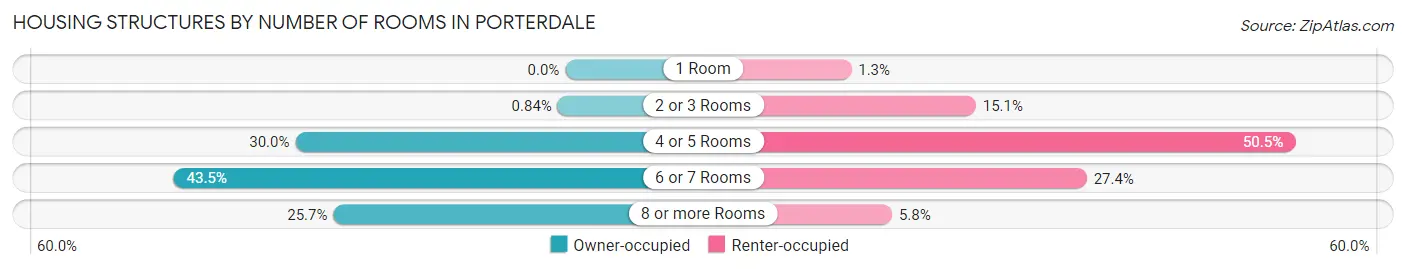
| Number of Rooms | Owner-occupied | Renter-occupied |
| 1 Room | 0 (0.0%) | 5 (1.3%) |
| 2 or 3 Rooms | 2 (0.8%) | 60 (15.1%) |
| 4 or 5 Rooms | 71 (30.0%) | 201 (50.5%) |
| 6 or 7 Rooms | 103 (43.5%) | 109 (27.4%) |
| 8 or more Rooms | 61 (25.7%) | 23 (5.8%) |
| Total | 237 (100.0%) | 398 (100.0%) |
Housing Structure by Heating Type in Porterdale
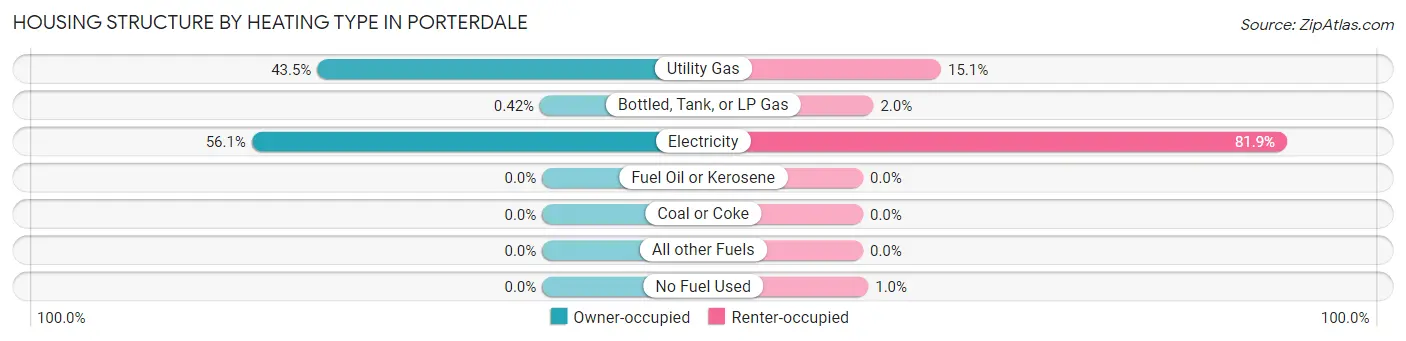
| Heating Type | Owner-occupied | Renter-occupied |
| Utility Gas | 103 (43.5%) | 60 (15.1%) |
| Bottled, Tank, or LP Gas | 1 (0.4%) | 8 (2.0%) |
| Electricity | 133 (56.1%) | 326 (81.9%) |
| Fuel Oil or Kerosene | 0 (0.0%) | 0 (0.0%) |
| Coal or Coke | 0 (0.0%) | 0 (0.0%) |
| All other Fuels | 0 (0.0%) | 0 (0.0%) |
| No Fuel Used | 0 (0.0%) | 4 (1.0%) |
| Total | 237 (100.0%) | 398 (100.0%) |
Household Vehicle Usage in Porterdale
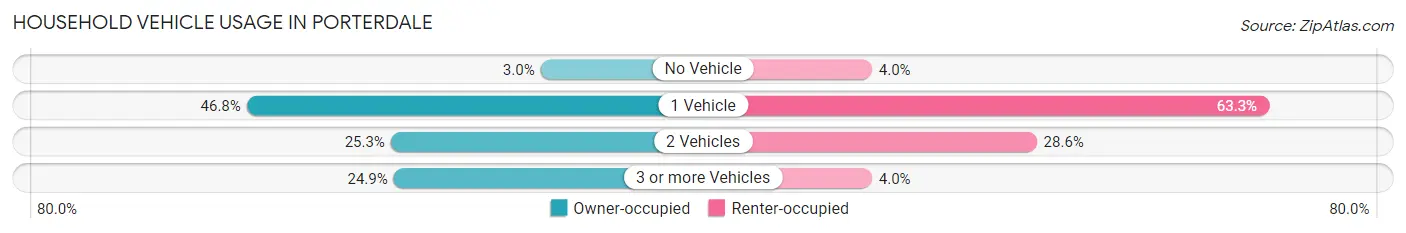
| Vehicles per Household | Owner-occupied | Renter-occupied |
| No Vehicle | 7 (2.9%) | 16 (4.0%) |
| 1 Vehicle | 111 (46.8%) | 252 (63.3%) |
| 2 Vehicles | 60 (25.3%) | 114 (28.6%) |
| 3 or more Vehicles | 59 (24.9%) | 16 (4.0%) |
| Total | 237 (100.0%) | 398 (100.0%) |
Real Estate & Mortgages in Porterdale
Real Estate and Mortgage Overview in Porterdale
| Characteristic | Without Mortgage | With Mortgage |
| Housing Units | 75 | 162 |
| Median Property Value | $103,700 | $132,500 |
| Median Household Income | - | - |
| Monthly Housing Costs | $443 | $0 |
| Real Estate Taxes | $1,515 | $0 |
Property Value by Mortgage Status in Porterdale
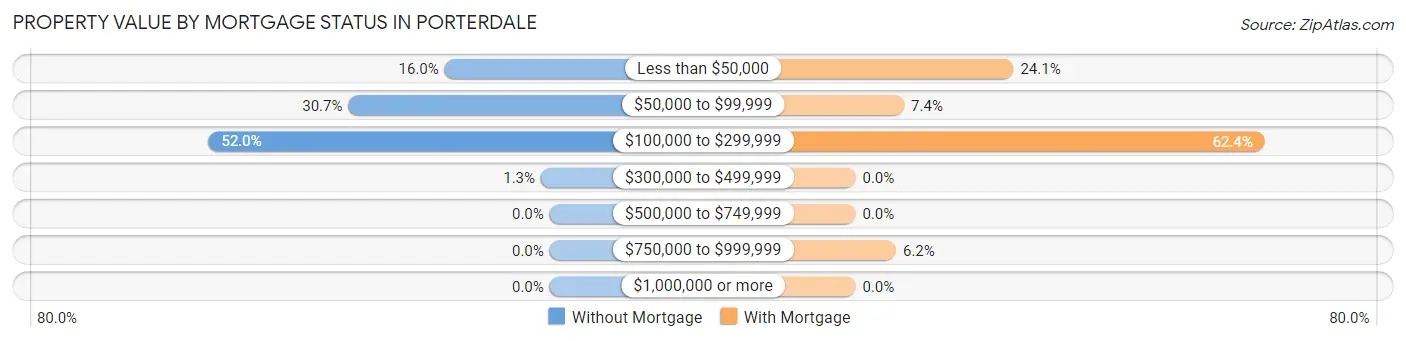
| Property Value | Without Mortgage | With Mortgage |
| Less than $50,000 | 12 (16.0%) | 39 (24.1%) |
| $50,000 to $99,999 | 23 (30.7%) | 12 (7.4%) |
| $100,000 to $299,999 | 39 (52.0%) | 101 (62.4%) |
| $300,000 to $499,999 | 1 (1.3%) | 0 (0.0%) |
| $500,000 to $749,999 | 0 (0.0%) | 0 (0.0%) |
| $750,000 to $999,999 | 0 (0.0%) | 10 (6.2%) |
| $1,000,000 or more | 0 (0.0%) | 0 (0.0%) |
| Total | 75 (100.0%) | 162 (100.0%) |
Household Income by Mortgage Status in Porterdale
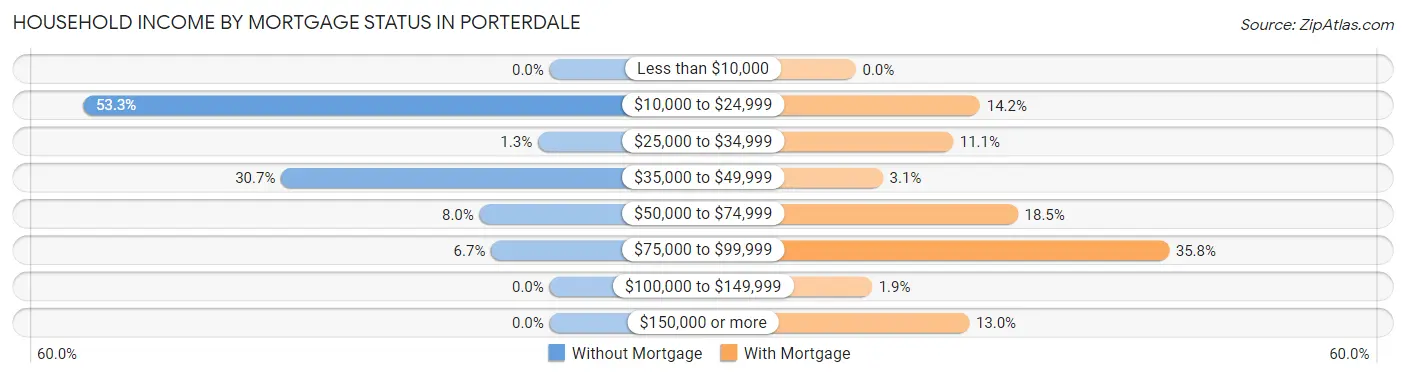
| Household Income | Without Mortgage | With Mortgage |
| Less than $10,000 | 0 (0.0%) | 0 (0.0%) |
| $10,000 to $24,999 | 40 (53.3%) | 23 (14.2%) |
| $25,000 to $34,999 | 1 (1.3%) | 18 (11.1%) |
| $35,000 to $49,999 | 23 (30.7%) | 5 (3.1%) |
| $50,000 to $74,999 | 6 (8.0%) | 30 (18.5%) |
| $75,000 to $99,999 | 5 (6.7%) | 58 (35.8%) |
| $100,000 to $149,999 | 0 (0.0%) | 3 (1.8%) |
| $150,000 or more | 0 (0.0%) | 21 (13.0%) |
| Total | 75 (100.0%) | 162 (100.0%) |
Property Value to Household Income Ratio in Porterdale
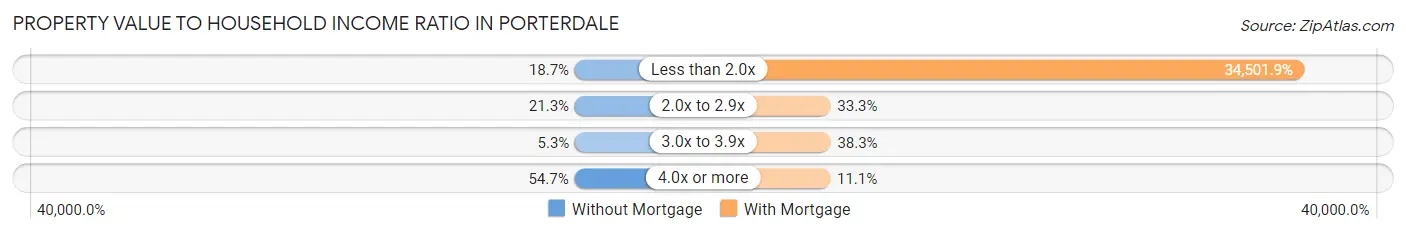
| Value-to-Income Ratio | Without Mortgage | With Mortgage |
| Less than 2.0x | 14 (18.7%) | 55,893 (34,501.9%) |
| 2.0x to 2.9x | 16 (21.3%) | 54 (33.3%) |
| 3.0x to 3.9x | 4 (5.3%) | 62 (38.3%) |
| 4.0x or more | 41 (54.7%) | 18 (11.1%) |
| Total | 75 (100.0%) | 162 (100.0%) |
Real Estate Taxes by Mortgage Status in Porterdale
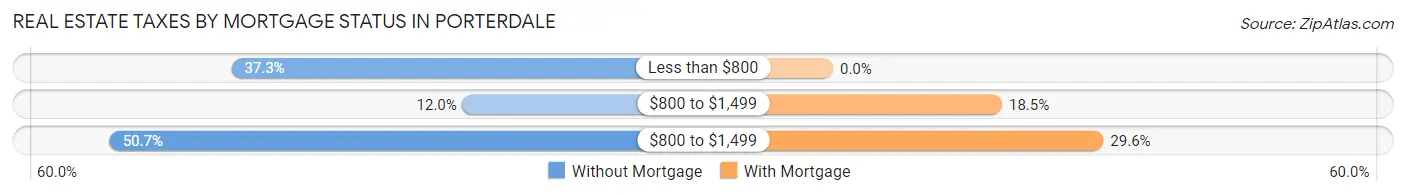
| Property Taxes | Without Mortgage | With Mortgage |
| Less than $800 | 28 (37.3%) | 0 (0.0%) |
| $800 to $1,499 | 9 (12.0%) | 30 (18.5%) |
| $800 to $1,499 | 38 (50.7%) | 48 (29.6%) |
| Total | 75 (100.0%) | 162 (100.0%) |
Health & Disability in Porterdale
Health Insurance Coverage by Age in Porterdale
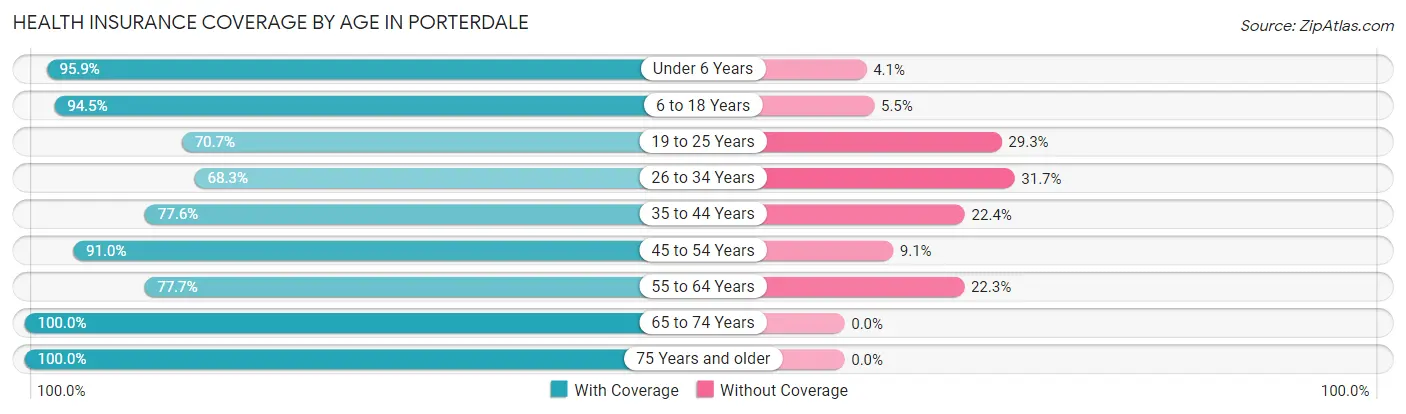
| Age Bracket | With Coverage | Without Coverage |
| Under 6 Years | 94 (95.9%) | 4 (4.1%) |
| 6 to 18 Years | 273 (94.5%) | 16 (5.5%) |
| 19 to 25 Years | 111 (70.7%) | 46 (29.3%) |
| 26 to 34 Years | 84 (68.3%) | 39 (31.7%) |
| 35 to 44 Years | 121 (77.6%) | 35 (22.4%) |
| 45 to 54 Years | 221 (90.9%) | 22 (9.0%) |
| 55 to 64 Years | 268 (77.7%) | 77 (22.3%) |
| 65 to 74 Years | 165 (100.0%) | 0 (0.0%) |
| 75 Years and older | 26 (100.0%) | 0 (0.0%) |
| Total | 1,363 (85.1%) | 239 (14.9%) |
Health Insurance Coverage by Citizenship Status in Porterdale
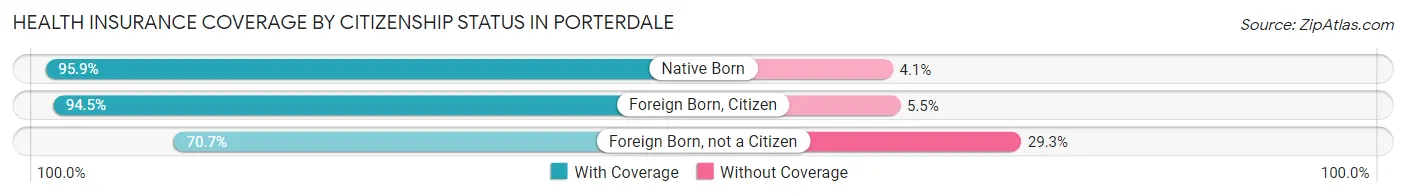
| Citizenship Status | With Coverage | Without Coverage |
| Native Born | 94 (95.9%) | 4 (4.1%) |
| Foreign Born, Citizen | 273 (94.5%) | 16 (5.5%) |
| Foreign Born, not a Citizen | 111 (70.7%) | 46 (29.3%) |
Health Insurance Coverage by Household Income in Porterdale
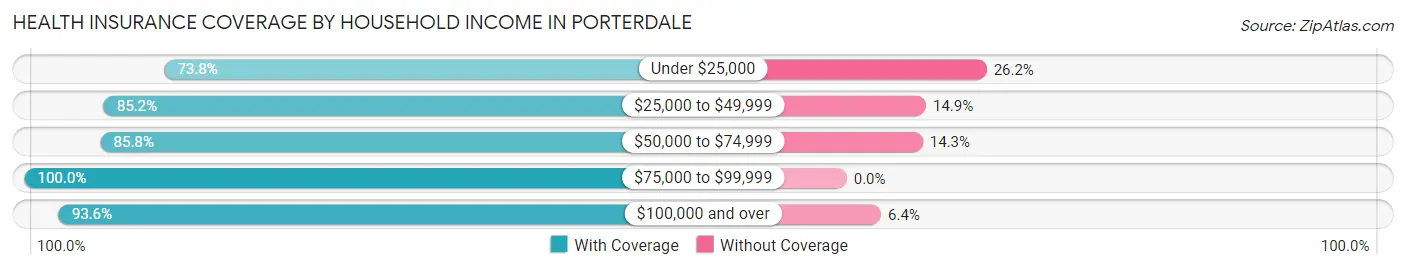
| Household Income | With Coverage | Without Coverage |
| Under $25,000 | 321 (73.8%) | 114 (26.2%) |
| $25,000 to $49,999 | 304 (85.2%) | 53 (14.8%) |
| $50,000 to $74,999 | 349 (85.8%) | 58 (14.2%) |
| $75,000 to $99,999 | 185 (100.0%) | 0 (0.0%) |
| $100,000 and over | 204 (93.6%) | 14 (6.4%) |
Public vs Private Health Insurance Coverage by Age in Porterdale
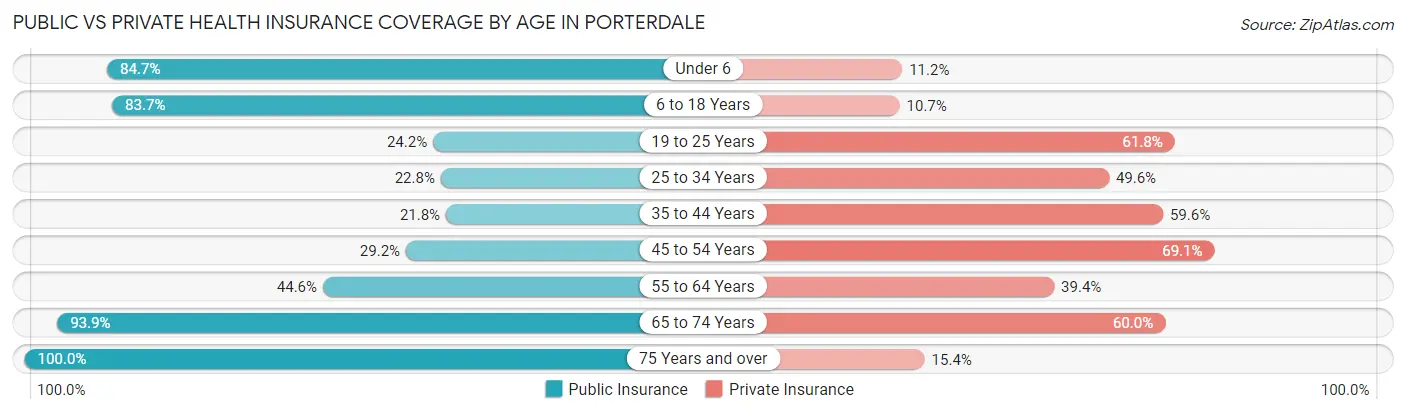
| Age Bracket | Public Insurance | Private Insurance |
| Under 6 | 83 (84.7%) | 11 (11.2%) |
| 6 to 18 Years | 242 (83.7%) | 31 (10.7%) |
| 19 to 25 Years | 38 (24.2%) | 97 (61.8%) |
| 25 to 34 Years | 28 (22.8%) | 61 (49.6%) |
| 35 to 44 Years | 34 (21.8%) | 93 (59.6%) |
| 45 to 54 Years | 71 (29.2%) | 168 (69.1%) |
| 55 to 64 Years | 154 (44.6%) | 136 (39.4%) |
| 65 to 74 Years | 155 (93.9%) | 99 (60.0%) |
| 75 Years and over | 26 (100.0%) | 4 (15.4%) |
| Total | 831 (51.9%) | 700 (43.7%) |
Disability Status by Sex by Age in Porterdale
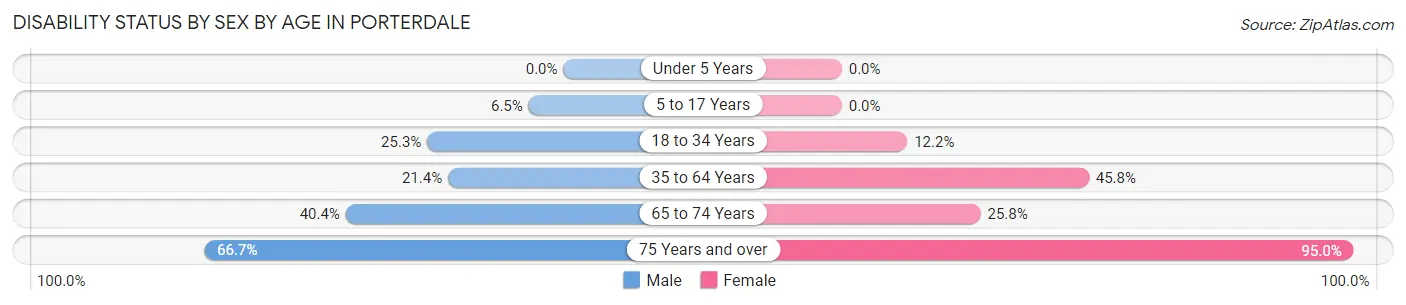
| Age Bracket | Male | Female |
| Under 5 Years | 0 (0.0%) | 0 (0.0%) |
| 5 to 17 Years | 10 (6.5%) | 0 (0.0%) |
| 18 to 34 Years | 45 (25.3%) | 13 (12.1%) |
| 35 to 64 Years | 64 (21.4%) | 204 (45.8%) |
| 65 to 74 Years | 40 (40.4%) | 17 (25.8%) |
| 75 Years and over | 4 (66.7%) | 19 (95.0%) |
Disability Class by Sex by Age in Porterdale
Disability Class: Hearing Difficulty
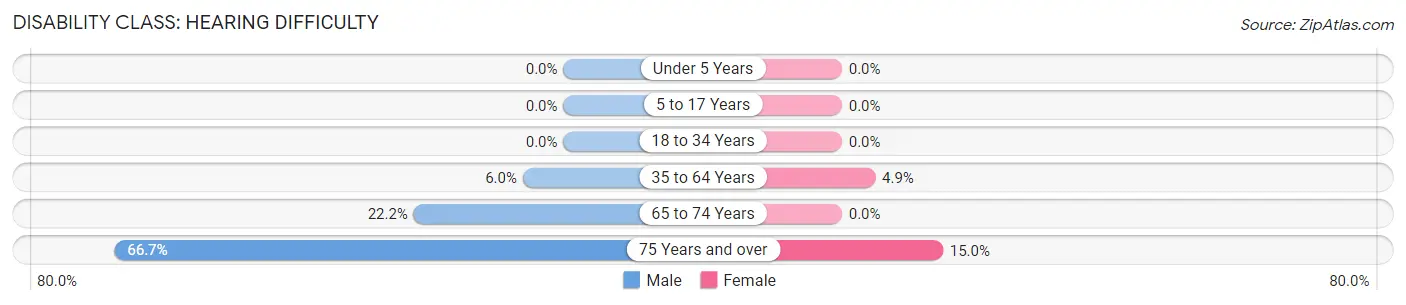
| Age Bracket | Male | Female |
| Under 5 Years | 0 (0.0%) | 0 (0.0%) |
| 5 to 17 Years | 0 (0.0%) | 0 (0.0%) |
| 18 to 34 Years | 0 (0.0%) | 0 (0.0%) |
| 35 to 64 Years | 18 (6.0%) | 22 (4.9%) |
| 65 to 74 Years | 22 (22.2%) | 0 (0.0%) |
| 75 Years and over | 4 (66.7%) | 3 (15.0%) |
Disability Class: Vision Difficulty
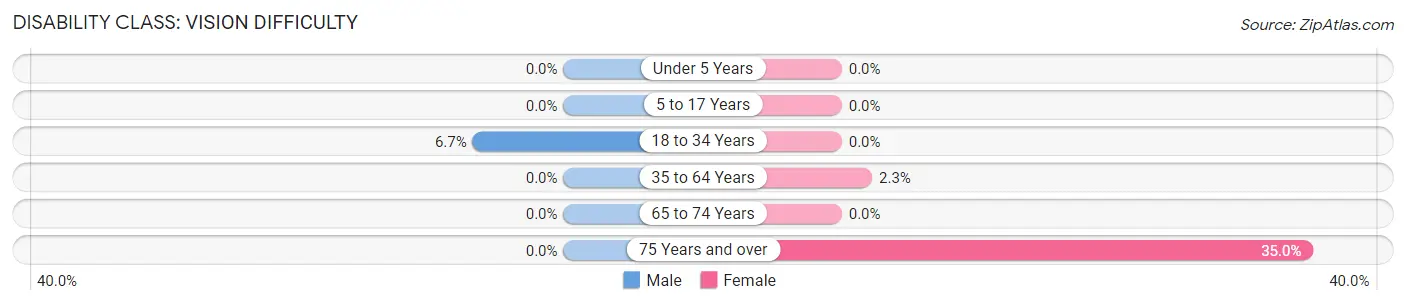
| Age Bracket | Male | Female |
| Under 5 Years | 0 (0.0%) | 0 (0.0%) |
| 5 to 17 Years | 0 (0.0%) | 0 (0.0%) |
| 18 to 34 Years | 12 (6.7%) | 0 (0.0%) |
| 35 to 64 Years | 0 (0.0%) | 10 (2.2%) |
| 65 to 74 Years | 0 (0.0%) | 0 (0.0%) |
| 75 Years and over | 0 (0.0%) | 7 (35.0%) |
Disability Class: Cognitive Difficulty
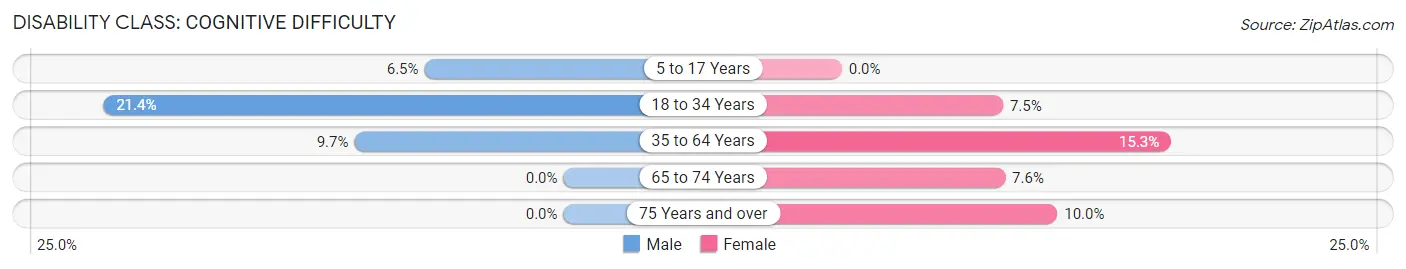
| Age Bracket | Male | Female |
| 5 to 17 Years | 10 (6.5%) | 0 (0.0%) |
| 18 to 34 Years | 38 (21.3%) | 8 (7.5%) |
| 35 to 64 Years | 29 (9.7%) | 68 (15.3%) |
| 65 to 74 Years | 0 (0.0%) | 5 (7.6%) |
| 75 Years and over | 0 (0.0%) | 2 (10.0%) |
Disability Class: Ambulatory Difficulty
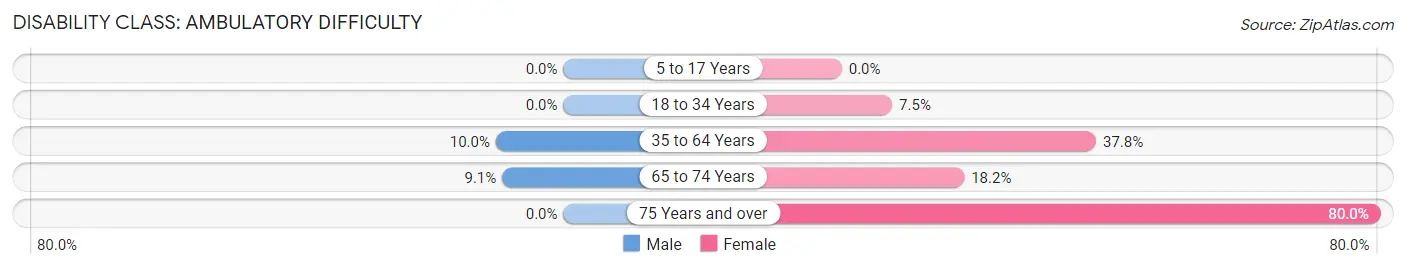
| Age Bracket | Male | Female |
| 5 to 17 Years | 0 (0.0%) | 0 (0.0%) |
| 18 to 34 Years | 0 (0.0%) | 8 (7.5%) |
| 35 to 64 Years | 30 (10.0%) | 168 (37.8%) |
| 65 to 74 Years | 9 (9.1%) | 12 (18.2%) |
| 75 Years and over | 0 (0.0%) | 16 (80.0%) |
Disability Class: Self-Care Difficulty
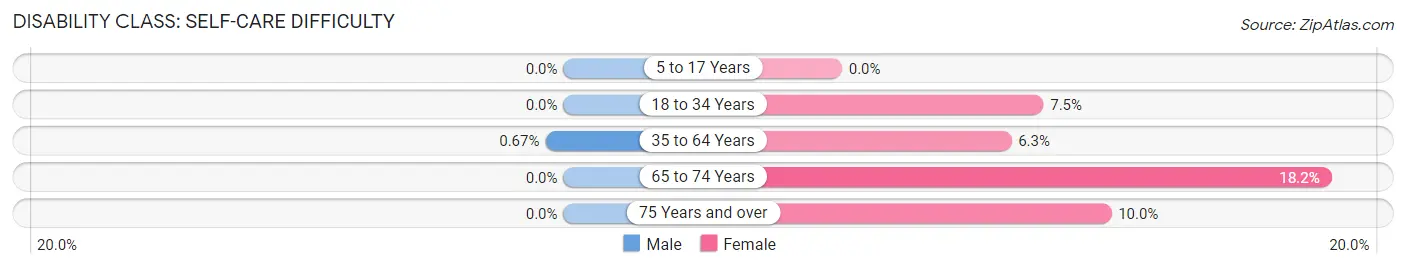
| Age Bracket | Male | Female |
| 5 to 17 Years | 0 (0.0%) | 0 (0.0%) |
| 18 to 34 Years | 0 (0.0%) | 8 (7.5%) |
| 35 to 64 Years | 2 (0.7%) | 28 (6.3%) |
| 65 to 74 Years | 0 (0.0%) | 12 (18.2%) |
| 75 Years and over | 0 (0.0%) | 2 (10.0%) |
Technology Access in Porterdale
Computing Device Access in Porterdale
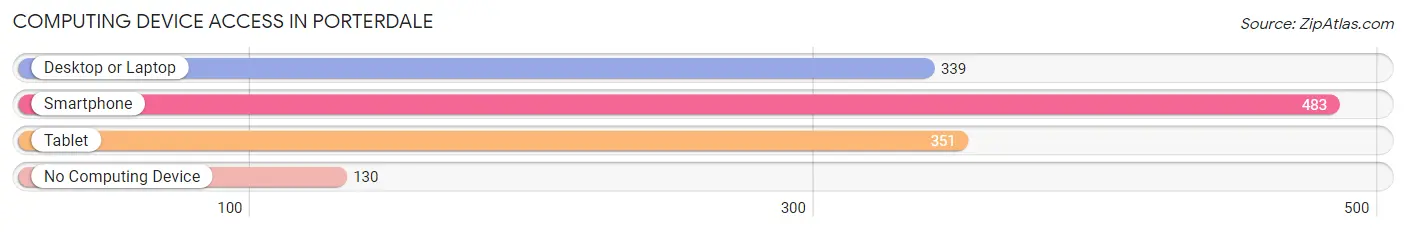
| Device Type | # Households | % Households |
| Desktop or Laptop | 339 | 53.4% |
| Smartphone | 483 | 76.1% |
| Tablet | 351 | 55.3% |
| No Computing Device | 130 | 20.5% |
| Total | 635 | 100.0% |
Internet Access in Porterdale
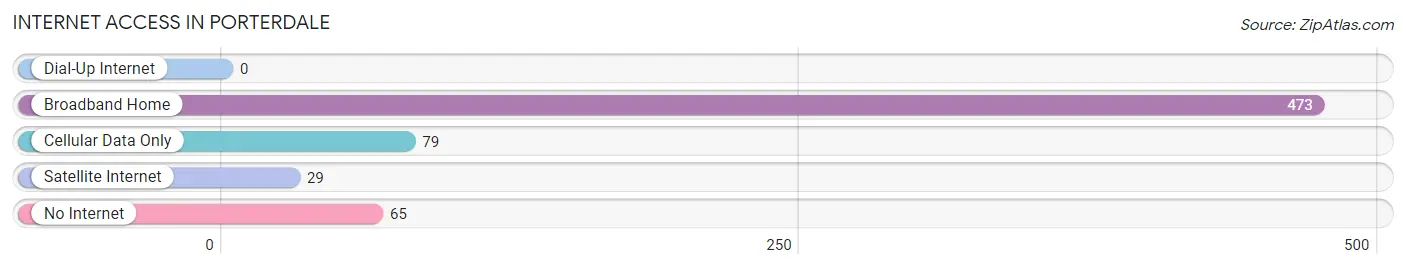
| Internet Type | # Households | % Households |
| Dial-Up Internet | 0 | 0.0% |
| Broadband Home | 473 | 74.5% |
| Cellular Data Only | 79 | 12.4% |
| Satellite Internet | 29 | 4.6% |
| No Internet | 65 | 10.2% |
| Total | 635 | 100.0% |
Porterdale Summary
Porterdale, Georgia is a small city located in Newton County, Georgia, United States. It is situated along the Yellow River, approximately 40 miles east of Atlanta. The city has a population of 1,719 as of the 2010 census.
History
Porterdale was founded in 1884 by the Porter family, who owned a large cotton plantation in the area. The town was named after the family and was incorporated in 1916. The town was originally a mill town, with the Porterdale Cotton Mill being the main employer. The mill was in operation until the late 1970s, when it was closed due to economic decline.
In the early 2000s, the city began to experience a revitalization, with the opening of a new city hall, a new library, and a new police station. The city also began to attract new businesses, such as restaurants, shops, and art galleries.
Geography
Porterdale is located in the Piedmont region of Georgia, at the confluence of the Yellow and Alcovy Rivers. The city has a total area of 1.3 square miles, all of which is land. The city is located approximately 40 miles east of Atlanta and is part of the Atlanta metropolitan area.
Climate
Porterdale has a humid subtropical climate, with hot, humid summers and mild winters. The average annual temperature is 61°F, with an average high of 79°F in July and an average low of 43°F in January. The average annual precipitation is 50 inches, with the wettest month being July, when an average of 6.3 inches of rain falls.
Economy
Porterdale’s economy is largely based on tourism and retail. The city is home to several restaurants, shops, and art galleries, as well as a number of historic sites. The city is also home to the Porterdale Mill Lofts, a historic mill that has been converted into loft apartments.
Demographics
As of the 2010 census, Porterdale had a population of 1,719. The racial makeup of the city was 79.2% White, 16.2% African American, 0.7% Native American, 0.7% Asian, 0.1% Pacific Islander, 1.2% from other races, and 2.0% from two or more races. Hispanic or Latino of any race were 3.2% of the population.
The median income for a household in Porterdale was $37,917, and the median income for a family was $45,000. The per capita income for the city was $20,945. About 11.2% of families and 14.2% of the population were below the poverty line, including 19.2% of those under age 18 and 8.3% of those age 65 or over.
Common Questions
What is the Total Population of Porterdale?
Total Population of Porterdale is 1,602.
What is the Total Male Population of Porterdale?
Total Male Population of Porterdale is 782.
What is the Total Female Population of Porterdale?
Total Female Population of Porterdale is 820.
What is the Ratio of Males per 100 Females in Porterdale?
There are 95.37 Males per 100 Females in Porterdale.
What is the Ratio of Females per 100 Males in Porterdale?
There are 104.86 Females per 100 Males in Porterdale.
What is the Median Population Age in Porterdale?
Median Population Age in Porterdale is 42.7 Years.
What is the Average Family Size in Porterdale
Average Family Size in Porterdale is 3.4 People.
What is the Average Household Size in Porterdale
Average Household Size in Porterdale is 2.5 People.
What is Per Capita Income in Porterdale?
Per Capita income in Porterdale is $18,265.
What is the Median Family Income in Porterdale?
Median Family Income in Porterdale is $44,375.
What is the Median Household income in Porterdale?
Median Household Income in Porterdale is $36,563.
What is Income or Wage Gap in Porterdale?
Income or Wage Gap in Porterdale is 9.0%.
Women in Porterdale earn 91.0 cents for every dollar earned by a man.
What is Inequality or Gini Index in Porterdale?
Inequality or Gini Index in Porterdale is 0.44.
How Large is the Labor Force in Porterdale?
There are 579 People in the Labor Forcein in Porterdale.
What is the Percentage of People in the Labor Force in Porterdale?
46.4% of People are in the Labor Force in Porterdale.
What is the Unemployment Rate in Porterdale?
Unemployment Rate in Porterdale is 3.8%.