Pelham, GA
Pelham Map
Pelham Overview
3,501
TOTAL POPULATION
1,354
MALE POPULATION
2,147
FEMALE POPULATION
63.06
MALES / 100 FEMALES
158.57
FEMALES / 100 MALES
30.9
MEDIAN AGE
3.3
AVG FAMILY SIZE
2.5
AVG HOUSEHOLD SIZE
$16,961
PER CAPITA INCOME
$33,786
AVG FAMILY INCOME
$34,761
AVG HOUSEHOLD INCOME
20.9%
WAGE / INCOME GAP [ % ]
79.1¢/ $1
WAGE / INCOME GAP [ $ ]
0.41
INEQUALITY / GINI INDEX
1,288
LABOR FORCE [ PEOPLE ]
49.0%
PERCENT IN LABOR FORCE
13.1%
UNEMPLOYMENT RATE
Pelham Zip Codes
Pelham Area Codes
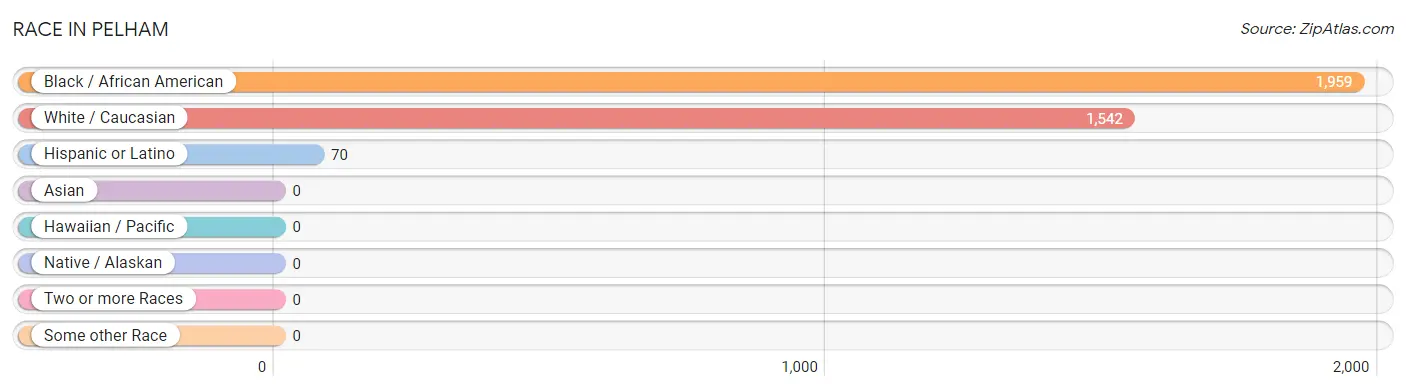
Race in Pelham
The most populous races in Pelham are Black / African American (1,959 | 56.0%), White / Caucasian (1,542 | 44.0%), and Hispanic or Latino (70 | 2.0%).
| Race | # Population | % Population |
| Asian | 0 | 0.0% |
| Black / African American | 1,959 | 56.0% |
| Hawaiian / Pacific | 0 | 0.0% |
| Hispanic or Latino | 70 | 2.0% |
| Native / Alaskan | 0 | 0.0% |
| White / Caucasian | 1,542 | 44.0% |
| Two or more Races | 0 | 0.0% |
| Some other Race | 0 | 0.0% |
| Total | 3,501 | 100.0% |
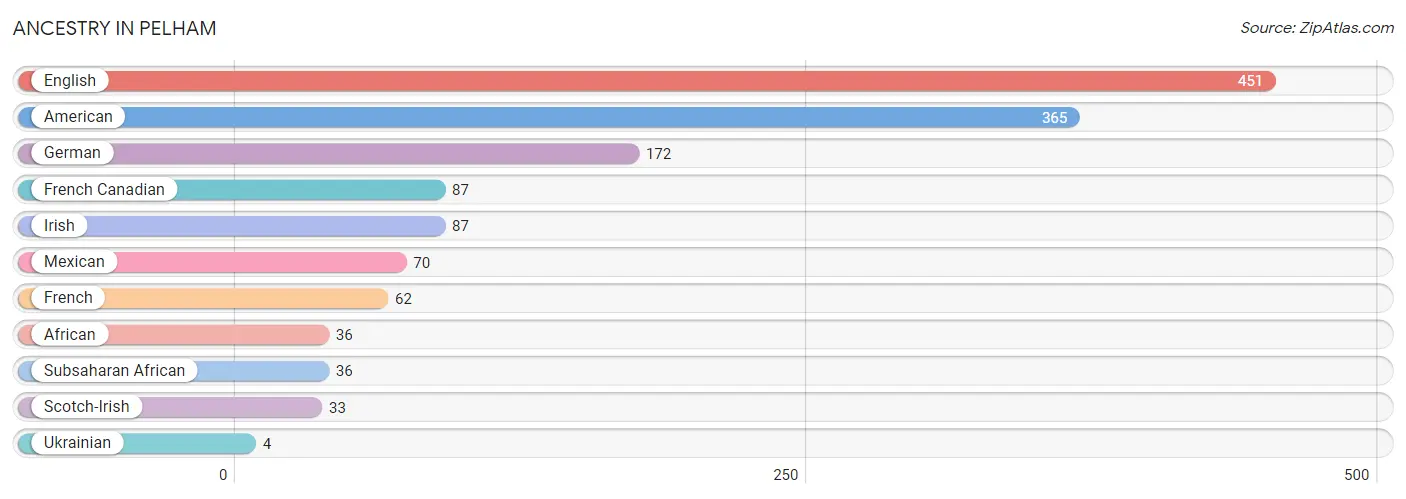
Ancestry in Pelham
The most populous ancestries reported in Pelham are English (451 | 12.9%), American (365 | 10.4%), German (172 | 4.9%), French Canadian (87 | 2.5%), and Irish (87 | 2.5%), together accounting for 33.2% of all Pelham residents.
| Ancestry | # Population | % Population |
| African | 36 | 1.0% |
| American | 365 | 10.4% |
| English | 451 | 12.9% |
| French | 62 | 1.8% |
| French Canadian | 87 | 2.5% |
| German | 172 | 4.9% |
| Irish | 87 | 2.5% |
| Mexican | 70 | 2.0% |
| Scotch-Irish | 33 | 0.9% |
| Subsaharan African | 36 | 1.0% |
| Ukrainian | 4 | 0.1% | View All 11 Rows |
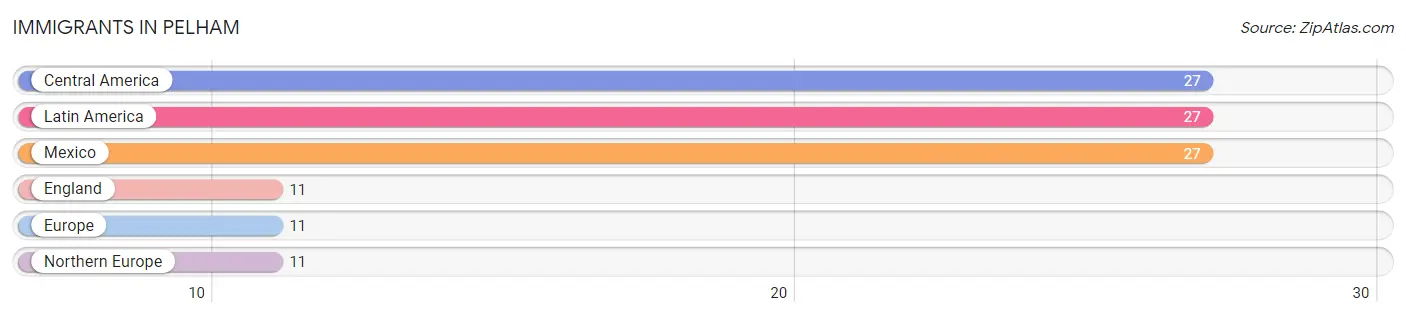
Immigrants in Pelham
The most numerous immigrant groups reported in Pelham came from Central America (27 | 0.8%), Latin America (27 | 0.8%), Mexico (27 | 0.8%), England (11 | 0.3%), and Europe (11 | 0.3%), together accounting for 2.9% of all Pelham residents.
| Immigration Origin | # Population | % Population |
| Central America | 27 | 0.8% |
| England | 11 | 0.3% |
| Europe | 11 | 0.3% |
| Latin America | 27 | 0.8% |
| Mexico | 27 | 0.8% |
| Northern Europe | 11 | 0.3% | View All 6 Rows |
Sex and Age in Pelham
Sex and Age in Pelham
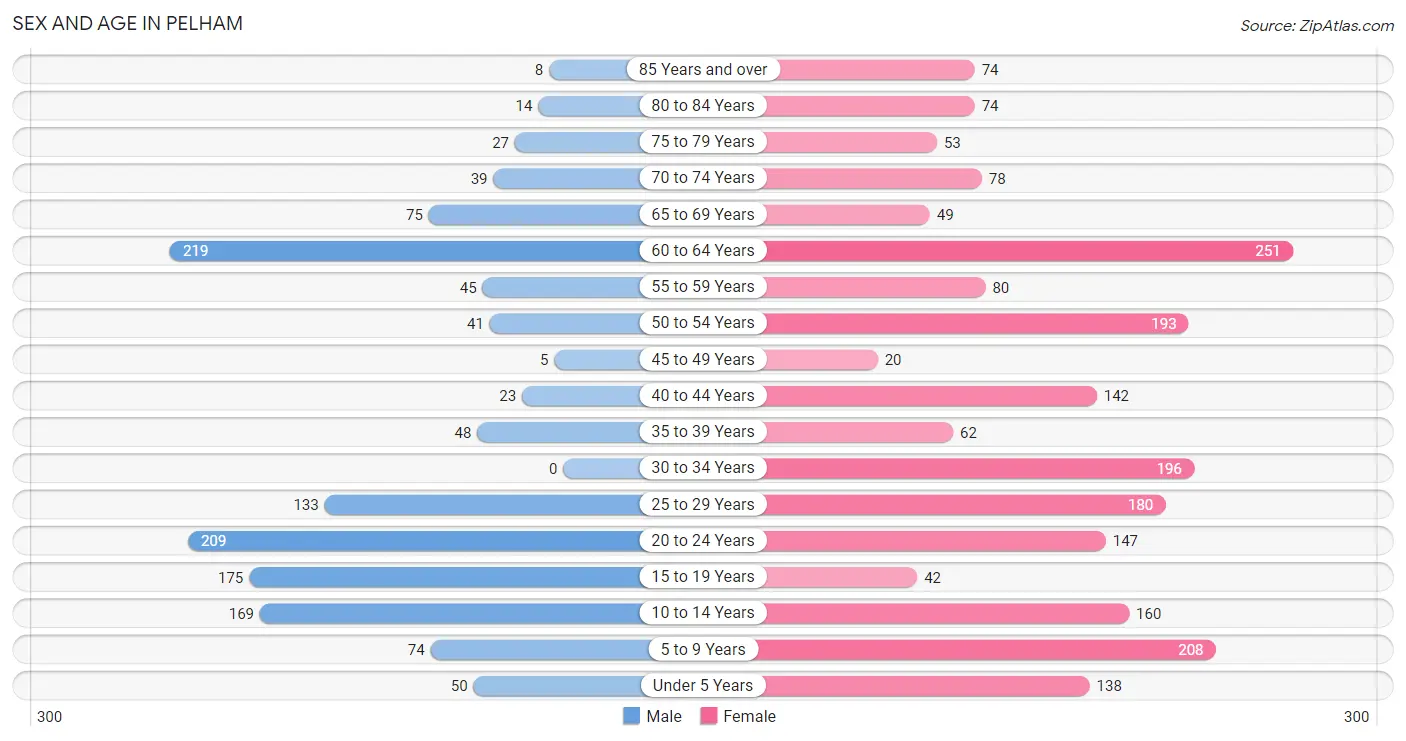
The most populous age groups in Pelham are 60 to 64 Years (219 | 16.2%) for men and 60 to 64 Years (251 | 11.7%) for women.
| Age Bracket | Male | Female |
| Under 5 Years | 50 (3.7%) | 138 (6.4%) |
| 5 to 9 Years | 74 (5.5%) | 208 (9.7%) |
| 10 to 14 Years | 169 (12.5%) | 160 (7.4%) |
| 15 to 19 Years | 175 (12.9%) | 42 (2.0%) |
| 20 to 24 Years | 209 (15.4%) | 147 (6.9%) |
| 25 to 29 Years | 133 (9.8%) | 180 (8.4%) |
| 30 to 34 Years | 0 (0.0%) | 196 (9.1%) |
| 35 to 39 Years | 48 (3.5%) | 62 (2.9%) |
| 40 to 44 Years | 23 (1.7%) | 142 (6.6%) |
| 45 to 49 Years | 5 (0.4%) | 20 (0.9%) |
| 50 to 54 Years | 41 (3.0%) | 193 (9.0%) |
| 55 to 59 Years | 45 (3.3%) | 80 (3.7%) |
| 60 to 64 Years | 219 (16.2%) | 251 (11.7%) |
| 65 to 69 Years | 75 (5.5%) | 49 (2.3%) |
| 70 to 74 Years | 39 (2.9%) | 78 (3.6%) |
| 75 to 79 Years | 27 (2.0%) | 53 (2.5%) |
| 80 to 84 Years | 14 (1.0%) | 74 (3.5%) |
| 85 Years and over | 8 (0.6%) | 74 (3.5%) |
| Total | 1,354 (100.0%) | 2,147 (100.0%) |
Families and Households in Pelham
Median Family Size in Pelham
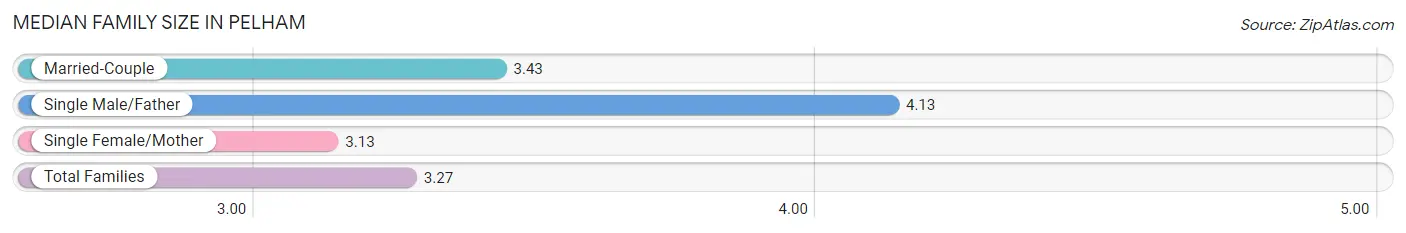
The median family size in Pelham is 3.27 persons per family, with single male/father families (15 | 1.9%) accounting for the largest median family size of 4.13 persons per family. On the other hand, single female/mother families (465 | 57.6%) represent the smallest median family size with 3.13 persons per family.
| Family Type | # Families | Family Size |
| Married-Couple | 328 (40.6%) | 3.43 |
| Single Male/Father | 15 (1.9%) | 4.13 |
| Single Female/Mother | 465 (57.6%) | 3.13 |
| Total Families | 808 (100.0%) | 3.27 |
Median Household Size in Pelham
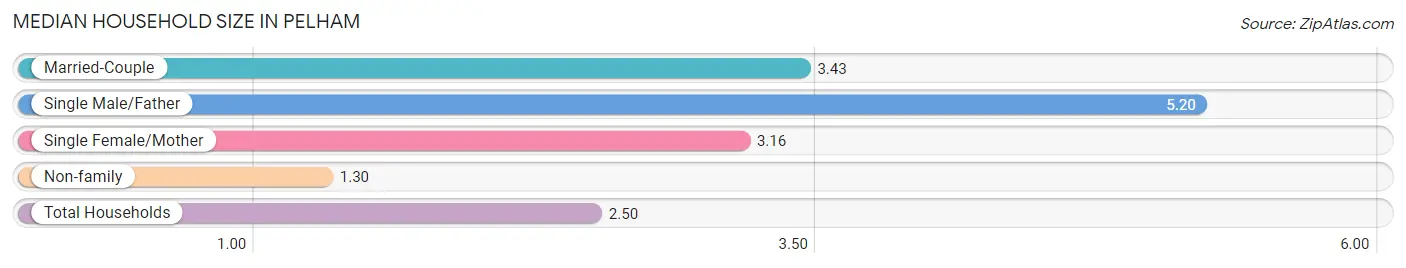
The median household size in Pelham is 2.50 persons per household, with single male/father households (15 | 1.1%) accounting for the largest median household size of 5.2 persons per household. non-family households (549 | 40.5%) represent the smallest median household size with 1.30 persons per household.
| Household Type | # Households | Household Size |
| Married-Couple | 328 (24.2%) | 3.43 |
| Single Male/Father | 15 (1.1%) | 5.20 |
| Single Female/Mother | 465 (34.3%) | 3.16 |
| Non-family | 549 (40.5%) | 1.30 |
| Total Households | 1,357 (100.0%) | 2.50 |
Household Size by Marriage Status in Pelham
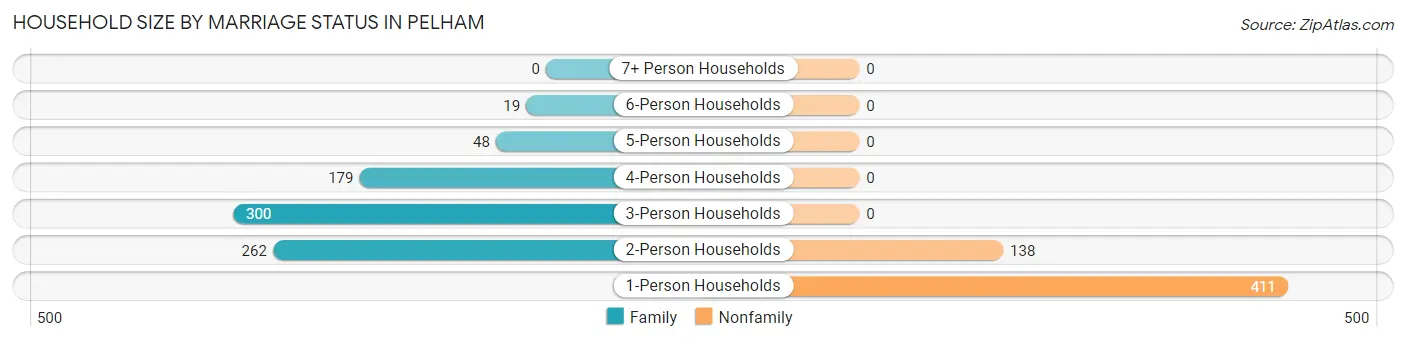
Out of a total of 1,357 households in Pelham, 808 (59.5%) are family households, while 549 (40.5%) are nonfamily households. The most numerous type of family households are 3-person households, comprising 300, and the most common type of nonfamily households are 1-person households, comprising 411.
| Household Size | Family Households | Nonfamily Households |
| 1-Person Households | - | 411 (30.3%) |
| 2-Person Households | 262 (19.3%) | 138 (10.2%) |
| 3-Person Households | 300 (22.1%) | 0 (0.0%) |
| 4-Person Households | 179 (13.2%) | 0 (0.0%) |
| 5-Person Households | 48 (3.5%) | 0 (0.0%) |
| 6-Person Households | 19 (1.4%) | 0 (0.0%) |
| 7+ Person Households | 0 (0.0%) | 0 (0.0%) |
| Total | 808 (59.5%) | 549 (40.5%) |
Female Fertility in Pelham
Fertility by Age in Pelham
Average fertility rate in Pelham is 98.0 births per 1,000 women. Women in the age bracket of 20 to 34 years have the highest fertility rate with 151.0 births per 1,000 women. Women in the age bracket of 20 to 34 years acount for 100.0% of all women with births.
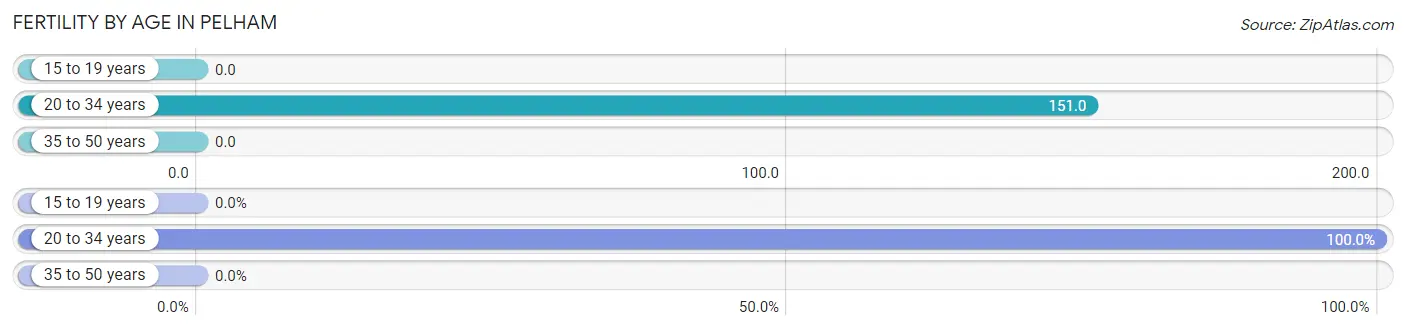
| Age Bracket | Women with Births | Births / 1,000 Women |
| 15 to 19 years | 0 (0.0%) | 0.0 |
| 20 to 34 years | 79 (100.0%) | 151.0 |
| 35 to 50 years | 0 (0.0%) | 0.0 |
| Total | 79 (100.0%) | 98.0 |
Fertility by Age by Marriage Status in Pelham
82.3% of women with births (79) in Pelham are married. The highest percentage of unmarried women with births falls into 20 to 34 years age bracket with 17.7% of them unmarried at the time of birth, while the lowest percentage of unmarried women with births belong to 20 to 34 years age bracket with 17.7% of them unmarried.
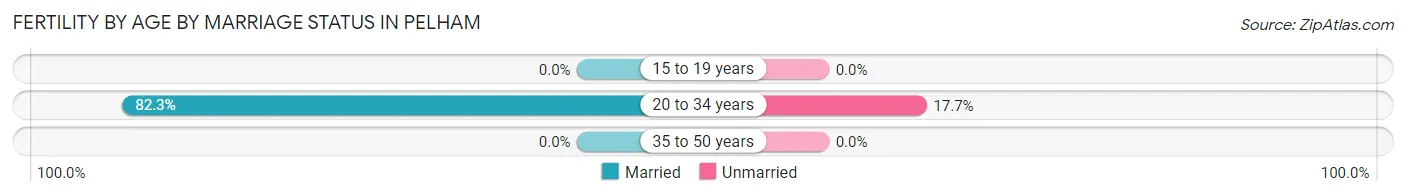
| Age Bracket | Married | Unmarried |
| 15 to 19 years | 0 (0.0%) | 0 (0.0%) |
| 20 to 34 years | 65 (82.3%) | 14 (17.7%) |
| 35 to 50 years | 0 (0.0%) | 0 (0.0%) |
| Total | 65 (82.3%) | 14 (17.7%) |
Fertility by Education in Pelham
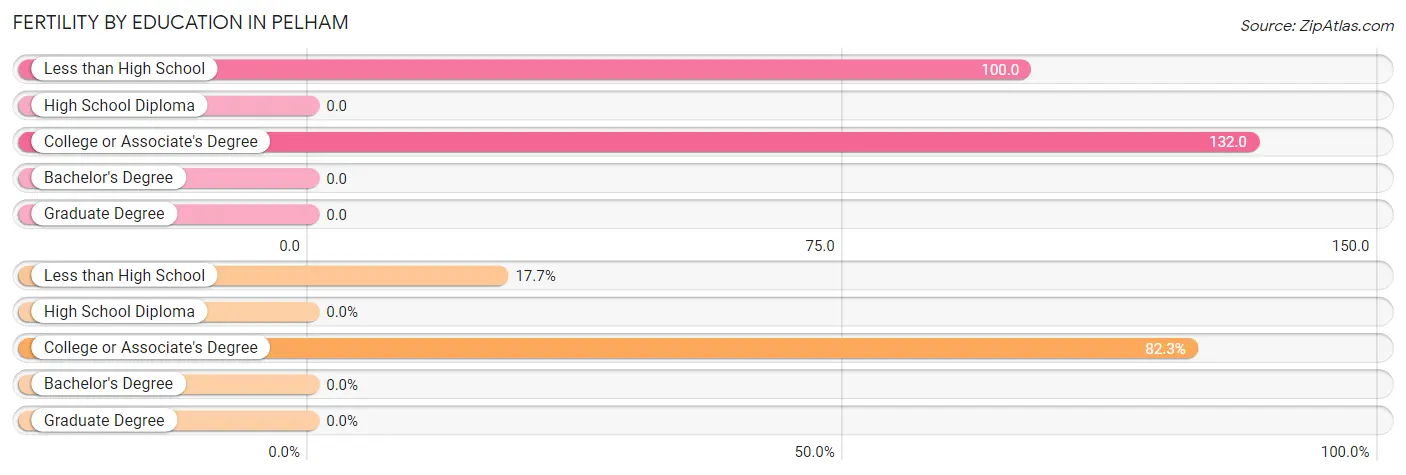
| Educational Attainment | Women with Births | Births / 1,000 Women |
| Less than High School | 14 (17.7%) | 100.0 |
| High School Diploma | 0 (0.0%) | 0.0 |
| College or Associate's Degree | 65 (82.3%) | 132.0 |
| Bachelor's Degree | 0 (0.0%) | 0.0 |
| Graduate Degree | 0 (0.0%) | 0.0 |
| Total | 79 (100.0%) | 98.0 |
Fertility by Education by Marriage Status in Pelham
17.7% of women with births in Pelham are unmarried. Women with the educational attainment of college or associate's degree are most likely to be married with 100.0% of them married at childbirth, while women with the educational attainment of less than high school are least likely to be married with 100.0% of them unmarried at childbirth.
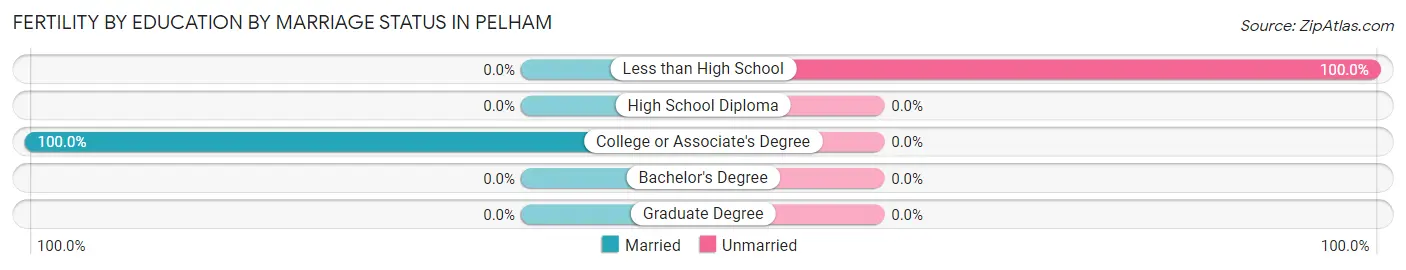
| Educational Attainment | Married | Unmarried |
| Less than High School | 0 (0.0%) | 14 (100.0%) |
| High School Diploma | 0 (0.0%) | 0 (0.0%) |
| College or Associate's Degree | 65 (100.0%) | 0 (0.0%) |
| Bachelor's Degree | 0 (0.0%) | 0 (0.0%) |
| Graduate Degree | 0 (0.0%) | 0 (0.0%) |
| Total | 65 (82.3%) | 14 (17.7%) |
Income in Pelham
Income Overview in Pelham
Per Capita Income in Pelham is $16,961, while median incomes of families and households are $33,786 and $34,761 respectively.
| Characteristic | Number | Measure |
| Per Capita Income | 3,501 | $16,961 |
| Median Family Income | 808 | $33,786 |
| Mean Family Income | 808 | $41,022 |
| Median Household Income | 1,357 | $34,761 |
| Mean Household Income | 1,357 | $41,411 |
| Income Deficit | 808 | $0 |
| Wage / Income Gap (%) | 3,501 | 20.86% |
| Wage / Income Gap ($) | 3,501 | 79.14¢ per $1 |
| Gini / Inequality Index | 3,501 | 0.41 |
Earnings by Sex in Pelham
Average Earnings in Pelham are $22,225, $27,074 for men and $21,426 for women, a difference of 20.9%.
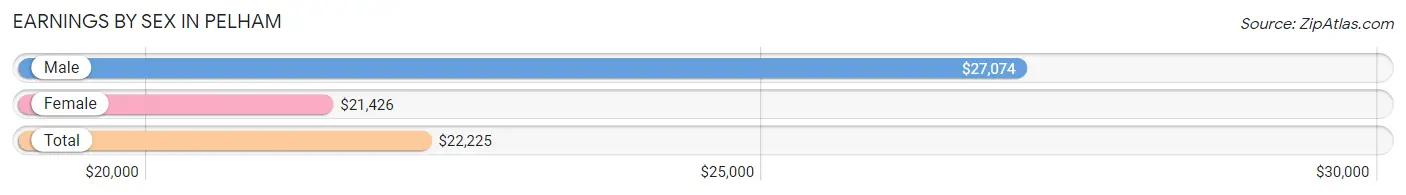
| Sex | Number | Average Earnings |
| Male | 650 (45.3%) | $27,074 |
| Female | 786 (54.7%) | $21,426 |
| Total | 1,436 (100.0%) | $22,225 |
Earnings by Sex by Income Bracket in Pelham
The most common earnings brackets in Pelham are $5,000 to $7,499 for men (116 | 17.8%) and $25,000 to $29,999 for women (141 | 17.9%).
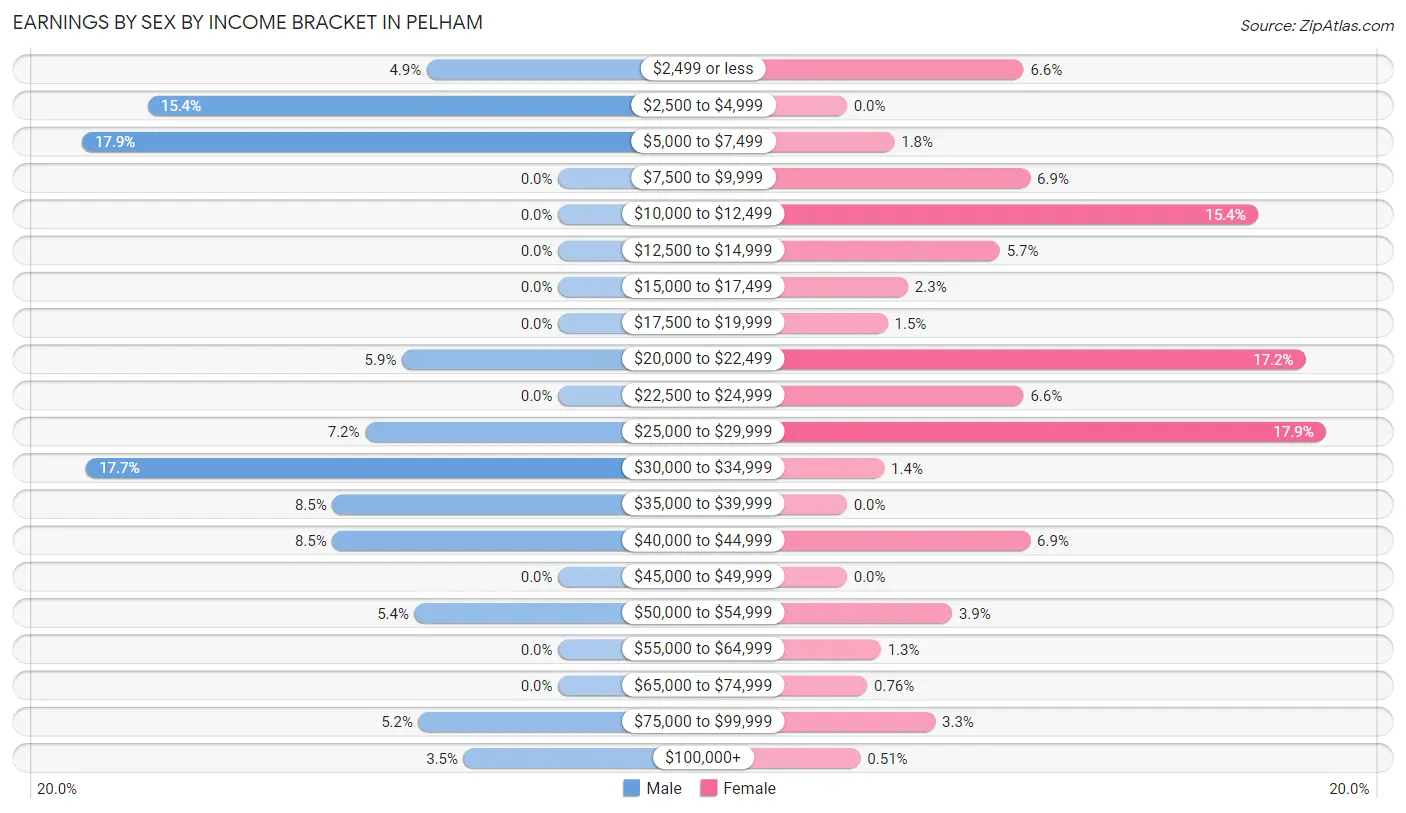
| Income | Male | Female |
| $2,499 or less | 32 (4.9%) | 52 (6.6%) |
| $2,500 to $4,999 | 100 (15.4%) | 0 (0.0%) |
| $5,000 to $7,499 | 116 (17.8%) | 14 (1.8%) |
| $7,500 to $9,999 | 0 (0.0%) | 54 (6.9%) |
| $10,000 to $12,499 | 0 (0.0%) | 121 (15.4%) |
| $12,500 to $14,999 | 0 (0.0%) | 45 (5.7%) |
| $15,000 to $17,499 | 0 (0.0%) | 18 (2.3%) |
| $17,500 to $19,999 | 0 (0.0%) | 12 (1.5%) |
| $20,000 to $22,499 | 38 (5.9%) | 135 (17.2%) |
| $22,500 to $24,999 | 0 (0.0%) | 52 (6.6%) |
| $25,000 to $29,999 | 47 (7.2%) | 141 (17.9%) |
| $30,000 to $34,999 | 115 (17.7%) | 11 (1.4%) |
| $35,000 to $39,999 | 55 (8.5%) | 0 (0.0%) |
| $40,000 to $44,999 | 55 (8.5%) | 54 (6.9%) |
| $45,000 to $49,999 | 0 (0.0%) | 0 (0.0%) |
| $50,000 to $54,999 | 35 (5.4%) | 31 (3.9%) |
| $55,000 to $64,999 | 0 (0.0%) | 10 (1.3%) |
| $65,000 to $74,999 | 0 (0.0%) | 6 (0.8%) |
| $75,000 to $99,999 | 34 (5.2%) | 26 (3.3%) |
| $100,000+ | 23 (3.5%) | 4 (0.5%) |
| Total | 650 (100.0%) | 786 (100.0%) |
Earnings by Sex by Educational Attainment in Pelham
Average earnings in Pelham are $35,068 for men and $22,764 for women, a difference of 35.1%. Men with an educational attainment of college or associate's degree enjoy the highest average annual earnings of $26,862, while those with college or associate's degree education earn the least with $26,862. Women with an educational attainment of bachelor's degree earn the most with the average annual earnings of $24,375, while those with high school diploma education have the smallest earnings of $21,625.
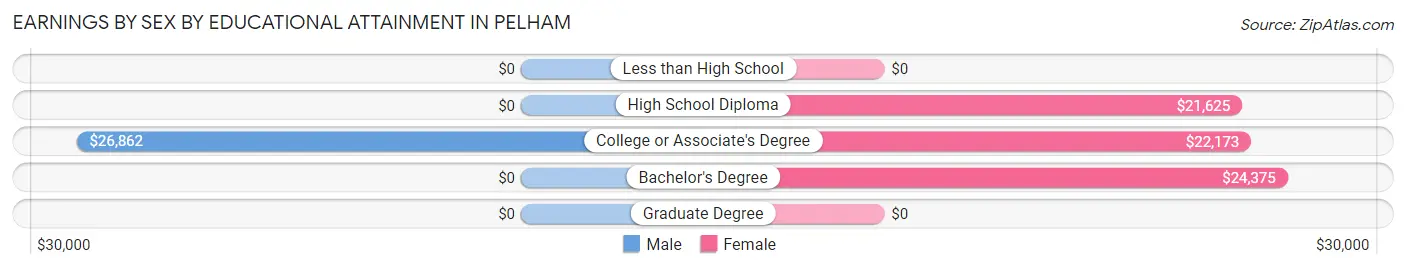
| Educational Attainment | Male Income | Female Income |
| Less than High School | - | - |
| High School Diploma | - | - |
| College or Associate's Degree | $26,862 | $22,173 |
| Bachelor's Degree | - | - |
| Graduate Degree | - | - |
| Total | $35,068 | $22,764 |
Family Income in Pelham
Family Income Brackets in Pelham
According to the Pelham family income data, there are 179 families falling into the $50,000 to $74,999 income range, which is the most common income bracket and makes up 22.2% of all families.
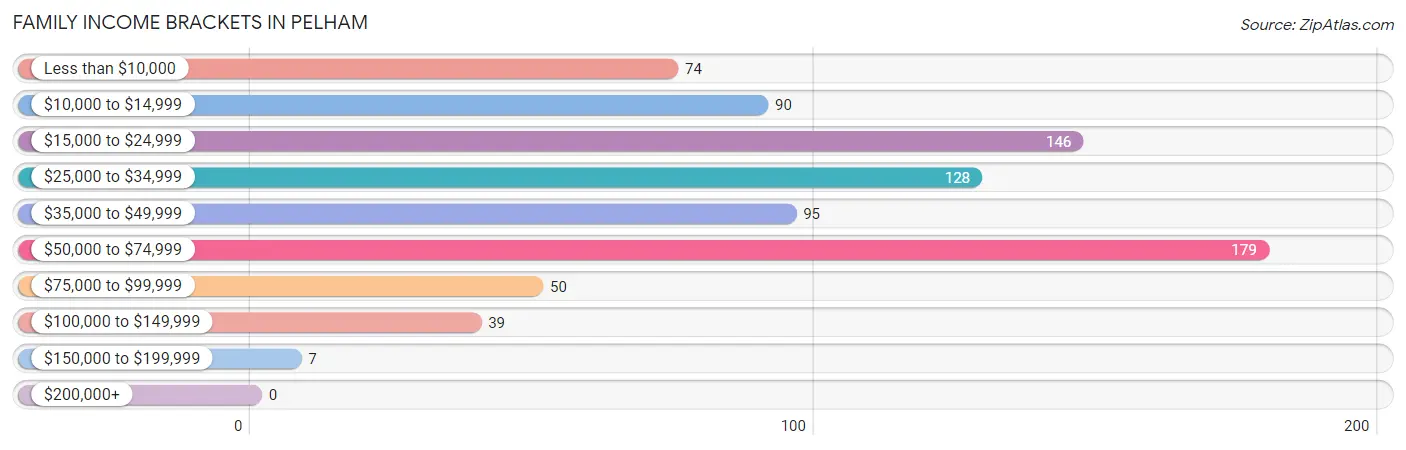
| Income Bracket | # Families | % Families |
| Less than $10,000 | 74 | 9.2% |
| $10,000 to $14,999 | 90 | 11.1% |
| $15,000 to $24,999 | 146 | 18.1% |
| $25,000 to $34,999 | 128 | 15.8% |
| $35,000 to $49,999 | 95 | 11.8% |
| $50,000 to $74,999 | 179 | 22.2% |
| $75,000 to $99,999 | 50 | 6.2% |
| $100,000 to $149,999 | 39 | 4.8% |
| $150,000 to $199,999 | 7 | 0.9% |
| $200,000+ | 0 | 0.0% |
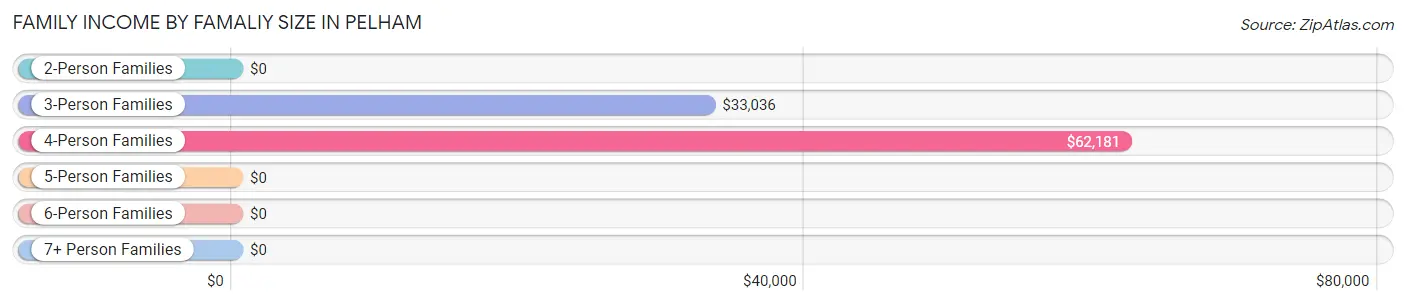
Family Income by Famaliy Size in Pelham
4-person families (166 | 20.5%) account for the highest median family income in Pelham with $62,181 per family, while 4-person families (166 | 20.5%) have the highest median income of $15,545 per family member.
| Income Bracket | # Families | Median Income |
| 2-Person Families | 301 (37.2%) | $0 |
| 3-Person Families | 274 (33.9%) | $33,036 |
| 4-Person Families | 166 (20.5%) | $62,181 |
| 5-Person Families | 48 (5.9%) | $0 |
| 6-Person Families | 19 (2.4%) | $0 |
| 7+ Person Families | 0 (0.0%) | $0 |
| Total | 808 (100.0%) | $33,786 |
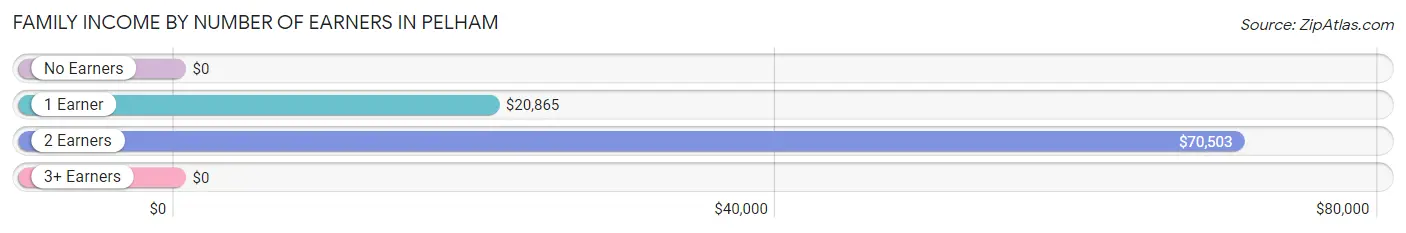
Family Income by Number of Earners in Pelham
| Number of Earners | # Families | Median Income |
| No Earners | 147 (18.2%) | $0 |
| 1 Earner | 324 (40.1%) | $20,865 |
| 2 Earners | 267 (33.0%) | $70,503 |
| 3+ Earners | 70 (8.7%) | $0 |
| Total | 808 (100.0%) | $33,786 |
Household Income in Pelham
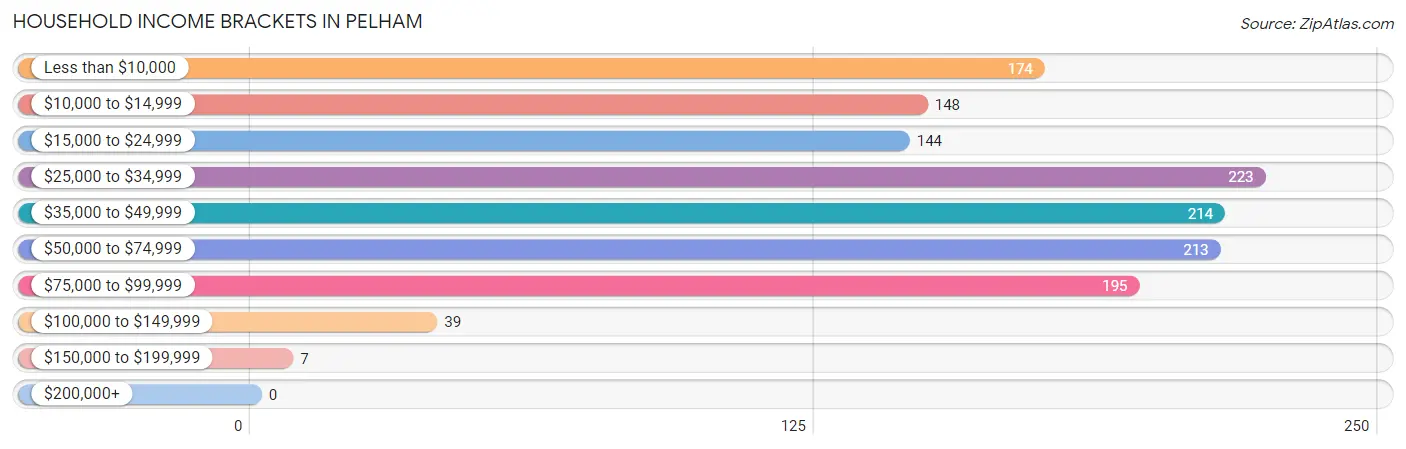
Household Income Brackets in Pelham
With 223 households falling in the category, the $25,000 to $34,999 income range is the most frequent in Pelham, accounting for 16.4% of all households.
| Income Bracket | # Households | % Households |
| Less than $10,000 | 174 | 12.8% |
| $10,000 to $14,999 | 148 | 10.9% |
| $15,000 to $24,999 | 144 | 10.6% |
| $25,000 to $34,999 | 223 | 16.4% |
| $35,000 to $49,999 | 214 | 15.8% |
| $50,000 to $74,999 | 213 | 15.7% |
| $75,000 to $99,999 | 195 | 14.4% |
| $100,000 to $149,999 | 39 | 2.9% |
| $150,000 to $199,999 | 7 | 0.5% |
| $200,000+ | 0 | 0.0% |
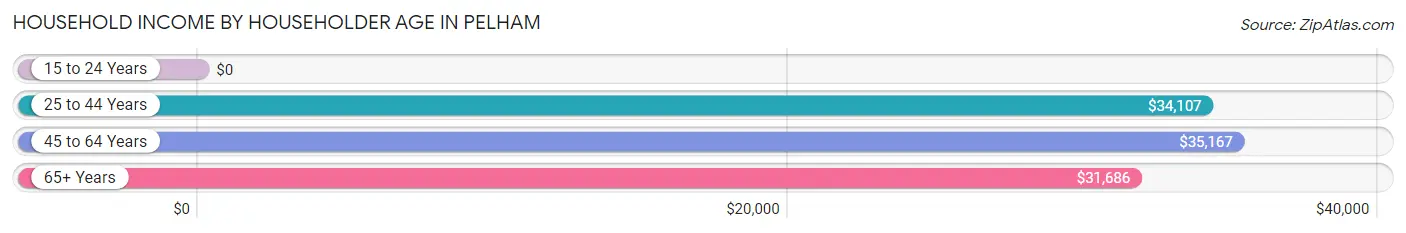
Household Income by Householder Age in Pelham
The median household income in Pelham is $34,761, with the highest median household income of $35,167 found in the 45 to 64 years age bracket for the primary householder. A total of 538 households (39.7%) fall into this category. Meanwhile, the 15 to 24 years age bracket for the primary householder has the lowest median household income of $0, with 77 households (5.7%) in this group.
| Income Bracket | # Households | Median Income |
| 15 to 24 Years | 77 (5.7%) | $0 |
| 25 to 44 Years | 434 (32.0%) | $34,107 |
| 45 to 64 Years | 538 (39.7%) | $35,167 |
| 65+ Years | 308 (22.7%) | $31,686 |
| Total | 1,357 (100.0%) | $34,761 |
Poverty in Pelham
Income Below Poverty by Sex and Age in Pelham
With 17.9% poverty level for males and 41.7% for females among the residents of Pelham, 16 and 17 year old males and 6 to 11 year old females are the most vulnerable to poverty, with 58 males (100.0%) and 230 females (83.3%) in their respective age groups living below the poverty level.
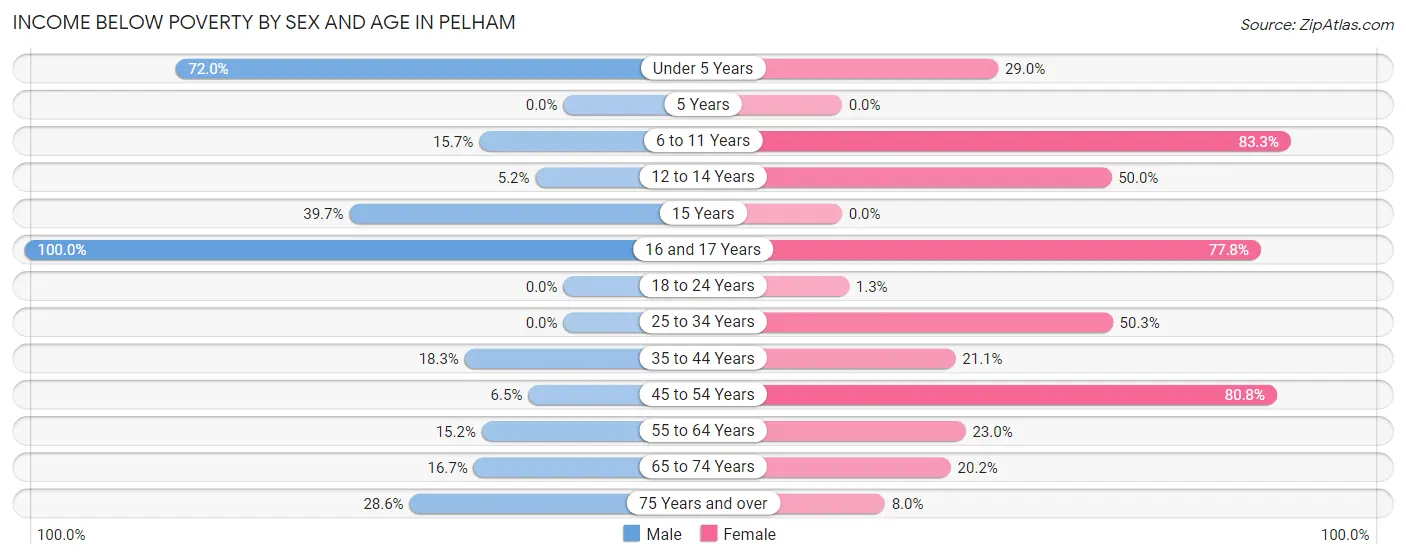
| Age Bracket | Male | Female |
| Under 5 Years | 36 (72.0%) | 40 (29.0%) |
| 5 Years | 0 (0.0%) | 0 (0.0%) |
| 6 to 11 Years | 26 (15.7%) | 230 (83.3%) |
| 12 to 14 Years | 4 (5.2%) | 46 (50.0%) |
| 15 Years | 29 (39.7%) | 0 (0.0%) |
| 16 and 17 Years | 58 (100.0%) | 28 (77.8%) |
| 18 to 24 Years | 0 (0.0%) | 2 (1.3%) |
| 25 to 34 Years | 0 (0.0%) | 189 (50.3%) |
| 35 to 44 Years | 13 (18.3%) | 43 (21.1%) |
| 45 to 54 Years | 3 (6.5%) | 172 (80.7%) |
| 55 to 64 Years | 40 (15.1%) | 76 (23.0%) |
| 65 to 74 Years | 17 (16.7%) | 19 (20.2%) |
| 75 Years and over | 14 (28.6%) | 11 (8.0%) |
| Total | 240 (17.9%) | 856 (41.7%) |
Income Above Poverty by Sex and Age in Pelham
According to the poverty statistics in Pelham, males aged 18 to 24 years and females aged 18 to 24 years are the age groups that are most secure financially, with 100.0% of males and 98.7% of females in these age groups living above the poverty line.
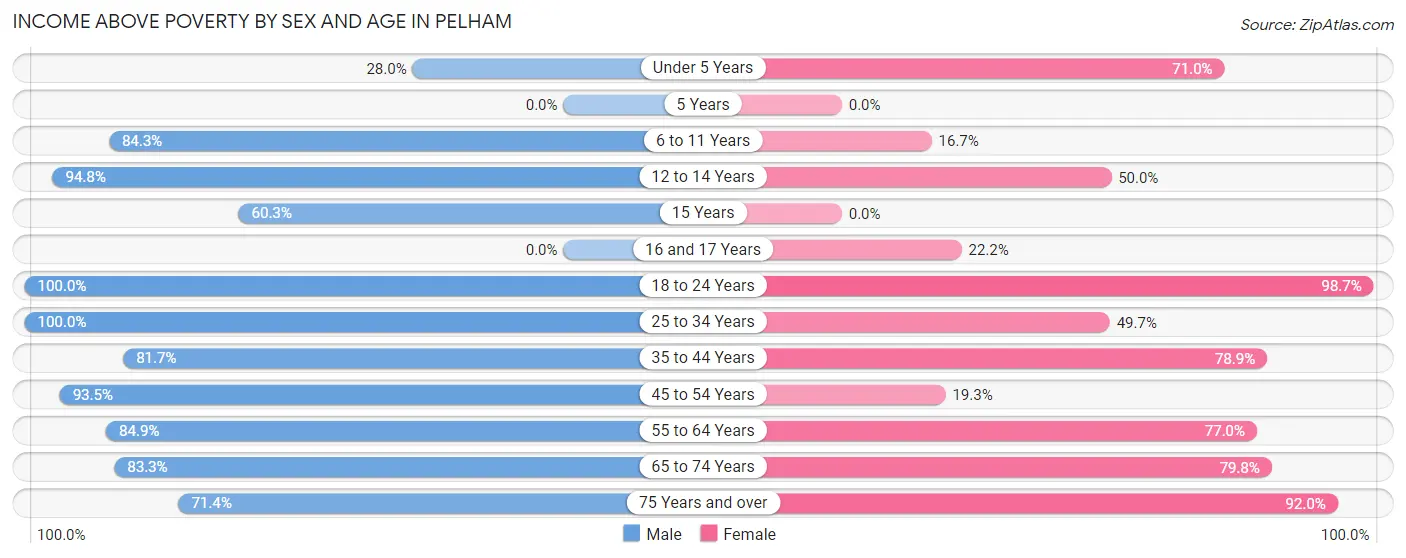
| Age Bracket | Male | Female |
| Under 5 Years | 14 (28.0%) | 98 (71.0%) |
| 5 Years | 0 (0.0%) | 0 (0.0%) |
| 6 to 11 Years | 140 (84.3%) | 46 (16.7%) |
| 12 to 14 Years | 73 (94.8%) | 46 (50.0%) |
| 15 Years | 44 (60.3%) | 0 (0.0%) |
| 16 and 17 Years | 0 (0.0%) | 8 (22.2%) |
| 18 to 24 Years | 253 (100.0%) | 151 (98.7%) |
| 25 to 34 Years | 133 (100.0%) | 187 (49.7%) |
| 35 to 44 Years | 58 (81.7%) | 161 (78.9%) |
| 45 to 54 Years | 43 (93.5%) | 41 (19.3%) |
| 55 to 64 Years | 224 (84.9%) | 255 (77.0%) |
| 65 to 74 Years | 85 (83.3%) | 75 (79.8%) |
| 75 Years and over | 35 (71.4%) | 127 (92.0%) |
| Total | 1,102 (82.1%) | 1,195 (58.3%) |
Income Below Poverty Among Married-Couple Families in Pelham
The poverty statistics for married-couple families in Pelham show that 3.4% or 11 of the total 328 families live below the poverty line. Families with no children have the highest poverty rate of 7.3%, comprising of 11 families. On the other hand, families with 1 or 2 children have the lowest poverty rate of 0.0%, which includes 0 families.
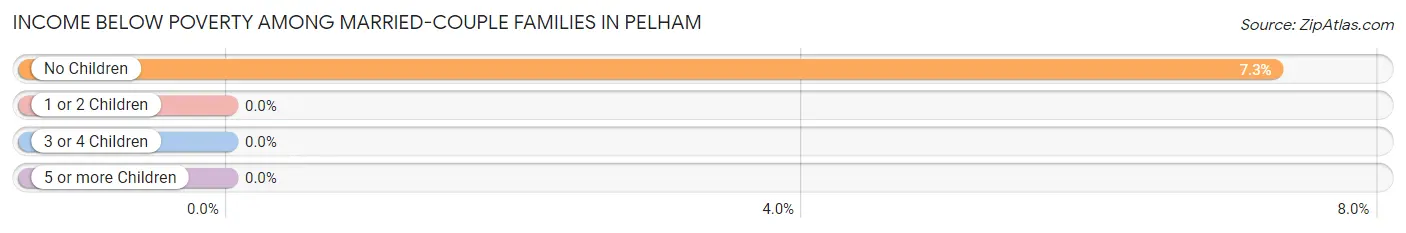
| Children | Above Poverty | Below Poverty |
| No Children | 140 (92.7%) | 11 (7.3%) |
| 1 or 2 Children | 172 (100.0%) | 0 (0.0%) |
| 3 or 4 Children | 5 (100.0%) | 0 (0.0%) |
| 5 or more Children | 0 (0.0%) | 0 (0.0%) |
| Total | 317 (96.7%) | 11 (3.4%) |
Income Below Poverty Among Single-Parent Households in Pelham
According to the poverty data in Pelham, 86.7% or 13 single-father households and 59.6% or 277 single-mother households are living below the poverty line. Among single-father households, those with 1 or 2 children have the highest poverty rate, with 13 households (100.0%) experiencing poverty. Likewise, among single-mother households, those with 3 or 4 children have the highest poverty rate, with 56 households (100.0%) falling below the poverty line.
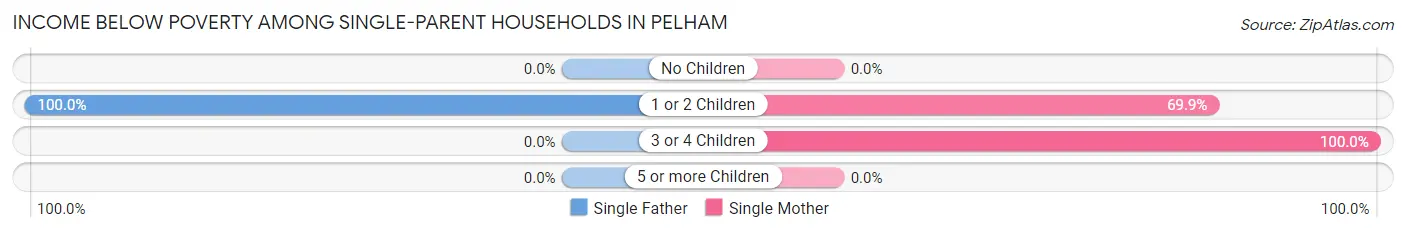
| Children | Single Father | Single Mother |
| No Children | 0 (0.0%) | 0 (0.0%) |
| 1 or 2 Children | 13 (100.0%) | 221 (69.9%) |
| 3 or 4 Children | 0 (0.0%) | 56 (100.0%) |
| 5 or more Children | 0 (0.0%) | 0 (0.0%) |
| Total | 13 (86.7%) | 277 (59.6%) |
Income Below Poverty Among Married-Couple vs Single-Parent Households in Pelham
The poverty data for Pelham shows that 11 of the married-couple family households (3.4%) and 290 of the single-parent households (60.4%) are living below the poverty level. Within the married-couple family households, those with no children have the highest poverty rate, with 11 households (7.3%) falling below the poverty line. Among the single-parent households, those with 3 or 4 children have the highest poverty rate, with 56 household (100.0%) living below poverty.
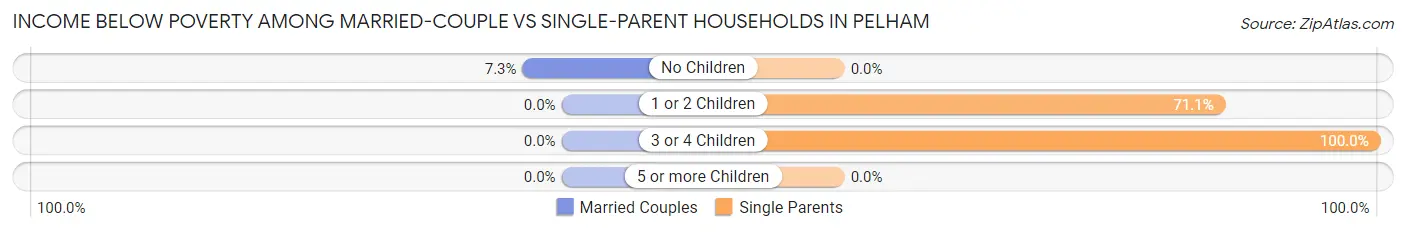
| Children | Married-Couple Families | Single-Parent Households |
| No Children | 11 (7.3%) | 0 (0.0%) |
| 1 or 2 Children | 0 (0.0%) | 234 (71.1%) |
| 3 or 4 Children | 0 (0.0%) | 56 (100.0%) |
| 5 or more Children | 0 (0.0%) | 0 (0.0%) |
| Total | 11 (3.4%) | 290 (60.4%) |
Employment Characteristics in Pelham
Employment by Class of Employer in Pelham
Among the 1,043 employed individuals in Pelham, private company employees (764 | 73.3%), local government employees (99 | 9.5%), and not-for-profit organizations (56 | 5.4%) make up the most common classes of employment.
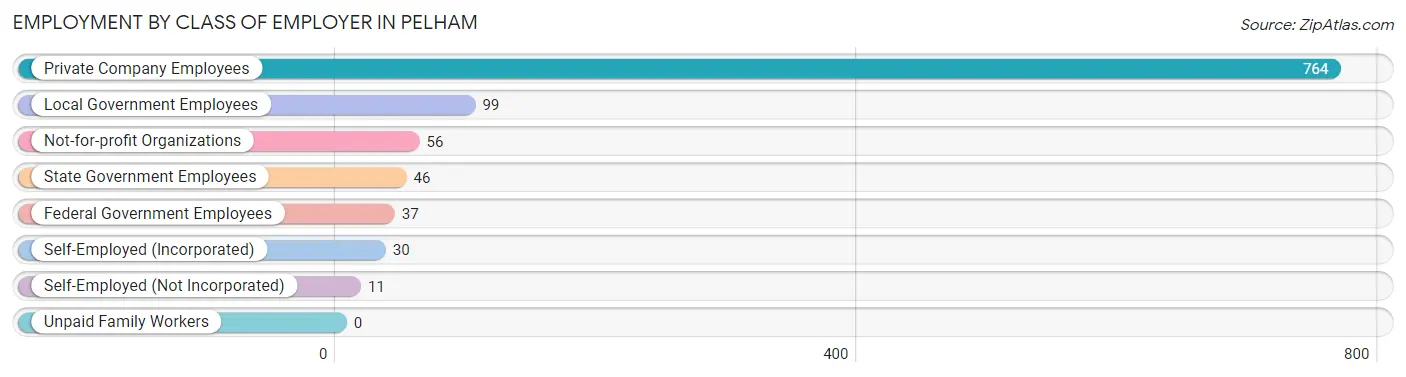
| Employer Class | # Employees | % Employees |
| Private Company Employees | 764 | 73.3% |
| Self-Employed (Incorporated) | 30 | 2.9% |
| Self-Employed (Not Incorporated) | 11 | 1.1% |
| Not-for-profit Organizations | 56 | 5.4% |
| Local Government Employees | 99 | 9.5% |
| State Government Employees | 46 | 4.4% |
| Federal Government Employees | 37 | 3.5% |
| Unpaid Family Workers | 0 | 0.0% |
| Total | 1,043 | 100.0% |
Employment Status by Age in Pelham
According to the labor force statistics for Pelham, out of the total population over 16 years of age (2,629), 49.0% or 1,288 individuals are in the labor force, with 13.1% or 169 of them unemployed. The age group with the highest labor force participation rate is 25 to 29 years, with 90.1% or 282 individuals in the labor force. Within the labor force, the 55 to 59 years age range has the highest percentage of unemployed individuals, with 51.9% or 27 of them being unemployed.
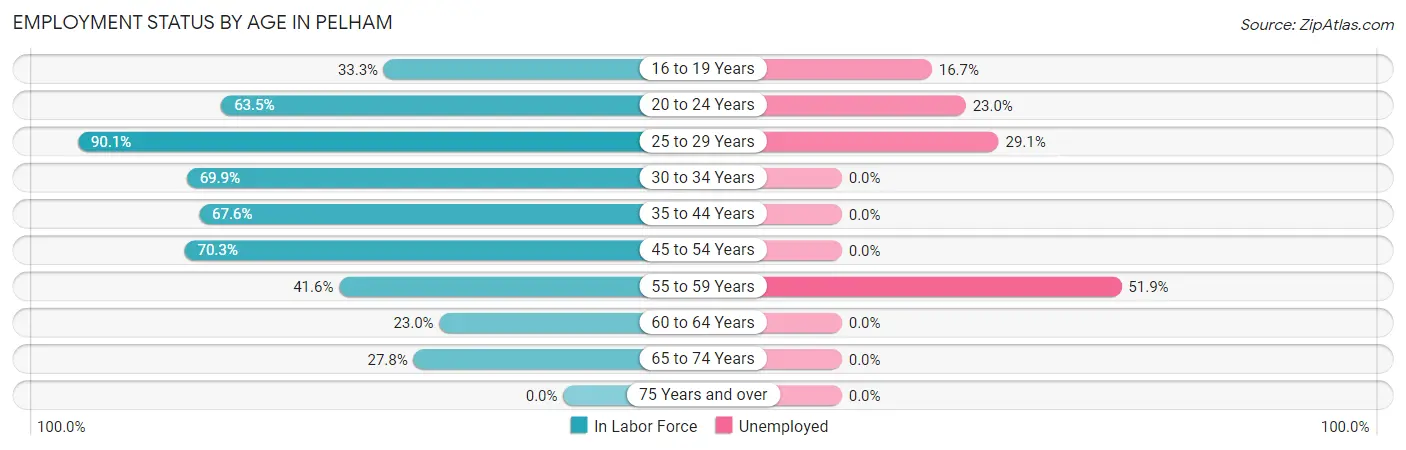
| Age Bracket | In Labor Force | Unemployed |
| 16 to 19 Years | 48 (33.3%) | 8 (16.7%) |
| 20 to 24 Years | 226 (63.5%) | 52 (23.0%) |
| 25 to 29 Years | 282 (90.1%) | 82 (29.1%) |
| 30 to 34 Years | 137 (69.9%) | 0 (0.0%) |
| 35 to 44 Years | 186 (67.6%) | 0 (0.0%) |
| 45 to 54 Years | 182 (70.3%) | 0 (0.0%) |
| 55 to 59 Years | 52 (41.6%) | 27 (51.9%) |
| 60 to 64 Years | 108 (23.0%) | 0 (0.0%) |
| 65 to 74 Years | 67 (27.8%) | 0 (0.0%) |
| 75 Years and over | 0 (0.0%) | 0 (0.0%) |
| Total | 1,288 (49.0%) | 169 (13.1%) |
Employment Status by Educational Attainment in Pelham
According to labor force statistics for Pelham, 57.8% of individuals (947) out of the total population between 25 and 64 years of age (1,638) are in the labor force, with 11.5% or 109 of them being unemployed. The group with the highest labor force participation rate are those with the educational attainment of bachelor's degree or higher, with 81.7% or 103 individuals in the labor force. Within the labor force, individuals with college / associate degree education have the highest percentage of unemployment, with 17.6% or 82 of them being unemployed.
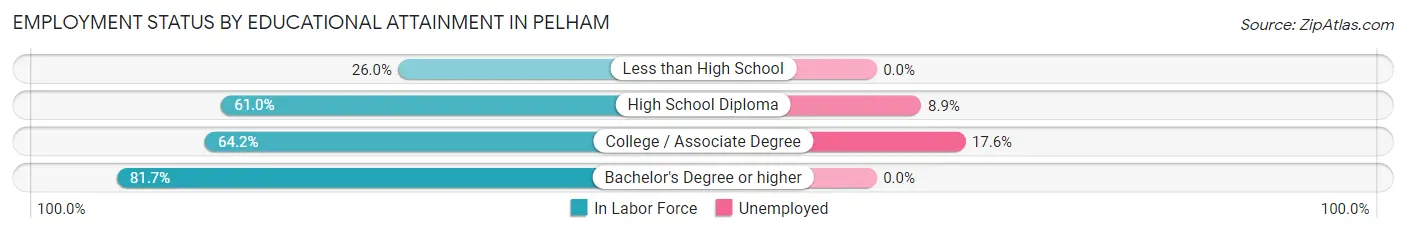
| Educational Attainment | In Labor Force | Unemployed |
| Less than High School | 75 (26.0%) | 0 (0.0%) |
| High School Diploma | 303 (61.0%) | 44 (8.9%) |
| College / Associate Degree | 466 (64.2%) | 128 (17.6%) |
| Bachelor's Degree or higher | 103 (81.7%) | 0 (0.0%) |
| Total | 947 (57.8%) | 188 (11.5%) |
Employment Occupations by Sex in Pelham
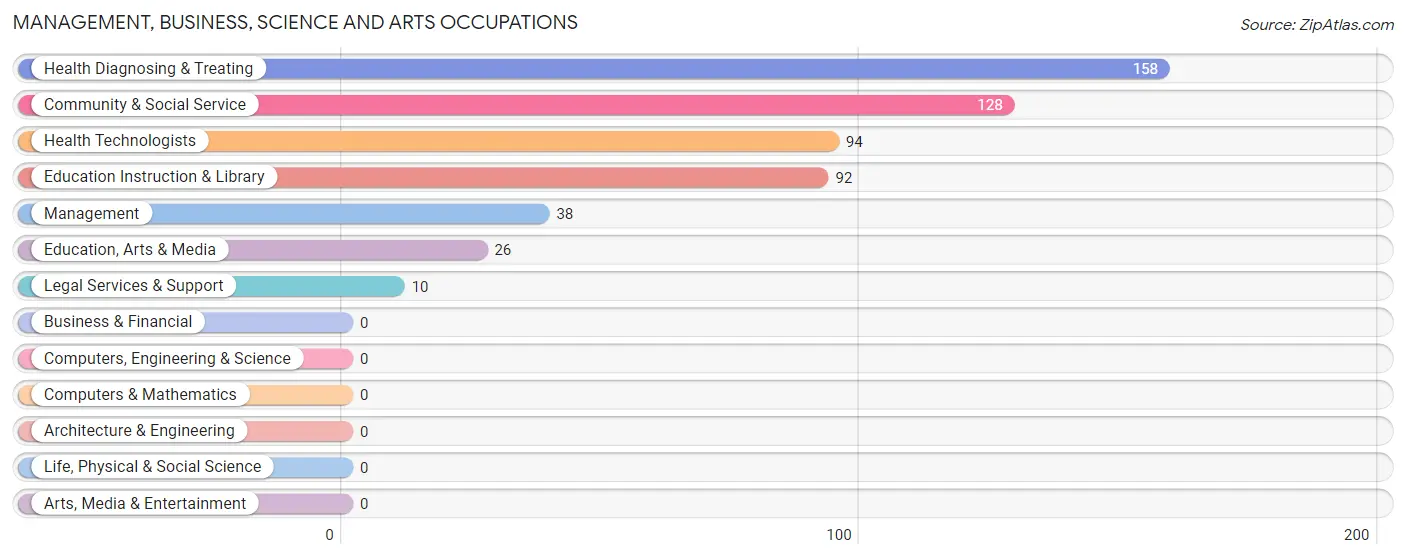
Management, Business, Science and Arts Occupations
The most common Management, Business, Science and Arts occupations in Pelham are Health Diagnosing & Treating (158 | 14.1%), Community & Social Service (128 | 11.4%), Health Technologists (94 | 8.4%), Education Instruction & Library (92 | 8.2%), and Management (38 | 3.4%).
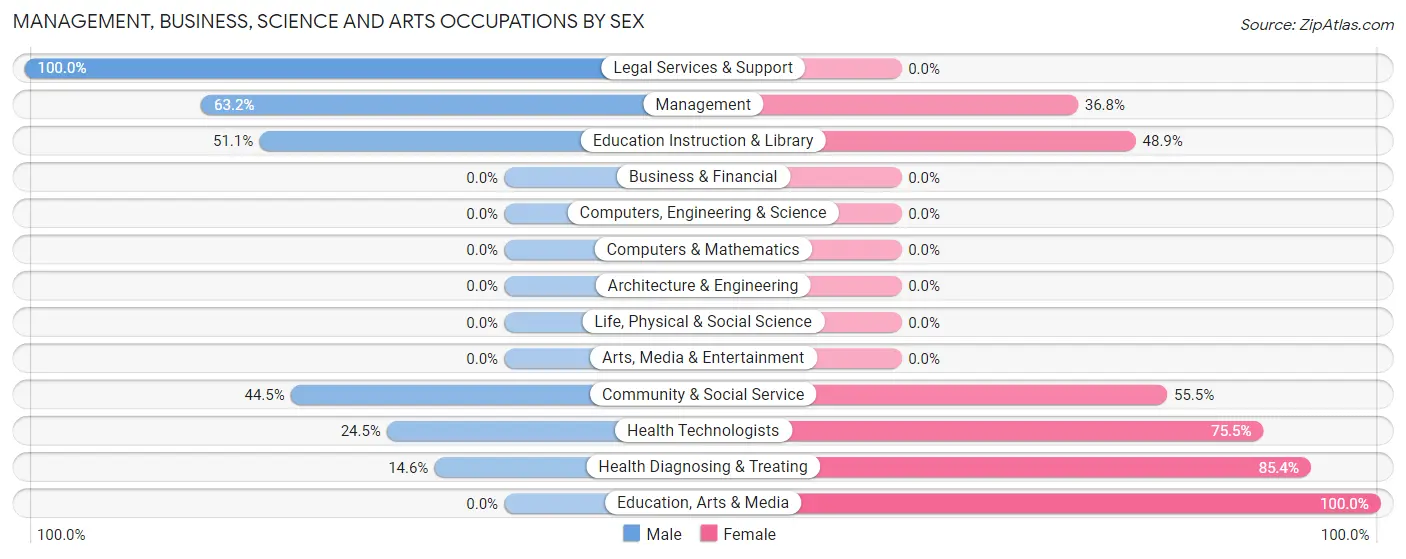
Management, Business, Science and Arts Occupations by Sex
Within the Management, Business, Science and Arts occupations in Pelham, the most male-oriented occupations are Legal Services & Support (100.0%), Management (63.2%), and Education Instruction & Library (51.1%), while the most female-oriented occupations are Education, Arts & Media (100.0%), Health Diagnosing & Treating (85.4%), and Health Technologists (75.5%).
| Occupation | Male | Female |
| Management | 24 (63.2%) | 14 (36.8%) |
| Business & Financial | 0 (0.0%) | 0 (0.0%) |
| Computers, Engineering & Science | 0 (0.0%) | 0 (0.0%) |
| Computers & Mathematics | 0 (0.0%) | 0 (0.0%) |
| Architecture & Engineering | 0 (0.0%) | 0 (0.0%) |
| Life, Physical & Social Science | 0 (0.0%) | 0 (0.0%) |
| Community & Social Service | 57 (44.5%) | 71 (55.5%) |
| Education, Arts & Media | 0 (0.0%) | 26 (100.0%) |
| Legal Services & Support | 10 (100.0%) | 0 (0.0%) |
| Education Instruction & Library | 47 (51.1%) | 45 (48.9%) |
| Arts, Media & Entertainment | 0 (0.0%) | 0 (0.0%) |
| Health Diagnosing & Treating | 23 (14.6%) | 135 (85.4%) |
| Health Technologists | 23 (24.5%) | 71 (75.5%) |
| Total (Category) | 104 (32.1%) | 220 (67.9%) |
| Total (Overall) | 515 (46.0%) | 604 (54.0%) |
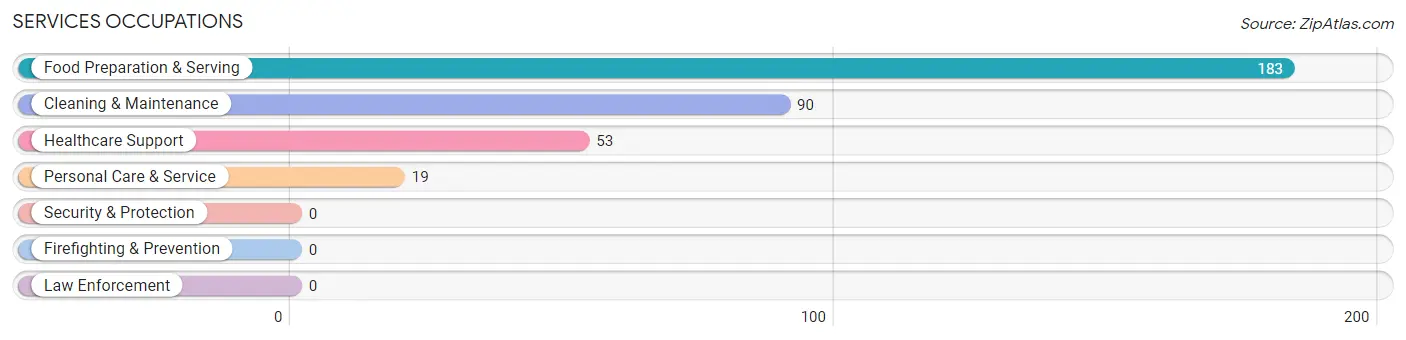
Services Occupations
The most common Services occupations in Pelham are Food Preparation & Serving (183 | 16.4%), Cleaning & Maintenance (90 | 8.0%), Healthcare Support (53 | 4.7%), and Personal Care & Service (19 | 1.7%).
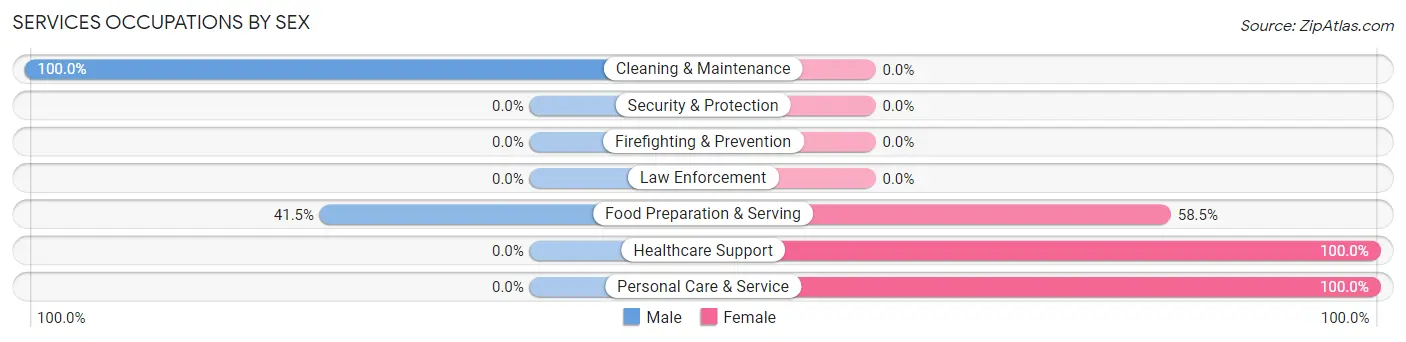
Services Occupations by Sex
Within the Services occupations in Pelham, the most male-oriented occupations are Cleaning & Maintenance (100.0%), and Food Preparation & Serving (41.5%), while the most female-oriented occupations are Healthcare Support (100.0%), Personal Care & Service (100.0%), and Food Preparation & Serving (58.5%).
| Occupation | Male | Female |
| Healthcare Support | 0 (0.0%) | 53 (100.0%) |
| Security & Protection | 0 (0.0%) | 0 (0.0%) |
| Firefighting & Prevention | 0 (0.0%) | 0 (0.0%) |
| Law Enforcement | 0 (0.0%) | 0 (0.0%) |
| Food Preparation & Serving | 76 (41.5%) | 107 (58.5%) |
| Cleaning & Maintenance | 90 (100.0%) | 0 (0.0%) |
| Personal Care & Service | 0 (0.0%) | 19 (100.0%) |
| Total (Category) | 166 (48.1%) | 179 (51.9%) |
| Total (Overall) | 515 (46.0%) | 604 (54.0%) |
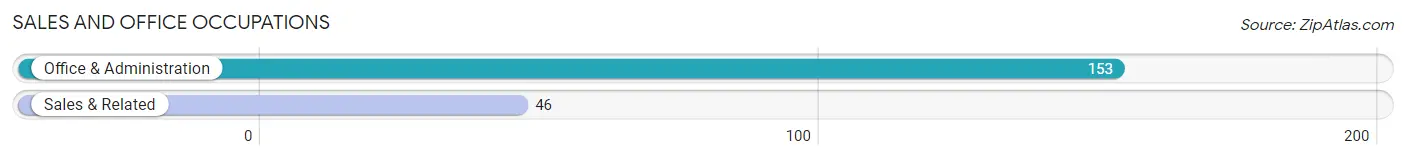
Sales and Office Occupations
The most common Sales and Office occupations in Pelham are Office & Administration (153 | 13.7%), and Sales & Related (46 | 4.1%).
Sales and Office Occupations by Sex
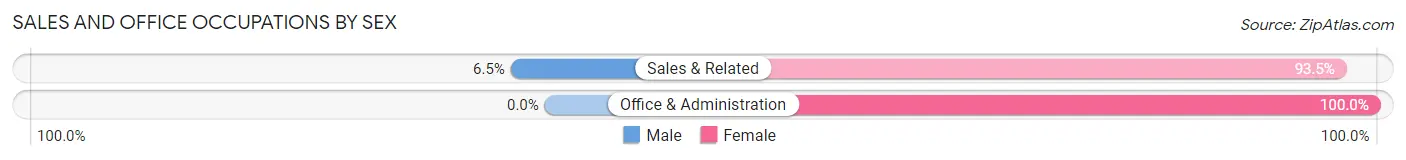
| Occupation | Male | Female |
| Sales & Related | 3 (6.5%) | 43 (93.5%) |
| Office & Administration | 0 (0.0%) | 153 (100.0%) |
| Total (Category) | 3 (1.5%) | 196 (98.5%) |
| Total (Overall) | 515 (46.0%) | 604 (54.0%) |
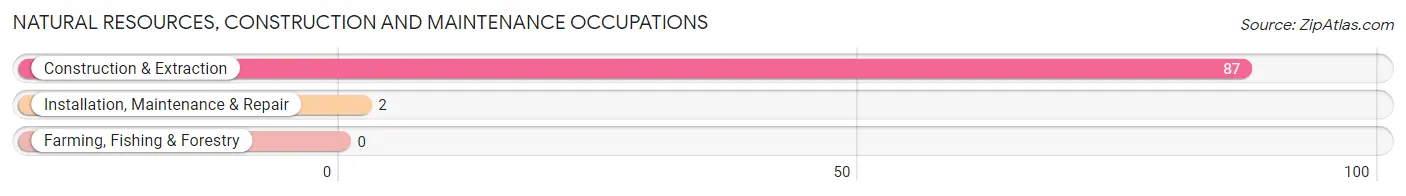
Natural Resources, Construction and Maintenance Occupations
The most common Natural Resources, Construction and Maintenance occupations in Pelham are Construction & Extraction (87 | 7.8%), and Installation, Maintenance & Repair (2 | 0.2%).
Natural Resources, Construction and Maintenance Occupations by Sex
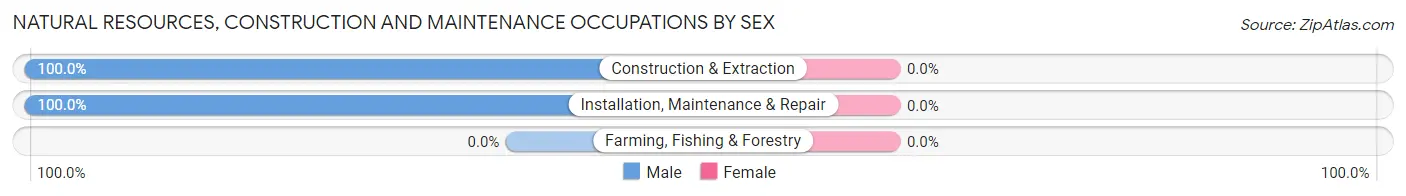
| Occupation | Male | Female |
| Farming, Fishing & Forestry | 0 (0.0%) | 0 (0.0%) |
| Construction & Extraction | 87 (100.0%) | 0 (0.0%) |
| Installation, Maintenance & Repair | 2 (100.0%) | 0 (0.0%) |
| Total (Category) | 89 (100.0%) | 0 (0.0%) |
| Total (Overall) | 515 (46.0%) | 604 (54.0%) |
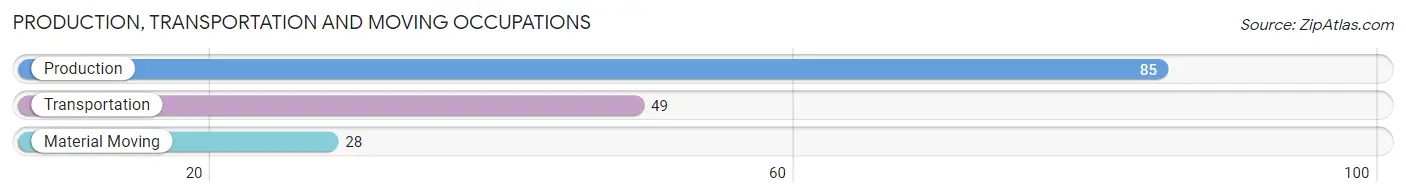
Production, Transportation and Moving Occupations
The most common Production, Transportation and Moving occupations in Pelham are Production (85 | 7.6%), Transportation (49 | 4.4%), and Material Moving (28 | 2.5%).
Production, Transportation and Moving Occupations by Sex
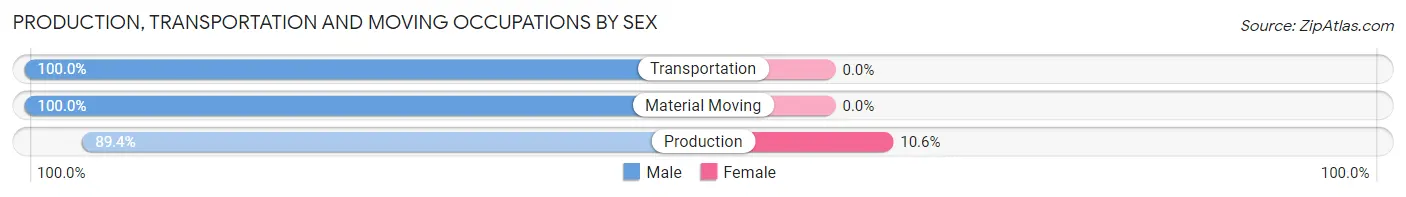
| Occupation | Male | Female |
| Production | 76 (89.4%) | 9 (10.6%) |
| Transportation | 49 (100.0%) | 0 (0.0%) |
| Material Moving | 28 (100.0%) | 0 (0.0%) |
| Total (Category) | 153 (94.4%) | 9 (5.6%) |
| Total (Overall) | 515 (46.0%) | 604 (54.0%) |
Employment Industries by Sex in Pelham
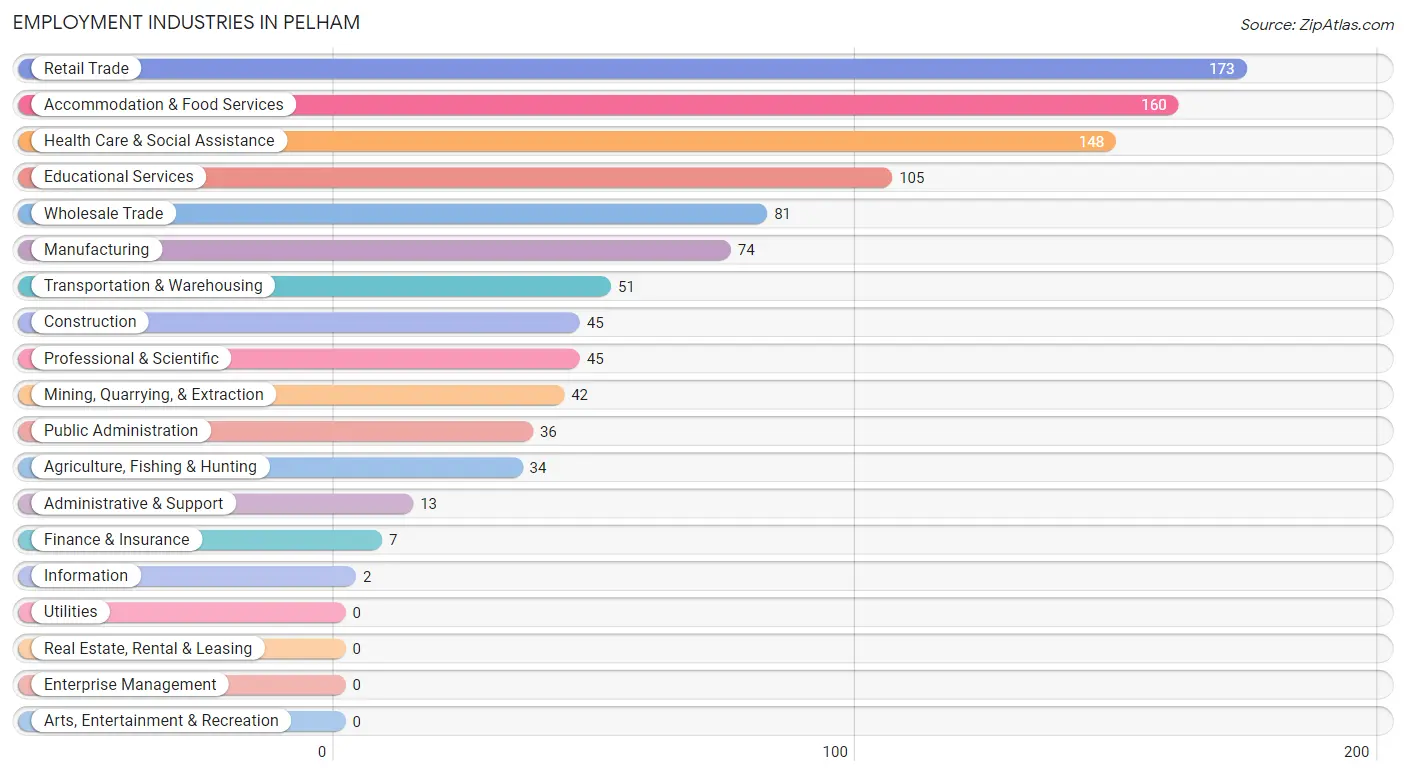
Employment Industries in Pelham
The major employment industries in Pelham include Retail Trade (173 | 15.5%), Accommodation & Food Services (160 | 14.3%), Health Care & Social Assistance (148 | 13.2%), Educational Services (105 | 9.4%), and Wholesale Trade (81 | 7.2%).
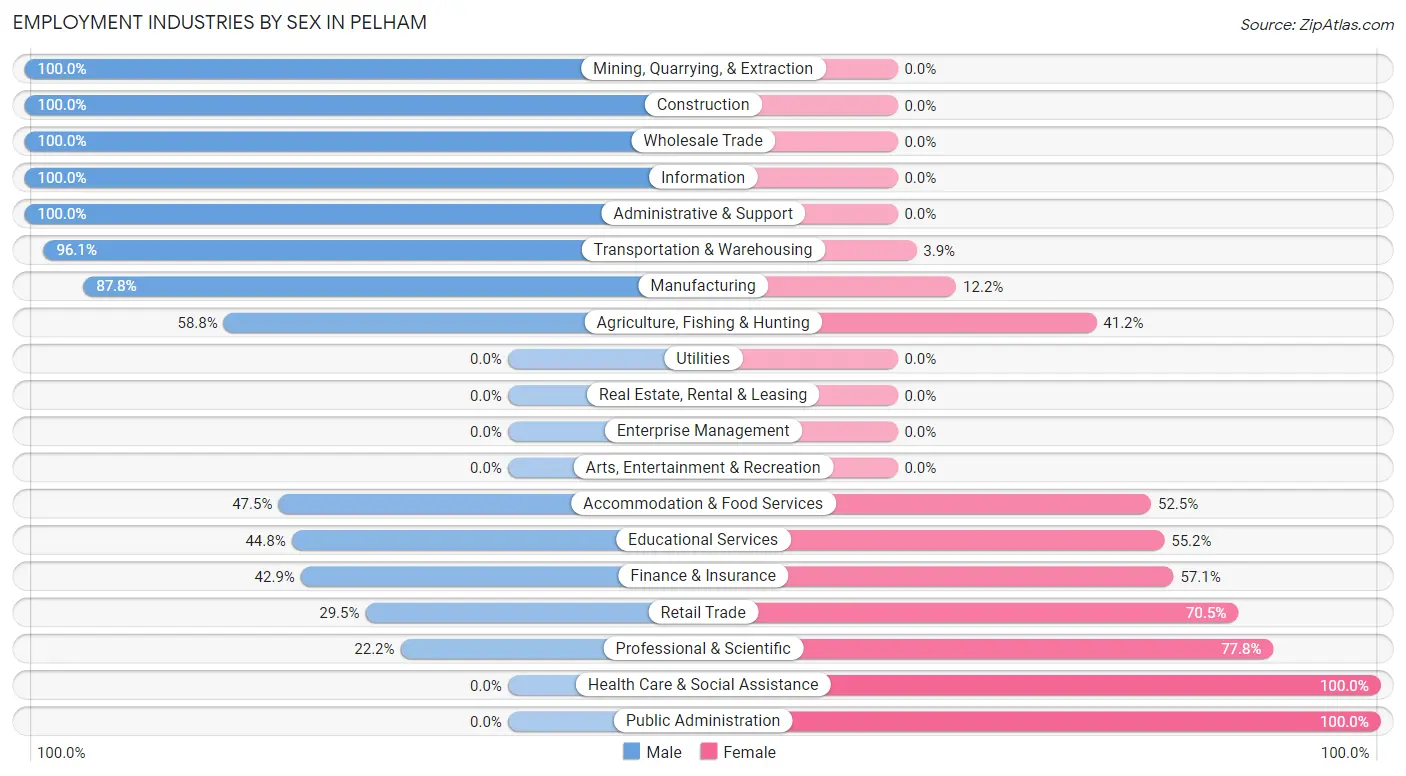
Employment Industries by Sex in Pelham
The Pelham industries that see more men than women are Mining, Quarrying, & Extraction (100.0%), Construction (100.0%), and Wholesale Trade (100.0%), whereas the industries that tend to have a higher number of women are Health Care & Social Assistance (100.0%), Public Administration (100.0%), and Professional & Scientific (77.8%).
| Industry | Male | Female |
| Agriculture, Fishing & Hunting | 20 (58.8%) | 14 (41.2%) |
| Mining, Quarrying, & Extraction | 42 (100.0%) | 0 (0.0%) |
| Construction | 45 (100.0%) | 0 (0.0%) |
| Manufacturing | 65 (87.8%) | 9 (12.2%) |
| Wholesale Trade | 81 (100.0%) | 0 (0.0%) |
| Retail Trade | 51 (29.5%) | 122 (70.5%) |
| Transportation & Warehousing | 49 (96.1%) | 2 (3.9%) |
| Utilities | 0 (0.0%) | 0 (0.0%) |
| Information | 2 (100.0%) | 0 (0.0%) |
| Finance & Insurance | 3 (42.9%) | 4 (57.1%) |
| Real Estate, Rental & Leasing | 0 (0.0%) | 0 (0.0%) |
| Professional & Scientific | 10 (22.2%) | 35 (77.8%) |
| Enterprise Management | 0 (0.0%) | 0 (0.0%) |
| Administrative & Support | 13 (100.0%) | 0 (0.0%) |
| Educational Services | 47 (44.8%) | 58 (55.2%) |
| Health Care & Social Assistance | 0 (0.0%) | 148 (100.0%) |
| Arts, Entertainment & Recreation | 0 (0.0%) | 0 (0.0%) |
| Accommodation & Food Services | 76 (47.5%) | 84 (52.5%) |
| Public Administration | 0 (0.0%) | 36 (100.0%) |
| Total | 515 (46.0%) | 604 (54.0%) |
Education in Pelham
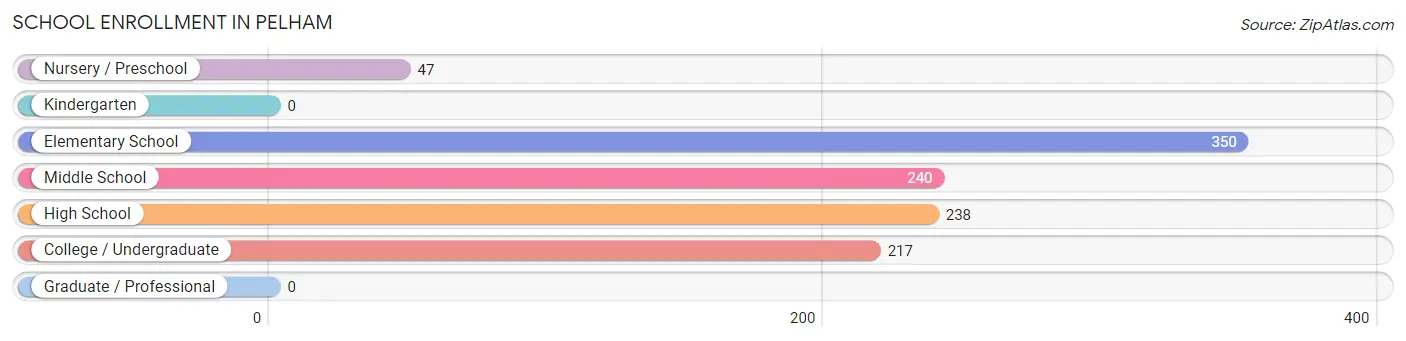
School Enrollment in Pelham
The most common levels of schooling among the 1,092 students in Pelham are elementary school (350 | 32.1%), middle school (240 | 22.0%), and high school (238 | 21.8%).
| School Level | # Students | % Students |
| Nursery / Preschool | 47 | 4.3% |
| Kindergarten | 0 | 0.0% |
| Elementary School | 350 | 32.1% |
| Middle School | 240 | 22.0% |
| High School | 238 | 21.8% |
| College / Undergraduate | 217 | 19.9% |
| Graduate / Professional | 0 | 0.0% |
| Total | 1,092 | 100.0% |
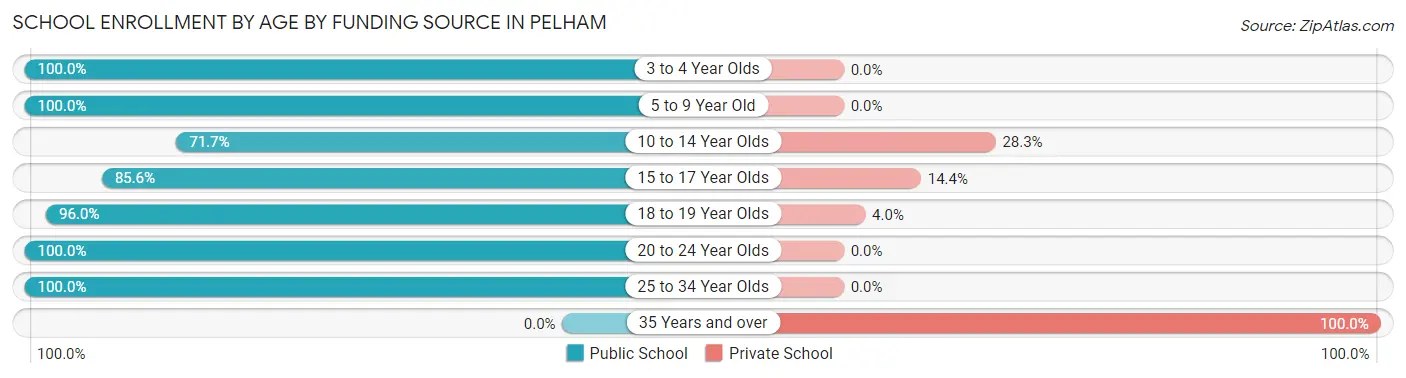
School Enrollment by Age by Funding Source in Pelham
Out of a total of 1,092 students who are enrolled in schools in Pelham, 166 (15.2%) attend a private institution, while the remaining 926 (84.8%) are enrolled in public schools. The age group of 35 years and over has the highest likelihood of being enrolled in private schools, with 47 (100.0% in the age bracket) enrolled. Conversely, the age group of 3 to 4 year olds has the lowest likelihood of being enrolled in a private school, with 47 (100.0% in the age bracket) attending a public institution.
| Age Bracket | Public School | Private School |
| 3 to 4 Year Olds | 47 (100.0%) | 0 (0.0%) |
| 5 to 9 Year Old | 282 (100.0%) | 0 (0.0%) |
| 10 to 14 Year Olds | 236 (71.7%) | 93 (28.3%) |
| 15 to 17 Year Olds | 143 (85.6%) | 24 (14.4%) |
| 18 to 19 Year Olds | 48 (96.0%) | 2 (4.0%) |
| 20 to 24 Year Olds | 127 (100.0%) | 0 (0.0%) |
| 25 to 34 Year Olds | 43 (100.0%) | 0 (0.0%) |
| 35 Years and over | 0 (0.0%) | 47 (100.0%) |
| Total | 926 (84.8%) | 166 (15.2%) |
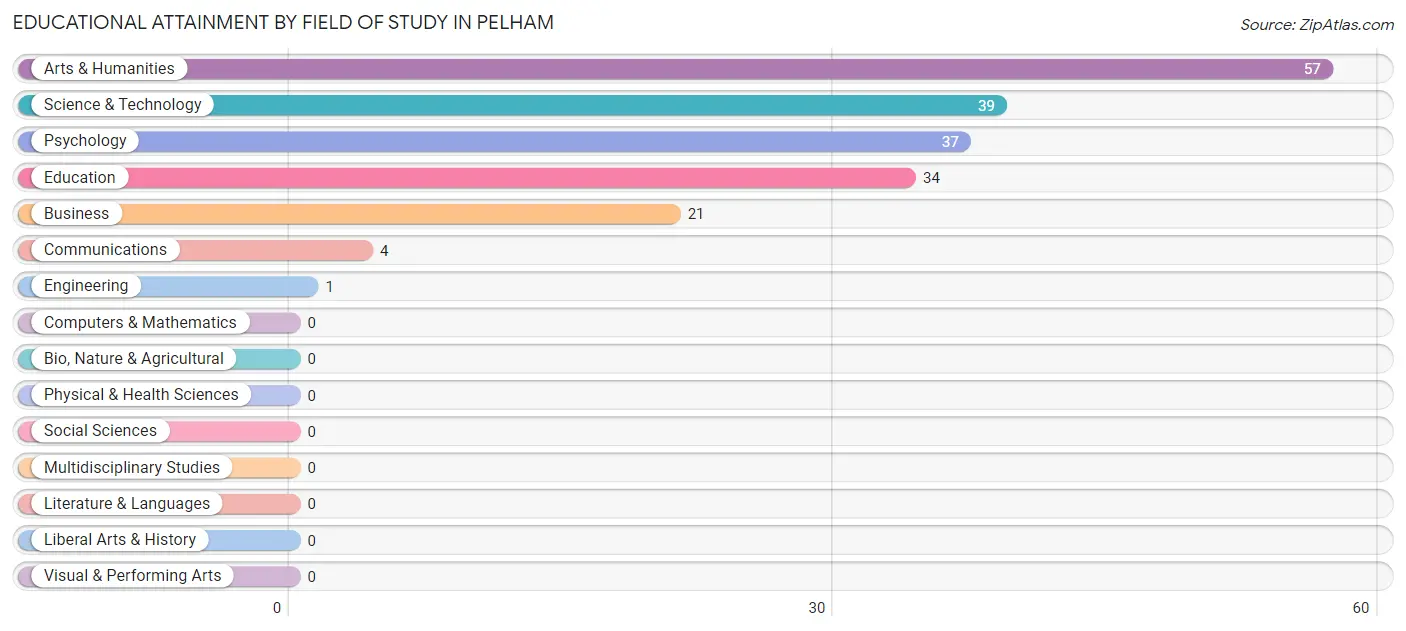
Educational Attainment by Field of Study in Pelham
Arts & humanities (57 | 29.5%), science & technology (39 | 20.2%), psychology (37 | 19.2%), education (34 | 17.6%), and business (21 | 10.9%) are the most common fields of study among 193 individuals in Pelham who have obtained a bachelor's degree or higher.
| Field of Study | # Graduates | % Graduates |
| Computers & Mathematics | 0 | 0.0% |
| Bio, Nature & Agricultural | 0 | 0.0% |
| Physical & Health Sciences | 0 | 0.0% |
| Psychology | 37 | 19.2% |
| Social Sciences | 0 | 0.0% |
| Engineering | 1 | 0.5% |
| Multidisciplinary Studies | 0 | 0.0% |
| Science & Technology | 39 | 20.2% |
| Business | 21 | 10.9% |
| Education | 34 | 17.6% |
| Literature & Languages | 0 | 0.0% |
| Liberal Arts & History | 0 | 0.0% |
| Visual & Performing Arts | 0 | 0.0% |
| Communications | 4 | 2.1% |
| Arts & Humanities | 57 | 29.5% |
| Total | 193 | 100.0% |
Transportation & Commute in Pelham
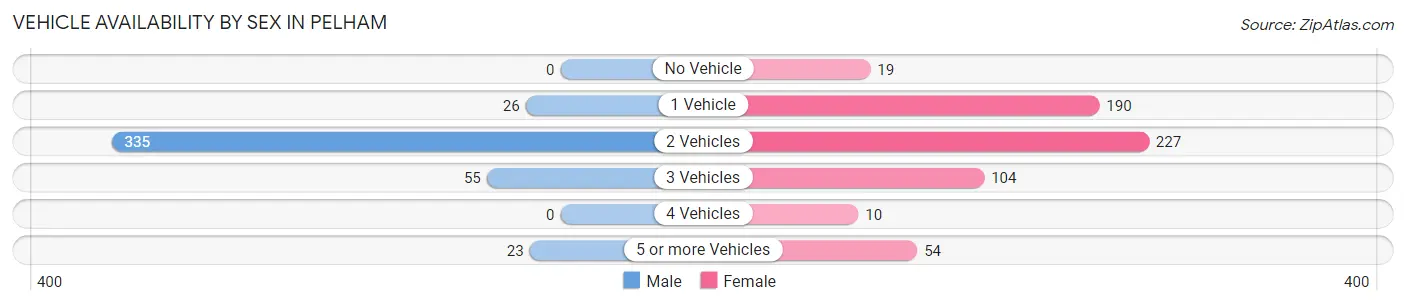
Vehicle Availability by Sex in Pelham
The most prevalent vehicle ownership categories in Pelham are males with 2 vehicles (335, accounting for 76.3%) and females with 2 vehicles (227, making up 55.5%).
| Vehicles Available | Male | Female |
| No Vehicle | 0 (0.0%) | 19 (3.2%) |
| 1 Vehicle | 26 (5.9%) | 190 (31.5%) |
| 2 Vehicles | 335 (76.3%) | 227 (37.6%) |
| 3 Vehicles | 55 (12.5%) | 104 (17.2%) |
| 4 Vehicles | 0 (0.0%) | 10 (1.7%) |
| 5 or more Vehicles | 23 (5.2%) | 54 (8.9%) |
| Total | 439 (100.0%) | 604 (100.0%) |
Commute Time in Pelham
The most frequently occuring commute durations in Pelham are 10 to 14 minutes (304 commuters, 29.1%), 5 to 9 minutes (184 commuters, 17.6%), and 15 to 19 minutes (151 commuters, 14.5%).
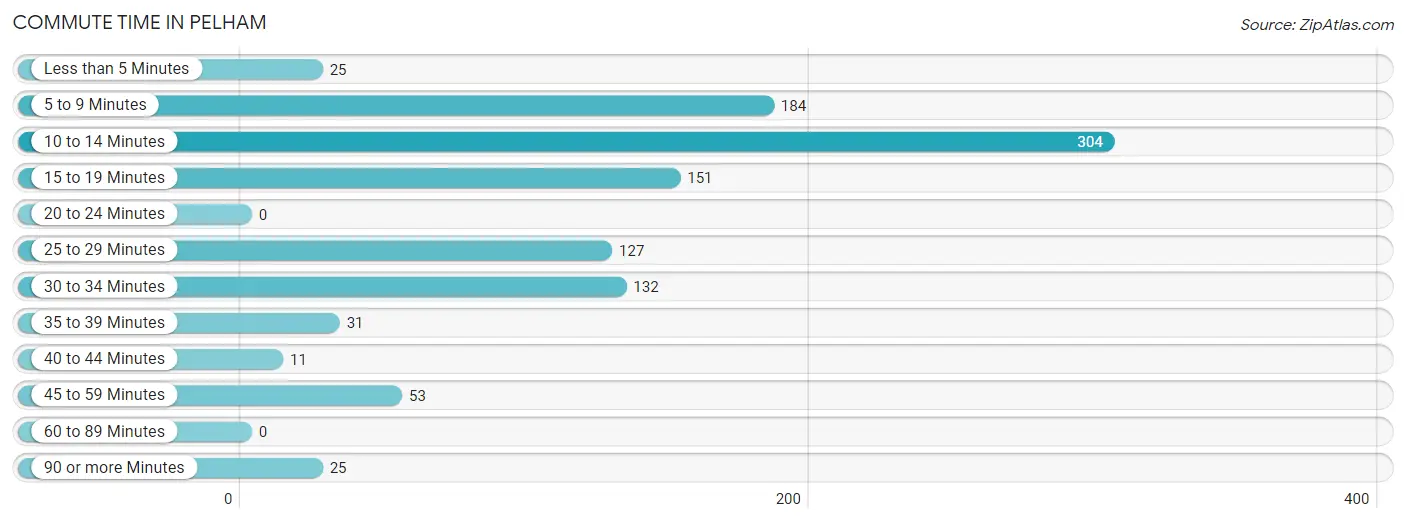
| Commute Time | # Commuters | % Commuters |
| Less than 5 Minutes | 25 | 2.4% |
| 5 to 9 Minutes | 184 | 17.6% |
| 10 to 14 Minutes | 304 | 29.1% |
| 15 to 19 Minutes | 151 | 14.5% |
| 20 to 24 Minutes | 0 | 0.0% |
| 25 to 29 Minutes | 127 | 12.2% |
| 30 to 34 Minutes | 132 | 12.7% |
| 35 to 39 Minutes | 31 | 3.0% |
| 40 to 44 Minutes | 11 | 1.1% |
| 45 to 59 Minutes | 53 | 5.1% |
| 60 to 89 Minutes | 0 | 0.0% |
| 90 or more Minutes | 25 | 2.4% |
Commute Time by Sex in Pelham
The most common commute times in Pelham are 25 to 29 minutes (127 commuters, 28.9%) for males and 10 to 14 minutes (196 commuters, 32.5%) for females.
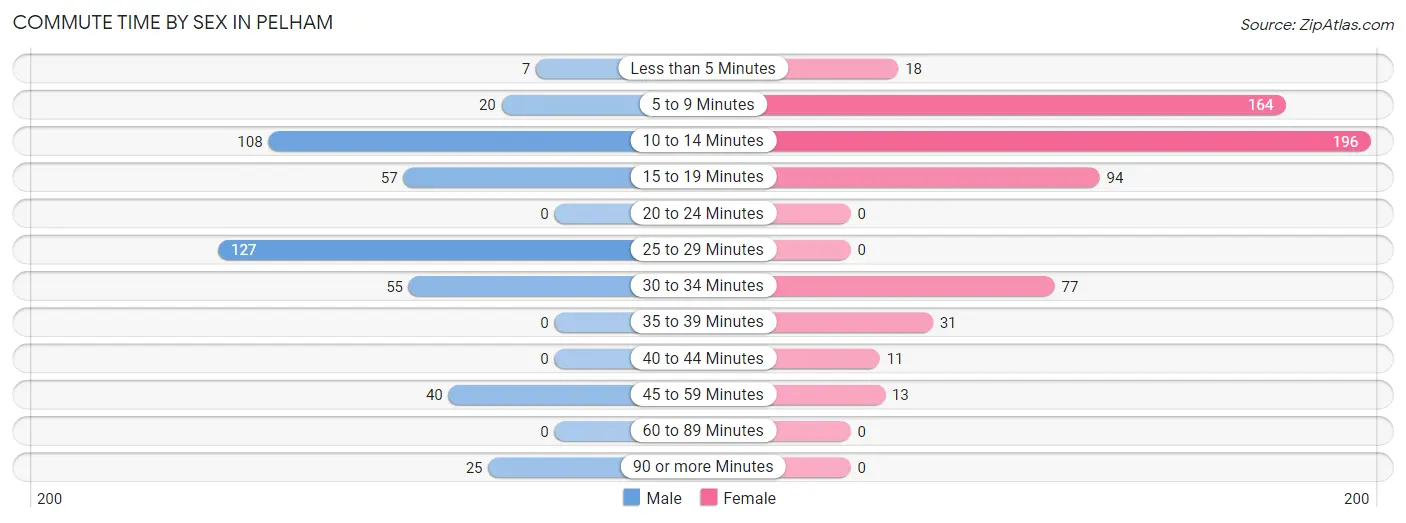
| Commute Time | Male | Female |
| Less than 5 Minutes | 7 (1.6%) | 18 (3.0%) |
| 5 to 9 Minutes | 20 (4.6%) | 164 (27.2%) |
| 10 to 14 Minutes | 108 (24.6%) | 196 (32.5%) |
| 15 to 19 Minutes | 57 (13.0%) | 94 (15.6%) |
| 20 to 24 Minutes | 0 (0.0%) | 0 (0.0%) |
| 25 to 29 Minutes | 127 (28.9%) | 0 (0.0%) |
| 30 to 34 Minutes | 55 (12.5%) | 77 (12.8%) |
| 35 to 39 Minutes | 0 (0.0%) | 31 (5.1%) |
| 40 to 44 Minutes | 0 (0.0%) | 11 (1.8%) |
| 45 to 59 Minutes | 40 (9.1%) | 13 (2.1%) |
| 60 to 89 Minutes | 0 (0.0%) | 0 (0.0%) |
| 90 or more Minutes | 25 (5.7%) | 0 (0.0%) |
Time of Departure to Work by Sex in Pelham
The most frequent times of departure to work in Pelham are 6:30 AM to 6:59 AM (141, 32.1%) for males and 7:00 AM to 7:29 AM (140, 23.2%) for females.
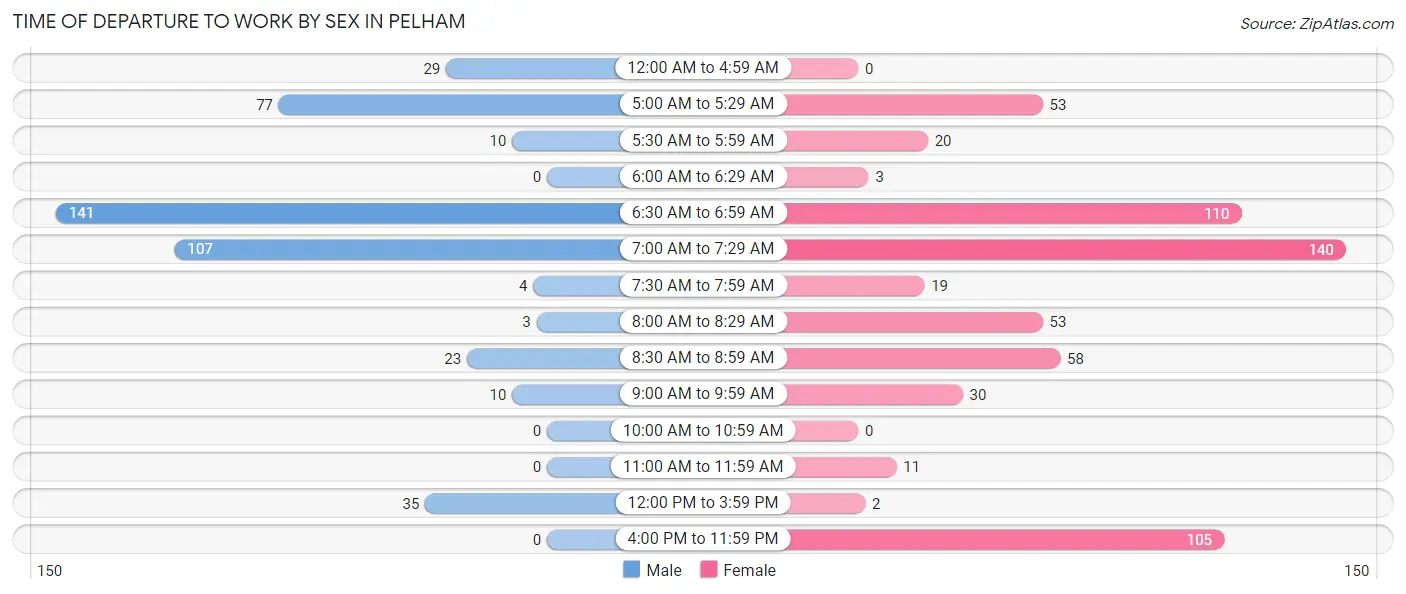
| Time of Departure | Male | Female |
| 12:00 AM to 4:59 AM | 29 (6.6%) | 0 (0.0%) |
| 5:00 AM to 5:29 AM | 77 (17.5%) | 53 (8.8%) |
| 5:30 AM to 5:59 AM | 10 (2.3%) | 20 (3.3%) |
| 6:00 AM to 6:29 AM | 0 (0.0%) | 3 (0.5%) |
| 6:30 AM to 6:59 AM | 141 (32.1%) | 110 (18.2%) |
| 7:00 AM to 7:29 AM | 107 (24.4%) | 140 (23.2%) |
| 7:30 AM to 7:59 AM | 4 (0.9%) | 19 (3.2%) |
| 8:00 AM to 8:29 AM | 3 (0.7%) | 53 (8.8%) |
| 8:30 AM to 8:59 AM | 23 (5.2%) | 58 (9.6%) |
| 9:00 AM to 9:59 AM | 10 (2.3%) | 30 (5.0%) |
| 10:00 AM to 10:59 AM | 0 (0.0%) | 0 (0.0%) |
| 11:00 AM to 11:59 AM | 0 (0.0%) | 11 (1.8%) |
| 12:00 PM to 3:59 PM | 35 (8.0%) | 2 (0.3%) |
| 4:00 PM to 11:59 PM | 0 (0.0%) | 105 (17.4%) |
| Total | 439 (100.0%) | 604 (100.0%) |
Housing Occupancy in Pelham
Occupancy by Ownership in Pelham
Of the total 1,357 dwellings in Pelham, owner-occupied units account for 657 (48.4%), while renter-occupied units make up 700 (51.6%).
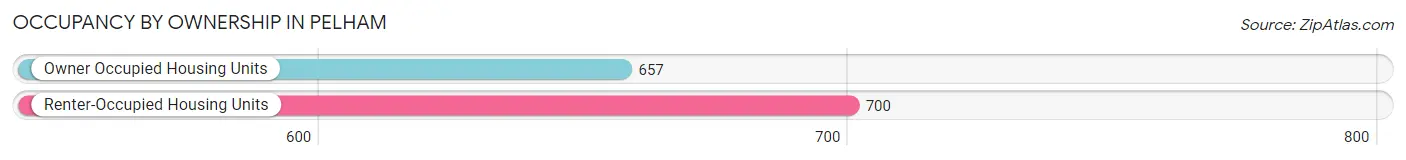
| Occupancy | # Housing Units | % Housing Units |
| Owner Occupied Housing Units | 657 | 48.4% |
| Renter-Occupied Housing Units | 700 | 51.6% |
| Total Occupied Housing Units | 1,357 | 100.0% |
Occupancy by Household Size in Pelham
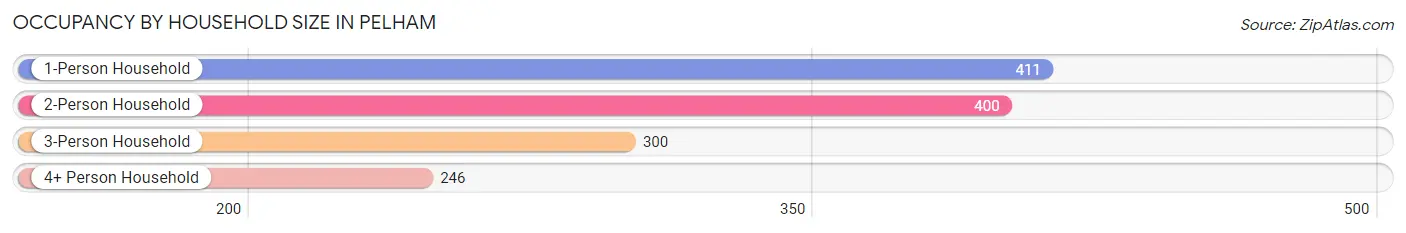
| Household Size | # Housing Units | % Housing Units |
| 1-Person Household | 411 | 30.3% |
| 2-Person Household | 400 | 29.5% |
| 3-Person Household | 300 | 22.1% |
| 4+ Person Household | 246 | 18.1% |
| Total Housing Units | 1,357 | 100.0% |
Occupancy by Ownership by Household Size in Pelham
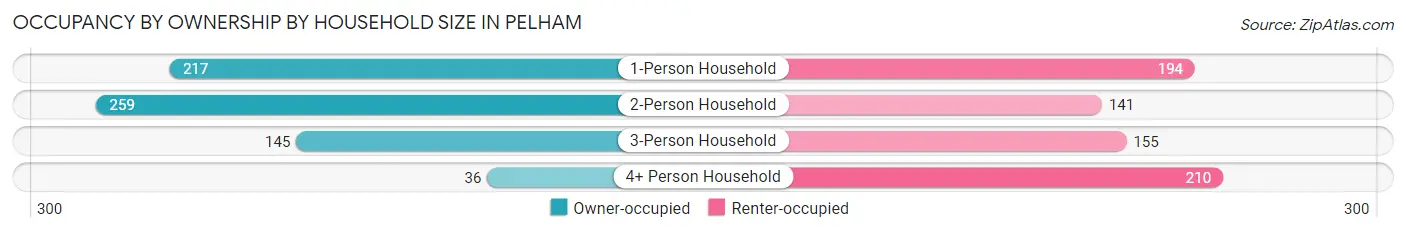
| Household Size | Owner-occupied | Renter-occupied |
| 1-Person Household | 217 (52.8%) | 194 (47.2%) |
| 2-Person Household | 259 (64.7%) | 141 (35.2%) |
| 3-Person Household | 145 (48.3%) | 155 (51.7%) |
| 4+ Person Household | 36 (14.6%) | 210 (85.4%) |
| Total Housing Units | 657 (48.4%) | 700 (51.6%) |
Occupancy by Educational Attainment in Pelham
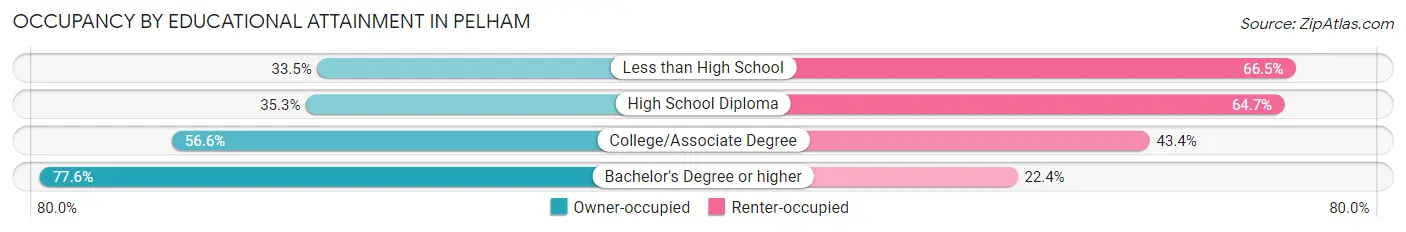
| Household Size | Owner-occupied | Renter-occupied |
| Less than High School | 58 (33.5%) | 115 (66.5%) |
| High School Diploma | 159 (35.3%) | 291 (64.7%) |
| College/Associate Degree | 350 (56.6%) | 268 (43.4%) |
| Bachelor's Degree or higher | 90 (77.6%) | 26 (22.4%) |
Occupancy by Age of Householder in Pelham
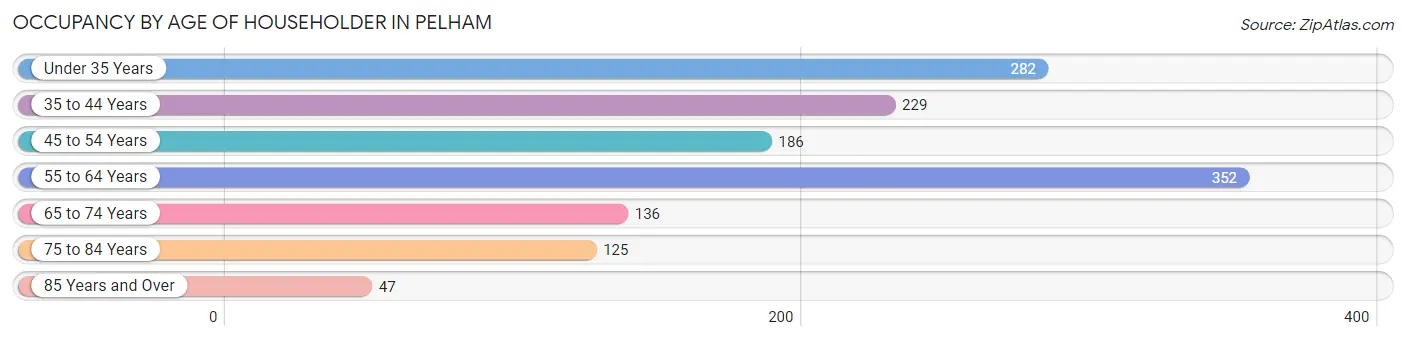
| Age Bracket | # Households | % Households |
| Under 35 Years | 282 | 20.8% |
| 35 to 44 Years | 229 | 16.9% |
| 45 to 54 Years | 186 | 13.7% |
| 55 to 64 Years | 352 | 25.9% |
| 65 to 74 Years | 136 | 10.0% |
| 75 to 84 Years | 125 | 9.2% |
| 85 Years and Over | 47 | 3.5% |
| Total | 1,357 | 100.0% |
Housing Finances in Pelham
Median Income by Occupancy in Pelham
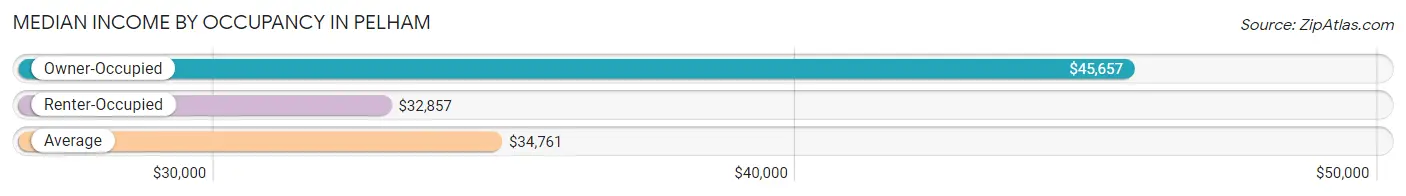
| Occupancy Type | # Households | Median Income |
| Owner-Occupied | 657 (48.4%) | $45,657 |
| Renter-Occupied | 700 (51.6%) | $32,857 |
| Average | 1,357 (100.0%) | $34,761 |
Occupancy by Householder Income Bracket in Pelham
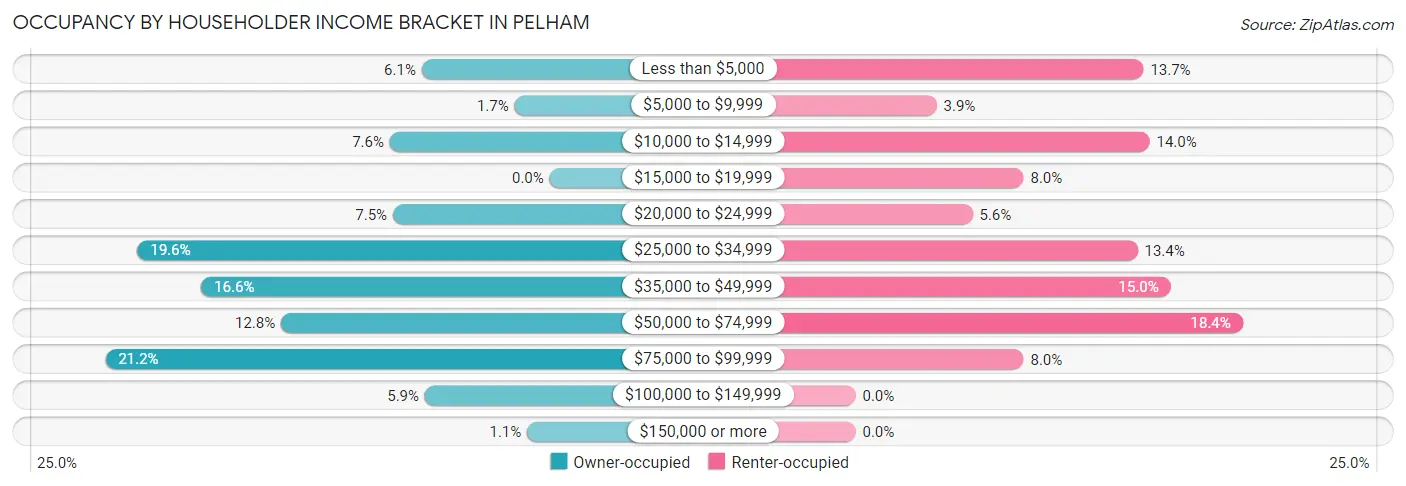
| Income Bracket | Owner-occupied | Renter-occupied |
| Less than $5,000 | 40 (6.1%) | 96 (13.7%) |
| $5,000 to $9,999 | 11 (1.7%) | 27 (3.9%) |
| $10,000 to $14,999 | 50 (7.6%) | 98 (14.0%) |
| $15,000 to $19,999 | 0 (0.0%) | 56 (8.0%) |
| $20,000 to $24,999 | 49 (7.5%) | 39 (5.6%) |
| $25,000 to $34,999 | 129 (19.6%) | 94 (13.4%) |
| $35,000 to $49,999 | 109 (16.6%) | 105 (15.0%) |
| $50,000 to $74,999 | 84 (12.8%) | 129 (18.4%) |
| $75,000 to $99,999 | 139 (21.2%) | 56 (8.0%) |
| $100,000 to $149,999 | 39 (5.9%) | 0 (0.0%) |
| $150,000 or more | 7 (1.1%) | 0 (0.0%) |
| Total | 657 (100.0%) | 700 (100.0%) |
Monthly Housing Cost Tiers in Pelham
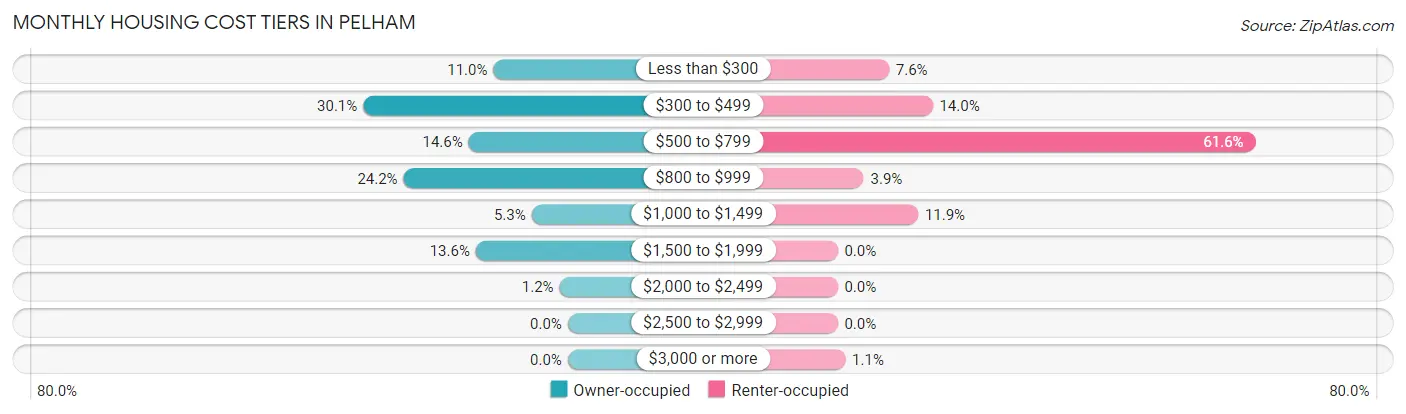
| Monthly Cost | Owner-occupied | Renter-occupied |
| Less than $300 | 72 (11.0%) | 53 (7.6%) |
| $300 to $499 | 198 (30.1%) | 98 (14.0%) |
| $500 to $799 | 96 (14.6%) | 431 (61.6%) |
| $800 to $999 | 159 (24.2%) | 27 (3.9%) |
| $1,000 to $1,499 | 35 (5.3%) | 83 (11.9%) |
| $1,500 to $1,999 | 89 (13.6%) | 0 (0.0%) |
| $2,000 to $2,499 | 8 (1.2%) | 0 (0.0%) |
| $2,500 to $2,999 | 0 (0.0%) | 0 (0.0%) |
| $3,000 or more | 0 (0.0%) | 8 (1.1%) |
| Total | 657 (100.0%) | 700 (100.0%) |
Physical Housing Characteristics in Pelham
Housing Structures in Pelham
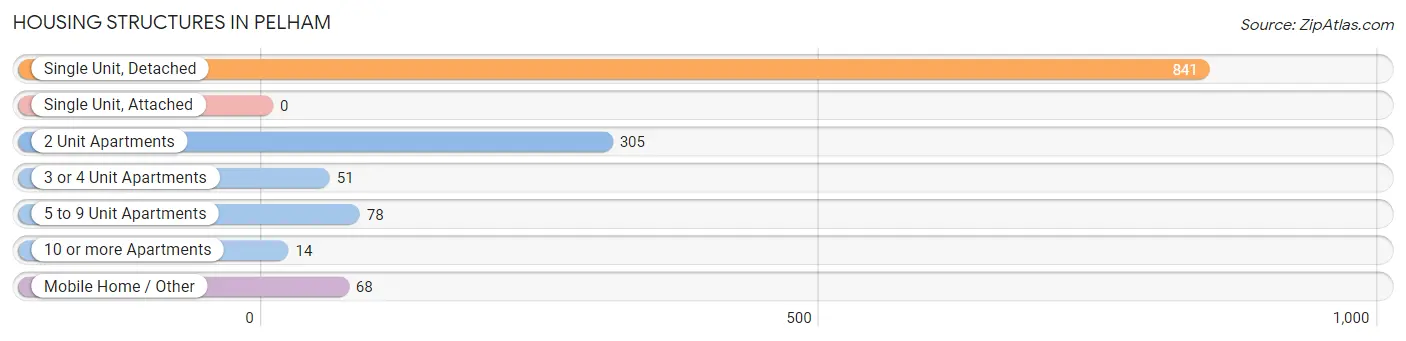
| Structure Type | # Housing Units | % Housing Units |
| Single Unit, Detached | 841 | 62.0% |
| Single Unit, Attached | 0 | 0.0% |
| 2 Unit Apartments | 305 | 22.5% |
| 3 or 4 Unit Apartments | 51 | 3.8% |
| 5 to 9 Unit Apartments | 78 | 5.8% |
| 10 or more Apartments | 14 | 1.0% |
| Mobile Home / Other | 68 | 5.0% |
| Total | 1,357 | 100.0% |
Housing Structures by Occupancy in Pelham
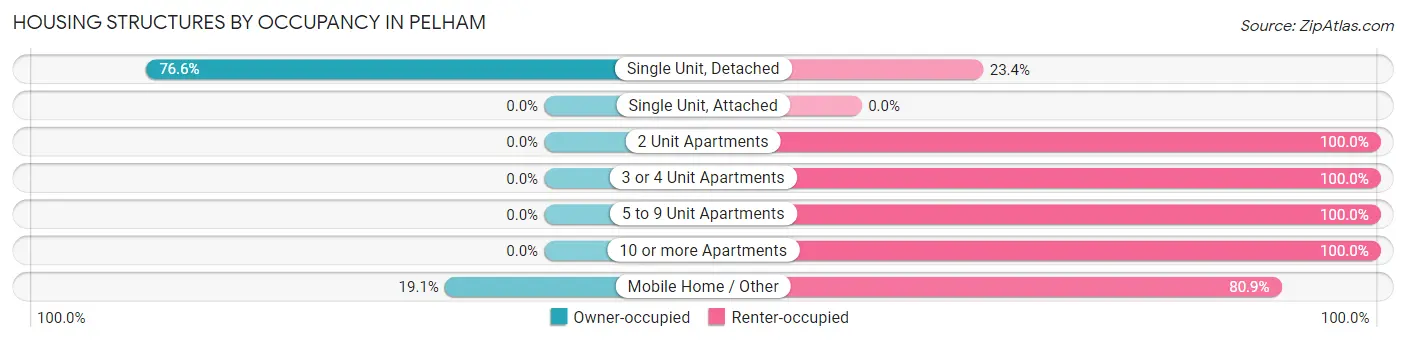
| Structure Type | Owner-occupied | Renter-occupied |
| Single Unit, Detached | 644 (76.6%) | 197 (23.4%) |
| Single Unit, Attached | 0 (0.0%) | 0 (0.0%) |
| 2 Unit Apartments | 0 (0.0%) | 305 (100.0%) |
| 3 or 4 Unit Apartments | 0 (0.0%) | 51 (100.0%) |
| 5 to 9 Unit Apartments | 0 (0.0%) | 78 (100.0%) |
| 10 or more Apartments | 0 (0.0%) | 14 (100.0%) |
| Mobile Home / Other | 13 (19.1%) | 55 (80.9%) |
| Total | 657 (48.4%) | 700 (51.6%) |
Housing Structures by Number of Rooms in Pelham
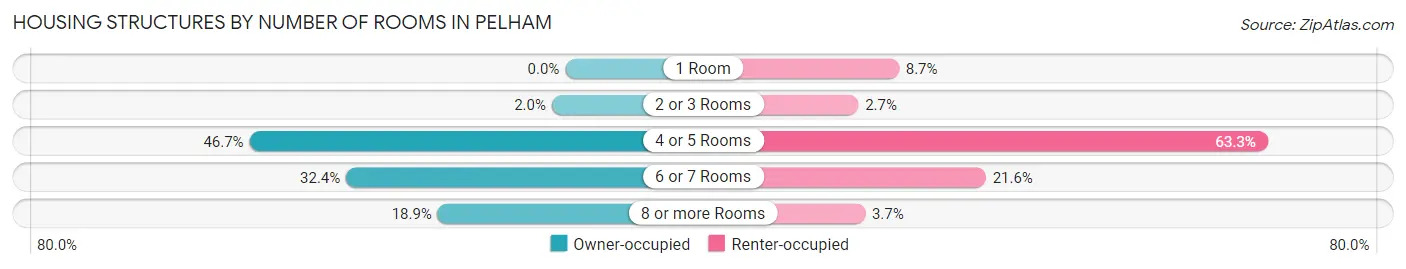
| Number of Rooms | Owner-occupied | Renter-occupied |
| 1 Room | 0 (0.0%) | 61 (8.7%) |
| 2 or 3 Rooms | 13 (2.0%) | 19 (2.7%) |
| 4 or 5 Rooms | 307 (46.7%) | 443 (63.3%) |
| 6 or 7 Rooms | 213 (32.4%) | 151 (21.6%) |
| 8 or more Rooms | 124 (18.9%) | 26 (3.7%) |
| Total | 657 (100.0%) | 700 (100.0%) |
Housing Structure by Heating Type in Pelham
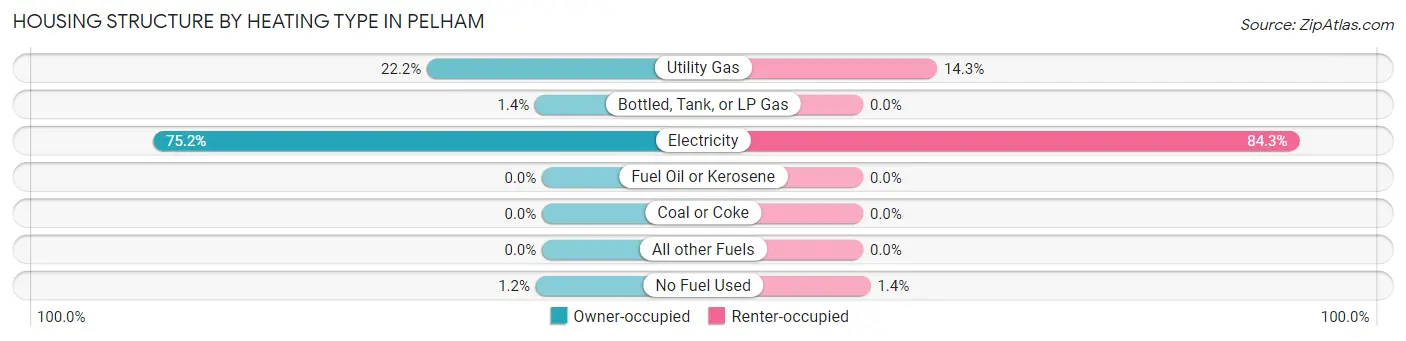
| Heating Type | Owner-occupied | Renter-occupied |
| Utility Gas | 146 (22.2%) | 100 (14.3%) |
| Bottled, Tank, or LP Gas | 9 (1.4%) | 0 (0.0%) |
| Electricity | 494 (75.2%) | 590 (84.3%) |
| Fuel Oil or Kerosene | 0 (0.0%) | 0 (0.0%) |
| Coal or Coke | 0 (0.0%) | 0 (0.0%) |
| All other Fuels | 0 (0.0%) | 0 (0.0%) |
| No Fuel Used | 8 (1.2%) | 10 (1.4%) |
| Total | 657 (100.0%) | 700 (100.0%) |
Household Vehicle Usage in Pelham
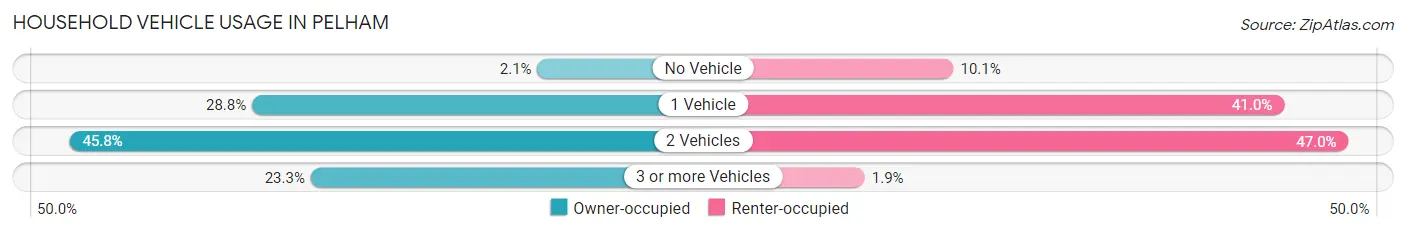
| Vehicles per Household | Owner-occupied | Renter-occupied |
| No Vehicle | 14 (2.1%) | 71 (10.1%) |
| 1 Vehicle | 189 (28.8%) | 287 (41.0%) |
| 2 Vehicles | 301 (45.8%) | 329 (47.0%) |
| 3 or more Vehicles | 153 (23.3%) | 13 (1.9%) |
| Total | 657 (100.0%) | 700 (100.0%) |
Real Estate & Mortgages in Pelham
Real Estate and Mortgage Overview in Pelham
| Characteristic | Without Mortgage | With Mortgage |
| Housing Units | 373 | 284 |
| Median Property Value | $69,600 | $175,000 |
| Median Household Income | $35,729 | $7 |
| Monthly Housing Costs | $393 | $0 |
| Real Estate Taxes | $1,181 | $0 |
Property Value by Mortgage Status in Pelham
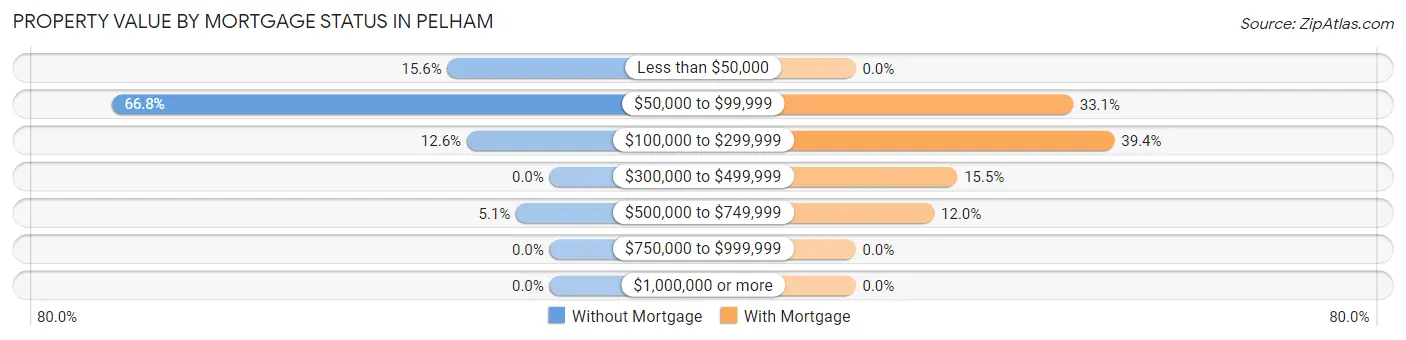
| Property Value | Without Mortgage | With Mortgage |
| Less than $50,000 | 58 (15.5%) | 0 (0.0%) |
| $50,000 to $99,999 | 249 (66.8%) | 94 (33.1%) |
| $100,000 to $299,999 | 47 (12.6%) | 112 (39.4%) |
| $300,000 to $499,999 | 0 (0.0%) | 44 (15.5%) |
| $500,000 to $749,999 | 19 (5.1%) | 34 (12.0%) |
| $750,000 to $999,999 | 0 (0.0%) | 0 (0.0%) |
| $1,000,000 or more | 0 (0.0%) | 0 (0.0%) |
| Total | 373 (100.0%) | 284 (100.0%) |
Household Income by Mortgage Status in Pelham
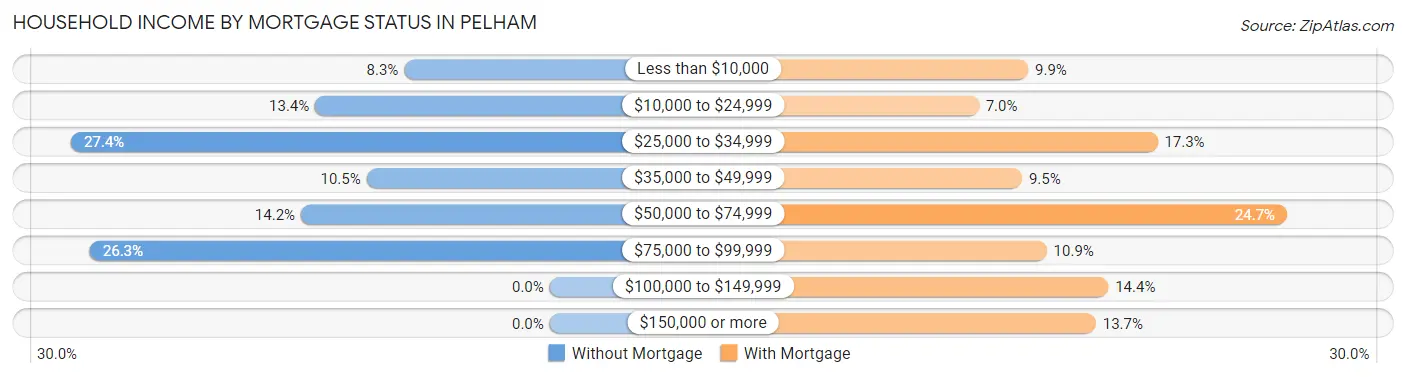
| Household Income | Without Mortgage | With Mortgage |
| Less than $10,000 | 31 (8.3%) | 28 (9.9%) |
| $10,000 to $24,999 | 50 (13.4%) | 20 (7.0%) |
| $25,000 to $34,999 | 102 (27.4%) | 49 (17.2%) |
| $35,000 to $49,999 | 39 (10.5%) | 27 (9.5%) |
| $50,000 to $74,999 | 53 (14.2%) | 70 (24.6%) |
| $75,000 to $99,999 | 98 (26.3%) | 31 (10.9%) |
| $100,000 to $149,999 | 0 (0.0%) | 41 (14.4%) |
| $150,000 or more | 0 (0.0%) | 39 (13.7%) |
| Total | 373 (100.0%) | 284 (100.0%) |
Property Value to Household Income Ratio in Pelham
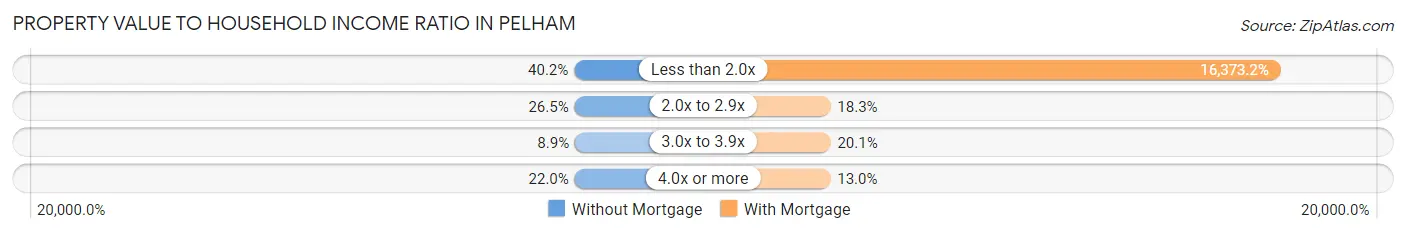
| Value-to-Income Ratio | Without Mortgage | With Mortgage |
| Less than 2.0x | 150 (40.2%) | 46,500 (16,373.2%) |
| 2.0x to 2.9x | 99 (26.5%) | 52 (18.3%) |
| 3.0x to 3.9x | 33 (8.8%) | 57 (20.1%) |
| 4.0x or more | 82 (22.0%) | 37 (13.0%) |
| Total | 373 (100.0%) | 284 (100.0%) |
Real Estate Taxes by Mortgage Status in Pelham
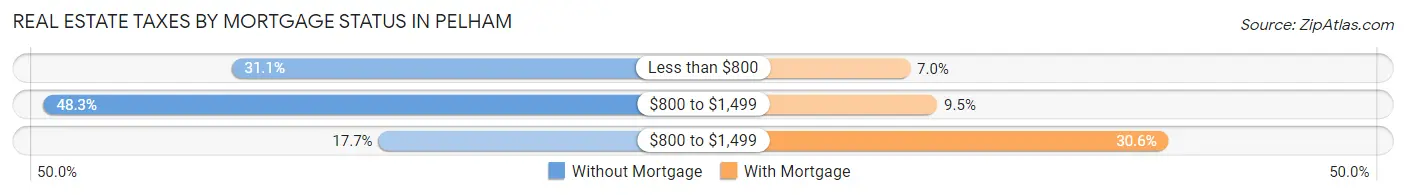
| Property Taxes | Without Mortgage | With Mortgage |
| Less than $800 | 116 (31.1%) | 20 (7.0%) |
| $800 to $1,499 | 180 (48.3%) | 27 (9.5%) |
| $800 to $1,499 | 66 (17.7%) | 87 (30.6%) |
| Total | 373 (100.0%) | 284 (100.0%) |
Health & Disability in Pelham
Health Insurance Coverage by Age in Pelham
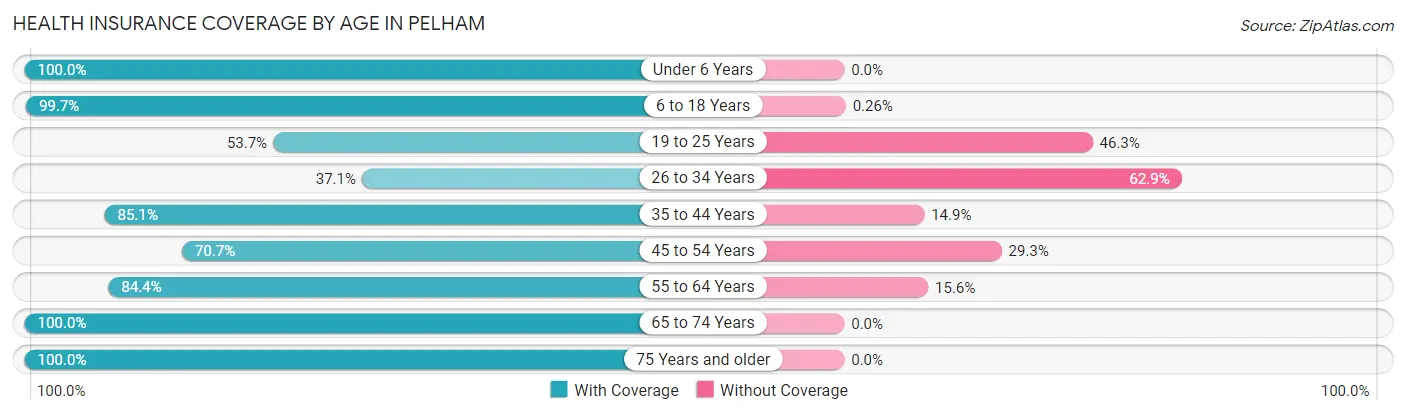
| Age Bracket | With Coverage | Without Coverage |
| Under 6 Years | 188 (100.0%) | 0 (0.0%) |
| 6 to 18 Years | 782 (99.7%) | 2 (0.3%) |
| 19 to 25 Years | 313 (53.7%) | 270 (46.3%) |
| 26 to 34 Years | 121 (37.1%) | 205 (62.9%) |
| 35 to 44 Years | 234 (85.1%) | 41 (14.9%) |
| 45 to 54 Years | 183 (70.7%) | 76 (29.3%) |
| 55 to 64 Years | 502 (84.4%) | 93 (15.6%) |
| 65 to 74 Years | 196 (100.0%) | 0 (0.0%) |
| 75 Years and older | 187 (100.0%) | 0 (0.0%) |
| Total | 2,706 (79.7%) | 687 (20.3%) |
Health Insurance Coverage by Citizenship Status in Pelham
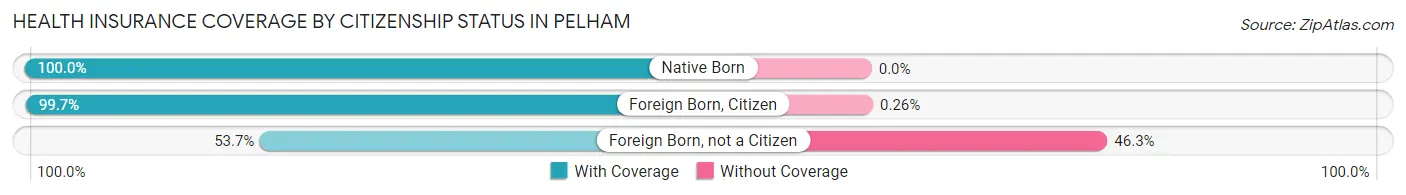
| Citizenship Status | With Coverage | Without Coverage |
| Native Born | 188 (100.0%) | 0 (0.0%) |
| Foreign Born, Citizen | 782 (99.7%) | 2 (0.3%) |
| Foreign Born, not a Citizen | 313 (53.7%) | 270 (46.3%) |
Health Insurance Coverage by Household Income in Pelham
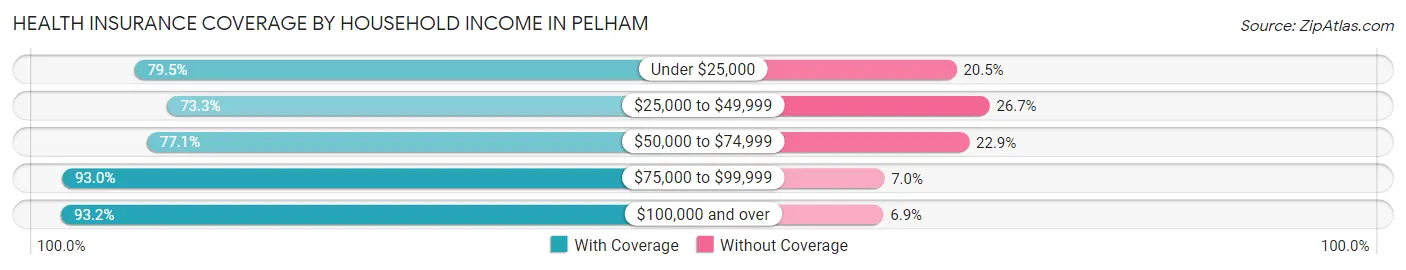
| Household Income | With Coverage | Without Coverage |
| Under $25,000 | 801 (79.5%) | 207 (20.5%) |
| $25,000 to $49,999 | 784 (73.3%) | 286 (26.7%) |
| $50,000 to $74,999 | 478 (77.1%) | 142 (22.9%) |
| $75,000 to $99,999 | 411 (93.0%) | 31 (7.0%) |
| $100,000 and over | 231 (93.1%) | 17 (6.9%) |
Public vs Private Health Insurance Coverage by Age in Pelham
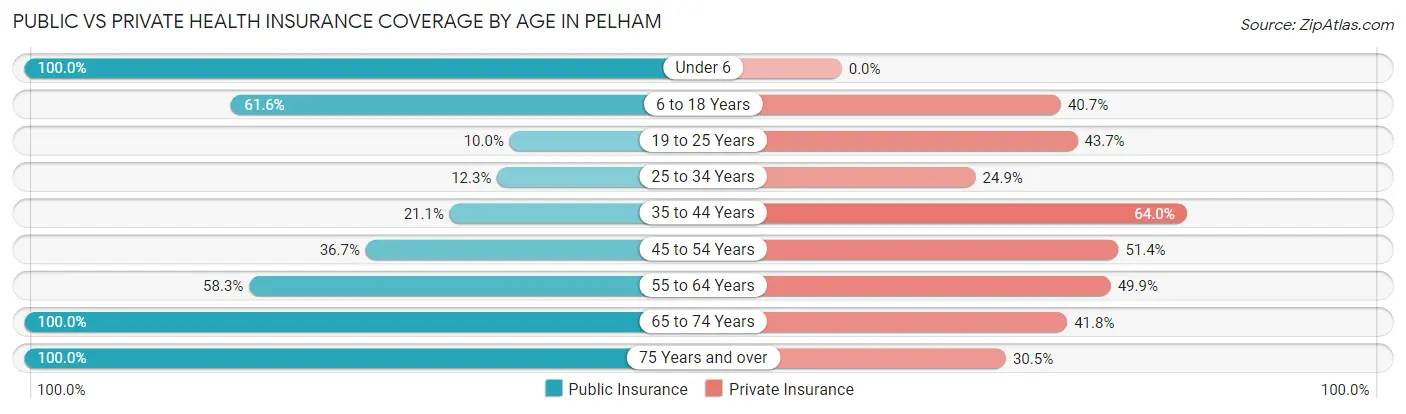
| Age Bracket | Public Insurance | Private Insurance |
| Under 6 | 188 (100.0%) | 0 (0.0%) |
| 6 to 18 Years | 483 (61.6%) | 319 (40.7%) |
| 19 to 25 Years | 58 (10.0%) | 255 (43.7%) |
| 25 to 34 Years | 40 (12.3%) | 81 (24.8%) |
| 35 to 44 Years | 58 (21.1%) | 176 (64.0%) |
| 45 to 54 Years | 95 (36.7%) | 133 (51.3%) |
| 55 to 64 Years | 347 (58.3%) | 297 (49.9%) |
| 65 to 74 Years | 196 (100.0%) | 82 (41.8%) |
| 75 Years and over | 187 (100.0%) | 57 (30.5%) |
| Total | 1,652 (48.7%) | 1,400 (41.3%) |
Disability Status by Sex by Age in Pelham
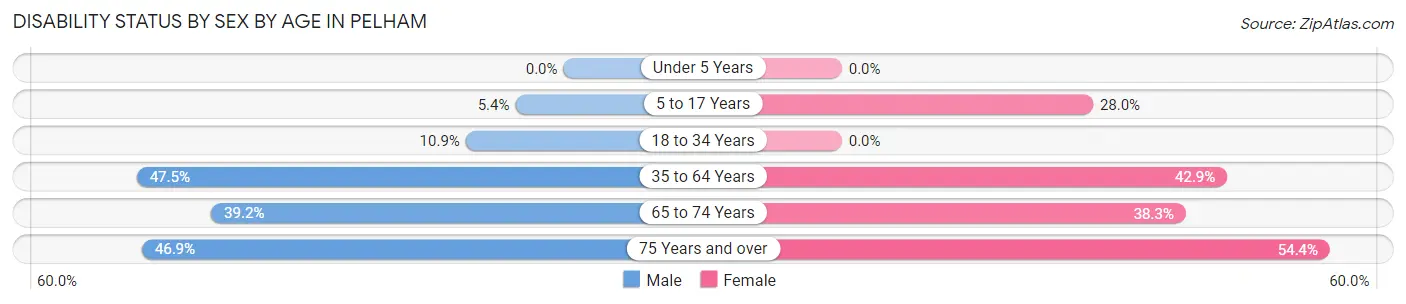
| Age Bracket | Male | Female |
| Under 5 Years | 0 (0.0%) | 0 (0.0%) |
| 5 to 17 Years | 20 (5.3%) | 113 (28.0%) |
| 18 to 34 Years | 42 (10.9%) | 0 (0.0%) |
| 35 to 64 Years | 181 (47.5%) | 321 (42.9%) |
| 65 to 74 Years | 40 (39.2%) | 36 (38.3%) |
| 75 Years and over | 23 (46.9%) | 75 (54.3%) |
Disability Class by Sex by Age in Pelham
Disability Class: Hearing Difficulty
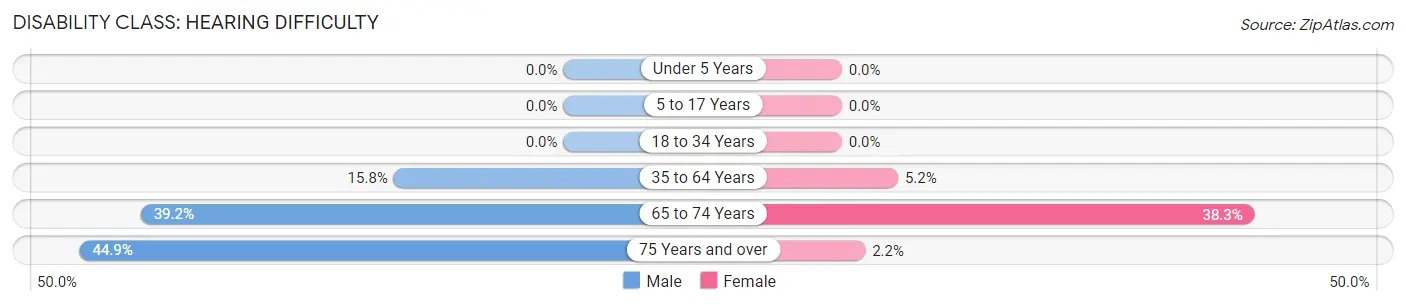
| Age Bracket | Male | Female |
| Under 5 Years | 0 (0.0%) | 0 (0.0%) |
| 5 to 17 Years | 0 (0.0%) | 0 (0.0%) |
| 18 to 34 Years | 0 (0.0%) | 0 (0.0%) |
| 35 to 64 Years | 60 (15.8%) | 39 (5.2%) |
| 65 to 74 Years | 40 (39.2%) | 36 (38.3%) |
| 75 Years and over | 22 (44.9%) | 3 (2.2%) |
Disability Class: Vision Difficulty
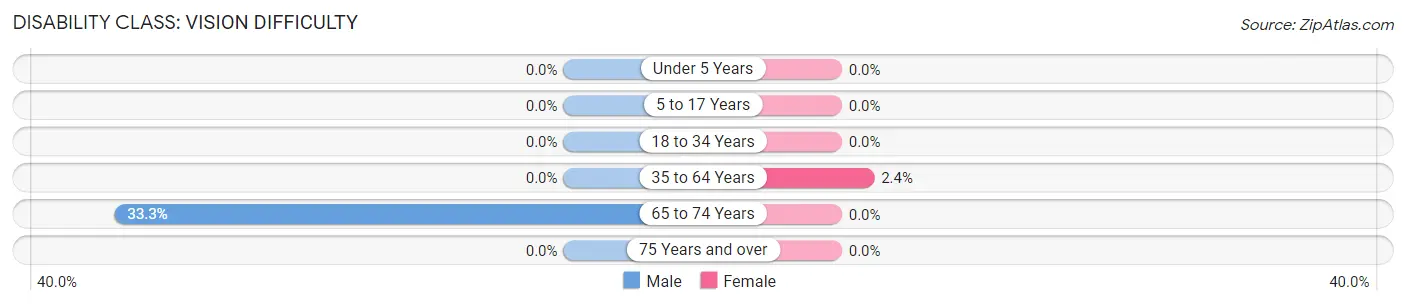
| Age Bracket | Male | Female |
| Under 5 Years | 0 (0.0%) | 0 (0.0%) |
| 5 to 17 Years | 0 (0.0%) | 0 (0.0%) |
| 18 to 34 Years | 0 (0.0%) | 0 (0.0%) |
| 35 to 64 Years | 0 (0.0%) | 18 (2.4%) |
| 65 to 74 Years | 34 (33.3%) | 0 (0.0%) |
| 75 Years and over | 0 (0.0%) | 0 (0.0%) |
Disability Class: Cognitive Difficulty
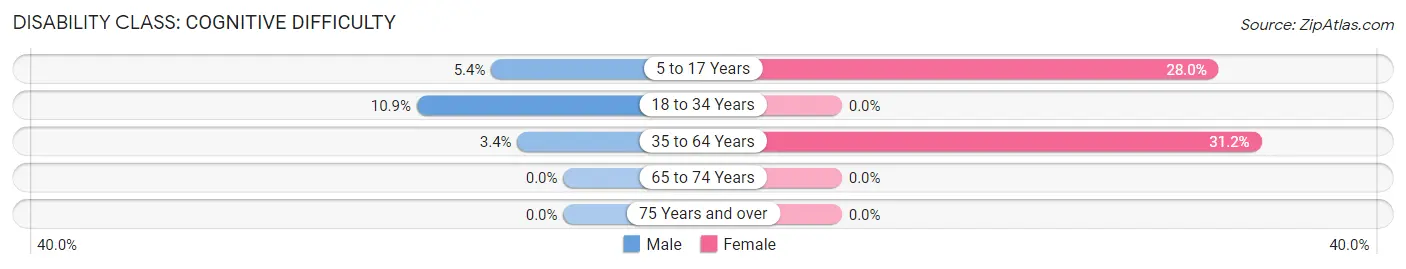
| Age Bracket | Male | Female |
| 5 to 17 Years | 20 (5.3%) | 113 (28.0%) |
| 18 to 34 Years | 42 (10.9%) | 0 (0.0%) |
| 35 to 64 Years | 13 (3.4%) | 233 (31.1%) |
| 65 to 74 Years | 0 (0.0%) | 0 (0.0%) |
| 75 Years and over | 0 (0.0%) | 0 (0.0%) |
Disability Class: Ambulatory Difficulty
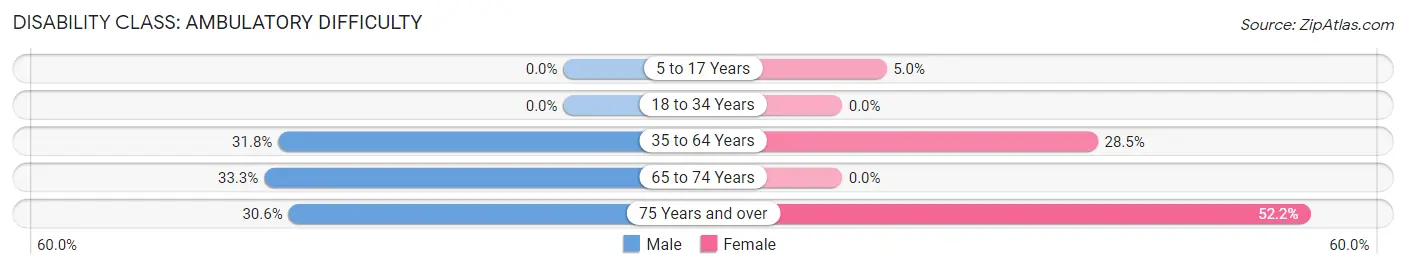
| Age Bracket | Male | Female |
| 5 to 17 Years | 0 (0.0%) | 20 (5.0%) |
| 18 to 34 Years | 0 (0.0%) | 0 (0.0%) |
| 35 to 64 Years | 121 (31.8%) | 213 (28.5%) |
| 65 to 74 Years | 34 (33.3%) | 0 (0.0%) |
| 75 Years and over | 15 (30.6%) | 72 (52.2%) |
Disability Class: Self-Care Difficulty
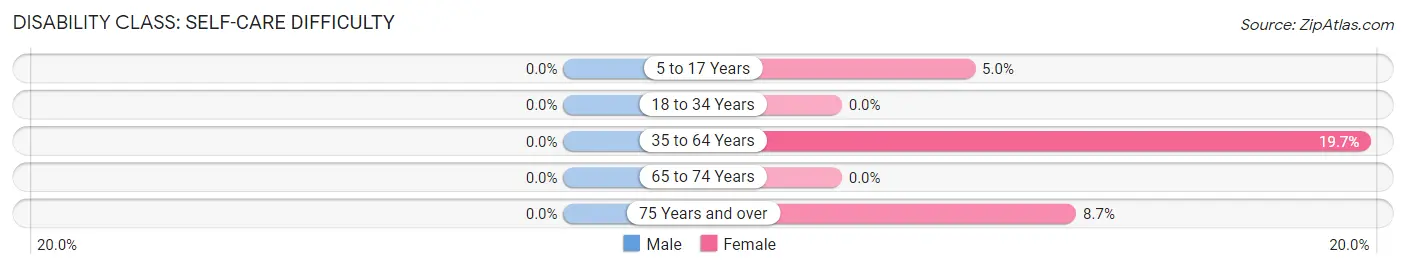
| Age Bracket | Male | Female |
| 5 to 17 Years | 0 (0.0%) | 20 (5.0%) |
| 18 to 34 Years | 0 (0.0%) | 0 (0.0%) |
| 35 to 64 Years | 0 (0.0%) | 147 (19.7%) |
| 65 to 74 Years | 0 (0.0%) | 0 (0.0%) |
| 75 Years and over | 0 (0.0%) | 12 (8.7%) |
Technology Access in Pelham
Computing Device Access in Pelham
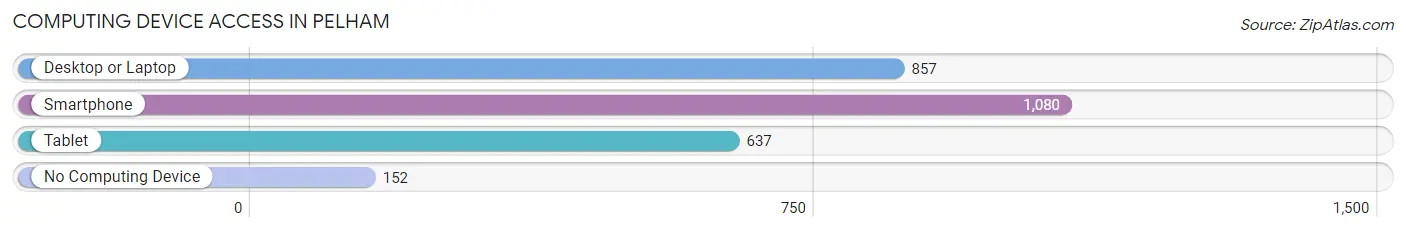
| Device Type | # Households | % Households |
| Desktop or Laptop | 857 | 63.1% |
| Smartphone | 1,080 | 79.6% |
| Tablet | 637 | 46.9% |
| No Computing Device | 152 | 11.2% |
| Total | 1,357 | 100.0% |
Internet Access in Pelham
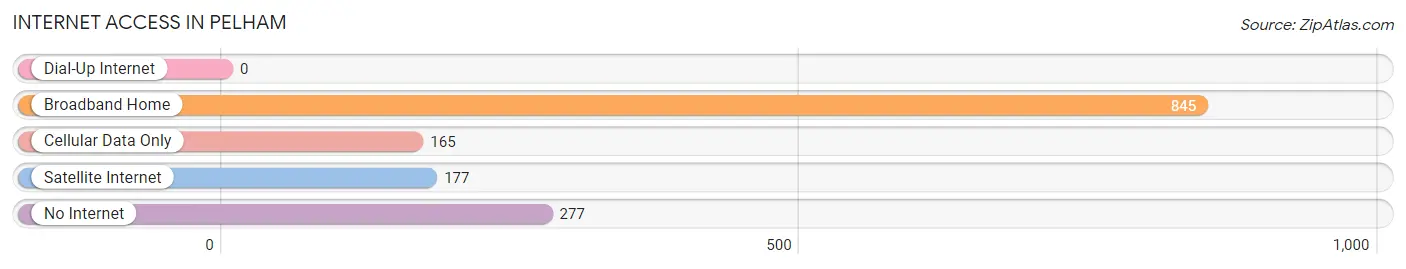
| Internet Type | # Households | % Households |
| Dial-Up Internet | 0 | 0.0% |
| Broadband Home | 845 | 62.3% |
| Cellular Data Only | 165 | 12.2% |
| Satellite Internet | 177 | 13.0% |
| No Internet | 277 | 20.4% |
| Total | 1,357 | 100.0% |
Pelham Summary
Pelham, Georgia is a small city located in Mitchell County, in the southwestern part of the state. It is situated about 30 miles south of Albany, the state capital, and about 60 miles north of Tallahassee, Florida. The city is part of the Albany metropolitan area and has a population of approximately 2,500 people.
History
Pelham was founded in 1854 by a group of settlers from South Carolina. The city was named after a local creek, which was named after a Revolutionary War hero, General John Pelham. The city was incorporated in 1872 and was the county seat of Mitchell County until the county seat was moved to Camilla in 1891.
In the late 19th century, Pelham was a thriving agricultural center, with cotton being the main crop. The city also had a number of sawmills and gristmills, as well as a number of stores and other businesses.
In the early 20th century, Pelham began to decline as the cotton industry moved away from the area. The city was also affected by the Great Depression and World War II. After the war, the city began to experience a slow but steady growth.
Geography
Pelham is located in the southwestern part of Georgia, in Mitchell County. The city is situated about 30 miles south of Albany, the state capital, and about 60 miles north of Tallahassee, Florida. The city is part of the Albany metropolitan area.
The city is located in a rural area, with the nearest large city being Albany. The city is surrounded by rolling hills and forests, and is located near the Flint River.
Economy
Pelham’s economy is largely based on agriculture. The city is home to a number of farms, which produce cotton, corn, soybeans, and other crops. The city also has a number of small businesses, including restaurants, stores, and other services.
Demographics
As of the 2010 census, the population of Pelham was 2,500. The racial makeup of the city was 79.2% White, 17.2% African American, 0.4% Native American, 0.4% Asian, 0.1% Pacific Islander, 1.2% from other races, and 1.5% from two or more races. Hispanic or Latino of any race were 2.2% of the population.
The median household income in Pelham was $30,938, and the median family income was $37,813. The per capita income for the city was $15,945. About 18.2% of the population was below the poverty line.
Conclusion
Pelham, Georgia is a small city located in Mitchell County, in the southwestern part of the state. It is situated about 30 miles south of Albany, the state capital, and about 60 miles north of Tallahassee, Florida. The city is part of the Albany metropolitan area and has a population of approximately 2,500 people. The city’s economy is largely based on agriculture, with a number of farms producing cotton, corn, soybeans, and other crops. The racial makeup of the city is 79.2% White, 17.2% African American, 0.4% Native American, 0.4% Asian, 0.1% Pacific Islander, 1.2% from other races, and 1.5% from two or more races. The median household income in Pelham was $30,938, and the median family income was $37,813. About 18.2% of the population was below the poverty line.
Common Questions
What is the Total Population of Pelham?
Total Population of Pelham is 3,501.
What is the Total Male Population of Pelham?
Total Male Population of Pelham is 1,354.
What is the Total Female Population of Pelham?
Total Female Population of Pelham is 2,147.
What is the Ratio of Males per 100 Females in Pelham?
There are 63.06 Males per 100 Females in Pelham.
What is the Ratio of Females per 100 Males in Pelham?
There are 158.57 Females per 100 Males in Pelham.
What is the Median Population Age in Pelham?
Median Population Age in Pelham is 30.9 Years.
What is the Average Family Size in Pelham
Average Family Size in Pelham is 3.3 People.
What is the Average Household Size in Pelham
Average Household Size in Pelham is 2.5 People.
What is Per Capita Income in Pelham?
Per Capita income in Pelham is $16,961.
What is the Median Family Income in Pelham?
Median Family Income in Pelham is $33,786.
What is the Median Household income in Pelham?
Median Household Income in Pelham is $34,761.
What is Income or Wage Gap in Pelham?
Income or Wage Gap in Pelham is 20.9%.
Women in Pelham earn 79.1 cents for every dollar earned by a man.
What is Inequality or Gini Index in Pelham?
Inequality or Gini Index in Pelham is 0.41.
How Large is the Labor Force in Pelham?
There are 1,288 People in the Labor Forcein in Pelham.
What is the Percentage of People in the Labor Force in Pelham?
49.0% of People are in the Labor Force in Pelham.
What is the Unemployment Rate in Pelham?
Unemployment Rate in Pelham is 13.1%.