Between, GA
Between Map
Between Overview
491
TOTAL POPULATION
309
MALE POPULATION
182
FEMALE POPULATION
169.78
MALES / 100 FEMALES
58.90
FEMALES / 100 MALES
35.7
MEDIAN AGE
3.7
AVG FAMILY SIZE
3.2
AVG HOUSEHOLD SIZE
$45,093
PER CAPITA INCOME
$131,250
AVG FAMILY INCOME
$123,854
AVG HOUSEHOLD INCOME
22.9%
WAGE / INCOME GAP [ % ]
77.1¢/ $1
WAGE / INCOME GAP [ $ ]
0.39
INEQUALITY / GINI INDEX
309
LABOR FORCE [ PEOPLE ]
78.4%
PERCENT IN LABOR FORCE
4.9%
UNEMPLOYMENT RATE
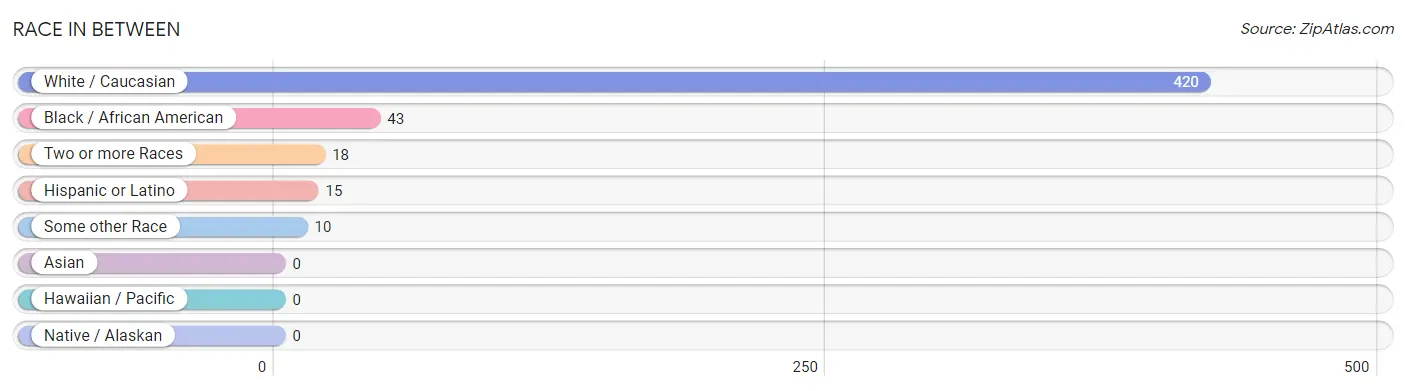
Race in Between
The most populous races in Between are White / Caucasian (420 | 85.5%), Black / African American (43 | 8.8%), and Two or more Races (18 | 3.7%).
| Race | # Population | % Population |
| Asian | 0 | 0.0% |
| Black / African American | 43 | 8.8% |
| Hawaiian / Pacific | 0 | 0.0% |
| Hispanic or Latino | 15 | 3.0% |
| Native / Alaskan | 0 | 0.0% |
| White / Caucasian | 420 | 85.5% |
| Two or more Races | 18 | 3.7% |
| Some other Race | 10 | 2.0% |
| Total | 491 | 100.0% |
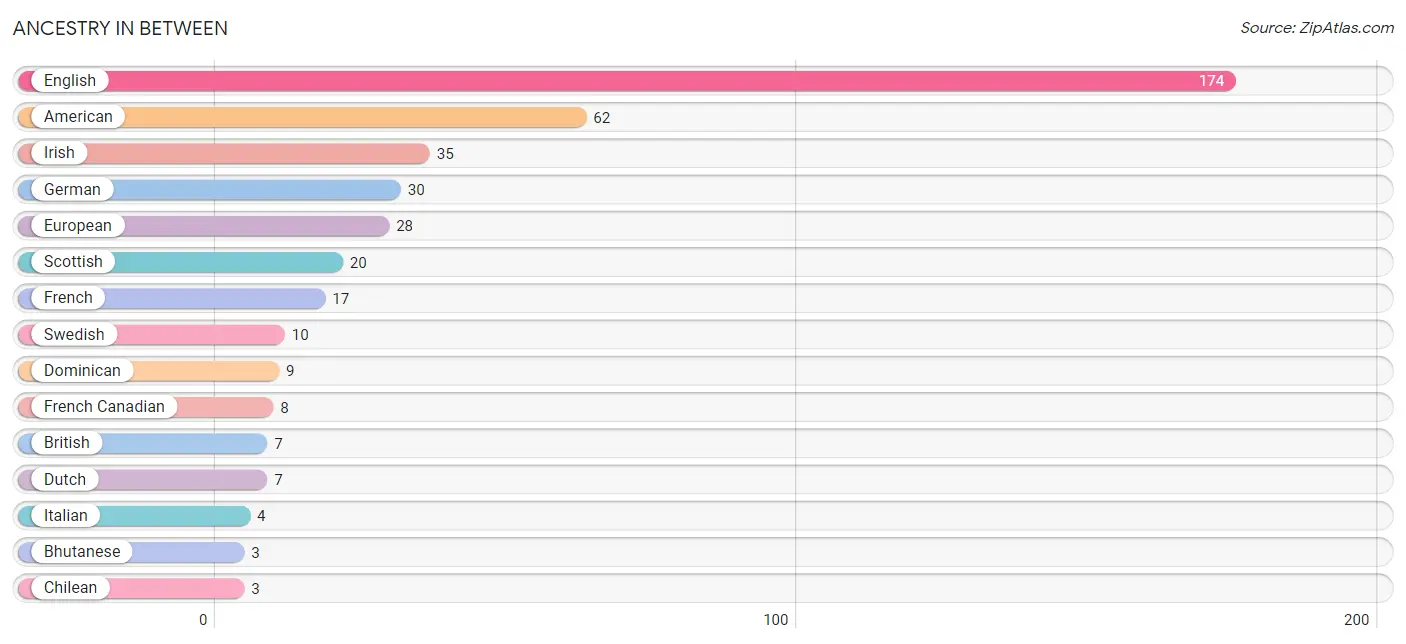
Ancestry in Between
The most populous ancestries reported in Between are English (174 | 35.4%), American (62 | 12.6%), Irish (35 | 7.1%), German (30 | 6.1%), and European (28 | 5.7%), together accounting for 67.0% of all Between residents.
| Ancestry | # Population | % Population |
| American | 62 | 12.6% |
| Bhutanese | 3 | 0.6% |
| British | 7 | 1.4% |
| Chilean | 3 | 0.6% |
| Czech | 1 | 0.2% |
| Dominican | 9 | 1.8% |
| Dutch | 7 | 1.4% |
| Dutch West Indian | 2 | 0.4% |
| English | 174 | 35.4% |
| European | 28 | 5.7% |
| French | 17 | 3.5% |
| French Canadian | 8 | 1.6% |
| German | 30 | 6.1% |
| Irish | 35 | 7.1% |
| Italian | 4 | 0.8% |
| Luxembourger | 2 | 0.4% |
| Mexican | 1 | 0.2% |
| Norwegian | 2 | 0.4% |
| Polish | 2 | 0.4% |
| Puerto Rican | 2 | 0.4% |
| Scandinavian | 1 | 0.2% |
| Scotch-Irish | 3 | 0.6% |
| Scottish | 20 | 4.1% |
| Serbian | 1 | 0.2% |
| South American | 3 | 0.6% |
| Swedish | 10 | 2.0% |
| Swiss | 2 | 0.4% |
| Welsh | 1 | 0.2% | View All 28 Rows |
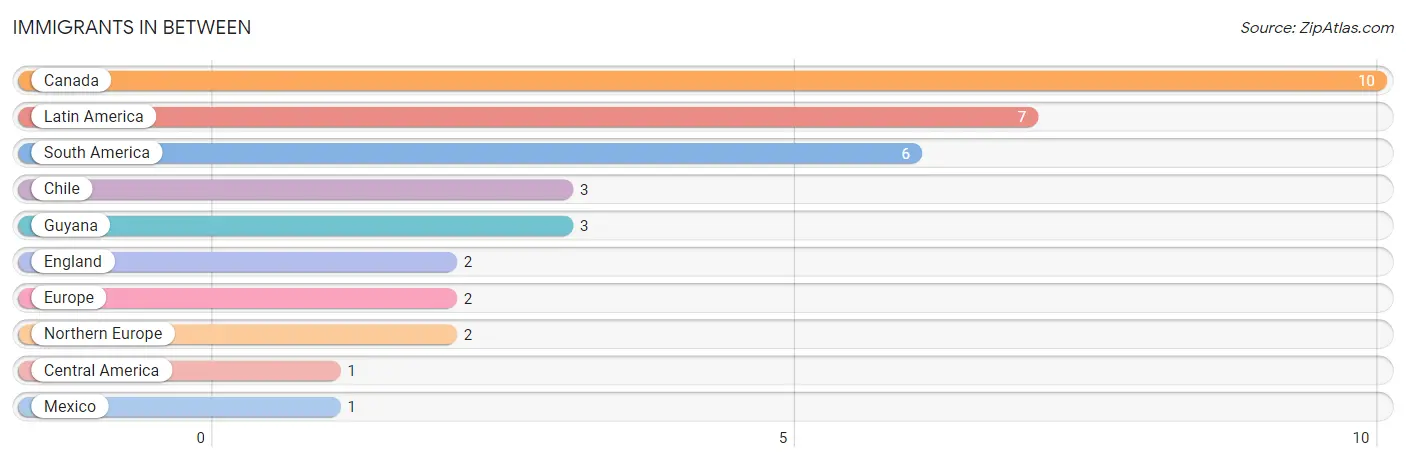
Immigrants in Between
The most numerous immigrant groups reported in Between came from Canada (10 | 2.0%), Latin America (7 | 1.4%), South America (6 | 1.2%), Chile (3 | 0.6%), and Guyana (3 | 0.6%), together accounting for 5.9% of all Between residents.
| Immigration Origin | # Population | % Population |
| Canada | 10 | 2.0% |
| Central America | 1 | 0.2% |
| Chile | 3 | 0.6% |
| England | 2 | 0.4% |
| Europe | 2 | 0.4% |
| Guyana | 3 | 0.6% |
| Latin America | 7 | 1.4% |
| Mexico | 1 | 0.2% |
| Northern Europe | 2 | 0.4% |
| South America | 6 | 1.2% | View All 10 Rows |
Sex and Age in Between
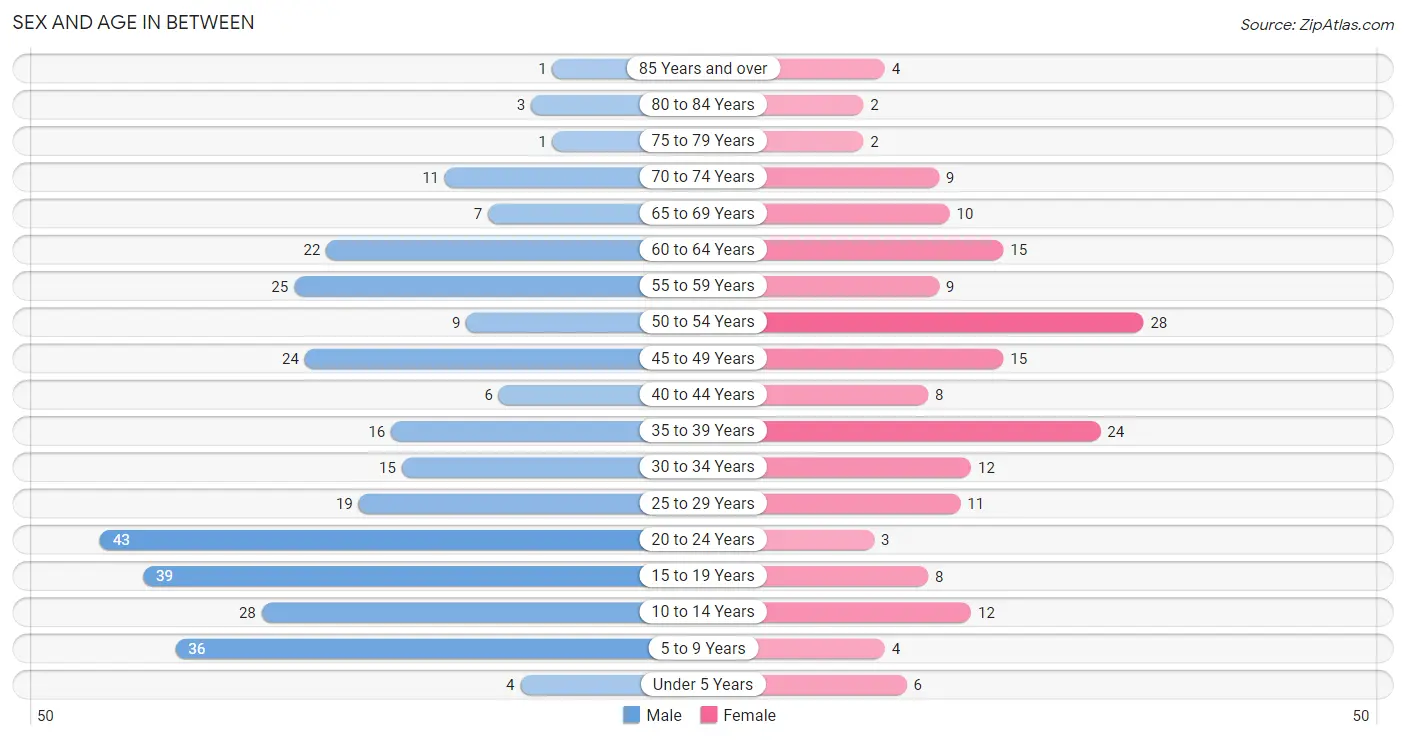
Sex and Age in Between
The most populous age groups in Between are 20 to 24 Years (43 | 13.9%) for men and 50 to 54 Years (28 | 15.4%) for women.
| Age Bracket | Male | Female |
| Under 5 Years | 4 (1.3%) | 6 (3.3%) |
| 5 to 9 Years | 36 (11.7%) | 4 (2.2%) |
| 10 to 14 Years | 28 (9.1%) | 12 (6.6%) |
| 15 to 19 Years | 39 (12.6%) | 8 (4.4%) |
| 20 to 24 Years | 43 (13.9%) | 3 (1.7%) |
| 25 to 29 Years | 19 (6.1%) | 11 (6.0%) |
| 30 to 34 Years | 15 (4.9%) | 12 (6.6%) |
| 35 to 39 Years | 16 (5.2%) | 24 (13.2%) |
| 40 to 44 Years | 6 (1.9%) | 8 (4.4%) |
| 45 to 49 Years | 24 (7.8%) | 15 (8.2%) |
| 50 to 54 Years | 9 (2.9%) | 28 (15.4%) |
| 55 to 59 Years | 25 (8.1%) | 9 (5.0%) |
| 60 to 64 Years | 22 (7.1%) | 15 (8.2%) |
| 65 to 69 Years | 7 (2.3%) | 10 (5.5%) |
| 70 to 74 Years | 11 (3.6%) | 9 (5.0%) |
| 75 to 79 Years | 1 (0.3%) | 2 (1.1%) |
| 80 to 84 Years | 3 (1.0%) | 2 (1.1%) |
| 85 Years and over | 1 (0.3%) | 4 (2.2%) |
| Total | 309 (100.0%) | 182 (100.0%) |
Families and Households in Between
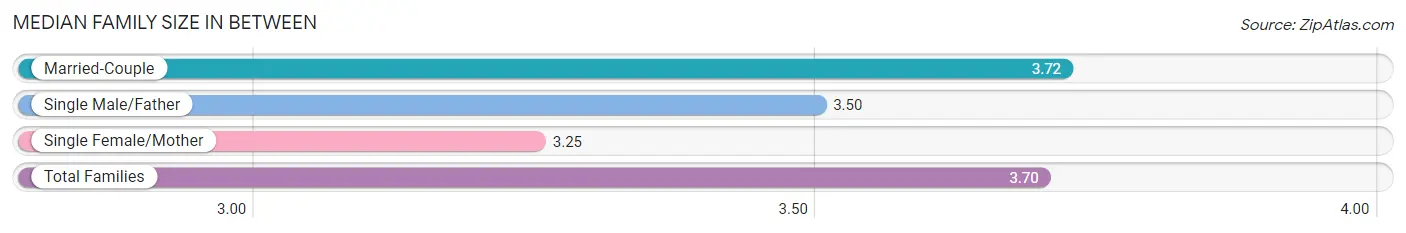
Median Family Size in Between
The median family size in Between is 3.70 persons per family, with married-couple families (115 | 93.5%) accounting for the largest median family size of 3.72 persons per family. On the other hand, single female/mother families (4 | 3.3%) represent the smallest median family size with 3.25 persons per family.
| Family Type | # Families | Family Size |
| Married-Couple | 115 (93.5%) | 3.72 |
| Single Male/Father | 4 (3.3%) | 3.50 |
| Single Female/Mother | 4 (3.3%) | 3.25 |
| Total Families | 123 (100.0%) | 3.70 |
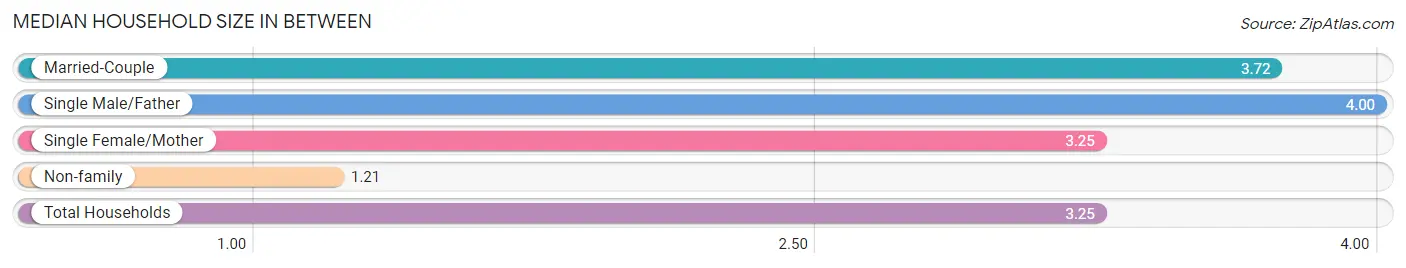
Median Household Size in Between
The median household size in Between is 3.25 persons per household, with single male/father households (4 | 2.6%) accounting for the largest median household size of 4 persons per household. non-family households (28 | 18.5%) represent the smallest median household size with 1.21 persons per household.
| Household Type | # Households | Household Size |
| Married-Couple | 115 (76.2%) | 3.72 |
| Single Male/Father | 4 (2.6%) | 4.00 |
| Single Female/Mother | 4 (2.6%) | 3.25 |
| Non-family | 28 (18.5%) | 1.21 |
| Total Households | 151 (100.0%) | 3.25 |
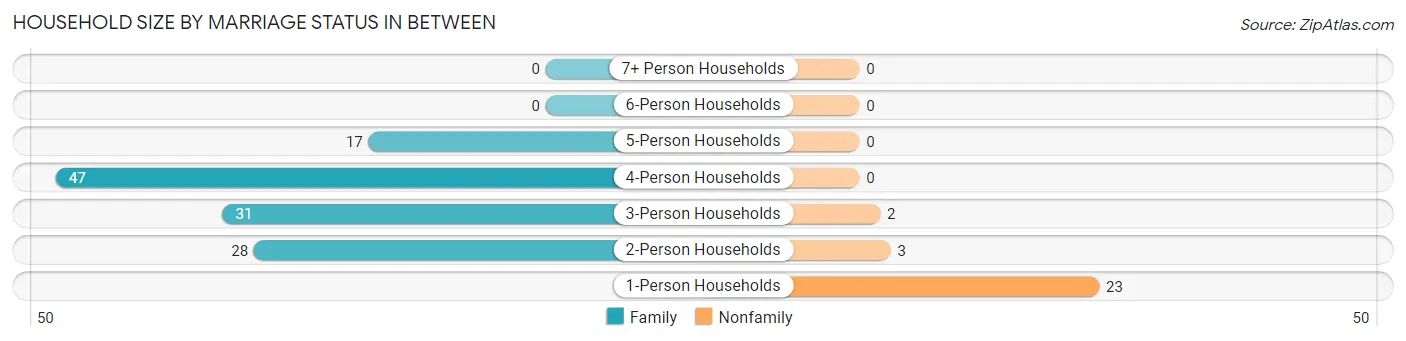
Household Size by Marriage Status in Between
Out of a total of 151 households in Between, 123 (81.5%) are family households, while 28 (18.5%) are nonfamily households. The most numerous type of family households are 4-person households, comprising 47, and the most common type of nonfamily households are 1-person households, comprising 23.
| Household Size | Family Households | Nonfamily Households |
| 1-Person Households | - | 23 (15.2%) |
| 2-Person Households | 28 (18.5%) | 3 (2.0%) |
| 3-Person Households | 31 (20.5%) | 2 (1.3%) |
| 4-Person Households | 47 (31.1%) | 0 (0.0%) |
| 5-Person Households | 17 (11.3%) | 0 (0.0%) |
| 6-Person Households | 0 (0.0%) | 0 (0.0%) |
| 7+ Person Households | 0 (0.0%) | 0 (0.0%) |
| Total | 123 (81.5%) | 28 (18.5%) |
Female Fertility in Between
Fertility by Age in Between
Average fertility rate in Between is 41.0 births per 1,000 women. Women in the age bracket of 35 to 50 years have the highest fertility rate with 47.0 births per 1,000 women. Women in the age bracket of 35 to 50 years acount for 75.0% of all women with births.
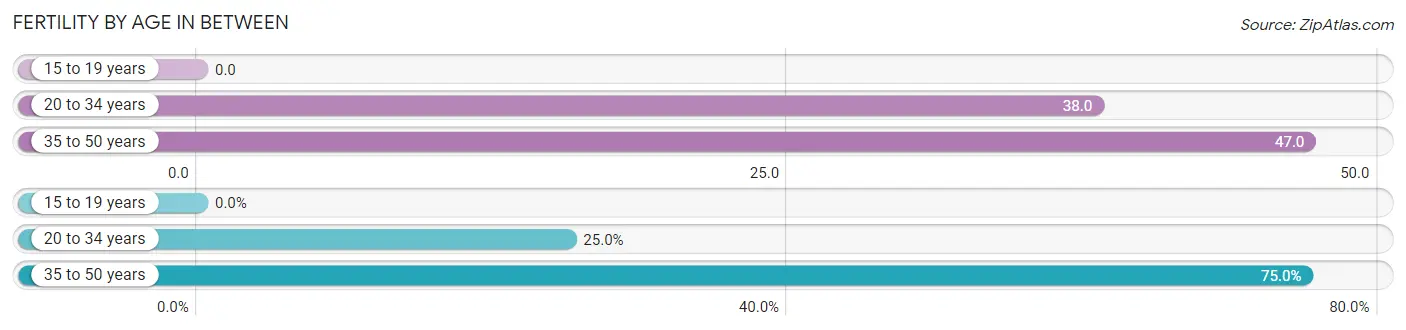
| Age Bracket | Women with Births | Births / 1,000 Women |
| 15 to 19 years | 0 (0.0%) | 0.0 |
| 20 to 34 years | 1 (25.0%) | 38.0 |
| 35 to 50 years | 3 (75.0%) | 47.0 |
| Total | 4 (100.0%) | 41.0 |
Fertility by Age by Marriage Status in Between
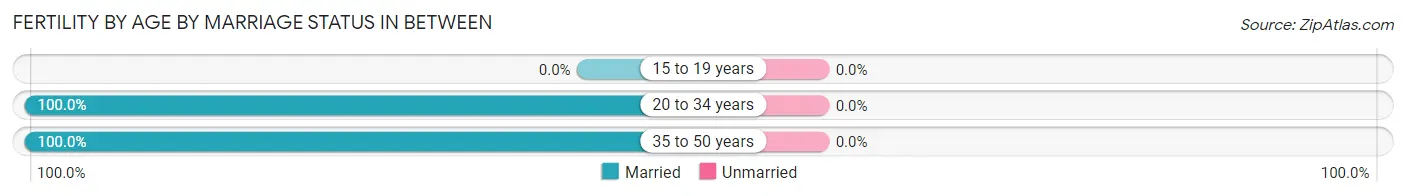
| Age Bracket | Married | Unmarried |
| 15 to 19 years | 0 (0.0%) | 0 (0.0%) |
| 20 to 34 years | 1 (100.0%) | 0 (0.0%) |
| 35 to 50 years | 3 (100.0%) | 0 (0.0%) |
| Total | 4 (100.0%) | 0 (0.0%) |
Fertility by Education in Between
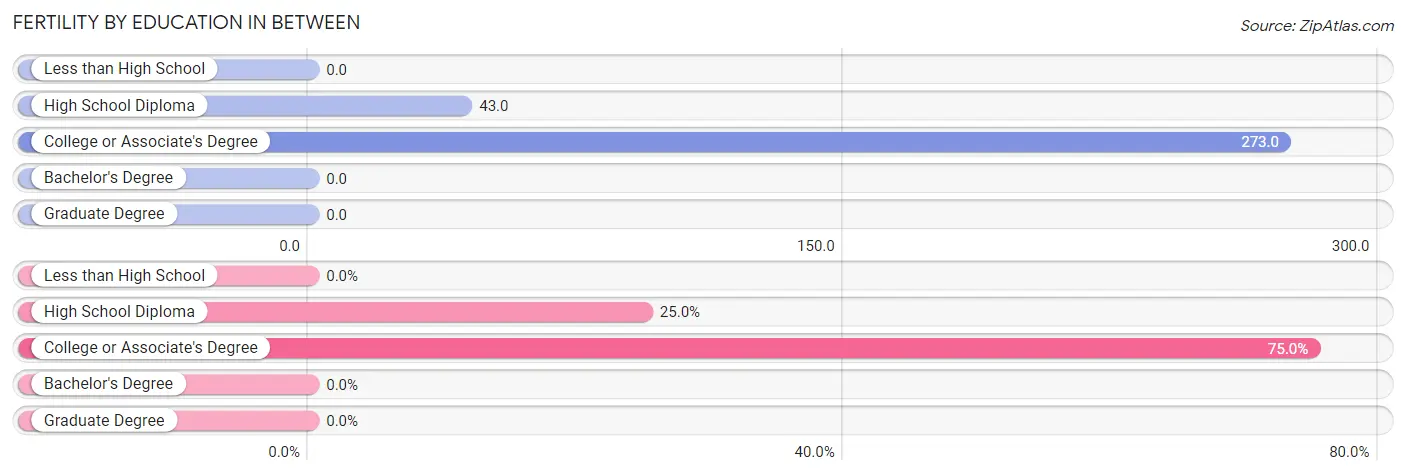
| Educational Attainment | Women with Births | Births / 1,000 Women |
| Less than High School | 0 (0.0%) | 0.0 |
| High School Diploma | 1 (25.0%) | 43.0 |
| College or Associate's Degree | 3 (75.0%) | 273.0 |
| Bachelor's Degree | 0 (0.0%) | 0.0 |
| Graduate Degree | 0 (0.0%) | 0.0 |
| Total | 4 (100.0%) | 41.0 |
Fertility by Education by Marriage Status in Between
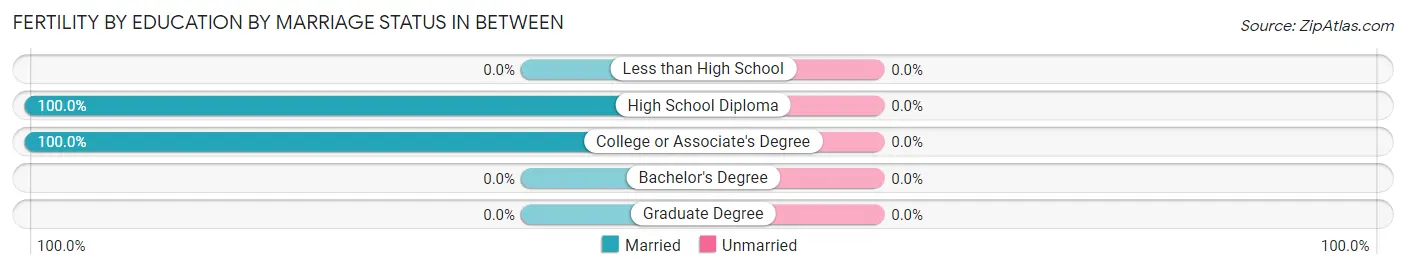
| Educational Attainment | Married | Unmarried |
| Less than High School | 0 (0.0%) | 0 (0.0%) |
| High School Diploma | 1 (100.0%) | 0 (0.0%) |
| College or Associate's Degree | 3 (100.0%) | 0 (0.0%) |
| Bachelor's Degree | 0 (0.0%) | 0 (0.0%) |
| Graduate Degree | 0 (0.0%) | 0 (0.0%) |
| Total | 4 (100.0%) | 0 (0.0%) |
Income in Between
Income Overview in Between
Per Capita Income in Between is $45,093, while median incomes of families and households are $131,250 and $123,854 respectively.
| Characteristic | Number | Measure |
| Per Capita Income | 491 | $45,093 |
| Median Family Income | 123 | $131,250 |
| Mean Family Income | 123 | $143,714 |
| Median Household Income | 151 | $123,854 |
| Mean Household Income | 151 | $132,189 |
| Income Deficit | 123 | $0 |
| Wage / Income Gap (%) | 491 | 22.86% |
| Wage / Income Gap ($) | 491 | 77.14¢ per $1 |
| Gini / Inequality Index | 491 | 0.39 |
Earnings by Sex in Between
Average Earnings in Between are $43,375, $39,728 for men and $51,500 for women, a difference of 22.9%.
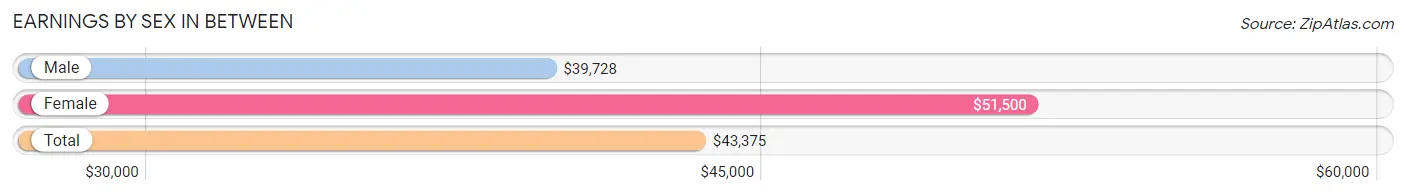
| Sex | Number | Average Earnings |
| Male | 215 (67.0%) | $39,728 |
| Female | 106 (33.0%) | $51,500 |
| Total | 321 (100.0%) | $43,375 |
Earnings by Sex by Income Bracket in Between
The most common earnings brackets in Between are $35,000 to $39,999 for men (71 | 33.0%) and $75,000 to $99,999 for women (25 | 23.6%).

| Income | Male | Female |
| $2,499 or less | 19 (8.8%) | 0 (0.0%) |
| $2,500 to $4,999 | 7 (3.3%) | 5 (4.7%) |
| $5,000 to $7,499 | 0 (0.0%) | 1 (0.9%) |
| $7,500 to $9,999 | 3 (1.4%) | 1 (0.9%) |
| $10,000 to $12,499 | 4 (1.9%) | 4 (3.8%) |
| $12,500 to $14,999 | 3 (1.4%) | 0 (0.0%) |
| $15,000 to $17,499 | 2 (0.9%) | 0 (0.0%) |
| $17,500 to $19,999 | 0 (0.0%) | 0 (0.0%) |
| $20,000 to $22,499 | 2 (0.9%) | 0 (0.0%) |
| $22,500 to $24,999 | 1 (0.5%) | 3 (2.8%) |
| $25,000 to $29,999 | 3 (1.4%) | 10 (9.4%) |
| $30,000 to $34,999 | 0 (0.0%) | 11 (10.4%) |
| $35,000 to $39,999 | 71 (33.0%) | 5 (4.7%) |
| $40,000 to $44,999 | 2 (0.9%) | 10 (9.4%) |
| $45,000 to $49,999 | 7 (3.3%) | 0 (0.0%) |
| $50,000 to $54,999 | 5 (2.3%) | 10 (9.4%) |
| $55,000 to $64,999 | 5 (2.3%) | 6 (5.7%) |
| $65,000 to $74,999 | 12 (5.6%) | 3 (2.8%) |
| $75,000 to $99,999 | 34 (15.8%) | 25 (23.6%) |
| $100,000+ | 35 (16.3%) | 12 (11.3%) |
| Total | 215 (100.0%) | 106 (100.0%) |
Earnings by Sex by Educational Attainment in Between
Average earnings in Between are $77,083 for men and $52,250 for women, a difference of 32.2%. Men with an educational attainment of graduate degree enjoy the highest average annual earnings of $108,750, while those with high school diploma education earn the least with $40,625. Women with an educational attainment of bachelor's degree earn the most with the average annual earnings of $88,281, while those with high school diploma education have the smallest earnings of $27,143.
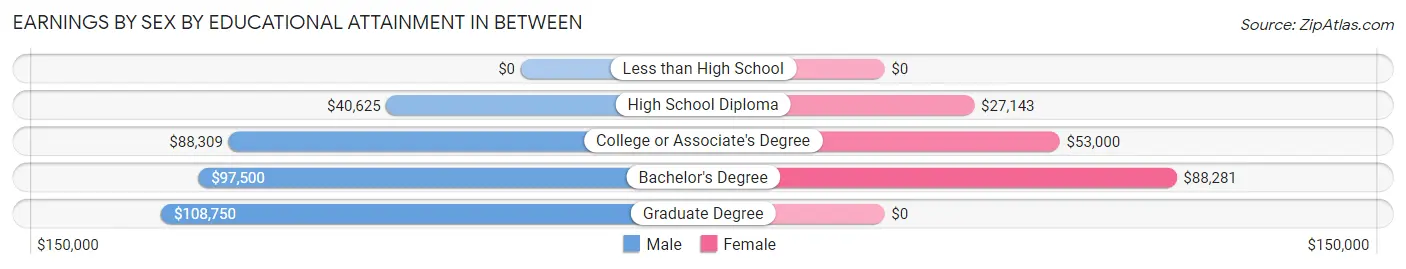
| Educational Attainment | Male Income | Female Income |
| Less than High School | - | - |
| High School Diploma | $40,625 | $27,143 |
| College or Associate's Degree | $88,309 | $53,000 |
| Bachelor's Degree | $97,500 | $88,281 |
| Graduate Degree | $108,750 | $0 |
| Total | $77,083 | $52,250 |
Family Income in Between
Family Income Brackets in Between
According to the Between family income data, there are 37 families falling into the $200,000+ income range, which is the most common income bracket and makes up 30.1% of all families.
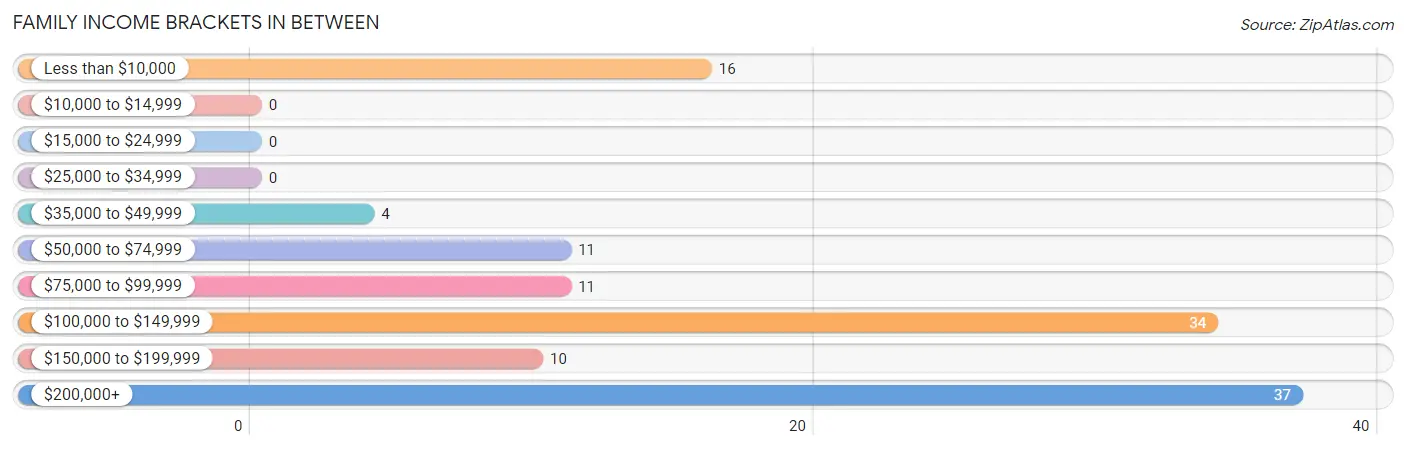
| Income Bracket | # Families | % Families |
| Less than $10,000 | 16 | 13.0% |
| $10,000 to $14,999 | 0 | 0.0% |
| $15,000 to $24,999 | 0 | 0.0% |
| $25,000 to $34,999 | 0 | 0.0% |
| $35,000 to $49,999 | 4 | 3.3% |
| $50,000 to $74,999 | 11 | 8.9% |
| $75,000 to $99,999 | 11 | 8.9% |
| $100,000 to $149,999 | 34 | 27.6% |
| $150,000 to $199,999 | 10 | 8.1% |
| $200,000+ | 37 | 30.1% |
Family Income by Famaliy Size in Between
4-person families (47 | 38.2%) account for the highest median family income in Between with $246,250 per family, while 4-person families (47 | 38.2%) have the highest median income of $61,562 per family member.
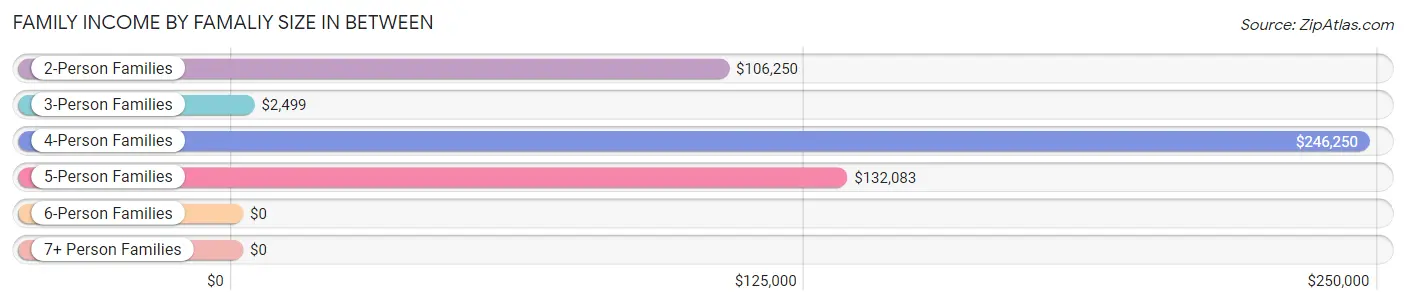
| Income Bracket | # Families | Median Income |
| 2-Person Families | 30 (24.4%) | $106,250 |
| 3-Person Families | 29 (23.6%) | $2,499 |
| 4-Person Families | 47 (38.2%) | $246,250 |
| 5-Person Families | 17 (13.8%) | $132,083 |
| 6-Person Families | 0 (0.0%) | $0 |
| 7+ Person Families | 0 (0.0%) | $0 |
| Total | 123 (100.0%) | $131,250 |
Family Income by Number of Earners in Between
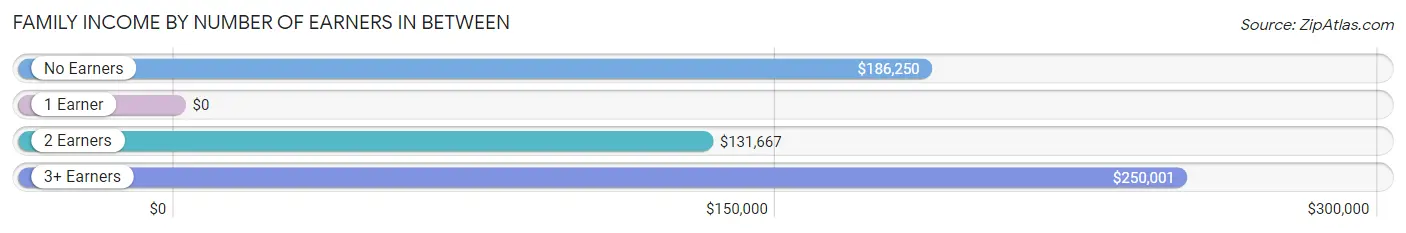
| Number of Earners | # Families | Median Income |
| No Earners | 7 (5.7%) | $186,250 |
| 1 Earner | 40 (32.5%) | $0 |
| 2 Earners | 44 (35.8%) | $131,667 |
| 3+ Earners | 32 (26.0%) | $250,001 |
| Total | 123 (100.0%) | $131,250 |
Household Income in Between
Household Income Brackets in Between
With 46 households falling in the category, the $100,000 to $149,999 income range is the most frequent in Between, accounting for 30.5% of all households.
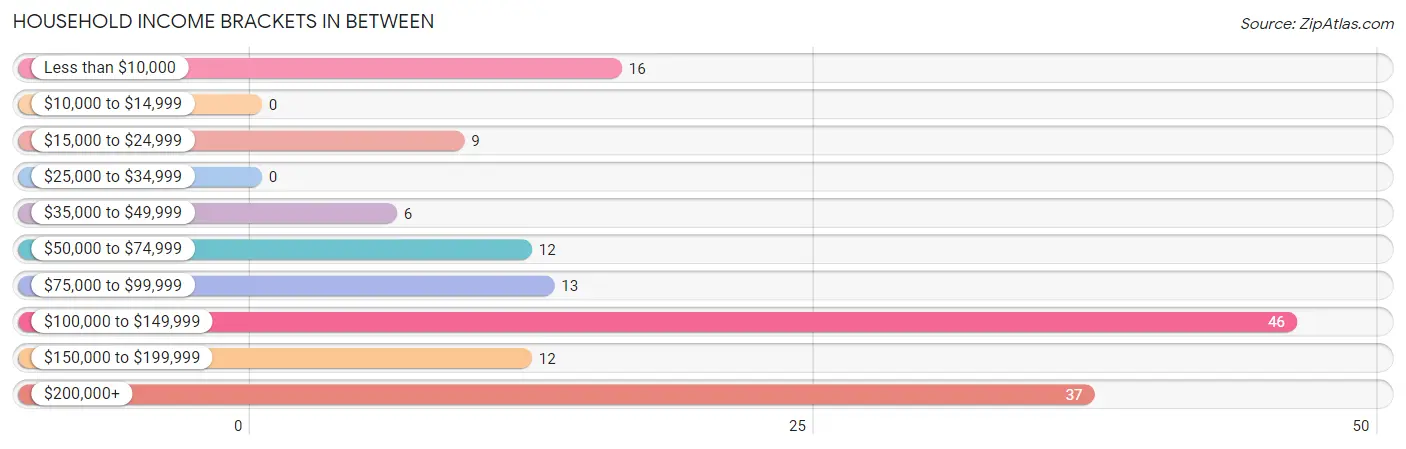
| Income Bracket | # Households | % Households |
| Less than $10,000 | 16 | 10.6% |
| $10,000 to $14,999 | 0 | 0.0% |
| $15,000 to $24,999 | 9 | 6.0% |
| $25,000 to $34,999 | 0 | 0.0% |
| $35,000 to $49,999 | 6 | 4.0% |
| $50,000 to $74,999 | 12 | 7.9% |
| $75,000 to $99,999 | 13 | 8.6% |
| $100,000 to $149,999 | 46 | 30.5% |
| $150,000 to $199,999 | 12 | 7.9% |
| $200,000+ | 37 | 24.5% |
Household Income by Householder Age in Between
The median household income in Between is $123,854, with the highest median household income of $124,167 found in the 45 to 64 years age bracket for the primary householder. A total of 82 households (54.3%) fall into this category.
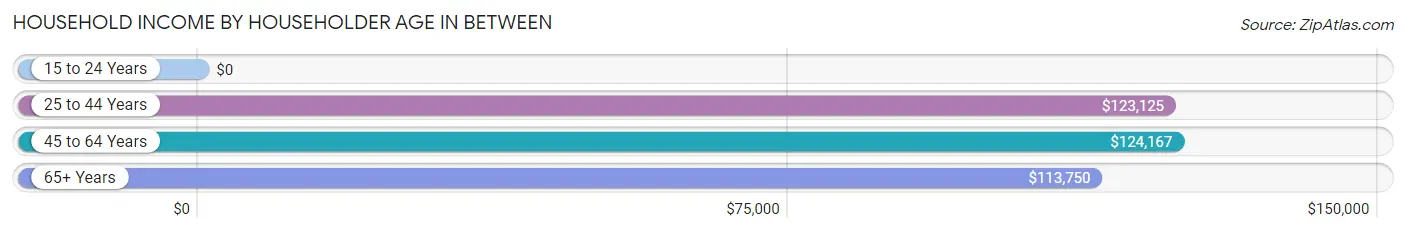
| Income Bracket | # Households | Median Income |
| 15 to 24 Years | 0 (0.0%) | $0 |
| 25 to 44 Years | 41 (27.2%) | $123,125 |
| 45 to 64 Years | 82 (54.3%) | $124,167 |
| 65+ Years | 28 (18.5%) | $113,750 |
| Total | 151 (100.0%) | $123,854 |
Poverty in Between
Income Below Poverty by Sex and Age in Between
With 10.7% poverty level for males and 5.5% for females among the residents of Between, 12 to 14 year old males and 45 to 54 year old females are the most vulnerable to poverty, with 12 males (52.2%) and 9 females (20.9%) in their respective age groups living below the poverty level.
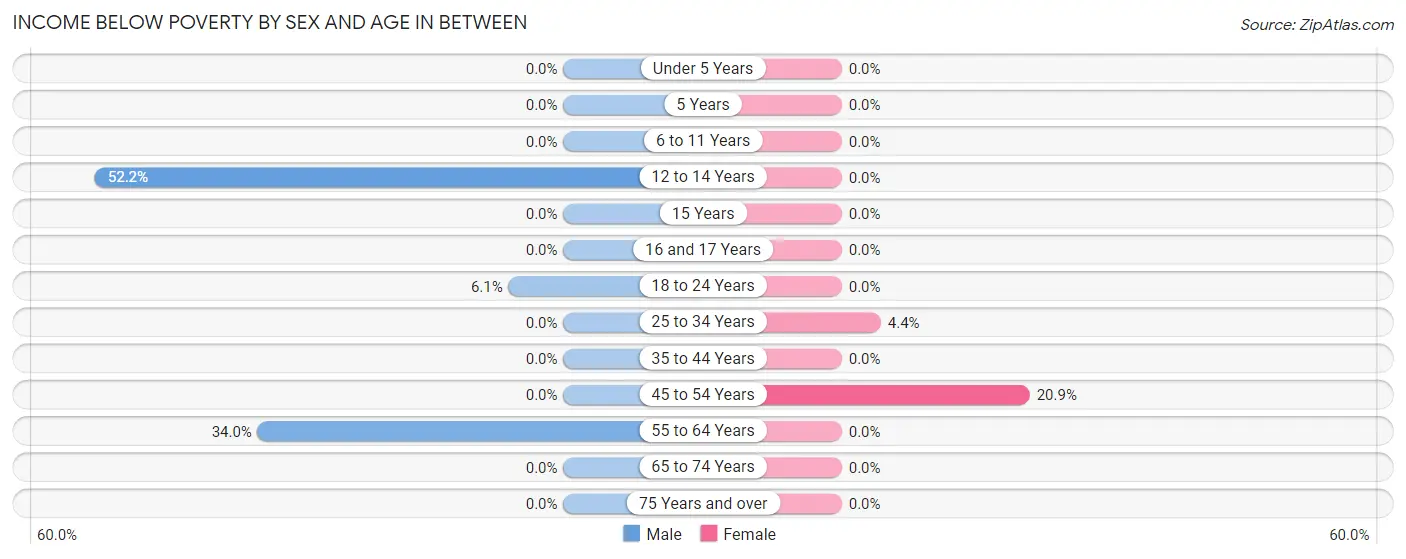
| Age Bracket | Male | Female |
| Under 5 Years | 0 (0.0%) | 0 (0.0%) |
| 5 Years | 0 (0.0%) | 0 (0.0%) |
| 6 to 11 Years | 0 (0.0%) | 0 (0.0%) |
| 12 to 14 Years | 12 (52.2%) | 0 (0.0%) |
| 15 Years | 0 (0.0%) | 0 (0.0%) |
| 16 and 17 Years | 0 (0.0%) | 0 (0.0%) |
| 18 to 24 Years | 5 (6.1%) | 0 (0.0%) |
| 25 to 34 Years | 0 (0.0%) | 1 (4.3%) |
| 35 to 44 Years | 0 (0.0%) | 0 (0.0%) |
| 45 to 54 Years | 0 (0.0%) | 9 (20.9%) |
| 55 to 64 Years | 16 (34.0%) | 0 (0.0%) |
| 65 to 74 Years | 0 (0.0%) | 0 (0.0%) |
| 75 Years and over | 0 (0.0%) | 0 (0.0%) |
| Total | 33 (10.7%) | 10 (5.5%) |
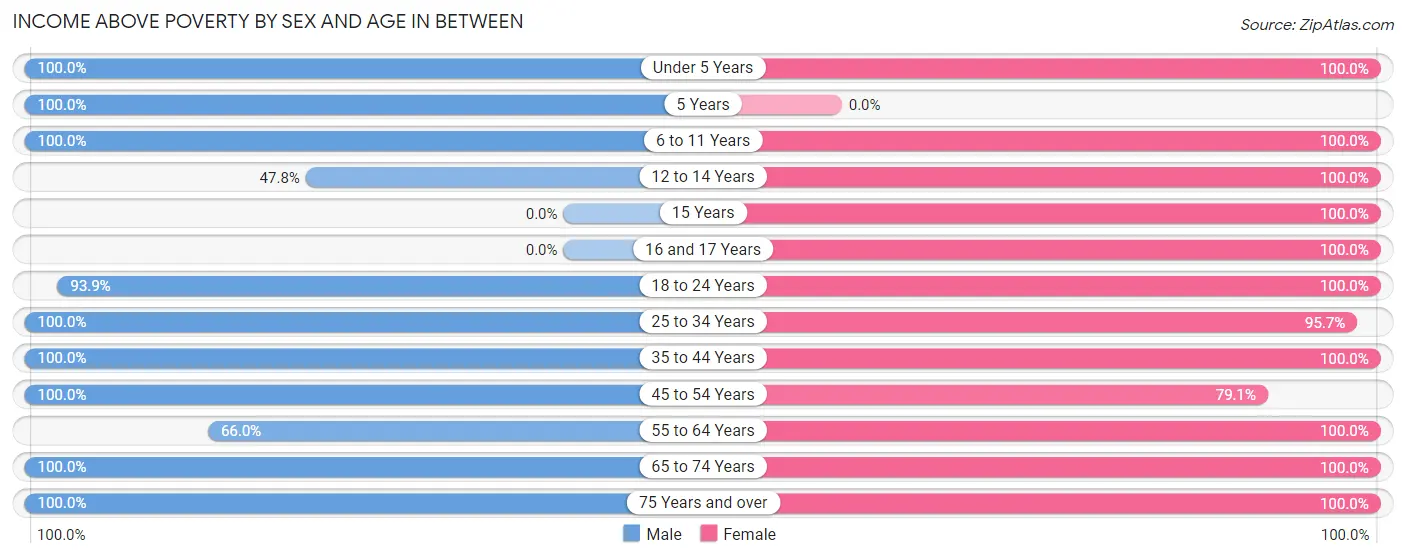
Income Above Poverty by Sex and Age in Between
According to the poverty statistics in Between, males aged under 5 years and females aged under 5 years are the age groups that are most secure financially, with 100.0% of males and 100.0% of females in these age groups living above the poverty line.
| Age Bracket | Male | Female |
| Under 5 Years | 4 (100.0%) | 6 (100.0%) |
| 5 Years | 9 (100.0%) | 0 (0.0%) |
| 6 to 11 Years | 32 (100.0%) | 8 (100.0%) |
| 12 to 14 Years | 11 (47.8%) | 8 (100.0%) |
| 15 Years | 0 (0.0%) | 7 (100.0%) |
| 16 and 17 Years | 0 (0.0%) | 1 (100.0%) |
| 18 to 24 Years | 77 (93.9%) | 3 (100.0%) |
| 25 to 34 Years | 34 (100.0%) | 22 (95.7%) |
| 35 to 44 Years | 22 (100.0%) | 32 (100.0%) |
| 45 to 54 Years | 33 (100.0%) | 34 (79.1%) |
| 55 to 64 Years | 31 (66.0%) | 24 (100.0%) |
| 65 to 74 Years | 18 (100.0%) | 19 (100.0%) |
| 75 Years and over | 5 (100.0%) | 8 (100.0%) |
| Total | 276 (89.3%) | 172 (94.5%) |
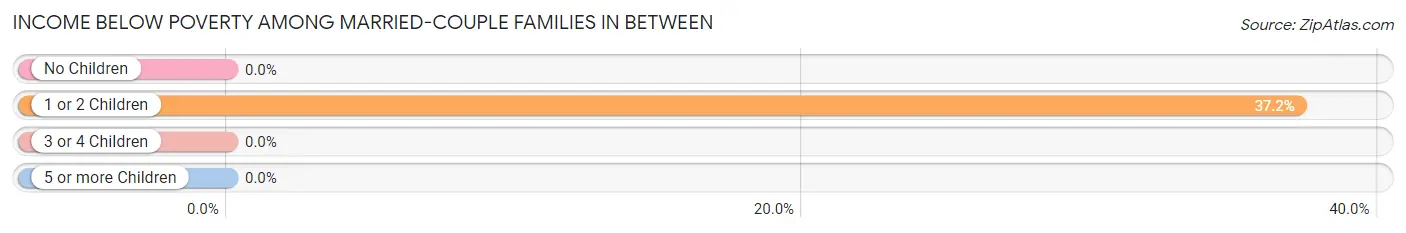
Income Below Poverty Among Married-Couple Families in Between
The poverty statistics for married-couple families in Between show that 13.9% or 16 of the total 115 families live below the poverty line. Families with 1 or 2 children have the highest poverty rate of 37.2%, comprising of 16 families. On the other hand, families with no children have the lowest poverty rate of 0.0%, which includes 0 families.
| Children | Above Poverty | Below Poverty |
| No Children | 63 (100.0%) | 0 (0.0%) |
| 1 or 2 Children | 27 (62.8%) | 16 (37.2%) |
| 3 or 4 Children | 9 (100.0%) | 0 (0.0%) |
| 5 or more Children | 0 (0.0%) | 0 (0.0%) |
| Total | 99 (86.1%) | 16 (13.9%) |
Income Below Poverty Among Single-Parent Households in Between
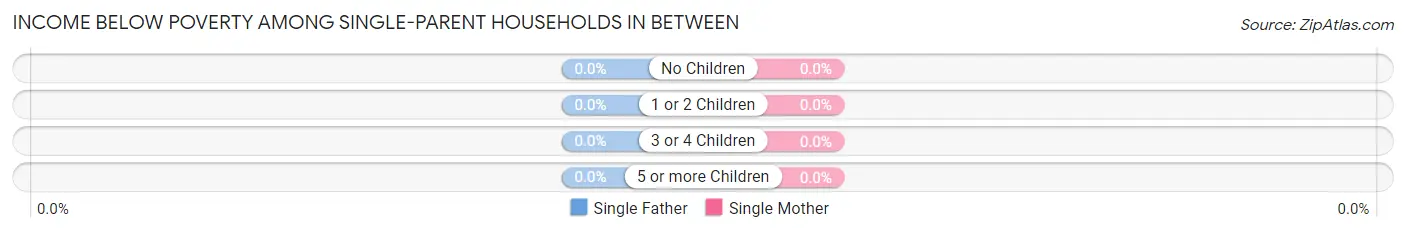
| Children | Single Father | Single Mother |
| No Children | 0 (0.0%) | 0 (0.0%) |
| 1 or 2 Children | 0 (0.0%) | 0 (0.0%) |
| 3 or 4 Children | 0 (0.0%) | 0 (0.0%) |
| 5 or more Children | 0 (0.0%) | 0 (0.0%) |
| Total | 0 (0.0%) | 0 (0.0%) |
Income Below Poverty Among Married-Couple vs Single-Parent Households in Between
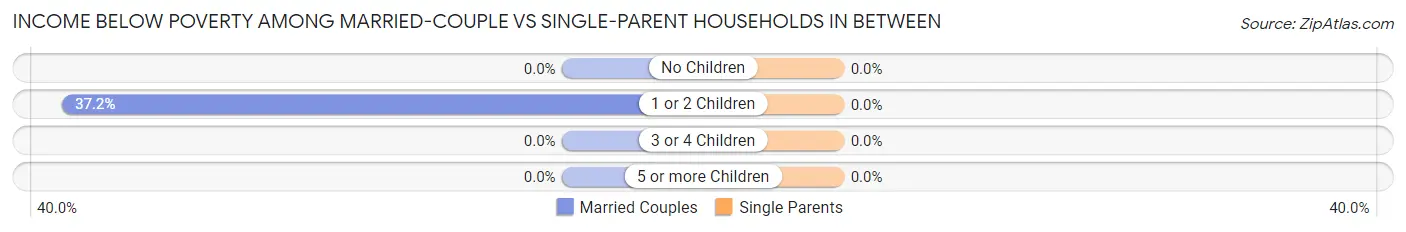
| Children | Married-Couple Families | Single-Parent Households |
| No Children | 0 (0.0%) | 0 (0.0%) |
| 1 or 2 Children | 16 (37.2%) | 0 (0.0%) |
| 3 or 4 Children | 0 (0.0%) | 0 (0.0%) |
| 5 or more Children | 0 (0.0%) | 0 (0.0%) |
| Total | 16 (13.9%) | 0 (0.0%) |
Employment Characteristics in Between
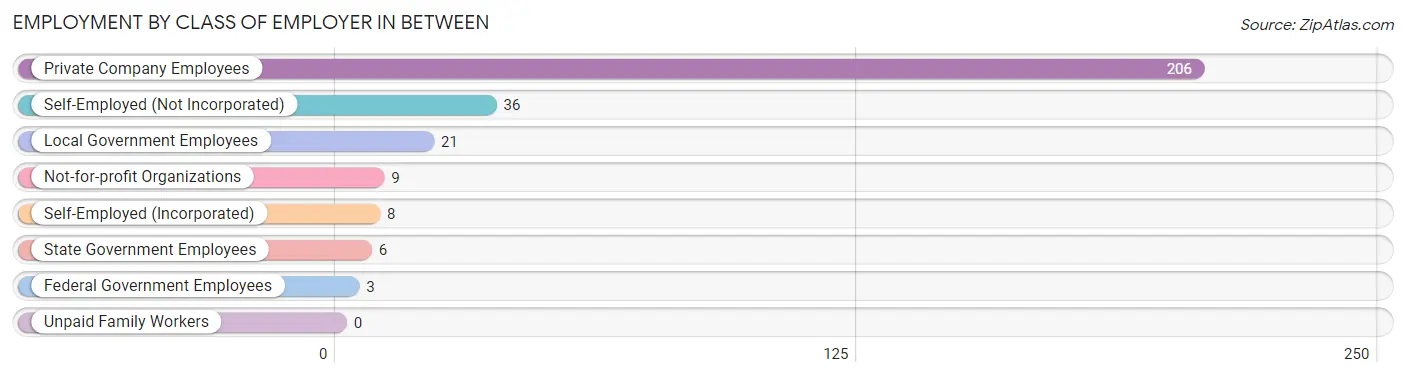
Employment by Class of Employer in Between
Among the 289 employed individuals in Between, private company employees (206 | 71.3%), self-employed (not incorporated) (36 | 12.5%), and local government employees (21 | 7.3%) make up the most common classes of employment.
| Employer Class | # Employees | % Employees |
| Private Company Employees | 206 | 71.3% |
| Self-Employed (Incorporated) | 8 | 2.8% |
| Self-Employed (Not Incorporated) | 36 | 12.5% |
| Not-for-profit Organizations | 9 | 3.1% |
| Local Government Employees | 21 | 7.3% |
| State Government Employees | 6 | 2.1% |
| Federal Government Employees | 3 | 1.0% |
| Unpaid Family Workers | 0 | 0.0% |
| Total | 289 | 100.0% |
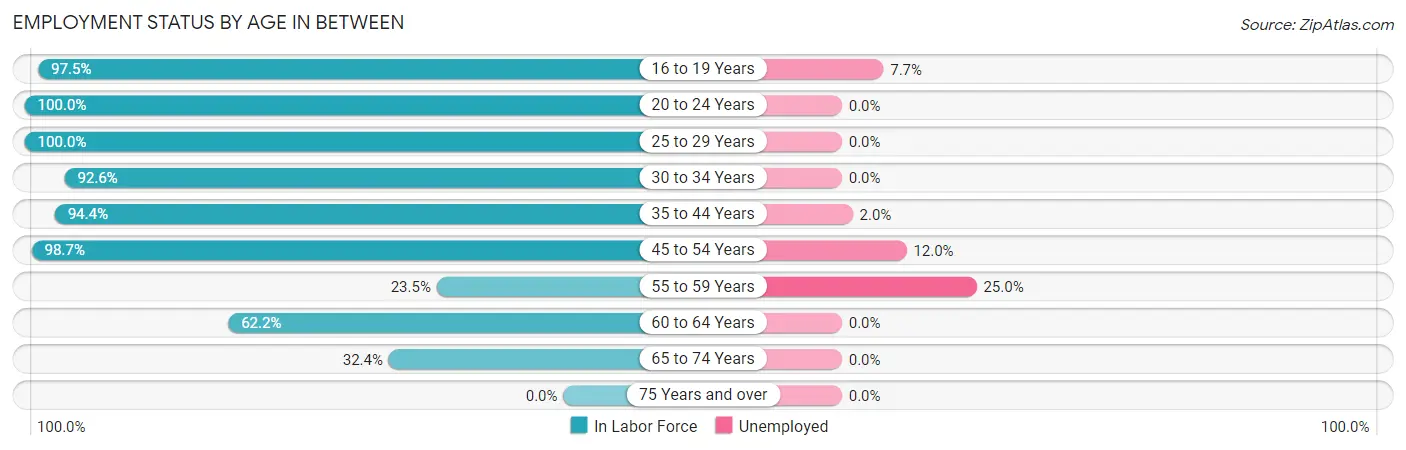
Employment Status by Age in Between
According to the labor force statistics for Between, out of the total population over 16 years of age (394), 78.4% or 309 individuals are in the labor force, with 4.9% or 15 of them unemployed. The age group with the highest labor force participation rate is 20 to 24 years, with 100.0% or 46 individuals in the labor force. Within the labor force, the 55 to 59 years age range has the highest percentage of unemployed individuals, with 25.0% or 2 of them being unemployed.
| Age Bracket | In Labor Force | Unemployed |
| 16 to 19 Years | 39 (97.5%) | 3 (7.7%) |
| 20 to 24 Years | 46 (100.0%) | 0 (0.0%) |
| 25 to 29 Years | 30 (100.0%) | 0 (0.0%) |
| 30 to 34 Years | 25 (92.6%) | 0 (0.0%) |
| 35 to 44 Years | 51 (94.4%) | 1 (2.0%) |
| 45 to 54 Years | 75 (98.7%) | 9 (12.0%) |
| 55 to 59 Years | 8 (23.5%) | 2 (25.0%) |
| 60 to 64 Years | 23 (62.2%) | 0 (0.0%) |
| 65 to 74 Years | 12 (32.4%) | 0 (0.0%) |
| 75 Years and over | 0 (0.0%) | 0 (0.0%) |
| Total | 309 (78.4%) | 15 (4.9%) |
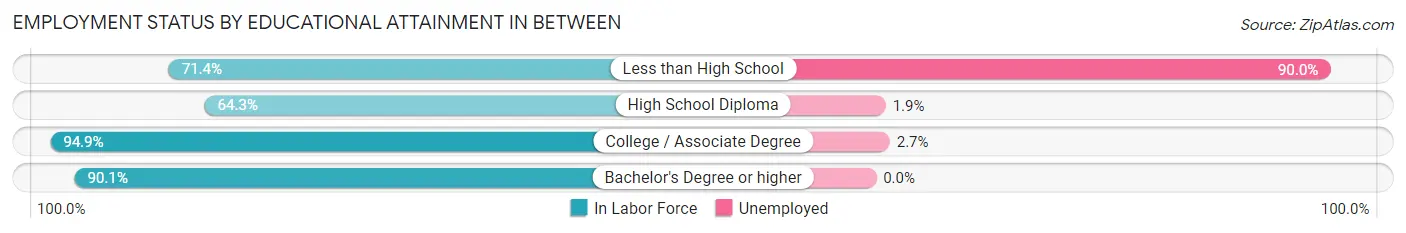
Employment Status by Educational Attainment in Between
According to labor force statistics for Between, 82.2% of individuals (212) out of the total population between 25 and 64 years of age (258) are in the labor force, with 5.7% or 12 of them being unemployed. The group with the highest labor force participation rate are those with the educational attainment of college / associate degree, with 94.9% or 75 individuals in the labor force. Within the labor force, individuals with less than high school education have the highest percentage of unemployment, with 90.0% or 9 of them being unemployed.
| Educational Attainment | In Labor Force | Unemployed |
| Less than High School | 10 (71.4%) | 13 (90.0%) |
| High School Diploma | 54 (64.3%) | 2 (1.9%) |
| College / Associate Degree | 75 (94.9%) | 2 (2.7%) |
| Bachelor's Degree or higher | 73 (90.1%) | 0 (0.0%) |
| Total | 212 (82.2%) | 15 (5.7%) |
Employment Occupations by Sex in Between
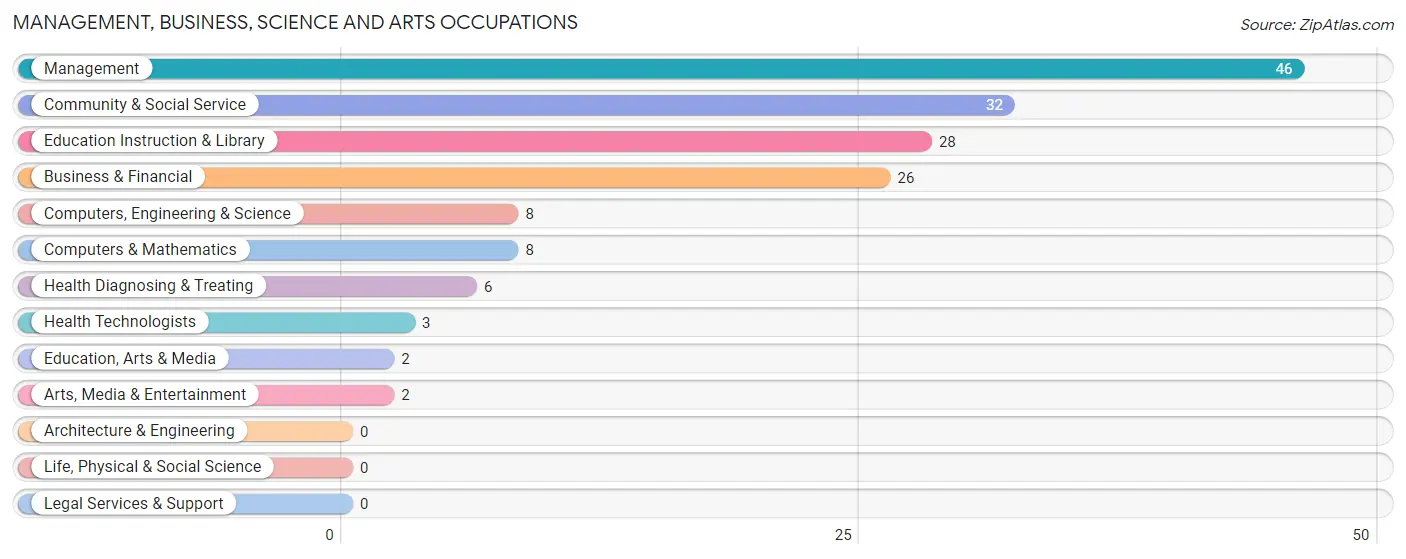
Management, Business, Science and Arts Occupations
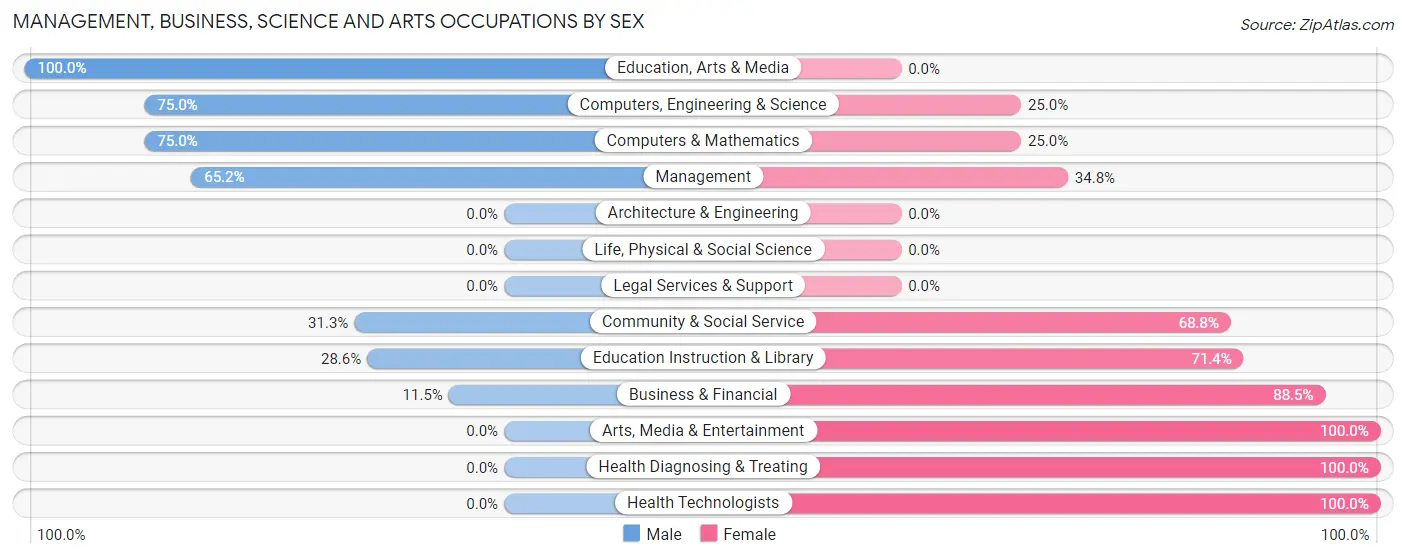
The most common Management, Business, Science and Arts occupations in Between are Management (46 | 15.7%), Community & Social Service (32 | 10.9%), Education Instruction & Library (28 | 9.5%), Business & Financial (26 | 8.8%), and Computers, Engineering & Science (8 | 2.7%).
Management, Business, Science and Arts Occupations by Sex
Within the Management, Business, Science and Arts occupations in Between, the most male-oriented occupations are Education, Arts & Media (100.0%), Computers, Engineering & Science (75.0%), and Computers & Mathematics (75.0%), while the most female-oriented occupations are Arts, Media & Entertainment (100.0%), Health Diagnosing & Treating (100.0%), and Health Technologists (100.0%).
| Occupation | Male | Female |
| Management | 30 (65.2%) | 16 (34.8%) |
| Business & Financial | 3 (11.5%) | 23 (88.5%) |
| Computers, Engineering & Science | 6 (75.0%) | 2 (25.0%) |
| Computers & Mathematics | 6 (75.0%) | 2 (25.0%) |
| Architecture & Engineering | 0 (0.0%) | 0 (0.0%) |
| Life, Physical & Social Science | 0 (0.0%) | 0 (0.0%) |
| Community & Social Service | 10 (31.2%) | 22 (68.8%) |
| Education, Arts & Media | 2 (100.0%) | 0 (0.0%) |
| Legal Services & Support | 0 (0.0%) | 0 (0.0%) |
| Education Instruction & Library | 8 (28.6%) | 20 (71.4%) |
| Arts, Media & Entertainment | 0 (0.0%) | 2 (100.0%) |
| Health Diagnosing & Treating | 0 (0.0%) | 6 (100.0%) |
| Health Technologists | 0 (0.0%) | 3 (100.0%) |
| Total (Category) | 49 (41.5%) | 69 (58.5%) |
| Total (Overall) | 194 (66.0%) | 100 (34.0%) |
Services Occupations
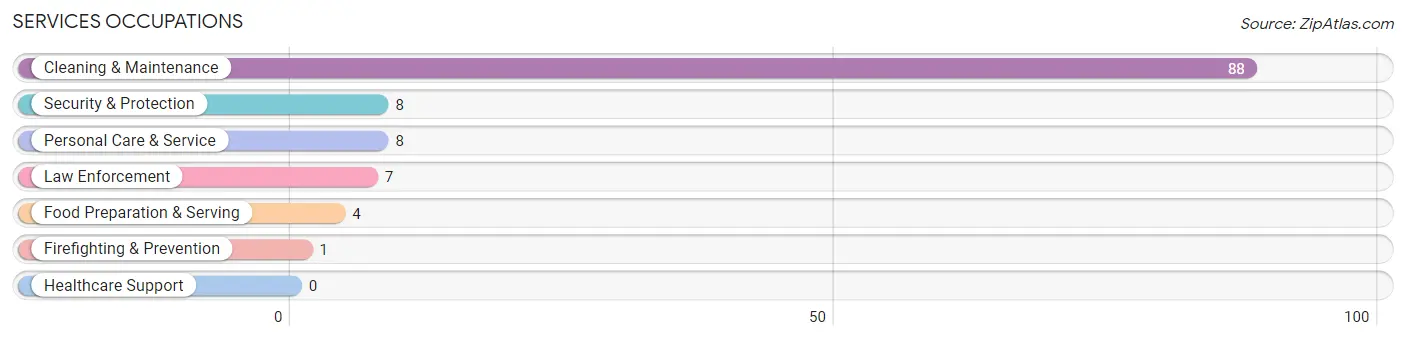
The most common Services occupations in Between are Cleaning & Maintenance (88 | 29.9%), Security & Protection (8 | 2.7%), Personal Care & Service (8 | 2.7%), Law Enforcement (7 | 2.4%), and Food Preparation & Serving (4 | 1.4%).
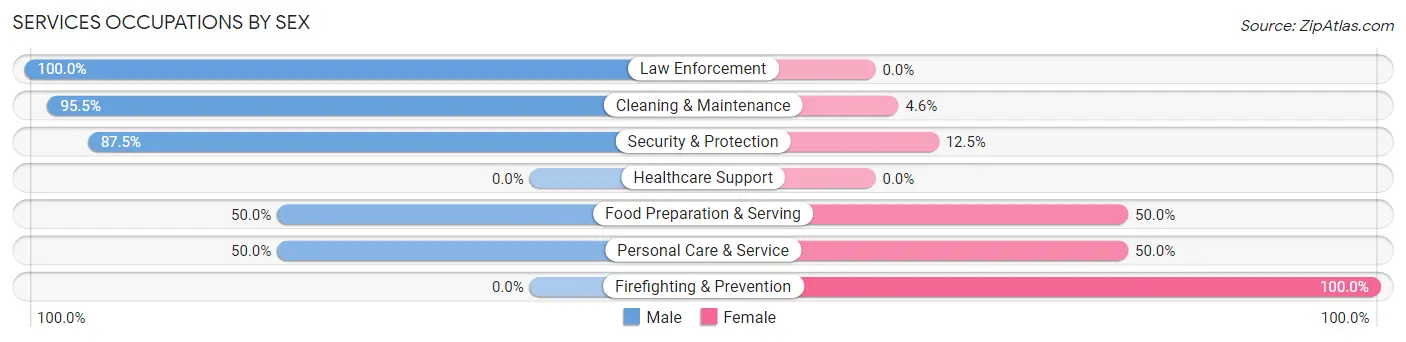
Services Occupations by Sex
Within the Services occupations in Between, the most male-oriented occupations are Law Enforcement (100.0%), Cleaning & Maintenance (95.5%), and Security & Protection (87.5%), while the most female-oriented occupations are Firefighting & Prevention (100.0%), Food Preparation & Serving (50.0%), and Personal Care & Service (50.0%).
| Occupation | Male | Female |
| Healthcare Support | 0 (0.0%) | 0 (0.0%) |
| Security & Protection | 7 (87.5%) | 1 (12.5%) |
| Firefighting & Prevention | 0 (0.0%) | 1 (100.0%) |
| Law Enforcement | 7 (100.0%) | 0 (0.0%) |
| Food Preparation & Serving | 2 (50.0%) | 2 (50.0%) |
| Cleaning & Maintenance | 84 (95.5%) | 4 (4.5%) |
| Personal Care & Service | 4 (50.0%) | 4 (50.0%) |
| Total (Category) | 97 (89.8%) | 11 (10.2%) |
| Total (Overall) | 194 (66.0%) | 100 (34.0%) |
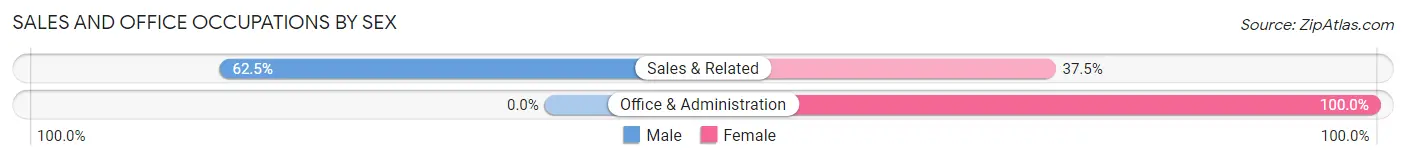
Sales and Office Occupations
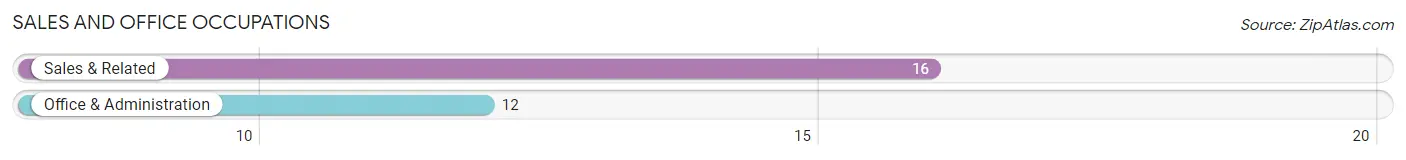
The most common Sales and Office occupations in Between are Sales & Related (16 | 5.4%), and Office & Administration (12 | 4.1%).
Sales and Office Occupations by Sex
| Occupation | Male | Female |
| Sales & Related | 10 (62.5%) | 6 (37.5%) |
| Office & Administration | 0 (0.0%) | 12 (100.0%) |
| Total (Category) | 10 (35.7%) | 18 (64.3%) |
| Total (Overall) | 194 (66.0%) | 100 (34.0%) |
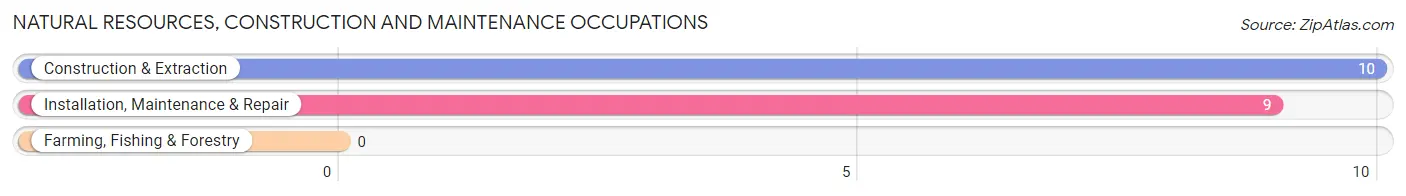
Natural Resources, Construction and Maintenance Occupations
The most common Natural Resources, Construction and Maintenance occupations in Between are Construction & Extraction (10 | 3.4%), and Installation, Maintenance & Repair (9 | 3.1%).
Natural Resources, Construction and Maintenance Occupations by Sex
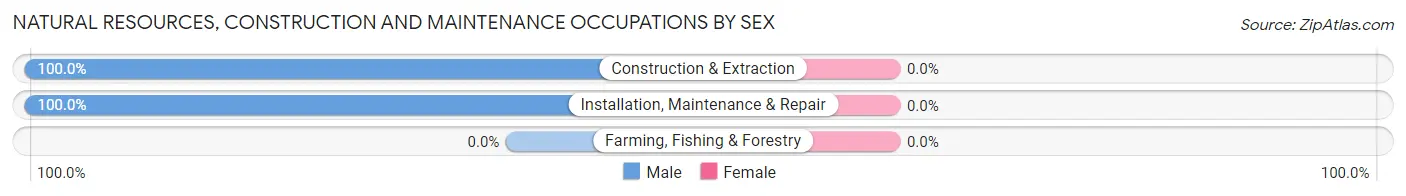
| Occupation | Male | Female |
| Farming, Fishing & Forestry | 0 (0.0%) | 0 (0.0%) |
| Construction & Extraction | 10 (100.0%) | 0 (0.0%) |
| Installation, Maintenance & Repair | 9 (100.0%) | 0 (0.0%) |
| Total (Category) | 19 (100.0%) | 0 (0.0%) |
| Total (Overall) | 194 (66.0%) | 100 (34.0%) |
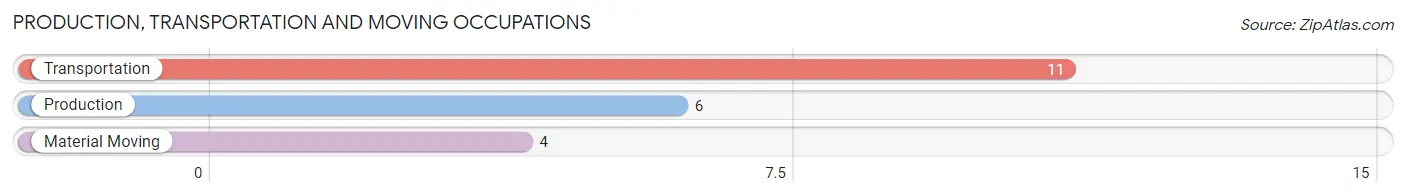
Production, Transportation and Moving Occupations
The most common Production, Transportation and Moving occupations in Between are Transportation (11 | 3.7%), Production (6 | 2.0%), and Material Moving (4 | 1.4%).
Production, Transportation and Moving Occupations by Sex
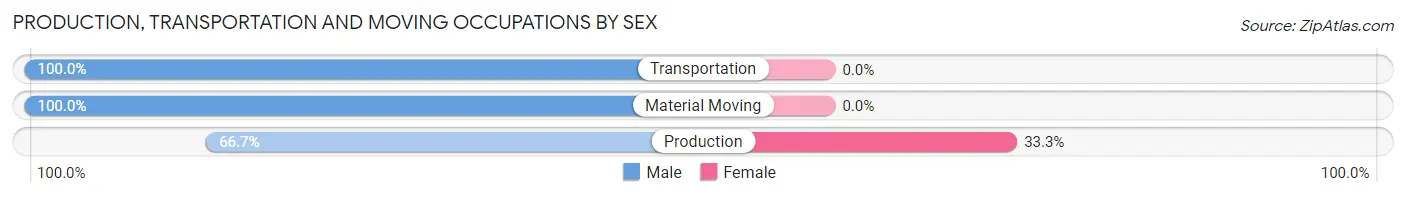
| Occupation | Male | Female |
| Production | 4 (66.7%) | 2 (33.3%) |
| Transportation | 11 (100.0%) | 0 (0.0%) |
| Material Moving | 4 (100.0%) | 0 (0.0%) |
| Total (Category) | 19 (90.5%) | 2 (9.5%) |
| Total (Overall) | 194 (66.0%) | 100 (34.0%) |
Employment Industries by Sex in Between
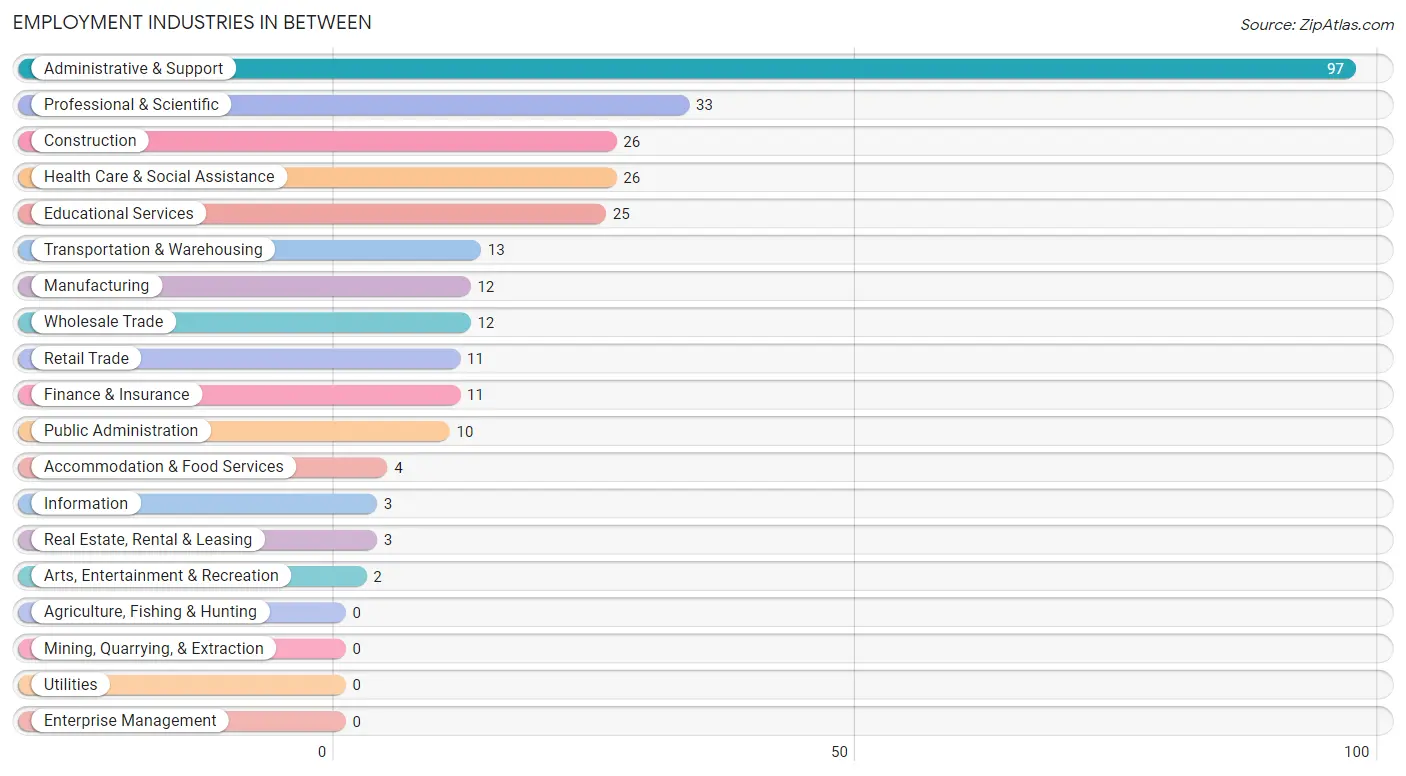
Employment Industries in Between
The major employment industries in Between include Administrative & Support (97 | 33.0%), Professional & Scientific (33 | 11.2%), Construction (26 | 8.8%), Health Care & Social Assistance (26 | 8.8%), and Educational Services (25 | 8.5%).
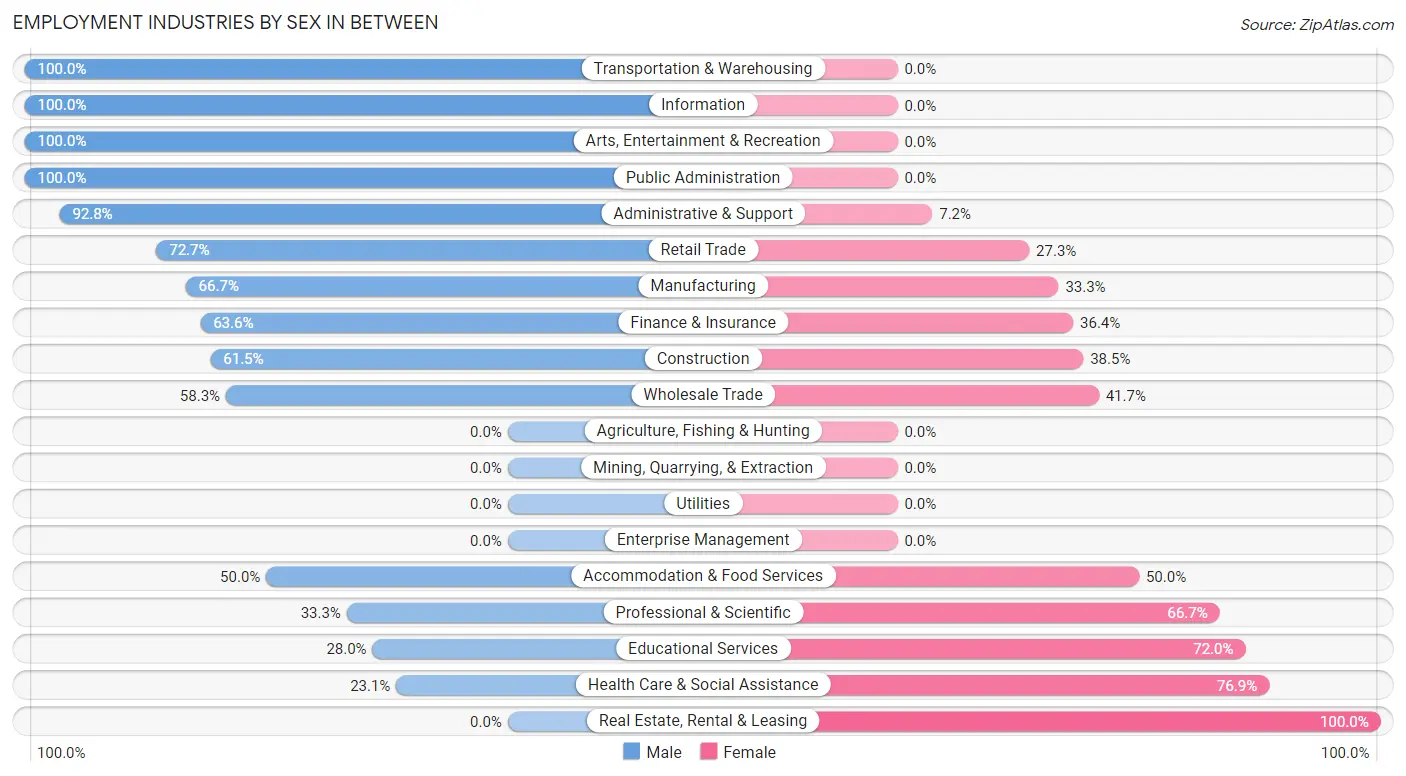
Employment Industries by Sex in Between
The Between industries that see more men than women are Transportation & Warehousing (100.0%), Information (100.0%), and Arts, Entertainment & Recreation (100.0%), whereas the industries that tend to have a higher number of women are Real Estate, Rental & Leasing (100.0%), Health Care & Social Assistance (76.9%), and Educational Services (72.0%).
| Industry | Male | Female |
| Agriculture, Fishing & Hunting | 0 (0.0%) | 0 (0.0%) |
| Mining, Quarrying, & Extraction | 0 (0.0%) | 0 (0.0%) |
| Construction | 16 (61.5%) | 10 (38.5%) |
| Manufacturing | 8 (66.7%) | 4 (33.3%) |
| Wholesale Trade | 7 (58.3%) | 5 (41.7%) |
| Retail Trade | 8 (72.7%) | 3 (27.3%) |
| Transportation & Warehousing | 13 (100.0%) | 0 (0.0%) |
| Utilities | 0 (0.0%) | 0 (0.0%) |
| Information | 3 (100.0%) | 0 (0.0%) |
| Finance & Insurance | 7 (63.6%) | 4 (36.4%) |
| Real Estate, Rental & Leasing | 0 (0.0%) | 3 (100.0%) |
| Professional & Scientific | 11 (33.3%) | 22 (66.7%) |
| Enterprise Management | 0 (0.0%) | 0 (0.0%) |
| Administrative & Support | 90 (92.8%) | 7 (7.2%) |
| Educational Services | 7 (28.0%) | 18 (72.0%) |
| Health Care & Social Assistance | 6 (23.1%) | 20 (76.9%) |
| Arts, Entertainment & Recreation | 2 (100.0%) | 0 (0.0%) |
| Accommodation & Food Services | 2 (50.0%) | 2 (50.0%) |
| Public Administration | 10 (100.0%) | 0 (0.0%) |
| Total | 194 (66.0%) | 100 (34.0%) |
Education in Between
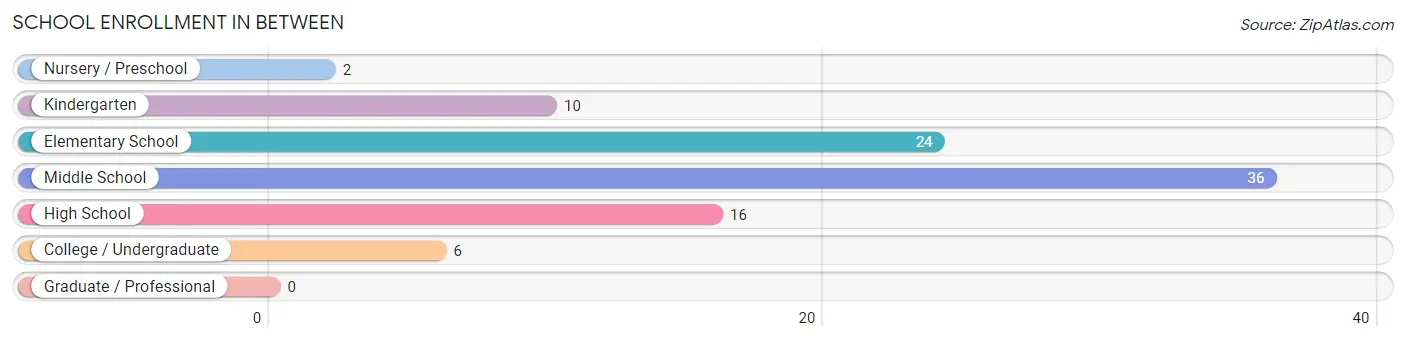
School Enrollment in Between
The most common levels of schooling among the 94 students in Between are middle school (36 | 38.3%), elementary school (24 | 25.5%), and high school (16 | 17.0%).
| School Level | # Students | % Students |
| Nursery / Preschool | 2 | 2.1% |
| Kindergarten | 10 | 10.6% |
| Elementary School | 24 | 25.5% |
| Middle School | 36 | 38.3% |
| High School | 16 | 17.0% |
| College / Undergraduate | 6 | 6.4% |
| Graduate / Professional | 0 | 0.0% |
| Total | 94 | 100.0% |
School Enrollment by Age by Funding Source in Between
Out of a total of 94 students who are enrolled in schools in Between, 28 (29.8%) attend a private institution, while the remaining 66 (70.2%) are enrolled in public schools. The age group of 5 to 9 year old has the highest likelihood of being enrolled in private schools, with 20 (55.6% in the age bracket) enrolled. Conversely, the age group of 18 to 19 year olds has the lowest likelihood of being enrolled in a private school, with 11 (100.0% in the age bracket) attending a public institution.
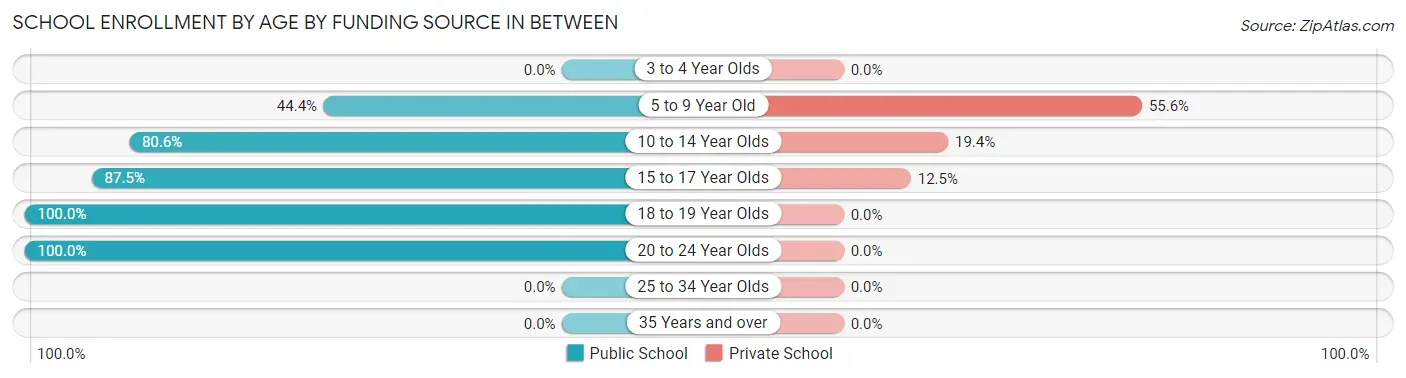
| Age Bracket | Public School | Private School |
| 3 to 4 Year Olds | 0 (0.0%) | 0 (0.0%) |
| 5 to 9 Year Old | 16 (44.4%) | 20 (55.6%) |
| 10 to 14 Year Olds | 29 (80.6%) | 7 (19.4%) |
| 15 to 17 Year Olds | 7 (87.5%) | 1 (12.5%) |
| 18 to 19 Year Olds | 11 (100.0%) | 0 (0.0%) |
| 20 to 24 Year Olds | 3 (100.0%) | 0 (0.0%) |
| 25 to 34 Year Olds | 0 (0.0%) | 0 (0.0%) |
| 35 Years and over | 0 (0.0%) | 0 (0.0%) |
| Total | 66 (70.2%) | 28 (29.8%) |
Educational Attainment by Field of Study in Between
Business (42 | 41.6%), education (22 | 21.8%), social sciences (6 | 5.9%), engineering (6 | 5.9%), and liberal arts & history (6 | 5.9%) are the most common fields of study among 101 individuals in Between who have obtained a bachelor's degree or higher.
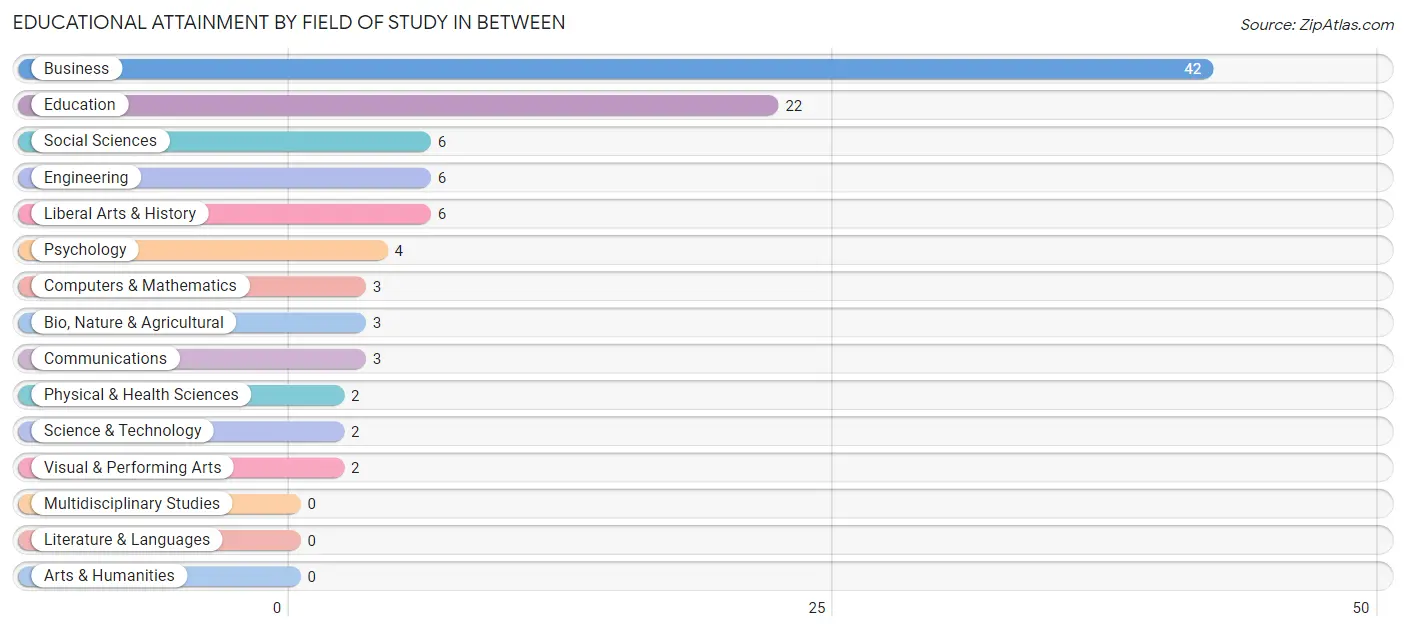
| Field of Study | # Graduates | % Graduates |
| Computers & Mathematics | 3 | 3.0% |
| Bio, Nature & Agricultural | 3 | 3.0% |
| Physical & Health Sciences | 2 | 2.0% |
| Psychology | 4 | 4.0% |
| Social Sciences | 6 | 5.9% |
| Engineering | 6 | 5.9% |
| Multidisciplinary Studies | 0 | 0.0% |
| Science & Technology | 2 | 2.0% |
| Business | 42 | 41.6% |
| Education | 22 | 21.8% |
| Literature & Languages | 0 | 0.0% |
| Liberal Arts & History | 6 | 5.9% |
| Visual & Performing Arts | 2 | 2.0% |
| Communications | 3 | 3.0% |
| Arts & Humanities | 0 | 0.0% |
| Total | 101 | 100.0% |
Transportation & Commute in Between
Vehicle Availability by Sex in Between
The most prevalent vehicle ownership categories in Between are males with 5 or more vehicles (96, accounting for 50.8%) and females with 5 or more vehicles (20, making up 96.0%).
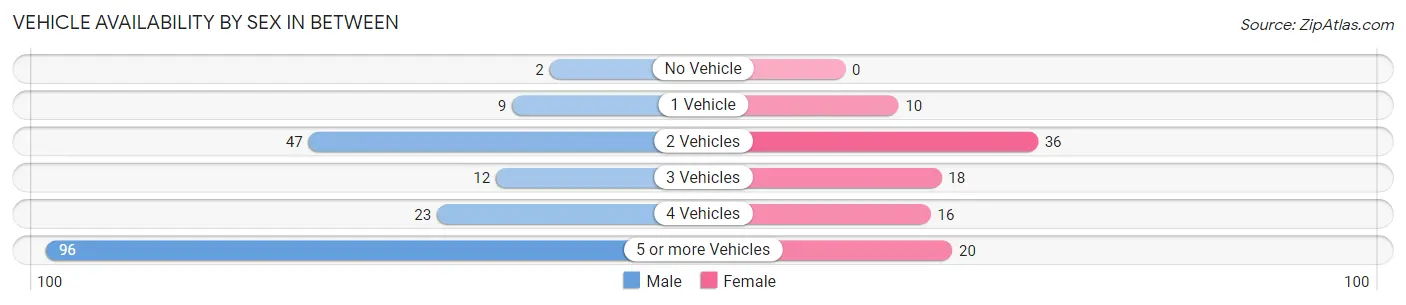
| Vehicles Available | Male | Female |
| No Vehicle | 2 (1.1%) | 0 (0.0%) |
| 1 Vehicle | 9 (4.8%) | 10 (10.0%) |
| 2 Vehicles | 47 (24.9%) | 36 (36.0%) |
| 3 Vehicles | 12 (6.4%) | 18 (18.0%) |
| 4 Vehicles | 23 (12.2%) | 16 (16.0%) |
| 5 or more Vehicles | 96 (50.8%) | 20 (20.0%) |
| Total | 189 (100.0%) | 100 (100.0%) |
Commute Time in Between
The most frequently occuring commute durations in Between are 30 to 34 minutes (38 commuters, 24.5%), 5 to 9 minutes (32 commuters, 20.6%), and 45 to 59 minutes (22 commuters, 14.2%).
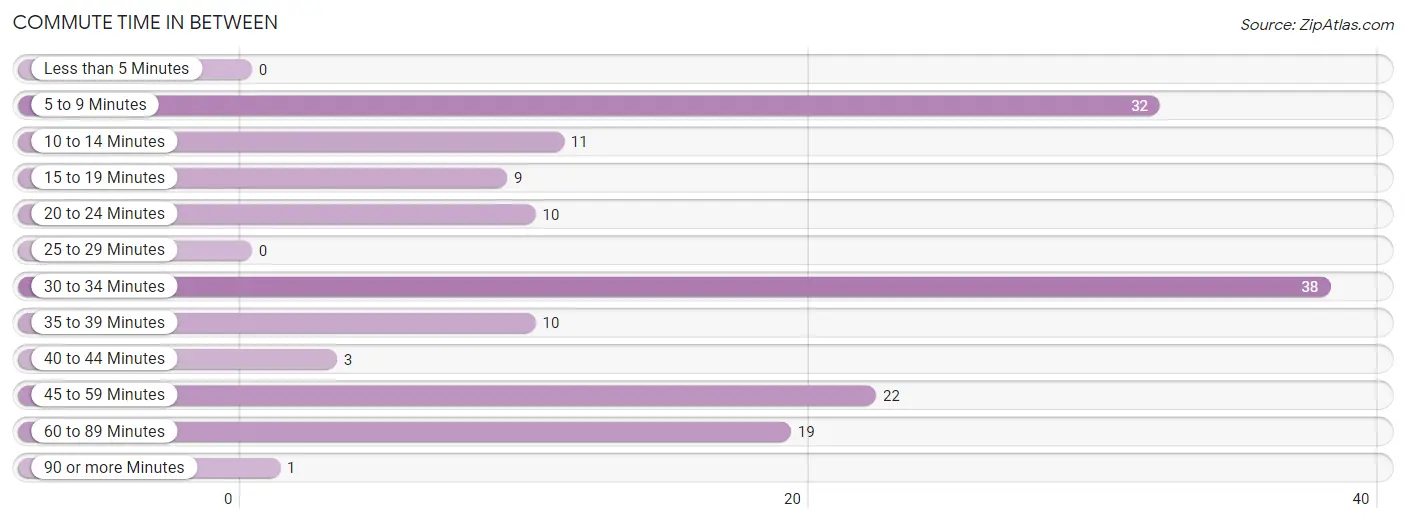
| Commute Time | # Commuters | % Commuters |
| Less than 5 Minutes | 0 | 0.0% |
| 5 to 9 Minutes | 32 | 20.6% |
| 10 to 14 Minutes | 11 | 7.1% |
| 15 to 19 Minutes | 9 | 5.8% |
| 20 to 24 Minutes | 10 | 6.5% |
| 25 to 29 Minutes | 0 | 0.0% |
| 30 to 34 Minutes | 38 | 24.5% |
| 35 to 39 Minutes | 10 | 6.5% |
| 40 to 44 Minutes | 3 | 1.9% |
| 45 to 59 Minutes | 22 | 14.2% |
| 60 to 89 Minutes | 19 | 12.3% |
| 90 or more Minutes | 1 | 0.6% |
Commute Time by Sex in Between
The most common commute times in Between are 45 to 59 minutes (21 commuters, 24.1%) for males and 5 to 9 minutes (22 commuters, 32.4%) for females.
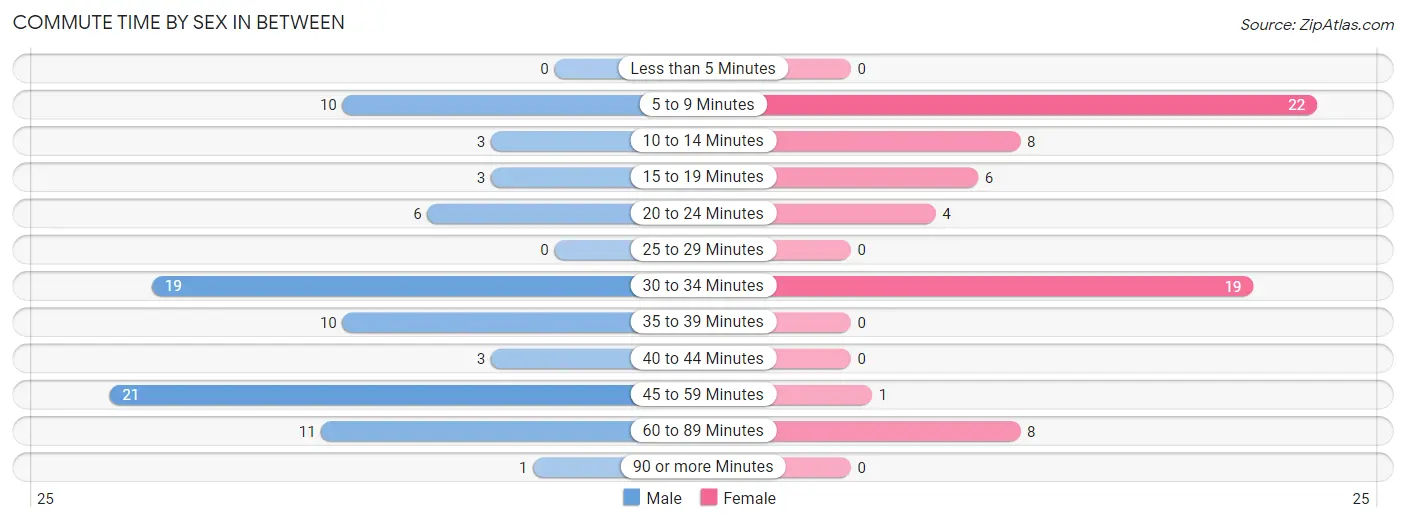
| Commute Time | Male | Female |
| Less than 5 Minutes | 0 (0.0%) | 0 (0.0%) |
| 5 to 9 Minutes | 10 (11.5%) | 22 (32.4%) |
| 10 to 14 Minutes | 3 (3.5%) | 8 (11.8%) |
| 15 to 19 Minutes | 3 (3.5%) | 6 (8.8%) |
| 20 to 24 Minutes | 6 (6.9%) | 4 (5.9%) |
| 25 to 29 Minutes | 0 (0.0%) | 0 (0.0%) |
| 30 to 34 Minutes | 19 (21.8%) | 19 (27.9%) |
| 35 to 39 Minutes | 10 (11.5%) | 0 (0.0%) |
| 40 to 44 Minutes | 3 (3.5%) | 0 (0.0%) |
| 45 to 59 Minutes | 21 (24.1%) | 1 (1.5%) |
| 60 to 89 Minutes | 11 (12.6%) | 8 (11.8%) |
| 90 or more Minutes | 1 (1.1%) | 0 (0.0%) |
Time of Departure to Work by Sex in Between
The most frequent times of departure to work in Between are 7:00 AM to 7:29 AM (21, 24.1%) for males and 6:30 AM to 6:59 AM (19, 27.9%) for females.
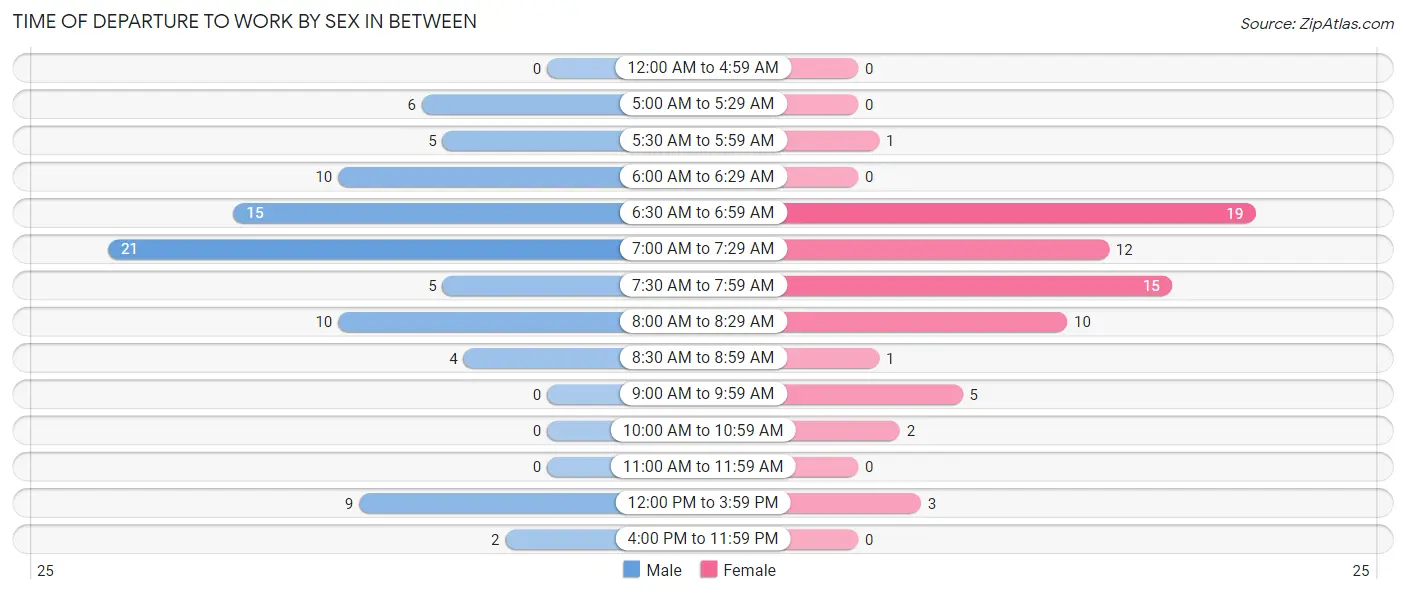
| Time of Departure | Male | Female |
| 12:00 AM to 4:59 AM | 0 (0.0%) | 0 (0.0%) |
| 5:00 AM to 5:29 AM | 6 (6.9%) | 0 (0.0%) |
| 5:30 AM to 5:59 AM | 5 (5.8%) | 1 (1.5%) |
| 6:00 AM to 6:29 AM | 10 (11.5%) | 0 (0.0%) |
| 6:30 AM to 6:59 AM | 15 (17.2%) | 19 (27.9%) |
| 7:00 AM to 7:29 AM | 21 (24.1%) | 12 (17.6%) |
| 7:30 AM to 7:59 AM | 5 (5.8%) | 15 (22.1%) |
| 8:00 AM to 8:29 AM | 10 (11.5%) | 10 (14.7%) |
| 8:30 AM to 8:59 AM | 4 (4.6%) | 1 (1.5%) |
| 9:00 AM to 9:59 AM | 0 (0.0%) | 5 (7.3%) |
| 10:00 AM to 10:59 AM | 0 (0.0%) | 2 (2.9%) |
| 11:00 AM to 11:59 AM | 0 (0.0%) | 0 (0.0%) |
| 12:00 PM to 3:59 PM | 9 (10.3%) | 3 (4.4%) |
| 4:00 PM to 11:59 PM | 2 (2.3%) | 0 (0.0%) |
| Total | 87 (100.0%) | 68 (100.0%) |
Housing Occupancy in Between
Occupancy by Ownership in Between
Of the total 151 dwellings in Between, owner-occupied units account for 130 (86.1%), while renter-occupied units make up 21 (13.9%).
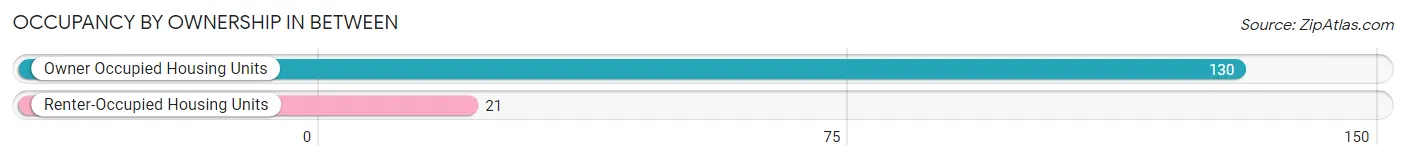
| Occupancy | # Housing Units | % Housing Units |
| Owner Occupied Housing Units | 130 | 86.1% |
| Renter-Occupied Housing Units | 21 | 13.9% |
| Total Occupied Housing Units | 151 | 100.0% |
Occupancy by Household Size in Between
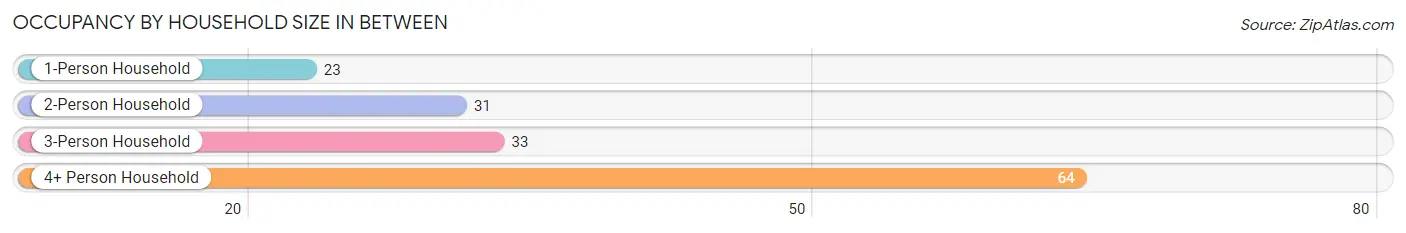
| Household Size | # Housing Units | % Housing Units |
| 1-Person Household | 23 | 15.2% |
| 2-Person Household | 31 | 20.5% |
| 3-Person Household | 33 | 21.8% |
| 4+ Person Household | 64 | 42.4% |
| Total Housing Units | 151 | 100.0% |
Occupancy by Ownership by Household Size in Between
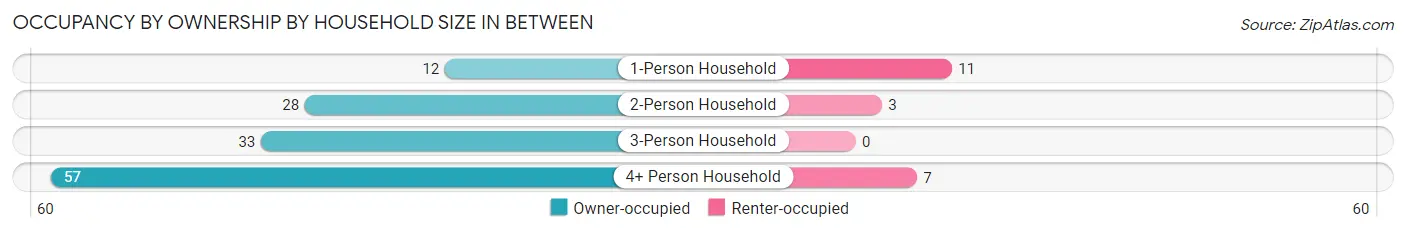
| Household Size | Owner-occupied | Renter-occupied |
| 1-Person Household | 12 (52.2%) | 11 (47.8%) |
| 2-Person Household | 28 (90.3%) | 3 (9.7%) |
| 3-Person Household | 33 (100.0%) | 0 (0.0%) |
| 4+ Person Household | 57 (89.1%) | 7 (10.9%) |
| Total Housing Units | 130 (86.1%) | 21 (13.9%) |
Occupancy by Educational Attainment in Between
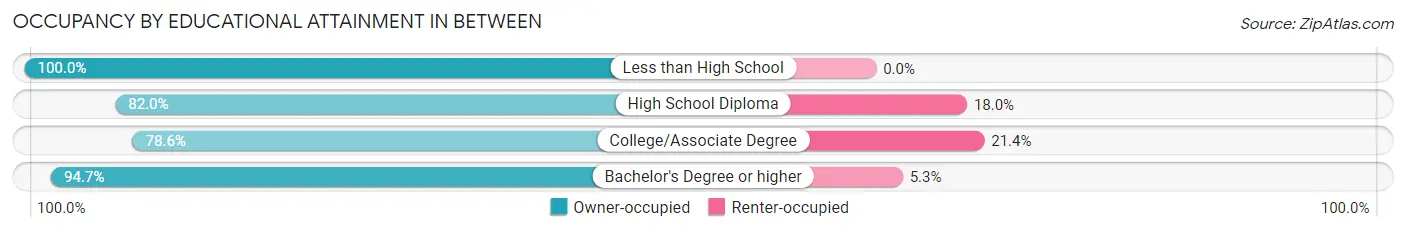
| Household Size | Owner-occupied | Renter-occupied |
| Less than High School | 2 (100.0%) | 0 (0.0%) |
| High School Diploma | 41 (82.0%) | 9 (18.0%) |
| College/Associate Degree | 33 (78.6%) | 9 (21.4%) |
| Bachelor's Degree or higher | 54 (94.7%) | 3 (5.3%) |
Occupancy by Age of Householder in Between
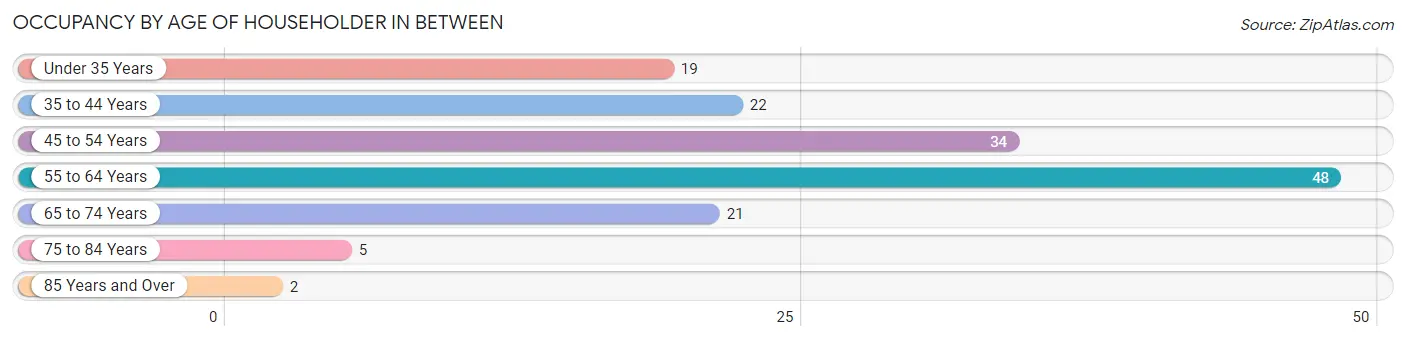
| Age Bracket | # Households | % Households |
| Under 35 Years | 19 | 12.6% |
| 35 to 44 Years | 22 | 14.6% |
| 45 to 54 Years | 34 | 22.5% |
| 55 to 64 Years | 48 | 31.8% |
| 65 to 74 Years | 21 | 13.9% |
| 75 to 84 Years | 5 | 3.3% |
| 85 Years and Over | 2 | 1.3% |
| Total | 151 | 100.0% |
Housing Finances in Between
Median Income by Occupancy in Between
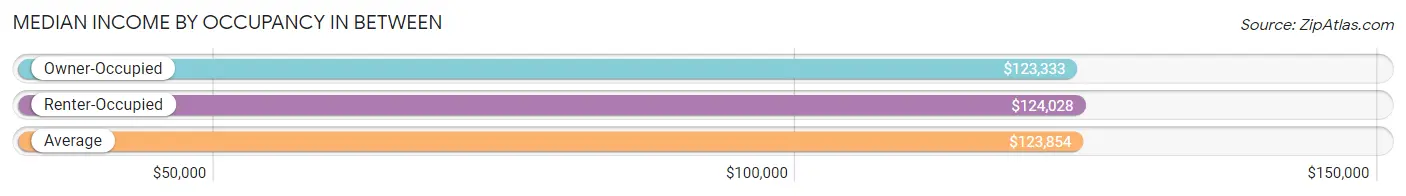
| Occupancy Type | # Households | Median Income |
| Owner-Occupied | 130 (86.1%) | $123,333 |
| Renter-Occupied | 21 (13.9%) | $124,028 |
| Average | 151 (100.0%) | $123,854 |
Occupancy by Householder Income Bracket in Between
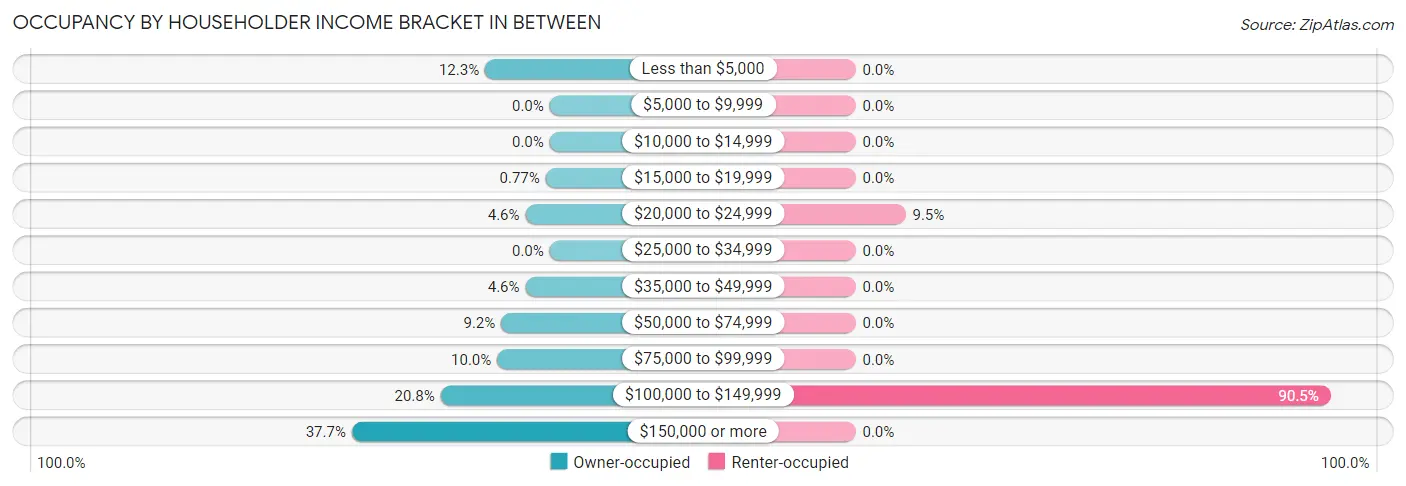
| Income Bracket | Owner-occupied | Renter-occupied |
| Less than $5,000 | 16 (12.3%) | 0 (0.0%) |
| $5,000 to $9,999 | 0 (0.0%) | 0 (0.0%) |
| $10,000 to $14,999 | 0 (0.0%) | 0 (0.0%) |
| $15,000 to $19,999 | 1 (0.8%) | 0 (0.0%) |
| $20,000 to $24,999 | 6 (4.6%) | 2 (9.5%) |
| $25,000 to $34,999 | 0 (0.0%) | 0 (0.0%) |
| $35,000 to $49,999 | 6 (4.6%) | 0 (0.0%) |
| $50,000 to $74,999 | 12 (9.2%) | 0 (0.0%) |
| $75,000 to $99,999 | 13 (10.0%) | 0 (0.0%) |
| $100,000 to $149,999 | 27 (20.8%) | 19 (90.5%) |
| $150,000 or more | 49 (37.7%) | 0 (0.0%) |
| Total | 130 (100.0%) | 21 (100.0%) |
Monthly Housing Cost Tiers in Between
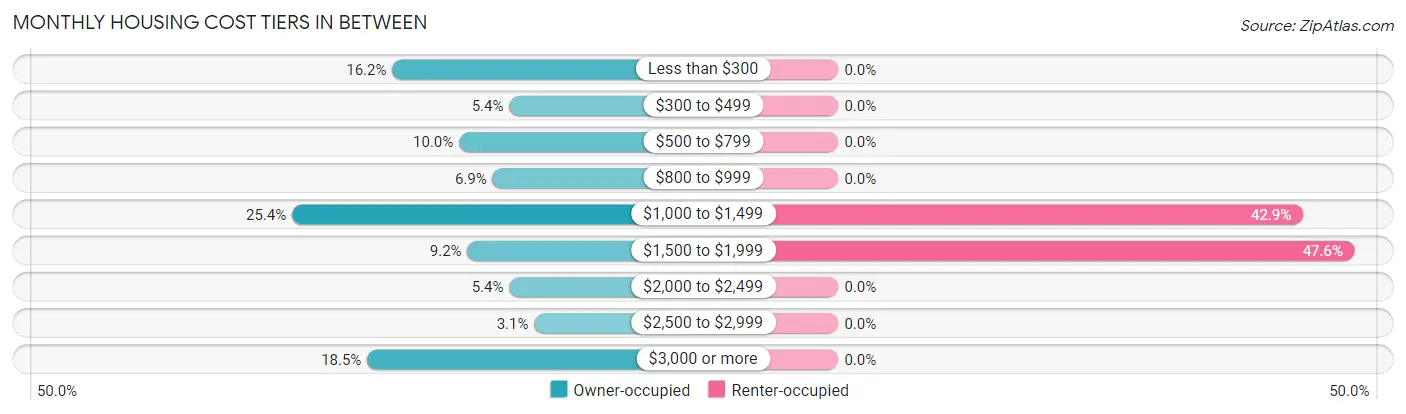
| Monthly Cost | Owner-occupied | Renter-occupied |
| Less than $300 | 21 (16.2%) | 0 (0.0%) |
| $300 to $499 | 7 (5.4%) | 0 (0.0%) |
| $500 to $799 | 13 (10.0%) | 0 (0.0%) |
| $800 to $999 | 9 (6.9%) | 0 (0.0%) |
| $1,000 to $1,499 | 33 (25.4%) | 9 (42.9%) |
| $1,500 to $1,999 | 12 (9.2%) | 10 (47.6%) |
| $2,000 to $2,499 | 7 (5.4%) | 0 (0.0%) |
| $2,500 to $2,999 | 4 (3.1%) | 0 (0.0%) |
| $3,000 or more | 24 (18.5%) | 0 (0.0%) |
| Total | 130 (100.0%) | 21 (100.0%) |
Physical Housing Characteristics in Between
Housing Structures in Between
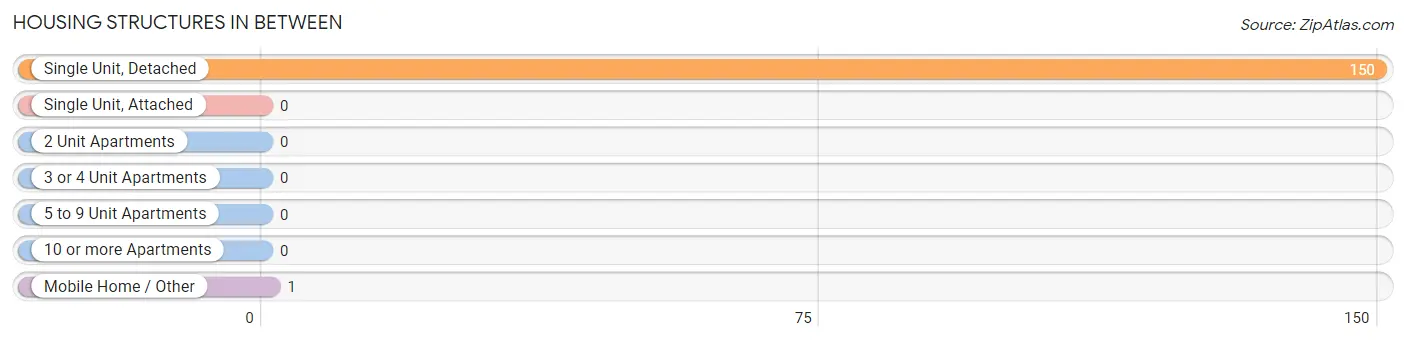
| Structure Type | # Housing Units | % Housing Units |
| Single Unit, Detached | 150 | 99.3% |
| Single Unit, Attached | 0 | 0.0% |
| 2 Unit Apartments | 0 | 0.0% |
| 3 or 4 Unit Apartments | 0 | 0.0% |
| 5 to 9 Unit Apartments | 0 | 0.0% |
| 10 or more Apartments | 0 | 0.0% |
| Mobile Home / Other | 1 | 0.7% |
| Total | 151 | 100.0% |
Housing Structures by Occupancy in Between
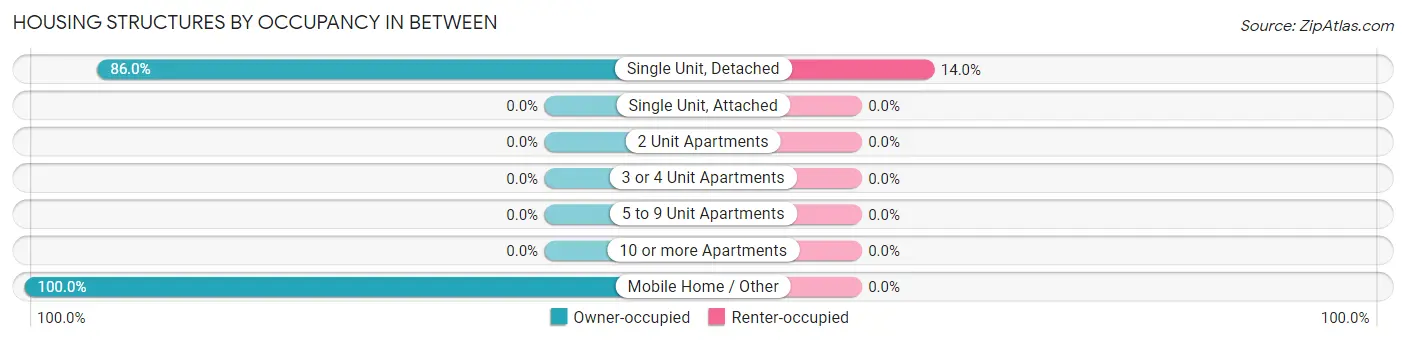
| Structure Type | Owner-occupied | Renter-occupied |
| Single Unit, Detached | 129 (86.0%) | 21 (14.0%) |
| Single Unit, Attached | 0 (0.0%) | 0 (0.0%) |
| 2 Unit Apartments | 0 (0.0%) | 0 (0.0%) |
| 3 or 4 Unit Apartments | 0 (0.0%) | 0 (0.0%) |
| 5 to 9 Unit Apartments | 0 (0.0%) | 0 (0.0%) |
| 10 or more Apartments | 0 (0.0%) | 0 (0.0%) |
| Mobile Home / Other | 1 (100.0%) | 0 (0.0%) |
| Total | 130 (86.1%) | 21 (13.9%) |
Housing Structures by Number of Rooms in Between
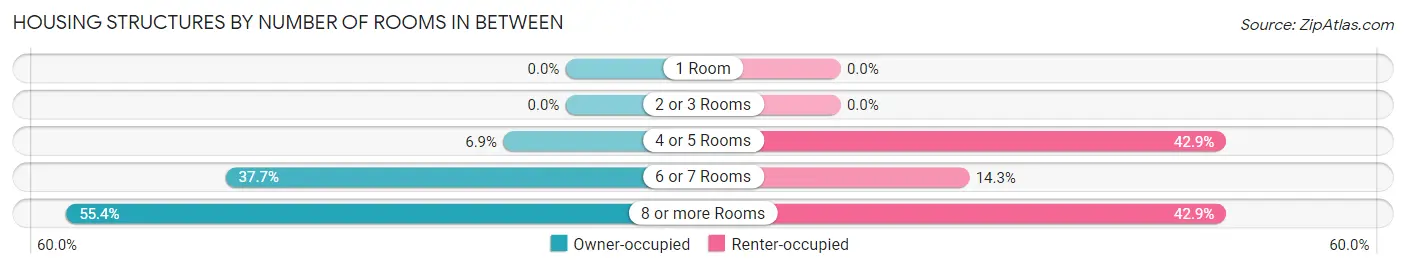
| Number of Rooms | Owner-occupied | Renter-occupied |
| 1 Room | 0 (0.0%) | 0 (0.0%) |
| 2 or 3 Rooms | 0 (0.0%) | 0 (0.0%) |
| 4 or 5 Rooms | 9 (6.9%) | 9 (42.9%) |
| 6 or 7 Rooms | 49 (37.7%) | 3 (14.3%) |
| 8 or more Rooms | 72 (55.4%) | 9 (42.9%) |
| Total | 130 (100.0%) | 21 (100.0%) |
Housing Structure by Heating Type in Between
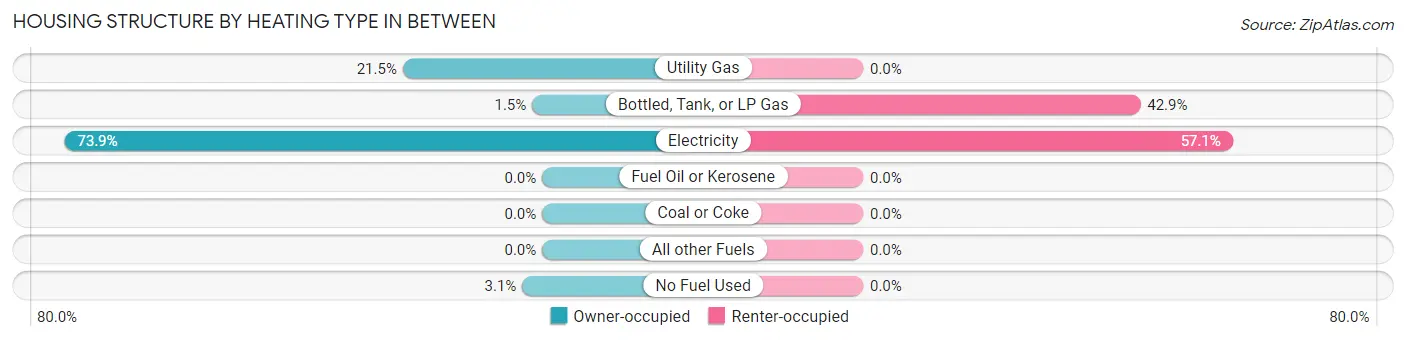
| Heating Type | Owner-occupied | Renter-occupied |
| Utility Gas | 28 (21.5%) | 0 (0.0%) |
| Bottled, Tank, or LP Gas | 2 (1.5%) | 9 (42.9%) |
| Electricity | 96 (73.9%) | 12 (57.1%) |
| Fuel Oil or Kerosene | 0 (0.0%) | 0 (0.0%) |
| Coal or Coke | 0 (0.0%) | 0 (0.0%) |
| All other Fuels | 0 (0.0%) | 0 (0.0%) |
| No Fuel Used | 4 (3.1%) | 0 (0.0%) |
| Total | 130 (100.0%) | 21 (100.0%) |
Household Vehicle Usage in Between
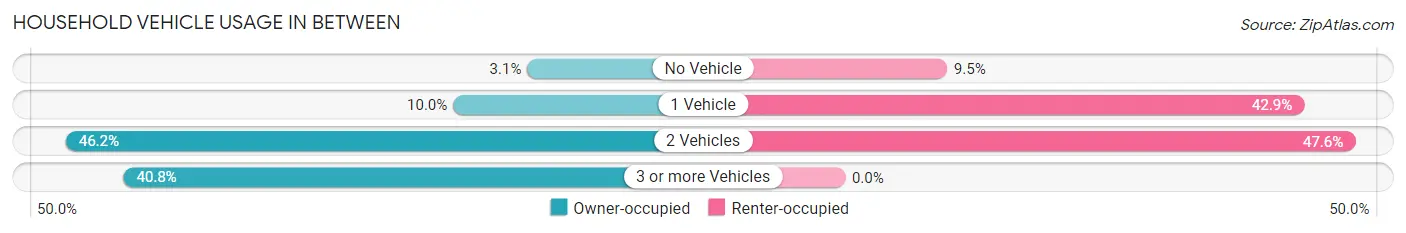
| Vehicles per Household | Owner-occupied | Renter-occupied |
| No Vehicle | 4 (3.1%) | 2 (9.5%) |
| 1 Vehicle | 13 (10.0%) | 9 (42.9%) |
| 2 Vehicles | 60 (46.2%) | 10 (47.6%) |
| 3 or more Vehicles | 53 (40.8%) | 0 (0.0%) |
| Total | 130 (100.0%) | 21 (100.0%) |
Real Estate & Mortgages in Between
Real Estate and Mortgage Overview in Between
| Characteristic | Without Mortgage | With Mortgage |
| Housing Units | 21 | 109 |
| Median Property Value | $425,000 | $316,700 |
| Median Household Income | $101,875 | $42 |
| Monthly Housing Costs | $550 | $24 |
| Real Estate Taxes | $1,450 | $9 |
Property Value by Mortgage Status in Between
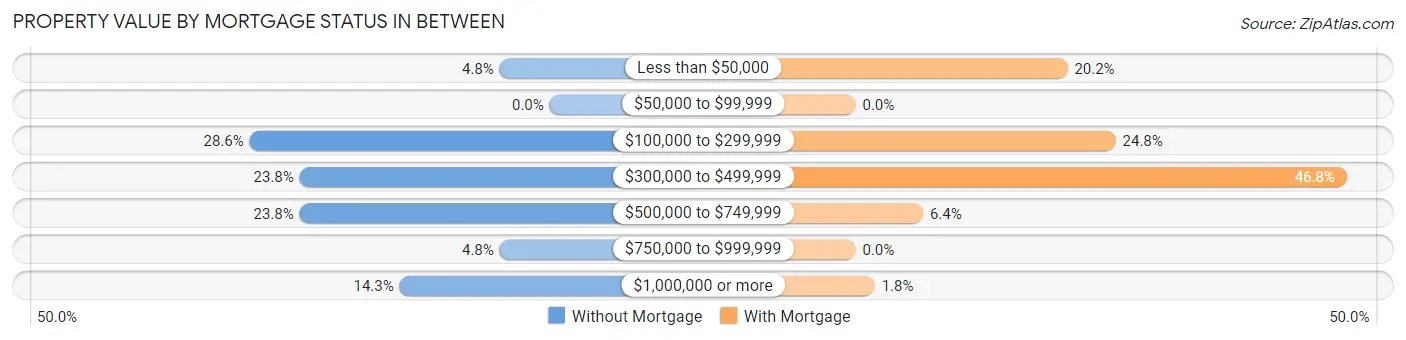
| Property Value | Without Mortgage | With Mortgage |
| Less than $50,000 | 1 (4.8%) | 22 (20.2%) |
| $50,000 to $99,999 | 0 (0.0%) | 0 (0.0%) |
| $100,000 to $299,999 | 6 (28.6%) | 27 (24.8%) |
| $300,000 to $499,999 | 5 (23.8%) | 51 (46.8%) |
| $500,000 to $749,999 | 5 (23.8%) | 7 (6.4%) |
| $750,000 to $999,999 | 1 (4.8%) | 0 (0.0%) |
| $1,000,000 or more | 3 (14.3%) | 2 (1.8%) |
| Total | 21 (100.0%) | 109 (100.0%) |
Household Income by Mortgage Status in Between
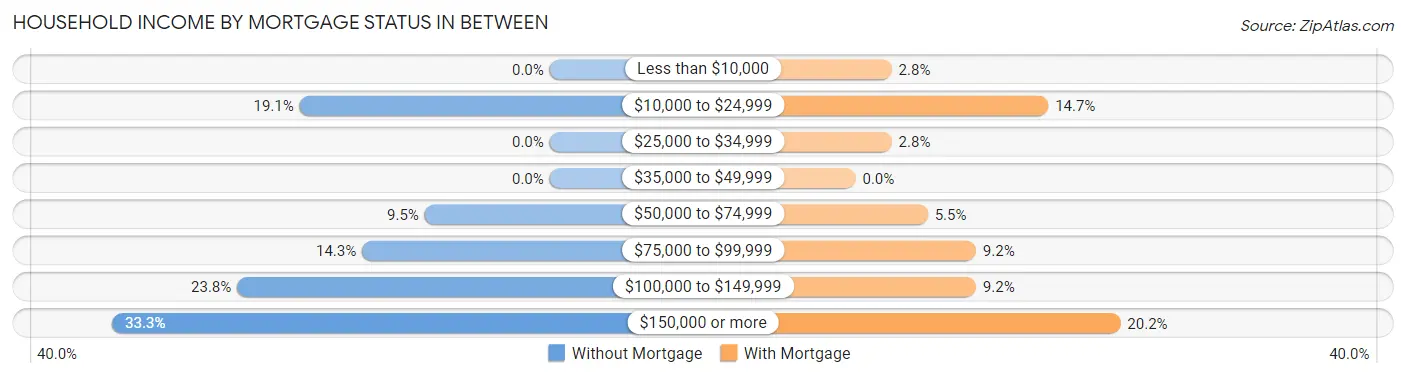
| Household Income | Without Mortgage | With Mortgage |
| Less than $10,000 | 0 (0.0%) | 3 (2.8%) |
| $10,000 to $24,999 | 4 (19.1%) | 16 (14.7%) |
| $25,000 to $34,999 | 0 (0.0%) | 3 (2.8%) |
| $35,000 to $49,999 | 0 (0.0%) | 0 (0.0%) |
| $50,000 to $74,999 | 2 (9.5%) | 6 (5.5%) |
| $75,000 to $99,999 | 3 (14.3%) | 10 (9.2%) |
| $100,000 to $149,999 | 5 (23.8%) | 10 (9.2%) |
| $150,000 or more | 7 (33.3%) | 22 (20.2%) |
| Total | 21 (100.0%) | 109 (100.0%) |
Property Value to Household Income Ratio in Between
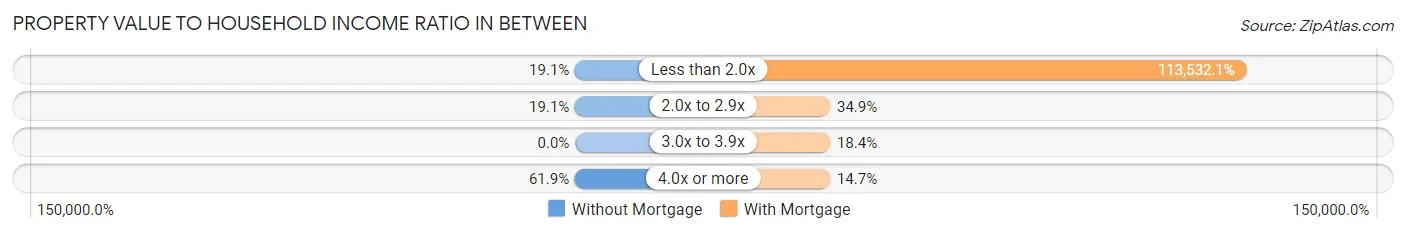
| Value-to-Income Ratio | Without Mortgage | With Mortgage |
| Less than 2.0x | 4 (19.1%) | 123,750 (113,532.1%) |
| 2.0x to 2.9x | 4 (19.1%) | 38 (34.9%) |
| 3.0x to 3.9x | 0 (0.0%) | 20 (18.3%) |
| 4.0x or more | 13 (61.9%) | 16 (14.7%) |
| Total | 21 (100.0%) | 109 (100.0%) |
Real Estate Taxes by Mortgage Status in Between
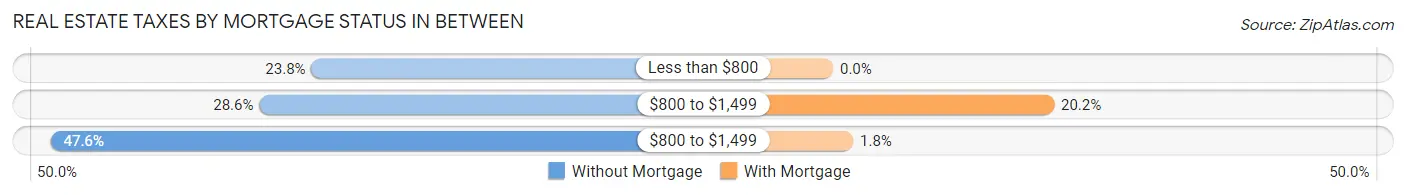
| Property Taxes | Without Mortgage | With Mortgage |
| Less than $800 | 5 (23.8%) | 0 (0.0%) |
| $800 to $1,499 | 6 (28.6%) | 22 (20.2%) |
| $800 to $1,499 | 10 (47.6%) | 2 (1.8%) |
| Total | 21 (100.0%) | 109 (100.0%) |
Health & Disability in Between
Health Insurance Coverage by Age in Between
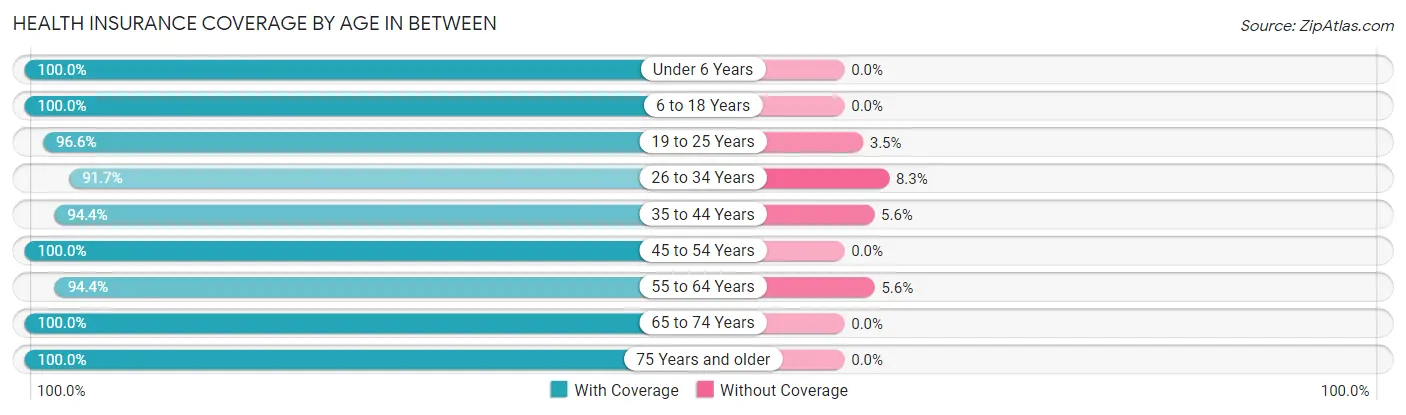
| Age Bracket | With Coverage | Without Coverage |
| Under 6 Years | 19 (100.0%) | 0 (0.0%) |
| 6 to 18 Years | 86 (100.0%) | 0 (0.0%) |
| 19 to 25 Years | 84 (96.6%) | 3 (3.5%) |
| 26 to 34 Years | 44 (91.7%) | 4 (8.3%) |
| 35 to 44 Years | 51 (94.4%) | 3 (5.6%) |
| 45 to 54 Years | 76 (100.0%) | 0 (0.0%) |
| 55 to 64 Years | 67 (94.4%) | 4 (5.6%) |
| 65 to 74 Years | 37 (100.0%) | 0 (0.0%) |
| 75 Years and older | 13 (100.0%) | 0 (0.0%) |
| Total | 477 (97.2%) | 14 (2.9%) |
Health Insurance Coverage by Citizenship Status in Between
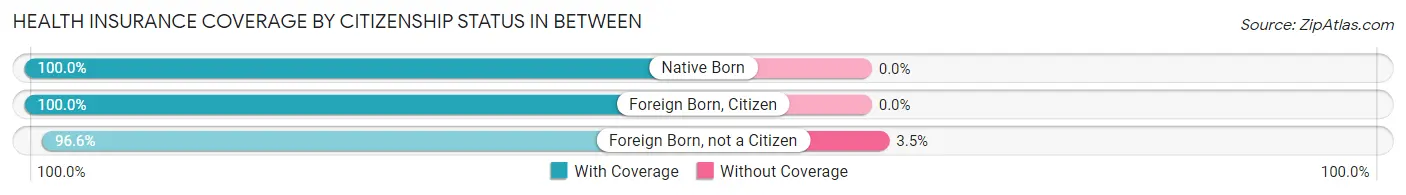
| Citizenship Status | With Coverage | Without Coverage |
| Native Born | 19 (100.0%) | 0 (0.0%) |
| Foreign Born, Citizen | 86 (100.0%) | 0 (0.0%) |
| Foreign Born, not a Citizen | 84 (96.6%) | 3 (3.5%) |
Health Insurance Coverage by Household Income in Between
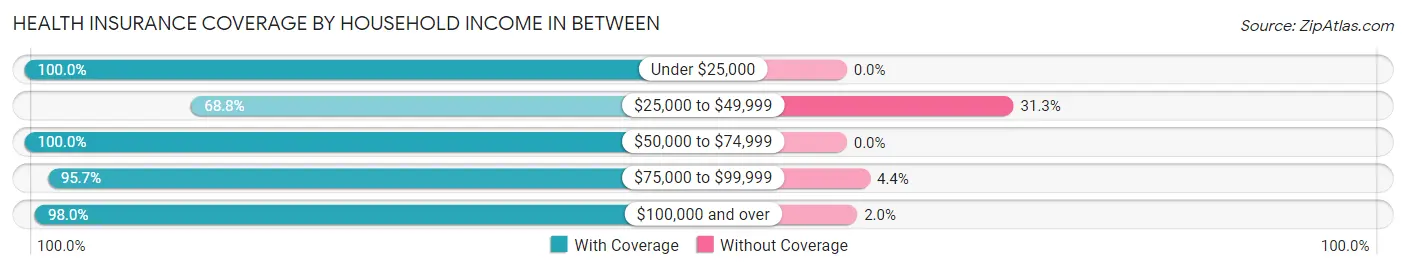
| Household Income | With Coverage | Without Coverage |
| Under $25,000 | 46 (100.0%) | 0 (0.0%) |
| $25,000 to $49,999 | 11 (68.8%) | 5 (31.2%) |
| $50,000 to $74,999 | 25 (100.0%) | 0 (0.0%) |
| $75,000 to $99,999 | 44 (95.7%) | 2 (4.3%) |
| $100,000 and over | 351 (98.0%) | 7 (2.0%) |
Public vs Private Health Insurance Coverage by Age in Between
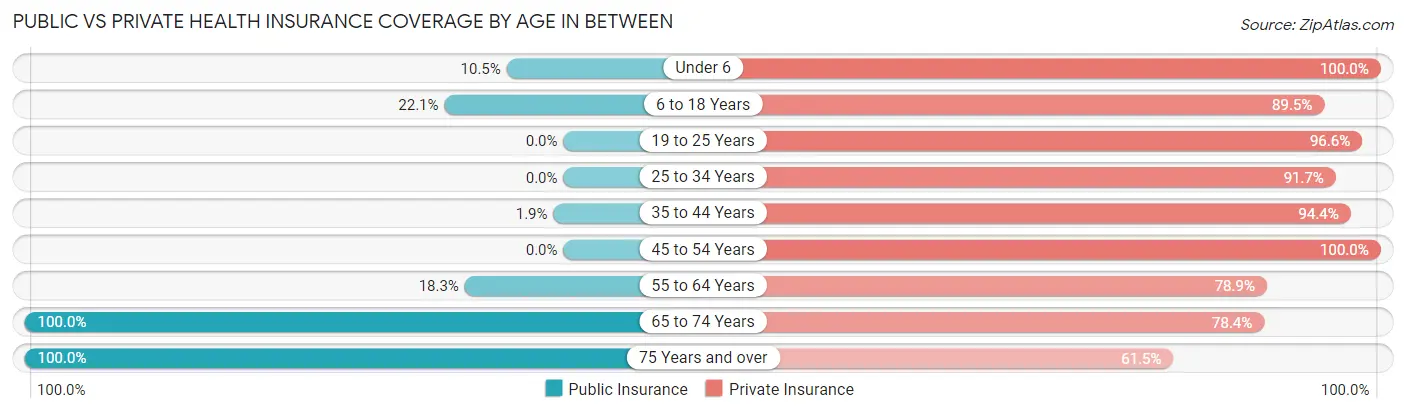
| Age Bracket | Public Insurance | Private Insurance |
| Under 6 | 2 (10.5%) | 19 (100.0%) |
| 6 to 18 Years | 19 (22.1%) | 77 (89.5%) |
| 19 to 25 Years | 0 (0.0%) | 84 (96.6%) |
| 25 to 34 Years | 0 (0.0%) | 44 (91.7%) |
| 35 to 44 Years | 1 (1.8%) | 51 (94.4%) |
| 45 to 54 Years | 0 (0.0%) | 76 (100.0%) |
| 55 to 64 Years | 13 (18.3%) | 56 (78.9%) |
| 65 to 74 Years | 37 (100.0%) | 29 (78.4%) |
| 75 Years and over | 13 (100.0%) | 8 (61.5%) |
| Total | 85 (17.3%) | 444 (90.4%) |
Disability Status by Sex by Age in Between
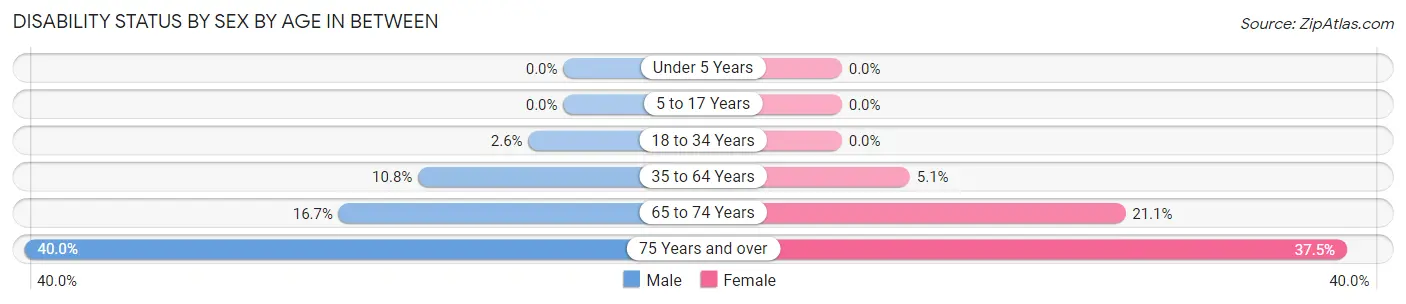
| Age Bracket | Male | Female |
| Under 5 Years | 0 (0.0%) | 0 (0.0%) |
| 5 to 17 Years | 0 (0.0%) | 0 (0.0%) |
| 18 to 34 Years | 3 (2.6%) | 0 (0.0%) |
| 35 to 64 Years | 11 (10.8%) | 5 (5.1%) |
| 65 to 74 Years | 3 (16.7%) | 4 (21.0%) |
| 75 Years and over | 2 (40.0%) | 3 (37.5%) |
Disability Class by Sex by Age in Between
Disability Class: Hearing Difficulty
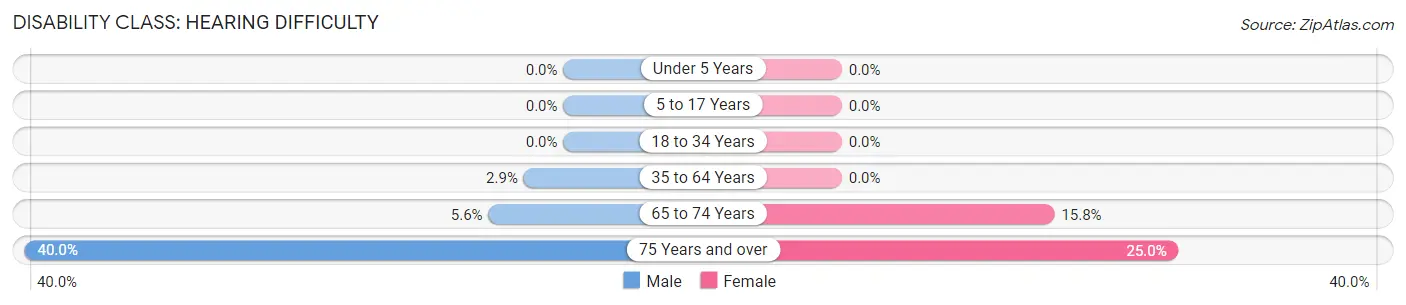
| Age Bracket | Male | Female |
| Under 5 Years | 0 (0.0%) | 0 (0.0%) |
| 5 to 17 Years | 0 (0.0%) | 0 (0.0%) |
| 18 to 34 Years | 0 (0.0%) | 0 (0.0%) |
| 35 to 64 Years | 3 (2.9%) | 0 (0.0%) |
| 65 to 74 Years | 1 (5.6%) | 3 (15.8%) |
| 75 Years and over | 2 (40.0%) | 2 (25.0%) |
Disability Class: Vision Difficulty
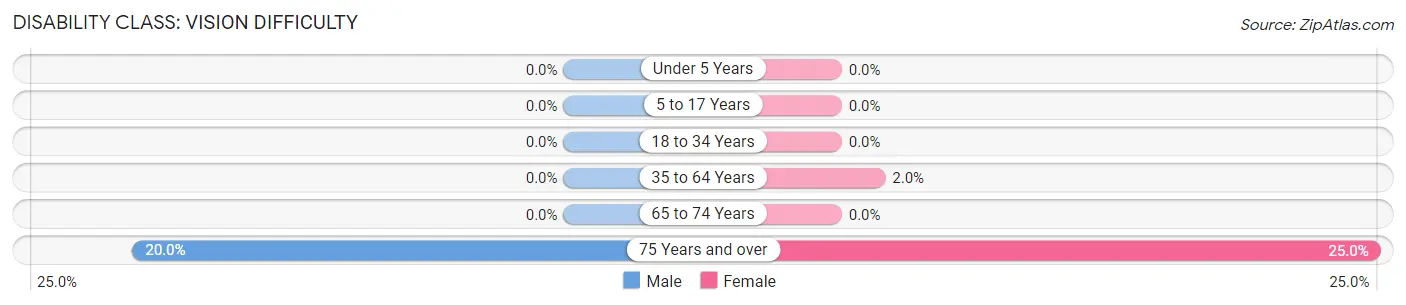
| Age Bracket | Male | Female |
| Under 5 Years | 0 (0.0%) | 0 (0.0%) |
| 5 to 17 Years | 0 (0.0%) | 0 (0.0%) |
| 18 to 34 Years | 0 (0.0%) | 0 (0.0%) |
| 35 to 64 Years | 0 (0.0%) | 2 (2.0%) |
| 65 to 74 Years | 0 (0.0%) | 0 (0.0%) |
| 75 Years and over | 1 (20.0%) | 2 (25.0%) |
Disability Class: Cognitive Difficulty
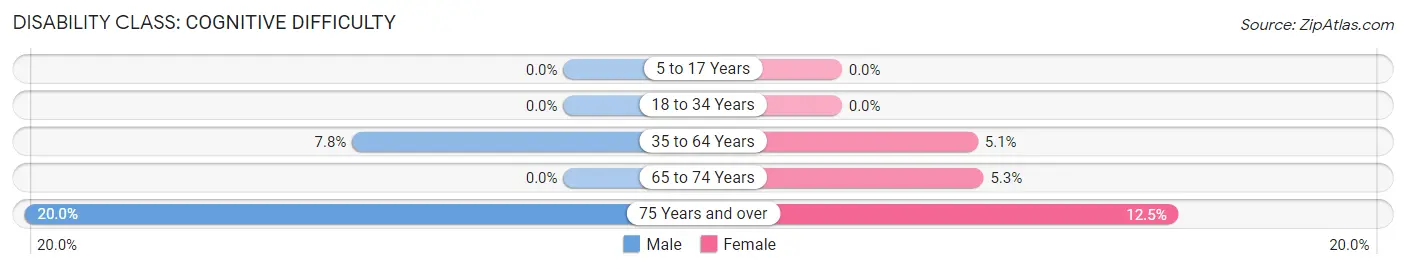
| Age Bracket | Male | Female |
| 5 to 17 Years | 0 (0.0%) | 0 (0.0%) |
| 18 to 34 Years | 0 (0.0%) | 0 (0.0%) |
| 35 to 64 Years | 8 (7.8%) | 5 (5.1%) |
| 65 to 74 Years | 0 (0.0%) | 1 (5.3%) |
| 75 Years and over | 1 (20.0%) | 1 (12.5%) |
Disability Class: Ambulatory Difficulty
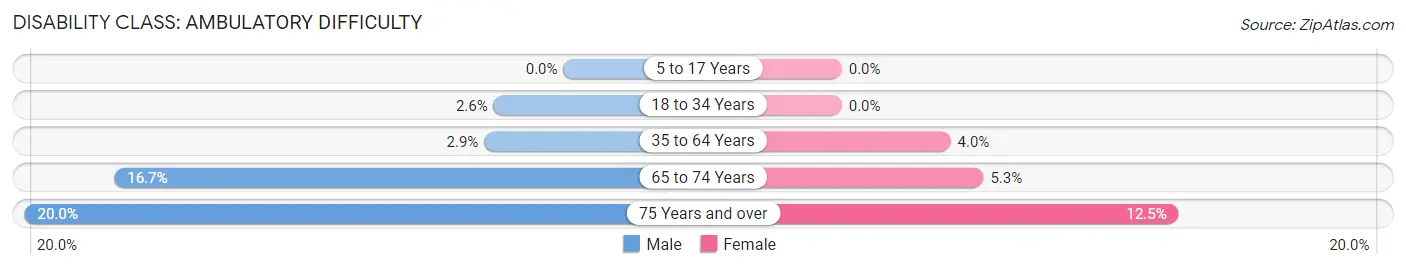
| Age Bracket | Male | Female |
| 5 to 17 Years | 0 (0.0%) | 0 (0.0%) |
| 18 to 34 Years | 3 (2.6%) | 0 (0.0%) |
| 35 to 64 Years | 3 (2.9%) | 4 (4.0%) |
| 65 to 74 Years | 3 (16.7%) | 1 (5.3%) |
| 75 Years and over | 1 (20.0%) | 1 (12.5%) |
Disability Class: Self-Care Difficulty
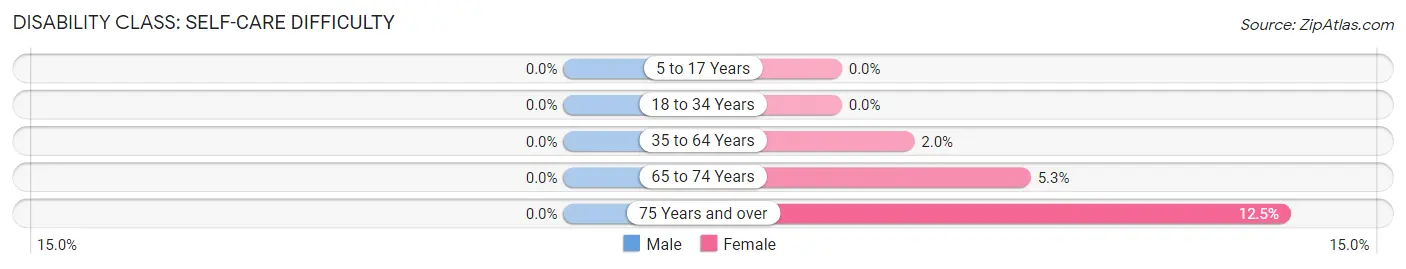
| Age Bracket | Male | Female |
| 5 to 17 Years | 0 (0.0%) | 0 (0.0%) |
| 18 to 34 Years | 0 (0.0%) | 0 (0.0%) |
| 35 to 64 Years | 0 (0.0%) | 2 (2.0%) |
| 65 to 74 Years | 0 (0.0%) | 1 (5.3%) |
| 75 Years and over | 0 (0.0%) | 1 (12.5%) |
Technology Access in Between
Computing Device Access in Between
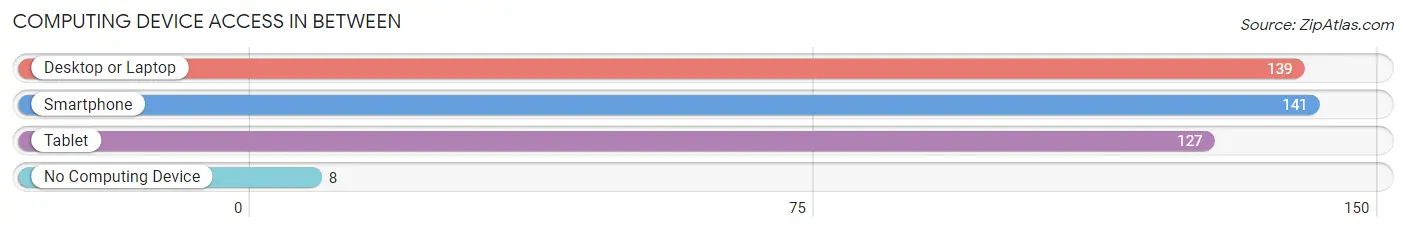
| Device Type | # Households | % Households |
| Desktop or Laptop | 139 | 92.0% |
| Smartphone | 141 | 93.4% |
| Tablet | 127 | 84.1% |
| No Computing Device | 8 | 5.3% |
| Total | 151 | 100.0% |
Internet Access in Between
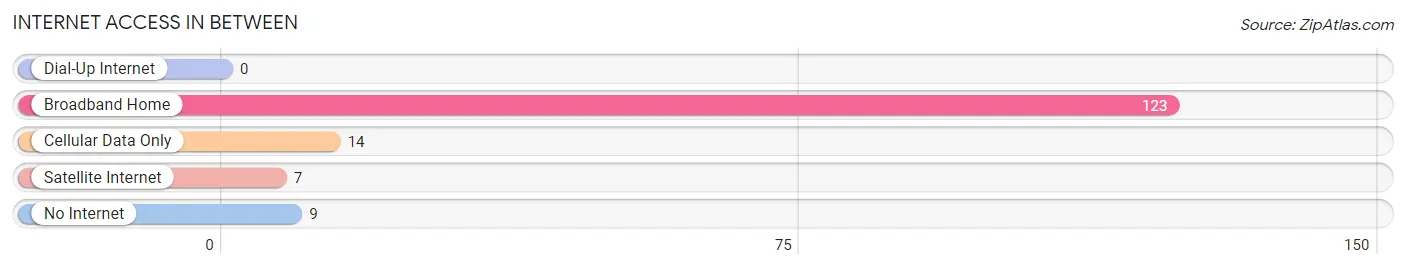
| Internet Type | # Households | % Households |
| Dial-Up Internet | 0 | 0.0% |
| Broadband Home | 123 | 81.5% |
| Cellular Data Only | 14 | 9.3% |
| Satellite Internet | 7 | 4.6% |
| No Internet | 9 | 6.0% |
| Total | 151 | 100.0% |
Between Summary
History
Georgia is a state located in the southeastern United States. It was one of the original Thirteen Colonies and was admitted to the Union in 1788. Georgia was the fourth state to ratify the United States Constitution, making it one of the founding states of the United States.
The history of Georgia is closely tied to the history of the United States. Georgia was the first state to ratify the Articles of Confederation, and was the fourth state to ratify the United States Constitution. Georgia was also the first state to secede from the Union in 1861, and was the last state to be readmitted to the Union in 1870.
Georgia has a long and varied history, from its Native American inhabitants to its colonial period, to its role in the Civil War and Reconstruction, to its modern-day status as a major economic and political power in the South.
Geography
Georgia is located in the southeastern United States, bordered by Alabama to the west, Tennessee to the north, North Carolina and South Carolina to the east, and the Atlantic Ocean to the south. Georgia is the largest state east of the Mississippi River, and is the 24th largest state in the United States.
The geography of Georgia is diverse, ranging from the Appalachian Mountains in the north to the Atlantic Ocean in the south. The state is divided into four distinct regions: the Blue Ridge Mountains, the Piedmont Plateau, the Coastal Plain, and the Okefenokee Swamp.
The Blue Ridge Mountains are located in the northern part of the state, and are home to the highest point in Georgia, Brasstown Bald. The Piedmont Plateau is located in the central part of the state, and is home to the state capital, Atlanta. The Coastal Plain is located in the southern part of the state, and is home to the state's beaches and barrier islands. The Okefenokee Swamp is located in the southeastern part of the state, and is home to a variety of wildlife.
Economy
Georgia has a diverse and vibrant economy. The state is home to a variety of industries, including agriculture, manufacturing, tourism, and technology.
Agriculture is a major part of the state's economy, with the state producing a variety of crops, including cotton, peanuts, corn, soybeans, and tobacco. Georgia is also home to a number of livestock, including cattle, hogs, and poultry.
Manufacturing is also a major part of the state's economy, with the state producing a variety of products, including textiles, chemicals, paper products, and transportation equipment.
Tourism is also a major part of the state's economy, with the state attracting millions of visitors each year. Georgia is home to a variety of attractions, including the Georgia Aquarium, the World of Coca-Cola, and Stone Mountain Park.
Technology is also a major part of the state's economy, with the state home to a number of technology companies, including AT&T, Dell, and IBM.
Demographics
As of the 2010 census, Georgia had a population of 9,687,653. The state is home to a variety of ethnic and racial groups, including African Americans, Hispanics, Asians, and Native Americans.
The largest racial group in Georgia is African Americans, who make up 31.5% of the state's population. The second largest racial group is whites, who make up 57.7% of the state's population. Hispanics make up 8.3% of the state's population, while Asians make up 2.2% of the state's population. Native Americans make up 0.4% of the state's population.
The median household income in Georgia is $50,895, and the median age is 36.7 years. The state has a poverty rate of 17.2%, and the unemployment rate is 4.3%.
Common Questions
What is the Total Population of Between?
Total Population of Between is 491.
What is the Total Male Population of Between?
Total Male Population of Between is 309.
What is the Total Female Population of Between?
Total Female Population of Between is 182.
What is the Ratio of Males per 100 Females in Between?
There are 169.78 Males per 100 Females in Between.
What is the Ratio of Females per 100 Males in Between?
There are 58.90 Females per 100 Males in Between.
What is the Median Population Age in Between?
Median Population Age in Between is 35.7 Years.
What is the Average Family Size in Between
Average Family Size in Between is 3.7 People.
What is the Average Household Size in Between
Average Household Size in Between is 3.2 People.
What is Per Capita Income in Between?
Per Capita income in Between is $45,093.
What is the Median Family Income in Between?
Median Family Income in Between is $131,250.
What is the Median Household income in Between?
Median Household Income in Between is $123,854.
What is Income or Wage Gap in Between?
Income or Wage Gap in Between is 22.9%.
Women in Between earn 77.1 cents for every dollar earned by a man.
What is Inequality or Gini Index in Between?
Inequality or Gini Index in Between is 0.39.
How Large is the Labor Force in Between?
There are 309 People in the Labor Forcein in Between.
What is the Percentage of People in the Labor Force in Between?
78.4% of People are in the Labor Force in Between.
What is the Unemployment Rate in Between?
Unemployment Rate in Between is 4.9%.