Montgomery, GA
Montgomery Map
Montgomery Overview
4,606
TOTAL POPULATION
2,166
MALE POPULATION
2,440
FEMALE POPULATION
88.77
MALES / 100 FEMALES
112.65
FEMALES / 100 MALES
38.5
MEDIAN AGE
2.7
AVG FAMILY SIZE
2.5
AVG HOUSEHOLD SIZE
$44,796
PER CAPITA INCOME
$118,854
AVG FAMILY INCOME
$88,828
AVG HOUSEHOLD INCOME
39.4%
WAGE / INCOME GAP [ % ]
60.6¢/ $1
WAGE / INCOME GAP [ $ ]
0.43
INEQUALITY / GINI INDEX
2,402
LABOR FORCE [ PEOPLE ]
60.0%
PERCENT IN LABOR FORCE
1.9%
UNEMPLOYMENT RATE
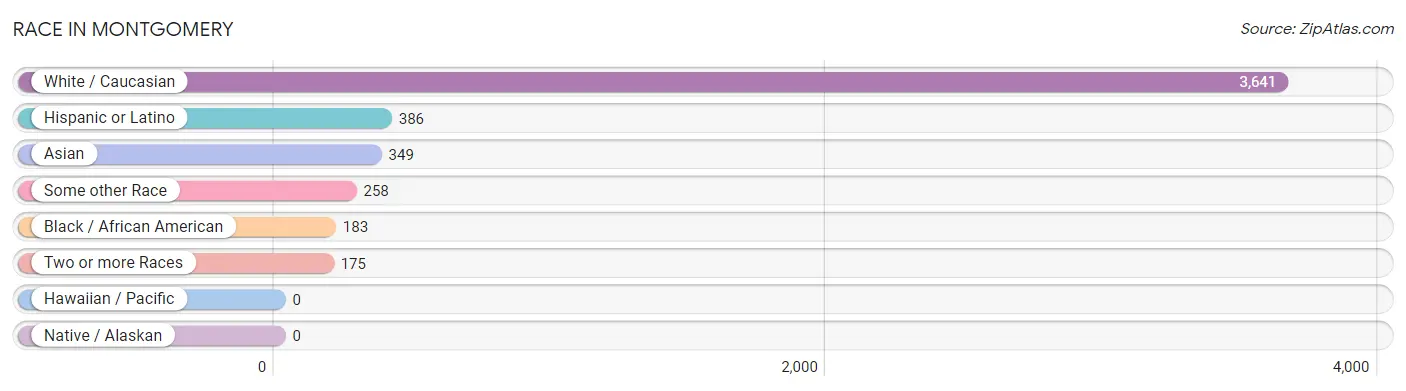
Race in Montgomery
The most populous races in Montgomery are White / Caucasian (3,641 | 79.0%), Hispanic or Latino (386 | 8.4%), and Asian (349 | 7.6%).
| Race | # Population | % Population |
| Asian | 349 | 7.6% |
| Black / African American | 183 | 4.0% |
| Hawaiian / Pacific | 0 | 0.0% |
| Hispanic or Latino | 386 | 8.4% |
| Native / Alaskan | 0 | 0.0% |
| White / Caucasian | 3,641 | 79.0% |
| Two or more Races | 175 | 3.8% |
| Some other Race | 258 | 5.6% |
| Total | 4,606 | 100.0% |
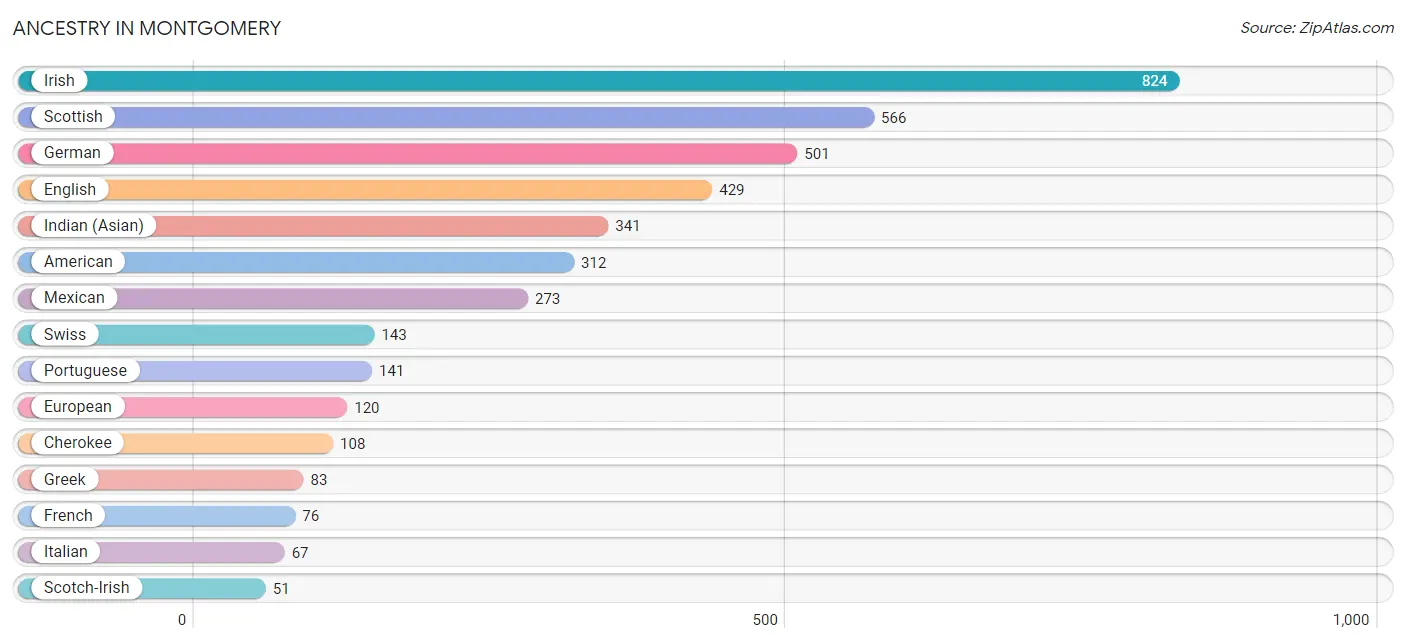
Ancestry in Montgomery
The most populous ancestries reported in Montgomery are Irish (824 | 17.9%), Scottish (566 | 12.3%), German (501 | 10.9%), English (429 | 9.3%), and Indian (Asian) (341 | 7.4%), together accounting for 57.8% of all Montgomery residents.
| Ancestry | # Population | % Population |
| American | 312 | 6.8% |
| Arab | 12 | 0.3% |
| Austrian | 19 | 0.4% |
| Brazilian | 22 | 0.5% |
| Burmese | 8 | 0.2% |
| Canadian | 18 | 0.4% |
| Central American | 8 | 0.2% |
| Cherokee | 108 | 2.3% |
| Dutch | 27 | 0.6% |
| Eastern European | 19 | 0.4% |
| Egyptian | 12 | 0.3% |
| English | 429 | 9.3% |
| European | 120 | 2.6% |
| French | 76 | 1.7% |
| German | 501 | 10.9% |
| Greek | 83 | 1.8% |
| Honduran | 8 | 0.2% |
| Indian (Asian) | 341 | 7.4% |
| Iranian | 9 | 0.2% |
| Irish | 824 | 17.9% |
| Italian | 67 | 1.5% |
| Japanese | 9 | 0.2% |
| Lithuanian | 24 | 0.5% |
| Maltese | 14 | 0.3% |
| Mexican | 273 | 5.9% |
| Native Hawaiian | 27 | 0.6% |
| Polish | 12 | 0.3% |
| Portuguese | 141 | 3.1% |
| Puerto Rican | 24 | 0.5% |
| Scotch-Irish | 51 | 1.1% |
| Scottish | 566 | 12.3% |
| Swedish | 12 | 0.3% |
| Swiss | 143 | 3.1% | View All 33 Rows |
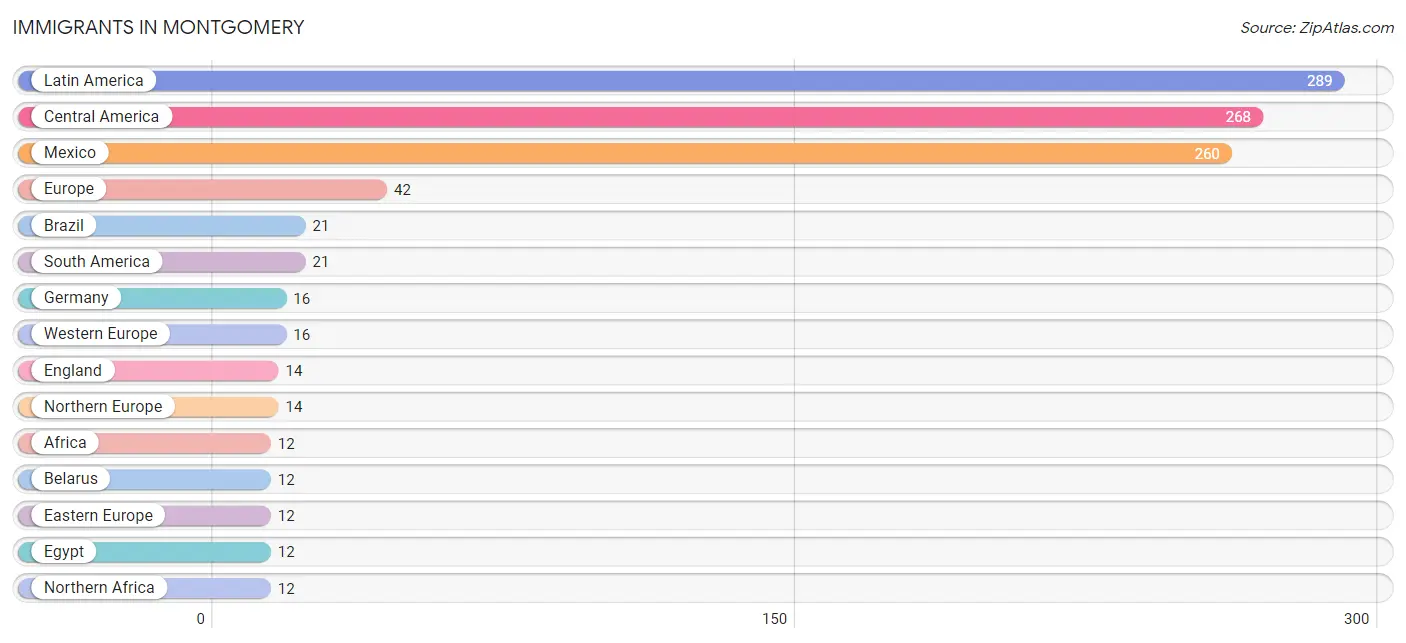
Immigrants in Montgomery
The most numerous immigrant groups reported in Montgomery came from Latin America (289 | 6.3%), Central America (268 | 5.8%), Mexico (260 | 5.6%), Europe (42 | 0.9%), and Brazil (21 | 0.5%), together accounting for 19.1% of all Montgomery residents.
| Immigration Origin | # Population | % Population |
| Africa | 12 | 0.3% |
| Asia | 8 | 0.2% |
| Belarus | 12 | 0.3% |
| Brazil | 21 | 0.5% |
| Central America | 268 | 5.8% |
| Eastern Asia | 8 | 0.2% |
| Eastern Europe | 12 | 0.3% |
| Egypt | 12 | 0.3% |
| England | 14 | 0.3% |
| Europe | 42 | 0.9% |
| Germany | 16 | 0.4% |
| Honduras | 8 | 0.2% |
| Korea | 8 | 0.2% |
| Latin America | 289 | 6.3% |
| Mexico | 260 | 5.6% |
| Northern Africa | 12 | 0.3% |
| Northern Europe | 14 | 0.3% |
| South America | 21 | 0.5% |
| Western Europe | 16 | 0.4% | View All 19 Rows |
Sex and Age in Montgomery
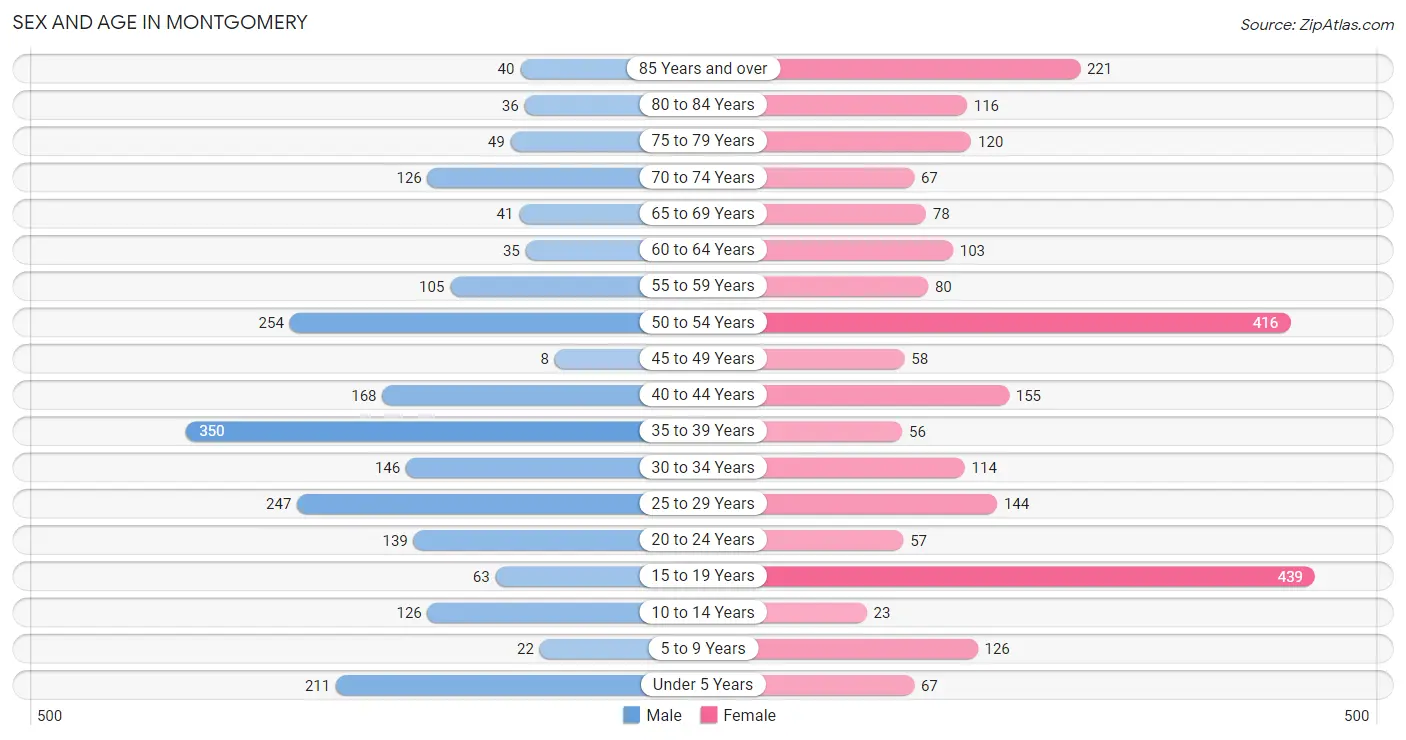
Sex and Age in Montgomery
The most populous age groups in Montgomery are 35 to 39 Years (350 | 16.2%) for men and 15 to 19 Years (439 | 18.0%) for women.
| Age Bracket | Male | Female |
| Under 5 Years | 211 (9.7%) | 67 (2.8%) |
| 5 to 9 Years | 22 (1.0%) | 126 (5.2%) |
| 10 to 14 Years | 126 (5.8%) | 23 (0.9%) |
| 15 to 19 Years | 63 (2.9%) | 439 (18.0%) |
| 20 to 24 Years | 139 (6.4%) | 57 (2.3%) |
| 25 to 29 Years | 247 (11.4%) | 144 (5.9%) |
| 30 to 34 Years | 146 (6.7%) | 114 (4.7%) |
| 35 to 39 Years | 350 (16.2%) | 56 (2.3%) |
| 40 to 44 Years | 168 (7.8%) | 155 (6.4%) |
| 45 to 49 Years | 8 (0.4%) | 58 (2.4%) |
| 50 to 54 Years | 254 (11.7%) | 416 (17.1%) |
| 55 to 59 Years | 105 (4.9%) | 80 (3.3%) |
| 60 to 64 Years | 35 (1.6%) | 103 (4.2%) |
| 65 to 69 Years | 41 (1.9%) | 78 (3.2%) |
| 70 to 74 Years | 126 (5.8%) | 67 (2.8%) |
| 75 to 79 Years | 49 (2.3%) | 120 (4.9%) |
| 80 to 84 Years | 36 (1.7%) | 116 (4.8%) |
| 85 Years and over | 40 (1.8%) | 221 (9.1%) |
| Total | 2,166 (100.0%) | 2,440 (100.0%) |
Families and Households in Montgomery
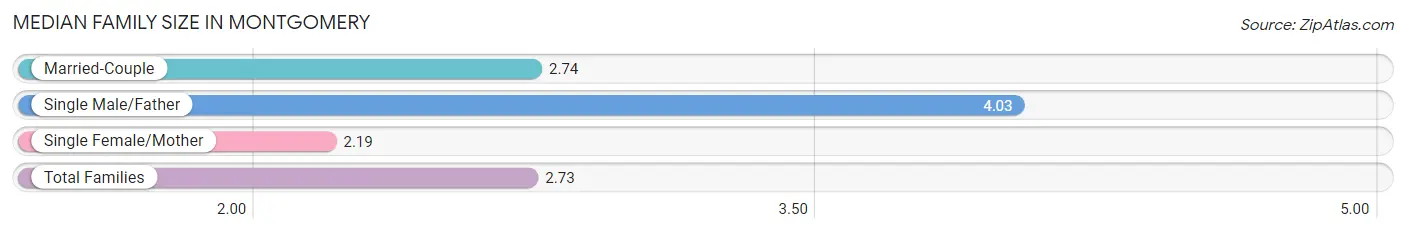
Median Family Size in Montgomery
The median family size in Montgomery is 2.73 persons per family, with single male/father families (60 | 4.3%) accounting for the largest median family size of 4.03 persons per family. On the other hand, single female/mother families (172 | 12.3%) represent the smallest median family size with 2.19 persons per family.
| Family Type | # Families | Family Size |
| Married-Couple | 1,164 (83.4%) | 2.74 |
| Single Male/Father | 60 (4.3%) | 4.03 |
| Single Female/Mother | 172 (12.3%) | 2.19 |
| Total Families | 1,396 (100.0%) | 2.73 |
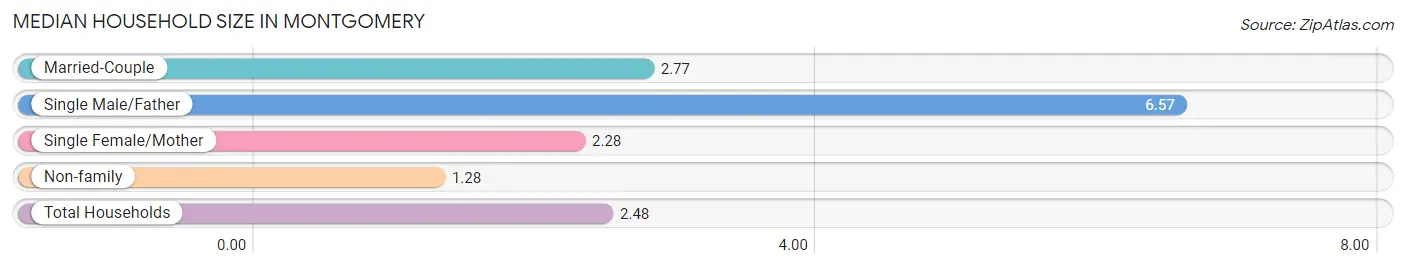
Median Household Size in Montgomery
The median household size in Montgomery is 2.48 persons per household, with single male/father households (60 | 3.2%) accounting for the largest median household size of 6.57 persons per household. non-family households (465 | 25.0%) represent the smallest median household size with 1.28 persons per household.
| Household Type | # Households | Household Size |
| Married-Couple | 1,164 (62.5%) | 2.77 |
| Single Male/Father | 60 (3.2%) | 6.57 |
| Single Female/Mother | 172 (9.2%) | 2.28 |
| Non-family | 465 (25.0%) | 1.28 |
| Total Households | 1,861 (100.0%) | 2.48 |
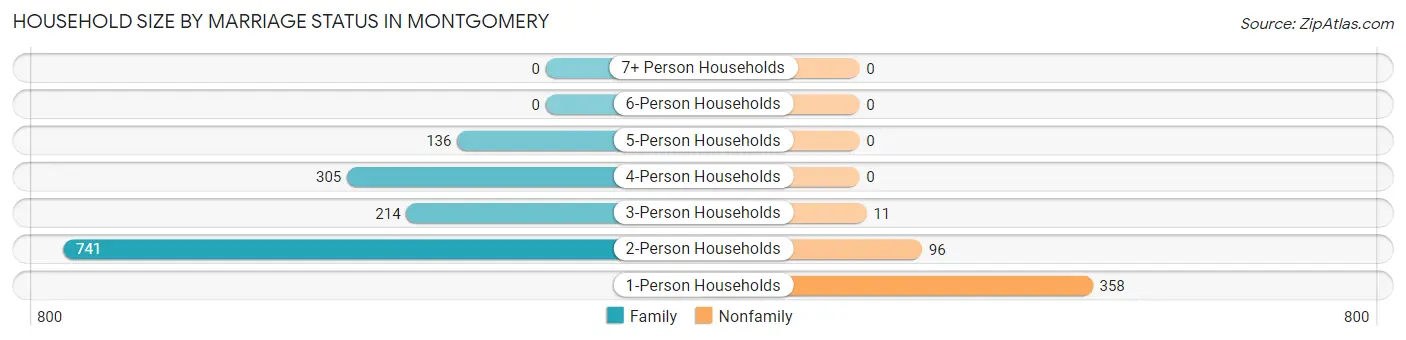
Household Size by Marriage Status in Montgomery
Out of a total of 1,861 households in Montgomery, 1,396 (75.0%) are family households, while 465 (25.0%) are nonfamily households. The most numerous type of family households are 2-person households, comprising 741, and the most common type of nonfamily households are 1-person households, comprising 358.
| Household Size | Family Households | Nonfamily Households |
| 1-Person Households | - | 358 (19.2%) |
| 2-Person Households | 741 (39.8%) | 96 (5.2%) |
| 3-Person Households | 214 (11.5%) | 11 (0.6%) |
| 4-Person Households | 305 (16.4%) | 0 (0.0%) |
| 5-Person Households | 136 (7.3%) | 0 (0.0%) |
| 6-Person Households | 0 (0.0%) | 0 (0.0%) |
| 7+ Person Households | 0 (0.0%) | 0 (0.0%) |
| Total | 1,396 (75.0%) | 465 (25.0%) |
Female Fertility in Montgomery
Fertility by Age in Montgomery
Average fertility rate in Montgomery is 61.0 births per 1,000 women. Women in the age bracket of 35 to 50 years have the highest fertility rate with 143.0 births per 1,000 women. Women in the age bracket of 35 to 50 years acount for 76.5% of all women with births.
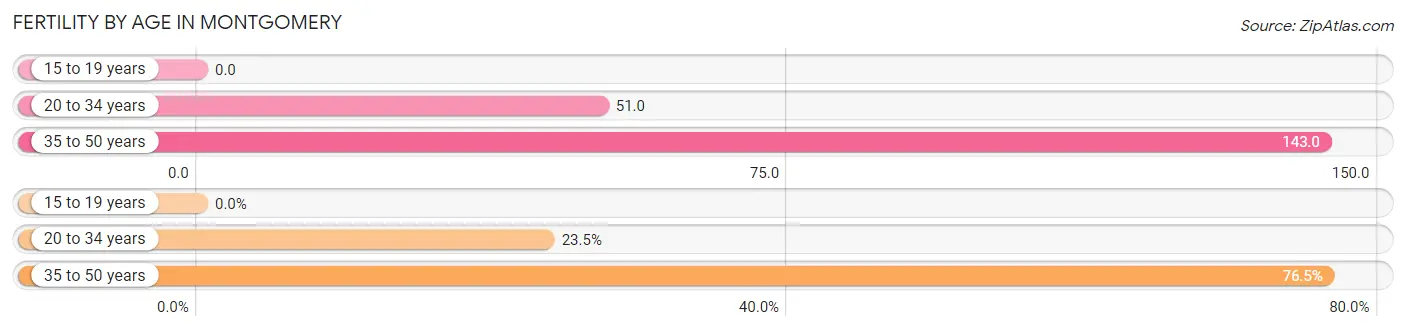
| Age Bracket | Women with Births | Births / 1,000 Women |
| 15 to 19 years | 0 (0.0%) | 0.0 |
| 20 to 34 years | 16 (23.5%) | 51.0 |
| 35 to 50 years | 52 (76.5%) | 143.0 |
| Total | 68 (100.0%) | 61.0 |
Fertility by Age by Marriage Status in Montgomery
23.5% of women with births (68) in Montgomery are married. The highest percentage of unmarried women with births falls into 35 to 50 years age bracket with 100.0% of them unmarried at the time of birth, while the lowest percentage of unmarried women with births belong to 20 to 34 years age bracket with 0.0% of them unmarried.
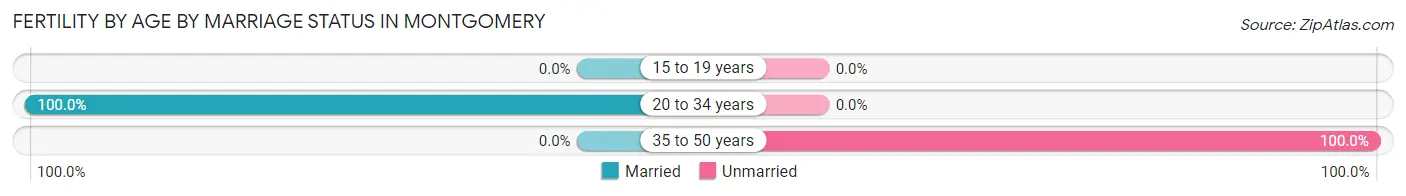
| Age Bracket | Married | Unmarried |
| 15 to 19 years | 0 (0.0%) | 0 (0.0%) |
| 20 to 34 years | 16 (100.0%) | 0 (0.0%) |
| 35 to 50 years | 0 (0.0%) | 52 (100.0%) |
| Total | 16 (23.5%) | 52 (76.5%) |
Fertility by Education in Montgomery
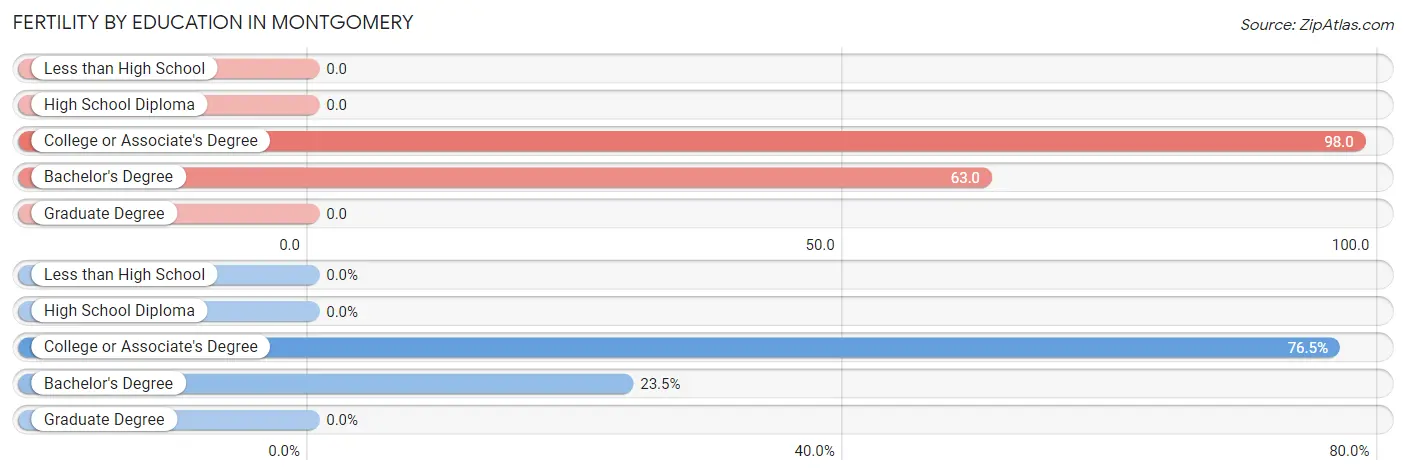
| Educational Attainment | Women with Births | Births / 1,000 Women |
| Less than High School | 0 (0.0%) | 0.0 |
| High School Diploma | 0 (0.0%) | 0.0 |
| College or Associate's Degree | 52 (76.5%) | 98.0 |
| Bachelor's Degree | 16 (23.5%) | 63.0 |
| Graduate Degree | 0 (0.0%) | 0.0 |
| Total | 68 (100.0%) | 61.0 |
Fertility by Education by Marriage Status in Montgomery
76.5% of women with births in Montgomery are unmarried. Women with the educational attainment of bachelor's degree are most likely to be married with 100.0% of them married at childbirth, while women with the educational attainment of college or associate's degree are least likely to be married with 100.0% of them unmarried at childbirth.
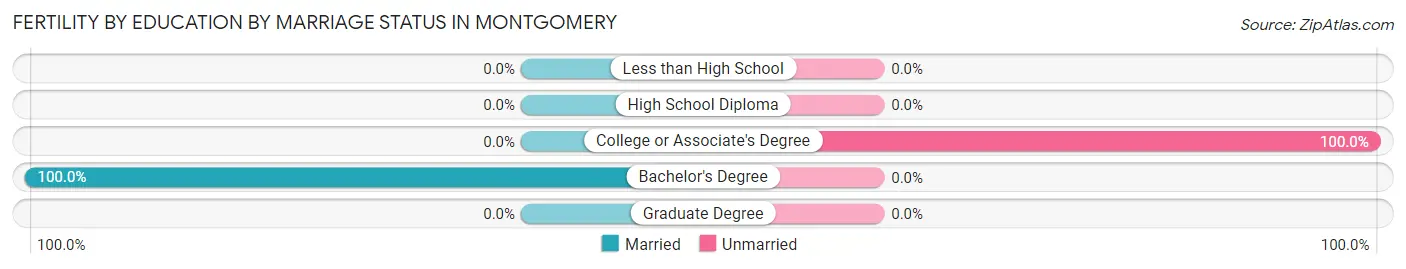
| Educational Attainment | Married | Unmarried |
| Less than High School | 0 (0.0%) | 0 (0.0%) |
| High School Diploma | 0 (0.0%) | 0 (0.0%) |
| College or Associate's Degree | 0 (0.0%) | 52 (100.0%) |
| Bachelor's Degree | 16 (100.0%) | 0 (0.0%) |
| Graduate Degree | 0 (0.0%) | 0 (0.0%) |
| Total | 16 (23.5%) | 52 (76.5%) |
Income in Montgomery
Income Overview in Montgomery
Per Capita Income in Montgomery is $44,796, while median incomes of families and households are $118,854 and $88,828 respectively.
| Characteristic | Number | Measure |
| Per Capita Income | 4,606 | $44,796 |
| Median Family Income | 1,396 | $118,854 |
| Mean Family Income | 1,396 | $129,272 |
| Median Household Income | 1,861 | $88,828 |
| Mean Household Income | 1,861 | $112,620 |
| Income Deficit | 1,396 | $0 |
| Wage / Income Gap (%) | 4,606 | 39.38% |
| Wage / Income Gap ($) | 4,606 | 60.62¢ per $1 |
| Gini / Inequality Index | 4,606 | 0.43 |
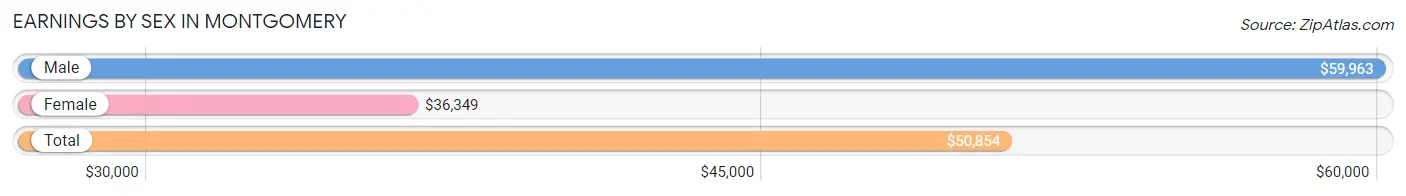
Earnings by Sex in Montgomery
Average Earnings in Montgomery are $50,854, $59,963 for men and $36,349 for women, a difference of 39.4%.
| Sex | Number | Average Earnings |
| Male | 1,400 (56.0%) | $59,963 |
| Female | 1,102 (44.0%) | $36,349 |
| Total | 2,502 (100.0%) | $50,854 |
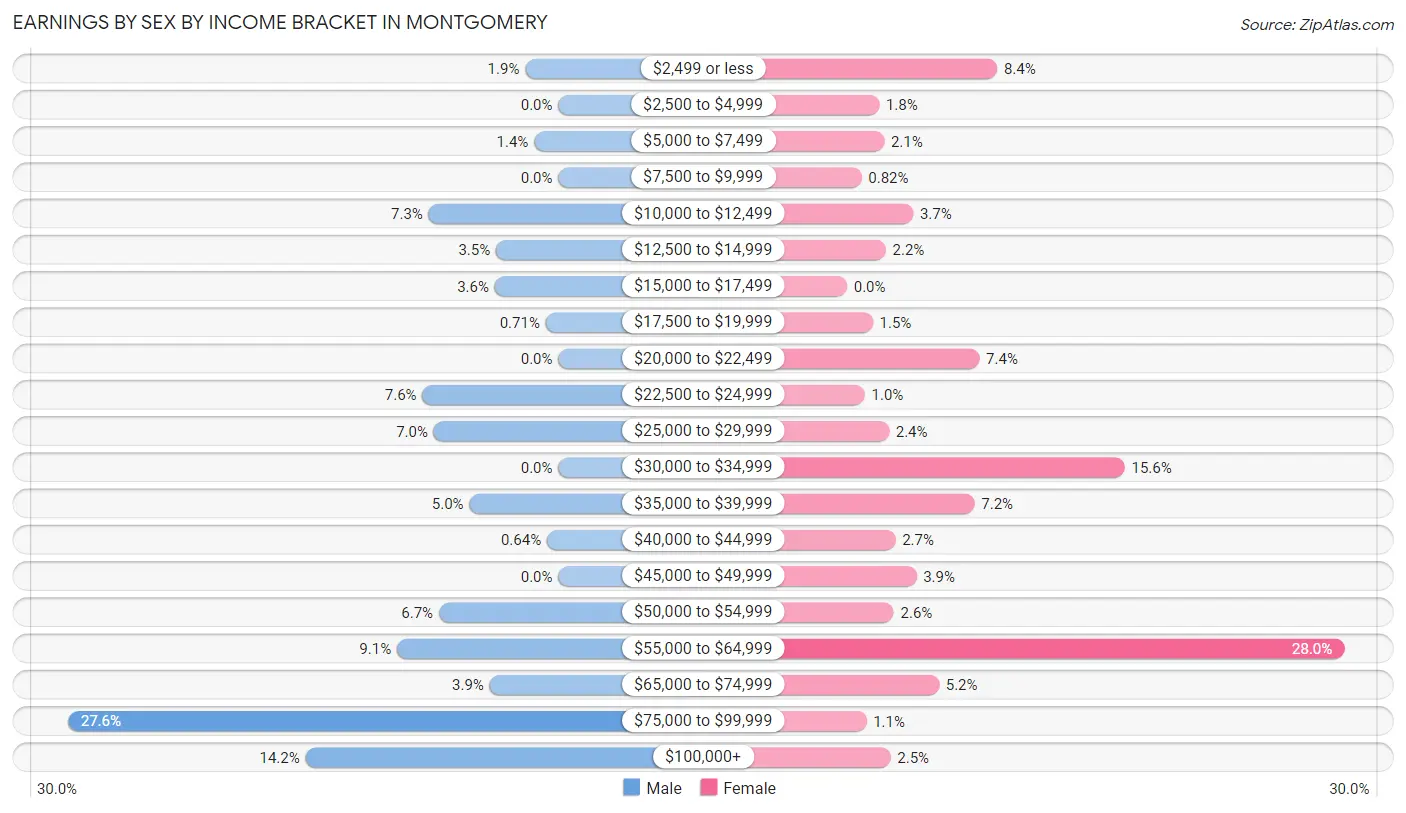
Earnings by Sex by Income Bracket in Montgomery
The most common earnings brackets in Montgomery are $75,000 to $99,999 for men (386 | 27.6%) and $55,000 to $64,999 for women (308 | 28.0%).
| Income | Male | Female |
| $2,499 or less | 26 (1.9%) | 93 (8.4%) |
| $2,500 to $4,999 | 0 (0.0%) | 20 (1.8%) |
| $5,000 to $7,499 | 19 (1.4%) | 23 (2.1%) |
| $7,500 to $9,999 | 0 (0.0%) | 9 (0.8%) |
| $10,000 to $12,499 | 102 (7.3%) | 41 (3.7%) |
| $12,500 to $14,999 | 49 (3.5%) | 24 (2.2%) |
| $15,000 to $17,499 | 50 (3.6%) | 0 (0.0%) |
| $17,500 to $19,999 | 10 (0.7%) | 16 (1.5%) |
| $20,000 to $22,499 | 0 (0.0%) | 82 (7.4%) |
| $22,500 to $24,999 | 107 (7.6%) | 11 (1.0%) |
| $25,000 to $29,999 | 98 (7.0%) | 26 (2.4%) |
| $30,000 to $34,999 | 0 (0.0%) | 172 (15.6%) |
| $35,000 to $39,999 | 70 (5.0%) | 79 (7.2%) |
| $40,000 to $44,999 | 9 (0.6%) | 30 (2.7%) |
| $45,000 to $49,999 | 0 (0.0%) | 43 (3.9%) |
| $50,000 to $54,999 | 94 (6.7%) | 29 (2.6%) |
| $55,000 to $64,999 | 127 (9.1%) | 308 (28.0%) |
| $65,000 to $74,999 | 54 (3.9%) | 57 (5.2%) |
| $75,000 to $99,999 | 386 (27.6%) | 12 (1.1%) |
| $100,000+ | 199 (14.2%) | 27 (2.5%) |
| Total | 1,400 (100.0%) | 1,102 (100.0%) |
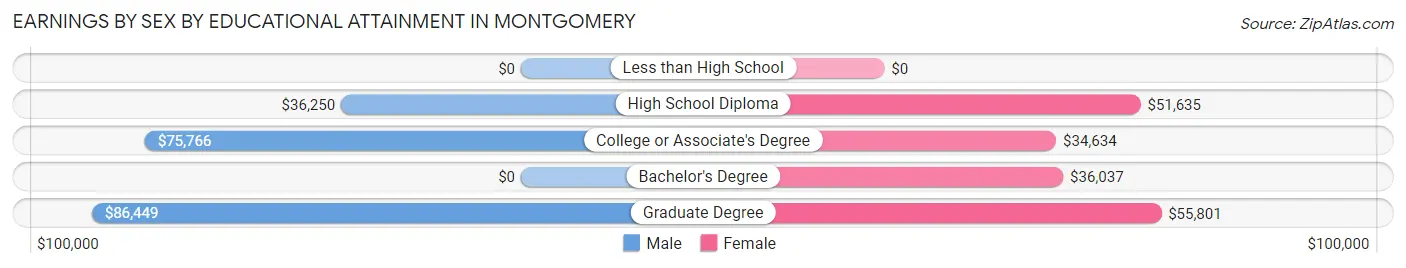
Earnings by Sex by Educational Attainment in Montgomery
Average earnings in Montgomery are $69,079 for men and $40,885 for women, a difference of 40.8%. Men with an educational attainment of graduate degree enjoy the highest average annual earnings of $86,449, while those with high school diploma education earn the least with $36,250. Women with an educational attainment of graduate degree earn the most with the average annual earnings of $55,801, while those with college or associate's degree education have the smallest earnings of $34,634.
| Educational Attainment | Male Income | Female Income |
| Less than High School | - | - |
| High School Diploma | $36,250 | $51,635 |
| College or Associate's Degree | $75,766 | $34,634 |
| Bachelor's Degree | - | - |
| Graduate Degree | $86,449 | $55,801 |
| Total | $69,079 | $40,885 |
Family Income in Montgomery
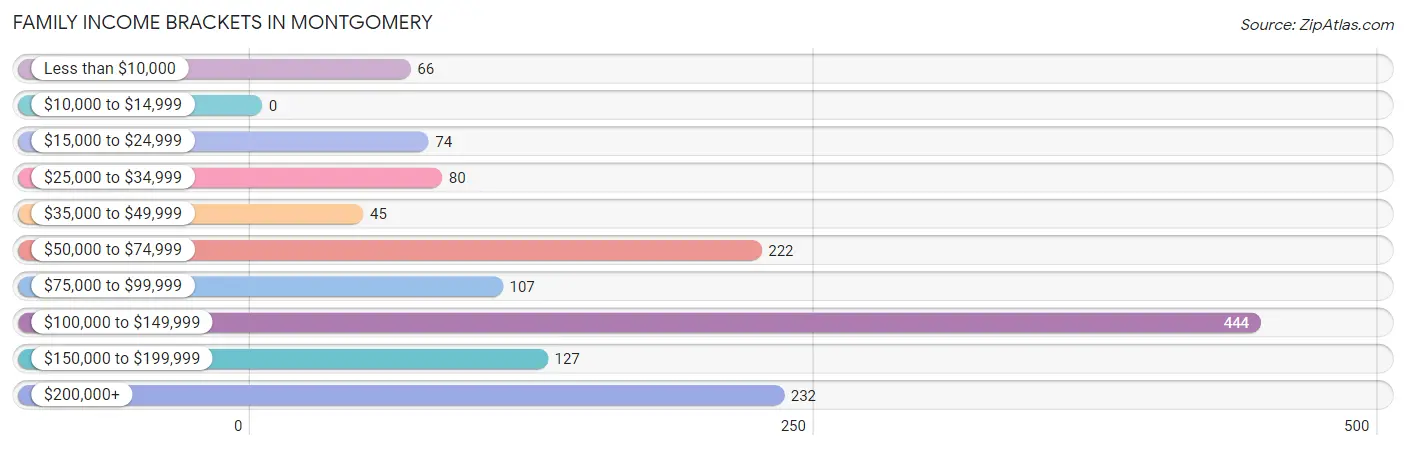
Family Income Brackets in Montgomery
According to the Montgomery family income data, there are 444 families falling into the $100,000 to $149,999 income range, which is the most common income bracket and makes up 31.8% of all families.
| Income Bracket | # Families | % Families |
| Less than $10,000 | 66 | 4.7% |
| $10,000 to $14,999 | 0 | 0.0% |
| $15,000 to $24,999 | 74 | 5.3% |
| $25,000 to $34,999 | 80 | 5.7% |
| $35,000 to $49,999 | 45 | 3.2% |
| $50,000 to $74,999 | 222 | 15.9% |
| $75,000 to $99,999 | 107 | 7.7% |
| $100,000 to $149,999 | 444 | 31.8% |
| $150,000 to $199,999 | 127 | 9.1% |
| $200,000+ | 232 | 16.6% |
Family Income by Famaliy Size in Montgomery
2-person families (780 | 55.9%) account for the highest median family income in Montgomery with $120,673 per family, while 2-person families (780 | 55.9%) have the highest median income of $60,336 per family member.
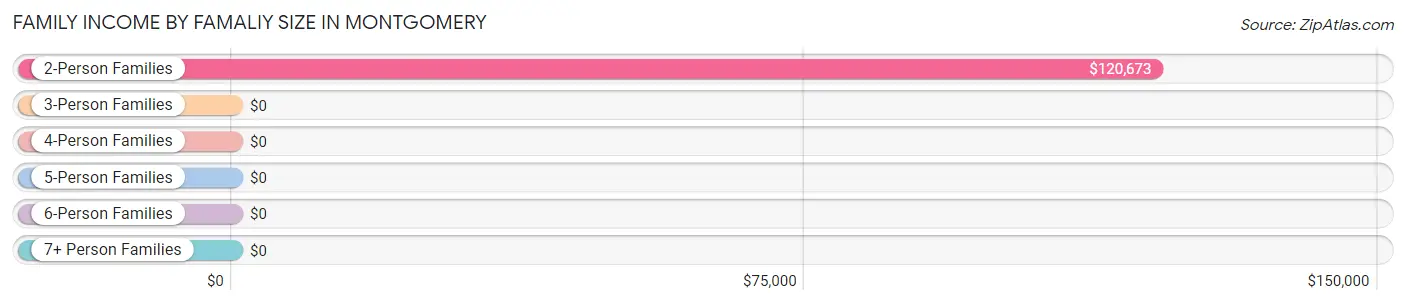
| Income Bracket | # Families | Median Income |
| 2-Person Families | 780 (55.9%) | $120,673 |
| 3-Person Families | 217 (15.5%) | $0 |
| 4-Person Families | 305 (21.8%) | $0 |
| 5-Person Families | 94 (6.7%) | $0 |
| 6-Person Families | 0 (0.0%) | $0 |
| 7+ Person Families | 0 (0.0%) | $0 |
| Total | 1,396 (100.0%) | $118,854 |
Family Income by Number of Earners in Montgomery
The median family income in Montgomery is $118,854, with families comprising 3+ earners (172) having the highest median family income of $165,735, while families with 1 earner (370) have the lowest median family income of $58,897, accounting for 12.3% and 26.5% of families, respectively.
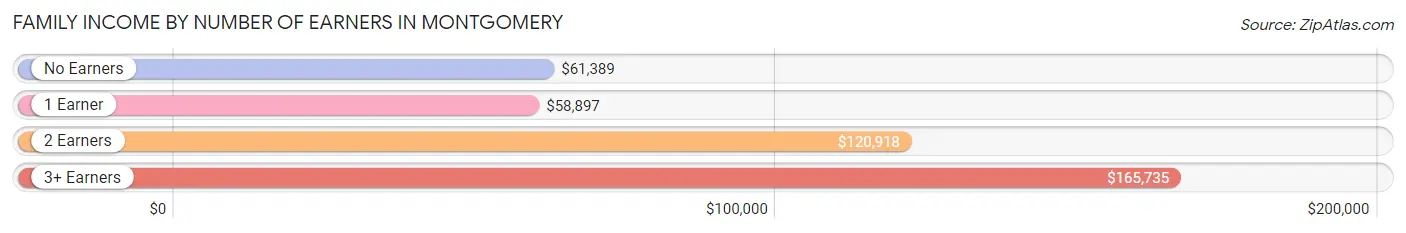
| Number of Earners | # Families | Median Income |
| No Earners | 186 (13.3%) | $61,389 |
| 1 Earner | 370 (26.5%) | $58,897 |
| 2 Earners | 668 (47.8%) | $120,918 |
| 3+ Earners | 172 (12.3%) | $165,735 |
| Total | 1,396 (100.0%) | $118,854 |
Household Income in Montgomery
Household Income Brackets in Montgomery
With 506 households falling in the category, the $100,000 to $149,999 income range is the most frequent in Montgomery, accounting for 27.2% of all households.
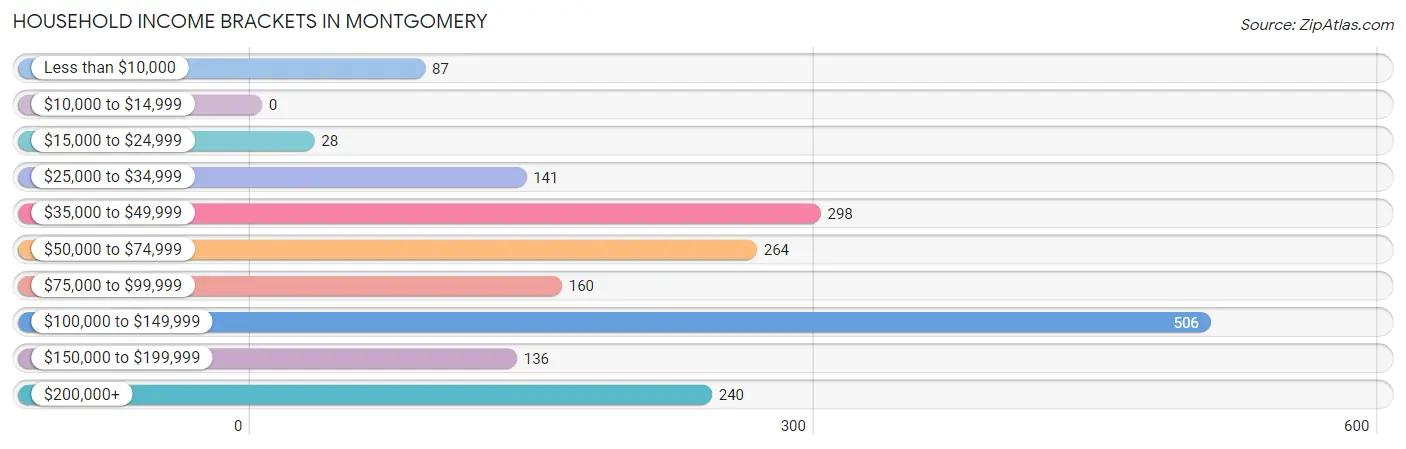
| Income Bracket | # Households | % Households |
| Less than $10,000 | 87 | 4.7% |
| $10,000 to $14,999 | 0 | 0.0% |
| $15,000 to $24,999 | 28 | 1.5% |
| $25,000 to $34,999 | 141 | 7.6% |
| $35,000 to $49,999 | 298 | 16.0% |
| $50,000 to $74,999 | 264 | 14.2% |
| $75,000 to $99,999 | 160 | 8.6% |
| $100,000 to $149,999 | 506 | 27.2% |
| $150,000 to $199,999 | 136 | 7.3% |
| $200,000+ | 240 | 12.9% |
Household Income by Householder Age in Montgomery
The median household income in Montgomery is $88,828, with the highest median household income of $120,179 found in the 25 to 44 years age bracket for the primary householder. A total of 651 households (35.0%) fall into this category. Meanwhile, the 15 to 24 years age bracket for the primary householder has the lowest median household income of $0, with 55 households (3.0%) in this group.
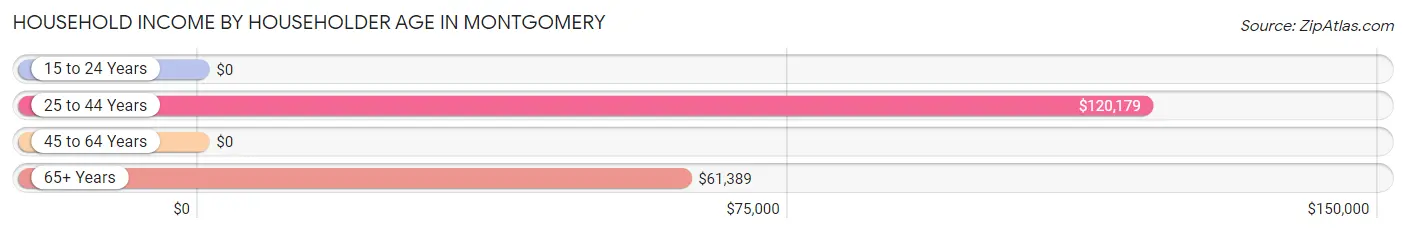
| Income Bracket | # Households | Median Income |
| 15 to 24 Years | 55 (3.0%) | $0 |
| 25 to 44 Years | 651 (35.0%) | $120,179 |
| 45 to 64 Years | 667 (35.8%) | $0 |
| 65+ Years | 488 (26.2%) | $61,389 |
| Total | 1,861 (100.0%) | $88,828 |
Poverty in Montgomery
Income Below Poverty by Sex and Age in Montgomery
With 11.8% poverty level for males and 10.1% for females among the residents of Montgomery, 12 to 14 year old males and 55 to 64 year old females are the most vulnerable to poverty, with 73 males (82.0%) and 52 females (28.4%) in their respective age groups living below the poverty level.
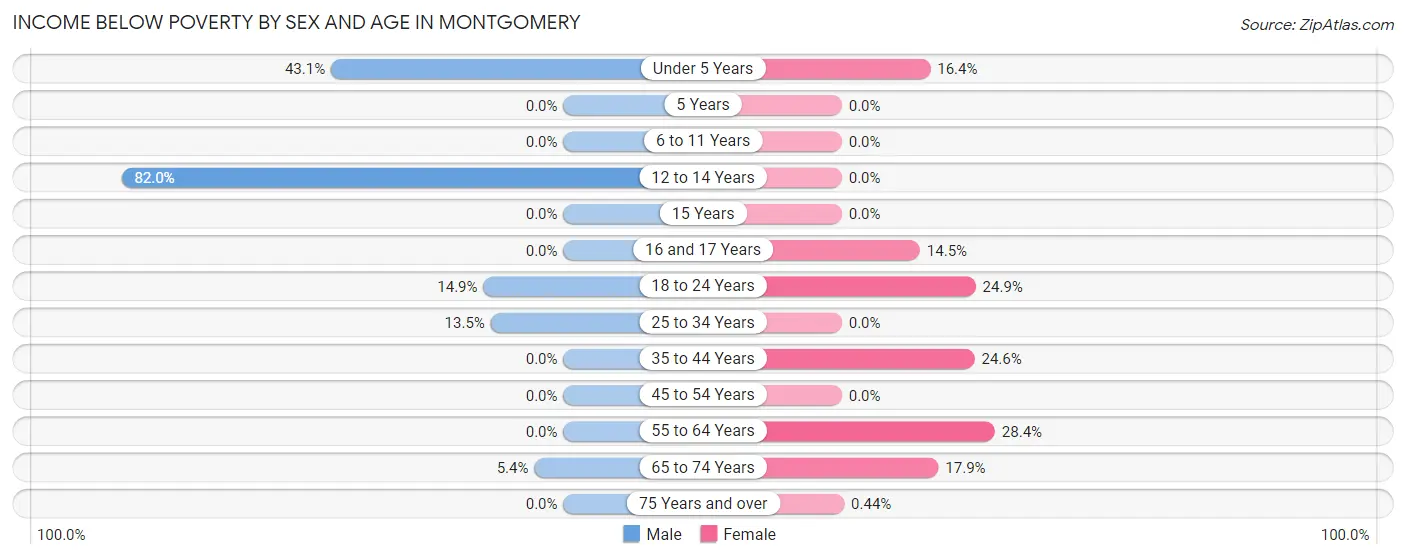
| Age Bracket | Male | Female |
| Under 5 Years | 91 (43.1%) | 11 (16.4%) |
| 5 Years | 0 (0.0%) | 0 (0.0%) |
| 6 to 11 Years | 0 (0.0%) | 0 (0.0%) |
| 12 to 14 Years | 73 (82.0%) | 0 (0.0%) |
| 15 Years | 0 (0.0%) | 0 (0.0%) |
| 16 and 17 Years | 0 (0.0%) | 19 (14.5%) |
| 18 to 24 Years | 30 (14.8%) | 84 (24.8%) |
| 25 to 34 Years | 53 (13.5%) | 0 (0.0%) |
| 35 to 44 Years | 0 (0.0%) | 52 (24.6%) |
| 45 to 54 Years | 0 (0.0%) | 0 (0.0%) |
| 55 to 64 Years | 0 (0.0%) | 52 (28.4%) |
| 65 to 74 Years | 9 (5.4%) | 26 (17.9%) |
| 75 Years and over | 0 (0.0%) | 2 (0.4%) |
| Total | 256 (11.8%) | 246 (10.1%) |
Income Above Poverty by Sex and Age in Montgomery
According to the poverty statistics in Montgomery, males aged 6 to 11 years and females aged 6 to 11 years are the age groups that are most secure financially, with 100.0% of males and 100.0% of females in these age groups living above the poverty line.
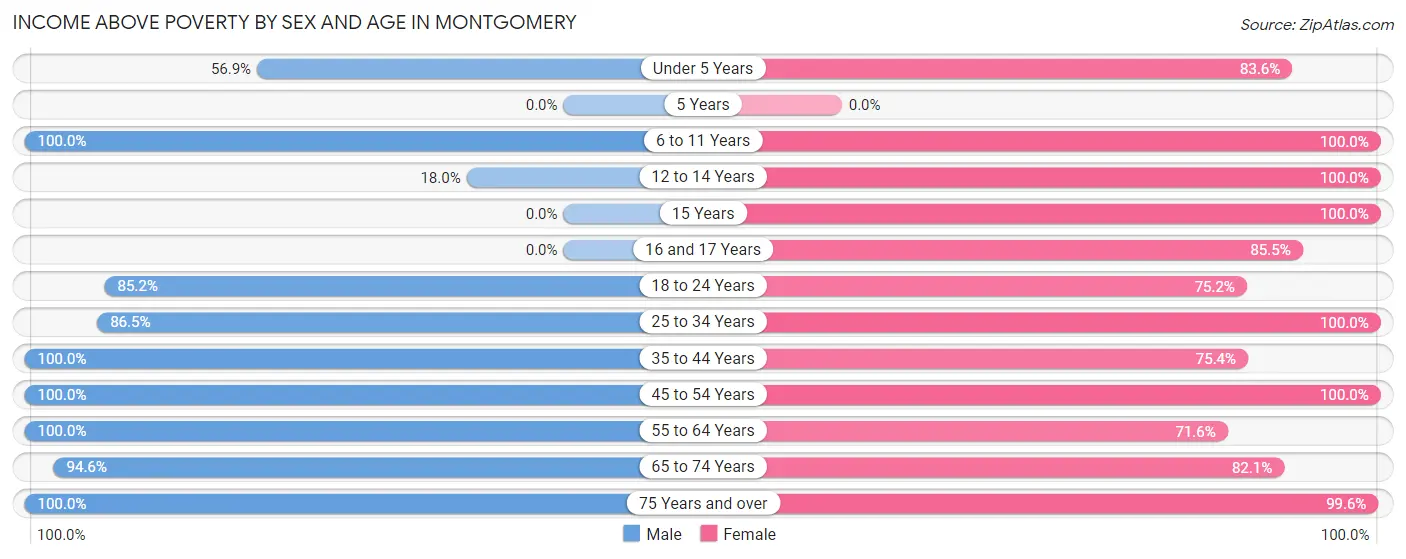
| Age Bracket | Male | Female |
| Under 5 Years | 120 (56.9%) | 56 (83.6%) |
| 5 Years | 0 (0.0%) | 0 (0.0%) |
| 6 to 11 Years | 59 (100.0%) | 138 (100.0%) |
| 12 to 14 Years | 16 (18.0%) | 11 (100.0%) |
| 15 Years | 0 (0.0%) | 27 (100.0%) |
| 16 and 17 Years | 0 (0.0%) | 112 (85.5%) |
| 18 to 24 Years | 172 (85.2%) | 254 (75.1%) |
| 25 to 34 Years | 340 (86.5%) | 258 (100.0%) |
| 35 to 44 Years | 518 (100.0%) | 159 (75.4%) |
| 45 to 54 Years | 262 (100.0%) | 474 (100.0%) |
| 55 to 64 Years | 140 (100.0%) | 131 (71.6%) |
| 65 to 74 Years | 158 (94.6%) | 119 (82.1%) |
| 75 Years and over | 125 (100.0%) | 455 (99.6%) |
| Total | 1,910 (88.2%) | 2,194 (89.9%) |
Income Below Poverty Among Married-Couple Families in Montgomery
The poverty statistics for married-couple families in Montgomery show that 2.1% or 25 of the total 1,164 families live below the poverty line. Families with 1 or 2 children have the highest poverty rate of 6.0%, comprising of 16 families. On the other hand, families with 3 or 4 children have the lowest poverty rate of 0.0%, which includes 0 families.
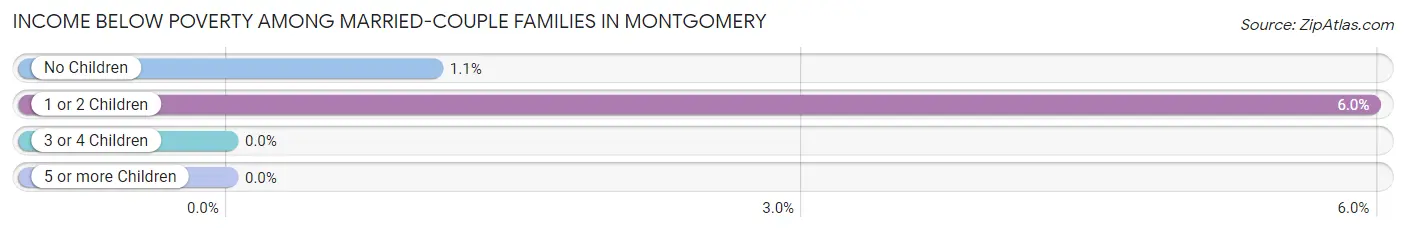
| Children | Above Poverty | Below Poverty |
| No Children | 831 (98.9%) | 9 (1.1%) |
| 1 or 2 Children | 252 (94.0%) | 16 (6.0%) |
| 3 or 4 Children | 56 (100.0%) | 0 (0.0%) |
| 5 or more Children | 0 (0.0%) | 0 (0.0%) |
| Total | 1,139 (97.9%) | 25 (2.1%) |
Income Below Poverty Among Single-Parent Households in Montgomery
According to the poverty data in Montgomery, 70.0% or 42 single-father households and 23.8% or 41 single-mother households are living below the poverty line. Among single-father households, those with 1 or 2 children have the highest poverty rate, with 42 households (100.0%) experiencing poverty. Likewise, among single-mother households, those with 1 or 2 children have the highest poverty rate, with 41 households (51.2%) falling below the poverty line.

| Children | Single Father | Single Mother |
| No Children | 0 (0.0%) | 0 (0.0%) |
| 1 or 2 Children | 42 (100.0%) | 41 (51.2%) |
| 3 or 4 Children | 0 (0.0%) | 0 (0.0%) |
| 5 or more Children | 0 (0.0%) | 0 (0.0%) |
| Total | 42 (70.0%) | 41 (23.8%) |
Income Below Poverty Among Married-Couple vs Single-Parent Households in Montgomery
The poverty data for Montgomery shows that 25 of the married-couple family households (2.1%) and 83 of the single-parent households (35.8%) are living below the poverty level. Within the married-couple family households, those with 1 or 2 children have the highest poverty rate, with 16 households (6.0%) falling below the poverty line. Among the single-parent households, those with 1 or 2 children have the highest poverty rate, with 83 household (68.0%) living below poverty.
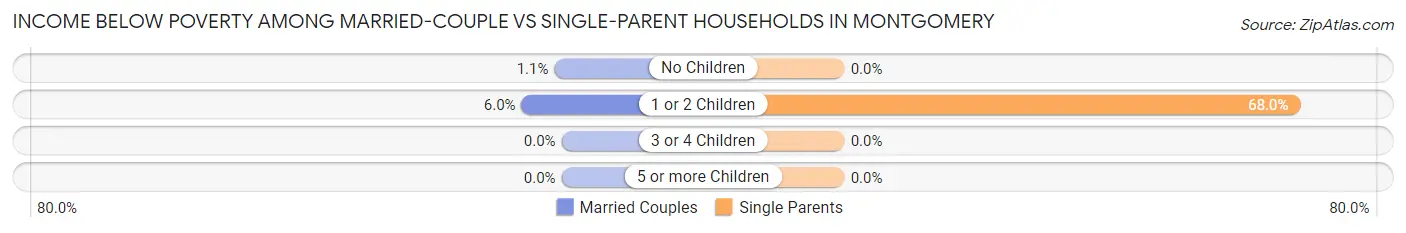
| Children | Married-Couple Families | Single-Parent Households |
| No Children | 9 (1.1%) | 0 (0.0%) |
| 1 or 2 Children | 16 (6.0%) | 83 (68.0%) |
| 3 or 4 Children | 0 (0.0%) | 0 (0.0%) |
| 5 or more Children | 0 (0.0%) | 0 (0.0%) |
| Total | 25 (2.1%) | 83 (35.8%) |
Employment Characteristics in Montgomery
Employment by Class of Employer in Montgomery
Among the 2,261 employed individuals in Montgomery, private company employees (1,132 | 50.1%), not-for-profit organizations (450 | 19.9%), and self-employed (incorporated) (300 | 13.3%) make up the most common classes of employment.
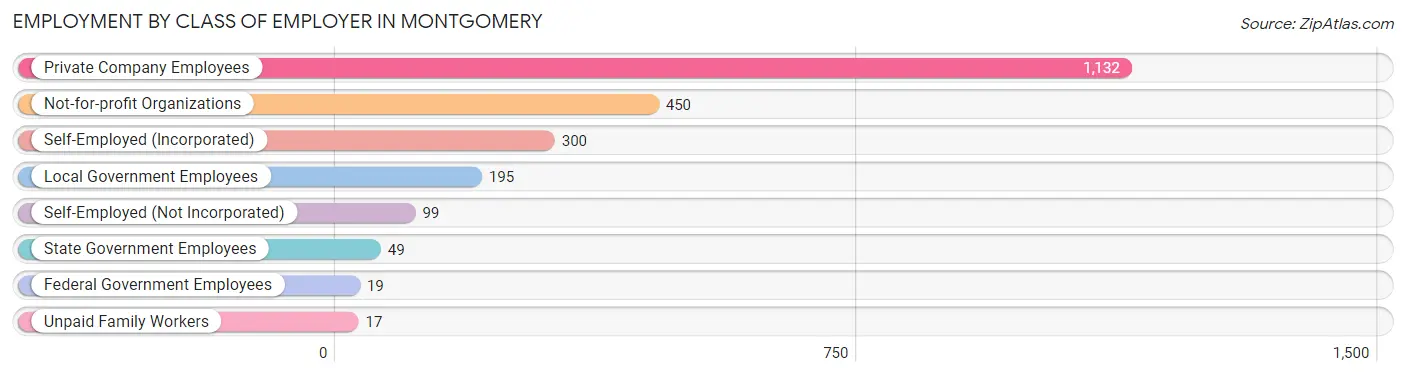
| Employer Class | # Employees | % Employees |
| Private Company Employees | 1,132 | 50.1% |
| Self-Employed (Incorporated) | 300 | 13.3% |
| Self-Employed (Not Incorporated) | 99 | 4.4% |
| Not-for-profit Organizations | 450 | 19.9% |
| Local Government Employees | 195 | 8.6% |
| State Government Employees | 49 | 2.2% |
| Federal Government Employees | 19 | 0.8% |
| Unpaid Family Workers | 17 | 0.7% |
| Total | 2,261 | 100.0% |
Employment Status by Age in Montgomery
According to the labor force statistics for Montgomery, out of the total population over 16 years of age (4,004), 60.0% or 2,402 individuals are in the labor force, with 1.9% or 46 of them unemployed. The age group with the highest labor force participation rate is 20 to 24 years, with 96.4% or 189 individuals in the labor force. Within the labor force, the 16 to 19 years age range has the highest percentage of unemployed individuals, with 30.8% or 28 of them being unemployed.
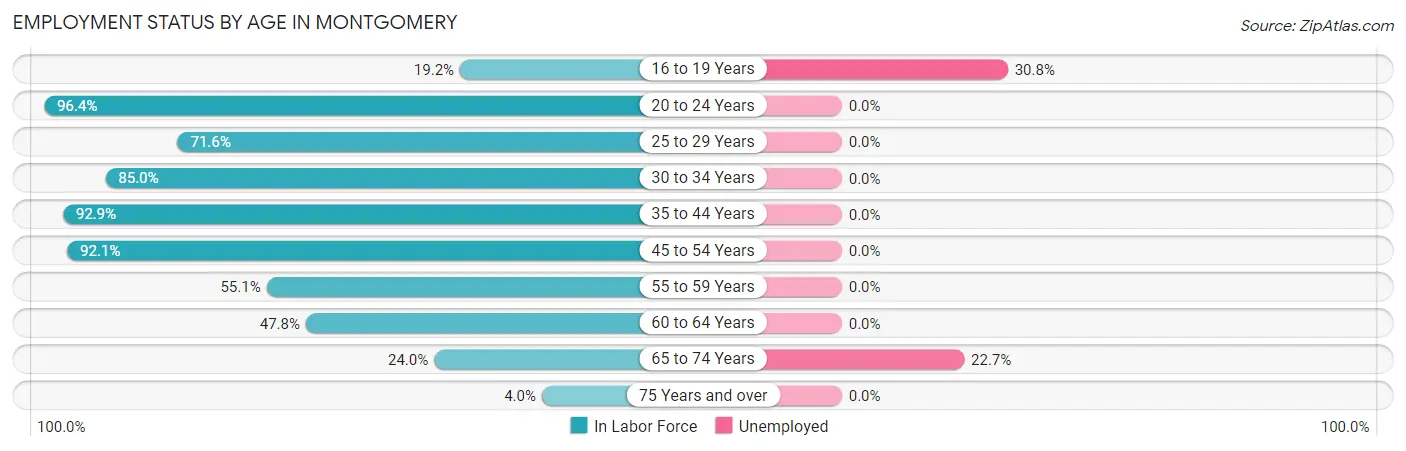
| Age Bracket | In Labor Force | Unemployed |
| 16 to 19 Years | 91 (19.2%) | 28 (30.8%) |
| 20 to 24 Years | 189 (96.4%) | 0 (0.0%) |
| 25 to 29 Years | 280 (71.6%) | 0 (0.0%) |
| 30 to 34 Years | 221 (85.0%) | 0 (0.0%) |
| 35 to 44 Years | 677 (92.9%) | 0 (0.0%) |
| 45 to 54 Years | 678 (92.1%) | 0 (0.0%) |
| 55 to 59 Years | 102 (55.1%) | 0 (0.0%) |
| 60 to 64 Years | 66 (47.8%) | 0 (0.0%) |
| 65 to 74 Years | 75 (24.0%) | 17 (22.7%) |
| 75 Years and over | 23 (4.0%) | 0 (0.0%) |
| Total | 2,402 (60.0%) | 46 (1.9%) |
Employment Status by Educational Attainment in Montgomery
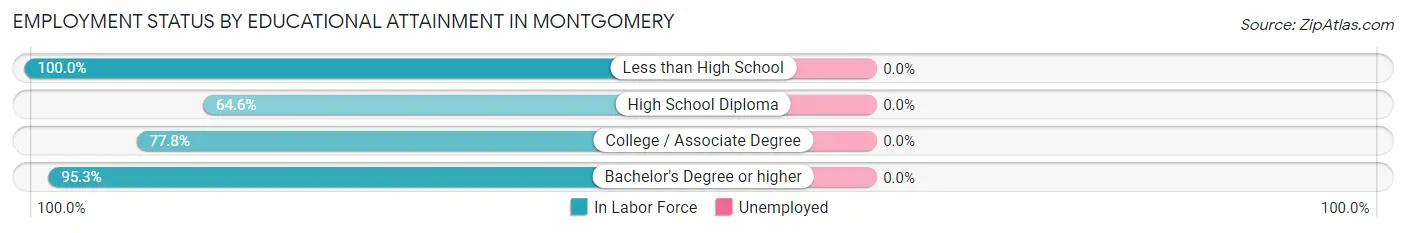
| Educational Attainment | In Labor Force | Unemployed |
| Less than High School | 32 (100.0%) | 0 (0.0%) |
| High School Diploma | 368 (64.6%) | 0 (0.0%) |
| College / Associate Degree | 563 (77.8%) | 0 (0.0%) |
| Bachelor's Degree or higher | 1,061 (95.3%) | 0 (0.0%) |
| Total | 2,024 (83.0%) | 0 (0.0%) |
Employment Occupations by Sex in Montgomery
Management, Business, Science and Arts Occupations
The most common Management, Business, Science and Arts occupations in Montgomery are Community & Social Service (550 | 23.5%), Education Instruction & Library (374 | 16.0%), Management (281 | 12.0%), Education, Arts & Media (106 | 4.5%), and Health Diagnosing & Treating (101 | 4.3%).
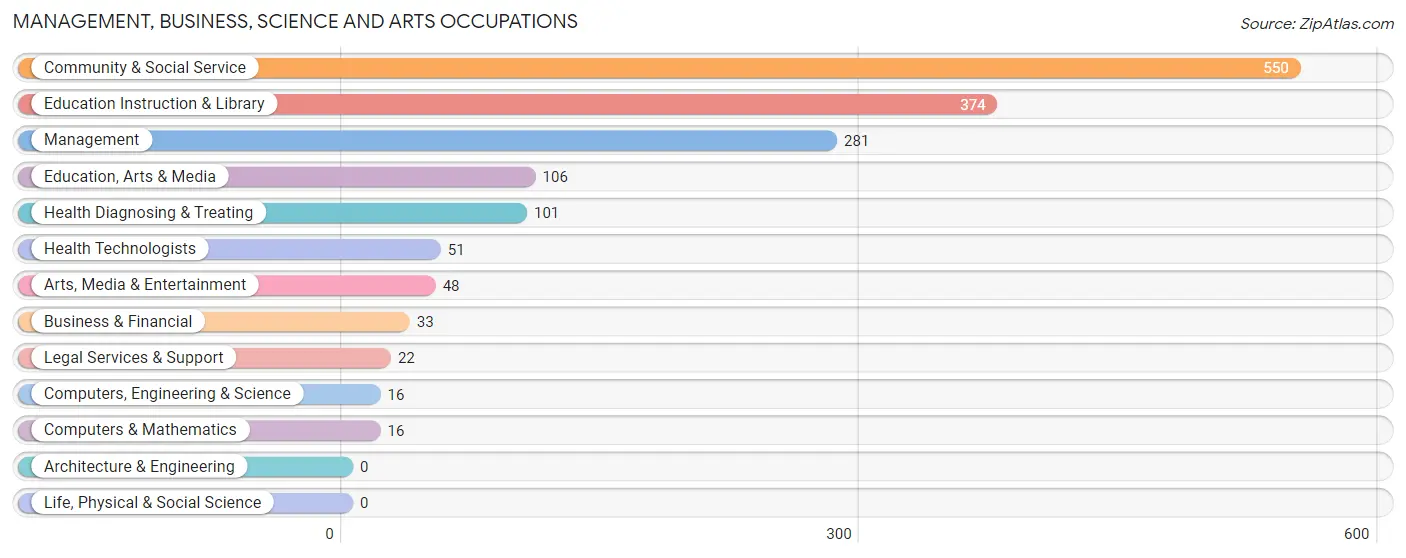
Management, Business, Science and Arts Occupations by Sex
Within the Management, Business, Science and Arts occupations in Montgomery, the most male-oriented occupations are Computers, Engineering & Science (100.0%), Computers & Mathematics (100.0%), and Legal Services & Support (100.0%), while the most female-oriented occupations are Business & Financial (100.0%), Health Diagnosing & Treating (67.3%), and Arts, Media & Entertainment (62.5%).
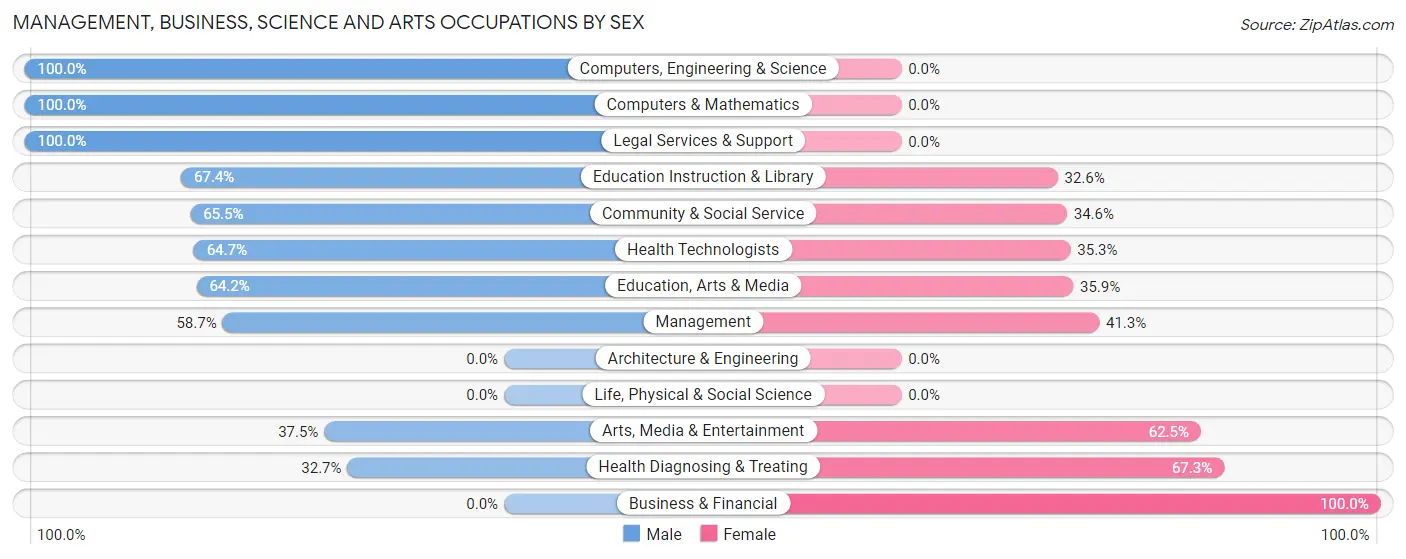
| Occupation | Male | Female |
| Management | 165 (58.7%) | 116 (41.3%) |
| Business & Financial | 0 (0.0%) | 33 (100.0%) |
| Computers, Engineering & Science | 16 (100.0%) | 0 (0.0%) |
| Computers & Mathematics | 16 (100.0%) | 0 (0.0%) |
| Architecture & Engineering | 0 (0.0%) | 0 (0.0%) |
| Life, Physical & Social Science | 0 (0.0%) | 0 (0.0%) |
| Community & Social Service | 360 (65.4%) | 190 (34.5%) |
| Education, Arts & Media | 68 (64.1%) | 38 (35.8%) |
| Legal Services & Support | 22 (100.0%) | 0 (0.0%) |
| Education Instruction & Library | 252 (67.4%) | 122 (32.6%) |
| Arts, Media & Entertainment | 18 (37.5%) | 30 (62.5%) |
| Health Diagnosing & Treating | 33 (32.7%) | 68 (67.3%) |
| Health Technologists | 33 (64.7%) | 18 (35.3%) |
| Total (Category) | 574 (58.5%) | 407 (41.5%) |
| Total (Overall) | 1,361 (58.2%) | 977 (41.8%) |
Services Occupations
The most common Services occupations in Montgomery are Food Preparation & Serving (242 | 10.3%), Security & Protection (166 | 7.1%), Firefighting & Prevention (107 | 4.6%), Cleaning & Maintenance (96 | 4.1%), and Healthcare Support (76 | 3.3%).

Services Occupations by Sex
Within the Services occupations in Montgomery, the most male-oriented occupations are Firefighting & Prevention (100.0%), Cleaning & Maintenance (100.0%), and Security & Protection (85.5%), while the most female-oriented occupations are Healthcare Support (100.0%), Personal Care & Service (100.0%), and Law Enforcement (40.7%).
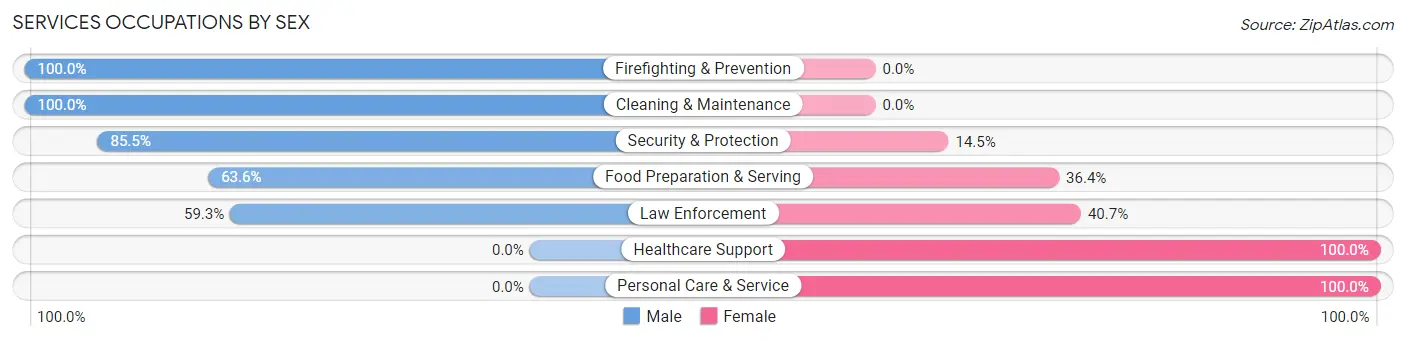
| Occupation | Male | Female |
| Healthcare Support | 0 (0.0%) | 76 (100.0%) |
| Security & Protection | 142 (85.5%) | 24 (14.5%) |
| Firefighting & Prevention | 107 (100.0%) | 0 (0.0%) |
| Law Enforcement | 35 (59.3%) | 24 (40.7%) |
| Food Preparation & Serving | 154 (63.6%) | 88 (36.4%) |
| Cleaning & Maintenance | 96 (100.0%) | 0 (0.0%) |
| Personal Care & Service | 0 (0.0%) | 25 (100.0%) |
| Total (Category) | 392 (64.8%) | 213 (35.2%) |
| Total (Overall) | 1,361 (58.2%) | 977 (41.8%) |
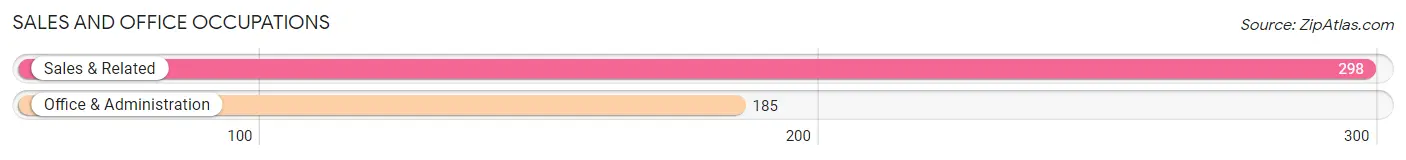
Sales and Office Occupations
The most common Sales and Office occupations in Montgomery are Sales & Related (298 | 12.8%), and Office & Administration (185 | 7.9%).
Sales and Office Occupations by Sex
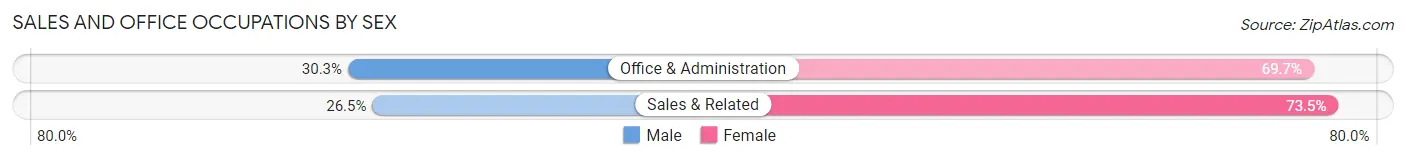
| Occupation | Male | Female |
| Sales & Related | 79 (26.5%) | 219 (73.5%) |
| Office & Administration | 56 (30.3%) | 129 (69.7%) |
| Total (Category) | 135 (28.0%) | 348 (72.1%) |
| Total (Overall) | 1,361 (58.2%) | 977 (41.8%) |
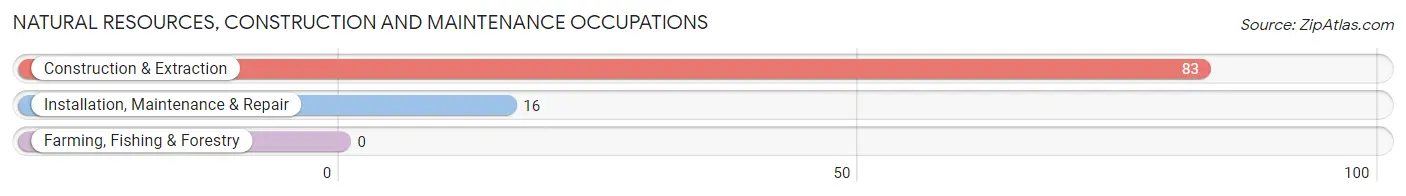
Natural Resources, Construction and Maintenance Occupations
The most common Natural Resources, Construction and Maintenance occupations in Montgomery are Construction & Extraction (83 | 3.5%), and Installation, Maintenance & Repair (16 | 0.7%).
Natural Resources, Construction and Maintenance Occupations by Sex
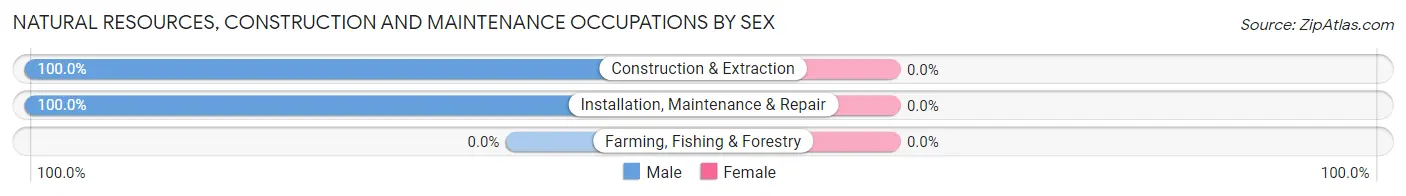
| Occupation | Male | Female |
| Farming, Fishing & Forestry | 0 (0.0%) | 0 (0.0%) |
| Construction & Extraction | 83 (100.0%) | 0 (0.0%) |
| Installation, Maintenance & Repair | 16 (100.0%) | 0 (0.0%) |
| Total (Category) | 99 (100.0%) | 0 (0.0%) |
| Total (Overall) | 1,361 (58.2%) | 977 (41.8%) |
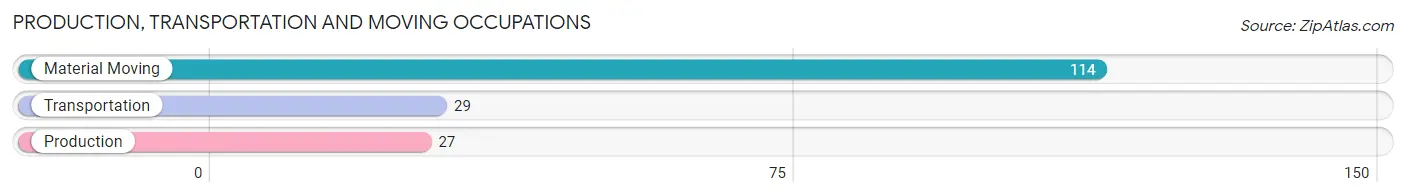
Production, Transportation and Moving Occupations
The most common Production, Transportation and Moving occupations in Montgomery are Material Moving (114 | 4.9%), Transportation (29 | 1.2%), and Production (27 | 1.1%).
Production, Transportation and Moving Occupations by Sex
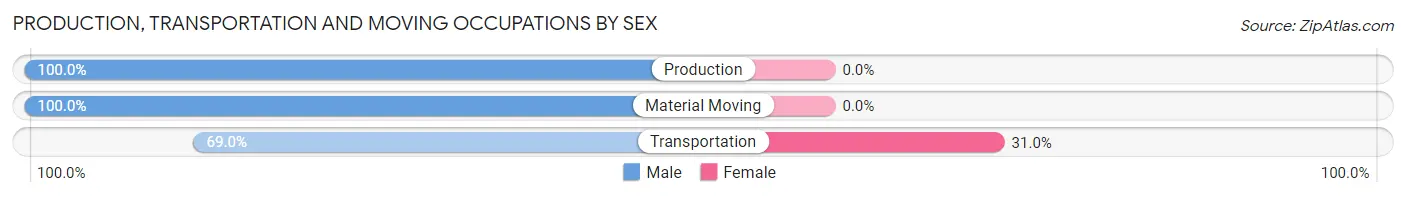
| Occupation | Male | Female |
| Production | 27 (100.0%) | 0 (0.0%) |
| Transportation | 20 (69.0%) | 9 (31.0%) |
| Material Moving | 114 (100.0%) | 0 (0.0%) |
| Total (Category) | 161 (94.7%) | 9 (5.3%) |
| Total (Overall) | 1,361 (58.2%) | 977 (41.8%) |
Employment Industries by Sex in Montgomery
Employment Industries in Montgomery
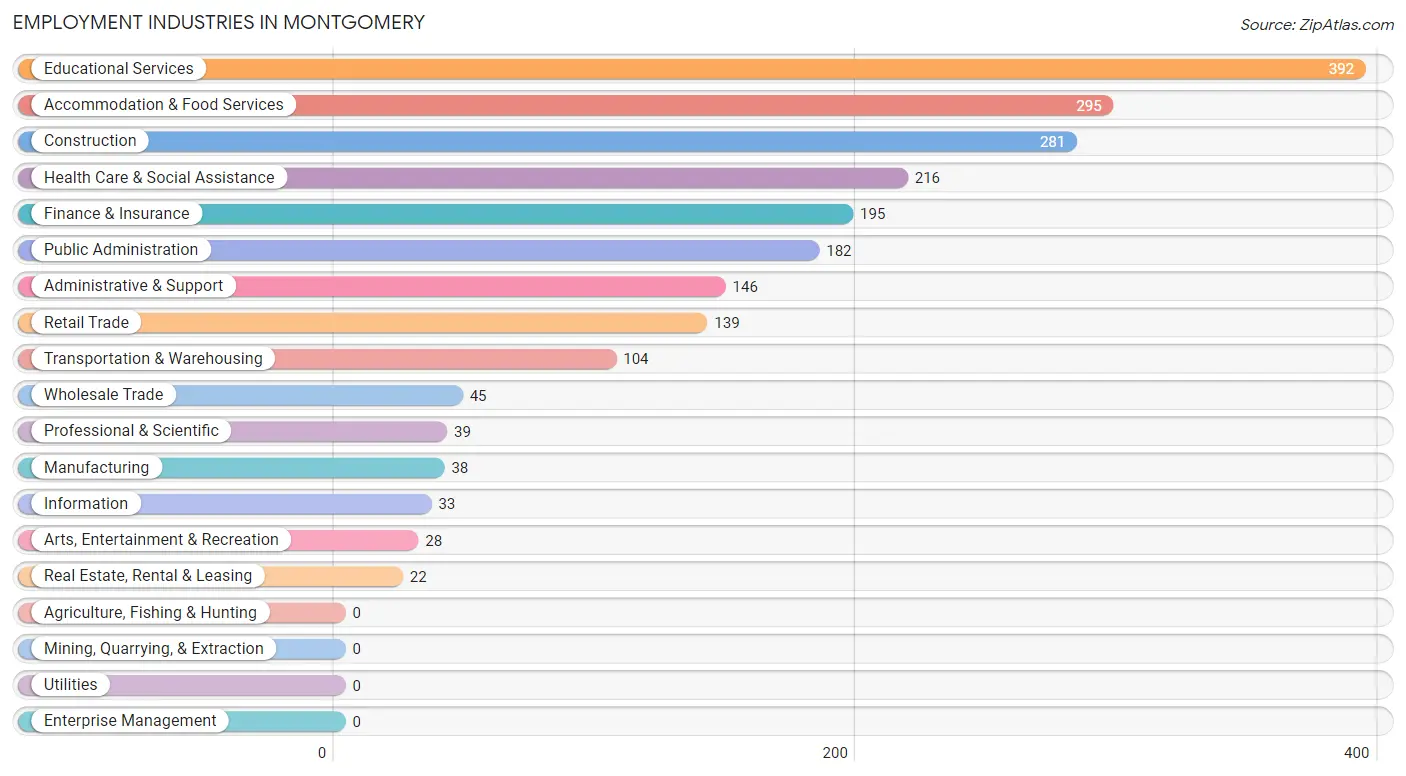
The major employment industries in Montgomery include Educational Services (392 | 16.8%), Accommodation & Food Services (295 | 12.6%), Construction (281 | 12.0%), Health Care & Social Assistance (216 | 9.2%), and Finance & Insurance (195 | 8.3%).
Employment Industries by Sex in Montgomery
The Montgomery industries that see more men than women are Manufacturing (100.0%), Transportation & Warehousing (100.0%), and Public Administration (86.8%), whereas the industries that tend to have a higher number of women are Finance & Insurance (100.0%), Real Estate, Rental & Leasing (100.0%), and Arts, Entertainment & Recreation (100.0%).
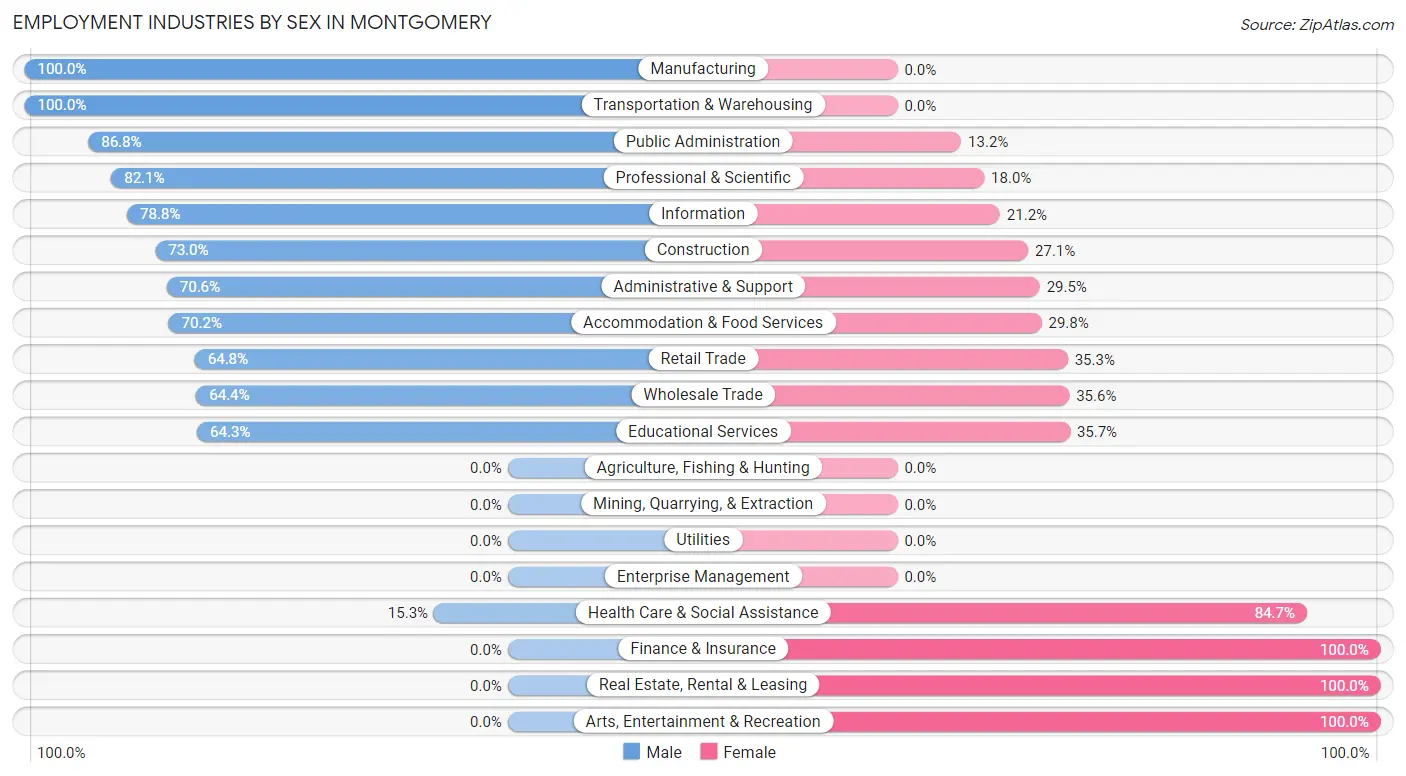
| Industry | Male | Female |
| Agriculture, Fishing & Hunting | 0 (0.0%) | 0 (0.0%) |
| Mining, Quarrying, & Extraction | 0 (0.0%) | 0 (0.0%) |
| Construction | 205 (73.0%) | 76 (27.1%) |
| Manufacturing | 38 (100.0%) | 0 (0.0%) |
| Wholesale Trade | 29 (64.4%) | 16 (35.6%) |
| Retail Trade | 90 (64.7%) | 49 (35.2%) |
| Transportation & Warehousing | 104 (100.0%) | 0 (0.0%) |
| Utilities | 0 (0.0%) | 0 (0.0%) |
| Information | 26 (78.8%) | 7 (21.2%) |
| Finance & Insurance | 0 (0.0%) | 195 (100.0%) |
| Real Estate, Rental & Leasing | 0 (0.0%) | 22 (100.0%) |
| Professional & Scientific | 32 (82.1%) | 7 (17.9%) |
| Enterprise Management | 0 (0.0%) | 0 (0.0%) |
| Administrative & Support | 103 (70.6%) | 43 (29.4%) |
| Educational Services | 252 (64.3%) | 140 (35.7%) |
| Health Care & Social Assistance | 33 (15.3%) | 183 (84.7%) |
| Arts, Entertainment & Recreation | 0 (0.0%) | 28 (100.0%) |
| Accommodation & Food Services | 207 (70.2%) | 88 (29.8%) |
| Public Administration | 158 (86.8%) | 24 (13.2%) |
| Total | 1,361 (58.2%) | 977 (41.8%) |
Education in Montgomery
School Enrollment in Montgomery
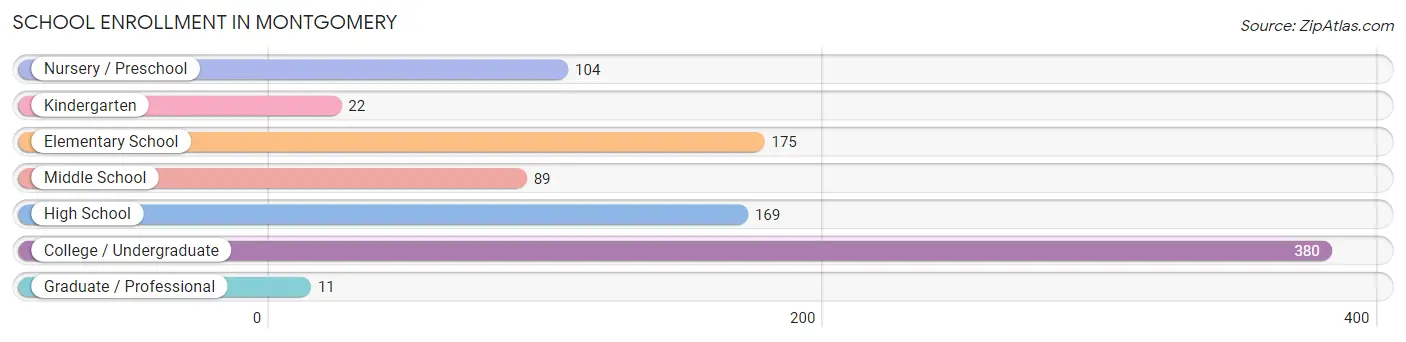
The most common levels of schooling among the 950 students in Montgomery are college / undergraduate (380 | 40.0%), elementary school (175 | 18.4%), and high school (169 | 17.8%).
| School Level | # Students | % Students |
| Nursery / Preschool | 104 | 11.0% |
| Kindergarten | 22 | 2.3% |
| Elementary School | 175 | 18.4% |
| Middle School | 89 | 9.4% |
| High School | 169 | 17.8% |
| College / Undergraduate | 380 | 40.0% |
| Graduate / Professional | 11 | 1.2% |
| Total | 950 | 100.0% |
School Enrollment by Age by Funding Source in Montgomery
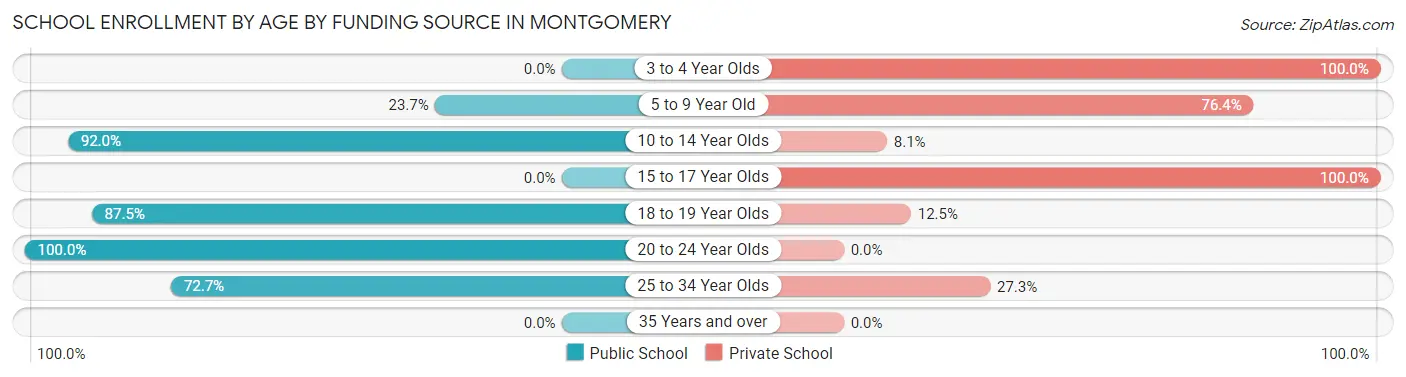
Out of a total of 950 students who are enrolled in schools in Montgomery, 438 (46.1%) attend a private institution, while the remaining 512 (53.9%) are enrolled in public schools. The age group of 3 to 4 year olds has the highest likelihood of being enrolled in private schools, with 104 (100.0% in the age bracket) enrolled. Conversely, the age group of 20 to 24 year olds has the lowest likelihood of being enrolled in a private school, with 61 (100.0% in the age bracket) attending a public institution.
| Age Bracket | Public School | Private School |
| 3 to 4 Year Olds | 0 (0.0%) | 104 (100.0%) |
| 5 to 9 Year Old | 35 (23.6%) | 113 (76.3%) |
| 10 to 14 Year Olds | 137 (91.9%) | 12 (8.1%) |
| 15 to 17 Year Olds | 0 (0.0%) | 158 (100.0%) |
| 18 to 19 Year Olds | 231 (87.5%) | 33 (12.5%) |
| 20 to 24 Year Olds | 61 (100.0%) | 0 (0.0%) |
| 25 to 34 Year Olds | 48 (72.7%) | 18 (27.3%) |
| 35 Years and over | 0 (0.0%) | 0 (0.0%) |
| Total | 512 (53.9%) | 438 (46.1%) |
Educational Attainment by Field of Study in Montgomery
Business (397 | 27.5%), literature & languages (354 | 24.5%), science & technology (114 | 7.9%), visual & performing arts (96 | 6.7%), and arts & humanities (96 | 6.7%) are the most common fields of study among 1,444 individuals in Montgomery who have obtained a bachelor's degree or higher.
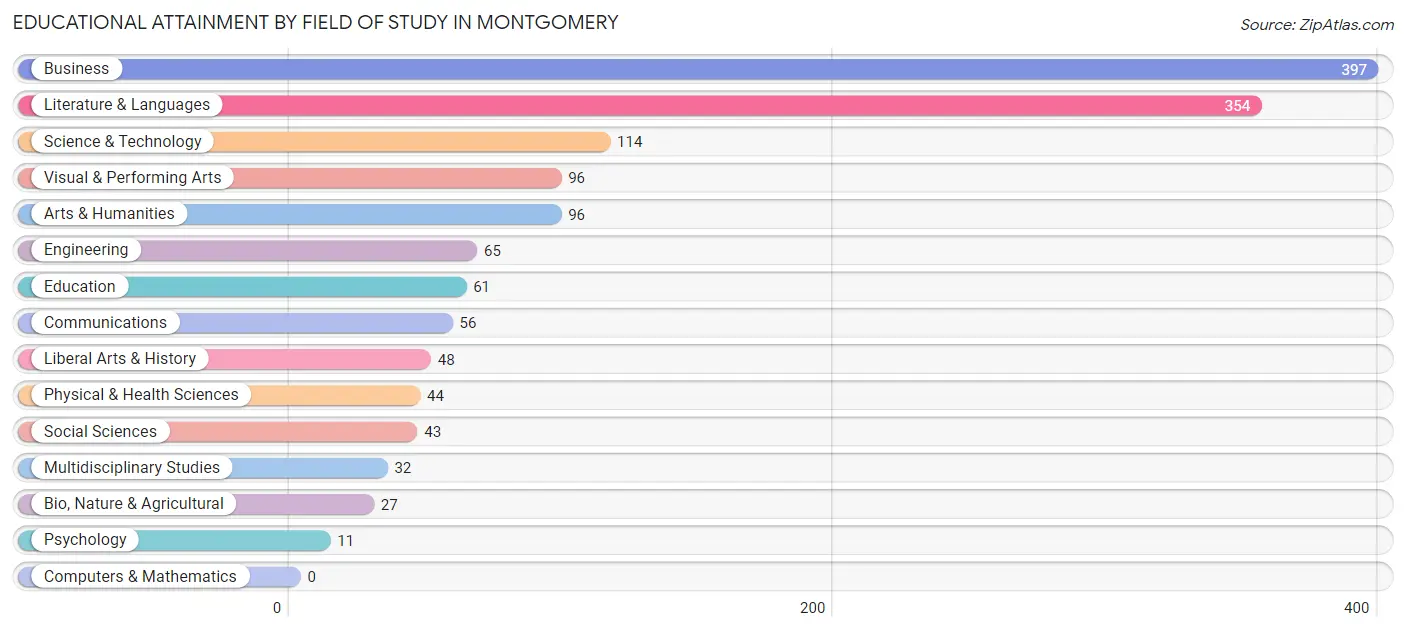
| Field of Study | # Graduates | % Graduates |
| Computers & Mathematics | 0 | 0.0% |
| Bio, Nature & Agricultural | 27 | 1.9% |
| Physical & Health Sciences | 44 | 3.0% |
| Psychology | 11 | 0.8% |
| Social Sciences | 43 | 3.0% |
| Engineering | 65 | 4.5% |
| Multidisciplinary Studies | 32 | 2.2% |
| Science & Technology | 114 | 7.9% |
| Business | 397 | 27.5% |
| Education | 61 | 4.2% |
| Literature & Languages | 354 | 24.5% |
| Liberal Arts & History | 48 | 3.3% |
| Visual & Performing Arts | 96 | 6.7% |
| Communications | 56 | 3.9% |
| Arts & Humanities | 96 | 6.7% |
| Total | 1,444 | 100.0% |
Transportation & Commute in Montgomery
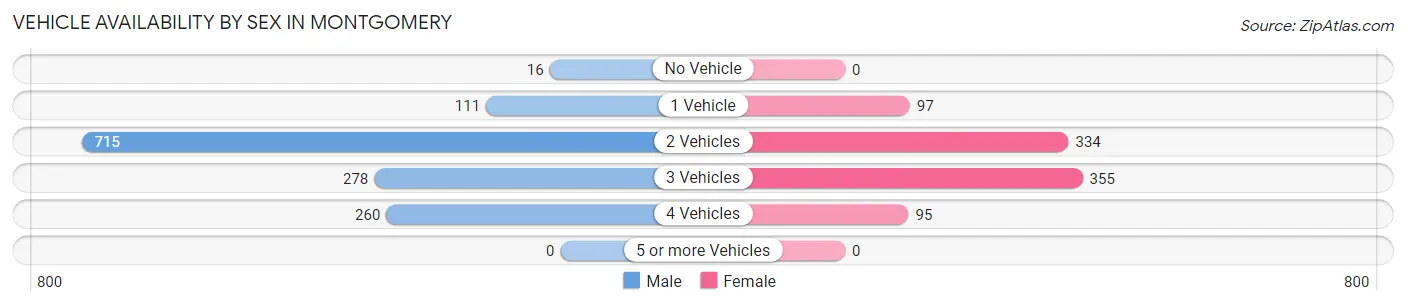
Vehicle Availability by Sex in Montgomery
The most prevalent vehicle ownership categories in Montgomery are males with 2 vehicles (715, accounting for 51.8%) and females with 2 vehicles (334, making up 81.2%).
| Vehicles Available | Male | Female |
| No Vehicle | 16 (1.2%) | 0 (0.0%) |
| 1 Vehicle | 111 (8.0%) | 97 (11.0%) |
| 2 Vehicles | 715 (51.8%) | 334 (37.9%) |
| 3 Vehicles | 278 (20.1%) | 355 (40.3%) |
| 4 Vehicles | 260 (18.8%) | 95 (10.8%) |
| 5 or more Vehicles | 0 (0.0%) | 0 (0.0%) |
| Total | 1,380 (100.0%) | 881 (100.0%) |
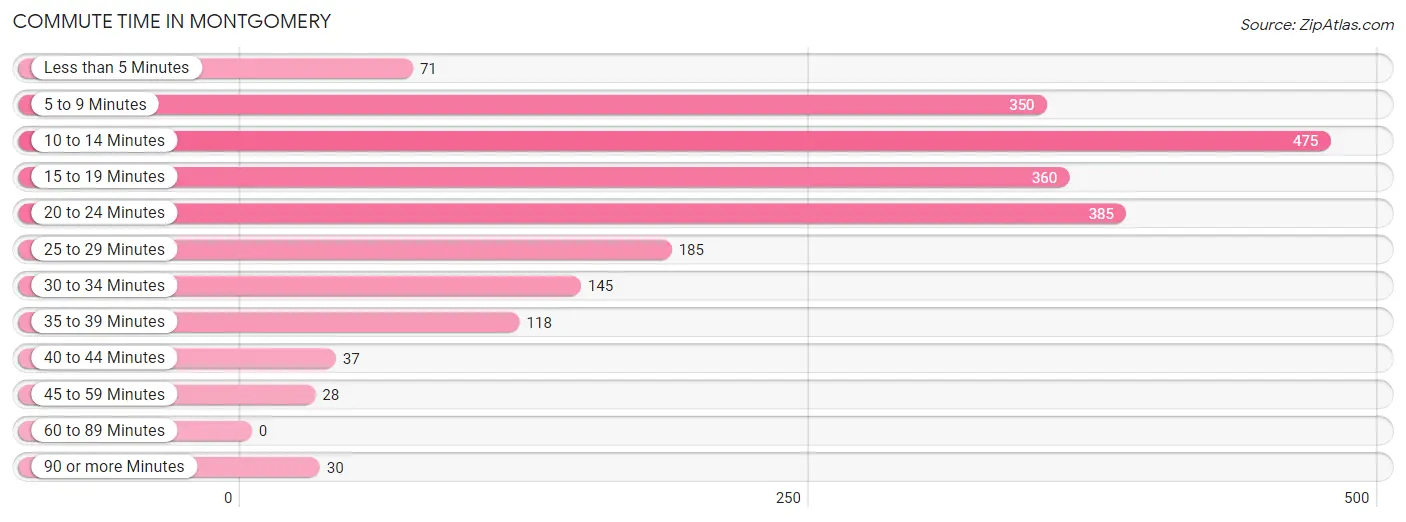
Commute Time in Montgomery
The most frequently occuring commute durations in Montgomery are 10 to 14 minutes (475 commuters, 21.7%), 20 to 24 minutes (385 commuters, 17.6%), and 15 to 19 minutes (360 commuters, 16.5%).
| Commute Time | # Commuters | % Commuters |
| Less than 5 Minutes | 71 | 3.3% |
| 5 to 9 Minutes | 350 | 16.0% |
| 10 to 14 Minutes | 475 | 21.7% |
| 15 to 19 Minutes | 360 | 16.5% |
| 20 to 24 Minutes | 385 | 17.6% |
| 25 to 29 Minutes | 185 | 8.5% |
| 30 to 34 Minutes | 145 | 6.6% |
| 35 to 39 Minutes | 118 | 5.4% |
| 40 to 44 Minutes | 37 | 1.7% |
| 45 to 59 Minutes | 28 | 1.3% |
| 60 to 89 Minutes | 0 | 0.0% |
| 90 or more Minutes | 30 | 1.4% |
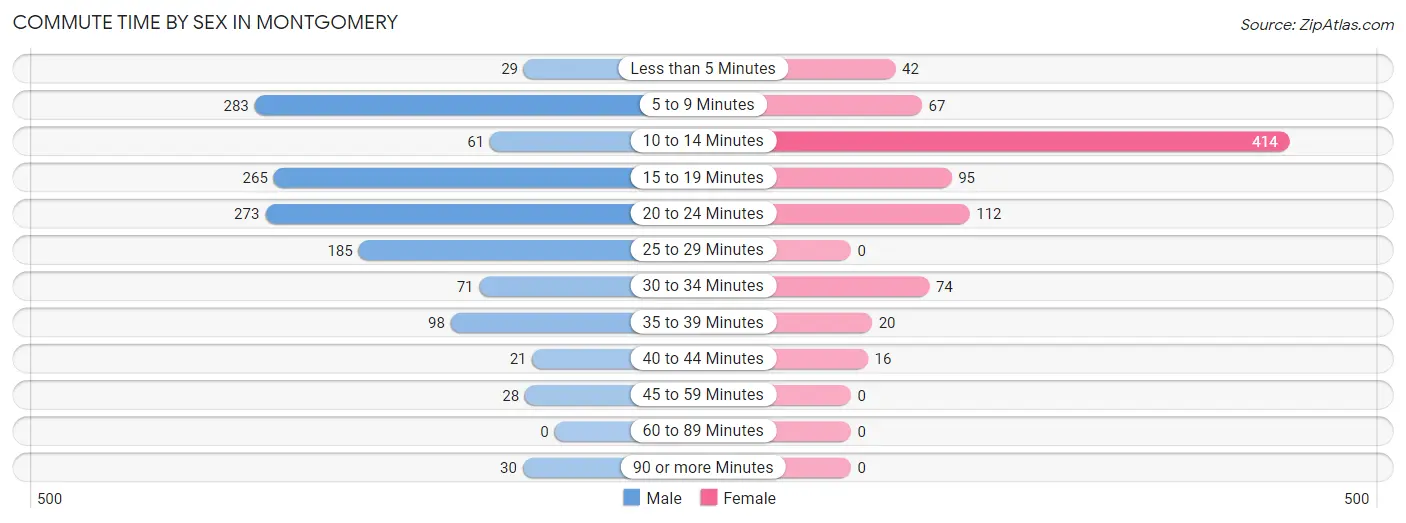
Commute Time by Sex in Montgomery
The most common commute times in Montgomery are 5 to 9 minutes (283 commuters, 21.1%) for males and 10 to 14 minutes (414 commuters, 49.3%) for females.
| Commute Time | Male | Female |
| Less than 5 Minutes | 29 (2.2%) | 42 (5.0%) |
| 5 to 9 Minutes | 283 (21.1%) | 67 (8.0%) |
| 10 to 14 Minutes | 61 (4.5%) | 414 (49.3%) |
| 15 to 19 Minutes | 265 (19.7%) | 95 (11.3%) |
| 20 to 24 Minutes | 273 (20.3%) | 112 (13.3%) |
| 25 to 29 Minutes | 185 (13.8%) | 0 (0.0%) |
| 30 to 34 Minutes | 71 (5.3%) | 74 (8.8%) |
| 35 to 39 Minutes | 98 (7.3%) | 20 (2.4%) |
| 40 to 44 Minutes | 21 (1.6%) | 16 (1.9%) |
| 45 to 59 Minutes | 28 (2.1%) | 0 (0.0%) |
| 60 to 89 Minutes | 0 (0.0%) | 0 (0.0%) |
| 90 or more Minutes | 30 (2.2%) | 0 (0.0%) |
Time of Departure to Work by Sex in Montgomery
The most frequent times of departure to work in Montgomery are 8:00 AM to 8:29 AM (403, 30.0%) for males and 8:00 AM to 8:29 AM (299, 35.6%) for females.
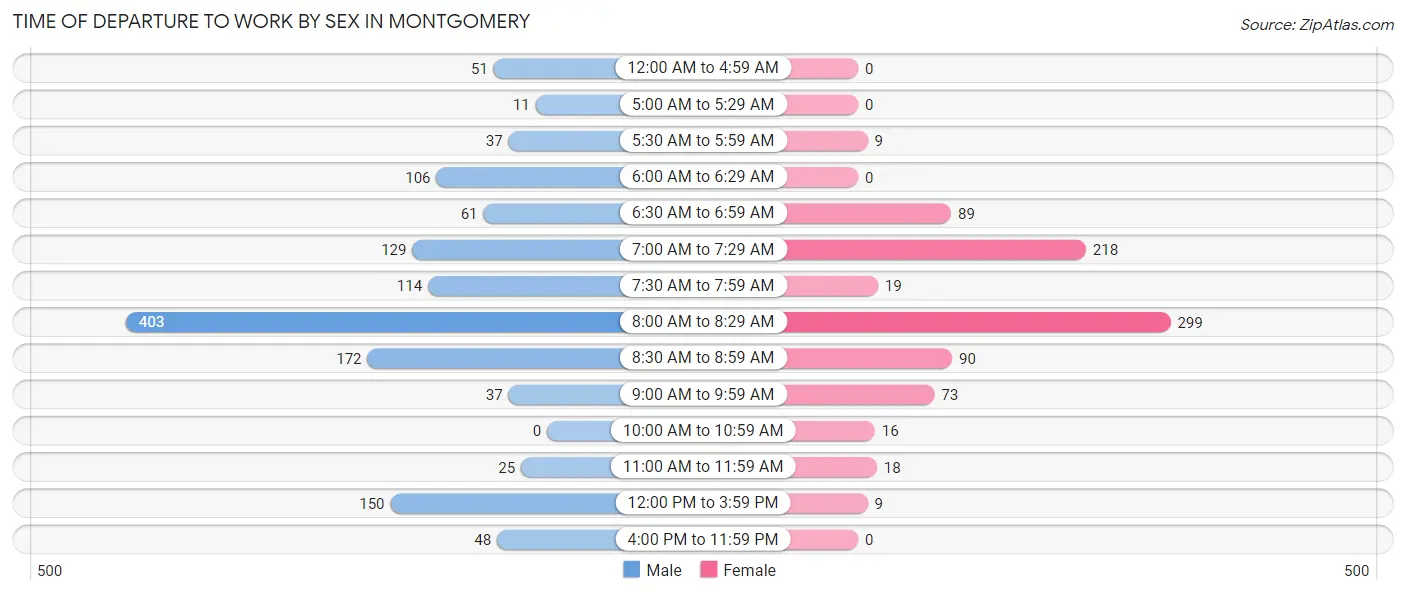
| Time of Departure | Male | Female |
| 12:00 AM to 4:59 AM | 51 (3.8%) | 0 (0.0%) |
| 5:00 AM to 5:29 AM | 11 (0.8%) | 0 (0.0%) |
| 5:30 AM to 5:59 AM | 37 (2.8%) | 9 (1.1%) |
| 6:00 AM to 6:29 AM | 106 (7.9%) | 0 (0.0%) |
| 6:30 AM to 6:59 AM | 61 (4.5%) | 89 (10.6%) |
| 7:00 AM to 7:29 AM | 129 (9.6%) | 218 (26.0%) |
| 7:30 AM to 7:59 AM | 114 (8.5%) | 19 (2.3%) |
| 8:00 AM to 8:29 AM | 403 (30.0%) | 299 (35.6%) |
| 8:30 AM to 8:59 AM | 172 (12.8%) | 90 (10.7%) |
| 9:00 AM to 9:59 AM | 37 (2.8%) | 73 (8.7%) |
| 10:00 AM to 10:59 AM | 0 (0.0%) | 16 (1.9%) |
| 11:00 AM to 11:59 AM | 25 (1.9%) | 18 (2.1%) |
| 12:00 PM to 3:59 PM | 150 (11.2%) | 9 (1.1%) |
| 4:00 PM to 11:59 PM | 48 (3.6%) | 0 (0.0%) |
| Total | 1,344 (100.0%) | 840 (100.0%) |
Housing Occupancy in Montgomery
Occupancy by Ownership in Montgomery
Of the total 1,861 dwellings in Montgomery, owner-occupied units account for 1,527 (82.1%), while renter-occupied units make up 334 (17.9%).
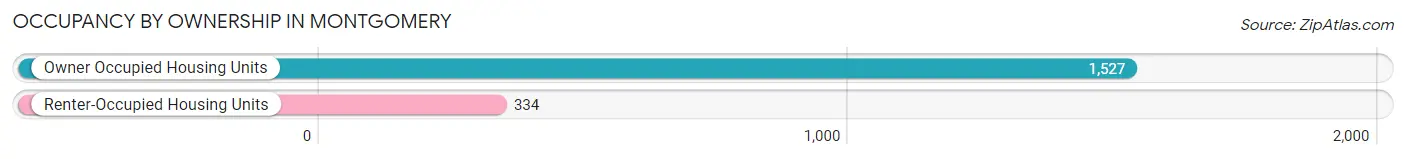
| Occupancy | # Housing Units | % Housing Units |
| Owner Occupied Housing Units | 1,527 | 82.1% |
| Renter-Occupied Housing Units | 334 | 17.9% |
| Total Occupied Housing Units | 1,861 | 100.0% |
Occupancy by Household Size in Montgomery
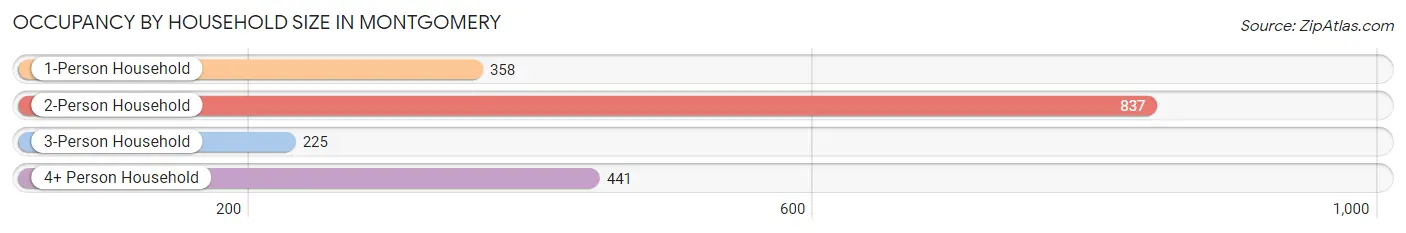
| Household Size | # Housing Units | % Housing Units |
| 1-Person Household | 358 | 19.2% |
| 2-Person Household | 837 | 45.0% |
| 3-Person Household | 225 | 12.1% |
| 4+ Person Household | 441 | 23.7% |
| Total Housing Units | 1,861 | 100.0% |
Occupancy by Ownership by Household Size in Montgomery
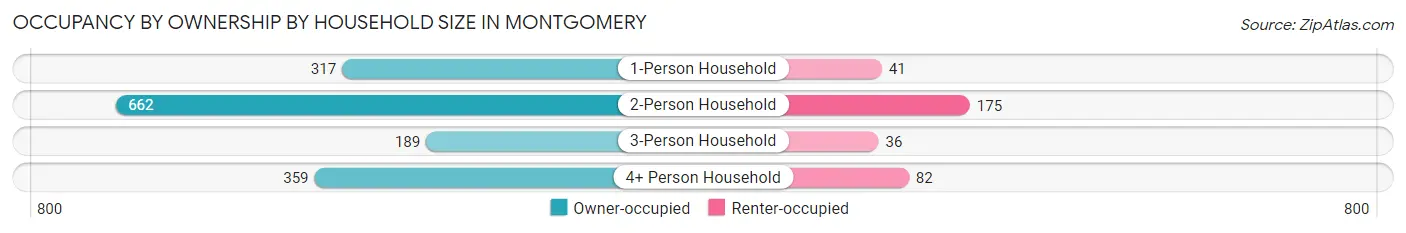
| Household Size | Owner-occupied | Renter-occupied |
| 1-Person Household | 317 (88.5%) | 41 (11.5%) |
| 2-Person Household | 662 (79.1%) | 175 (20.9%) |
| 3-Person Household | 189 (84.0%) | 36 (16.0%) |
| 4+ Person Household | 359 (81.4%) | 82 (18.6%) |
| Total Housing Units | 1,527 (82.1%) | 334 (17.9%) |
Occupancy by Educational Attainment in Montgomery
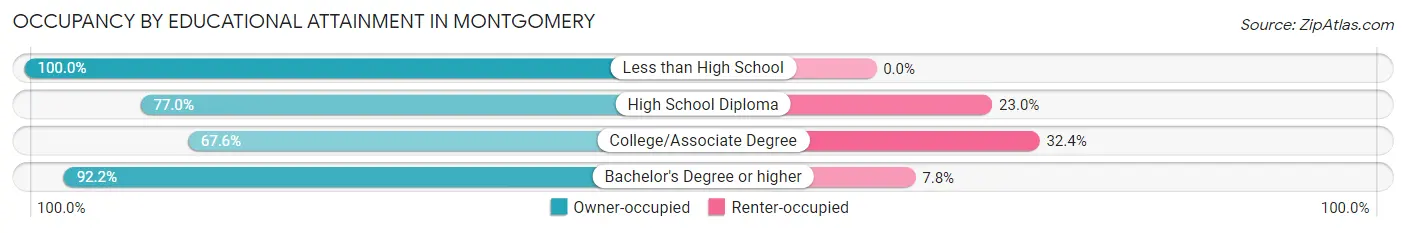
| Household Size | Owner-occupied | Renter-occupied |
| Less than High School | 38 (100.0%) | 0 (0.0%) |
| High School Diploma | 231 (77.0%) | 69 (23.0%) |
| College/Associate Degree | 403 (67.6%) | 193 (32.4%) |
| Bachelor's Degree or higher | 855 (92.2%) | 72 (7.8%) |
Occupancy by Age of Householder in Montgomery
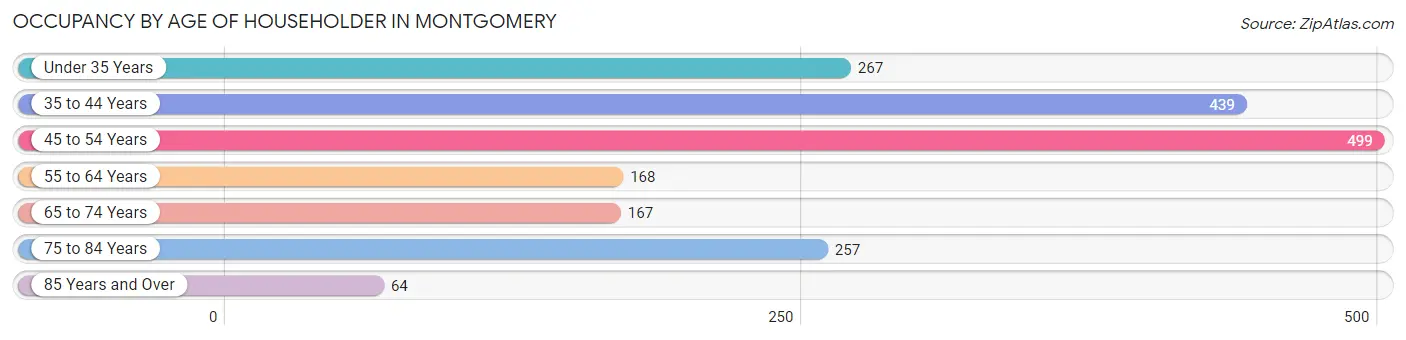
| Age Bracket | # Households | % Households |
| Under 35 Years | 267 | 14.3% |
| 35 to 44 Years | 439 | 23.6% |
| 45 to 54 Years | 499 | 26.8% |
| 55 to 64 Years | 168 | 9.0% |
| 65 to 74 Years | 167 | 9.0% |
| 75 to 84 Years | 257 | 13.8% |
| 85 Years and Over | 64 | 3.4% |
| Total | 1,861 | 100.0% |
Housing Finances in Montgomery
Median Income by Occupancy in Montgomery
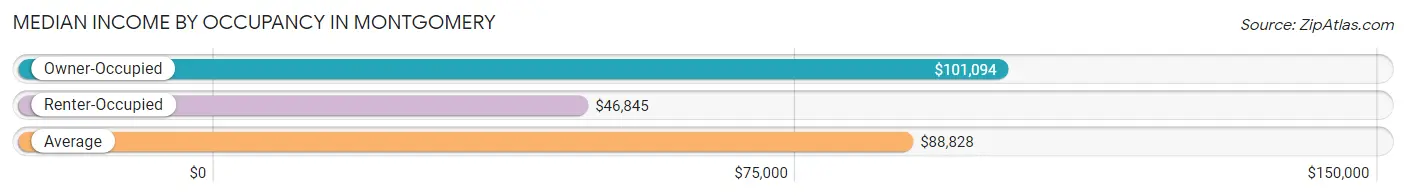
| Occupancy Type | # Households | Median Income |
| Owner-Occupied | 1,527 (82.1%) | $101,094 |
| Renter-Occupied | 334 (17.9%) | $46,845 |
| Average | 1,861 (100.0%) | $88,828 |
Occupancy by Householder Income Bracket in Montgomery
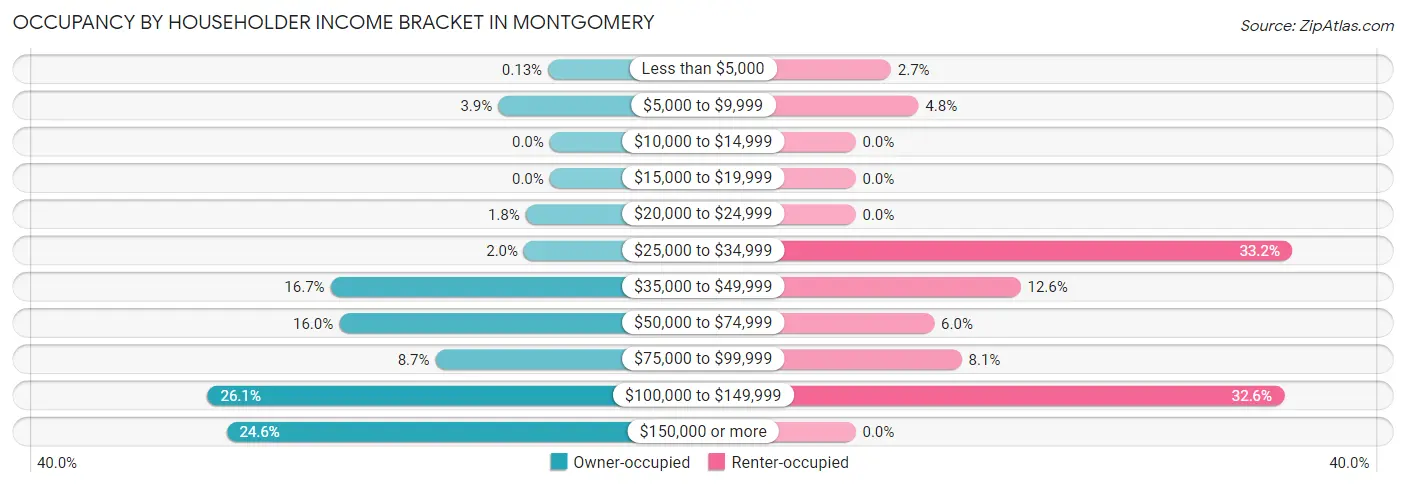
| Income Bracket | Owner-occupied | Renter-occupied |
| Less than $5,000 | 2 (0.1%) | 9 (2.7%) |
| $5,000 to $9,999 | 60 (3.9%) | 16 (4.8%) |
| $10,000 to $14,999 | 0 (0.0%) | 0 (0.0%) |
| $15,000 to $19,999 | 0 (0.0%) | 0 (0.0%) |
| $20,000 to $24,999 | 28 (1.8%) | 0 (0.0%) |
| $25,000 to $34,999 | 30 (2.0%) | 111 (33.2%) |
| $35,000 to $49,999 | 255 (16.7%) | 42 (12.6%) |
| $50,000 to $74,999 | 245 (16.0%) | 20 (6.0%) |
| $75,000 to $99,999 | 133 (8.7%) | 27 (8.1%) |
| $100,000 to $149,999 | 398 (26.1%) | 109 (32.6%) |
| $150,000 or more | 376 (24.6%) | 0 (0.0%) |
| Total | 1,527 (100.0%) | 334 (100.0%) |
Monthly Housing Cost Tiers in Montgomery
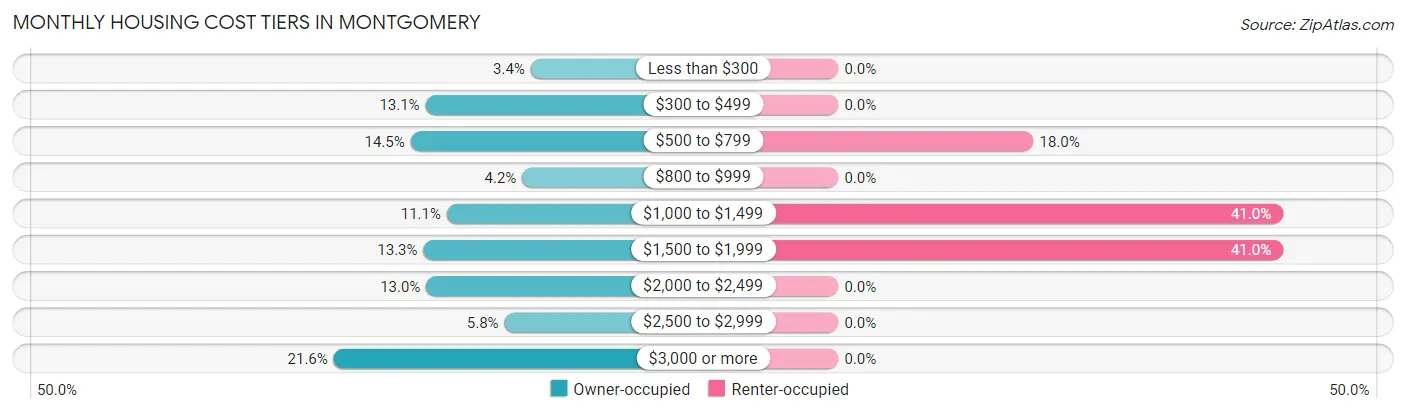
| Monthly Cost | Owner-occupied | Renter-occupied |
| Less than $300 | 52 (3.4%) | 0 (0.0%) |
| $300 to $499 | 200 (13.1%) | 0 (0.0%) |
| $500 to $799 | 221 (14.5%) | 60 (18.0%) |
| $800 to $999 | 64 (4.2%) | 0 (0.0%) |
| $1,000 to $1,499 | 170 (11.1%) | 137 (41.0%) |
| $1,500 to $1,999 | 203 (13.3%) | 137 (41.0%) |
| $2,000 to $2,499 | 199 (13.0%) | 0 (0.0%) |
| $2,500 to $2,999 | 89 (5.8%) | 0 (0.0%) |
| $3,000 or more | 329 (21.5%) | 0 (0.0%) |
| Total | 1,527 (100.0%) | 334 (100.0%) |
Physical Housing Characteristics in Montgomery
Housing Structures in Montgomery
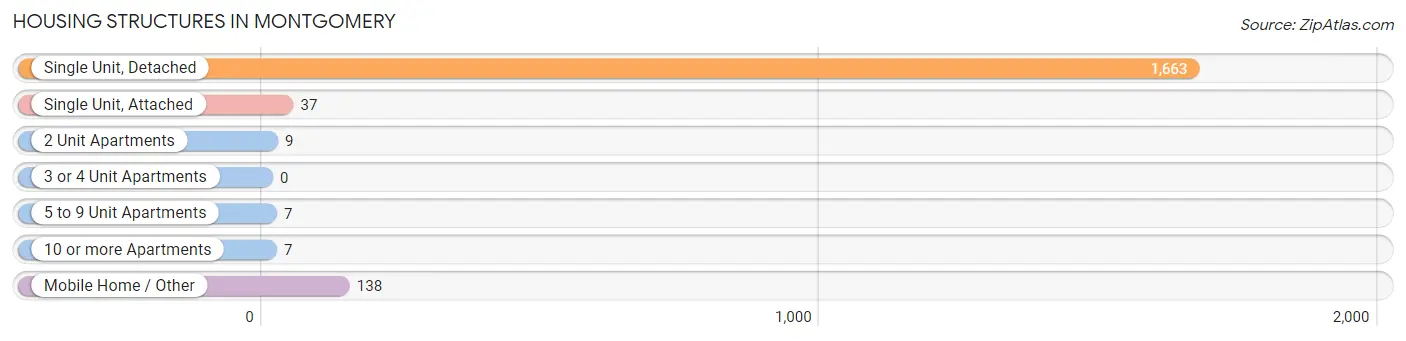
| Structure Type | # Housing Units | % Housing Units |
| Single Unit, Detached | 1,663 | 89.4% |
| Single Unit, Attached | 37 | 2.0% |
| 2 Unit Apartments | 9 | 0.5% |
| 3 or 4 Unit Apartments | 0 | 0.0% |
| 5 to 9 Unit Apartments | 7 | 0.4% |
| 10 or more Apartments | 7 | 0.4% |
| Mobile Home / Other | 138 | 7.4% |
| Total | 1,861 | 100.0% |
Housing Structures by Occupancy in Montgomery
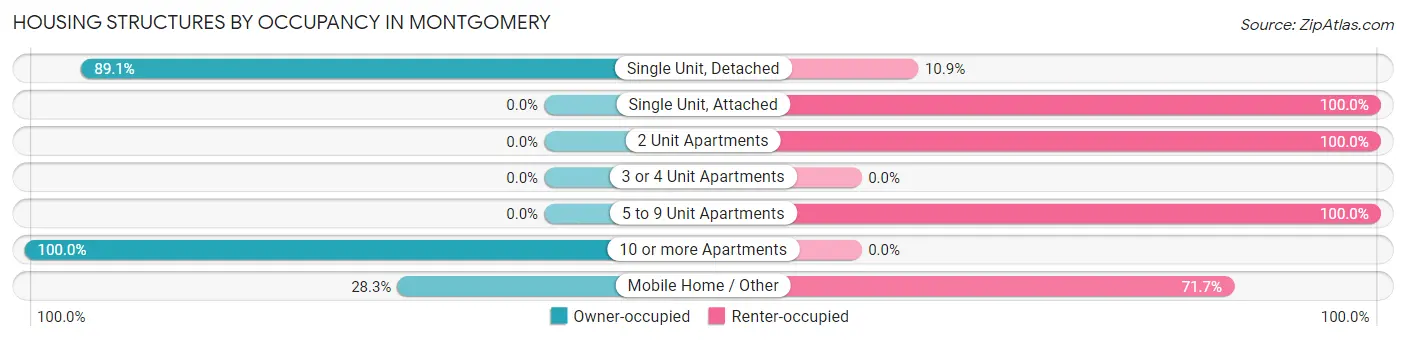
| Structure Type | Owner-occupied | Renter-occupied |
| Single Unit, Detached | 1,481 (89.1%) | 182 (10.9%) |
| Single Unit, Attached | 0 (0.0%) | 37 (100.0%) |
| 2 Unit Apartments | 0 (0.0%) | 9 (100.0%) |
| 3 or 4 Unit Apartments | 0 (0.0%) | 0 (0.0%) |
| 5 to 9 Unit Apartments | 0 (0.0%) | 7 (100.0%) |
| 10 or more Apartments | 7 (100.0%) | 0 (0.0%) |
| Mobile Home / Other | 39 (28.3%) | 99 (71.7%) |
| Total | 1,527 (82.1%) | 334 (17.9%) |
Housing Structures by Number of Rooms in Montgomery
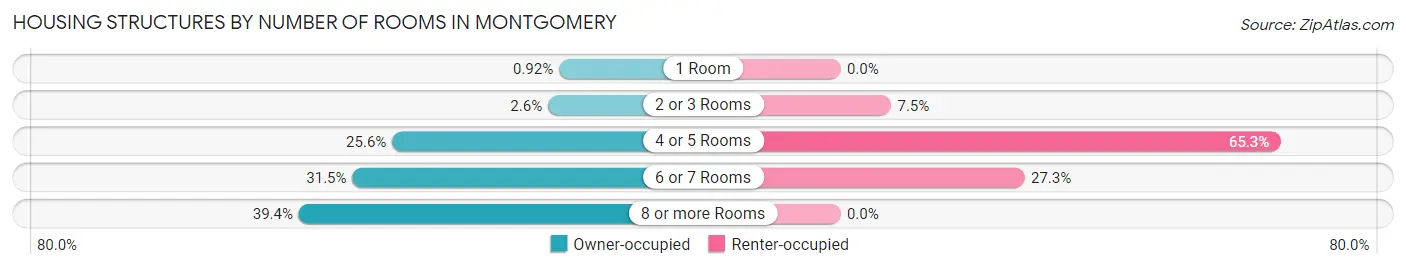
| Number of Rooms | Owner-occupied | Renter-occupied |
| 1 Room | 14 (0.9%) | 0 (0.0%) |
| 2 or 3 Rooms | 39 (2.5%) | 25 (7.5%) |
| 4 or 5 Rooms | 391 (25.6%) | 218 (65.3%) |
| 6 or 7 Rooms | 481 (31.5%) | 91 (27.3%) |
| 8 or more Rooms | 602 (39.4%) | 0 (0.0%) |
| Total | 1,527 (100.0%) | 334 (100.0%) |
Housing Structure by Heating Type in Montgomery
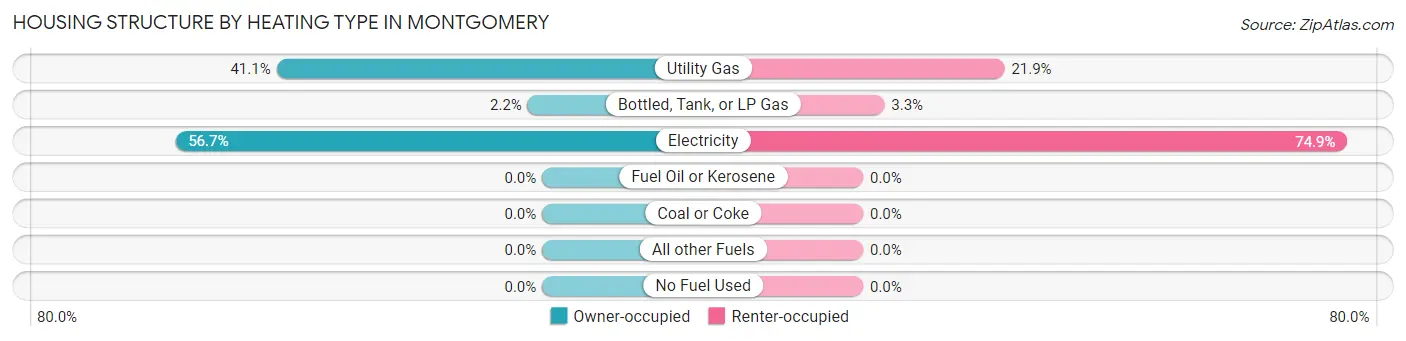
| Heating Type | Owner-occupied | Renter-occupied |
| Utility Gas | 627 (41.1%) | 73 (21.9%) |
| Bottled, Tank, or LP Gas | 34 (2.2%) | 11 (3.3%) |
| Electricity | 866 (56.7%) | 250 (74.9%) |
| Fuel Oil or Kerosene | 0 (0.0%) | 0 (0.0%) |
| Coal or Coke | 0 (0.0%) | 0 (0.0%) |
| All other Fuels | 0 (0.0%) | 0 (0.0%) |
| No Fuel Used | 0 (0.0%) | 0 (0.0%) |
| Total | 1,527 (100.0%) | 334 (100.0%) |
Household Vehicle Usage in Montgomery
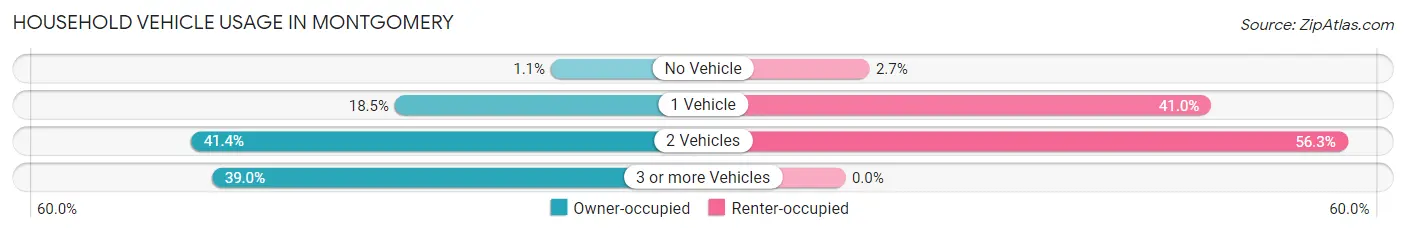
| Vehicles per Household | Owner-occupied | Renter-occupied |
| No Vehicle | 16 (1.1%) | 9 (2.7%) |
| 1 Vehicle | 283 (18.5%) | 137 (41.0%) |
| 2 Vehicles | 632 (41.4%) | 188 (56.3%) |
| 3 or more Vehicles | 596 (39.0%) | 0 (0.0%) |
| Total | 1,527 (100.0%) | 334 (100.0%) |
Real Estate & Mortgages in Montgomery
Real Estate and Mortgage Overview in Montgomery
| Characteristic | Without Mortgage | With Mortgage |
| Housing Units | 634 | 893 |
| Median Property Value | $220,000 | $559,900 |
| Median Household Income | $61,944 | $174 |
| Monthly Housing Costs | $546 | $329 |
| Real Estate Taxes | $2,038 | $0 |
Property Value by Mortgage Status in Montgomery
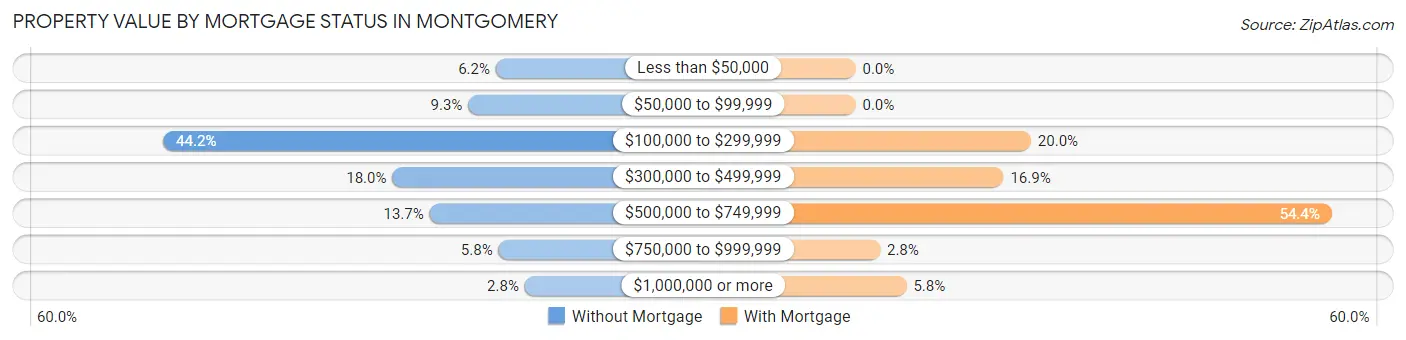
| Property Value | Without Mortgage | With Mortgage |
| Less than $50,000 | 39 (6.1%) | 0 (0.0%) |
| $50,000 to $99,999 | 59 (9.3%) | 0 (0.0%) |
| $100,000 to $299,999 | 280 (44.2%) | 179 (20.0%) |
| $300,000 to $499,999 | 114 (18.0%) | 151 (16.9%) |
| $500,000 to $749,999 | 87 (13.7%) | 486 (54.4%) |
| $750,000 to $999,999 | 37 (5.8%) | 25 (2.8%) |
| $1,000,000 or more | 18 (2.8%) | 52 (5.8%) |
| Total | 634 (100.0%) | 893 (100.0%) |
Household Income by Mortgage Status in Montgomery
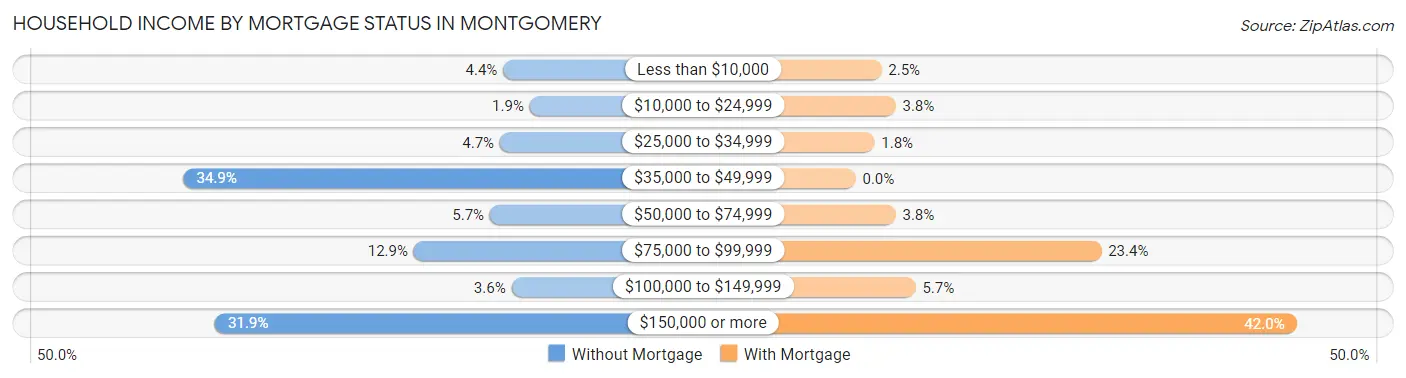
| Household Income | Without Mortgage | With Mortgage |
| Less than $10,000 | 28 (4.4%) | 22 (2.5%) |
| $10,000 to $24,999 | 12 (1.9%) | 34 (3.8%) |
| $25,000 to $34,999 | 30 (4.7%) | 16 (1.8%) |
| $35,000 to $49,999 | 221 (34.9%) | 0 (0.0%) |
| $50,000 to $74,999 | 36 (5.7%) | 34 (3.8%) |
| $75,000 to $99,999 | 82 (12.9%) | 209 (23.4%) |
| $100,000 to $149,999 | 23 (3.6%) | 51 (5.7%) |
| $150,000 or more | 202 (31.9%) | 375 (42.0%) |
| Total | 634 (100.0%) | 893 (100.0%) |
Property Value to Household Income Ratio in Montgomery
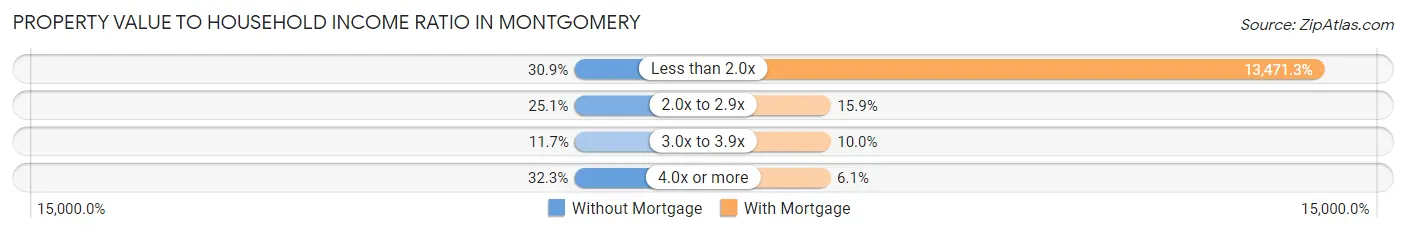
| Value-to-Income Ratio | Without Mortgage | With Mortgage |
| Less than 2.0x | 196 (30.9%) | 120,299 (13,471.3%) |
| 2.0x to 2.9x | 159 (25.1%) | 142 (15.9%) |
| 3.0x to 3.9x | 74 (11.7%) | 89 (10.0%) |
| 4.0x or more | 205 (32.3%) | 54 (6.0%) |
| Total | 634 (100.0%) | 893 (100.0%) |
Real Estate Taxes by Mortgage Status in Montgomery
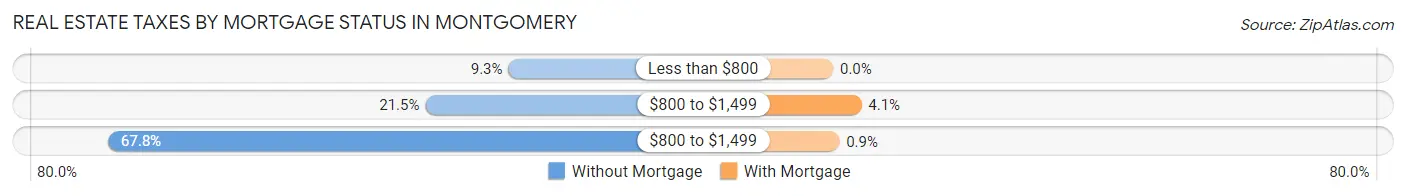
| Property Taxes | Without Mortgage | With Mortgage |
| Less than $800 | 59 (9.3%) | 0 (0.0%) |
| $800 to $1,499 | 136 (21.4%) | 37 (4.1%) |
| $800 to $1,499 | 430 (67.8%) | 8 (0.9%) |
| Total | 634 (100.0%) | 893 (100.0%) |
Health & Disability in Montgomery
Health Insurance Coverage by Age in Montgomery
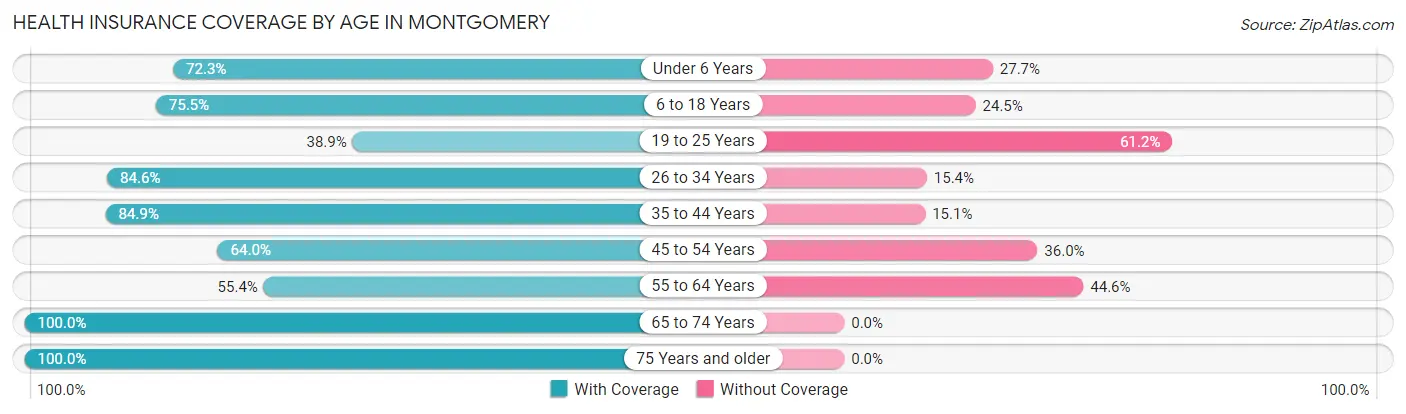
| Age Bracket | With Coverage | Without Coverage |
| Under 6 Years | 201 (72.3%) | 77 (27.7%) |
| 6 to 18 Years | 404 (75.5%) | 131 (24.5%) |
| 19 to 25 Years | 230 (38.9%) | 362 (61.2%) |
| 26 to 34 Years | 423 (84.6%) | 77 (15.4%) |
| 35 to 44 Years | 619 (84.9%) | 110 (15.1%) |
| 45 to 54 Years | 471 (64.0%) | 265 (36.0%) |
| 55 to 64 Years | 179 (55.4%) | 144 (44.6%) |
| 65 to 74 Years | 312 (100.0%) | 0 (0.0%) |
| 75 Years and older | 582 (100.0%) | 0 (0.0%) |
| Total | 3,421 (74.6%) | 1,166 (25.4%) |
Health Insurance Coverage by Citizenship Status in Montgomery
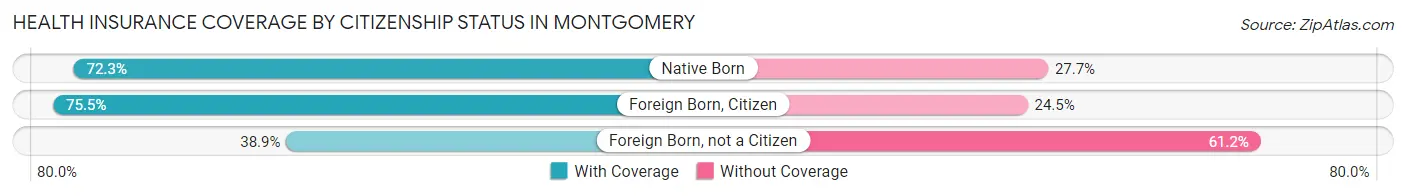
| Citizenship Status | With Coverage | Without Coverage |
| Native Born | 201 (72.3%) | 77 (27.7%) |
| Foreign Born, Citizen | 404 (75.5%) | 131 (24.5%) |
| Foreign Born, not a Citizen | 230 (38.9%) | 362 (61.2%) |
Health Insurance Coverage by Household Income in Montgomery
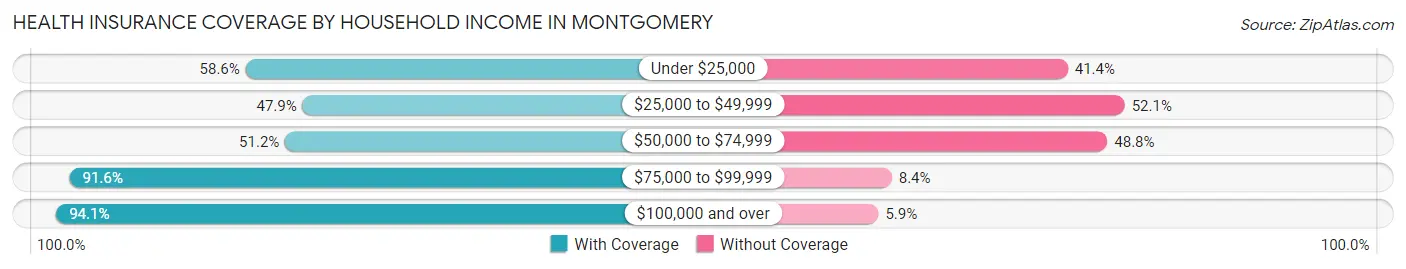
| Household Income | With Coverage | Without Coverage |
| Under $25,000 | 116 (58.6%) | 82 (41.4%) |
| $25,000 to $49,999 | 464 (47.9%) | 504 (52.1%) |
| $50,000 to $74,999 | 435 (51.2%) | 415 (48.8%) |
| $75,000 to $99,999 | 456 (91.6%) | 42 (8.4%) |
| $100,000 and over | 1,950 (94.1%) | 123 (5.9%) |
Public vs Private Health Insurance Coverage by Age in Montgomery
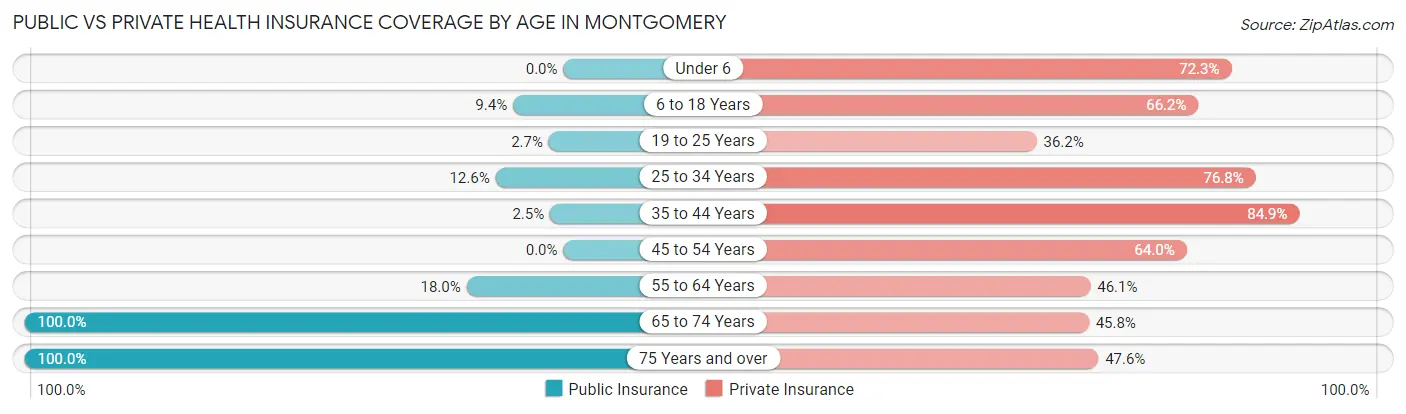
| Age Bracket | Public Insurance | Private Insurance |
| Under 6 | 0 (0.0%) | 201 (72.3%) |
| 6 to 18 Years | 50 (9.3%) | 354 (66.2%) |
| 19 to 25 Years | 16 (2.7%) | 214 (36.1%) |
| 25 to 34 Years | 63 (12.6%) | 384 (76.8%) |
| 35 to 44 Years | 18 (2.5%) | 619 (84.9%) |
| 45 to 54 Years | 0 (0.0%) | 471 (64.0%) |
| 55 to 64 Years | 58 (18.0%) | 149 (46.1%) |
| 65 to 74 Years | 312 (100.0%) | 143 (45.8%) |
| 75 Years and over | 582 (100.0%) | 277 (47.6%) |
| Total | 1,099 (24.0%) | 2,812 (61.3%) |
Disability Status by Sex by Age in Montgomery
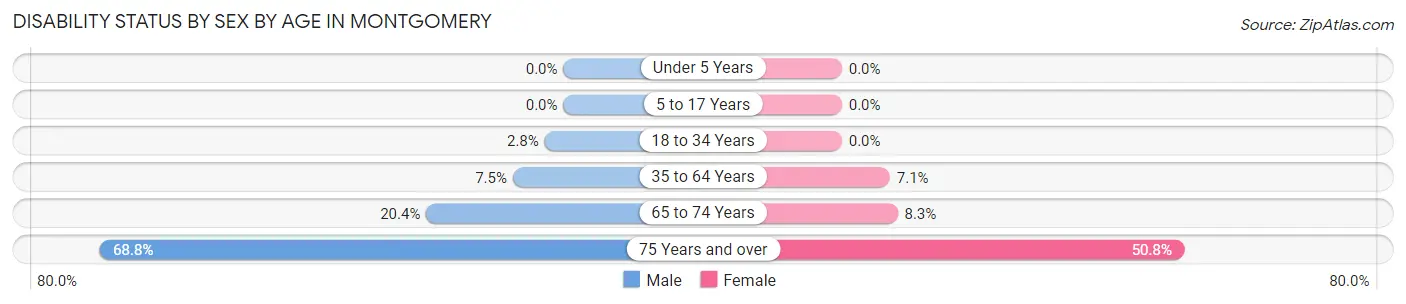
| Age Bracket | Male | Female |
| Under 5 Years | 0 (0.0%) | 0 (0.0%) |
| 5 to 17 Years | 0 (0.0%) | 0 (0.0%) |
| 18 to 34 Years | 16 (2.8%) | 0 (0.0%) |
| 35 to 64 Years | 69 (7.5%) | 62 (7.1%) |
| 65 to 74 Years | 34 (20.4%) | 12 (8.3%) |
| 75 Years and over | 86 (68.8%) | 232 (50.8%) |
Disability Class by Sex by Age in Montgomery
Disability Class: Hearing Difficulty
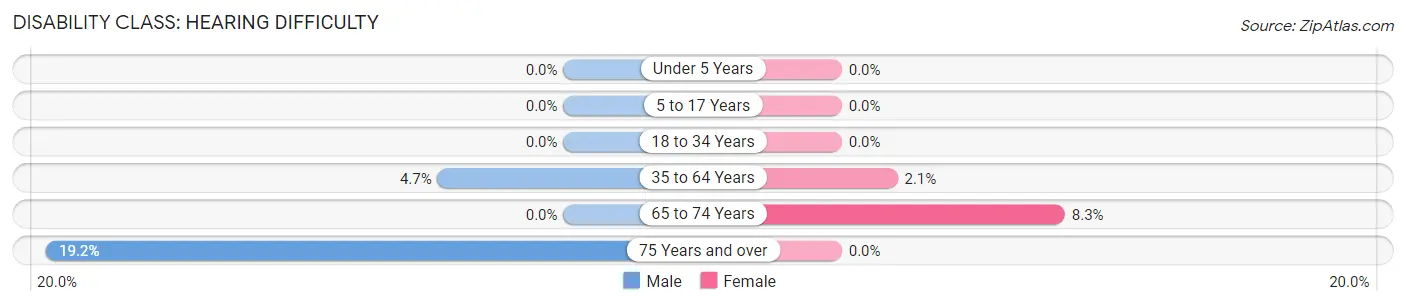
| Age Bracket | Male | Female |
| Under 5 Years | 0 (0.0%) | 0 (0.0%) |
| 5 to 17 Years | 0 (0.0%) | 0 (0.0%) |
| 18 to 34 Years | 0 (0.0%) | 0 (0.0%) |
| 35 to 64 Years | 43 (4.7%) | 18 (2.1%) |
| 65 to 74 Years | 0 (0.0%) | 12 (8.3%) |
| 75 Years and over | 24 (19.2%) | 0 (0.0%) |
Disability Class: Vision Difficulty
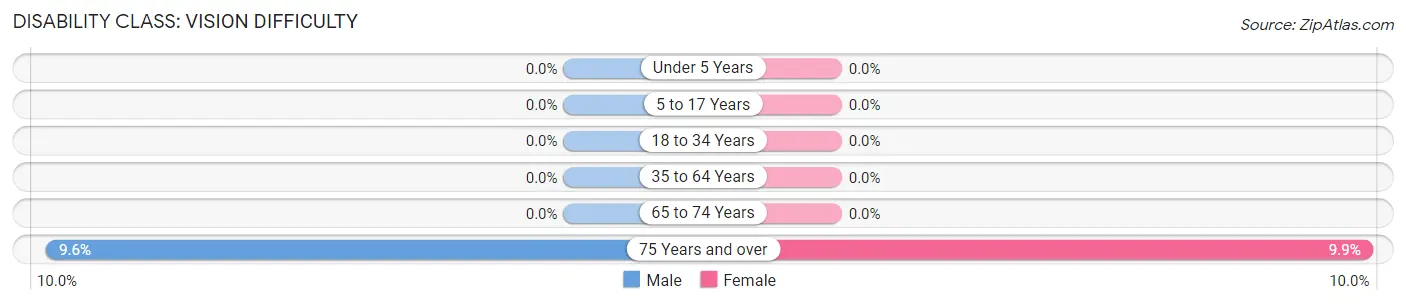
| Age Bracket | Male | Female |
| Under 5 Years | 0 (0.0%) | 0 (0.0%) |
| 5 to 17 Years | 0 (0.0%) | 0 (0.0%) |
| 18 to 34 Years | 0 (0.0%) | 0 (0.0%) |
| 35 to 64 Years | 0 (0.0%) | 0 (0.0%) |
| 65 to 74 Years | 0 (0.0%) | 0 (0.0%) |
| 75 Years and over | 12 (9.6%) | 45 (9.9%) |
Disability Class: Cognitive Difficulty
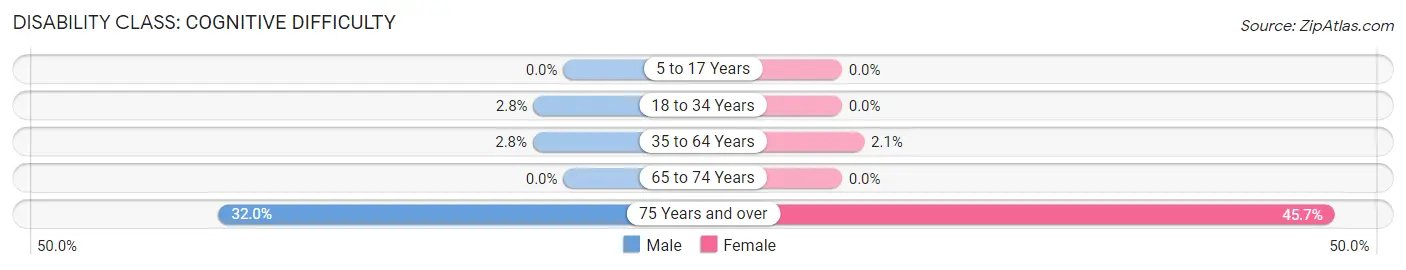
| Age Bracket | Male | Female |
| 5 to 17 Years | 0 (0.0%) | 0 (0.0%) |
| 18 to 34 Years | 16 (2.8%) | 0 (0.0%) |
| 35 to 64 Years | 26 (2.8%) | 18 (2.1%) |
| 65 to 74 Years | 0 (0.0%) | 0 (0.0%) |
| 75 Years and over | 40 (32.0%) | 209 (45.7%) |
Disability Class: Ambulatory Difficulty
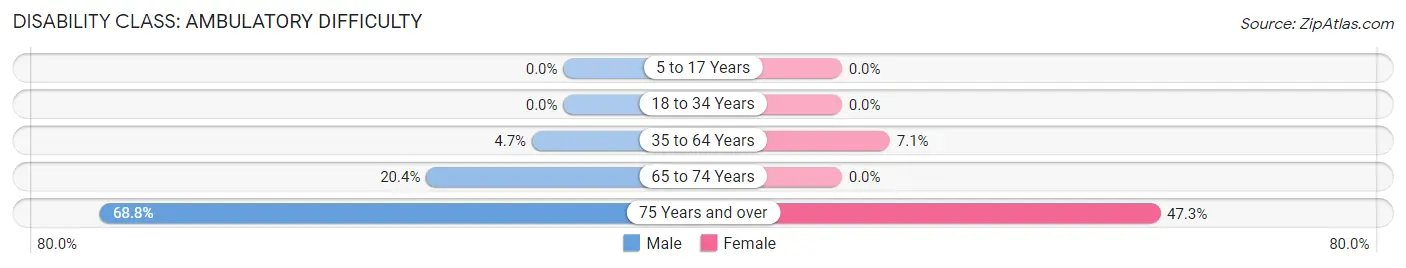
| Age Bracket | Male | Female |
| 5 to 17 Years | 0 (0.0%) | 0 (0.0%) |
| 18 to 34 Years | 0 (0.0%) | 0 (0.0%) |
| 35 to 64 Years | 43 (4.7%) | 62 (7.1%) |
| 65 to 74 Years | 34 (20.4%) | 0 (0.0%) |
| 75 Years and over | 86 (68.8%) | 216 (47.3%) |
Disability Class: Self-Care Difficulty
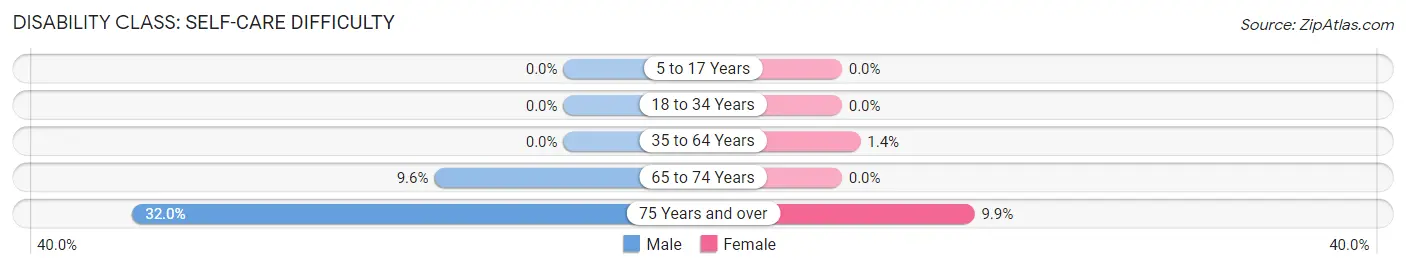
| Age Bracket | Male | Female |
| 5 to 17 Years | 0 (0.0%) | 0 (0.0%) |
| 18 to 34 Years | 0 (0.0%) | 0 (0.0%) |
| 35 to 64 Years | 0 (0.0%) | 12 (1.4%) |
| 65 to 74 Years | 16 (9.6%) | 0 (0.0%) |
| 75 Years and over | 40 (32.0%) | 45 (9.9%) |
Technology Access in Montgomery
Computing Device Access in Montgomery
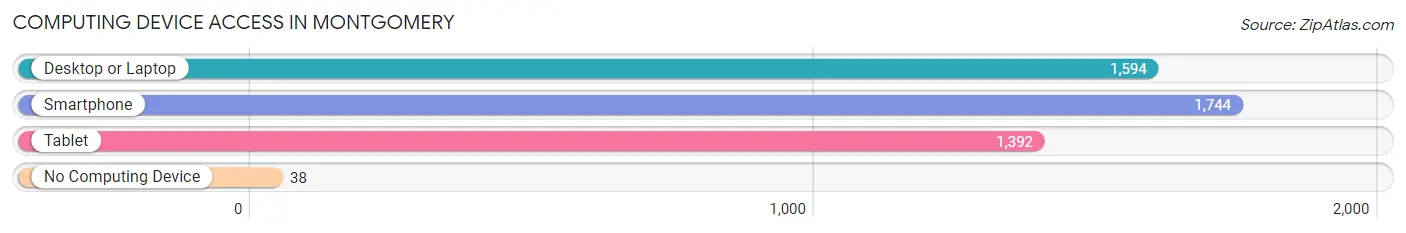
| Device Type | # Households | % Households |
| Desktop or Laptop | 1,594 | 85.7% |
| Smartphone | 1,744 | 93.7% |
| Tablet | 1,392 | 74.8% |
| No Computing Device | 38 | 2.0% |
| Total | 1,861 | 100.0% |
Internet Access in Montgomery
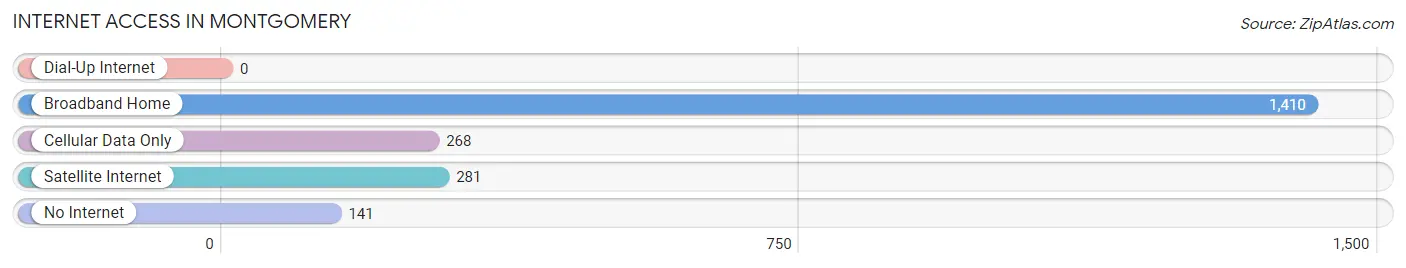
| Internet Type | # Households | % Households |
| Dial-Up Internet | 0 | 0.0% |
| Broadband Home | 1,410 | 75.8% |
| Cellular Data Only | 268 | 14.4% |
| Satellite Internet | 281 | 15.1% |
| No Internet | 141 | 7.6% |
| Total | 1,861 | 100.0% |
Montgomery Summary
Montgomery, Georgia is a small city located in the southwestern part of the state, about an hour and a half south of Atlanta. It is the county seat of Montgomery County and is home to a population of approximately 2,500 people. The city is known for its historic downtown area, which is home to a variety of shops, restaurants, and other businesses.
History
Montgomery was founded in 1820 by a group of settlers from South Carolina. The city was named after General Richard Montgomery, a Revolutionary War hero. The city was incorporated in 1822 and quickly became a thriving center of commerce and industry. The city was home to a variety of businesses, including a cotton mill, a sawmill, and a gristmill.
In the late 19th century, Montgomery was a major railroad hub, with several lines running through the city. The city was also home to a variety of manufacturing businesses, including a cotton mill, a furniture factory, and a shoe factory.
In the early 20th century, Montgomery was a major center of the civil rights movement. The city was the site of the Montgomery Bus Boycott, which was a major event in the struggle for racial equality.
Geography
Montgomery is located in the southwestern part of the state, about an hour and a half south of Atlanta. The city is situated in the foothills of the Appalachian Mountains and is surrounded by rolling hills and forests. The city is located on the banks of the Ocmulgee River, which flows through the city.
The climate in Montgomery is mild and humid, with hot summers and mild winters. The average temperature in the summer is around 80 degrees Fahrenheit, while the average temperature in the winter is around 50 degrees Fahrenheit.
Economy
The economy of Montgomery is largely based on agriculture and manufacturing. The city is home to a variety of agricultural businesses, including a cotton mill, a sawmill, and a gristmill. The city is also home to a variety of manufacturing businesses, including a furniture factory, a shoe factory, and a paper mill.
The city is also home to a variety of retail businesses, including a variety of shops, restaurants, and other businesses. The city is also home to a variety of service businesses, including a hospital, a bank, and a post office.
Demographics
As of the 2010 census, the population of Montgomery was 2,500. The racial makeup of the city was 79.2% White, 17.2% African American, 0.4% Native American, 0.4% Asian, 0.2% Pacific Islander, and 2.4% from other races. The median household income in the city was $31,250, and the median family income was $37,500.
The city is home to a variety of religious denominations, including Baptist, Methodist, Presbyterian, and Catholic. The city is also home to a variety of educational institutions, including a public school system, a private school, and a community college.
Conclusion
Montgomery, Georgia is a small city located in the southwestern part of the state, about an hour and a half south of Atlanta. It is the county seat of Montgomery County and is home to a population of approximately 2,500 people. The city is known for its historic downtown area, which is home to a variety of shops, restaurants, and other businesses. The economy of Montgomery is largely based on agriculture and manufacturing, and the city is home to a variety of retail businesses, service businesses, and educational institutions. The city is also home to a variety of religious denominations and is a major center of the civil rights movement.
Common Questions
What is the Total Population of Montgomery?
Total Population of Montgomery is 4,606.
What is the Total Male Population of Montgomery?
Total Male Population of Montgomery is 2,166.
What is the Total Female Population of Montgomery?
Total Female Population of Montgomery is 2,440.
What is the Ratio of Males per 100 Females in Montgomery?
There are 88.77 Males per 100 Females in Montgomery.
What is the Ratio of Females per 100 Males in Montgomery?
There are 112.65 Females per 100 Males in Montgomery.
What is the Median Population Age in Montgomery?
Median Population Age in Montgomery is 38.5 Years.
What is the Average Family Size in Montgomery
Average Family Size in Montgomery is 2.7 People.
What is the Average Household Size in Montgomery
Average Household Size in Montgomery is 2.5 People.
What is Per Capita Income in Montgomery?
Per Capita income in Montgomery is $44,796.
What is the Median Family Income in Montgomery?
Median Family Income in Montgomery is $118,854.
What is the Median Household income in Montgomery?
Median Household Income in Montgomery is $88,828.
What is Income or Wage Gap in Montgomery?
Income or Wage Gap in Montgomery is 39.4%.
Women in Montgomery earn 60.6 cents for every dollar earned by a man.
What is Inequality or Gini Index in Montgomery?
Inequality or Gini Index in Montgomery is 0.43.
How Large is the Labor Force in Montgomery?
There are 2,402 People in the Labor Forcein in Montgomery.
What is the Percentage of People in the Labor Force in Montgomery?
60.0% of People are in the Labor Force in Montgomery.
What is the Unemployment Rate in Montgomery?
Unemployment Rate in Montgomery is 1.9%.