Isle of Hope, GA
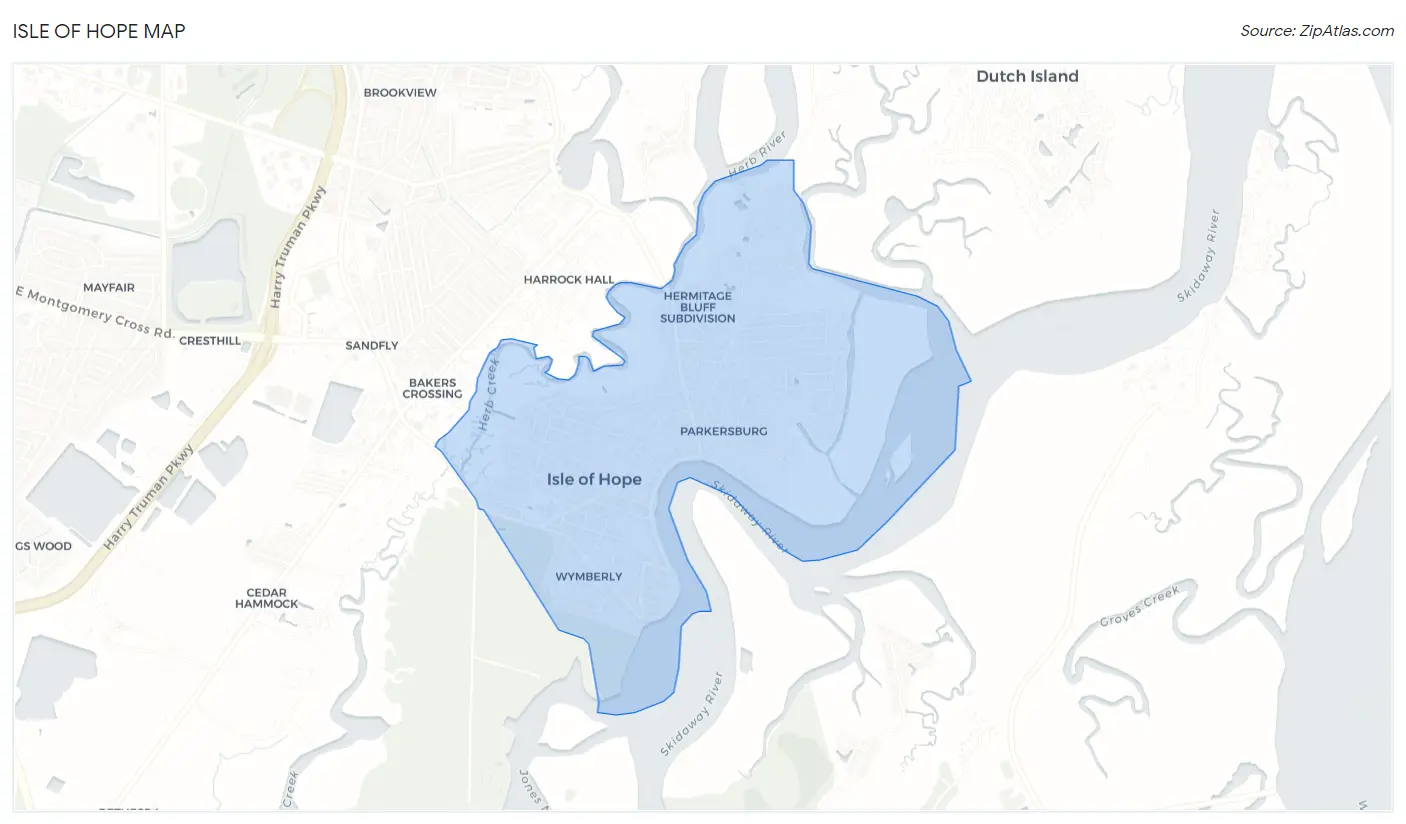
Isle of Hope Map
Isle of Hope Overview
2,137
TOTAL POPULATION
868
MALE POPULATION
1,269
FEMALE POPULATION
68.40
MALES / 100 FEMALES
146.20
FEMALES / 100 MALES
42.8
MEDIAN AGE
3.1
AVG FAMILY SIZE
2.2
AVG HOUSEHOLD SIZE
$70,088
PER CAPITA INCOME
$131,964
AVG FAMILY INCOME
$96,934
AVG HOUSEHOLD INCOME
27.5%
WAGE / INCOME GAP [ % ]
72.5¢/ $1
WAGE / INCOME GAP [ $ ]
0.49
INEQUALITY / GINI INDEX
1,012
LABOR FORCE [ PEOPLE ]
59.9%
PERCENT IN LABOR FORCE
1.8%
UNEMPLOYMENT RATE
Race in Isle of Hope
The most populous races in Isle of Hope are White / Caucasian (2,093 | 97.9%), Two or more Races (37 | 1.7%), and Hispanic or Latino (7 | 0.3%).
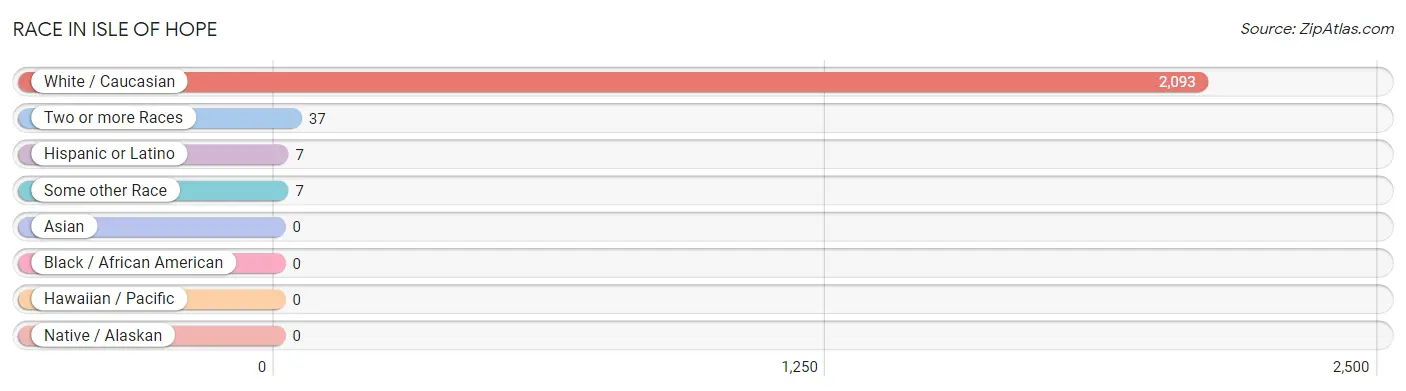
| Race | # Population | % Population |
| Asian | 0 | 0.0% |
| Black / African American | 0 | 0.0% |
| Hawaiian / Pacific | 0 | 0.0% |
| Hispanic or Latino | 7 | 0.3% |
| Native / Alaskan | 0 | 0.0% |
| White / Caucasian | 2,093 | 97.9% |
| Two or more Races | 37 | 1.7% |
| Some other Race | 7 | 0.3% |
| Total | 2,137 | 100.0% |
Ancestry in Isle of Hope
The most populous ancestries reported in Isle of Hope are English (466 | 21.8%), German (462 | 21.6%), Irish (255 | 11.9%), Scottish (211 | 9.9%), and Scotch-Irish (177 | 8.3%), together accounting for 73.5% of all Isle of Hope residents.
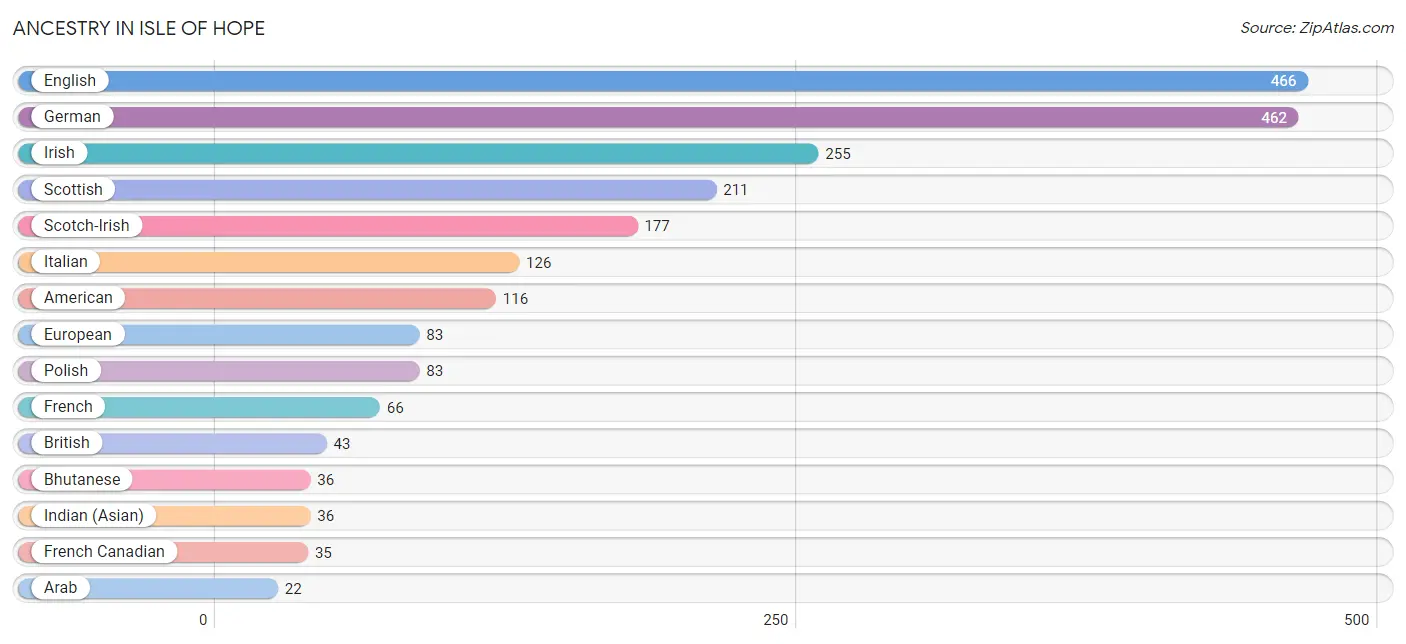
| Ancestry | # Population | % Population |
| American | 116 | 5.4% |
| Arab | 22 | 1.0% |
| Austrian | 7 | 0.3% |
| Bhutanese | 36 | 1.7% |
| British | 43 | 2.0% |
| Dominican | 7 | 0.3% |
| English | 466 | 21.8% |
| European | 83 | 3.9% |
| Finnish | 20 | 0.9% |
| French | 66 | 3.1% |
| French Canadian | 35 | 1.6% |
| German | 462 | 21.6% |
| Greek | 11 | 0.5% |
| Haitian | 7 | 0.3% |
| Hungarian | 9 | 0.4% |
| Indian (Asian) | 36 | 1.7% |
| Irish | 255 | 11.9% |
| Italian | 126 | 5.9% |
| Lebanese | 22 | 1.0% |
| Norwegian | 17 | 0.8% |
| Polish | 83 | 3.9% |
| Scotch-Irish | 177 | 8.3% |
| Scottish | 211 | 9.9% |
| Swiss | 19 | 0.9% |
| Welsh | 16 | 0.7% | View All 25 Rows |
Immigrants in Isle of Hope
The most numerous immigrant groups reported in Isle of Hope came from Europe (32 | 1.5%), Germany (23 | 1.1%), Western Europe (23 | 1.1%), England (9 | 0.4%), and Northern Europe (9 | 0.4%), together accounting for 4.5% of all Isle of Hope residents.
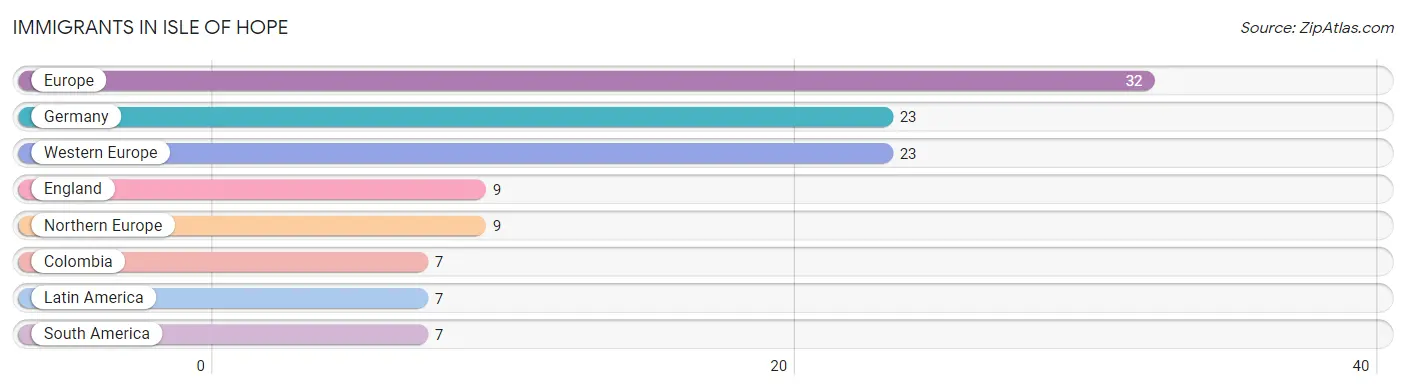
| Immigration Origin | # Population | % Population |
| Colombia | 7 | 0.3% |
| England | 9 | 0.4% |
| Europe | 32 | 1.5% |
| Germany | 23 | 1.1% |
| Latin America | 7 | 0.3% |
| Northern Europe | 9 | 0.4% |
| South America | 7 | 0.3% |
| Western Europe | 23 | 1.1% | View All 8 Rows |
Sex and Age in Isle of Hope
Sex and Age in Isle of Hope
The most populous age groups in Isle of Hope are 35 to 39 Years (105 | 12.1%) for men and 60 to 64 Years (116 | 9.1%) for women.
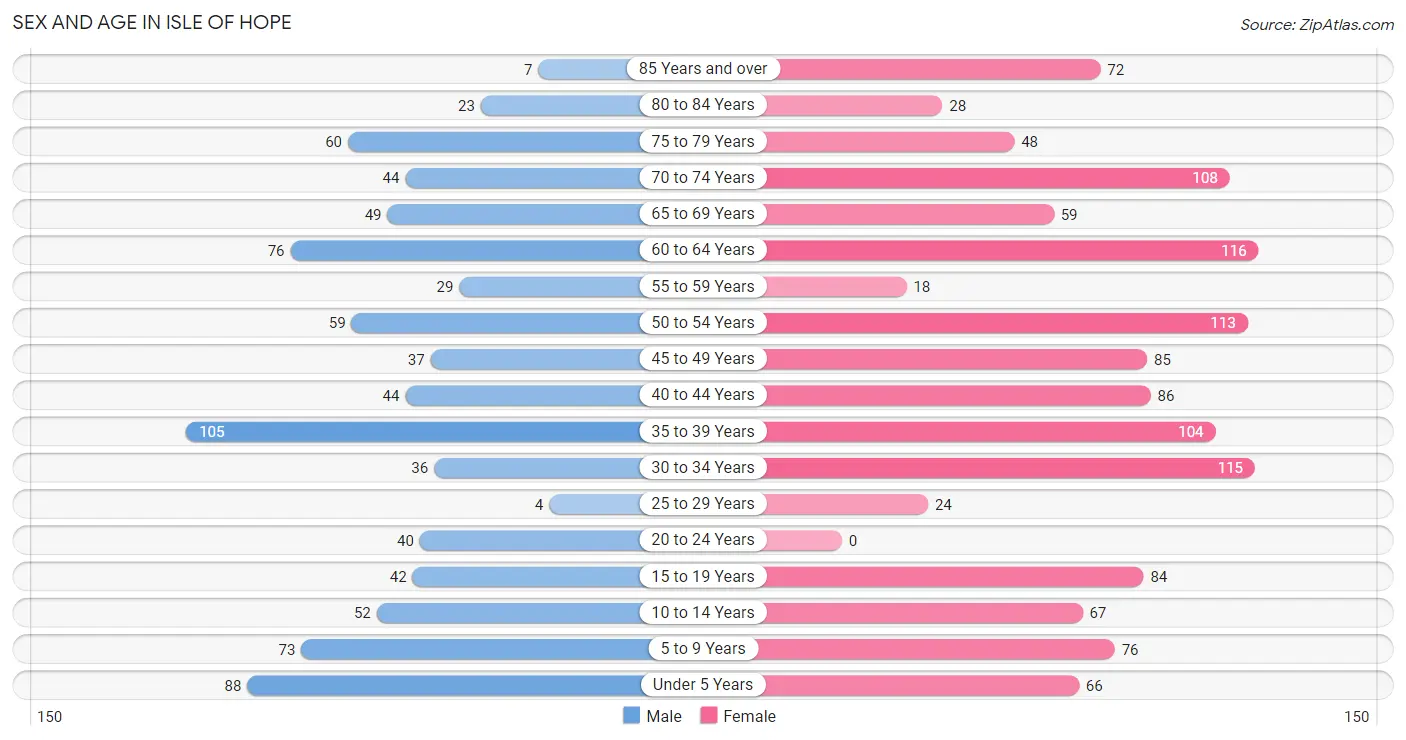
| Age Bracket | Male | Female |
| Under 5 Years | 88 (10.1%) | 66 (5.2%) |
| 5 to 9 Years | 73 (8.4%) | 76 (6.0%) |
| 10 to 14 Years | 52 (6.0%) | 67 (5.3%) |
| 15 to 19 Years | 42 (4.8%) | 84 (6.6%) |
| 20 to 24 Years | 40 (4.6%) | 0 (0.0%) |
| 25 to 29 Years | 4 (0.5%) | 24 (1.9%) |
| 30 to 34 Years | 36 (4.2%) | 115 (9.1%) |
| 35 to 39 Years | 105 (12.1%) | 104 (8.2%) |
| 40 to 44 Years | 44 (5.1%) | 86 (6.8%) |
| 45 to 49 Years | 37 (4.3%) | 85 (6.7%) |
| 50 to 54 Years | 59 (6.8%) | 113 (8.9%) |
| 55 to 59 Years | 29 (3.3%) | 18 (1.4%) |
| 60 to 64 Years | 76 (8.8%) | 116 (9.1%) |
| 65 to 69 Years | 49 (5.7%) | 59 (4.6%) |
| 70 to 74 Years | 44 (5.1%) | 108 (8.5%) |
| 75 to 79 Years | 60 (6.9%) | 48 (3.8%) |
| 80 to 84 Years | 23 (2.6%) | 28 (2.2%) |
| 85 Years and over | 7 (0.8%) | 72 (5.7%) |
| Total | 868 (100.0%) | 1,269 (100.0%) |
Families and Households in Isle of Hope
Median Family Size in Isle of Hope
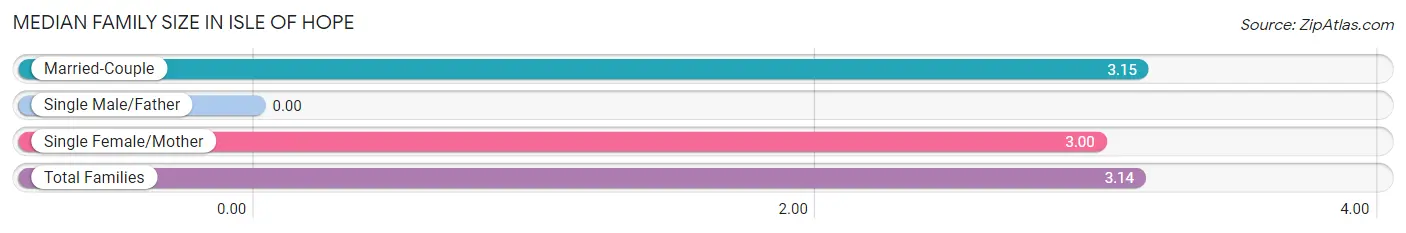
| Family Type | # Families | Family Size |
| Married-Couple | 487 (90.9%) | 3.15 |
| Single Male/Father | 0 (0.0%) | - |
| Single Female/Mother | 49 (9.1%) | 3.00 |
| Total Families | 536 (100.0%) | 3.14 |
Median Household Size in Isle of Hope
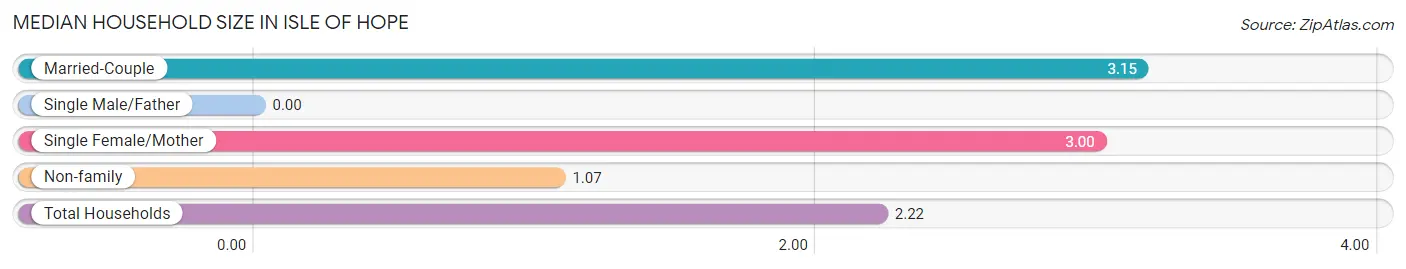
| Household Type | # Households | Household Size |
| Married-Couple | 487 (50.7%) | 3.15 |
| Single Male/Father | 0 (0.0%) | - |
| Single Female/Mother | 49 (5.1%) | 3.00 |
| Non-family | 425 (44.2%) | 1.07 |
| Total Households | 961 (100.0%) | 2.22 |
Household Size by Marriage Status in Isle of Hope
Out of a total of 961 households in Isle of Hope, 536 (55.8%) are family households, while 425 (44.2%) are nonfamily households. The most numerous type of family households are 2-person households, comprising 217, and the most common type of nonfamily households are 1-person households, comprising 397.
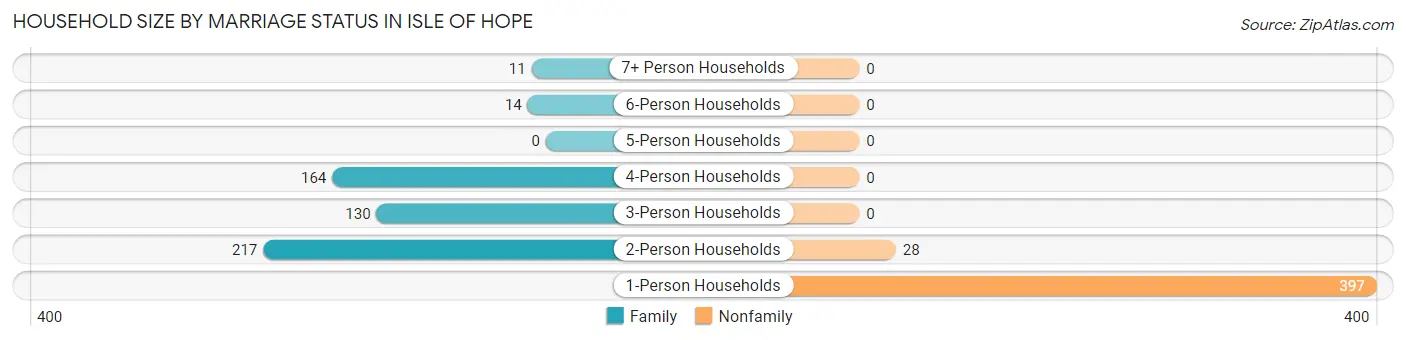
| Household Size | Family Households | Nonfamily Households |
| 1-Person Households | - | 397 (41.3%) |
| 2-Person Households | 217 (22.6%) | 28 (2.9%) |
| 3-Person Households | 130 (13.5%) | 0 (0.0%) |
| 4-Person Households | 164 (17.1%) | 0 (0.0%) |
| 5-Person Households | 0 (0.0%) | 0 (0.0%) |
| 6-Person Households | 14 (1.5%) | 0 (0.0%) |
| 7+ Person Households | 11 (1.1%) | 0 (0.0%) |
| Total | 536 (55.8%) | 425 (44.2%) |
Female Fertility in Isle of Hope
Fertility by Age in Isle of Hope
Average fertility rate in Isle of Hope is 104.0 births per 1,000 women. Women in the age bracket of 20 to 34 years have the highest fertility rate with 360.0 births per 1,000 women. Women in the age bracket of 20 to 34 years acount for 83.3% of all women with births.
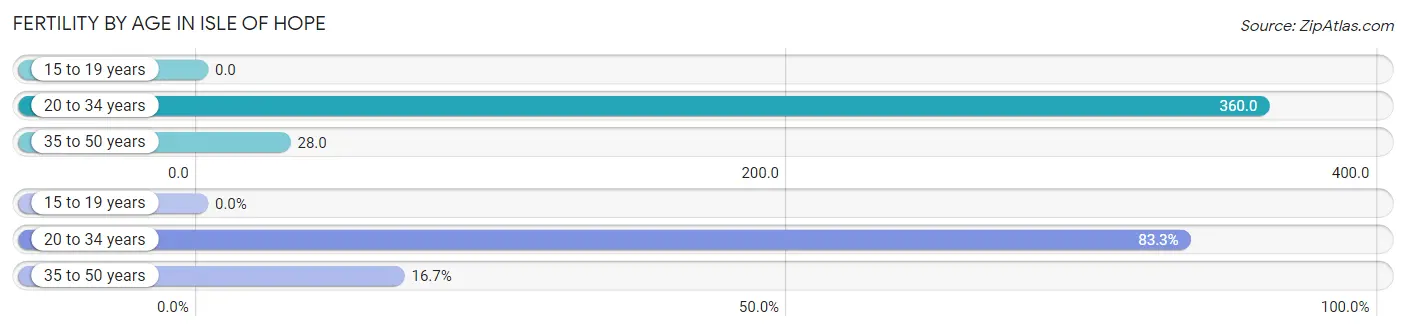
| Age Bracket | Women with Births | Births / 1,000 Women |
| 15 to 19 years | 0 (0.0%) | 0.0 |
| 20 to 34 years | 50 (83.3%) | 360.0 |
| 35 to 50 years | 10 (16.7%) | 28.0 |
| Total | 60 (100.0%) | 104.0 |
Fertility by Age by Marriage Status in Isle of Hope
30.0% of women with births (60) in Isle of Hope are married. The highest percentage of unmarried women with births falls into 20 to 34 years age bracket with 84.0% of them unmarried at the time of birth, while the lowest percentage of unmarried women with births belong to 35 to 50 years age bracket with 0.0% of them unmarried.
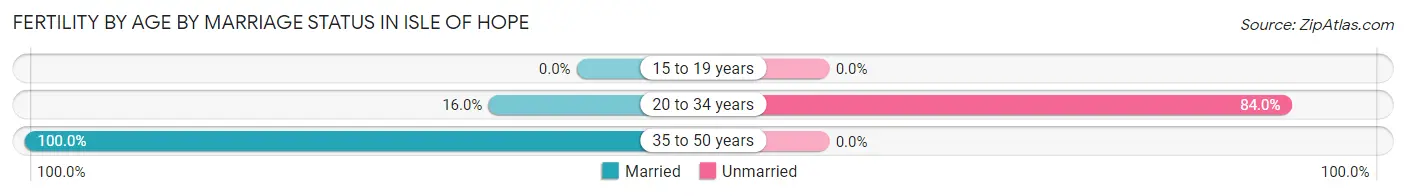
| Age Bracket | Married | Unmarried |
| 15 to 19 years | 0 (0.0%) | 0 (0.0%) |
| 20 to 34 years | 8 (16.0%) | 42 (84.0%) |
| 35 to 50 years | 10 (100.0%) | 0 (0.0%) |
| Total | 18 (30.0%) | 42 (70.0%) |
Fertility by Education in Isle of Hope
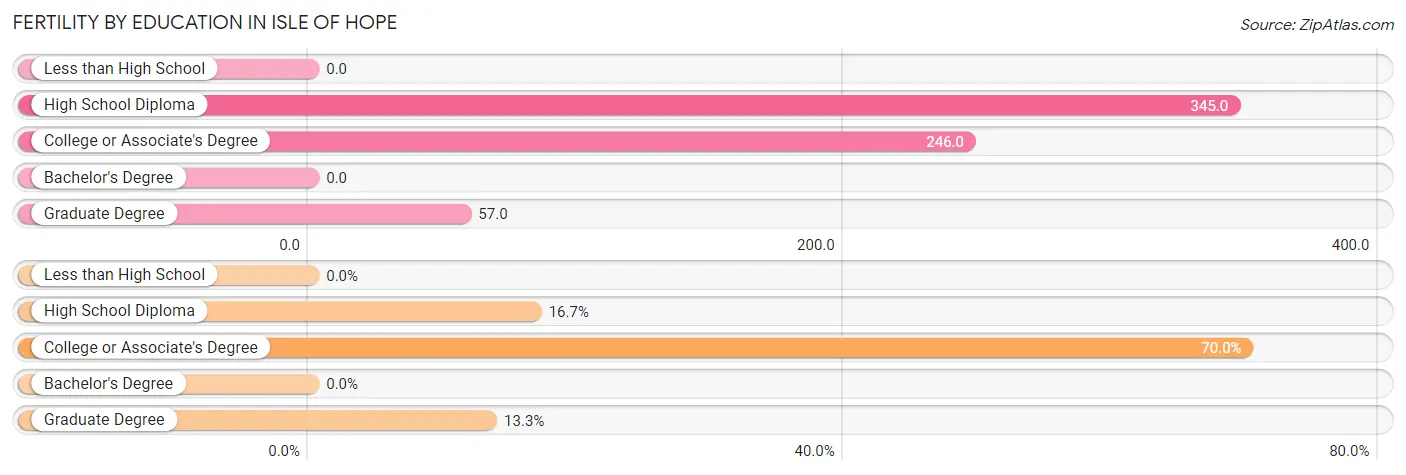
| Educational Attainment | Women with Births | Births / 1,000 Women |
| Less than High School | 0 (0.0%) | 0.0 |
| High School Diploma | 10 (16.7%) | 345.0 |
| College or Associate's Degree | 42 (70.0%) | 246.0 |
| Bachelor's Degree | 0 (0.0%) | 0.0 |
| Graduate Degree | 8 (13.3%) | 57.0 |
| Total | 60 (100.0%) | 104.0 |
Fertility by Education by Marriage Status in Isle of Hope
70.0% of women with births in Isle of Hope are unmarried. Women with the educational attainment of high school diploma are most likely to be married with 100.0% of them married at childbirth, while women with the educational attainment of college or associate's degree are least likely to be married with 100.0% of them unmarried at childbirth.
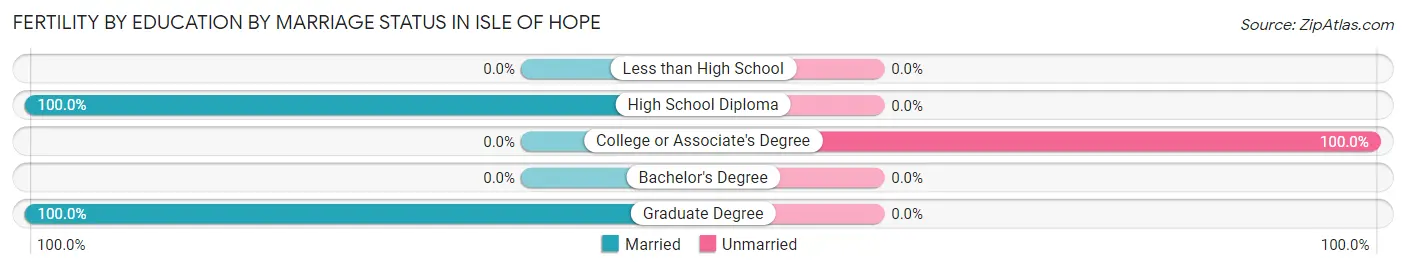
| Educational Attainment | Married | Unmarried |
| Less than High School | 0 (0.0%) | 0 (0.0%) |
| High School Diploma | 10 (100.0%) | 0 (0.0%) |
| College or Associate's Degree | 0 (0.0%) | 42 (100.0%) |
| Bachelor's Degree | 0 (0.0%) | 0 (0.0%) |
| Graduate Degree | 8 (100.0%) | 0 (0.0%) |
| Total | 18 (30.0%) | 42 (70.0%) |
Income in Isle of Hope
Income Overview in Isle of Hope
Per Capita Income in Isle of Hope is $70,088, while median incomes of families and households are $131,964 and $96,934 respectively.
| Characteristic | Number | Measure |
| Per Capita Income | 2,137 | $70,088 |
| Median Family Income | 536 | $131,964 |
| Mean Family Income | 536 | $212,400 |
| Median Household Income | 961 | $96,934 |
| Mean Household Income | 961 | $158,310 |
| Income Deficit | 536 | $0 |
| Wage / Income Gap (%) | 2,137 | 27.46% |
| Wage / Income Gap ($) | 2,137 | 72.54¢ per $1 |
| Gini / Inequality Index | 2,137 | 0.49 |
Earnings by Sex in Isle of Hope
Average Earnings in Isle of Hope are $70,931, $85,208 for men and $61,806 for women, a difference of 27.5%.
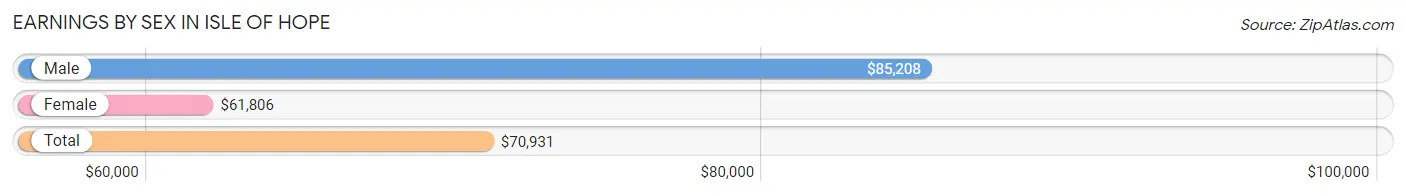
| Sex | Number | Average Earnings |
| Male | 473 (45.2%) | $85,208 |
| Female | 573 (54.8%) | $61,806 |
| Total | 1,046 (100.0%) | $70,931 |
Earnings by Sex by Income Bracket in Isle of Hope
The most common earnings brackets in Isle of Hope are $100,000+ for men (215 | 45.5%) and $100,000+ for women (156 | 27.2%).
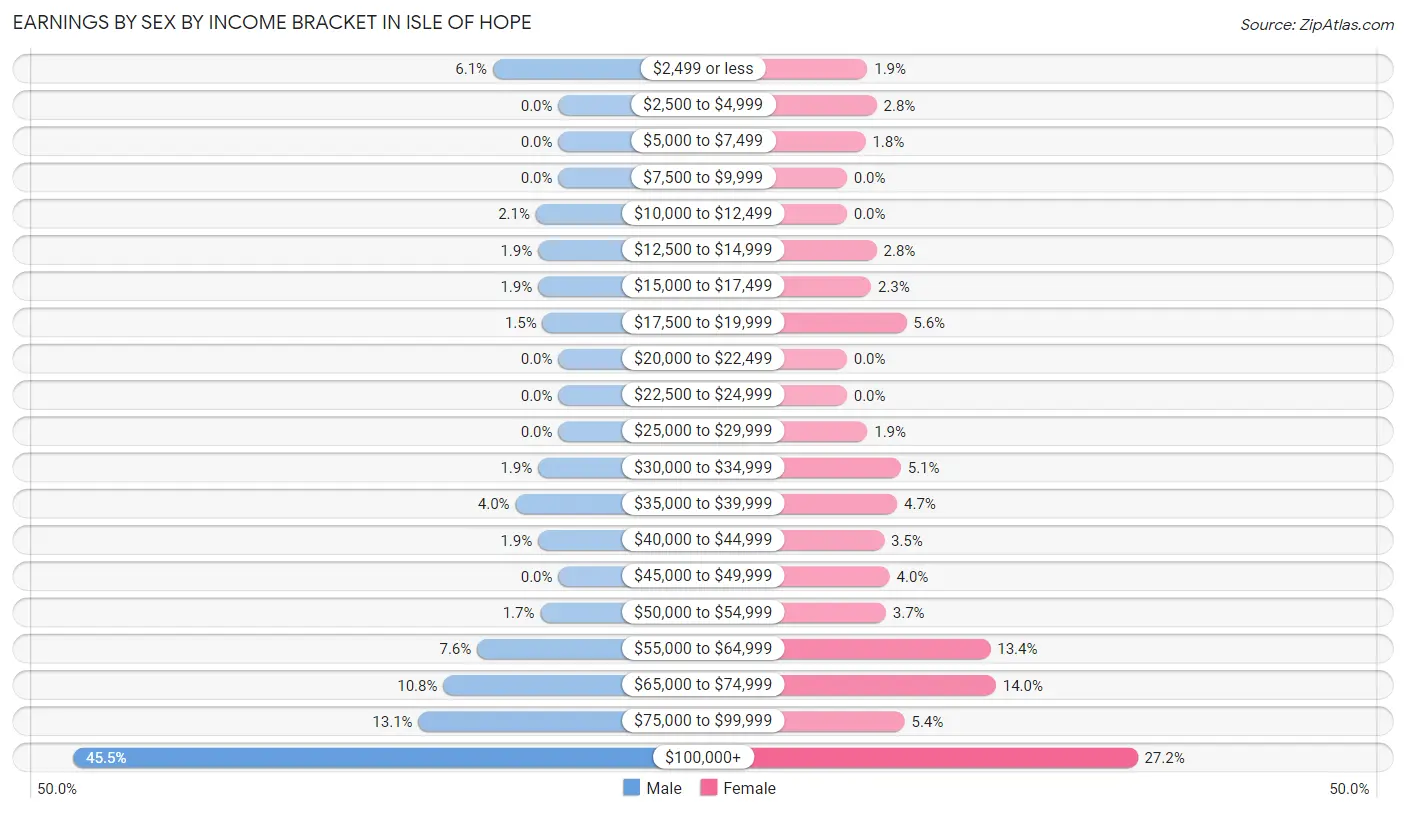
| Income | Male | Female |
| $2,499 or less | 29 (6.1%) | 11 (1.9%) |
| $2,500 to $4,999 | 0 (0.0%) | 16 (2.8%) |
| $5,000 to $7,499 | 0 (0.0%) | 10 (1.8%) |
| $7,500 to $9,999 | 0 (0.0%) | 0 (0.0%) |
| $10,000 to $12,499 | 10 (2.1%) | 0 (0.0%) |
| $12,500 to $14,999 | 9 (1.9%) | 16 (2.8%) |
| $15,000 to $17,499 | 9 (1.9%) | 13 (2.3%) |
| $17,500 to $19,999 | 7 (1.5%) | 32 (5.6%) |
| $20,000 to $22,499 | 0 (0.0%) | 0 (0.0%) |
| $22,500 to $24,999 | 0 (0.0%) | 0 (0.0%) |
| $25,000 to $29,999 | 0 (0.0%) | 11 (1.9%) |
| $30,000 to $34,999 | 9 (1.9%) | 29 (5.1%) |
| $35,000 to $39,999 | 19 (4.0%) | 27 (4.7%) |
| $40,000 to $44,999 | 9 (1.9%) | 20 (3.5%) |
| $45,000 to $49,999 | 0 (0.0%) | 23 (4.0%) |
| $50,000 to $54,999 | 8 (1.7%) | 21 (3.7%) |
| $55,000 to $64,999 | 36 (7.6%) | 77 (13.4%) |
| $65,000 to $74,999 | 51 (10.8%) | 80 (14.0%) |
| $75,000 to $99,999 | 62 (13.1%) | 31 (5.4%) |
| $100,000+ | 215 (45.5%) | 156 (27.2%) |
| Total | 473 (100.0%) | 573 (100.0%) |
Earnings by Sex by Educational Attainment in Isle of Hope
Average earnings in Isle of Hope are $90,750 for men and $61,806 for women, a difference of 31.9%. Men with an educational attainment of graduate degree enjoy the highest average annual earnings of $250,001, while those with college or associate's degree education earn the least with $70,417. Women with an educational attainment of graduate degree earn the most with the average annual earnings of $98,500, while those with college or associate's degree education have the smallest earnings of $46,957.
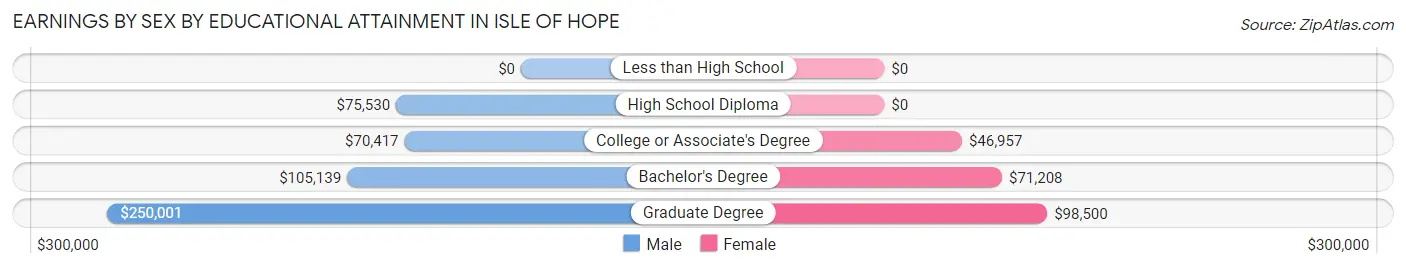
| Educational Attainment | Male Income | Female Income |
| Less than High School | - | - |
| High School Diploma | $75,530 | $0 |
| College or Associate's Degree | $70,417 | $46,957 |
| Bachelor's Degree | $105,139 | $71,208 |
| Graduate Degree | $250,001 | $98,500 |
| Total | $90,750 | $61,806 |
Family Income in Isle of Hope
Family Income Brackets in Isle of Hope
According to the Isle of Hope family income data, there are 157 families falling into the $200,000+ income range, which is the most common income bracket and makes up 29.3% of all families.
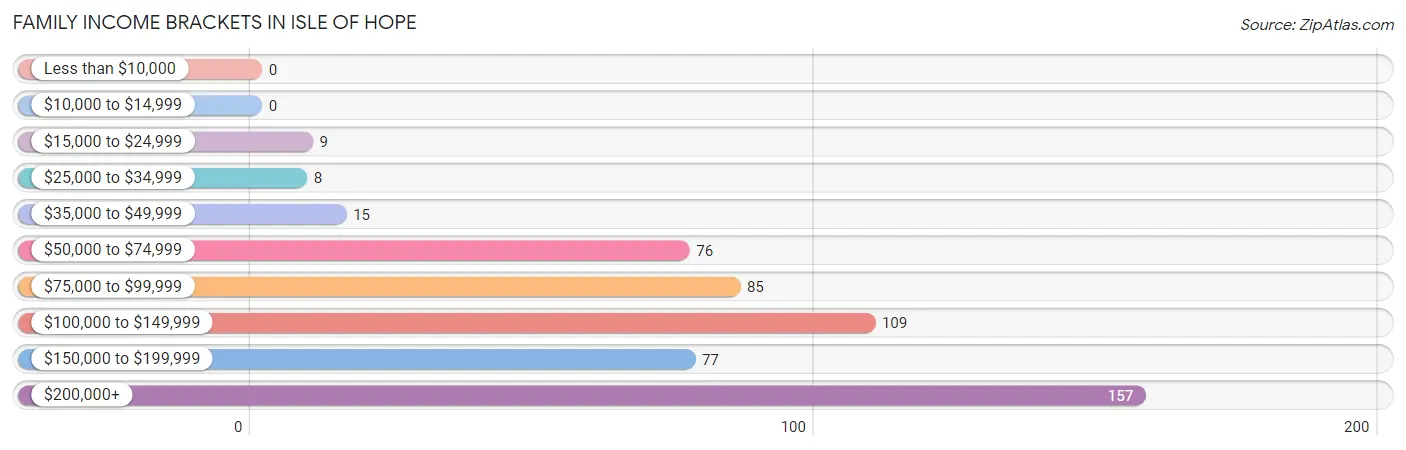
| Income Bracket | # Families | % Families |
| Less than $10,000 | 0 | 0.0% |
| $10,000 to $14,999 | 0 | 0.0% |
| $15,000 to $24,999 | 9 | 1.7% |
| $25,000 to $34,999 | 8 | 1.5% |
| $35,000 to $49,999 | 15 | 2.8% |
| $50,000 to $74,999 | 76 | 14.2% |
| $75,000 to $99,999 | 85 | 15.9% |
| $100,000 to $149,999 | 109 | 20.3% |
| $150,000 to $199,999 | 77 | 14.4% |
| $200,000+ | 157 | 29.3% |
Family Income by Famaliy Size in Isle of Hope
4-person families (164 | 30.6%) account for the highest median family income in Isle of Hope with $250,001 per family, while 4-person families (164 | 30.6%) have the highest median income of $62,500 per family member.
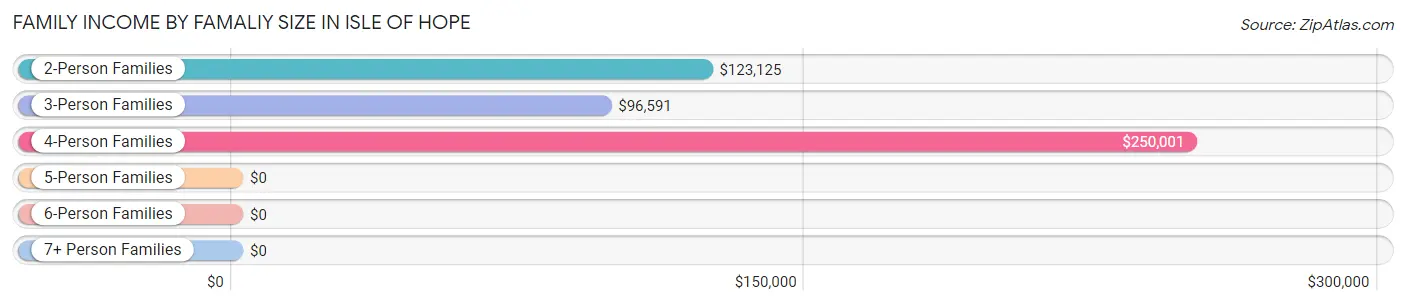
| Income Bracket | # Families | Median Income |
| 2-Person Families | 217 (40.5%) | $123,125 |
| 3-Person Families | 130 (24.2%) | $96,591 |
| 4-Person Families | 164 (30.6%) | $250,001 |
| 5-Person Families | 0 (0.0%) | $0 |
| 6-Person Families | 14 (2.6%) | $0 |
| 7+ Person Families | 11 (2.1%) | $0 |
| Total | 536 (100.0%) | $131,964 |
Family Income by Number of Earners in Isle of Hope
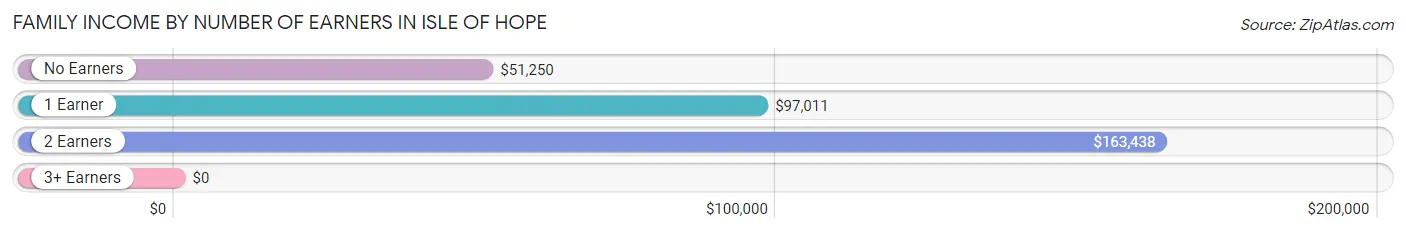
| Number of Earners | # Families | Median Income |
| No Earners | 55 (10.3%) | $51,250 |
| 1 Earner | 131 (24.4%) | $97,011 |
| 2 Earners | 332 (61.9%) | $163,438 |
| 3+ Earners | 18 (3.4%) | $0 |
| Total | 536 (100.0%) | $131,964 |
Household Income in Isle of Hope
Household Income Brackets in Isle of Hope
With 214 households falling in the category, the $200,000+ income range is the most frequent in Isle of Hope, accounting for 22.3% of all households. In contrast, only 5 households (0.5%) fall into the less than $10,000 income bracket, making it the least populous group.
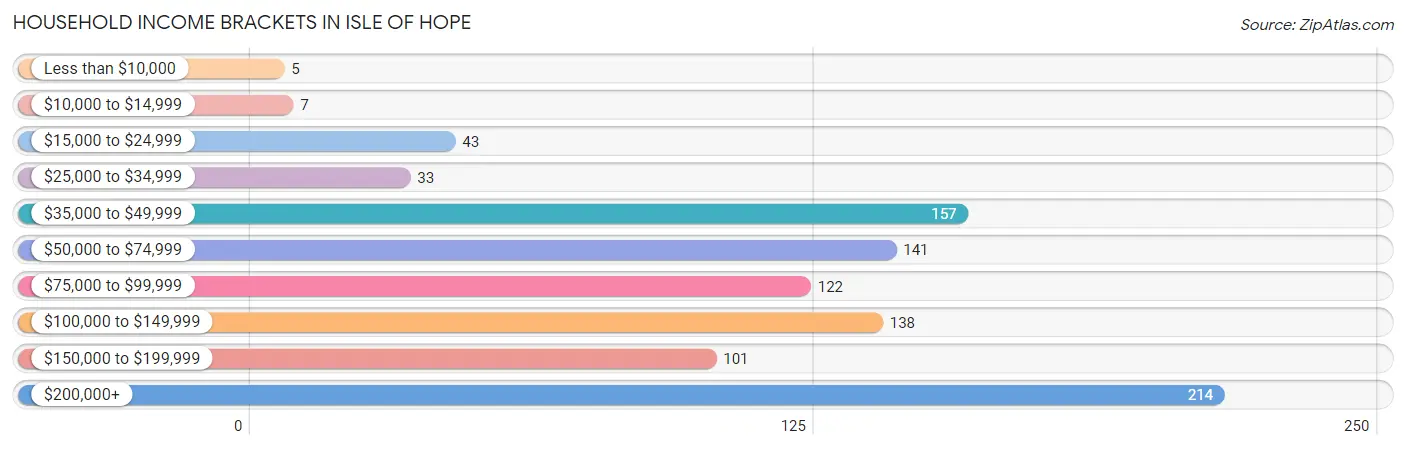
| Income Bracket | # Households | % Households |
| Less than $10,000 | 5 | 0.5% |
| $10,000 to $14,999 | 7 | 0.7% |
| $15,000 to $24,999 | 43 | 4.5% |
| $25,000 to $34,999 | 33 | 3.4% |
| $35,000 to $49,999 | 157 | 16.3% |
| $50,000 to $74,999 | 141 | 14.7% |
| $75,000 to $99,999 | 122 | 12.7% |
| $100,000 to $149,999 | 138 | 14.4% |
| $150,000 to $199,999 | 101 | 10.5% |
| $200,000+ | 214 | 22.3% |
Household Income by Householder Age in Isle of Hope
The median household income in Isle of Hope is $96,934, with the highest median household income of $185,938 found in the 25 to 44 years age bracket for the primary householder. A total of 264 households (27.5%) fall into this category.
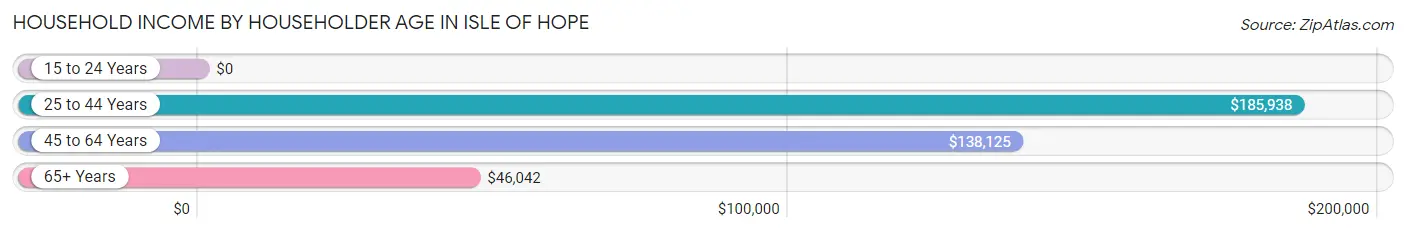
| Income Bracket | # Households | Median Income |
| 15 to 24 Years | 0 (0.0%) | $0 |
| 25 to 44 Years | 264 (27.5%) | $185,938 |
| 45 to 64 Years | 324 (33.7%) | $138,125 |
| 65+ Years | 373 (38.8%) | $46,042 |
| Total | 961 (100.0%) | $96,934 |
Poverty in Isle of Hope
Income Below Poverty by Sex and Age in Isle of Hope
With 1.6% poverty level for males and 1.3% for females among the residents of Isle of Hope, 55 to 64 year old males and 55 to 64 year old females are the most vulnerable to poverty, with 9 males (8.6%) and 9 females (6.7%) in their respective age groups living below the poverty level.
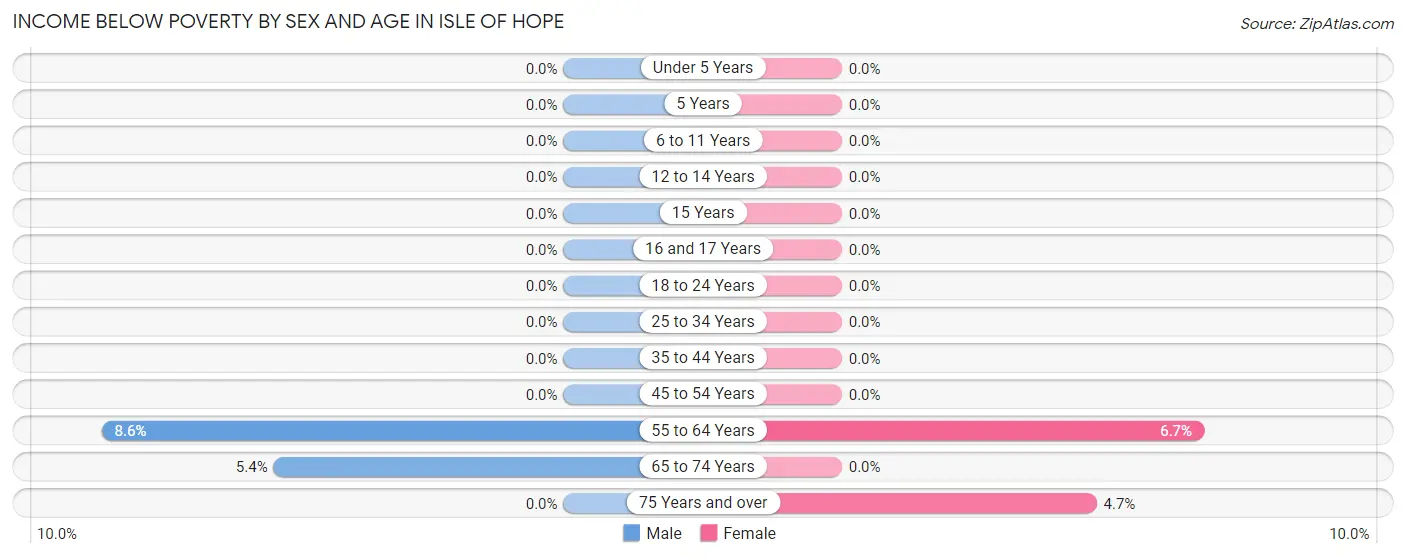
| Age Bracket | Male | Female |
| Under 5 Years | 0 (0.0%) | 0 (0.0%) |
| 5 Years | 0 (0.0%) | 0 (0.0%) |
| 6 to 11 Years | 0 (0.0%) | 0 (0.0%) |
| 12 to 14 Years | 0 (0.0%) | 0 (0.0%) |
| 15 Years | 0 (0.0%) | 0 (0.0%) |
| 16 and 17 Years | 0 (0.0%) | 0 (0.0%) |
| 18 to 24 Years | 0 (0.0%) | 0 (0.0%) |
| 25 to 34 Years | 0 (0.0%) | 0 (0.0%) |
| 35 to 44 Years | 0 (0.0%) | 0 (0.0%) |
| 45 to 54 Years | 0 (0.0%) | 0 (0.0%) |
| 55 to 64 Years | 9 (8.6%) | 9 (6.7%) |
| 65 to 74 Years | 5 (5.4%) | 0 (0.0%) |
| 75 Years and over | 0 (0.0%) | 7 (4.7%) |
| Total | 14 (1.6%) | 16 (1.3%) |
Income Above Poverty by Sex and Age in Isle of Hope
According to the poverty statistics in Isle of Hope, males aged under 5 years and females aged under 5 years are the age groups that are most secure financially, with 100.0% of males and 100.0% of females in these age groups living above the poverty line.
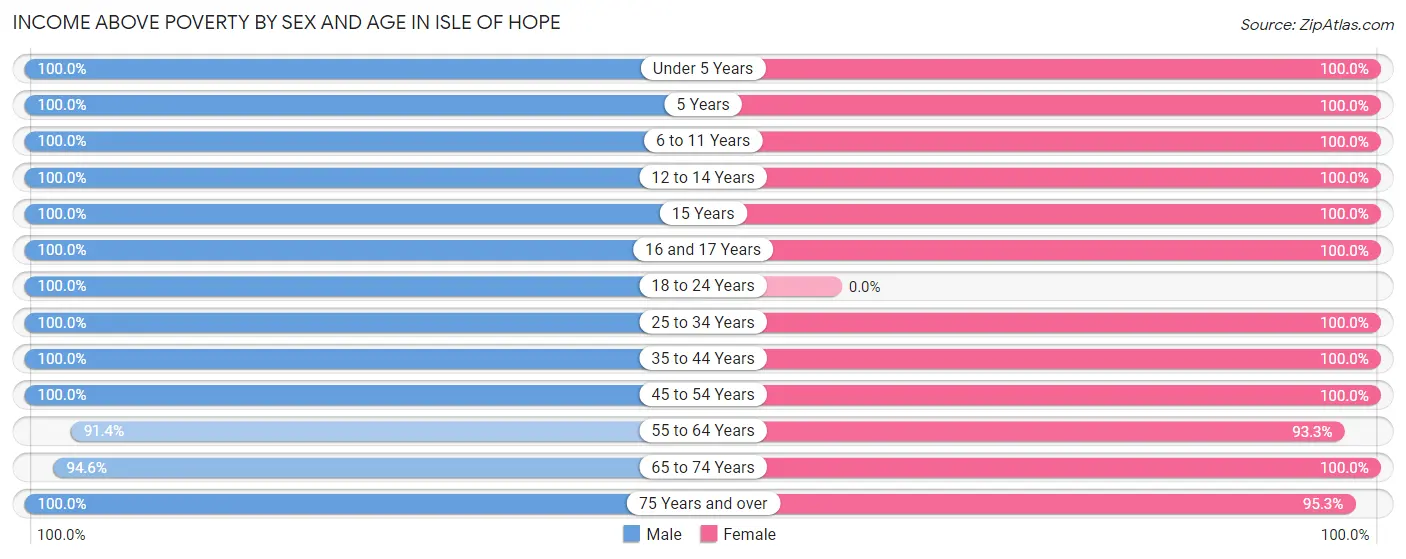
| Age Bracket | Male | Female |
| Under 5 Years | 88 (100.0%) | 66 (100.0%) |
| 5 Years | 10 (100.0%) | 32 (100.0%) |
| 6 to 11 Years | 94 (100.0%) | 63 (100.0%) |
| 12 to 14 Years | 21 (100.0%) | 48 (100.0%) |
| 15 Years | 8 (100.0%) | 17 (100.0%) |
| 16 and 17 Years | 34 (100.0%) | 67 (100.0%) |
| 18 to 24 Years | 40 (100.0%) | 0 (0.0%) |
| 25 to 34 Years | 40 (100.0%) | 139 (100.0%) |
| 35 to 44 Years | 149 (100.0%) | 190 (100.0%) |
| 45 to 54 Years | 96 (100.0%) | 198 (100.0%) |
| 55 to 64 Years | 96 (91.4%) | 125 (93.3%) |
| 65 to 74 Years | 88 (94.6%) | 167 (100.0%) |
| 75 Years and over | 90 (100.0%) | 141 (95.3%) |
| Total | 854 (98.4%) | 1,253 (98.7%) |
Income Below Poverty Among Married-Couple Families in Isle of Hope
The poverty statistics for married-couple families in Isle of Hope show that 1.8% or 9 of the total 487 families live below the poverty line. Families with no children have the highest poverty rate of 3.3%, comprising of 9 families. On the other hand, families with 1 or 2 children have the lowest poverty rate of 0.0%, which includes 0 families.
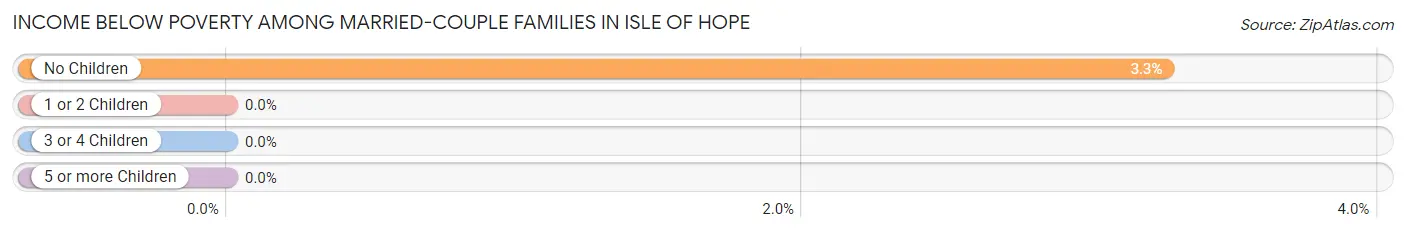
| Children | Above Poverty | Below Poverty |
| No Children | 267 (96.7%) | 9 (3.3%) |
| 1 or 2 Children | 186 (100.0%) | 0 (0.0%) |
| 3 or 4 Children | 14 (100.0%) | 0 (0.0%) |
| 5 or more Children | 11 (100.0%) | 0 (0.0%) |
| Total | 478 (98.2%) | 9 (1.8%) |
Income Below Poverty Among Single-Parent Households in Isle of Hope
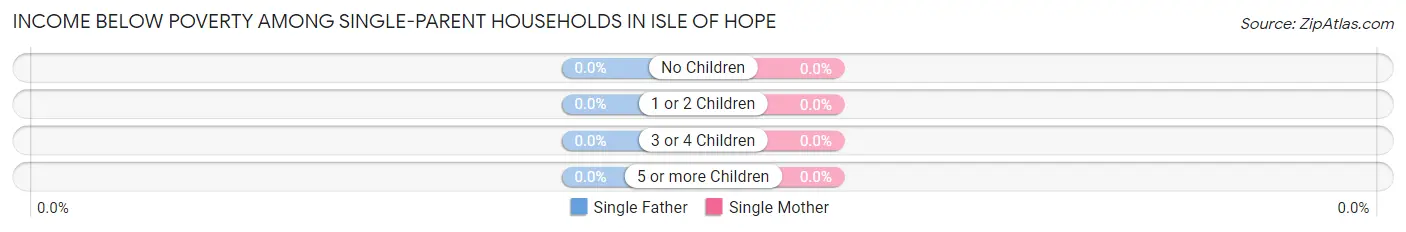
| Children | Single Father | Single Mother |
| No Children | 0 (0.0%) | 0 (0.0%) |
| 1 or 2 Children | 0 (0.0%) | 0 (0.0%) |
| 3 or 4 Children | 0 (0.0%) | 0 (0.0%) |
| 5 or more Children | 0 (0.0%) | 0 (0.0%) |
| Total | 0 (0.0%) | 0 (0.0%) |
Income Below Poverty Among Married-Couple vs Single-Parent Households in Isle of Hope
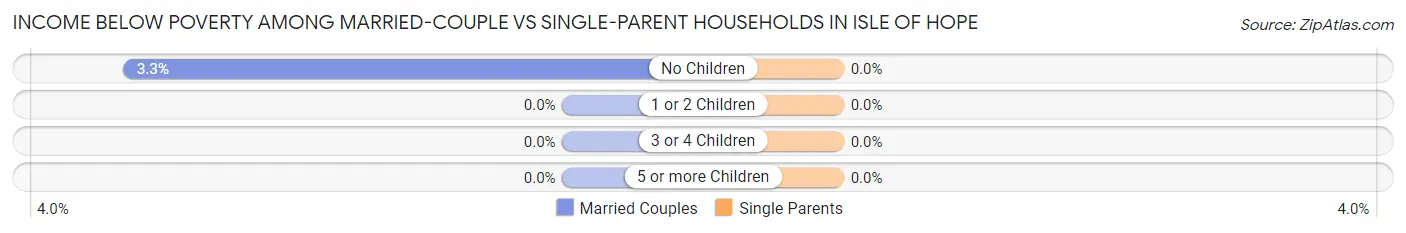
| Children | Married-Couple Families | Single-Parent Households |
| No Children | 9 (3.3%) | 0 (0.0%) |
| 1 or 2 Children | 0 (0.0%) | 0 (0.0%) |
| 3 or 4 Children | 0 (0.0%) | 0 (0.0%) |
| 5 or more Children | 0 (0.0%) | 0 (0.0%) |
| Total | 9 (1.8%) | 0 (0.0%) |
Employment Characteristics in Isle of Hope
Employment by Class of Employer in Isle of Hope
Among the 994 employed individuals in Isle of Hope, private company employees (571 | 57.4%), self-employed (incorporated) (161 | 16.2%), and not-for-profit organizations (144 | 14.5%) make up the most common classes of employment.
| Employer Class | # Employees | % Employees |
| Private Company Employees | 571 | 57.4% |
| Self-Employed (Incorporated) | 161 | 16.2% |
| Self-Employed (Not Incorporated) | 63 | 6.3% |
| Not-for-profit Organizations | 144 | 14.5% |
| Local Government Employees | 0 | 0.0% |
| State Government Employees | 38 | 3.8% |
| Federal Government Employees | 17 | 1.7% |
| Unpaid Family Workers | 0 | 0.0% |
| Total | 994 | 100.0% |
Employment Status by Age in Isle of Hope
According to the labor force statistics for Isle of Hope, out of the total population over 16 years of age (1,690), 59.9% or 1,012 individuals are in the labor force, with 1.8% or 18 of them unemployed. The age group with the highest labor force participation rate is 25 to 29 years, with 100.0% or 28 individuals in the labor force. Within the labor force, the 25 to 29 years age range has the highest percentage of unemployed individuals, with 39.3% or 11 of them being unemployed.
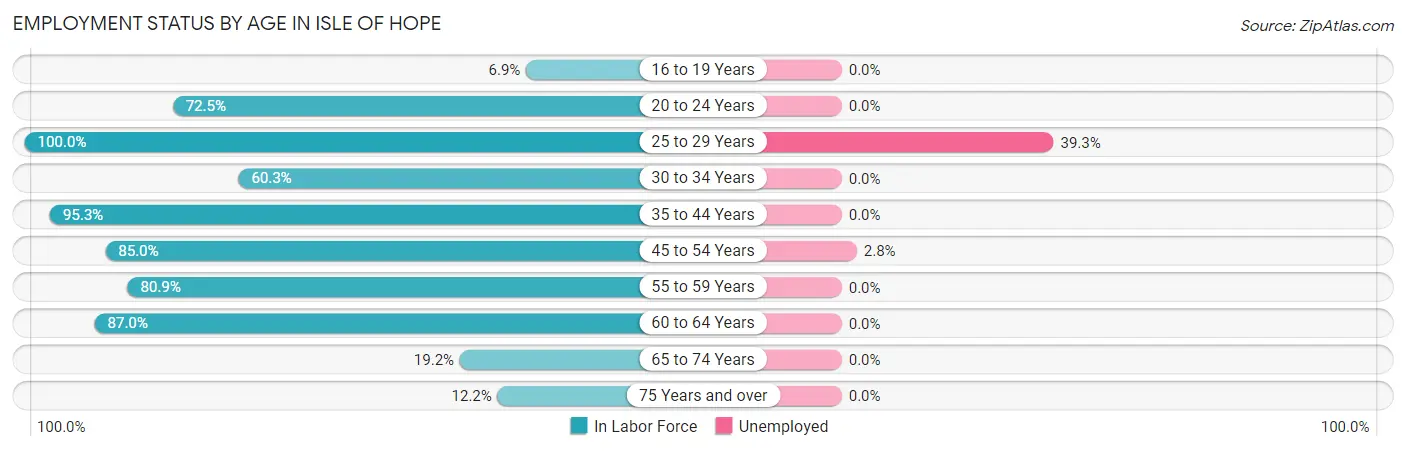
| Age Bracket | In Labor Force | Unemployed |
| 16 to 19 Years | 7 (6.9%) | 0 (0.0%) |
| 20 to 24 Years | 29 (72.5%) | 0 (0.0%) |
| 25 to 29 Years | 28 (100.0%) | 11 (39.3%) |
| 30 to 34 Years | 91 (60.3%) | 0 (0.0%) |
| 35 to 44 Years | 323 (95.3%) | 0 (0.0%) |
| 45 to 54 Years | 250 (85.0%) | 7 (2.8%) |
| 55 to 59 Years | 38 (80.9%) | 0 (0.0%) |
| 60 to 64 Years | 167 (87.0%) | 0 (0.0%) |
| 65 to 74 Years | 50 (19.2%) | 0 (0.0%) |
| 75 Years and over | 29 (12.2%) | 0 (0.0%) |
| Total | 1,012 (59.9%) | 18 (1.8%) |
Employment Status by Educational Attainment in Isle of Hope
According to labor force statistics for Isle of Hope, 85.3% of individuals (897) out of the total population between 25 and 64 years of age (1,051) are in the labor force, with 2.0% or 18 of them being unemployed. The group with the highest labor force participation rate are those with the educational attainment of bachelor's degree or higher, with 92.0% or 583 individuals in the labor force. Within the labor force, individuals with college / associate degree education have the highest percentage of unemployment, with 6.0% or 11 of them being unemployed.
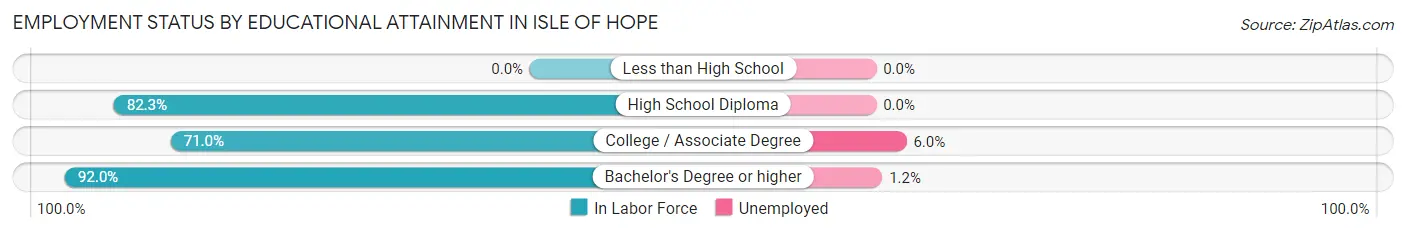
| Educational Attainment | In Labor Force | Unemployed |
| Less than High School | 0 (0.0%) | 0 (0.0%) |
| High School Diploma | 130 (82.3%) | 0 (0.0%) |
| College / Associate Degree | 184 (71.0%) | 16 (6.0%) |
| Bachelor's Degree or higher | 583 (92.0%) | 8 (1.2%) |
| Total | 897 (85.3%) | 21 (2.0%) |
Employment Occupations by Sex in Isle of Hope
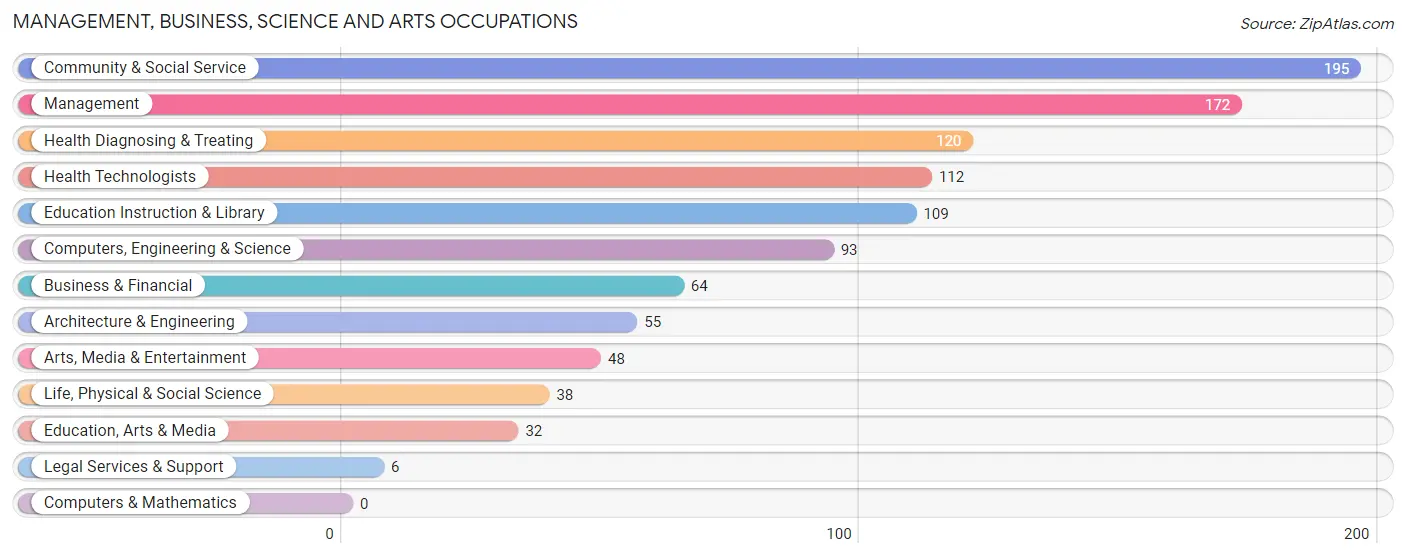
Management, Business, Science and Arts Occupations
The most common Management, Business, Science and Arts occupations in Isle of Hope are Community & Social Service (195 | 19.6%), Management (172 | 17.3%), Health Diagnosing & Treating (120 | 12.1%), Health Technologists (112 | 11.3%), and Education Instruction & Library (109 | 11.0%).
Management, Business, Science and Arts Occupations by Sex
Within the Management, Business, Science and Arts occupations in Isle of Hope, the most male-oriented occupations are Legal Services & Support (100.0%), Management (67.4%), and Architecture & Engineering (60.0%), while the most female-oriented occupations are Education, Arts & Media (100.0%), Education Instruction & Library (93.6%), and Community & Social Service (84.1%).
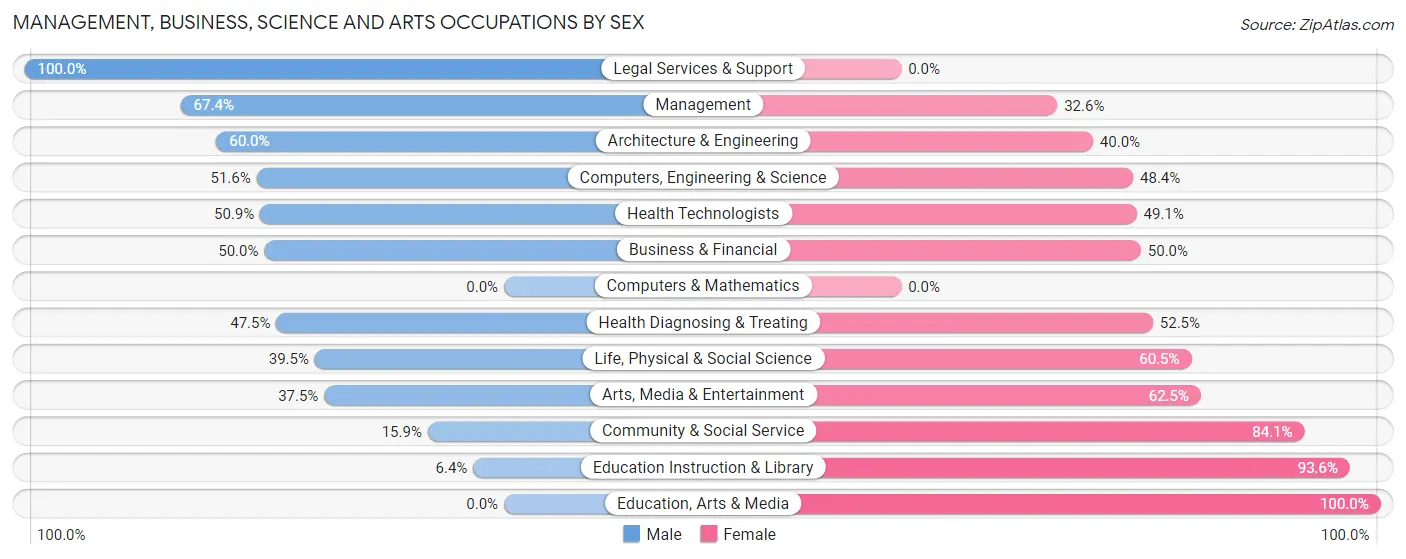
| Occupation | Male | Female |
| Management | 116 (67.4%) | 56 (32.6%) |
| Business & Financial | 32 (50.0%) | 32 (50.0%) |
| Computers, Engineering & Science | 48 (51.6%) | 45 (48.4%) |
| Computers & Mathematics | 0 (0.0%) | 0 (0.0%) |
| Architecture & Engineering | 33 (60.0%) | 22 (40.0%) |
| Life, Physical & Social Science | 15 (39.5%) | 23 (60.5%) |
| Community & Social Service | 31 (15.9%) | 164 (84.1%) |
| Education, Arts & Media | 0 (0.0%) | 32 (100.0%) |
| Legal Services & Support | 6 (100.0%) | 0 (0.0%) |
| Education Instruction & Library | 7 (6.4%) | 102 (93.6%) |
| Arts, Media & Entertainment | 18 (37.5%) | 30 (62.5%) |
| Health Diagnosing & Treating | 57 (47.5%) | 63 (52.5%) |
| Health Technologists | 57 (50.9%) | 55 (49.1%) |
| Total (Category) | 284 (44.1%) | 360 (55.9%) |
| Total (Overall) | 466 (46.9%) | 528 (53.1%) |
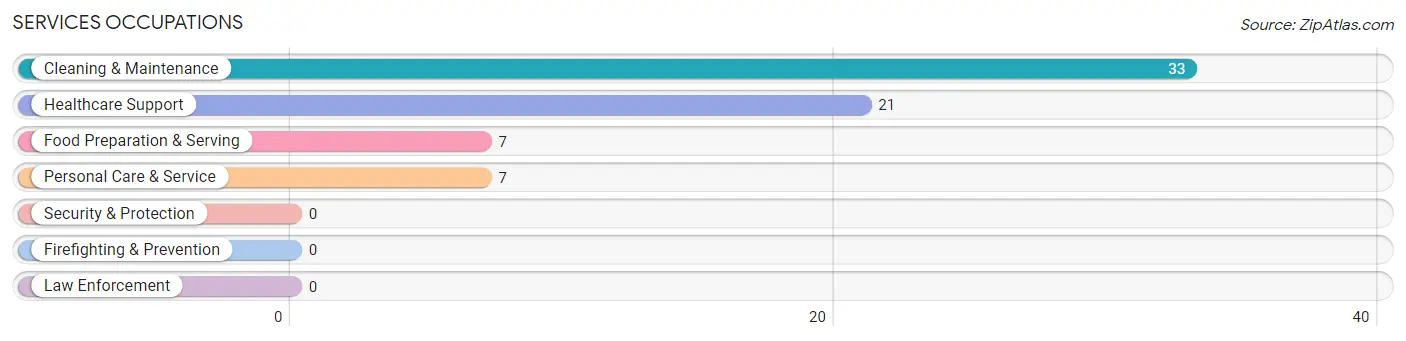
Services Occupations
The most common Services occupations in Isle of Hope are Cleaning & Maintenance (33 | 3.3%), Healthcare Support (21 | 2.1%), Food Preparation & Serving (7 | 0.7%), and Personal Care & Service (7 | 0.7%).
Services Occupations by Sex
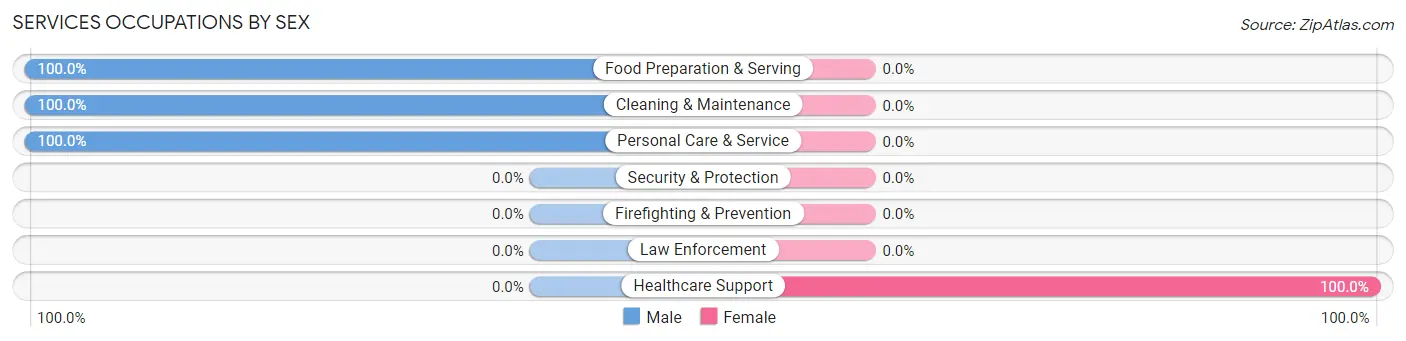
| Occupation | Male | Female |
| Healthcare Support | 0 (0.0%) | 21 (100.0%) |
| Security & Protection | 0 (0.0%) | 0 (0.0%) |
| Firefighting & Prevention | 0 (0.0%) | 0 (0.0%) |
| Law Enforcement | 0 (0.0%) | 0 (0.0%) |
| Food Preparation & Serving | 7 (100.0%) | 0 (0.0%) |
| Cleaning & Maintenance | 33 (100.0%) | 0 (0.0%) |
| Personal Care & Service | 7 (100.0%) | 0 (0.0%) |
| Total (Category) | 47 (69.1%) | 21 (30.9%) |
| Total (Overall) | 466 (46.9%) | 528 (53.1%) |
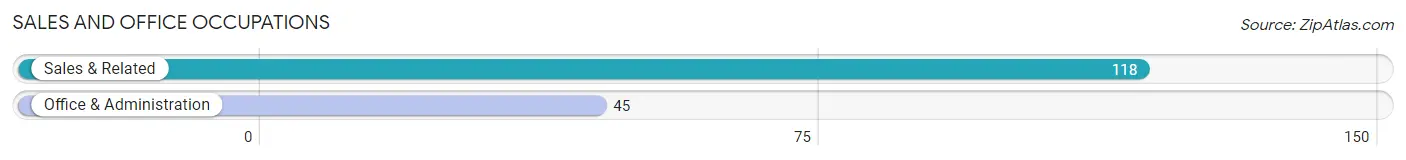
Sales and Office Occupations
The most common Sales and Office occupations in Isle of Hope are Sales & Related (118 | 11.9%), and Office & Administration (45 | 4.5%).
Sales and Office Occupations by Sex
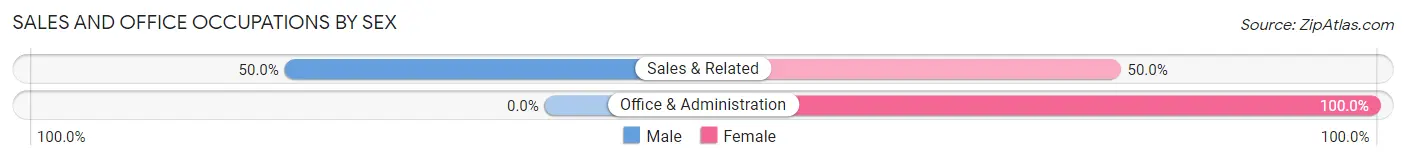
| Occupation | Male | Female |
| Sales & Related | 59 (50.0%) | 59 (50.0%) |
| Office & Administration | 0 (0.0%) | 45 (100.0%) |
| Total (Category) | 59 (36.2%) | 104 (63.8%) |
| Total (Overall) | 466 (46.9%) | 528 (53.1%) |
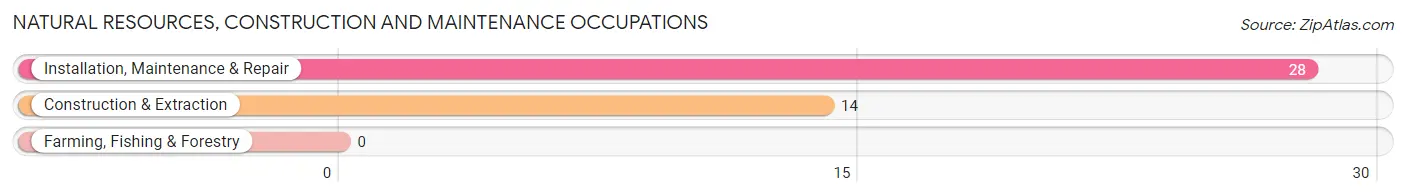
Natural Resources, Construction and Maintenance Occupations
The most common Natural Resources, Construction and Maintenance occupations in Isle of Hope are Installation, Maintenance & Repair (28 | 2.8%), and Construction & Extraction (14 | 1.4%).
Natural Resources, Construction and Maintenance Occupations by Sex
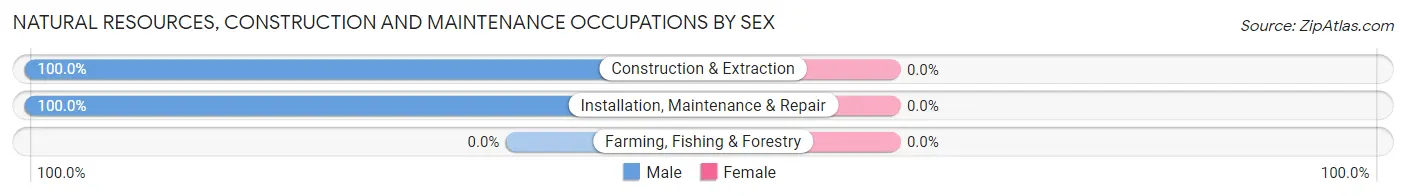
| Occupation | Male | Female |
| Farming, Fishing & Forestry | 0 (0.0%) | 0 (0.0%) |
| Construction & Extraction | 14 (100.0%) | 0 (0.0%) |
| Installation, Maintenance & Repair | 28 (100.0%) | 0 (0.0%) |
| Total (Category) | 42 (100.0%) | 0 (0.0%) |
| Total (Overall) | 466 (46.9%) | 528 (53.1%) |
Production, Transportation and Moving Occupations
The most common Production, Transportation and Moving occupations in Isle of Hope are Transportation (59 | 5.9%), Production (12 | 1.2%), and Material Moving (6 | 0.6%).
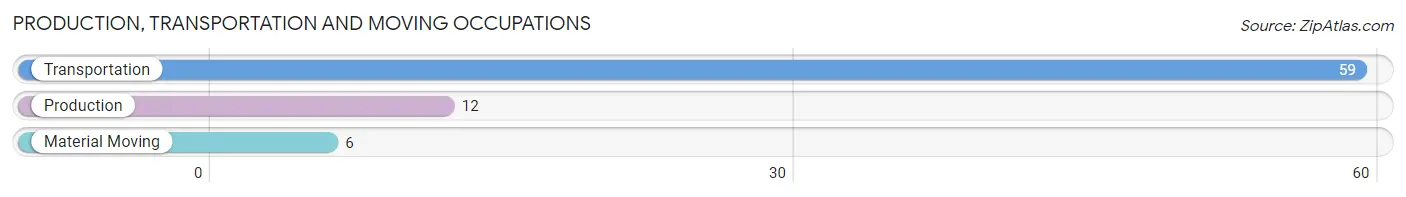
Production, Transportation and Moving Occupations by Sex
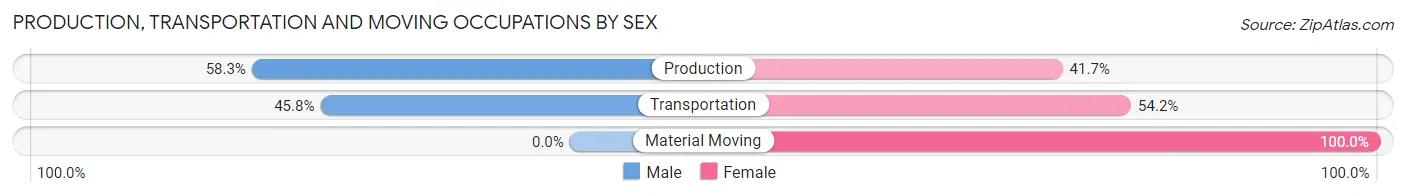
| Occupation | Male | Female |
| Production | 7 (58.3%) | 5 (41.7%) |
| Transportation | 27 (45.8%) | 32 (54.2%) |
| Material Moving | 0 (0.0%) | 6 (100.0%) |
| Total (Category) | 34 (44.2%) | 43 (55.8%) |
| Total (Overall) | 466 (46.9%) | 528 (53.1%) |
Employment Industries by Sex in Isle of Hope
Employment Industries in Isle of Hope
The major employment industries in Isle of Hope include Health Care & Social Assistance (210 | 21.1%), Manufacturing (155 | 15.6%), Educational Services (94 | 9.5%), Retail Trade (82 | 8.3%), and Construction (79 | 8.0%).
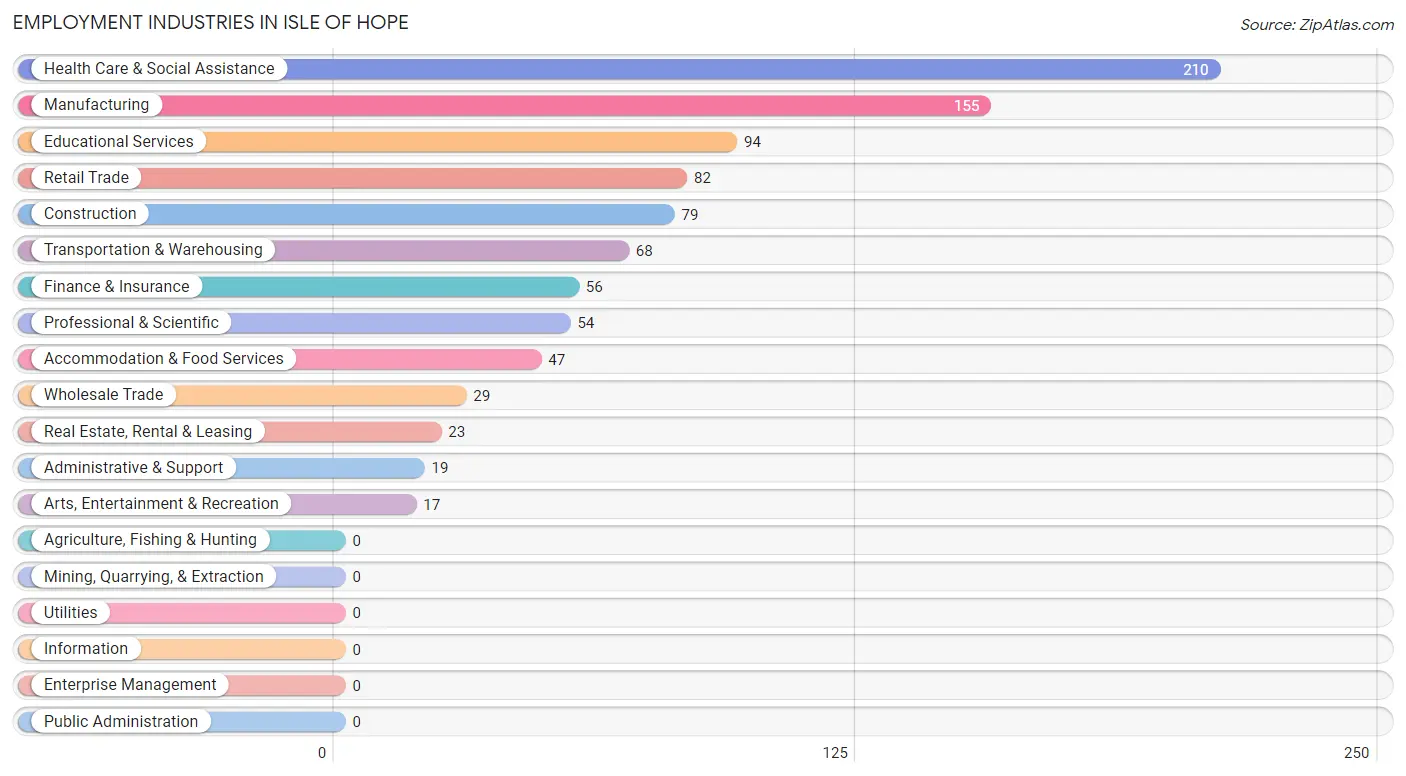
Employment Industries by Sex in Isle of Hope
The Isle of Hope industries that see more men than women are Wholesale Trade (100.0%), Administrative & Support (100.0%), and Construction (91.1%), whereas the industries that tend to have a higher number of women are Real Estate, Rental & Leasing (100.0%), Educational Services (85.1%), and Health Care & Social Assistance (77.1%).
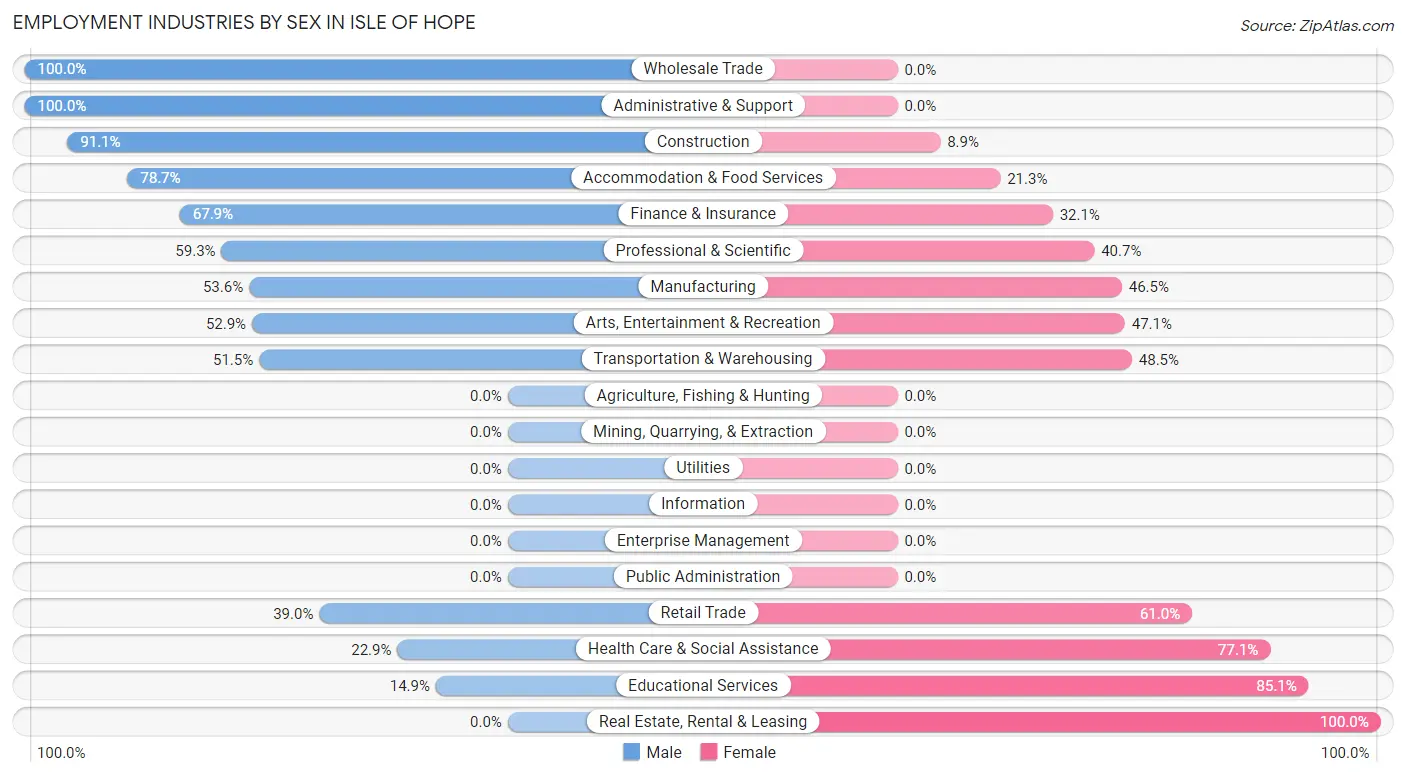
| Industry | Male | Female |
| Agriculture, Fishing & Hunting | 0 (0.0%) | 0 (0.0%) |
| Mining, Quarrying, & Extraction | 0 (0.0%) | 0 (0.0%) |
| Construction | 72 (91.1%) | 7 (8.9%) |
| Manufacturing | 83 (53.5%) | 72 (46.5%) |
| Wholesale Trade | 29 (100.0%) | 0 (0.0%) |
| Retail Trade | 32 (39.0%) | 50 (61.0%) |
| Transportation & Warehousing | 35 (51.5%) | 33 (48.5%) |
| Utilities | 0 (0.0%) | 0 (0.0%) |
| Information | 0 (0.0%) | 0 (0.0%) |
| Finance & Insurance | 38 (67.9%) | 18 (32.1%) |
| Real Estate, Rental & Leasing | 0 (0.0%) | 23 (100.0%) |
| Professional & Scientific | 32 (59.3%) | 22 (40.7%) |
| Enterprise Management | 0 (0.0%) | 0 (0.0%) |
| Administrative & Support | 19 (100.0%) | 0 (0.0%) |
| Educational Services | 14 (14.9%) | 80 (85.1%) |
| Health Care & Social Assistance | 48 (22.9%) | 162 (77.1%) |
| Arts, Entertainment & Recreation | 9 (52.9%) | 8 (47.1%) |
| Accommodation & Food Services | 37 (78.7%) | 10 (21.3%) |
| Public Administration | 0 (0.0%) | 0 (0.0%) |
| Total | 466 (46.9%) | 528 (53.1%) |
Education in Isle of Hope
School Enrollment in Isle of Hope
The most common levels of schooling among the 500 students in Isle of Hope are high school (138 | 27.6%), nursery / preschool (100 | 20.0%), and elementary school (95 | 19.0%).
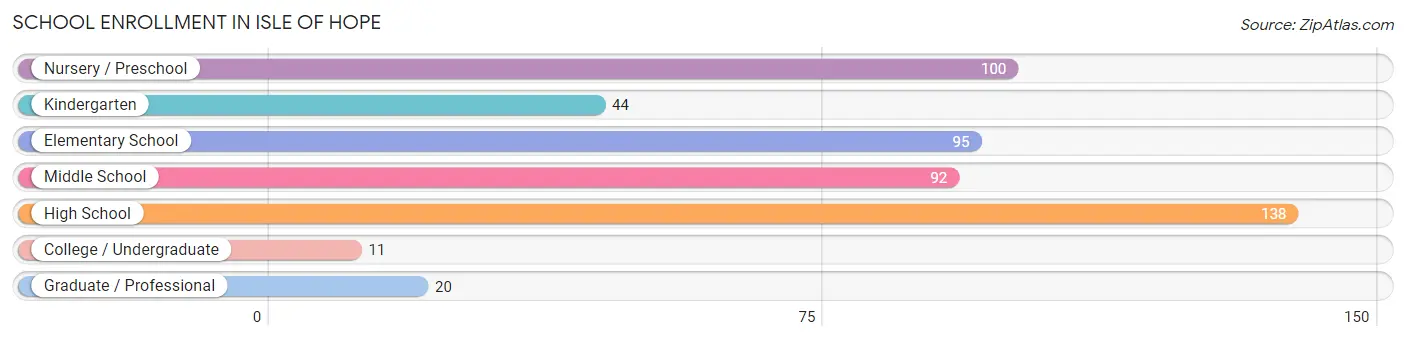
| School Level | # Students | % Students |
| Nursery / Preschool | 100 | 20.0% |
| Kindergarten | 44 | 8.8% |
| Elementary School | 95 | 19.0% |
| Middle School | 92 | 18.4% |
| High School | 138 | 27.6% |
| College / Undergraduate | 11 | 2.2% |
| Graduate / Professional | 20 | 4.0% |
| Total | 500 | 100.0% |
School Enrollment by Age by Funding Source in Isle of Hope
Out of a total of 500 students who are enrolled in schools in Isle of Hope, 340 (68.0%) attend a private institution, while the remaining 160 (32.0%) are enrolled in public schools. The age group of 3 to 4 year olds has the highest likelihood of being enrolled in private schools, with 67 (89.3% in the age bracket) enrolled. Conversely, the age group of 20 to 24 year olds has the lowest likelihood of being enrolled in a private school, with 11 (100.0% in the age bracket) attending a public institution.
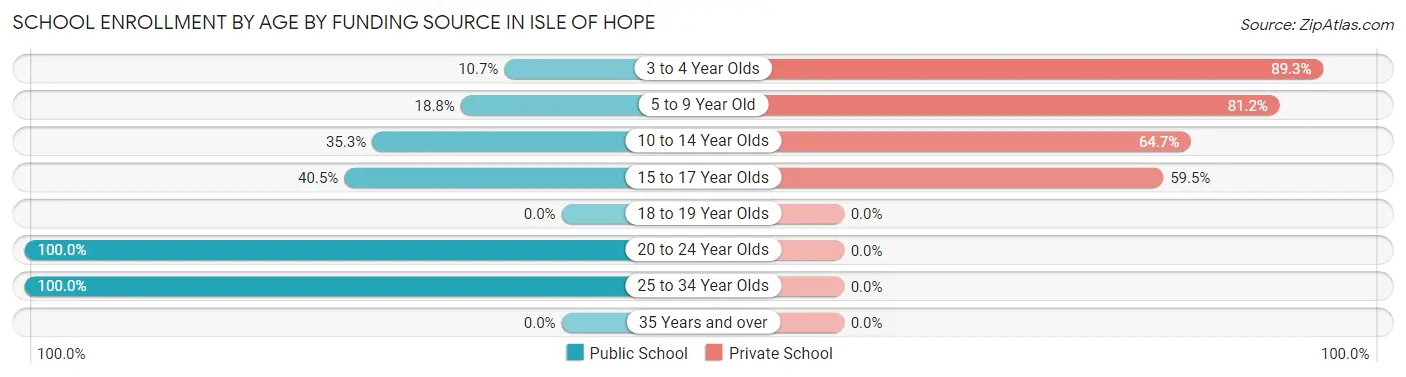
| Age Bracket | Public School | Private School |
| 3 to 4 Year Olds | 8 (10.7%) | 67 (89.3%) |
| 5 to 9 Year Old | 28 (18.8%) | 121 (81.2%) |
| 10 to 14 Year Olds | 42 (35.3%) | 77 (64.7%) |
| 15 to 17 Year Olds | 51 (40.5%) | 75 (59.5%) |
| 18 to 19 Year Olds | 0 (0.0%) | 0 (0.0%) |
| 20 to 24 Year Olds | 11 (100.0%) | 0 (0.0%) |
| 25 to 34 Year Olds | 20 (100.0%) | 0 (0.0%) |
| 35 Years and over | 0 (0.0%) | 0 (0.0%) |
| Total | 160 (32.0%) | 340 (68.0%) |
Educational Attainment by Field of Study in Isle of Hope
Business (180 | 18.8%), education (148 | 15.4%), science & technology (117 | 12.2%), bio, nature & agricultural (86 | 9.0%), and communications (81 | 8.5%) are the most common fields of study among 958 individuals in Isle of Hope who have obtained a bachelor's degree or higher.
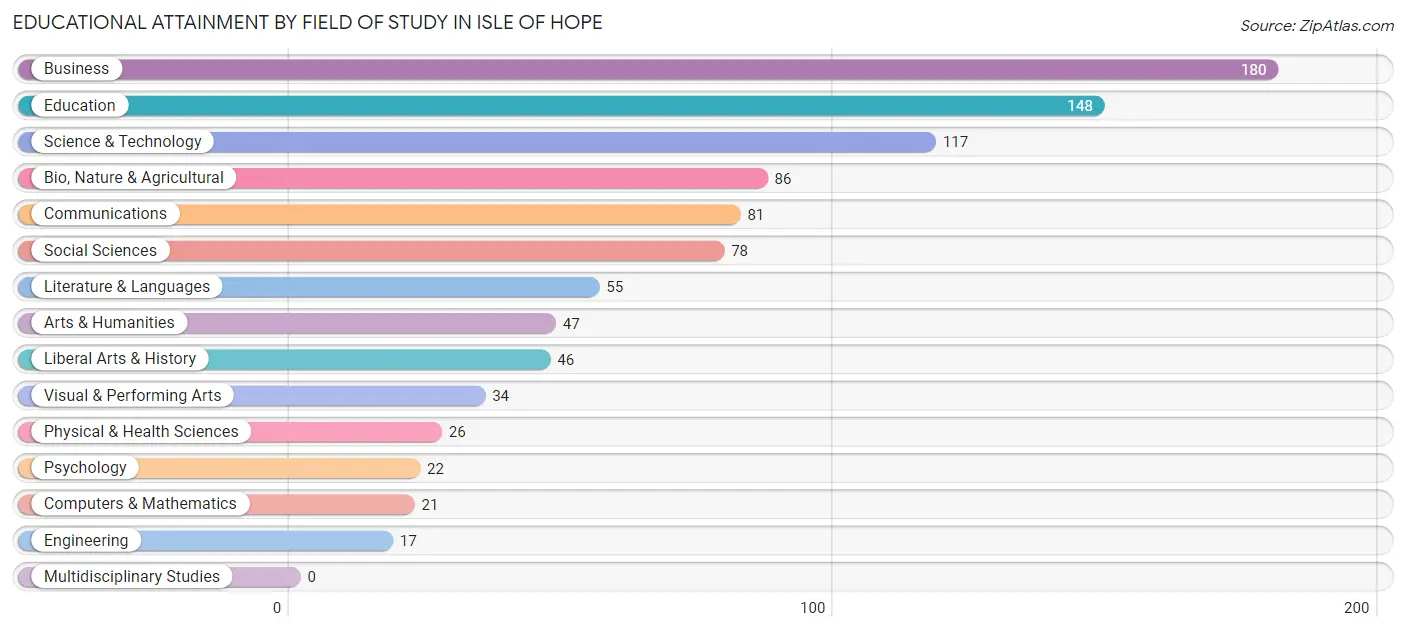
| Field of Study | # Graduates | % Graduates |
| Computers & Mathematics | 21 | 2.2% |
| Bio, Nature & Agricultural | 86 | 9.0% |
| Physical & Health Sciences | 26 | 2.7% |
| Psychology | 22 | 2.3% |
| Social Sciences | 78 | 8.1% |
| Engineering | 17 | 1.8% |
| Multidisciplinary Studies | 0 | 0.0% |
| Science & Technology | 117 | 12.2% |
| Business | 180 | 18.8% |
| Education | 148 | 15.4% |
| Literature & Languages | 55 | 5.7% |
| Liberal Arts & History | 46 | 4.8% |
| Visual & Performing Arts | 34 | 3.5% |
| Communications | 81 | 8.5% |
| Arts & Humanities | 47 | 4.9% |
| Total | 958 | 100.0% |
Transportation & Commute in Isle of Hope
Vehicle Availability by Sex in Isle of Hope
The most prevalent vehicle ownership categories in Isle of Hope are males with 2 vehicles (242, accounting for 51.9%) and females with 2 vehicles (296, making up 45.8%).
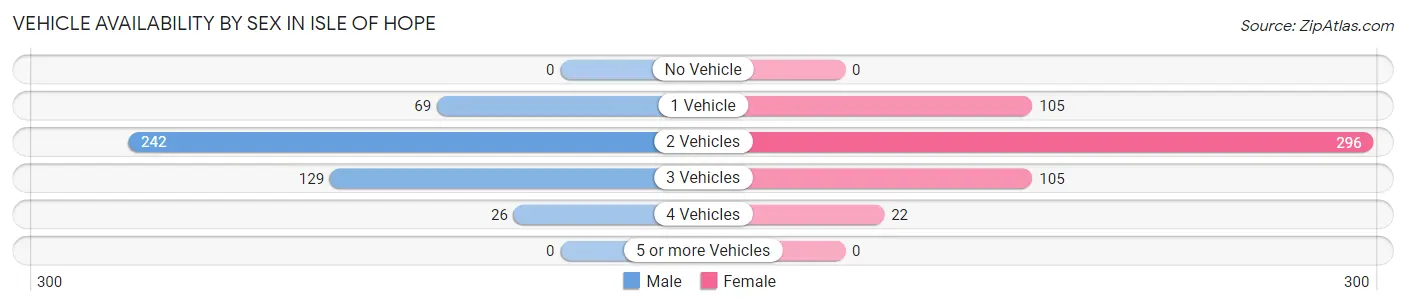
| Vehicles Available | Male | Female |
| No Vehicle | 0 (0.0%) | 0 (0.0%) |
| 1 Vehicle | 69 (14.8%) | 105 (19.9%) |
| 2 Vehicles | 242 (51.9%) | 296 (56.1%) |
| 3 Vehicles | 129 (27.7%) | 105 (19.9%) |
| 4 Vehicles | 26 (5.6%) | 22 (4.2%) |
| 5 or more Vehicles | 0 (0.0%) | 0 (0.0%) |
| Total | 466 (100.0%) | 528 (100.0%) |
Commute Time in Isle of Hope
The most frequently occuring commute durations in Isle of Hope are 10 to 14 minutes (249 commuters, 27.5%), 15 to 19 minutes (222 commuters, 24.5%), and 20 to 24 minutes (151 commuters, 16.7%).

| Commute Time | # Commuters | % Commuters |
| Less than 5 Minutes | 30 | 3.3% |
| 5 to 9 Minutes | 47 | 5.2% |
| 10 to 14 Minutes | 249 | 27.5% |
| 15 to 19 Minutes | 222 | 24.5% |
| 20 to 24 Minutes | 151 | 16.7% |
| 25 to 29 Minutes | 21 | 2.3% |
| 30 to 34 Minutes | 87 | 9.6% |
| 35 to 39 Minutes | 8 | 0.9% |
| 40 to 44 Minutes | 0 | 0.0% |
| 45 to 59 Minutes | 82 | 9.0% |
| 60 to 89 Minutes | 10 | 1.1% |
| 90 or more Minutes | 0 | 0.0% |
Commute Time by Sex in Isle of Hope
The most common commute times in Isle of Hope are 10 to 14 minutes (97 commuters, 22.9%) for males and 10 to 14 minutes (152 commuters, 31.4%) for females.
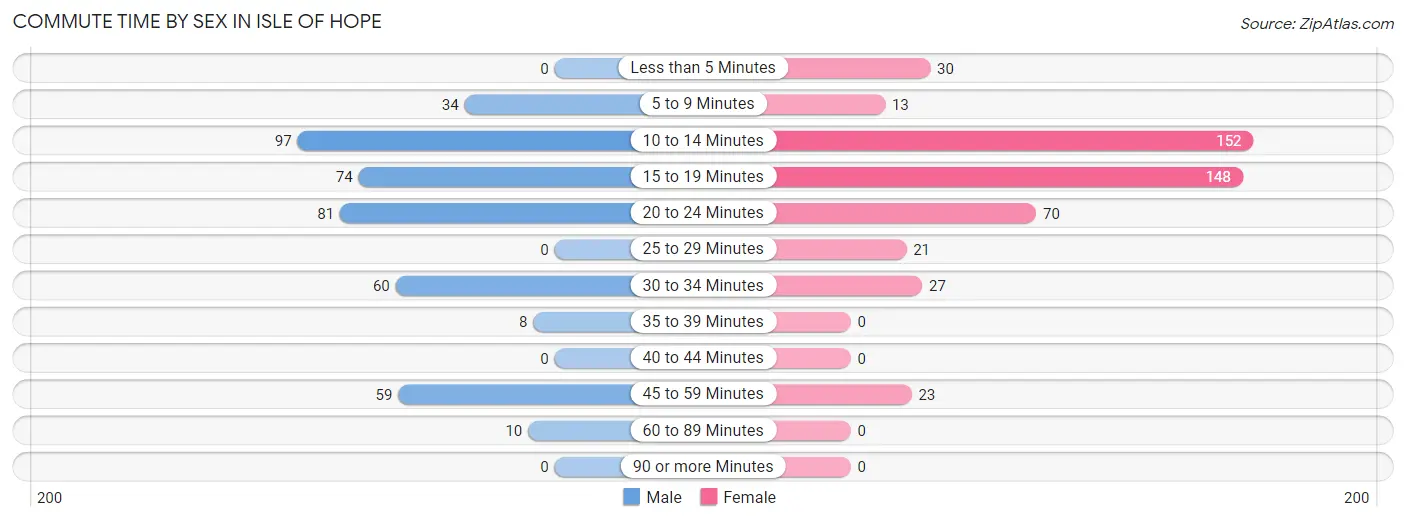
| Commute Time | Male | Female |
| Less than 5 Minutes | 0 (0.0%) | 30 (6.2%) |
| 5 to 9 Minutes | 34 (8.0%) | 13 (2.7%) |
| 10 to 14 Minutes | 97 (22.9%) | 152 (31.4%) |
| 15 to 19 Minutes | 74 (17.5%) | 148 (30.6%) |
| 20 to 24 Minutes | 81 (19.2%) | 70 (14.5%) |
| 25 to 29 Minutes | 0 (0.0%) | 21 (4.3%) |
| 30 to 34 Minutes | 60 (14.2%) | 27 (5.6%) |
| 35 to 39 Minutes | 8 (1.9%) | 0 (0.0%) |
| 40 to 44 Minutes | 0 (0.0%) | 0 (0.0%) |
| 45 to 59 Minutes | 59 (14.0%) | 23 (4.8%) |
| 60 to 89 Minutes | 10 (2.4%) | 0 (0.0%) |
| 90 or more Minutes | 0 (0.0%) | 0 (0.0%) |
Time of Departure to Work by Sex in Isle of Hope
The most frequent times of departure to work in Isle of Hope are 8:00 AM to 8:29 AM (108, 25.5%) for males and 8:00 AM to 8:29 AM (120, 24.8%) for females.
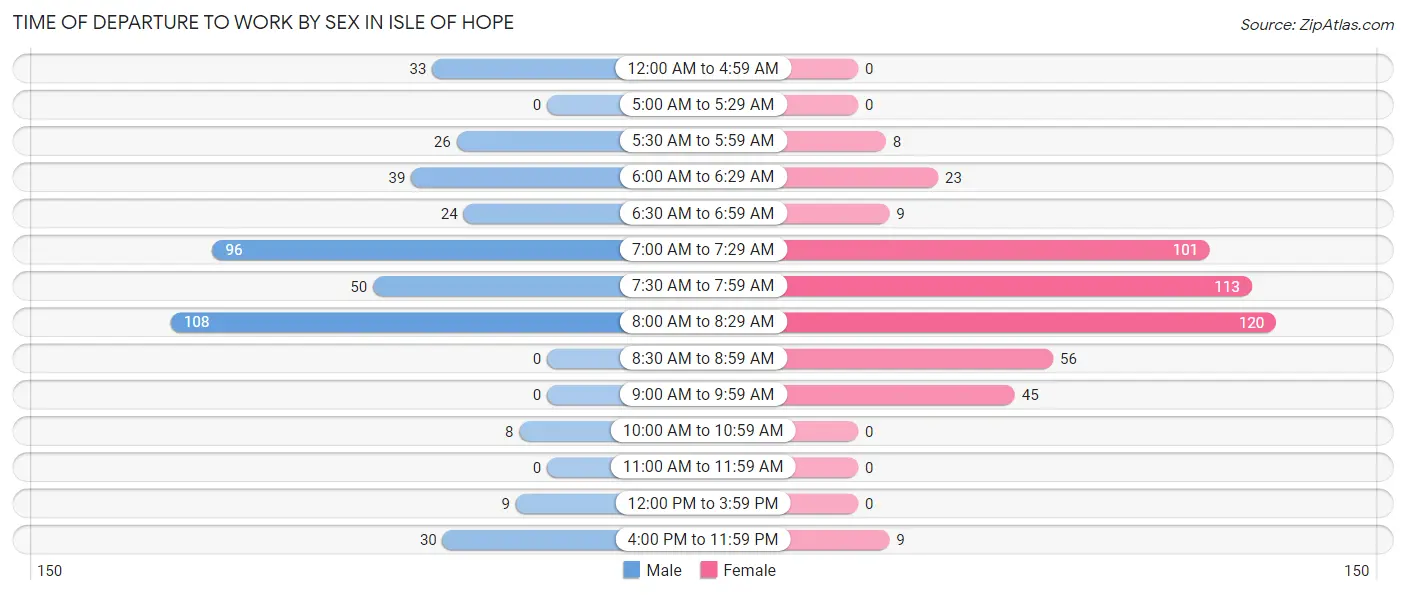
| Time of Departure | Male | Female |
| 12:00 AM to 4:59 AM | 33 (7.8%) | 0 (0.0%) |
| 5:00 AM to 5:29 AM | 0 (0.0%) | 0 (0.0%) |
| 5:30 AM to 5:59 AM | 26 (6.1%) | 8 (1.7%) |
| 6:00 AM to 6:29 AM | 39 (9.2%) | 23 (4.8%) |
| 6:30 AM to 6:59 AM | 24 (5.7%) | 9 (1.9%) |
| 7:00 AM to 7:29 AM | 96 (22.7%) | 101 (20.9%) |
| 7:30 AM to 7:59 AM | 50 (11.8%) | 113 (23.4%) |
| 8:00 AM to 8:29 AM | 108 (25.5%) | 120 (24.8%) |
| 8:30 AM to 8:59 AM | 0 (0.0%) | 56 (11.6%) |
| 9:00 AM to 9:59 AM | 0 (0.0%) | 45 (9.3%) |
| 10:00 AM to 10:59 AM | 8 (1.9%) | 0 (0.0%) |
| 11:00 AM to 11:59 AM | 0 (0.0%) | 0 (0.0%) |
| 12:00 PM to 3:59 PM | 9 (2.1%) | 0 (0.0%) |
| 4:00 PM to 11:59 PM | 30 (7.1%) | 9 (1.9%) |
| Total | 423 (100.0%) | 484 (100.0%) |
Housing Occupancy in Isle of Hope
Occupancy by Ownership in Isle of Hope
Of the total 961 dwellings in Isle of Hope, owner-occupied units account for 931 (96.9%), while renter-occupied units make up 30 (3.1%).
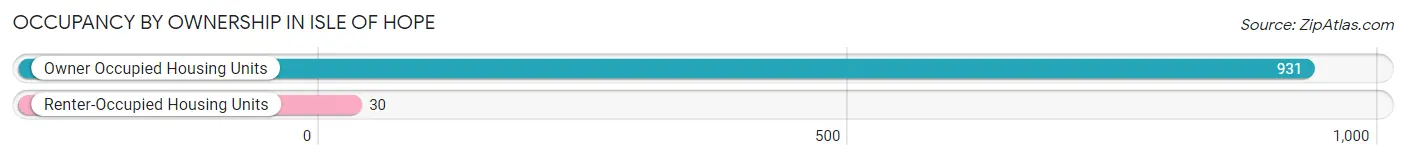
| Occupancy | # Housing Units | % Housing Units |
| Owner Occupied Housing Units | 931 | 96.9% |
| Renter-Occupied Housing Units | 30 | 3.1% |
| Total Occupied Housing Units | 961 | 100.0% |
Occupancy by Household Size in Isle of Hope
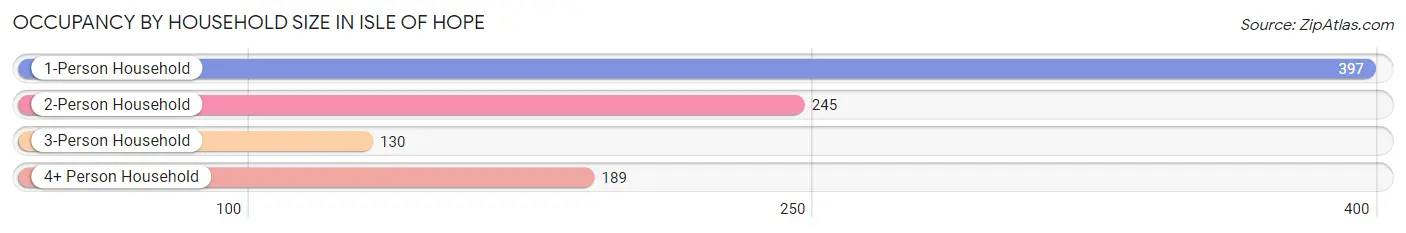
| Household Size | # Housing Units | % Housing Units |
| 1-Person Household | 397 | 41.3% |
| 2-Person Household | 245 | 25.5% |
| 3-Person Household | 130 | 13.5% |
| 4+ Person Household | 189 | 19.7% |
| Total Housing Units | 961 | 100.0% |
Occupancy by Ownership by Household Size in Isle of Hope
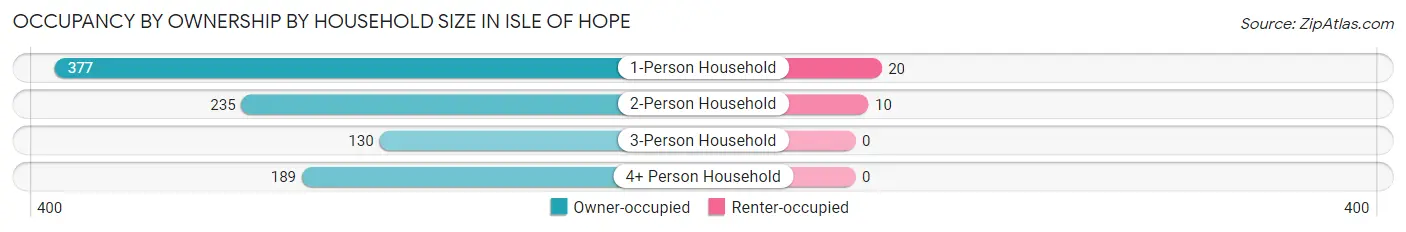
| Household Size | Owner-occupied | Renter-occupied |
| 1-Person Household | 377 (95.0%) | 20 (5.0%) |
| 2-Person Household | 235 (95.9%) | 10 (4.1%) |
| 3-Person Household | 130 (100.0%) | 0 (0.0%) |
| 4+ Person Household | 189 (100.0%) | 0 (0.0%) |
| Total Housing Units | 931 (96.9%) | 30 (3.1%) |
Occupancy by Educational Attainment in Isle of Hope
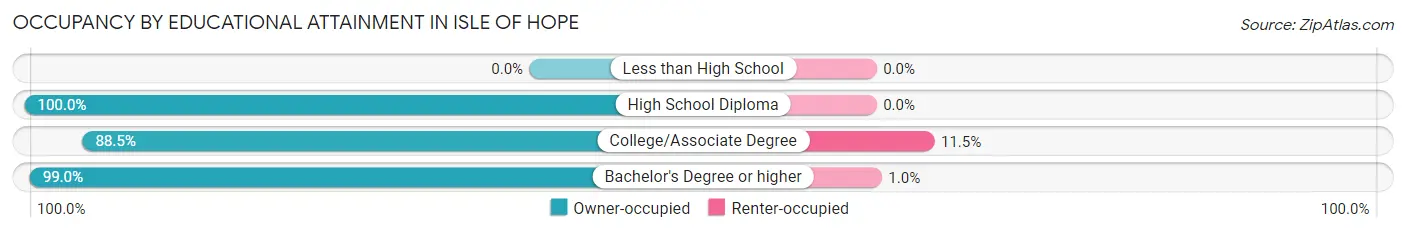
| Household Size | Owner-occupied | Renter-occupied |
| Less than High School | 0 (0.0%) | 0 (0.0%) |
| High School Diploma | 176 (100.0%) | 0 (0.0%) |
| College/Associate Degree | 185 (88.5%) | 24 (11.5%) |
| Bachelor's Degree or higher | 570 (99.0%) | 6 (1.0%) |
Occupancy by Age of Householder in Isle of Hope
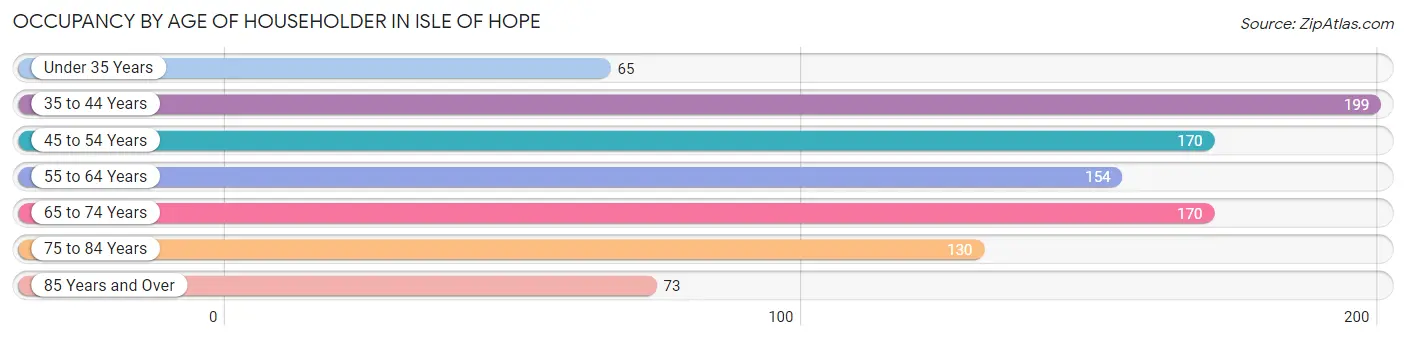
| Age Bracket | # Households | % Households |
| Under 35 Years | 65 | 6.8% |
| 35 to 44 Years | 199 | 20.7% |
| 45 to 54 Years | 170 | 17.7% |
| 55 to 64 Years | 154 | 16.0% |
| 65 to 74 Years | 170 | 17.7% |
| 75 to 84 Years | 130 | 13.5% |
| 85 Years and Over | 73 | 7.6% |
| Total | 961 | 100.0% |
Housing Finances in Isle of Hope
Median Income by Occupancy in Isle of Hope
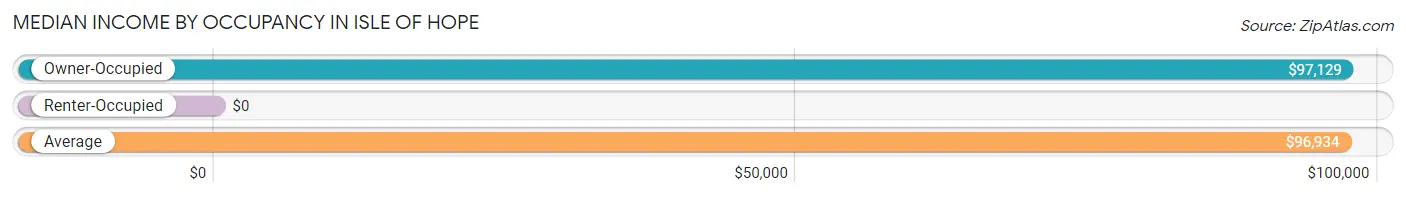
| Occupancy Type | # Households | Median Income |
| Owner-Occupied | 931 (96.9%) | $97,129 |
| Renter-Occupied | 30 (3.1%) | $0 |
| Average | 961 (100.0%) | $96,934 |
Occupancy by Householder Income Bracket in Isle of Hope
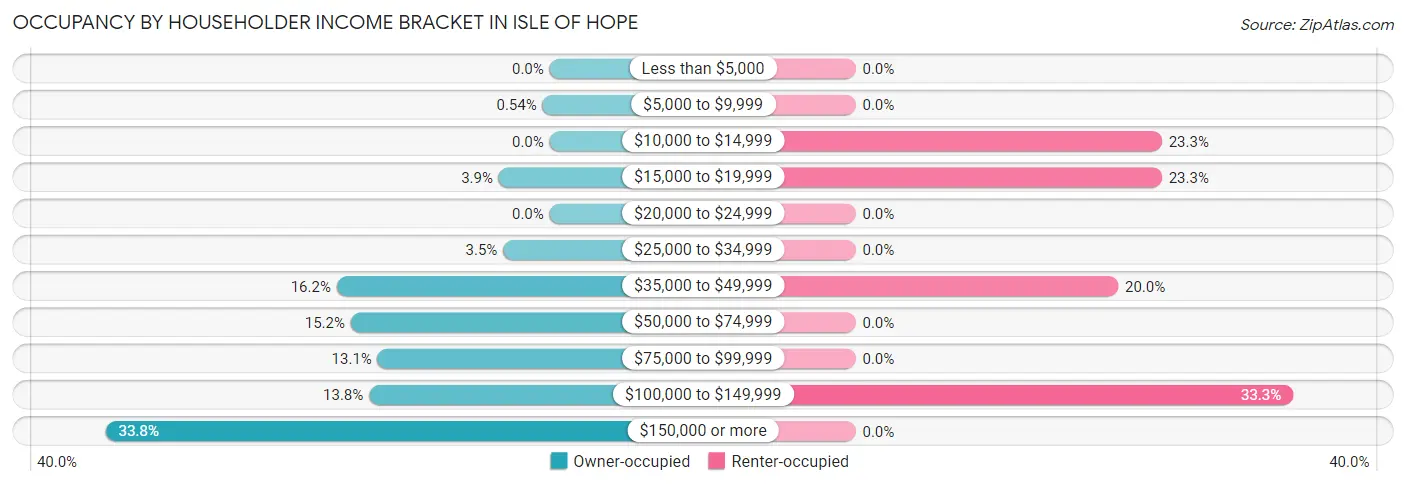
| Income Bracket | Owner-occupied | Renter-occupied |
| Less than $5,000 | 0 (0.0%) | 0 (0.0%) |
| $5,000 to $9,999 | 5 (0.5%) | 0 (0.0%) |
| $10,000 to $14,999 | 0 (0.0%) | 7 (23.3%) |
| $15,000 to $19,999 | 36 (3.9%) | 7 (23.3%) |
| $20,000 to $24,999 | 0 (0.0%) | 0 (0.0%) |
| $25,000 to $34,999 | 33 (3.5%) | 0 (0.0%) |
| $35,000 to $49,999 | 151 (16.2%) | 6 (20.0%) |
| $50,000 to $74,999 | 141 (15.1%) | 0 (0.0%) |
| $75,000 to $99,999 | 122 (13.1%) | 0 (0.0%) |
| $100,000 to $149,999 | 128 (13.8%) | 10 (33.3%) |
| $150,000 or more | 315 (33.8%) | 0 (0.0%) |
| Total | 931 (100.0%) | 30 (100.0%) |
Monthly Housing Cost Tiers in Isle of Hope
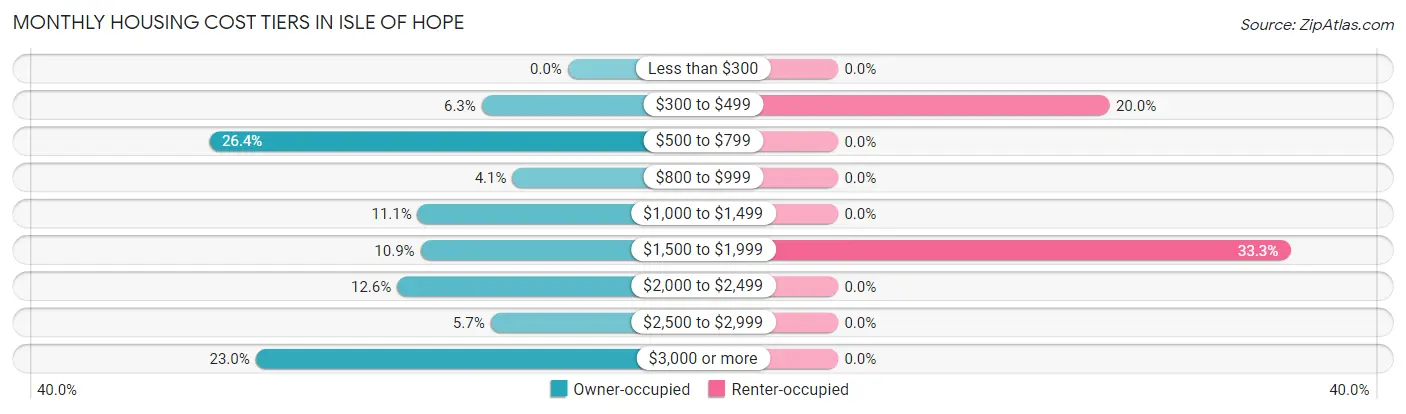
| Monthly Cost | Owner-occupied | Renter-occupied |
| Less than $300 | 0 (0.0%) | 0 (0.0%) |
| $300 to $499 | 59 (6.3%) | 6 (20.0%) |
| $500 to $799 | 246 (26.4%) | 0 (0.0%) |
| $800 to $999 | 38 (4.1%) | 0 (0.0%) |
| $1,000 to $1,499 | 103 (11.1%) | 0 (0.0%) |
| $1,500 to $1,999 | 101 (10.8%) | 10 (33.3%) |
| $2,000 to $2,499 | 117 (12.6%) | 0 (0.0%) |
| $2,500 to $2,999 | 53 (5.7%) | 0 (0.0%) |
| $3,000 or more | 214 (23.0%) | 0 (0.0%) |
| Total | 931 (100.0%) | 30 (100.0%) |
Physical Housing Characteristics in Isle of Hope
Housing Structures in Isle of Hope
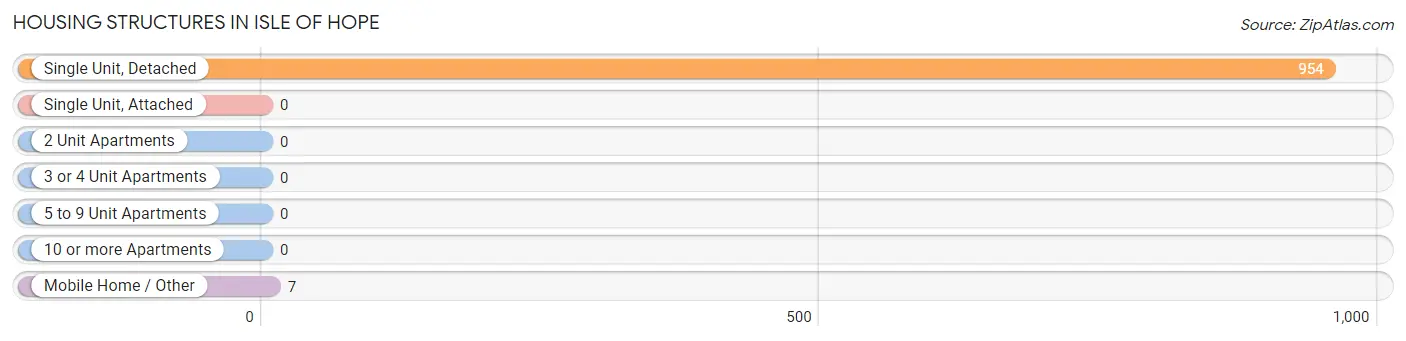
| Structure Type | # Housing Units | % Housing Units |
| Single Unit, Detached | 954 | 99.3% |
| Single Unit, Attached | 0 | 0.0% |
| 2 Unit Apartments | 0 | 0.0% |
| 3 or 4 Unit Apartments | 0 | 0.0% |
| 5 to 9 Unit Apartments | 0 | 0.0% |
| 10 or more Apartments | 0 | 0.0% |
| Mobile Home / Other | 7 | 0.7% |
| Total | 961 | 100.0% |
Housing Structures by Occupancy in Isle of Hope
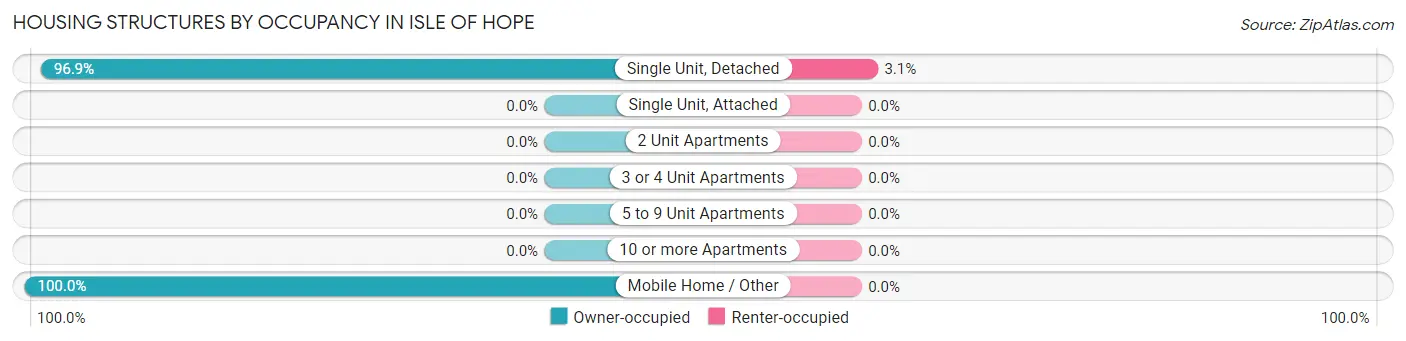
| Structure Type | Owner-occupied | Renter-occupied |
| Single Unit, Detached | 924 (96.9%) | 30 (3.1%) |
| Single Unit, Attached | 0 (0.0%) | 0 (0.0%) |
| 2 Unit Apartments | 0 (0.0%) | 0 (0.0%) |
| 3 or 4 Unit Apartments | 0 (0.0%) | 0 (0.0%) |
| 5 to 9 Unit Apartments | 0 (0.0%) | 0 (0.0%) |
| 10 or more Apartments | 0 (0.0%) | 0 (0.0%) |
| Mobile Home / Other | 7 (100.0%) | 0 (0.0%) |
| Total | 931 (96.9%) | 30 (3.1%) |
Housing Structures by Number of Rooms in Isle of Hope
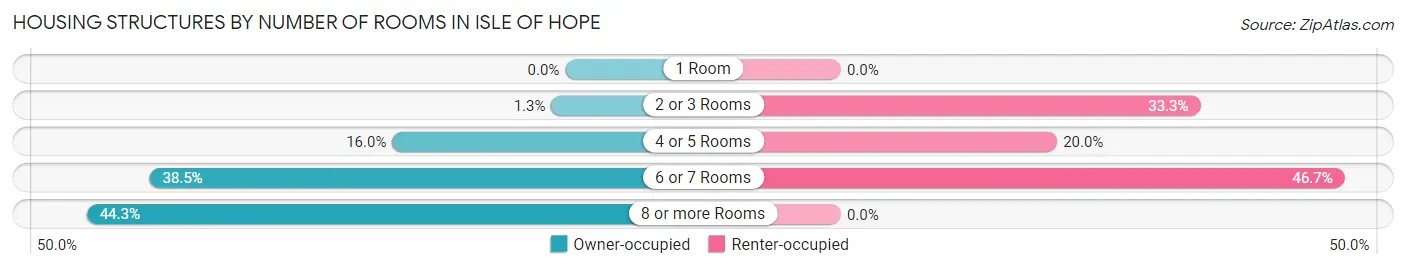
| Number of Rooms | Owner-occupied | Renter-occupied |
| 1 Room | 0 (0.0%) | 0 (0.0%) |
| 2 or 3 Rooms | 12 (1.3%) | 10 (33.3%) |
| 4 or 5 Rooms | 149 (16.0%) | 6 (20.0%) |
| 6 or 7 Rooms | 358 (38.5%) | 14 (46.7%) |
| 8 or more Rooms | 412 (44.3%) | 0 (0.0%) |
| Total | 931 (100.0%) | 30 (100.0%) |
Housing Structure by Heating Type in Isle of Hope
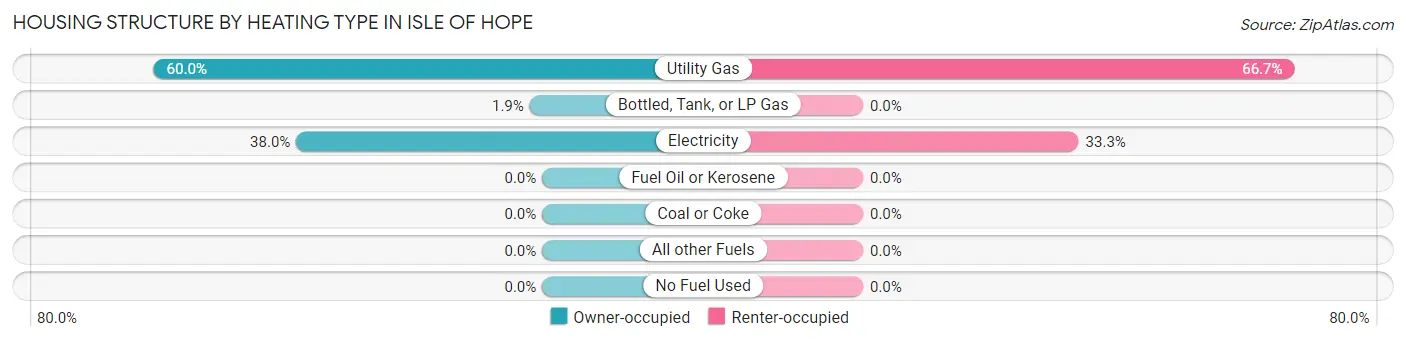
| Heating Type | Owner-occupied | Renter-occupied |
| Utility Gas | 559 (60.0%) | 20 (66.7%) |
| Bottled, Tank, or LP Gas | 18 (1.9%) | 0 (0.0%) |
| Electricity | 354 (38.0%) | 10 (33.3%) |
| Fuel Oil or Kerosene | 0 (0.0%) | 0 (0.0%) |
| Coal or Coke | 0 (0.0%) | 0 (0.0%) |
| All other Fuels | 0 (0.0%) | 0 (0.0%) |
| No Fuel Used | 0 (0.0%) | 0 (0.0%) |
| Total | 931 (100.0%) | 30 (100.0%) |
Household Vehicle Usage in Isle of Hope
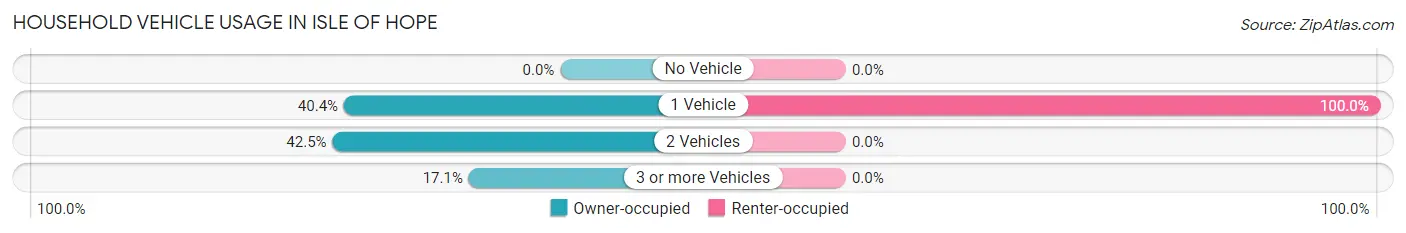
| Vehicles per Household | Owner-occupied | Renter-occupied |
| No Vehicle | 0 (0.0%) | 0 (0.0%) |
| 1 Vehicle | 376 (40.4%) | 30 (100.0%) |
| 2 Vehicles | 396 (42.5%) | 0 (0.0%) |
| 3 or more Vehicles | 159 (17.1%) | 0 (0.0%) |
| Total | 931 (100.0%) | 30 (100.0%) |
Real Estate & Mortgages in Isle of Hope
Real Estate and Mortgage Overview in Isle of Hope
| Characteristic | Without Mortgage | With Mortgage |
| Housing Units | 439 | 492 |
| Median Property Value | $381,600 | $462,200 |
| Median Household Income | $59,844 | $254 |
| Monthly Housing Costs | $664 | $206 |
| Real Estate Taxes | $3,118 | $0 |
Property Value by Mortgage Status in Isle of Hope
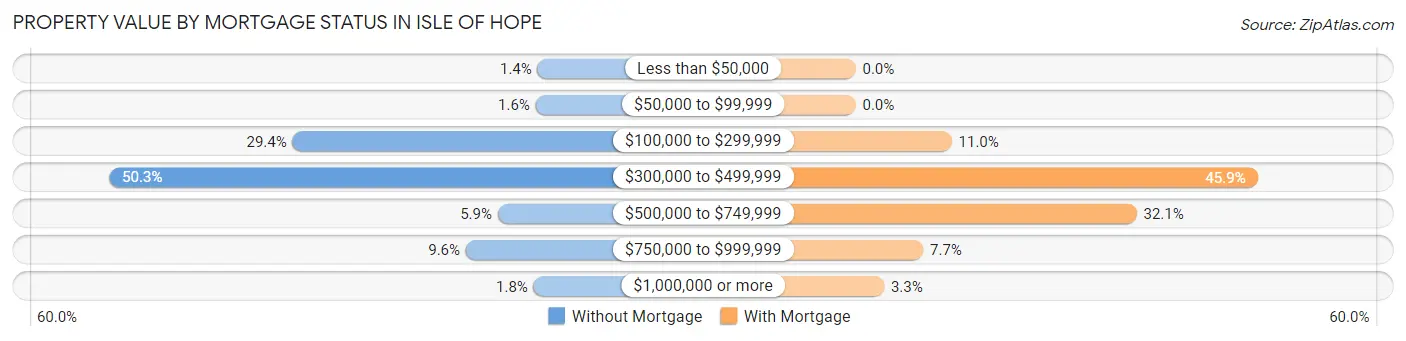
| Property Value | Without Mortgage | With Mortgage |
| Less than $50,000 | 6 (1.4%) | 0 (0.0%) |
| $50,000 to $99,999 | 7 (1.6%) | 0 (0.0%) |
| $100,000 to $299,999 | 129 (29.4%) | 54 (11.0%) |
| $300,000 to $499,999 | 221 (50.3%) | 226 (45.9%) |
| $500,000 to $749,999 | 26 (5.9%) | 158 (32.1%) |
| $750,000 to $999,999 | 42 (9.6%) | 38 (7.7%) |
| $1,000,000 or more | 8 (1.8%) | 16 (3.3%) |
| Total | 439 (100.0%) | 492 (100.0%) |
Household Income by Mortgage Status in Isle of Hope
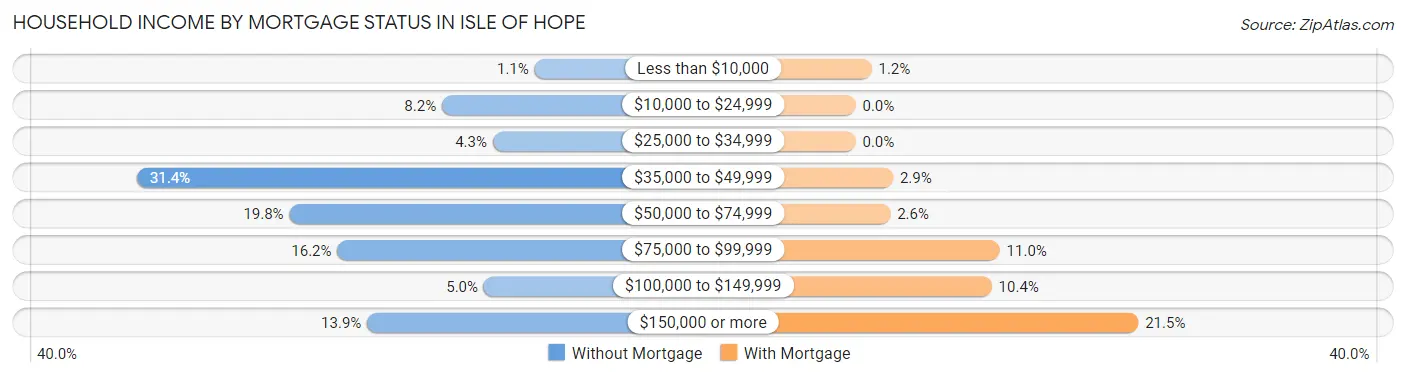
| Household Income | Without Mortgage | With Mortgage |
| Less than $10,000 | 5 (1.1%) | 6 (1.2%) |
| $10,000 to $24,999 | 36 (8.2%) | 0 (0.0%) |
| $25,000 to $34,999 | 19 (4.3%) | 0 (0.0%) |
| $35,000 to $49,999 | 138 (31.4%) | 14 (2.9%) |
| $50,000 to $74,999 | 87 (19.8%) | 13 (2.6%) |
| $75,000 to $99,999 | 71 (16.2%) | 54 (11.0%) |
| $100,000 to $149,999 | 22 (5.0%) | 51 (10.4%) |
| $150,000 or more | 61 (13.9%) | 106 (21.5%) |
| Total | 439 (100.0%) | 492 (100.0%) |
Property Value to Household Income Ratio in Isle of Hope
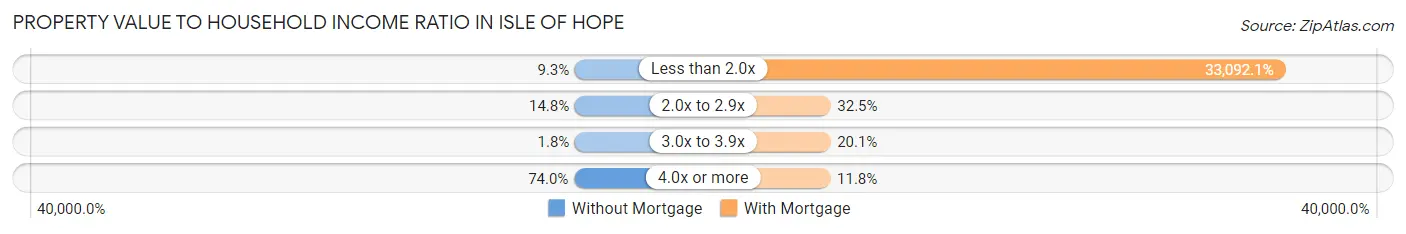
| Value-to-Income Ratio | Without Mortgage | With Mortgage |
| Less than 2.0x | 41 (9.3%) | 162,813 (33,092.1%) |
| 2.0x to 2.9x | 65 (14.8%) | 160 (32.5%) |
| 3.0x to 3.9x | 8 (1.8%) | 99 (20.1%) |
| 4.0x or more | 325 (74.0%) | 58 (11.8%) |
| Total | 439 (100.0%) | 492 (100.0%) |
Real Estate Taxes by Mortgage Status in Isle of Hope
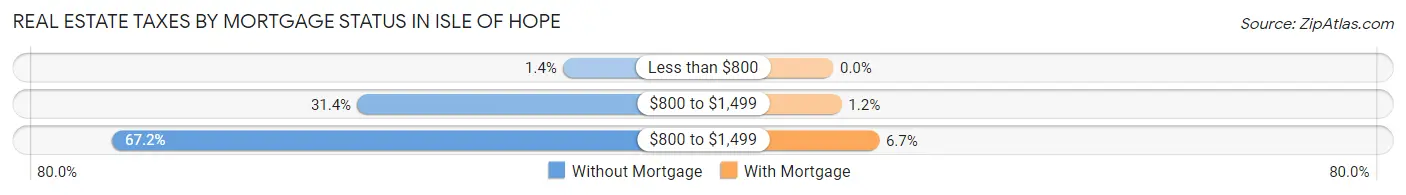
| Property Taxes | Without Mortgage | With Mortgage |
| Less than $800 | 6 (1.4%) | 0 (0.0%) |
| $800 to $1,499 | 138 (31.4%) | 6 (1.2%) |
| $800 to $1,499 | 295 (67.2%) | 33 (6.7%) |
| Total | 439 (100.0%) | 492 (100.0%) |
Health & Disability in Isle of Hope
Health Insurance Coverage by Age in Isle of Hope
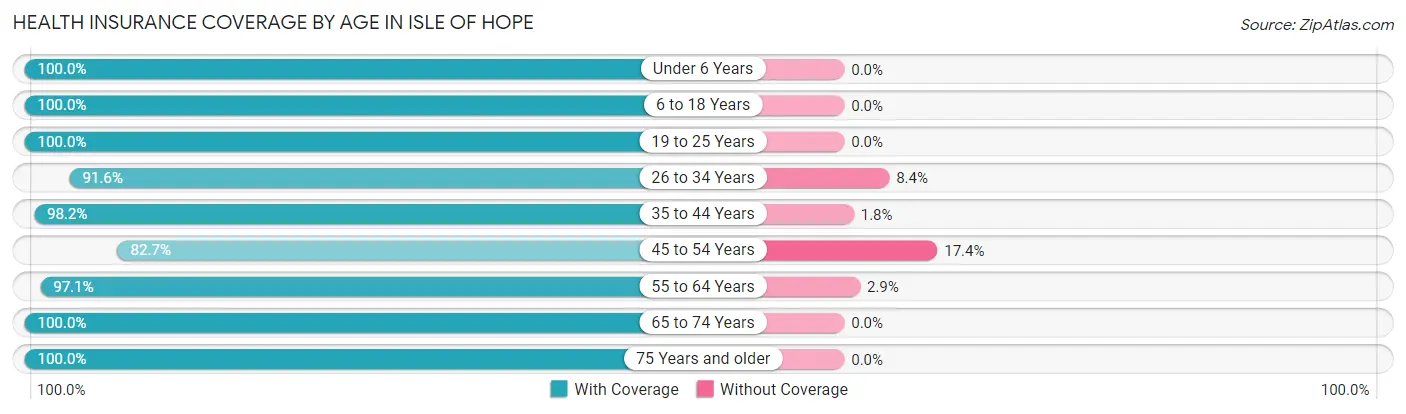
| Age Bracket | With Coverage | Without Coverage |
| Under 6 Years | 196 (100.0%) | 0 (0.0%) |
| 6 to 18 Years | 352 (100.0%) | 0 (0.0%) |
| 19 to 25 Years | 40 (100.0%) | 0 (0.0%) |
| 26 to 34 Years | 164 (91.6%) | 15 (8.4%) |
| 35 to 44 Years | 333 (98.2%) | 6 (1.8%) |
| 45 to 54 Years | 243 (82.7%) | 51 (17.3%) |
| 55 to 64 Years | 232 (97.1%) | 7 (2.9%) |
| 65 to 74 Years | 260 (100.0%) | 0 (0.0%) |
| 75 Years and older | 238 (100.0%) | 0 (0.0%) |
| Total | 2,058 (96.3%) | 79 (3.7%) |
Health Insurance Coverage by Citizenship Status in Isle of Hope
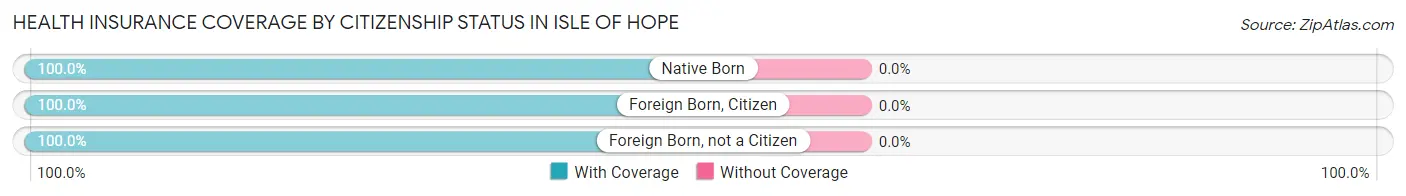
| Citizenship Status | With Coverage | Without Coverage |
| Native Born | 196 (100.0%) | 0 (0.0%) |
| Foreign Born, Citizen | 352 (100.0%) | 0 (0.0%) |
| Foreign Born, not a Citizen | 40 (100.0%) | 0 (0.0%) |
Health Insurance Coverage by Household Income in Isle of Hope
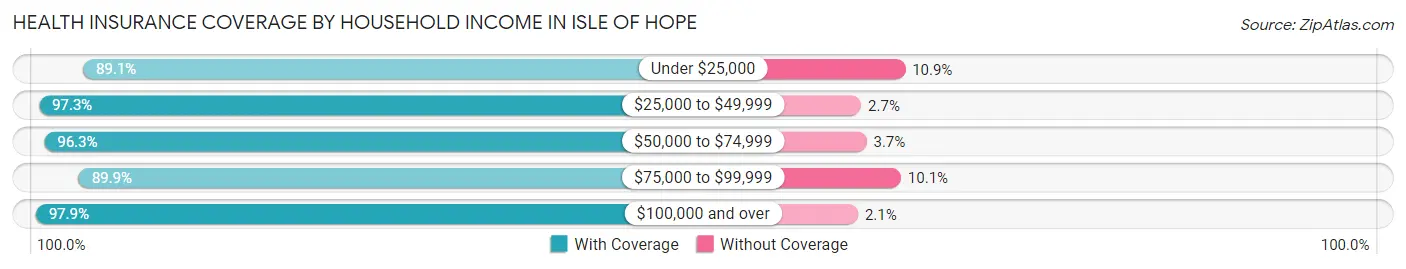
| Household Income | With Coverage | Without Coverage |
| Under $25,000 | 57 (89.1%) | 7 (10.9%) |
| $25,000 to $49,999 | 217 (97.3%) | 6 (2.7%) |
| $50,000 to $74,999 | 260 (96.3%) | 10 (3.7%) |
| $75,000 to $99,999 | 257 (89.9%) | 29 (10.1%) |
| $100,000 and over | 1,267 (97.9%) | 27 (2.1%) |
Public vs Private Health Insurance Coverage by Age in Isle of Hope
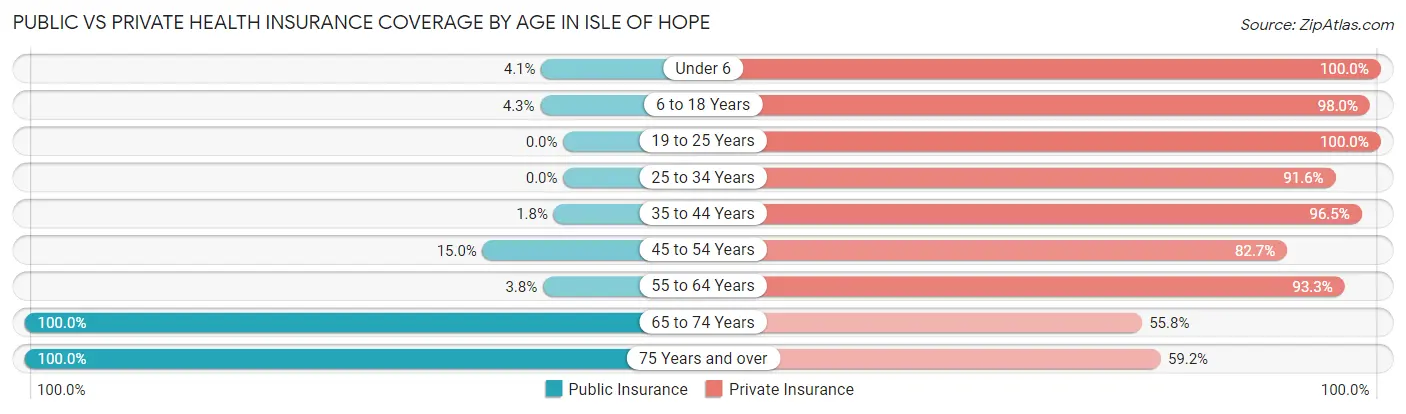
| Age Bracket | Public Insurance | Private Insurance |
| Under 6 | 8 (4.1%) | 196 (100.0%) |
| 6 to 18 Years | 15 (4.3%) | 345 (98.0%) |
| 19 to 25 Years | 0 (0.0%) | 40 (100.0%) |
| 25 to 34 Years | 0 (0.0%) | 164 (91.6%) |
| 35 to 44 Years | 6 (1.8%) | 327 (96.5%) |
| 45 to 54 Years | 44 (15.0%) | 243 (82.7%) |
| 55 to 64 Years | 9 (3.8%) | 223 (93.3%) |
| 65 to 74 Years | 260 (100.0%) | 145 (55.8%) |
| 75 Years and over | 238 (100.0%) | 141 (59.2%) |
| Total | 580 (27.1%) | 1,824 (85.4%) |
Disability Status by Sex by Age in Isle of Hope
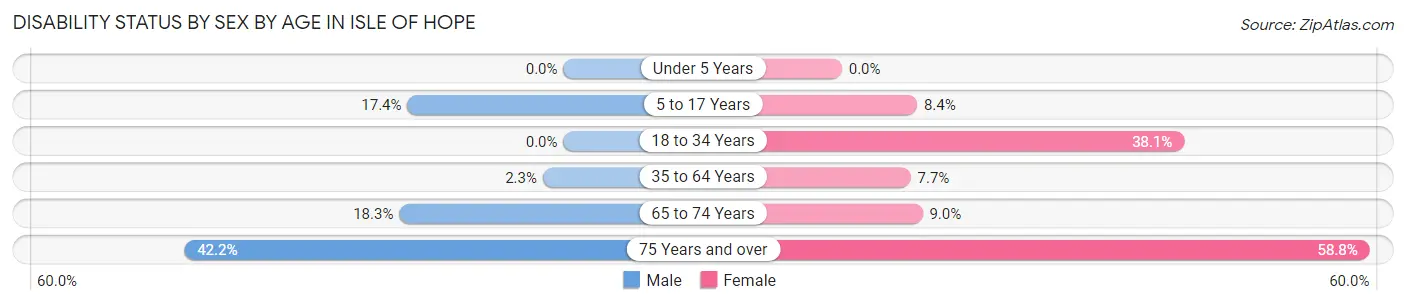
| Age Bracket | Male | Female |
| Under 5 Years | 0 (0.0%) | 0 (0.0%) |
| 5 to 17 Years | 29 (17.4%) | 19 (8.4%) |
| 18 to 34 Years | 0 (0.0%) | 53 (38.1%) |
| 35 to 64 Years | 8 (2.3%) | 40 (7.7%) |
| 65 to 74 Years | 17 (18.3%) | 15 (9.0%) |
| 75 Years and over | 38 (42.2%) | 87 (58.8%) |
Disability Class by Sex by Age in Isle of Hope
Disability Class: Hearing Difficulty
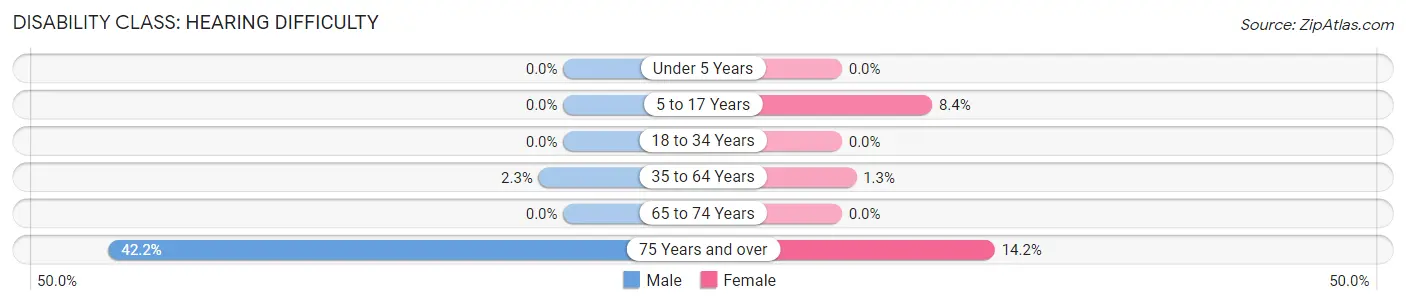
| Age Bracket | Male | Female |
| Under 5 Years | 0 (0.0%) | 0 (0.0%) |
| 5 to 17 Years | 0 (0.0%) | 19 (8.4%) |
| 18 to 34 Years | 0 (0.0%) | 0 (0.0%) |
| 35 to 64 Years | 8 (2.3%) | 7 (1.3%) |
| 65 to 74 Years | 0 (0.0%) | 0 (0.0%) |
| 75 Years and over | 38 (42.2%) | 21 (14.2%) |
Disability Class: Vision Difficulty
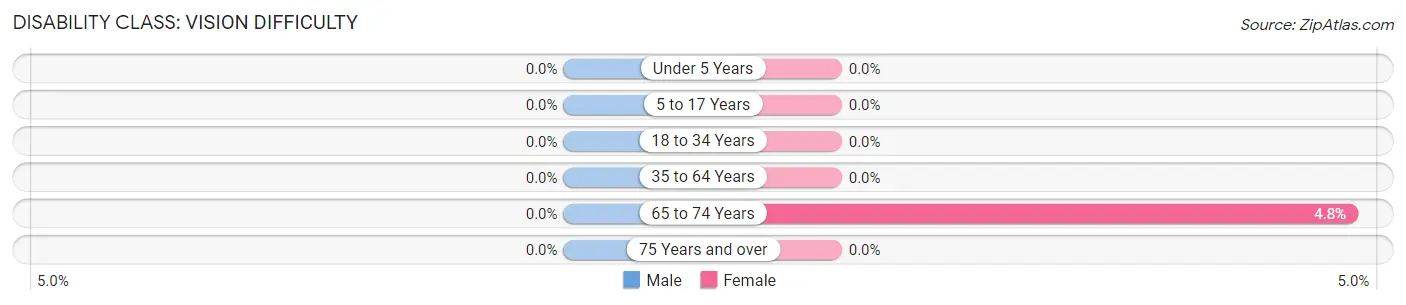
| Age Bracket | Male | Female |
| Under 5 Years | 0 (0.0%) | 0 (0.0%) |
| 5 to 17 Years | 0 (0.0%) | 0 (0.0%) |
| 18 to 34 Years | 0 (0.0%) | 0 (0.0%) |
| 35 to 64 Years | 0 (0.0%) | 0 (0.0%) |
| 65 to 74 Years | 0 (0.0%) | 8 (4.8%) |
| 75 Years and over | 0 (0.0%) | 0 (0.0%) |
Disability Class: Cognitive Difficulty
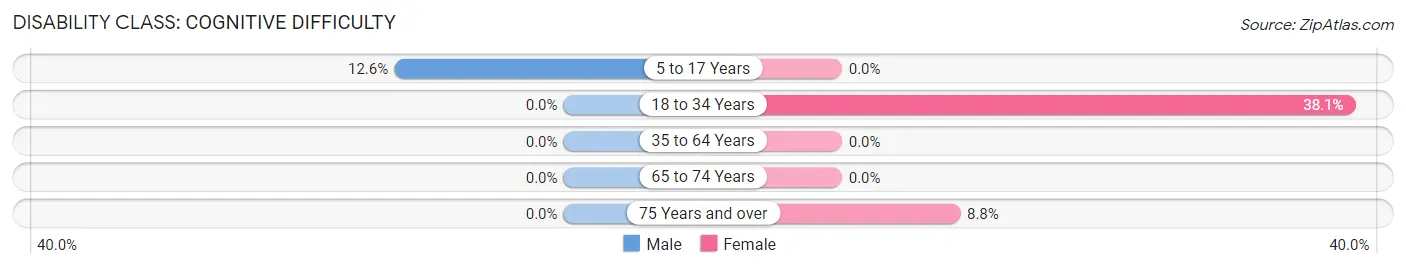
| Age Bracket | Male | Female |
| 5 to 17 Years | 21 (12.6%) | 0 (0.0%) |
| 18 to 34 Years | 0 (0.0%) | 53 (38.1%) |
| 35 to 64 Years | 0 (0.0%) | 0 (0.0%) |
| 65 to 74 Years | 0 (0.0%) | 0 (0.0%) |
| 75 Years and over | 0 (0.0%) | 13 (8.8%) |
Disability Class: Ambulatory Difficulty
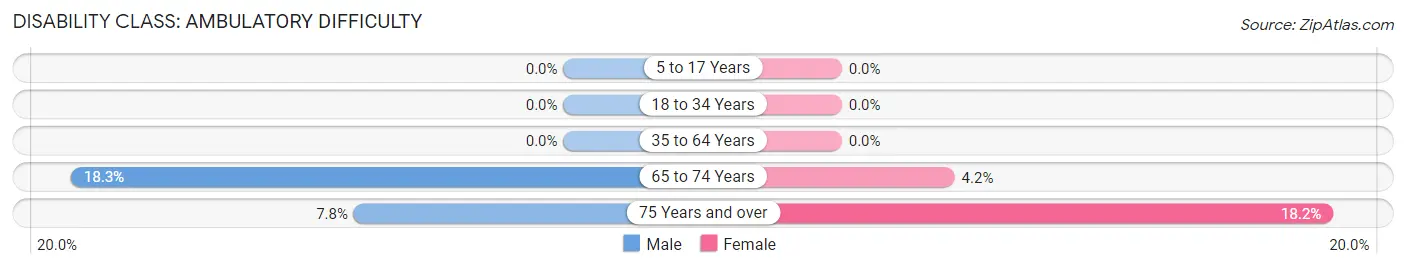
| Age Bracket | Male | Female |
| 5 to 17 Years | 0 (0.0%) | 0 (0.0%) |
| 18 to 34 Years | 0 (0.0%) | 0 (0.0%) |
| 35 to 64 Years | 0 (0.0%) | 0 (0.0%) |
| 65 to 74 Years | 17 (18.3%) | 7 (4.2%) |
| 75 Years and over | 7 (7.8%) | 27 (18.2%) |
Disability Class: Self-Care Difficulty
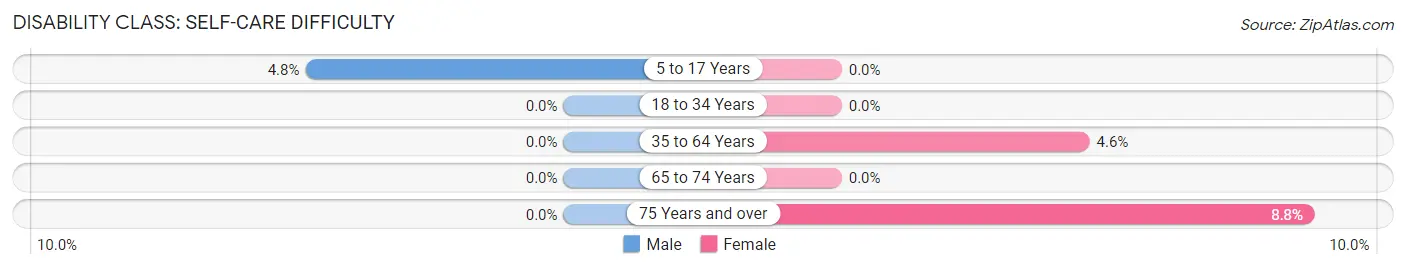
| Age Bracket | Male | Female |
| 5 to 17 Years | 8 (4.8%) | 0 (0.0%) |
| 18 to 34 Years | 0 (0.0%) | 0 (0.0%) |
| 35 to 64 Years | 0 (0.0%) | 24 (4.6%) |
| 65 to 74 Years | 0 (0.0%) | 0 (0.0%) |
| 75 Years and over | 0 (0.0%) | 13 (8.8%) |
Technology Access in Isle of Hope
Computing Device Access in Isle of Hope
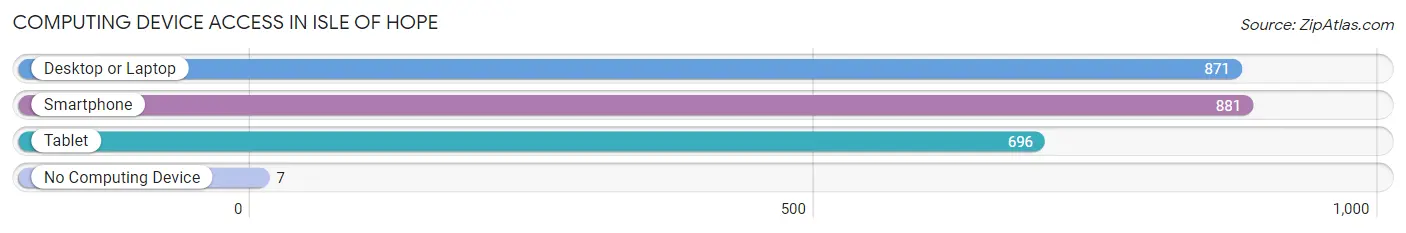
| Device Type | # Households | % Households |
| Desktop or Laptop | 871 | 90.6% |
| Smartphone | 881 | 91.7% |
| Tablet | 696 | 72.4% |
| No Computing Device | 7 | 0.7% |
| Total | 961 | 100.0% |
Internet Access in Isle of Hope
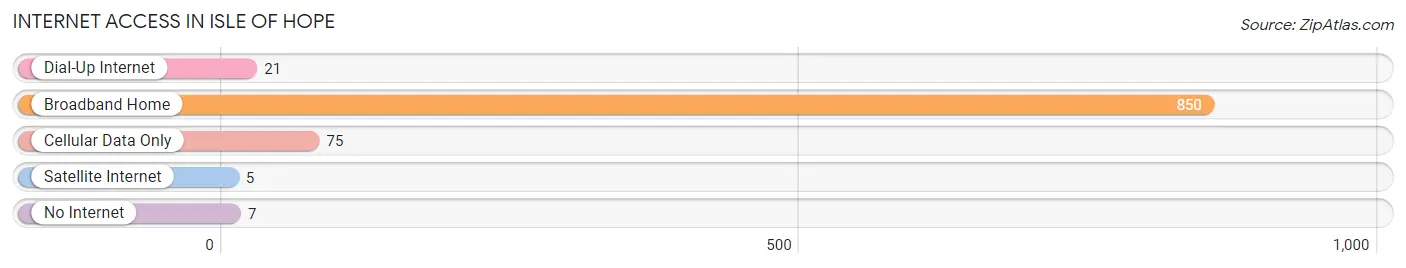
| Internet Type | # Households | % Households |
| Dial-Up Internet | 21 | 2.2% |
| Broadband Home | 850 | 88.4% |
| Cellular Data Only | 75 | 7.8% |
| Satellite Internet | 5 | 0.5% |
| No Internet | 7 | 0.7% |
| Total | 961 | 100.0% |
Isle of Hope Summary
Isle of Hope is a small, unincorporated community located in Chatham County, Georgia, United States. It is situated on the banks of the Skidaway River, just south of Savannah. The community is known for its picturesque views of the river, its historic homes, and its close proximity to the city of Savannah.
History
The Isle of Hope was first settled in the late 1700s by a group of English settlers. The settlers were attracted to the area due to its abundance of natural resources, including timber, fish, and oysters. The community was originally known as “Hope Town” and was later renamed “Isle of Hope” in 1820.
The Isle of Hope was a popular destination for wealthy Savannahians in the late 19th century. Many of the grand homes that line the streets of the Isle of Hope were built during this period. The community was also home to a number of prominent families, including the Habershams, the Lawtons, and the Greenes.
The Isle of Hope was incorporated as a town in 1891. The town was governed by a mayor and a board of aldermen. The town was annexed by the city of Savannah in 1910.
Geography
The Isle of Hope is located in Chatham County, Georgia, United States. It is situated on the banks of the Skidaway River, just south of Savannah. The community is bordered by the Skidaway River to the east, the Wilmington River to the south, and the Vernon River to the west.
The Isle of Hope is a small community, covering an area of just 0.7 square miles. The community is mostly residential, with a few small businesses located along the main thoroughfare.
Economy
The Isle of Hope is a primarily residential community, with a few small businesses located along the main thoroughfare. The community is home to a number of small businesses, including restaurants, retail stores, and professional services.
The Isle of Hope is also home to a number of historic sites, including the Isle of Hope Marina, the Isle of Hope Historic District, and the Isle of Hope United Methodist Church. These sites attract visitors from all over the world, providing a boost to the local economy.
Demographics
As of the 2010 census, the Isle of Hope had a population of 1,717. The population is predominantly white (90.2%), with a small African American population (7.2%). The median household income is $63,929, and the median home value is $310,000.
Conclusion
The Isle of Hope is a small, unincorporated community located in Chatham County, Georgia, United States. It is situated on the banks of the Skidaway River, just south of Savannah. The community is known for its picturesque views of the river, its historic homes, and its close proximity to the city of Savannah. The Isle of Hope is a primarily residential community, with a few small businesses located along the main thoroughfare. As of the 2010 census, the Isle of Hope had a population of 1,717. The population is predominantly white (90.2%), with a small African American population (7.2%). The median household income is $63,929, and the median home value is $310,000.
Common Questions
What is the Total Population of Isle of Hope?
Total Population of Isle of Hope is 2,137.
What is the Total Male Population of Isle of Hope?
Total Male Population of Isle of Hope is 868.
What is the Total Female Population of Isle of Hope?
Total Female Population of Isle of Hope is 1,269.
What is the Ratio of Males per 100 Females in Isle of Hope?
There are 68.40 Males per 100 Females in Isle of Hope.
What is the Ratio of Females per 100 Males in Isle of Hope?
There are 146.20 Females per 100 Males in Isle of Hope.
What is the Median Population Age in Isle of Hope?
Median Population Age in Isle of Hope is 42.8 Years.
What is the Average Family Size in Isle of Hope
Average Family Size in Isle of Hope is 3.1 People.
What is the Average Household Size in Isle of Hope
Average Household Size in Isle of Hope is 2.2 People.
What is Per Capita Income in Isle of Hope?
Per Capita income in Isle of Hope is $70,088.
What is the Median Family Income in Isle of Hope?
Median Family Income in Isle of Hope is $131,964.
What is the Median Household income in Isle of Hope?
Median Household Income in Isle of Hope is $96,934.
What is Income or Wage Gap in Isle of Hope?
Income or Wage Gap in Isle of Hope is 27.5%.
Women in Isle of Hope earn 72.5 cents for every dollar earned by a man.
What is Inequality or Gini Index in Isle of Hope?
Inequality or Gini Index in Isle of Hope is 0.49.
How Large is the Labor Force in Isle of Hope?
There are 1,012 People in the Labor Forcein in Isle of Hope.
What is the Percentage of People in the Labor Force in Isle of Hope?
59.9% of People are in the Labor Force in Isle of Hope.
What is the Unemployment Rate in Isle of Hope?
Unemployment Rate in Isle of Hope is 1.8%.