Avalon, GA
Avalon Map
Avalon Overview
285
TOTAL POPULATION
153
MALE POPULATION
132
FEMALE POPULATION
115.91
MALES / 100 FEMALES
86.27
FEMALES / 100 MALES
47.3
MEDIAN AGE
2.9
AVG FAMILY SIZE
2.6
AVG HOUSEHOLD SIZE
$25,702
PER CAPITA INCOME
$43,906
AVG HOUSEHOLD INCOME
0.39
INEQUALITY / GINI INDEX
115
LABOR FORCE [ PEOPLE ]
45.8%
PERCENT IN LABOR FORCE
Race in Avalon
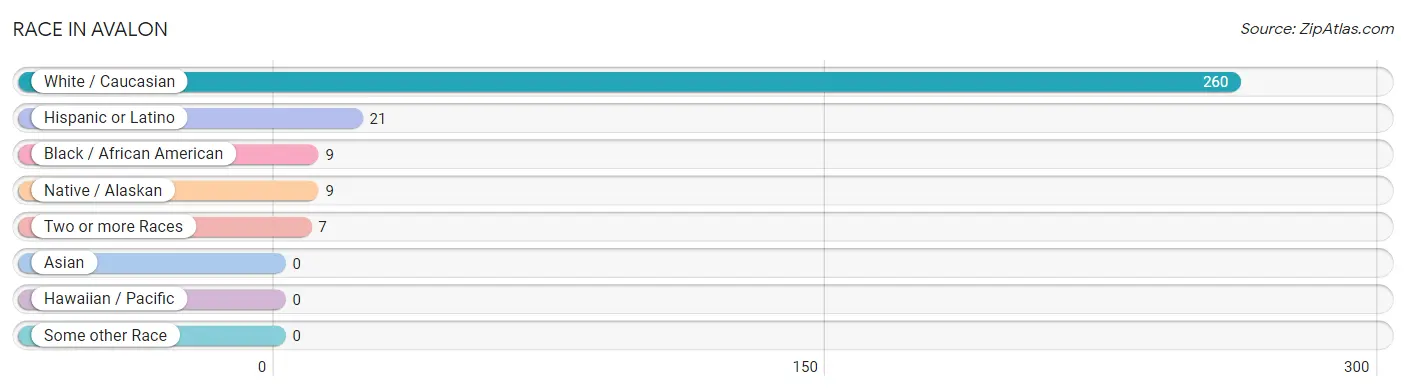
The most populous races in Avalon are White / Caucasian (260 | 91.2%), Hispanic or Latino (21 | 7.4%), and Black / African American (9 | 3.2%).
| Race | # Population | % Population |
| Asian | 0 | 0.0% |
| Black / African American | 9 | 3.2% |
| Hawaiian / Pacific | 0 | 0.0% |
| Hispanic or Latino | 21 | 7.4% |
| Native / Alaskan | 9 | 3.2% |
| White / Caucasian | 260 | 91.2% |
| Two or more Races | 7 | 2.5% |
| Some other Race | 0 | 0.0% |
| Total | 285 | 100.0% |
Ancestry in Avalon
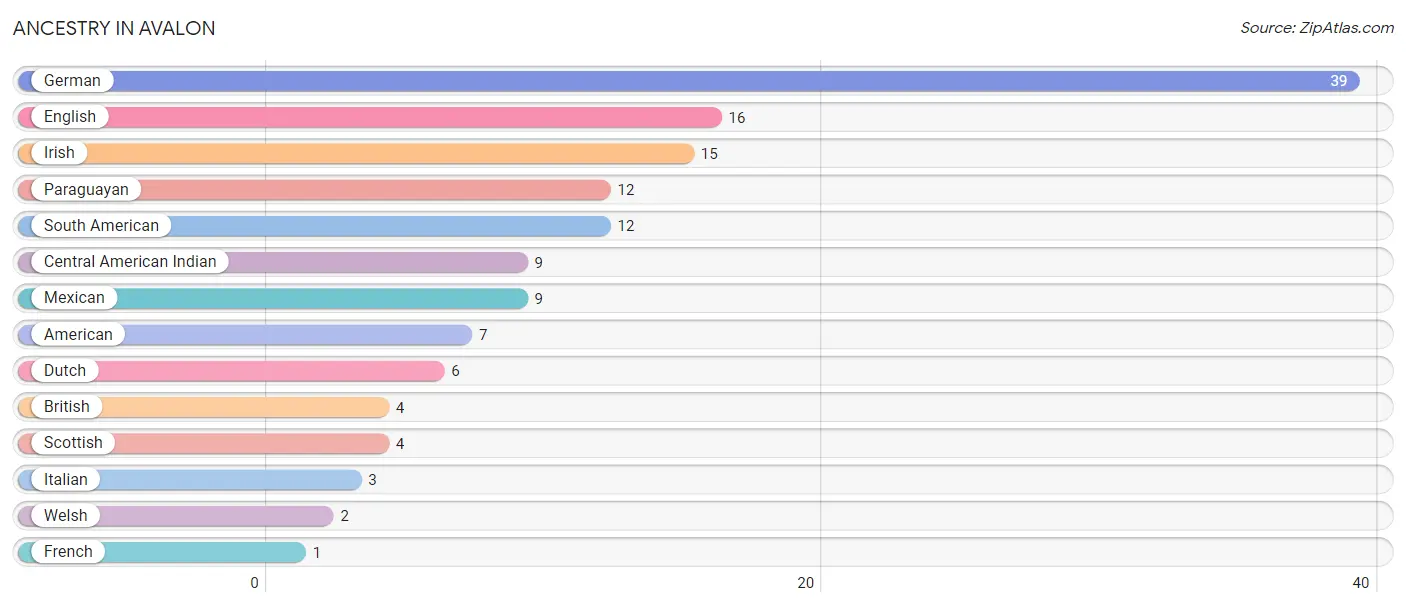
The most populous ancestries reported in Avalon are German (39 | 13.7%), English (16 | 5.6%), Irish (15 | 5.3%), Paraguayan (12 | 4.2%), and South American (12 | 4.2%), together accounting for 33.0% of all Avalon residents.
| Ancestry | # Population | % Population |
| American | 7 | 2.5% |
| British | 4 | 1.4% |
| Central American Indian | 9 | 3.2% |
| Dutch | 6 | 2.1% |
| English | 16 | 5.6% |
| French | 1 | 0.4% |
| German | 39 | 13.7% |
| Irish | 15 | 5.3% |
| Italian | 3 | 1.1% |
| Mexican | 9 | 3.2% |
| Paraguayan | 12 | 4.2% |
| Scottish | 4 | 1.4% |
| South American | 12 | 4.2% |
| Welsh | 2 | 0.7% | View All 14 Rows |
Immigrants in Avalon
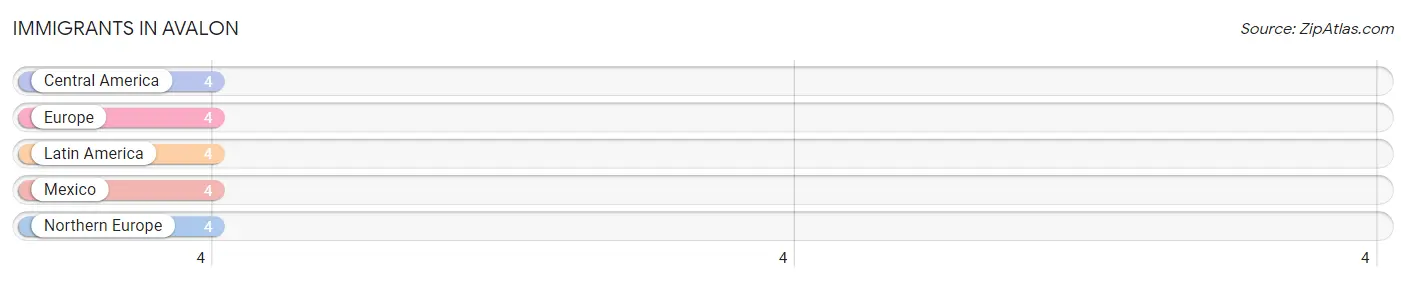
The most numerous immigrant groups reported in Avalon came from Central America (4 | 1.4%), Europe (4 | 1.4%), Latin America (4 | 1.4%), Mexico (4 | 1.4%), and Northern Europe (4 | 1.4%), together accounting for 7.0% of all Avalon residents.
| Immigration Origin | # Population | % Population |
| Central America | 4 | 1.4% |
| Europe | 4 | 1.4% |
| Latin America | 4 | 1.4% |
| Mexico | 4 | 1.4% |
| Northern Europe | 4 | 1.4% | View All 5 Rows |
Sex and Age in Avalon
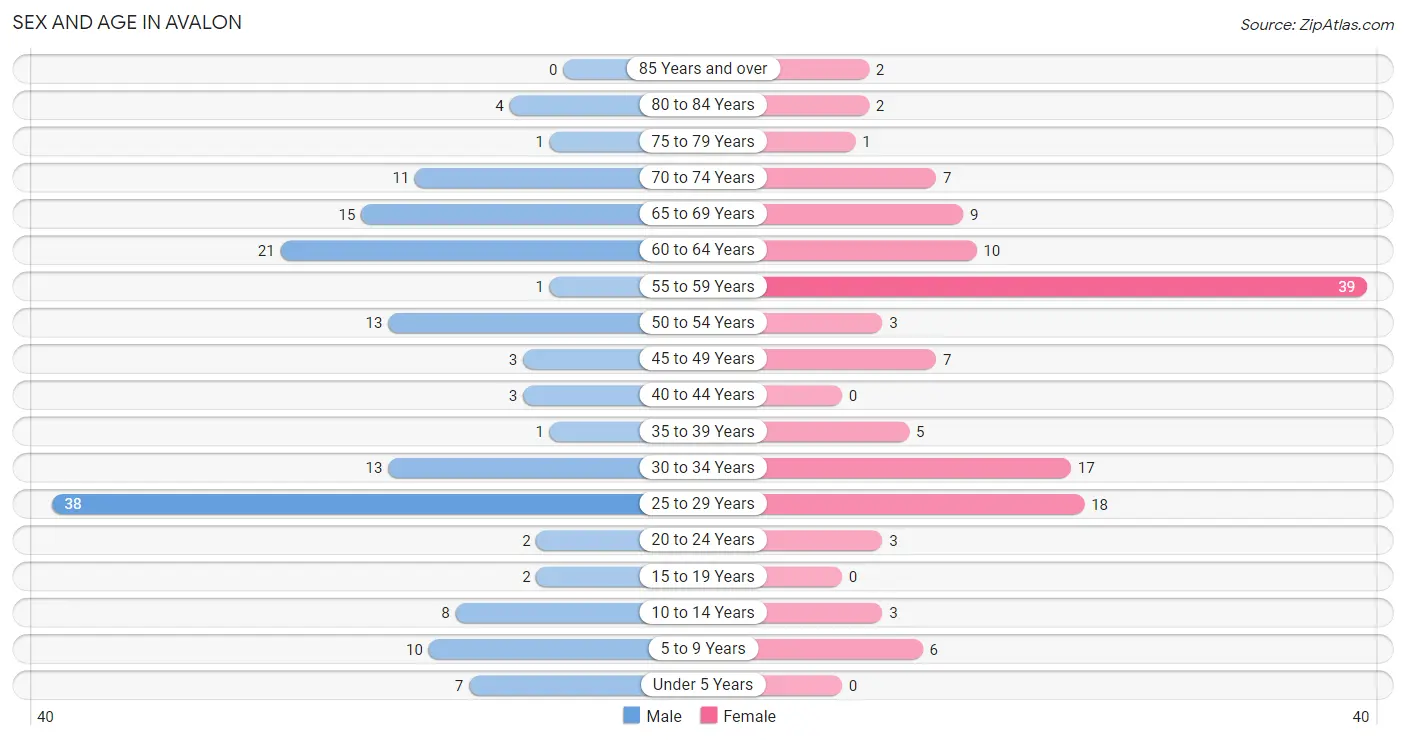
Sex and Age in Avalon
The most populous age groups in Avalon are 25 to 29 Years (38 | 24.8%) for men and 55 to 59 Years (39 | 29.5%) for women.
| Age Bracket | Male | Female |
| Under 5 Years | 7 (4.6%) | 0 (0.0%) |
| 5 to 9 Years | 10 (6.5%) | 6 (4.5%) |
| 10 to 14 Years | 8 (5.2%) | 3 (2.3%) |
| 15 to 19 Years | 2 (1.3%) | 0 (0.0%) |
| 20 to 24 Years | 2 (1.3%) | 3 (2.3%) |
| 25 to 29 Years | 38 (24.8%) | 18 (13.6%) |
| 30 to 34 Years | 13 (8.5%) | 17 (12.9%) |
| 35 to 39 Years | 1 (0.6%) | 5 (3.8%) |
| 40 to 44 Years | 3 (2.0%) | 0 (0.0%) |
| 45 to 49 Years | 3 (2.0%) | 7 (5.3%) |
| 50 to 54 Years | 13 (8.5%) | 3 (2.3%) |
| 55 to 59 Years | 1 (0.6%) | 39 (29.5%) |
| 60 to 64 Years | 21 (13.7%) | 10 (7.6%) |
| 65 to 69 Years | 15 (9.8%) | 9 (6.8%) |
| 70 to 74 Years | 11 (7.2%) | 7 (5.3%) |
| 75 to 79 Years | 1 (0.6%) | 1 (0.8%) |
| 80 to 84 Years | 4 (2.6%) | 2 (1.5%) |
| 85 Years and over | 0 (0.0%) | 2 (1.5%) |
| Total | 153 (100.0%) | 132 (100.0%) |
Families and Households in Avalon
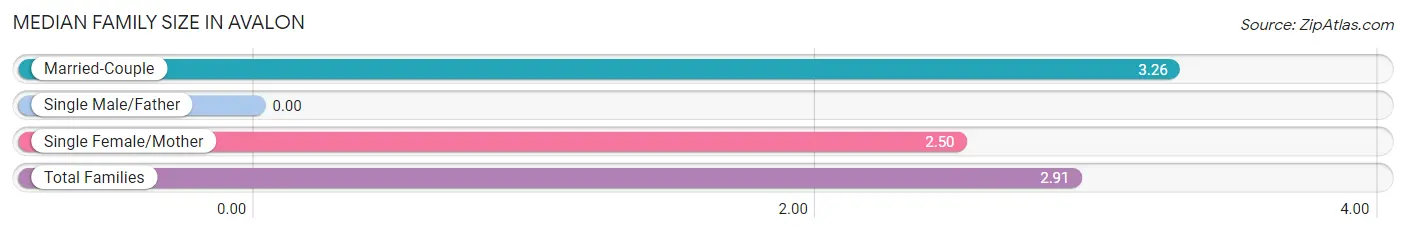
Median Family Size in Avalon
| Family Type | # Families | Family Size |
| Married-Couple | 35 (53.8%) | 3.26 |
| Single Male/Father | 0 (0.0%) | - |
| Single Female/Mother | 30 (46.2%) | 2.50 |
| Total Families | 65 (100.0%) | 2.91 |
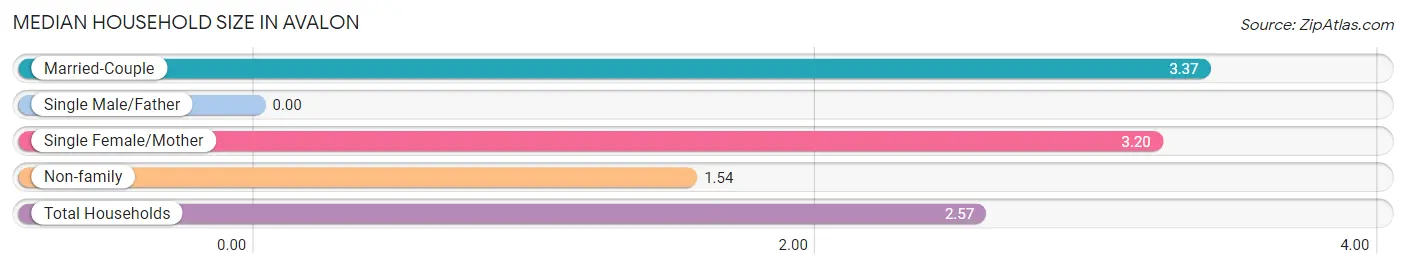
Median Household Size in Avalon
| Household Type | # Households | Household Size |
| Married-Couple | 35 (31.5%) | 3.37 |
| Single Male/Father | 0 (0.0%) | - |
| Single Female/Mother | 30 (27.0%) | 3.20 |
| Non-family | 46 (41.4%) | 1.54 |
| Total Households | 111 (100.0%) | 2.57 |
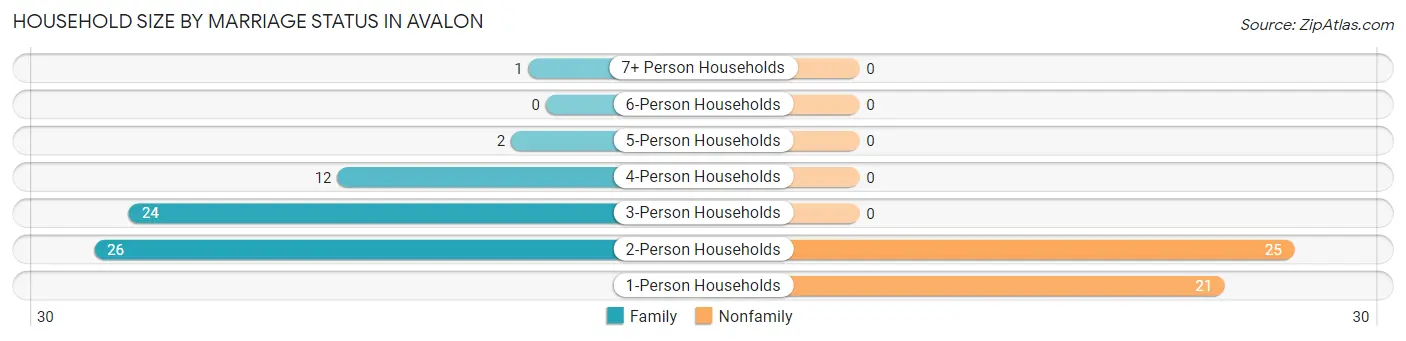
Household Size by Marriage Status in Avalon
Out of a total of 111 households in Avalon, 65 (58.6%) are family households, while 46 (41.4%) are nonfamily households. The most numerous type of family households are 2-person households, comprising 26, and the most common type of nonfamily households are 2-person households, comprising 25.
| Household Size | Family Households | Nonfamily Households |
| 1-Person Households | - | 21 (18.9%) |
| 2-Person Households | 26 (23.4%) | 25 (22.5%) |
| 3-Person Households | 24 (21.6%) | 0 (0.0%) |
| 4-Person Households | 12 (10.8%) | 0 (0.0%) |
| 5-Person Households | 2 (1.8%) | 0 (0.0%) |
| 6-Person Households | 0 (0.0%) | 0 (0.0%) |
| 7+ Person Households | 1 (0.9%) | 0 (0.0%) |
| Total | 65 (58.6%) | 46 (41.4%) |
Female Fertility in Avalon
Fertility by Age in Avalon
Average fertility rate in Avalon is 39.0 births per 1,000 women. Women in the age bracket of 20 to 34 years have the highest fertility rate with 53.0 births per 1,000 women. Women in the age bracket of 20 to 34 years acount for 100.0% of all women with births.
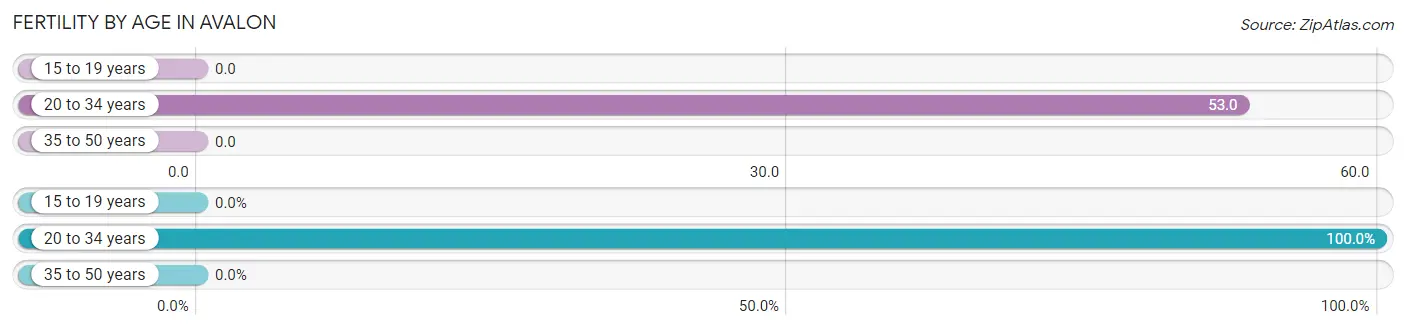
| Age Bracket | Women with Births | Births / 1,000 Women |
| 15 to 19 years | 0 (0.0%) | 0.0 |
| 20 to 34 years | 2 (100.0%) | 53.0 |
| 35 to 50 years | 0 (0.0%) | 0.0 |
| Total | 2 (100.0%) | 39.0 |
Fertility by Age by Marriage Status in Avalon
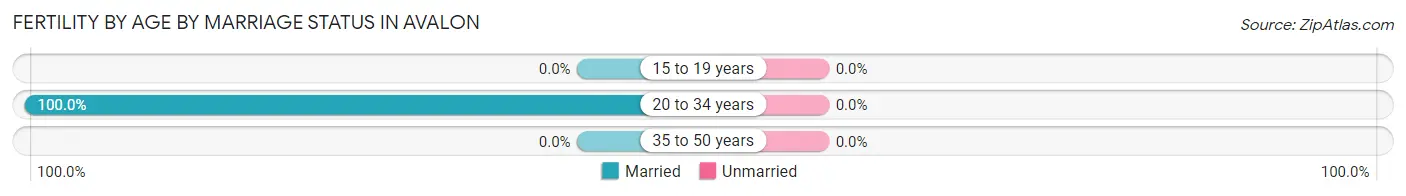
| Age Bracket | Married | Unmarried |
| 15 to 19 years | 0 (0.0%) | 0 (0.0%) |
| 20 to 34 years | 2 (100.0%) | 0 (0.0%) |
| 35 to 50 years | 0 (0.0%) | 0 (0.0%) |
| Total | 2 (100.0%) | 0 (0.0%) |
Fertility by Education in Avalon
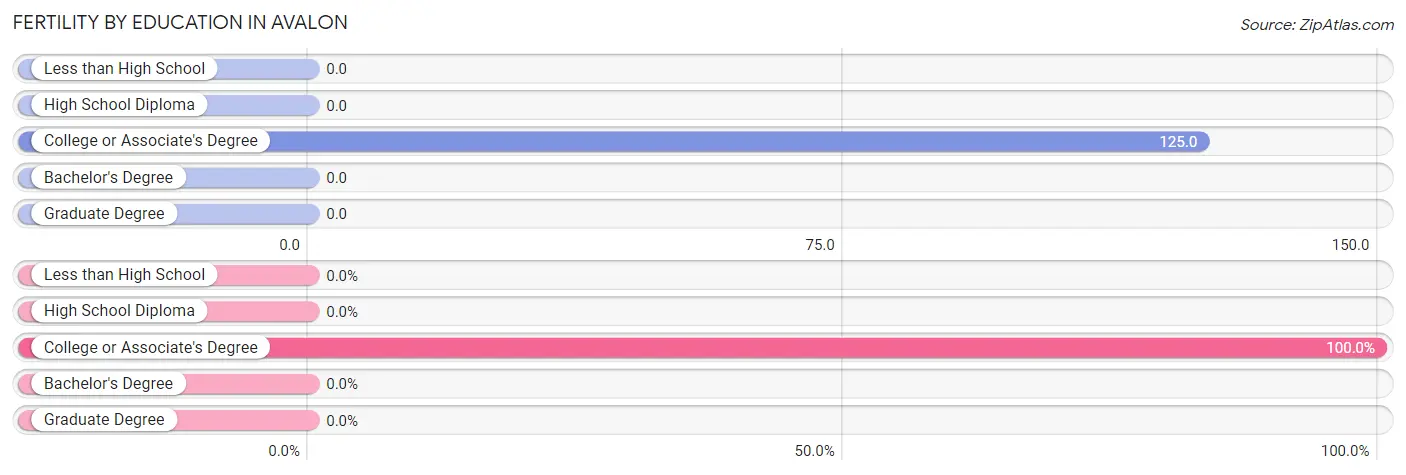
| Educational Attainment | Women with Births | Births / 1,000 Women |
| Less than High School | 0 (0.0%) | 0.0 |
| High School Diploma | 0 (0.0%) | 0.0 |
| College or Associate's Degree | 2 (100.0%) | 125.0 |
| Bachelor's Degree | 0 (0.0%) | 0.0 |
| Graduate Degree | 0 (0.0%) | 0.0 |
| Total | 2 (100.0%) | 39.0 |
Fertility by Education by Marriage Status in Avalon
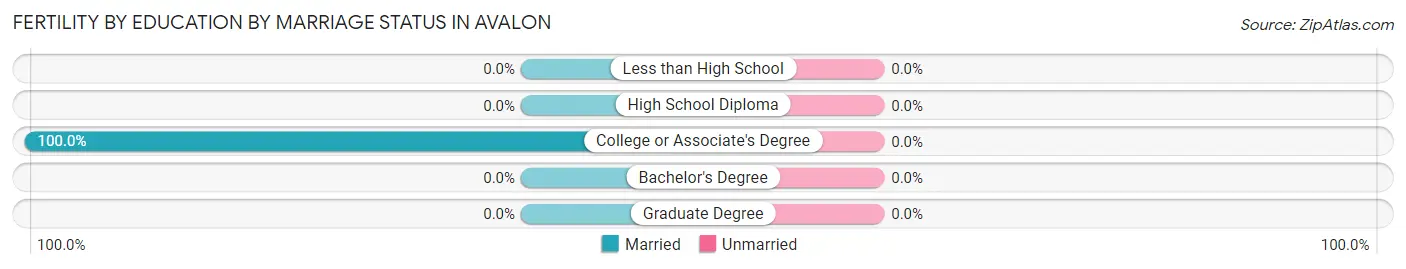
| Educational Attainment | Married | Unmarried |
| Less than High School | 0 (0.0%) | 0 (0.0%) |
| High School Diploma | 0 (0.0%) | 0 (0.0%) |
| College or Associate's Degree | 2 (100.0%) | 0 (0.0%) |
| Bachelor's Degree | 0 (0.0%) | 0 (0.0%) |
| Graduate Degree | 0 (0.0%) | 0 (0.0%) |
| Total | 2 (100.0%) | 0 (0.0%) |
Income in Avalon
Income Overview in Avalon
| Characteristic | Number | Measure |
| Per Capita Income | 285 | $25,702 |
| Median Family Income | 65 | $0 |
| Mean Family Income | 65 | $63,743 |
| Median Household Income | 111 | $43,906 |
| Mean Household Income | 111 | $55,973 |
| Income Deficit | 65 | $0 |
| Wage / Income Gap (%) | 285 | 0.00% |
| Wage / Income Gap ($) | 285 | 100.00¢ per $1 |
| Gini / Inequality Index | 285 | 0.39 |
Earnings by Sex in Avalon
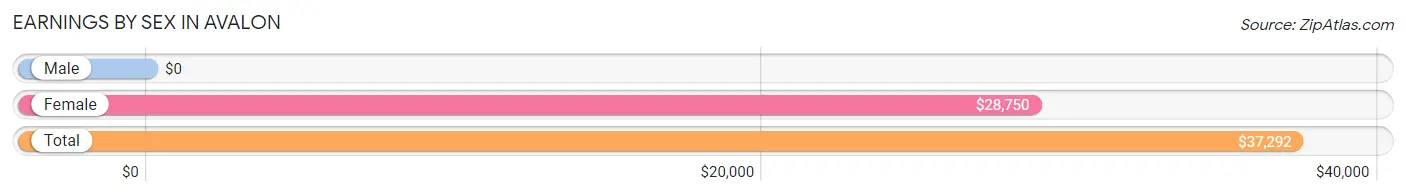
| Sex | Number | Average Earnings |
| Male | 77 (57.9%) | $0 |
| Female | 56 (42.1%) | $28,750 |
| Total | 133 (100.0%) | $37,292 |
Earnings by Sex by Income Bracket in Avalon
The most common earnings brackets in Avalon are $75,000 to $99,999 for men (30 | 39.0%) and $2,499 or less for women (11 | 19.6%).
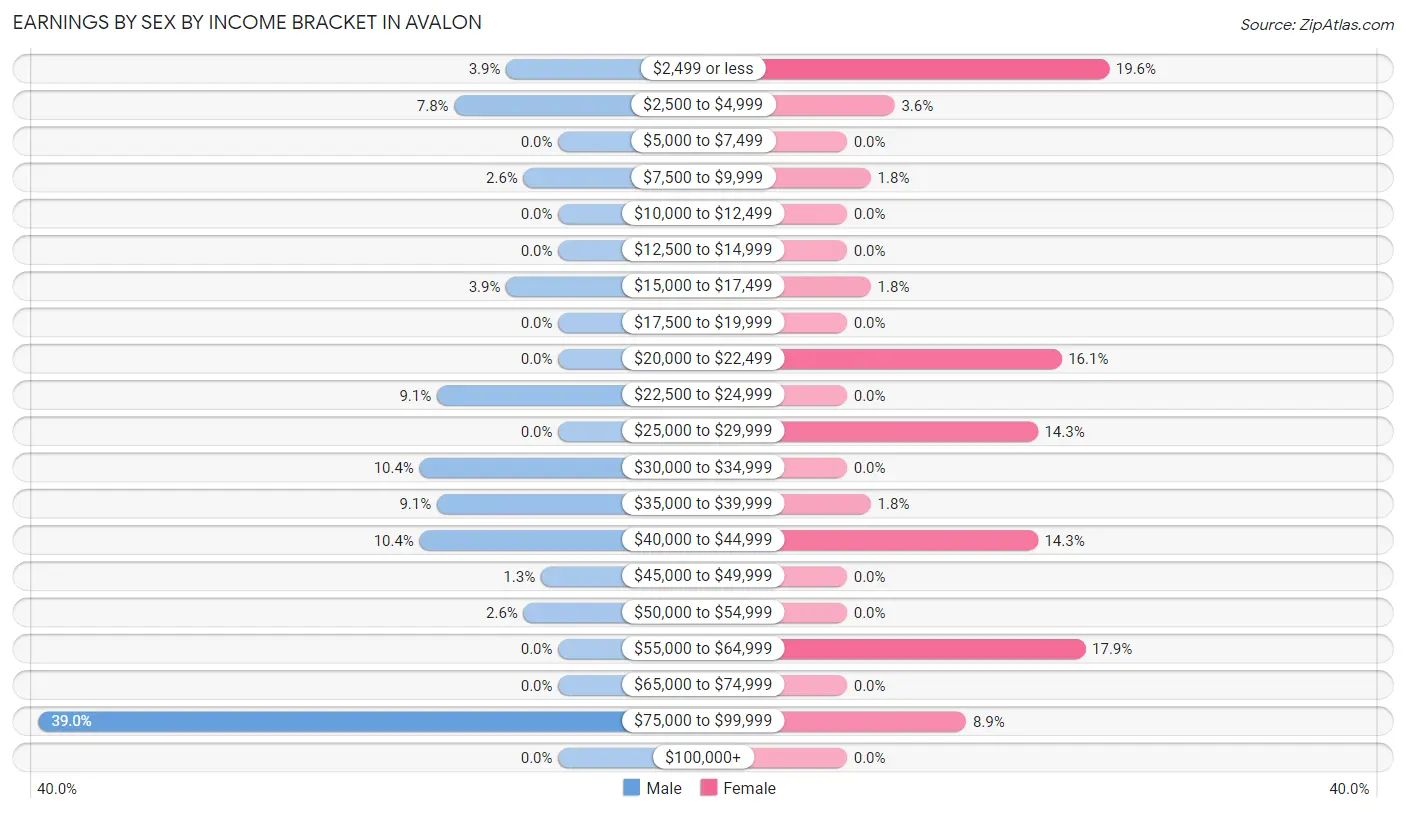
| Income | Male | Female |
| $2,499 or less | 3 (3.9%) | 11 (19.6%) |
| $2,500 to $4,999 | 6 (7.8%) | 2 (3.6%) |
| $5,000 to $7,499 | 0 (0.0%) | 0 (0.0%) |
| $7,500 to $9,999 | 2 (2.6%) | 1 (1.8%) |
| $10,000 to $12,499 | 0 (0.0%) | 0 (0.0%) |
| $12,500 to $14,999 | 0 (0.0%) | 0 (0.0%) |
| $15,000 to $17,499 | 3 (3.9%) | 1 (1.8%) |
| $17,500 to $19,999 | 0 (0.0%) | 0 (0.0%) |
| $20,000 to $22,499 | 0 (0.0%) | 9 (16.1%) |
| $22,500 to $24,999 | 7 (9.1%) | 0 (0.0%) |
| $25,000 to $29,999 | 0 (0.0%) | 8 (14.3%) |
| $30,000 to $34,999 | 8 (10.4%) | 0 (0.0%) |
| $35,000 to $39,999 | 7 (9.1%) | 1 (1.8%) |
| $40,000 to $44,999 | 8 (10.4%) | 8 (14.3%) |
| $45,000 to $49,999 | 1 (1.3%) | 0 (0.0%) |
| $50,000 to $54,999 | 2 (2.6%) | 0 (0.0%) |
| $55,000 to $64,999 | 0 (0.0%) | 10 (17.9%) |
| $65,000 to $74,999 | 0 (0.0%) | 0 (0.0%) |
| $75,000 to $99,999 | 30 (39.0%) | 5 (8.9%) |
| $100,000+ | 0 (0.0%) | 0 (0.0%) |
| Total | 77 (100.0%) | 56 (100.0%) |
Earnings by Sex by Educational Attainment in Avalon
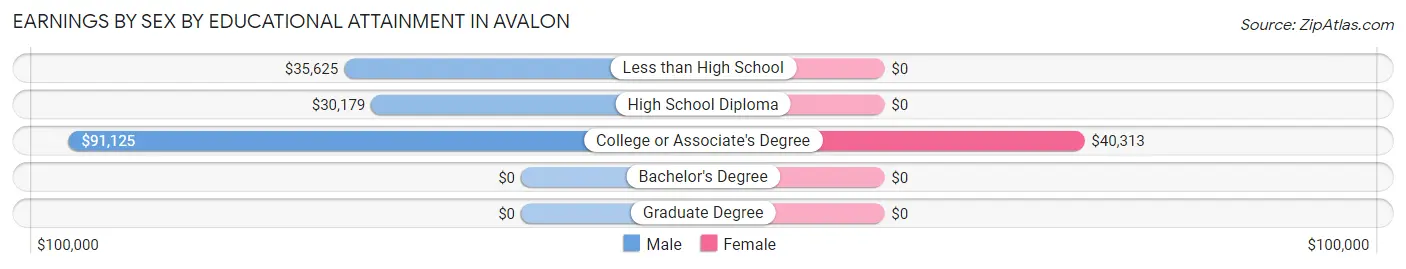
| Educational Attainment | Male Income | Female Income |
| Less than High School | $35,625 | $0 |
| High School Diploma | $30,179 | $0 |
| College or Associate's Degree | $91,125 | $40,313 |
| Bachelor's Degree | - | - |
| Graduate Degree | - | - |
| Total | - | - |
Family Income in Avalon
Family Income Brackets in Avalon
According to the Avalon family income data, there are 23 families falling into the $75,000 to $99,999 income range, which is the most common income bracket and makes up 35.4% of all families.
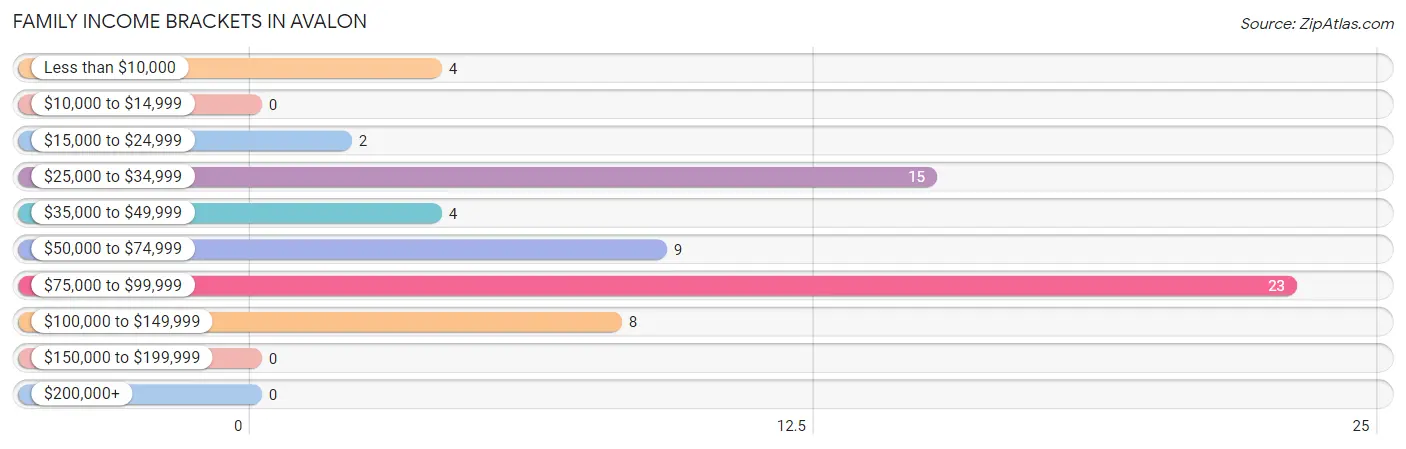
| Income Bracket | # Families | % Families |
| Less than $10,000 | 4 | 6.2% |
| $10,000 to $14,999 | 0 | 0.0% |
| $15,000 to $24,999 | 2 | 3.1% |
| $25,000 to $34,999 | 15 | 23.1% |
| $35,000 to $49,999 | 4 | 6.2% |
| $50,000 to $74,999 | 9 | 13.8% |
| $75,000 to $99,999 | 23 | 35.4% |
| $100,000 to $149,999 | 8 | 12.3% |
| $150,000 to $199,999 | 0 | 0.0% |
| $200,000+ | 0 | 0.0% |
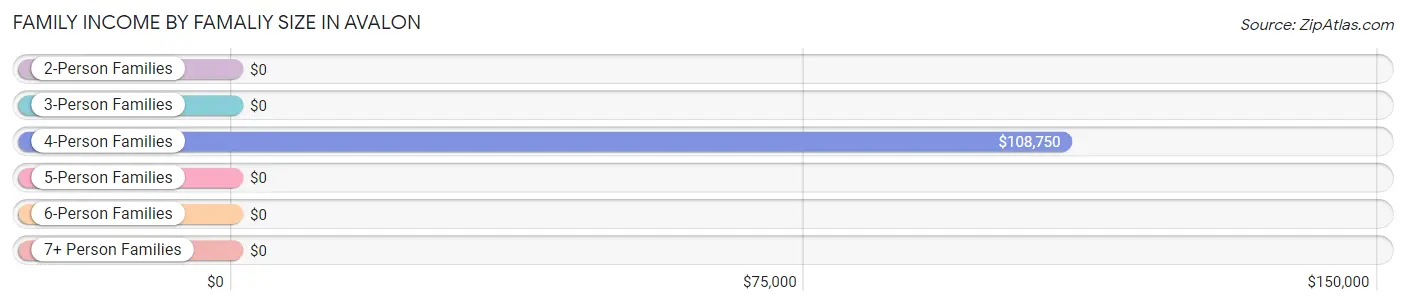
Family Income by Famaliy Size in Avalon
4-person families (14 | 21.5%) account for the highest median family income in Avalon with $108,750 per family, while 4-person families (14 | 21.5%) have the highest median income of $27,188 per family member.
| Income Bracket | # Families | Median Income |
| 2-Person Families | 47 (72.3%) | $0 |
| 3-Person Families | 3 (4.6%) | $0 |
| 4-Person Families | 14 (21.5%) | $108,750 |
| 5-Person Families | 0 (0.0%) | $0 |
| 6-Person Families | 0 (0.0%) | $0 |
| 7+ Person Families | 1 (1.5%) | $0 |
| Total | 65 (100.0%) | $0 |
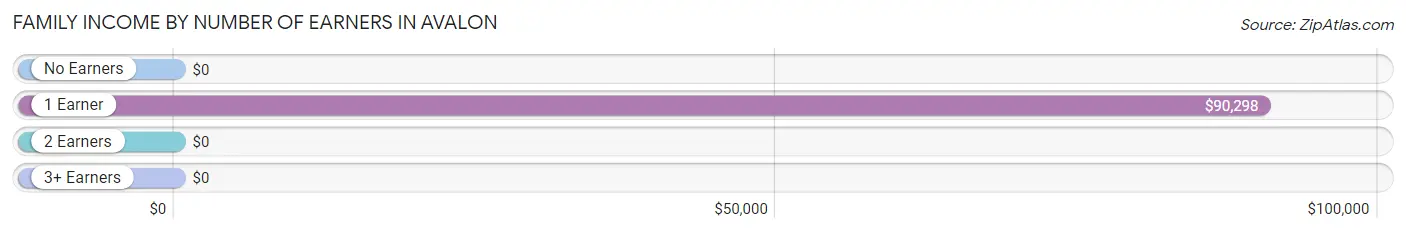
Family Income by Number of Earners in Avalon
| Number of Earners | # Families | Median Income |
| No Earners | 7 (10.8%) | $0 |
| 1 Earner | 37 (56.9%) | $90,298 |
| 2 Earners | 20 (30.8%) | $0 |
| 3+ Earners | 1 (1.5%) | $0 |
| Total | 65 (100.0%) | $0 |
Household Income in Avalon
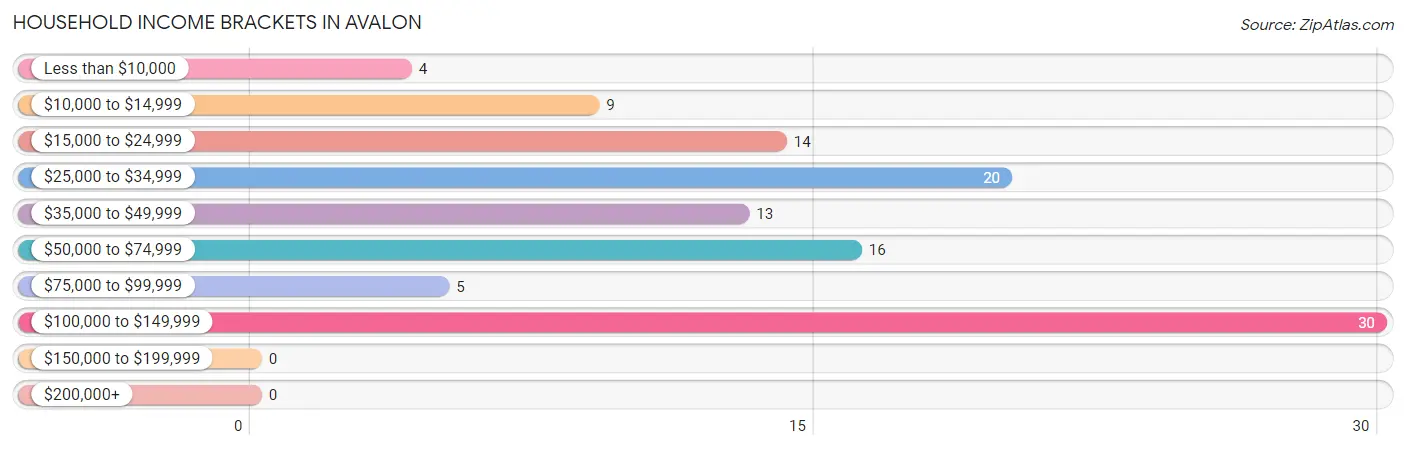
Household Income Brackets in Avalon
With 30 households falling in the category, the $100,000 to $149,999 income range is the most frequent in Avalon, accounting for 27.0% of all households.
| Income Bracket | # Households | % Households |
| Less than $10,000 | 4 | 3.6% |
| $10,000 to $14,999 | 9 | 8.1% |
| $15,000 to $24,999 | 14 | 12.6% |
| $25,000 to $34,999 | 20 | 18.0% |
| $35,000 to $49,999 | 13 | 11.7% |
| $50,000 to $74,999 | 16 | 14.4% |
| $75,000 to $99,999 | 5 | 4.5% |
| $100,000 to $149,999 | 30 | 27.0% |
| $150,000 to $199,999 | 0 | 0.0% |
| $200,000+ | 0 | 0.0% |
Household Income by Householder Age in Avalon
The median household income in Avalon is $43,906, with the highest median household income of $44,531 found in the 25 to 44 years age bracket for the primary householder. A total of 29 households (26.1%) fall into this category. Meanwhile, the 15 to 24 years age bracket for the primary householder has the lowest median household income of $0, with 1 households (0.9%) in this group.

| Income Bracket | # Households | Median Income |
| 15 to 24 Years | 1 (0.9%) | $0 |
| 25 to 44 Years | 29 (26.1%) | $44,531 |
| 45 to 64 Years | 48 (43.2%) | $0 |
| 65+ Years | 33 (29.7%) | $0 |
| Total | 111 (100.0%) | $43,906 |
Poverty in Avalon
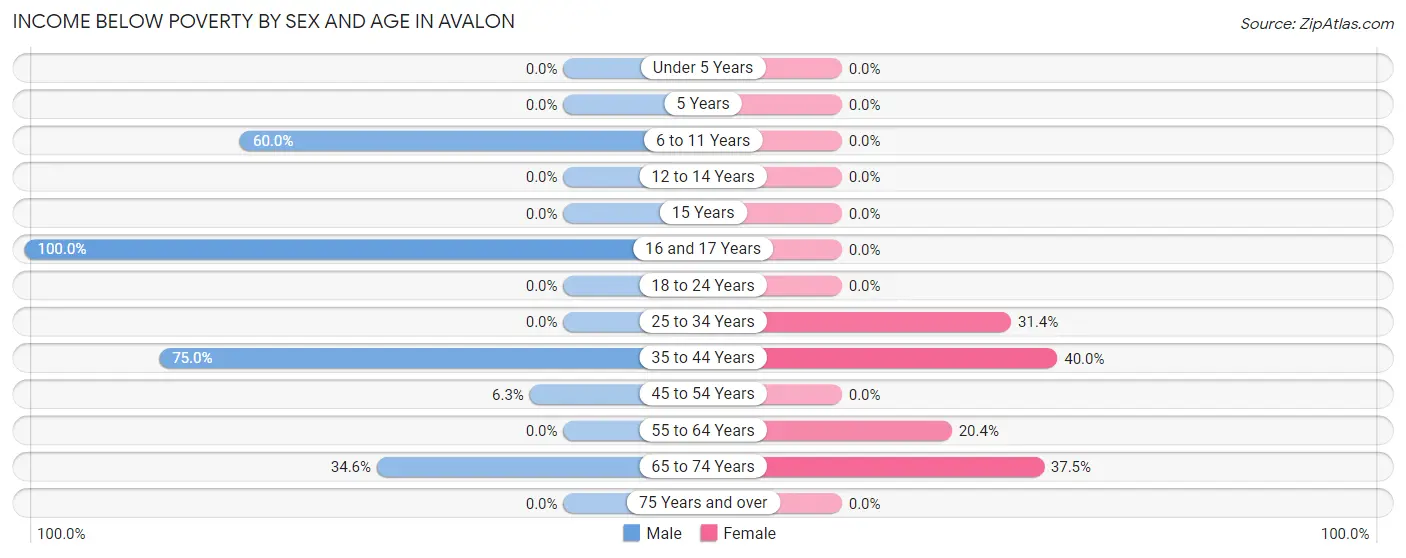
Income Below Poverty by Sex and Age in Avalon
With 13.7% poverty level for males and 22.0% for females among the residents of Avalon, 16 and 17 year old males and 35 to 44 year old females are the most vulnerable to poverty, with 2 males (100.0%) and 2 females (40.0%) in their respective age groups living below the poverty level.
| Age Bracket | Male | Female |
| Under 5 Years | 0 (0.0%) | 0 (0.0%) |
| 5 Years | 0 (0.0%) | 0 (0.0%) |
| 6 to 11 Years | 6 (60.0%) | 0 (0.0%) |
| 12 to 14 Years | 0 (0.0%) | 0 (0.0%) |
| 15 Years | 0 (0.0%) | 0 (0.0%) |
| 16 and 17 Years | 2 (100.0%) | 0 (0.0%) |
| 18 to 24 Years | 0 (0.0%) | 0 (0.0%) |
| 25 to 34 Years | 0 (0.0%) | 11 (31.4%) |
| 35 to 44 Years | 3 (75.0%) | 2 (40.0%) |
| 45 to 54 Years | 1 (6.2%) | 0 (0.0%) |
| 55 to 64 Years | 0 (0.0%) | 10 (20.4%) |
| 65 to 74 Years | 9 (34.6%) | 6 (37.5%) |
| 75 Years and over | 0 (0.0%) | 0 (0.0%) |
| Total | 21 (13.7%) | 29 (22.0%) |
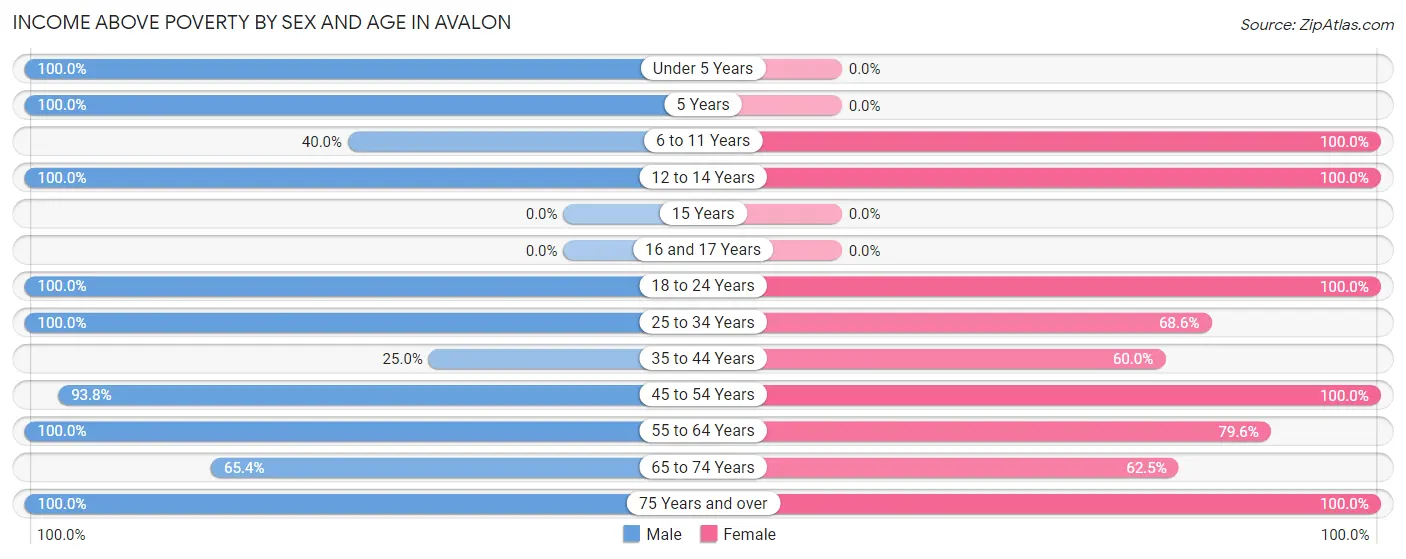
Income Above Poverty by Sex and Age in Avalon
According to the poverty statistics in Avalon, males aged under 5 years and females aged 6 to 11 years are the age groups that are most secure financially, with 100.0% of males and 100.0% of females in these age groups living above the poverty line.
| Age Bracket | Male | Female |
| Under 5 Years | 7 (100.0%) | 0 (0.0%) |
| 5 Years | 3 (100.0%) | 0 (0.0%) |
| 6 to 11 Years | 4 (40.0%) | 7 (100.0%) |
| 12 to 14 Years | 5 (100.0%) | 2 (100.0%) |
| 15 Years | 0 (0.0%) | 0 (0.0%) |
| 16 and 17 Years | 0 (0.0%) | 0 (0.0%) |
| 18 to 24 Years | 2 (100.0%) | 3 (100.0%) |
| 25 to 34 Years | 51 (100.0%) | 24 (68.6%) |
| 35 to 44 Years | 1 (25.0%) | 3 (60.0%) |
| 45 to 54 Years | 15 (93.8%) | 10 (100.0%) |
| 55 to 64 Years | 22 (100.0%) | 39 (79.6%) |
| 65 to 74 Years | 17 (65.4%) | 10 (62.5%) |
| 75 Years and over | 5 (100.0%) | 5 (100.0%) |
| Total | 132 (86.3%) | 103 (78.0%) |
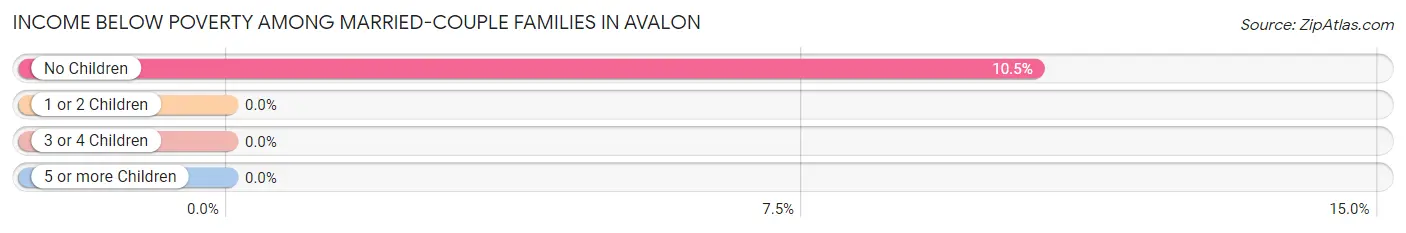
Income Below Poverty Among Married-Couple Families in Avalon
The poverty statistics for married-couple families in Avalon show that 5.7% or 2 of the total 35 families live below the poverty line. Families with no children have the highest poverty rate of 10.5%, comprising of 2 families. On the other hand, families with 1 or 2 children have the lowest poverty rate of 0.0%, which includes 0 families.
| Children | Above Poverty | Below Poverty |
| No Children | 17 (89.5%) | 2 (10.5%) |
| 1 or 2 Children | 15 (100.0%) | 0 (0.0%) |
| 3 or 4 Children | 1 (100.0%) | 0 (0.0%) |
| 5 or more Children | 0 (0.0%) | 0 (0.0%) |
| Total | 33 (94.3%) | 2 (5.7%) |
Income Below Poverty Among Single-Parent Households in Avalon
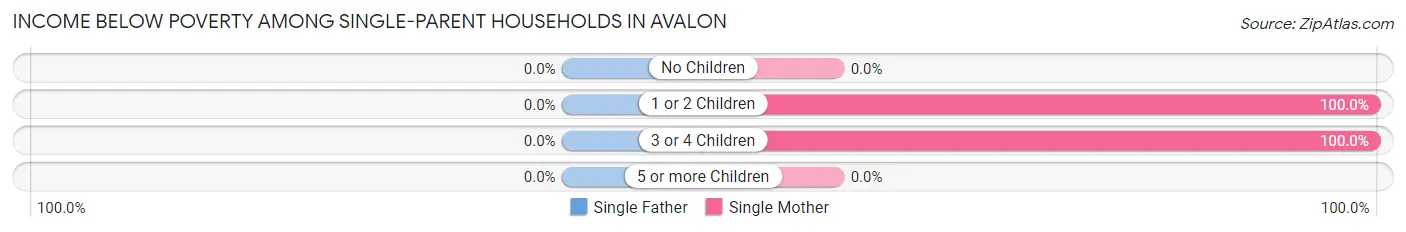
| Children | Single Father | Single Mother |
| No Children | 0 (0.0%) | 0 (0.0%) |
| 1 or 2 Children | 0 (0.0%) | 2 (100.0%) |
| 3 or 4 Children | 0 (0.0%) | 2 (100.0%) |
| 5 or more Children | 0 (0.0%) | 0 (0.0%) |
| Total | 0 (0.0%) | 4 (13.3%) |
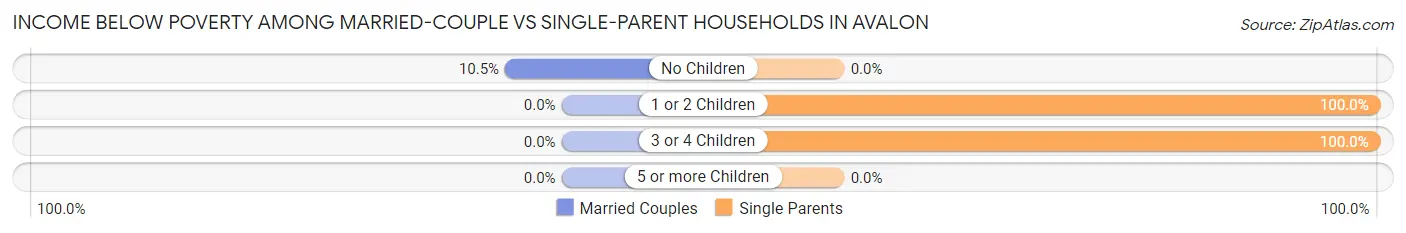
Income Below Poverty Among Married-Couple vs Single-Parent Households in Avalon
The poverty data for Avalon shows that 2 of the married-couple family households (5.7%) and 4 of the single-parent households (13.3%) are living below the poverty level. Within the married-couple family households, those with no children have the highest poverty rate, with 2 households (10.5%) falling below the poverty line. Among the single-parent households, those with 1 or 2 children have the highest poverty rate, with 2 household (100.0%) living below poverty.
| Children | Married-Couple Families | Single-Parent Households |
| No Children | 2 (10.5%) | 0 (0.0%) |
| 1 or 2 Children | 0 (0.0%) | 2 (100.0%) |
| 3 or 4 Children | 0 (0.0%) | 2 (100.0%) |
| 5 or more Children | 0 (0.0%) | 0 (0.0%) |
| Total | 2 (5.7%) | 4 (13.3%) |
Employment Characteristics in Avalon
Employment by Class of Employer in Avalon
Among the 115 employed individuals in Avalon, private company employees (92 | 80.0%), self-employed (not incorporated) (10 | 8.7%), and not-for-profit organizations (5 | 4.3%) make up the most common classes of employment.
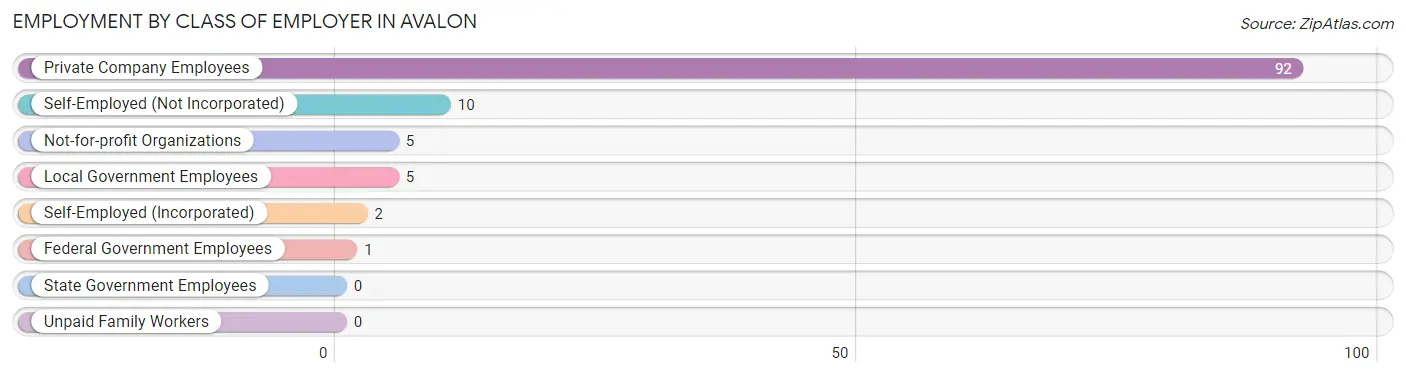
| Employer Class | # Employees | % Employees |
| Private Company Employees | 92 | 80.0% |
| Self-Employed (Incorporated) | 2 | 1.7% |
| Self-Employed (Not Incorporated) | 10 | 8.7% |
| Not-for-profit Organizations | 5 | 4.3% |
| Local Government Employees | 5 | 4.3% |
| State Government Employees | 0 | 0.0% |
| Federal Government Employees | 1 | 0.9% |
| Unpaid Family Workers | 0 | 0.0% |
| Total | 115 | 100.0% |
Employment Status by Age in Avalon
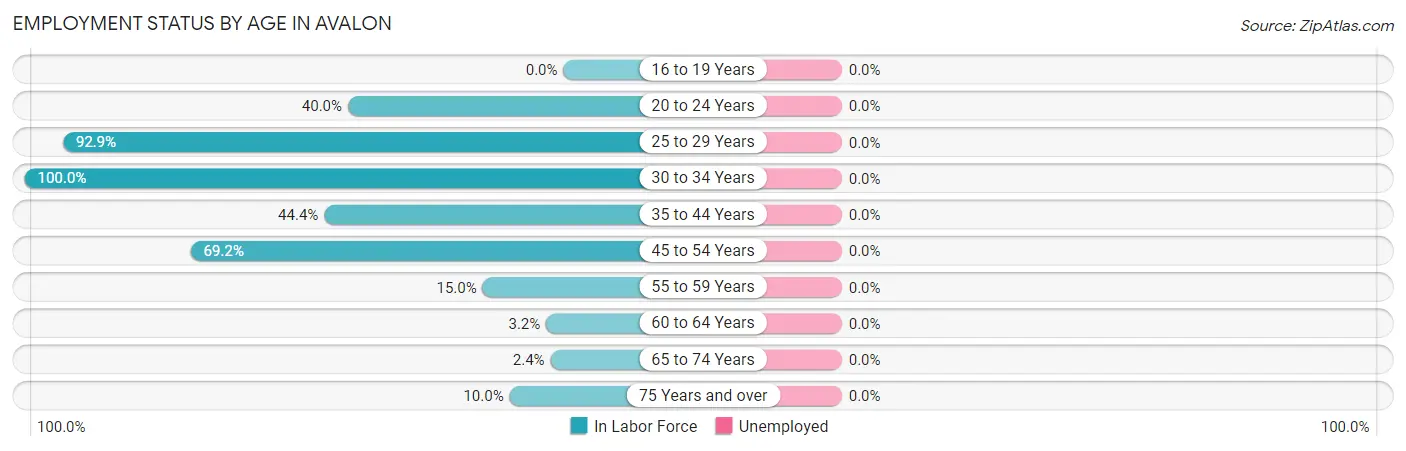
| Age Bracket | In Labor Force | Unemployed |
| 16 to 19 Years | 0 (0.0%) | 0 (0.0%) |
| 20 to 24 Years | 2 (40.0%) | 0 (0.0%) |
| 25 to 29 Years | 52 (92.9%) | 0 (0.0%) |
| 30 to 34 Years | 30 (100.0%) | 0 (0.0%) |
| 35 to 44 Years | 4 (44.4%) | 0 (0.0%) |
| 45 to 54 Years | 18 (69.2%) | 0 (0.0%) |
| 55 to 59 Years | 6 (15.0%) | 0 (0.0%) |
| 60 to 64 Years | 1 (3.2%) | 0 (0.0%) |
| 65 to 74 Years | 1 (2.4%) | 0 (0.0%) |
| 75 Years and over | 1 (10.0%) | 0 (0.0%) |
| Total | 115 (45.8%) | 0 (0.0%) |
Employment Status by Educational Attainment in Avalon
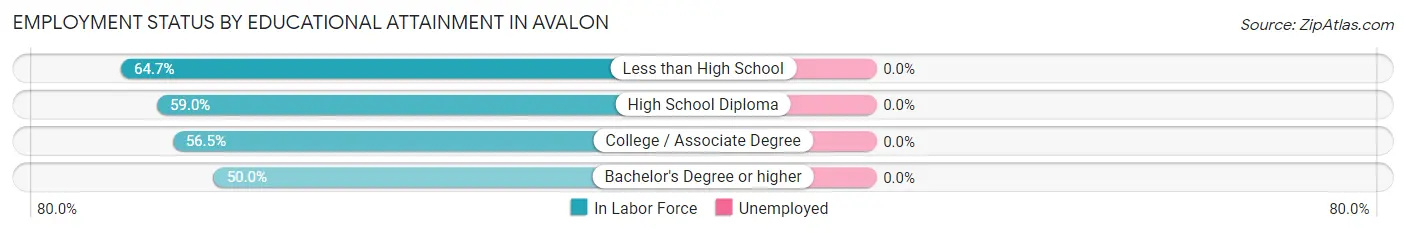
| Educational Attainment | In Labor Force | Unemployed |
| Less than High School | 11 (64.7%) | 0 (0.0%) |
| High School Diploma | 46 (59.0%) | 0 (0.0%) |
| College / Associate Degree | 48 (56.5%) | 0 (0.0%) |
| Bachelor's Degree or higher | 6 (50.0%) | 0 (0.0%) |
| Total | 111 (57.8%) | 0 (0.0%) |
Employment Occupations by Sex in Avalon
Management, Business, Science and Arts Occupations
The most common Management, Business, Science and Arts occupations in Avalon are Computers, Engineering & Science (30 | 26.1%), Computers & Mathematics (30 | 26.1%), Management (6 | 5.2%), Health Diagnosing & Treating (5 | 4.3%), and Health Technologists (5 | 4.3%).
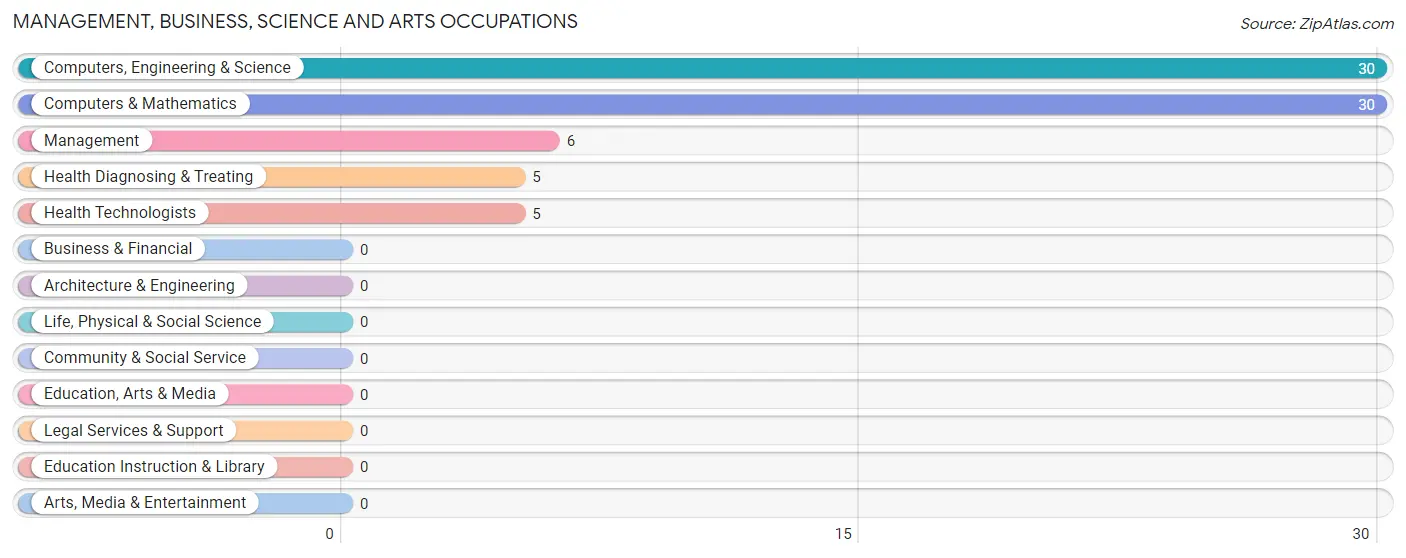
Management, Business, Science and Arts Occupations by Sex
Within the Management, Business, Science and Arts occupations in Avalon, the most male-oriented occupations are Computers, Engineering & Science (100.0%), Computers & Mathematics (100.0%), and Management (50.0%), while the most female-oriented occupations are Health Diagnosing & Treating (100.0%), Health Technologists (100.0%), and Management (50.0%).
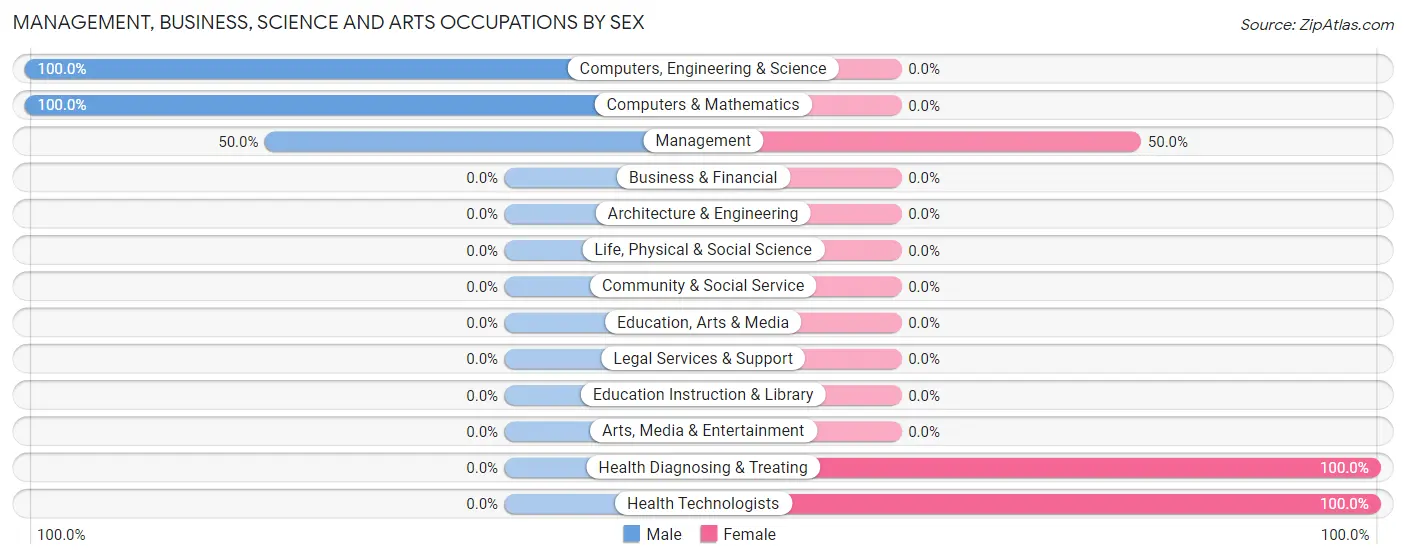
| Occupation | Male | Female |
| Management | 3 (50.0%) | 3 (50.0%) |
| Business & Financial | 0 (0.0%) | 0 (0.0%) |
| Computers, Engineering & Science | 30 (100.0%) | 0 (0.0%) |
| Computers & Mathematics | 30 (100.0%) | 0 (0.0%) |
| Architecture & Engineering | 0 (0.0%) | 0 (0.0%) |
| Life, Physical & Social Science | 0 (0.0%) | 0 (0.0%) |
| Community & Social Service | 0 (0.0%) | 0 (0.0%) |
| Education, Arts & Media | 0 (0.0%) | 0 (0.0%) |
| Legal Services & Support | 0 (0.0%) | 0 (0.0%) |
| Education Instruction & Library | 0 (0.0%) | 0 (0.0%) |
| Arts, Media & Entertainment | 0 (0.0%) | 0 (0.0%) |
| Health Diagnosing & Treating | 0 (0.0%) | 5 (100.0%) |
| Health Technologists | 0 (0.0%) | 5 (100.0%) |
| Total (Category) | 33 (80.5%) | 8 (19.5%) |
| Total (Overall) | 71 (61.7%) | 44 (38.3%) |
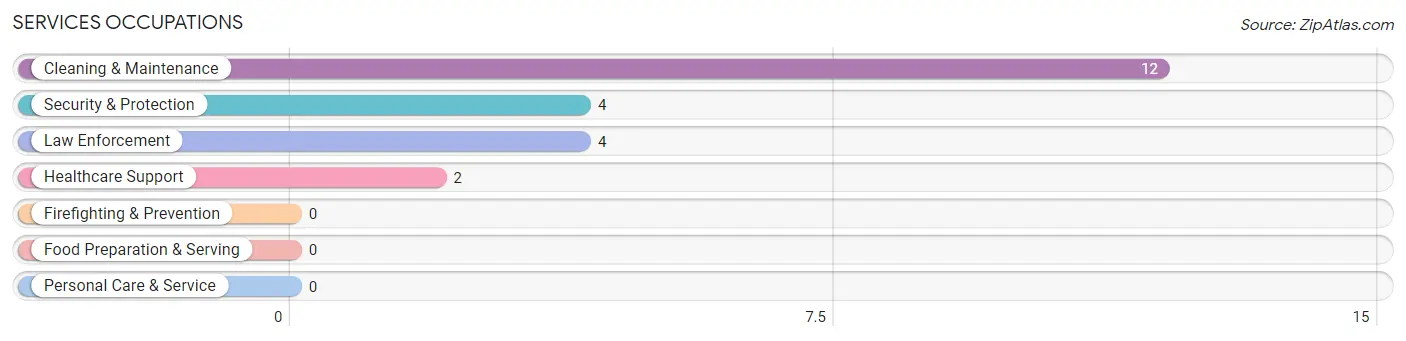
Services Occupations
The most common Services occupations in Avalon are Cleaning & Maintenance (12 | 10.4%), Security & Protection (4 | 3.5%), Law Enforcement (4 | 3.5%), and Healthcare Support (2 | 1.7%).
Services Occupations by Sex
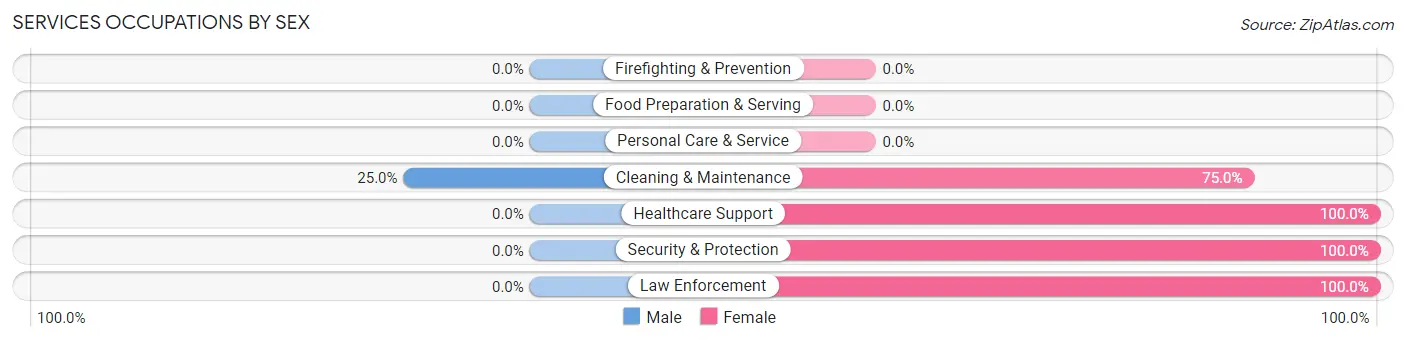
| Occupation | Male | Female |
| Healthcare Support | 0 (0.0%) | 2 (100.0%) |
| Security & Protection | 0 (0.0%) | 4 (100.0%) |
| Firefighting & Prevention | 0 (0.0%) | 0 (0.0%) |
| Law Enforcement | 0 (0.0%) | 4 (100.0%) |
| Food Preparation & Serving | 0 (0.0%) | 0 (0.0%) |
| Cleaning & Maintenance | 3 (25.0%) | 9 (75.0%) |
| Personal Care & Service | 0 (0.0%) | 0 (0.0%) |
| Total (Category) | 3 (16.7%) | 15 (83.3%) |
| Total (Overall) | 71 (61.7%) | 44 (38.3%) |
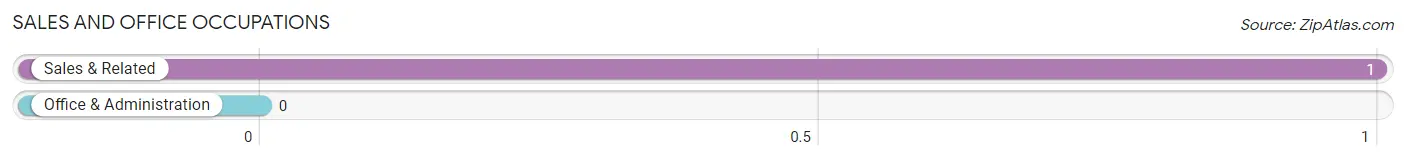
Sales and Office Occupations
The most common Sales and Office occupations in Avalon are , and Sales & Related (1 | 0.9%).
Sales and Office Occupations by Sex
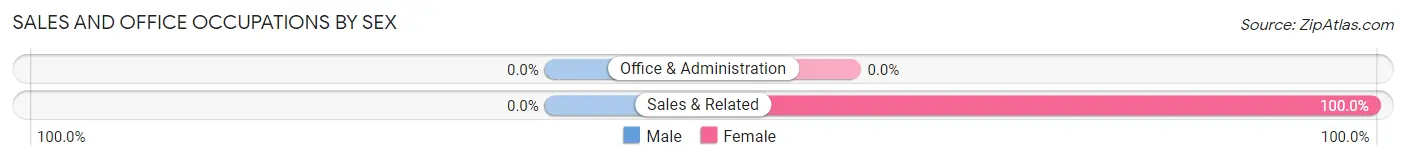
| Occupation | Male | Female |
| Sales & Related | 0 (0.0%) | 1 (100.0%) |
| Office & Administration | 0 (0.0%) | 0 (0.0%) |
| Total (Category) | 0 (0.0%) | 1 (100.0%) |
| Total (Overall) | 71 (61.7%) | 44 (38.3%) |
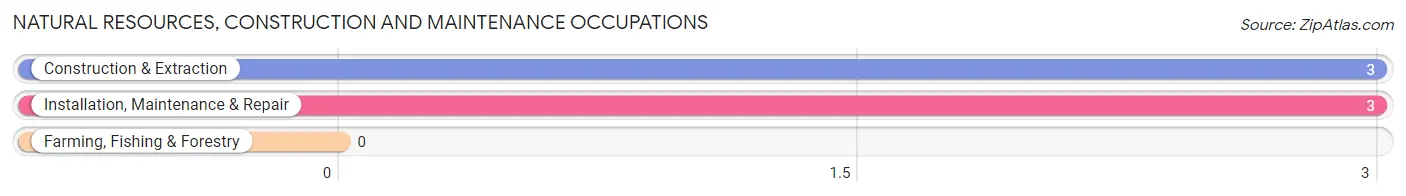
Natural Resources, Construction and Maintenance Occupations
The most common Natural Resources, Construction and Maintenance occupations in Avalon are Construction & Extraction (3 | 2.6%), and Installation, Maintenance & Repair (3 | 2.6%).
Natural Resources, Construction and Maintenance Occupations by Sex
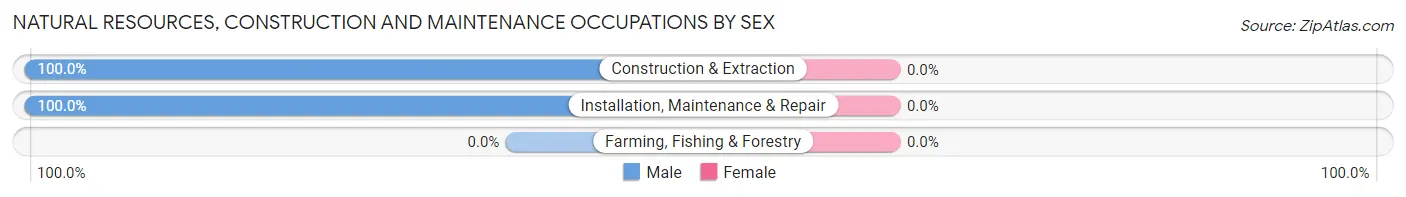
| Occupation | Male | Female |
| Farming, Fishing & Forestry | 0 (0.0%) | 0 (0.0%) |
| Construction & Extraction | 3 (100.0%) | 0 (0.0%) |
| Installation, Maintenance & Repair | 3 (100.0%) | 0 (0.0%) |
| Total (Category) | 6 (100.0%) | 0 (0.0%) |
| Total (Overall) | 71 (61.7%) | 44 (38.3%) |
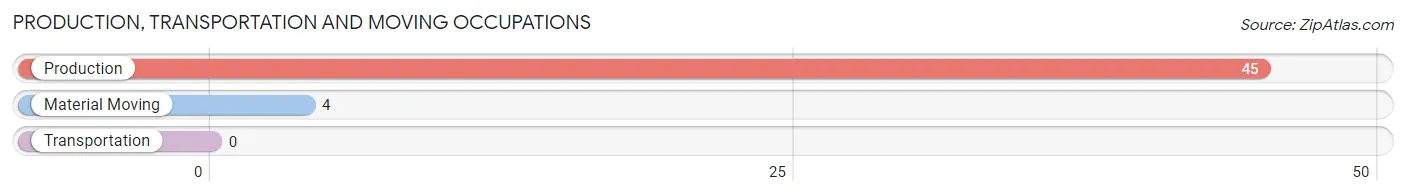
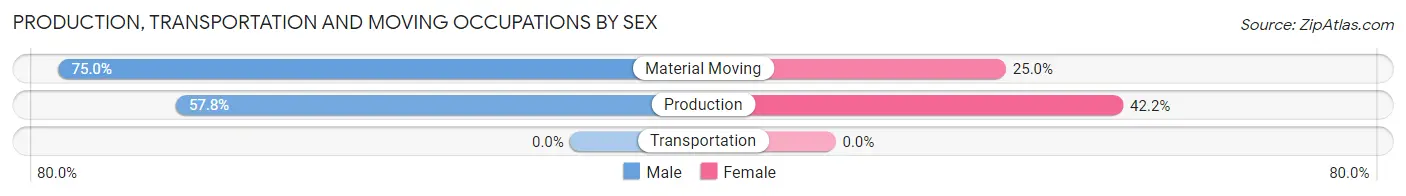
Production, Transportation and Moving Occupations
The most common Production, Transportation and Moving occupations in Avalon are Production (45 | 39.1%), and Material Moving (4 | 3.5%).
Production, Transportation and Moving Occupations by Sex
| Occupation | Male | Female |
| Production | 26 (57.8%) | 19 (42.2%) |
| Transportation | 0 (0.0%) | 0 (0.0%) |
| Material Moving | 3 (75.0%) | 1 (25.0%) |
| Total (Category) | 29 (59.2%) | 20 (40.8%) |
| Total (Overall) | 71 (61.7%) | 44 (38.3%) |
Employment Industries by Sex in Avalon
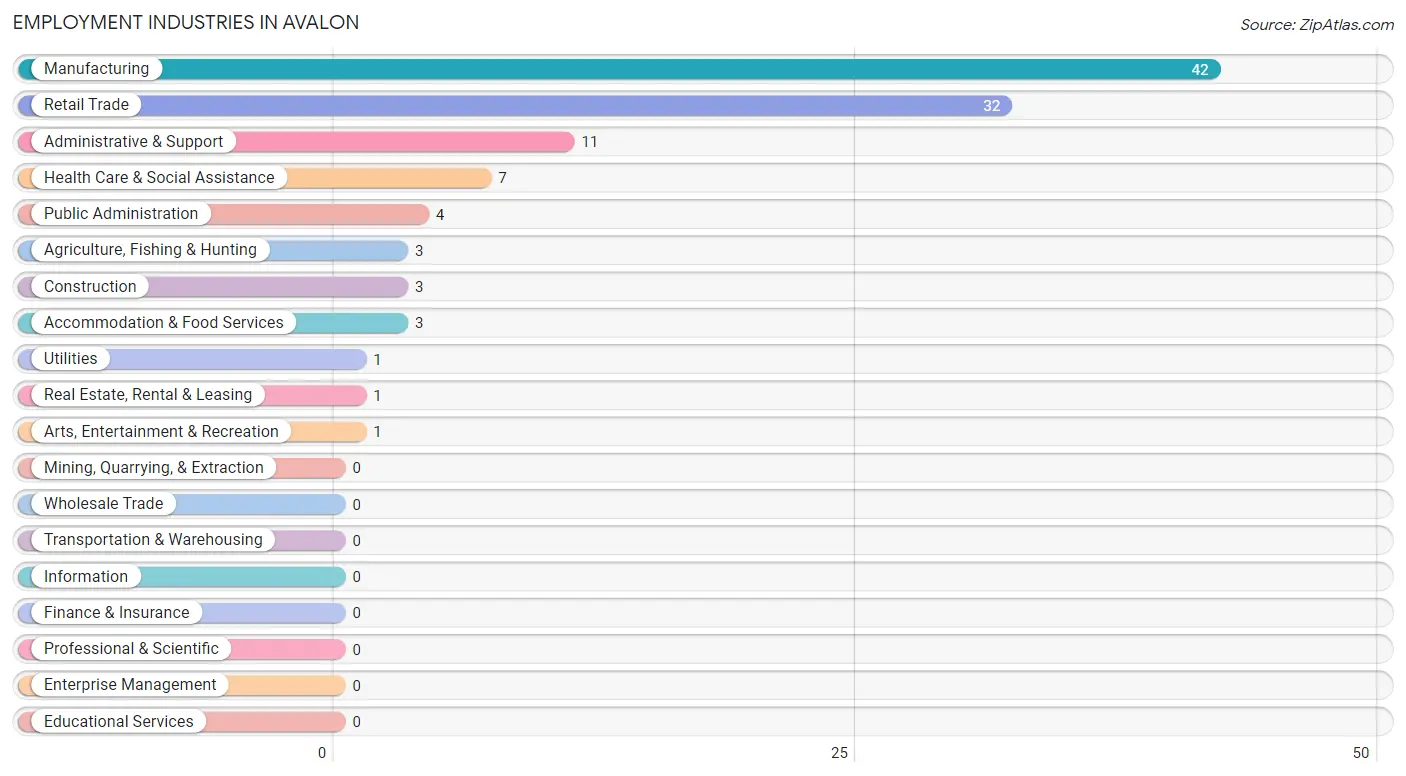
Employment Industries in Avalon
The major employment industries in Avalon include Manufacturing (42 | 36.5%), Retail Trade (32 | 27.8%), Administrative & Support (11 | 9.6%), Health Care & Social Assistance (7 | 6.1%), and Public Administration (4 | 3.5%).
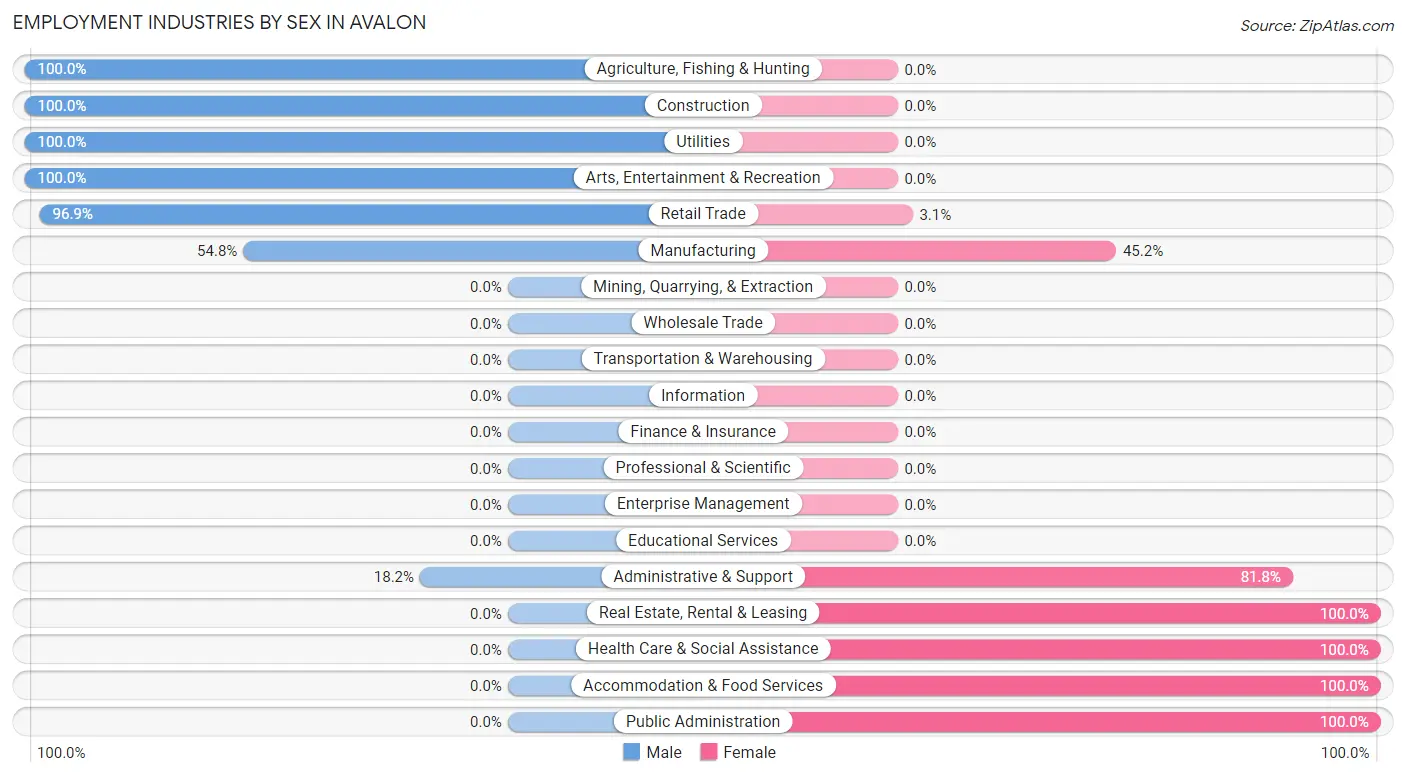
Employment Industries by Sex in Avalon
The Avalon industries that see more men than women are Agriculture, Fishing & Hunting (100.0%), Construction (100.0%), and Utilities (100.0%), whereas the industries that tend to have a higher number of women are Real Estate, Rental & Leasing (100.0%), Health Care & Social Assistance (100.0%), and Accommodation & Food Services (100.0%).
| Industry | Male | Female |
| Agriculture, Fishing & Hunting | 3 (100.0%) | 0 (0.0%) |
| Mining, Quarrying, & Extraction | 0 (0.0%) | 0 (0.0%) |
| Construction | 3 (100.0%) | 0 (0.0%) |
| Manufacturing | 23 (54.8%) | 19 (45.2%) |
| Wholesale Trade | 0 (0.0%) | 0 (0.0%) |
| Retail Trade | 31 (96.9%) | 1 (3.1%) |
| Transportation & Warehousing | 0 (0.0%) | 0 (0.0%) |
| Utilities | 1 (100.0%) | 0 (0.0%) |
| Information | 0 (0.0%) | 0 (0.0%) |
| Finance & Insurance | 0 (0.0%) | 0 (0.0%) |
| Real Estate, Rental & Leasing | 0 (0.0%) | 1 (100.0%) |
| Professional & Scientific | 0 (0.0%) | 0 (0.0%) |
| Enterprise Management | 0 (0.0%) | 0 (0.0%) |
| Administrative & Support | 2 (18.2%) | 9 (81.8%) |
| Educational Services | 0 (0.0%) | 0 (0.0%) |
| Health Care & Social Assistance | 0 (0.0%) | 7 (100.0%) |
| Arts, Entertainment & Recreation | 1 (100.0%) | 0 (0.0%) |
| Accommodation & Food Services | 0 (0.0%) | 3 (100.0%) |
| Public Administration | 0 (0.0%) | 4 (100.0%) |
| Total | 71 (61.7%) | 44 (38.3%) |
Education in Avalon
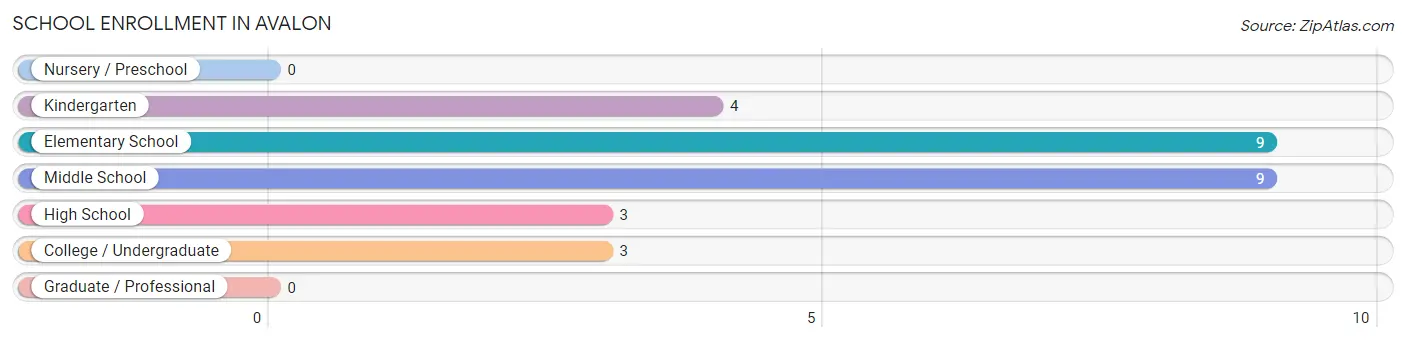
School Enrollment in Avalon
The most common levels of schooling among the 28 students in Avalon are elementary school (9 | 32.1%), middle school (9 | 32.1%), and kindergarten (4 | 14.3%).
| School Level | # Students | % Students |
| Nursery / Preschool | 0 | 0.0% |
| Kindergarten | 4 | 14.3% |
| Elementary School | 9 | 32.1% |
| Middle School | 9 | 32.1% |
| High School | 3 | 10.7% |
| College / Undergraduate | 3 | 10.7% |
| Graduate / Professional | 0 | 0.0% |
| Total | 28 | 100.0% |
School Enrollment by Age by Funding Source in Avalon
Out of a total of 28 students who are enrolled in schools in Avalon, 3 (10.7%) attend a private institution, while the remaining 25 (89.3%) are enrolled in public schools. The age group of 10 to 14 year olds has the highest likelihood of being enrolled in private schools, with 3 (27.3% in the age bracket) enrolled. Conversely, the age group of 5 to 9 year old has the lowest likelihood of being enrolled in a private school, with 12 (100.0% in the age bracket) attending a public institution.
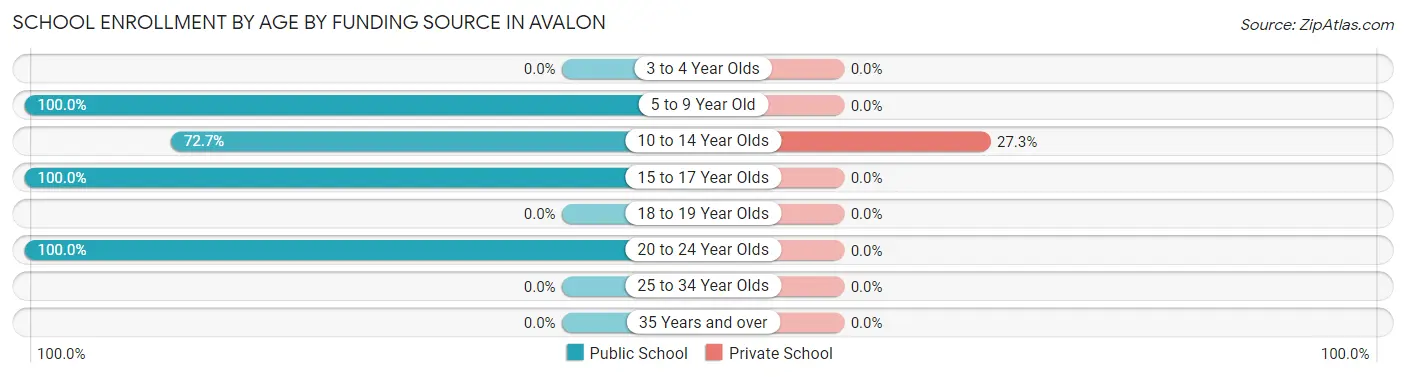
| Age Bracket | Public School | Private School |
| 3 to 4 Year Olds | 0 (0.0%) | 0 (0.0%) |
| 5 to 9 Year Old | 12 (100.0%) | 0 (0.0%) |
| 10 to 14 Year Olds | 8 (72.7%) | 3 (27.3%) |
| 15 to 17 Year Olds | 2 (100.0%) | 0 (0.0%) |
| 18 to 19 Year Olds | 0 (0.0%) | 0 (0.0%) |
| 20 to 24 Year Olds | 3 (100.0%) | 0 (0.0%) |
| 25 to 34 Year Olds | 0 (0.0%) | 0 (0.0%) |
| 35 Years and over | 0 (0.0%) | 0 (0.0%) |
| Total | 25 (89.3%) | 3 (10.7%) |
Educational Attainment by Field of Study in Avalon
Bio, nature & agricultural (6 | 37.5%), science & technology (4 | 25.0%), education (2 | 12.5%), visual & performing arts (2 | 12.5%), and computers & mathematics (1 | 6.2%) are the most common fields of study among 16 individuals in Avalon who have obtained a bachelor's degree or higher.
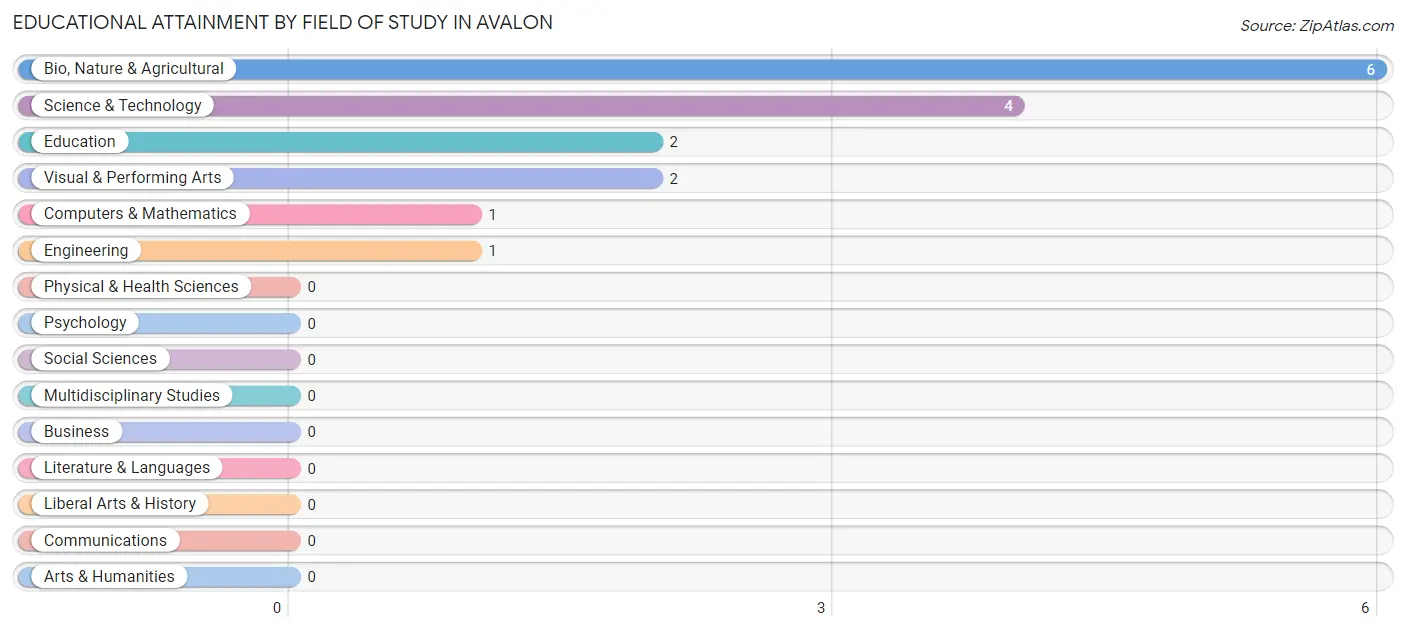
| Field of Study | # Graduates | % Graduates |
| Computers & Mathematics | 1 | 6.2% |
| Bio, Nature & Agricultural | 6 | 37.5% |
| Physical & Health Sciences | 0 | 0.0% |
| Psychology | 0 | 0.0% |
| Social Sciences | 0 | 0.0% |
| Engineering | 1 | 6.2% |
| Multidisciplinary Studies | 0 | 0.0% |
| Science & Technology | 4 | 25.0% |
| Business | 0 | 0.0% |
| Education | 2 | 12.5% |
| Literature & Languages | 0 | 0.0% |
| Liberal Arts & History | 0 | 0.0% |
| Visual & Performing Arts | 2 | 12.5% |
| Communications | 0 | 0.0% |
| Arts & Humanities | 0 | 0.0% |
| Total | 16 | 100.0% |
Transportation & Commute in Avalon
Vehicle Availability by Sex in Avalon
The most prevalent vehicle ownership categories in Avalon are males with 3 vehicles (44, accounting for 62.0%) and females with 3 vehicles (13, making up 100.0%).
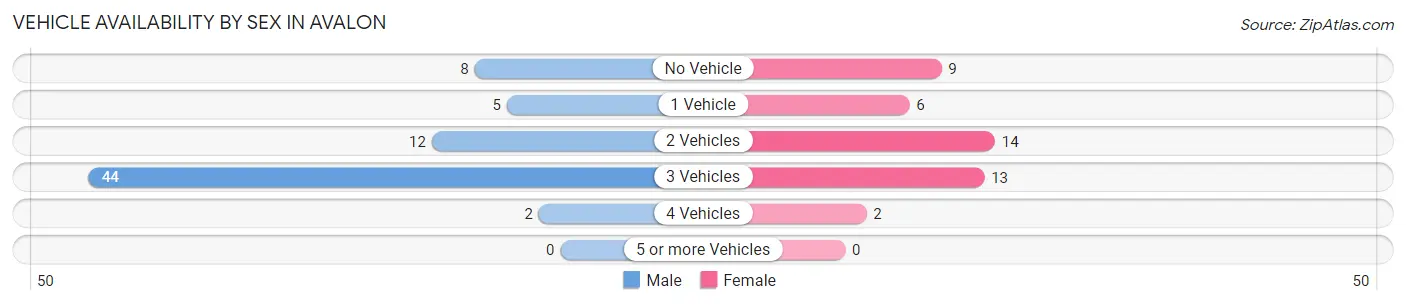
| Vehicles Available | Male | Female |
| No Vehicle | 8 (11.3%) | 9 (20.4%) |
| 1 Vehicle | 5 (7.0%) | 6 (13.6%) |
| 2 Vehicles | 12 (16.9%) | 14 (31.8%) |
| 3 Vehicles | 44 (62.0%) | 13 (29.5%) |
| 4 Vehicles | 2 (2.8%) | 2 (4.5%) |
| 5 or more Vehicles | 0 (0.0%) | 0 (0.0%) |
| Total | 71 (100.0%) | 44 (100.0%) |
Commute Time in Avalon
The most frequently occuring commute durations in Avalon are 10 to 14 minutes (48 commuters, 41.7%), 20 to 24 minutes (20 commuters, 17.4%), and 15 to 19 minutes (12 commuters, 10.4%).
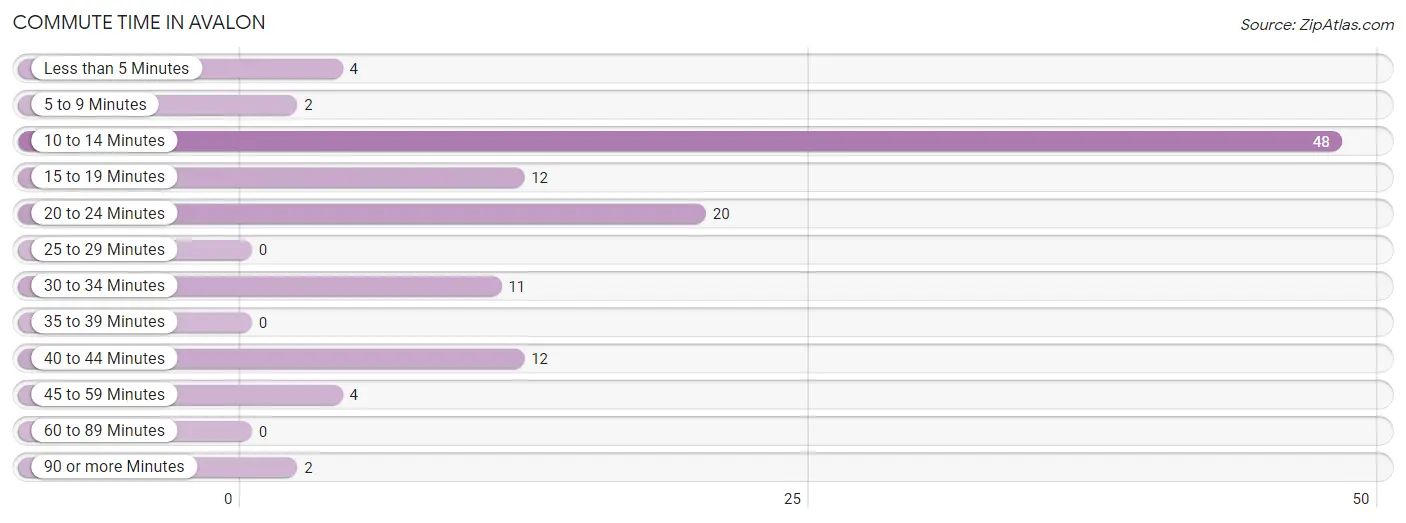
| Commute Time | # Commuters | % Commuters |
| Less than 5 Minutes | 4 | 3.5% |
| 5 to 9 Minutes | 2 | 1.7% |
| 10 to 14 Minutes | 48 | 41.7% |
| 15 to 19 Minutes | 12 | 10.4% |
| 20 to 24 Minutes | 20 | 17.4% |
| 25 to 29 Minutes | 0 | 0.0% |
| 30 to 34 Minutes | 11 | 9.6% |
| 35 to 39 Minutes | 0 | 0.0% |
| 40 to 44 Minutes | 12 | 10.4% |
| 45 to 59 Minutes | 4 | 3.5% |
| 60 to 89 Minutes | 0 | 0.0% |
| 90 or more Minutes | 2 | 1.7% |
Commute Time by Sex in Avalon
The most common commute times in Avalon are 10 to 14 minutes (31 commuters, 43.7%) for males and 20 to 24 minutes (18 commuters, 40.9%) for females.
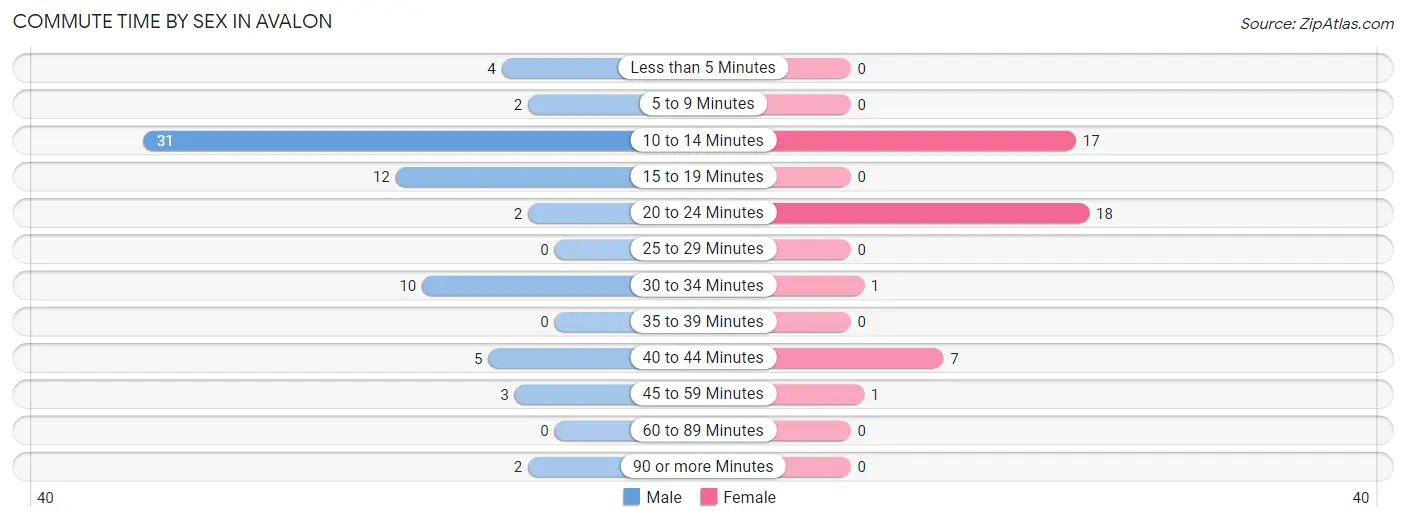
| Commute Time | Male | Female |
| Less than 5 Minutes | 4 (5.6%) | 0 (0.0%) |
| 5 to 9 Minutes | 2 (2.8%) | 0 (0.0%) |
| 10 to 14 Minutes | 31 (43.7%) | 17 (38.6%) |
| 15 to 19 Minutes | 12 (16.9%) | 0 (0.0%) |
| 20 to 24 Minutes | 2 (2.8%) | 18 (40.9%) |
| 25 to 29 Minutes | 0 (0.0%) | 0 (0.0%) |
| 30 to 34 Minutes | 10 (14.1%) | 1 (2.3%) |
| 35 to 39 Minutes | 0 (0.0%) | 0 (0.0%) |
| 40 to 44 Minutes | 5 (7.0%) | 7 (15.9%) |
| 45 to 59 Minutes | 3 (4.2%) | 1 (2.3%) |
| 60 to 89 Minutes | 0 (0.0%) | 0 (0.0%) |
| 90 or more Minutes | 2 (2.8%) | 0 (0.0%) |
Time of Departure to Work by Sex in Avalon
The most frequent times of departure to work in Avalon are 7:00 AM to 7:29 AM (36, 50.7%) for males and 6:30 AM to 6:59 AM (13, 29.5%) for females.
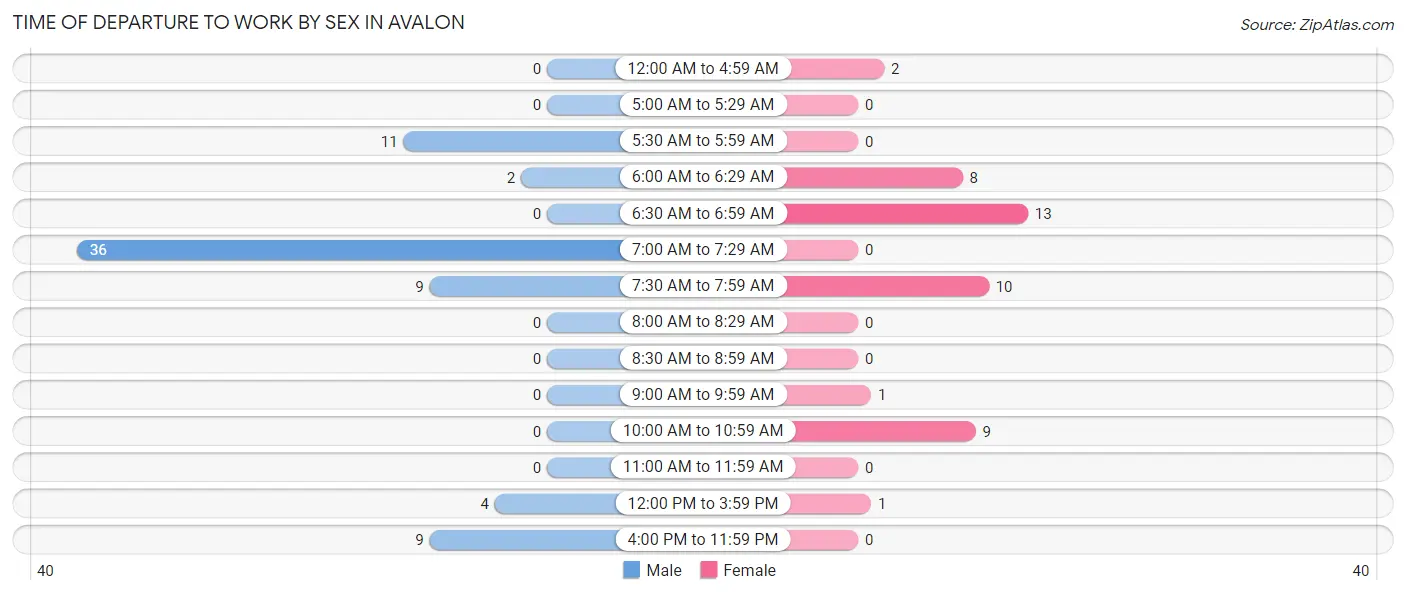
| Time of Departure | Male | Female |
| 12:00 AM to 4:59 AM | 0 (0.0%) | 2 (4.5%) |
| 5:00 AM to 5:29 AM | 0 (0.0%) | 0 (0.0%) |
| 5:30 AM to 5:59 AM | 11 (15.5%) | 0 (0.0%) |
| 6:00 AM to 6:29 AM | 2 (2.8%) | 8 (18.2%) |
| 6:30 AM to 6:59 AM | 0 (0.0%) | 13 (29.5%) |
| 7:00 AM to 7:29 AM | 36 (50.7%) | 0 (0.0%) |
| 7:30 AM to 7:59 AM | 9 (12.7%) | 10 (22.7%) |
| 8:00 AM to 8:29 AM | 0 (0.0%) | 0 (0.0%) |
| 8:30 AM to 8:59 AM | 0 (0.0%) | 0 (0.0%) |
| 9:00 AM to 9:59 AM | 0 (0.0%) | 1 (2.3%) |
| 10:00 AM to 10:59 AM | 0 (0.0%) | 9 (20.4%) |
| 11:00 AM to 11:59 AM | 0 (0.0%) | 0 (0.0%) |
| 12:00 PM to 3:59 PM | 4 (5.6%) | 1 (2.3%) |
| 4:00 PM to 11:59 PM | 9 (12.7%) | 0 (0.0%) |
| Total | 71 (100.0%) | 44 (100.0%) |
Housing Occupancy in Avalon
Occupancy by Ownership in Avalon
Of the total 111 dwellings in Avalon, owner-occupied units account for 56 (50.4%), while renter-occupied units make up 55 (49.5%).
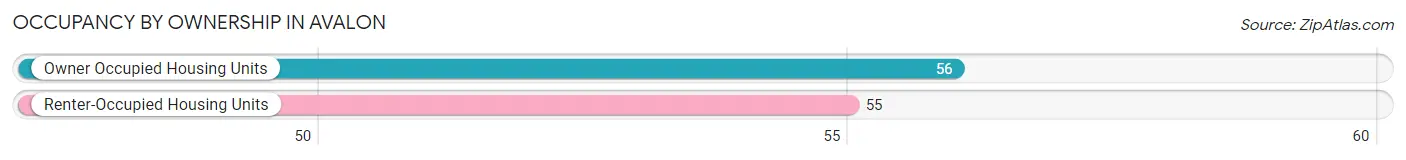
| Occupancy | # Housing Units | % Housing Units |
| Owner Occupied Housing Units | 56 | 50.4% |
| Renter-Occupied Housing Units | 55 | 49.5% |
| Total Occupied Housing Units | 111 | 100.0% |
Occupancy by Household Size in Avalon
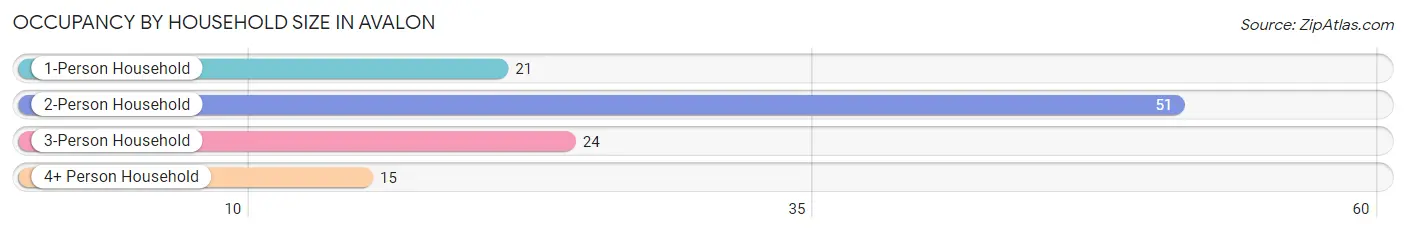
| Household Size | # Housing Units | % Housing Units |
| 1-Person Household | 21 | 18.9% |
| 2-Person Household | 51 | 46.0% |
| 3-Person Household | 24 | 21.6% |
| 4+ Person Household | 15 | 13.5% |
| Total Housing Units | 111 | 100.0% |
Occupancy by Ownership by Household Size in Avalon
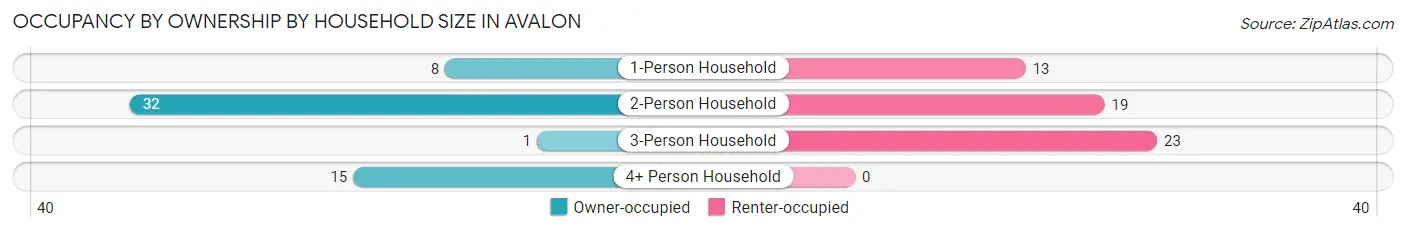
| Household Size | Owner-occupied | Renter-occupied |
| 1-Person Household | 8 (38.1%) | 13 (61.9%) |
| 2-Person Household | 32 (62.7%) | 19 (37.2%) |
| 3-Person Household | 1 (4.2%) | 23 (95.8%) |
| 4+ Person Household | 15 (100.0%) | 0 (0.0%) |
| Total Housing Units | 56 (50.4%) | 55 (49.5%) |
Occupancy by Educational Attainment in Avalon
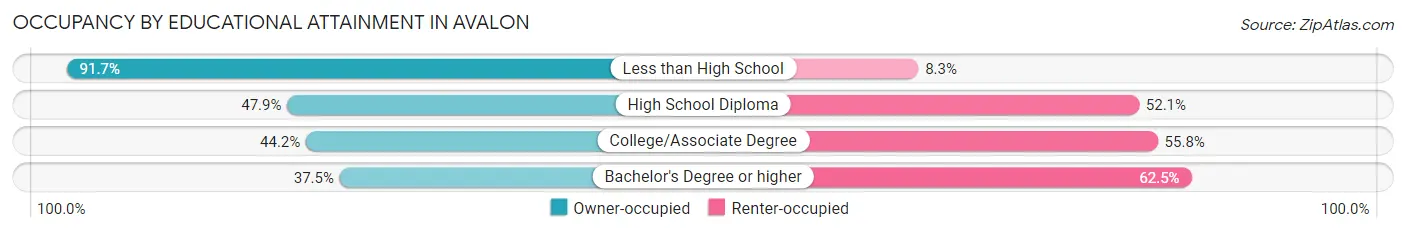
| Household Size | Owner-occupied | Renter-occupied |
| Less than High School | 11 (91.7%) | 1 (8.3%) |
| High School Diploma | 23 (47.9%) | 25 (52.1%) |
| College/Associate Degree | 19 (44.2%) | 24 (55.8%) |
| Bachelor's Degree or higher | 3 (37.5%) | 5 (62.5%) |
Occupancy by Age of Householder in Avalon
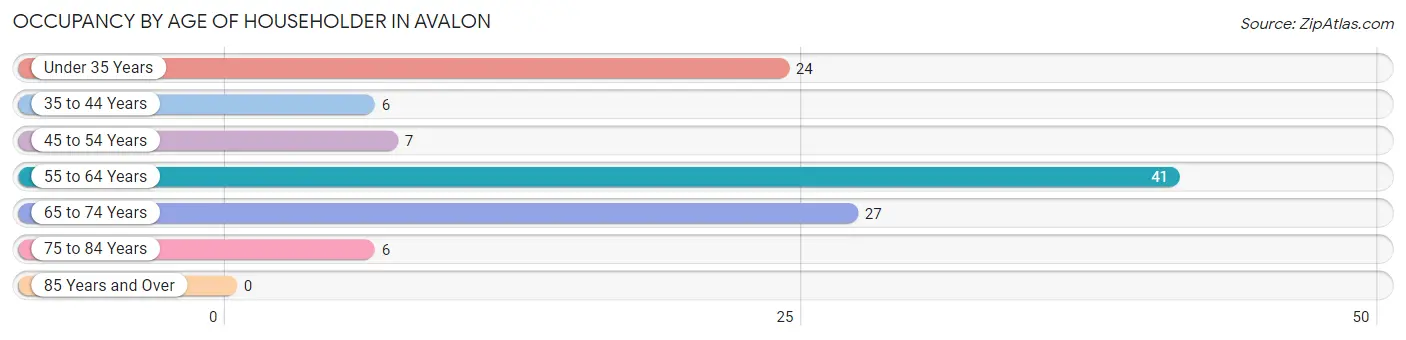
| Age Bracket | # Households | % Households |
| Under 35 Years | 24 | 21.6% |
| 35 to 44 Years | 6 | 5.4% |
| 45 to 54 Years | 7 | 6.3% |
| 55 to 64 Years | 41 | 36.9% |
| 65 to 74 Years | 27 | 24.3% |
| 75 to 84 Years | 6 | 5.4% |
| 85 Years and Over | 0 | 0.0% |
| Total | 111 | 100.0% |
Housing Finances in Avalon
Median Income by Occupancy in Avalon
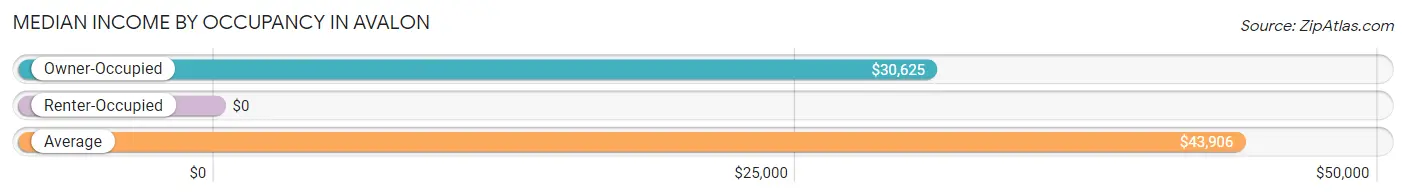
| Occupancy Type | # Households | Median Income |
| Owner-Occupied | 56 (50.4%) | $30,625 |
| Renter-Occupied | 55 (49.5%) | $0 |
| Average | 111 (100.0%) | $43,906 |
Occupancy by Householder Income Bracket in Avalon
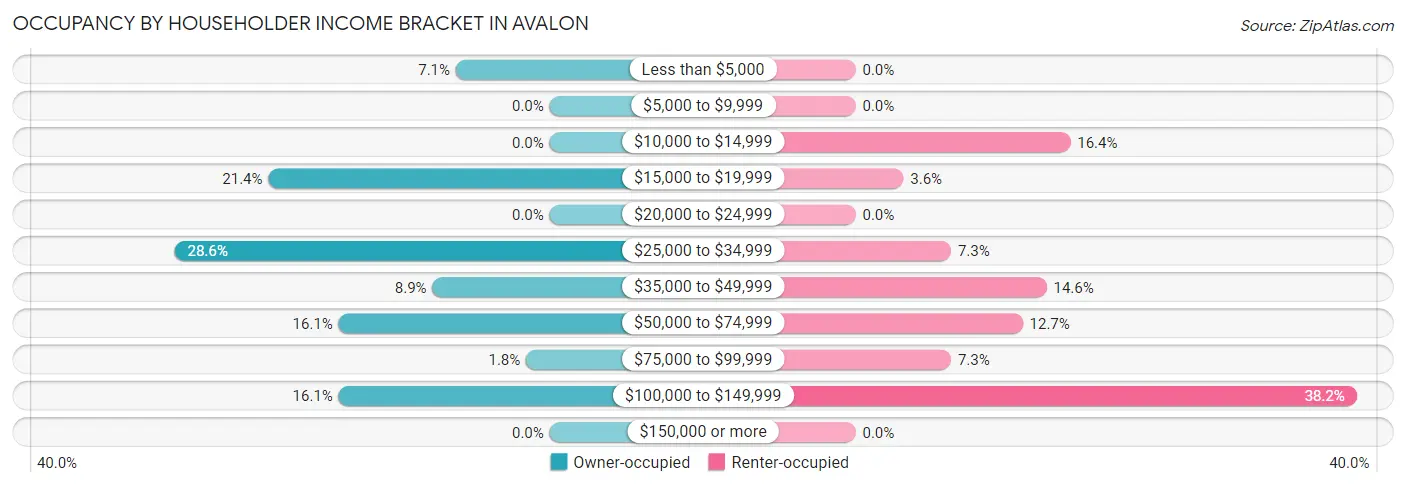
| Income Bracket | Owner-occupied | Renter-occupied |
| Less than $5,000 | 4 (7.1%) | 0 (0.0%) |
| $5,000 to $9,999 | 0 (0.0%) | 0 (0.0%) |
| $10,000 to $14,999 | 0 (0.0%) | 9 (16.4%) |
| $15,000 to $19,999 | 12 (21.4%) | 2 (3.6%) |
| $20,000 to $24,999 | 0 (0.0%) | 0 (0.0%) |
| $25,000 to $34,999 | 16 (28.6%) | 4 (7.3%) |
| $35,000 to $49,999 | 5 (8.9%) | 8 (14.5%) |
| $50,000 to $74,999 | 9 (16.1%) | 7 (12.7%) |
| $75,000 to $99,999 | 1 (1.8%) | 4 (7.3%) |
| $100,000 to $149,999 | 9 (16.1%) | 21 (38.2%) |
| $150,000 or more | 0 (0.0%) | 0 (0.0%) |
| Total | 56 (100.0%) | 55 (100.0%) |
Monthly Housing Cost Tiers in Avalon
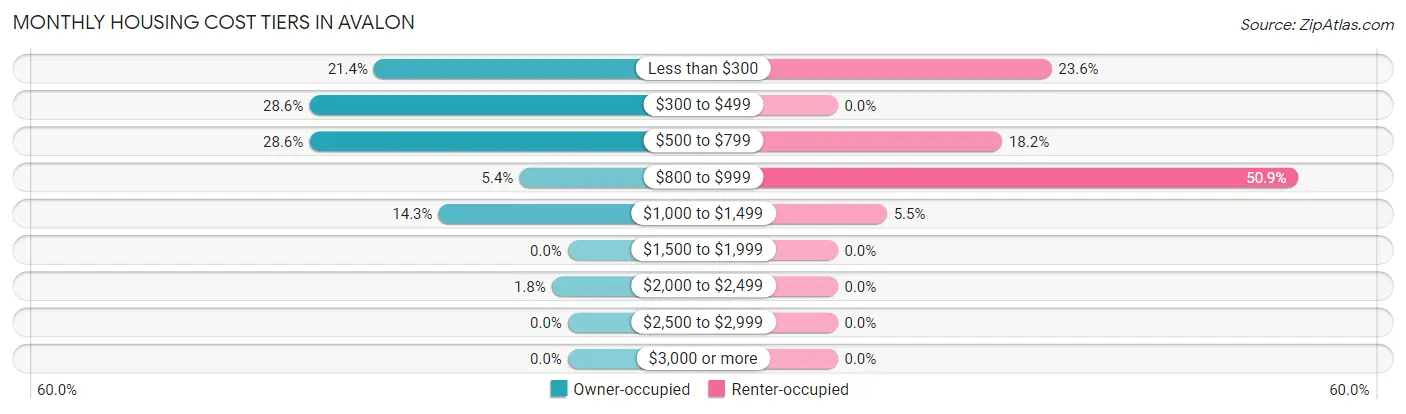
| Monthly Cost | Owner-occupied | Renter-occupied |
| Less than $300 | 12 (21.4%) | 13 (23.6%) |
| $300 to $499 | 16 (28.6%) | 0 (0.0%) |
| $500 to $799 | 16 (28.6%) | 10 (18.2%) |
| $800 to $999 | 3 (5.4%) | 28 (50.9%) |
| $1,000 to $1,499 | 8 (14.3%) | 3 (5.4%) |
| $1,500 to $1,999 | 0 (0.0%) | 0 (0.0%) |
| $2,000 to $2,499 | 1 (1.8%) | 0 (0.0%) |
| $2,500 to $2,999 | 0 (0.0%) | 0 (0.0%) |
| $3,000 or more | 0 (0.0%) | 0 (0.0%) |
| Total | 56 (100.0%) | 55 (100.0%) |
Physical Housing Characteristics in Avalon
Housing Structures in Avalon
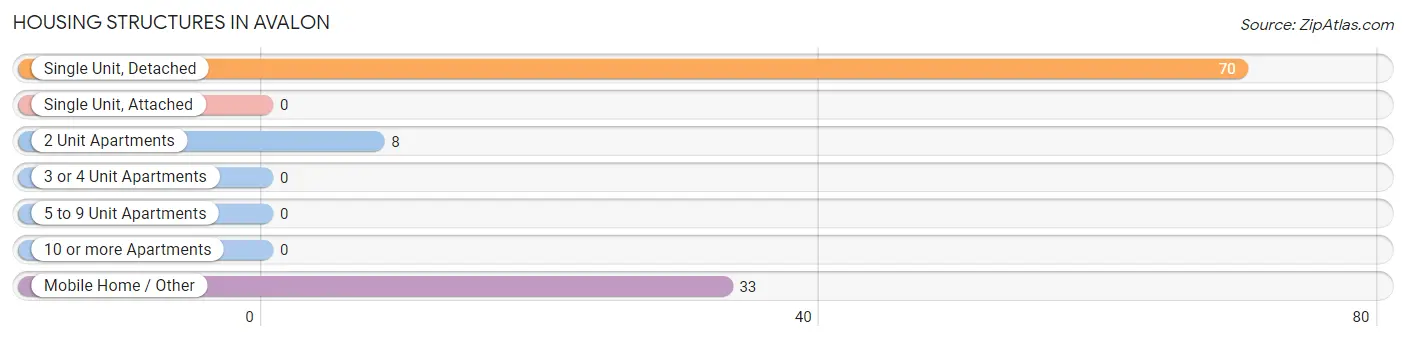
| Structure Type | # Housing Units | % Housing Units |
| Single Unit, Detached | 70 | 63.1% |
| Single Unit, Attached | 0 | 0.0% |
| 2 Unit Apartments | 8 | 7.2% |
| 3 or 4 Unit Apartments | 0 | 0.0% |
| 5 to 9 Unit Apartments | 0 | 0.0% |
| 10 or more Apartments | 0 | 0.0% |
| Mobile Home / Other | 33 | 29.7% |
| Total | 111 | 100.0% |
Housing Structures by Occupancy in Avalon
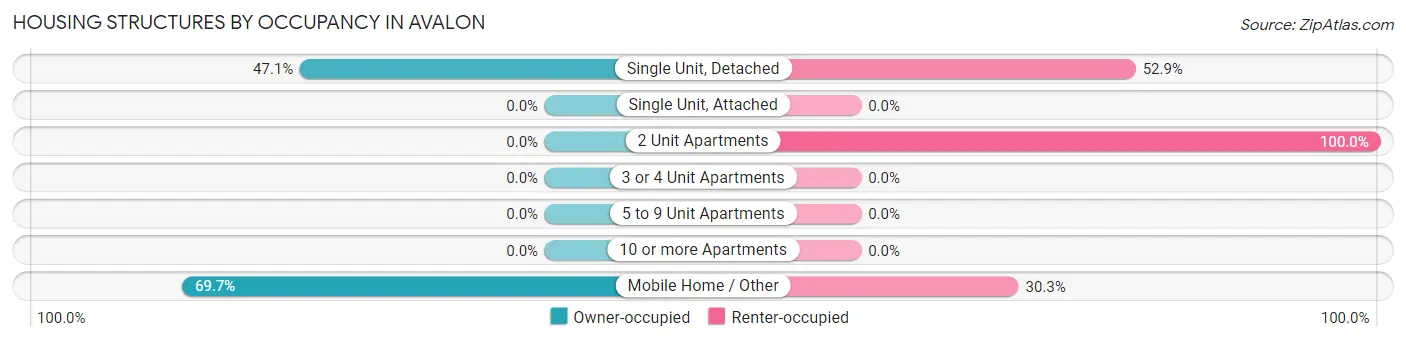
| Structure Type | Owner-occupied | Renter-occupied |
| Single Unit, Detached | 33 (47.1%) | 37 (52.9%) |
| Single Unit, Attached | 0 (0.0%) | 0 (0.0%) |
| 2 Unit Apartments | 0 (0.0%) | 8 (100.0%) |
| 3 or 4 Unit Apartments | 0 (0.0%) | 0 (0.0%) |
| 5 to 9 Unit Apartments | 0 (0.0%) | 0 (0.0%) |
| 10 or more Apartments | 0 (0.0%) | 0 (0.0%) |
| Mobile Home / Other | 23 (69.7%) | 10 (30.3%) |
| Total | 56 (50.4%) | 55 (49.5%) |
Housing Structures by Number of Rooms in Avalon
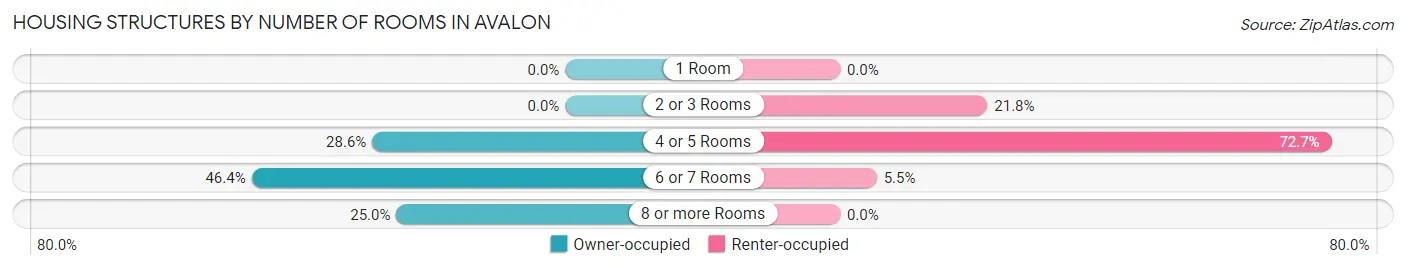
| Number of Rooms | Owner-occupied | Renter-occupied |
| 1 Room | 0 (0.0%) | 0 (0.0%) |
| 2 or 3 Rooms | 0 (0.0%) | 12 (21.8%) |
| 4 or 5 Rooms | 16 (28.6%) | 40 (72.7%) |
| 6 or 7 Rooms | 26 (46.4%) | 3 (5.4%) |
| 8 or more Rooms | 14 (25.0%) | 0 (0.0%) |
| Total | 56 (100.0%) | 55 (100.0%) |
Housing Structure by Heating Type in Avalon
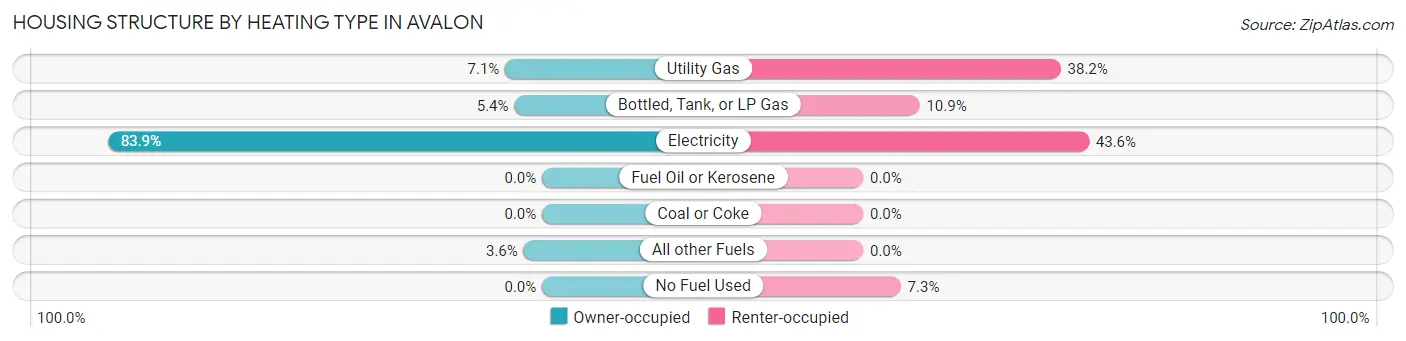
| Heating Type | Owner-occupied | Renter-occupied |
| Utility Gas | 4 (7.1%) | 21 (38.2%) |
| Bottled, Tank, or LP Gas | 3 (5.4%) | 6 (10.9%) |
| Electricity | 47 (83.9%) | 24 (43.6%) |
| Fuel Oil or Kerosene | 0 (0.0%) | 0 (0.0%) |
| Coal or Coke | 0 (0.0%) | 0 (0.0%) |
| All other Fuels | 2 (3.6%) | 0 (0.0%) |
| No Fuel Used | 0 (0.0%) | 4 (7.3%) |
| Total | 56 (100.0%) | 55 (100.0%) |
Household Vehicle Usage in Avalon
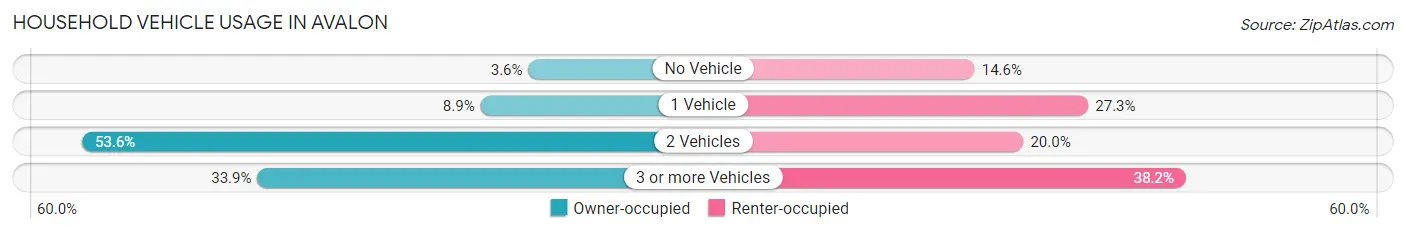
| Vehicles per Household | Owner-occupied | Renter-occupied |
| No Vehicle | 2 (3.6%) | 8 (14.5%) |
| 1 Vehicle | 5 (8.9%) | 15 (27.3%) |
| 2 Vehicles | 30 (53.6%) | 11 (20.0%) |
| 3 or more Vehicles | 19 (33.9%) | 21 (38.2%) |
| Total | 56 (100.0%) | 55 (100.0%) |
Real Estate & Mortgages in Avalon
Real Estate and Mortgage Overview in Avalon
| Characteristic | Without Mortgage | With Mortgage |
| Housing Units | 41 | 15 |
| Median Property Value | $187,500 | $151,800 |
| Median Household Income | $27,083 | $0 |
| Monthly Housing Costs | $388 | $0 |
| Real Estate Taxes | $700 | $1 |
Property Value by Mortgage Status in Avalon
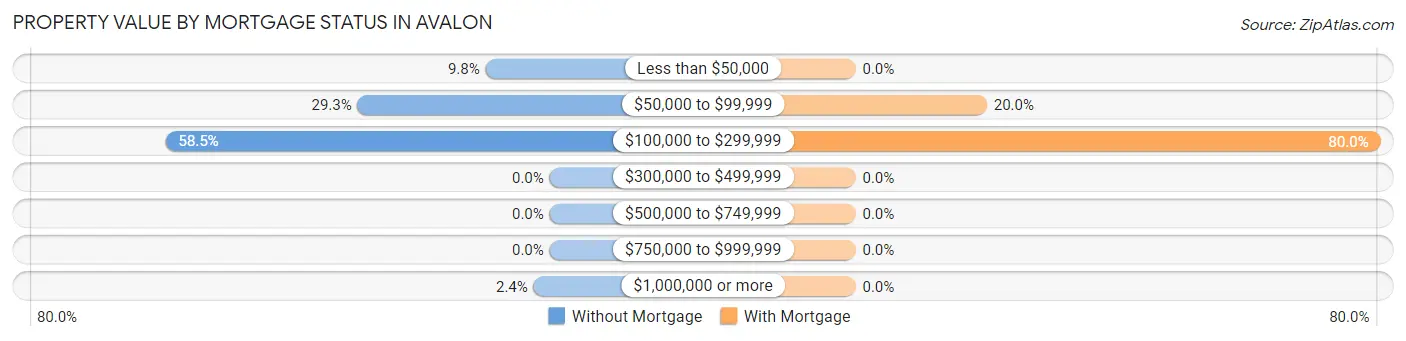
| Property Value | Without Mortgage | With Mortgage |
| Less than $50,000 | 4 (9.8%) | 0 (0.0%) |
| $50,000 to $99,999 | 12 (29.3%) | 3 (20.0%) |
| $100,000 to $299,999 | 24 (58.5%) | 12 (80.0%) |
| $300,000 to $499,999 | 0 (0.0%) | 0 (0.0%) |
| $500,000 to $749,999 | 0 (0.0%) | 0 (0.0%) |
| $750,000 to $999,999 | 0 (0.0%) | 0 (0.0%) |
| $1,000,000 or more | 1 (2.4%) | 0 (0.0%) |
| Total | 41 (100.0%) | 15 (100.0%) |
Household Income by Mortgage Status in Avalon
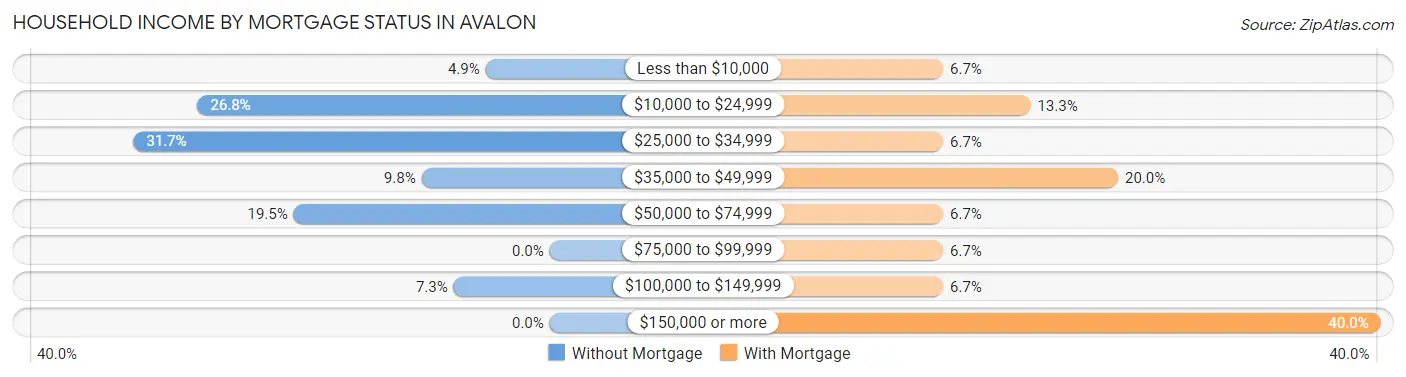
| Household Income | Without Mortgage | With Mortgage |
| Less than $10,000 | 2 (4.9%) | 1 (6.7%) |
| $10,000 to $24,999 | 11 (26.8%) | 2 (13.3%) |
| $25,000 to $34,999 | 13 (31.7%) | 1 (6.7%) |
| $35,000 to $49,999 | 4 (9.8%) | 3 (20.0%) |
| $50,000 to $74,999 | 8 (19.5%) | 1 (6.7%) |
| $75,000 to $99,999 | 0 (0.0%) | 1 (6.7%) |
| $100,000 to $149,999 | 3 (7.3%) | 1 (6.7%) |
| $150,000 or more | 0 (0.0%) | 6 (40.0%) |
| Total | 41 (100.0%) | 15 (100.0%) |
Property Value to Household Income Ratio in Avalon
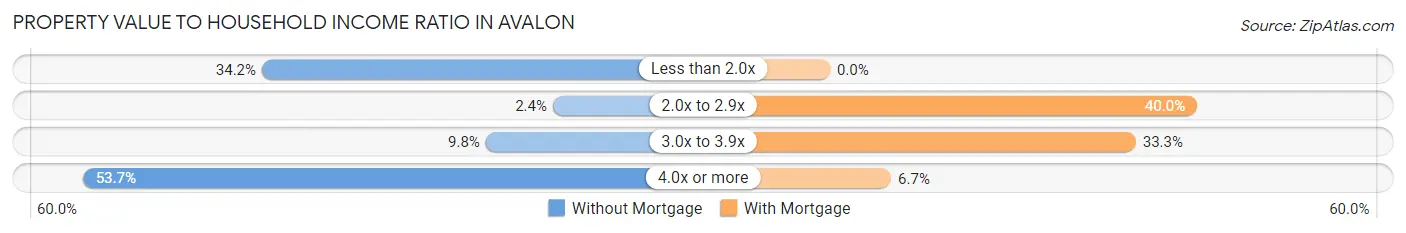
| Value-to-Income Ratio | Without Mortgage | With Mortgage |
| Less than 2.0x | 14 (34.2%) | 0 (0.0%) |
| 2.0x to 2.9x | 1 (2.4%) | 6 (40.0%) |
| 3.0x to 3.9x | 4 (9.8%) | 5 (33.3%) |
| 4.0x or more | 22 (53.7%) | 1 (6.7%) |
| Total | 41 (100.0%) | 15 (100.0%) |
Real Estate Taxes by Mortgage Status in Avalon
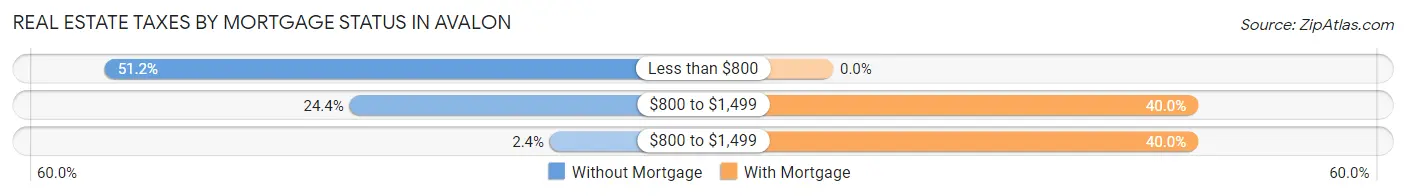
| Property Taxes | Without Mortgage | With Mortgage |
| Less than $800 | 21 (51.2%) | 0 (0.0%) |
| $800 to $1,499 | 10 (24.4%) | 6 (40.0%) |
| $800 to $1,499 | 1 (2.4%) | 6 (40.0%) |
| Total | 41 (100.0%) | 15 (100.0%) |
Health & Disability in Avalon
Health Insurance Coverage by Age in Avalon
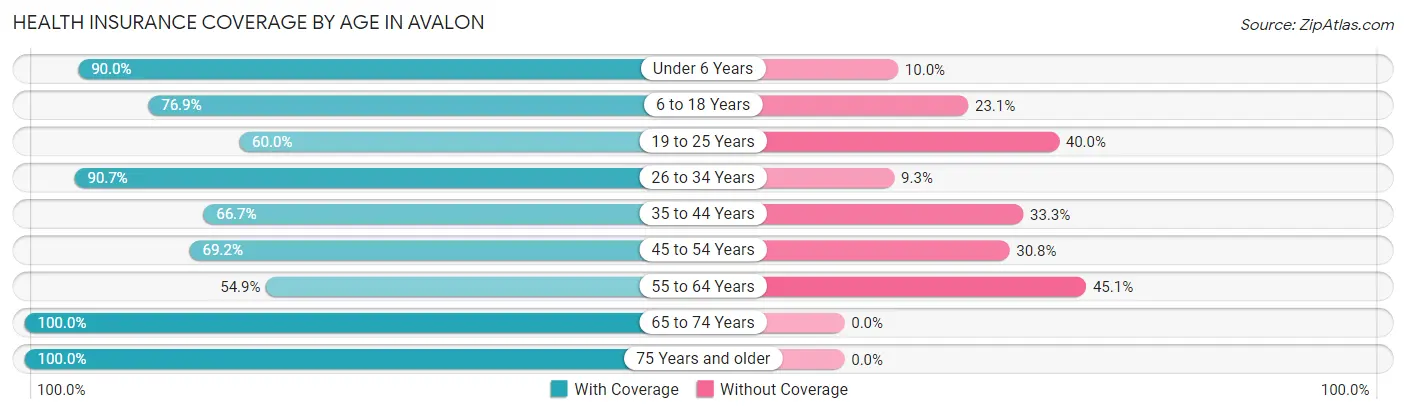
| Age Bracket | With Coverage | Without Coverage |
| Under 6 Years | 9 (90.0%) | 1 (10.0%) |
| 6 to 18 Years | 20 (76.9%) | 6 (23.1%) |
| 19 to 25 Years | 3 (60.0%) | 2 (40.0%) |
| 26 to 34 Years | 78 (90.7%) | 8 (9.3%) |
| 35 to 44 Years | 6 (66.7%) | 3 (33.3%) |
| 45 to 54 Years | 18 (69.2%) | 8 (30.8%) |
| 55 to 64 Years | 39 (54.9%) | 32 (45.1%) |
| 65 to 74 Years | 42 (100.0%) | 0 (0.0%) |
| 75 Years and older | 10 (100.0%) | 0 (0.0%) |
| Total | 225 (78.9%) | 60 (21.0%) |
Health Insurance Coverage by Citizenship Status in Avalon
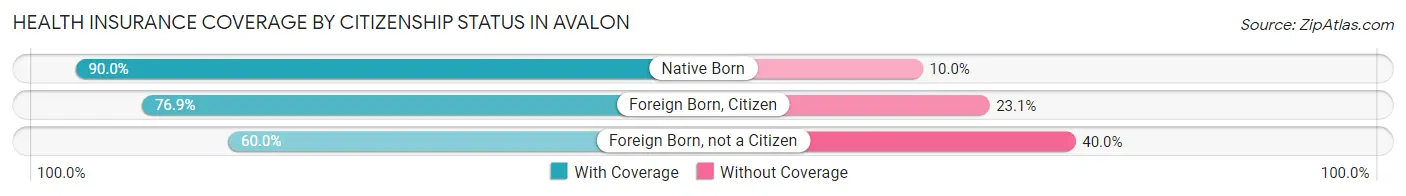
| Citizenship Status | With Coverage | Without Coverage |
| Native Born | 9 (90.0%) | 1 (10.0%) |
| Foreign Born, Citizen | 20 (76.9%) | 6 (23.1%) |
| Foreign Born, not a Citizen | 3 (60.0%) | 2 (40.0%) |
Health Insurance Coverage by Household Income in Avalon
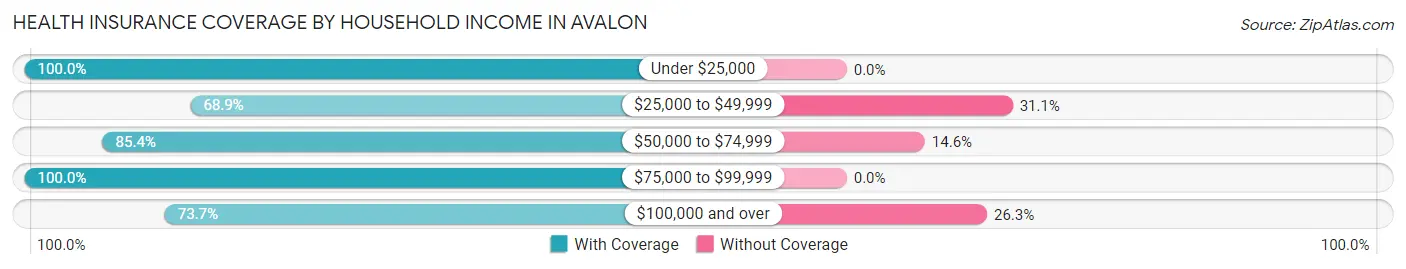
| Household Income | With Coverage | Without Coverage |
| Under $25,000 | 38 (100.0%) | 0 (0.0%) |
| $25,000 to $49,999 | 51 (68.9%) | 23 (31.1%) |
| $50,000 to $74,999 | 35 (85.4%) | 6 (14.6%) |
| $75,000 to $99,999 | 14 (100.0%) | 0 (0.0%) |
| $100,000 and over | 87 (73.7%) | 31 (26.3%) |
Public vs Private Health Insurance Coverage by Age in Avalon
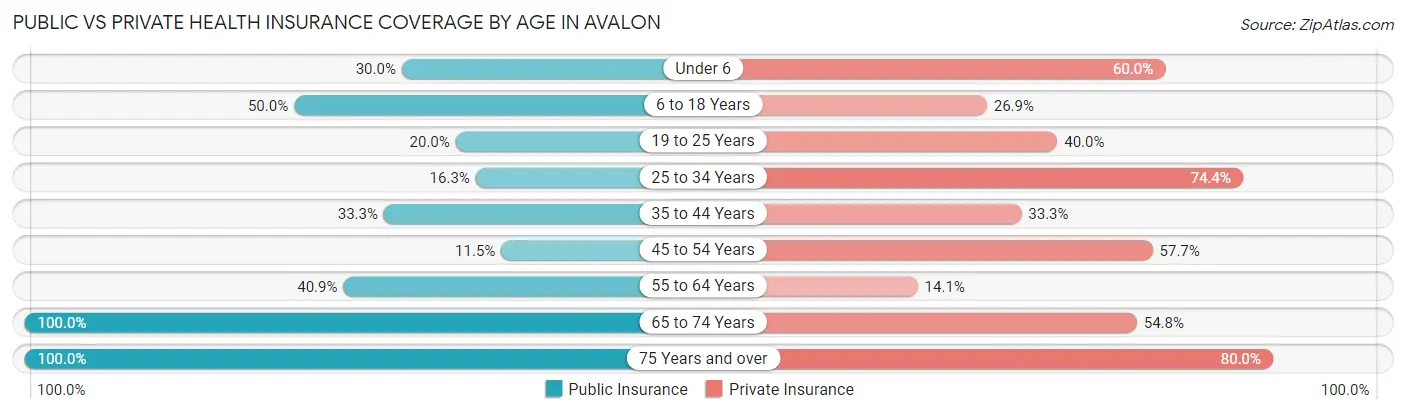
| Age Bracket | Public Insurance | Private Insurance |
| Under 6 | 3 (30.0%) | 6 (60.0%) |
| 6 to 18 Years | 13 (50.0%) | 7 (26.9%) |
| 19 to 25 Years | 1 (20.0%) | 2 (40.0%) |
| 25 to 34 Years | 14 (16.3%) | 64 (74.4%) |
| 35 to 44 Years | 3 (33.3%) | 3 (33.3%) |
| 45 to 54 Years | 3 (11.5%) | 15 (57.7%) |
| 55 to 64 Years | 29 (40.8%) | 10 (14.1%) |
| 65 to 74 Years | 42 (100.0%) | 23 (54.8%) |
| 75 Years and over | 10 (100.0%) | 8 (80.0%) |
| Total | 118 (41.4%) | 138 (48.4%) |
Disability Status by Sex by Age in Avalon
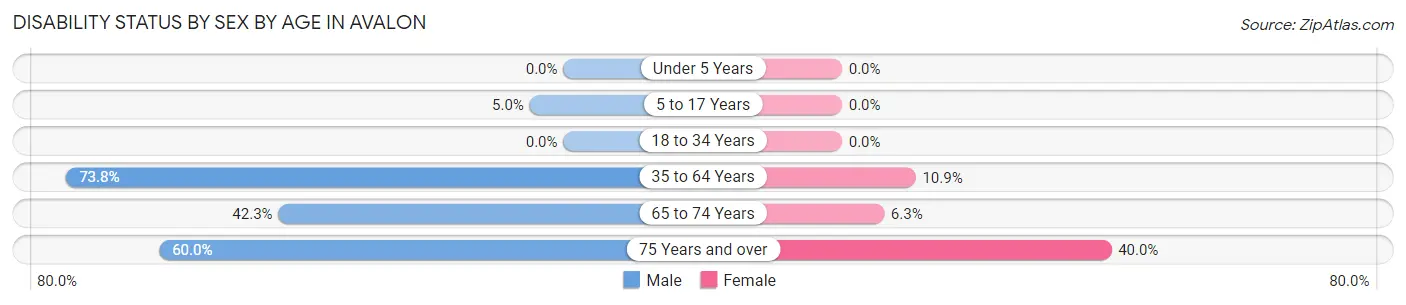
| Age Bracket | Male | Female |
| Under 5 Years | 0 (0.0%) | 0 (0.0%) |
| 5 to 17 Years | 1 (5.0%) | 0 (0.0%) |
| 18 to 34 Years | 0 (0.0%) | 0 (0.0%) |
| 35 to 64 Years | 31 (73.8%) | 7 (10.9%) |
| 65 to 74 Years | 11 (42.3%) | 1 (6.2%) |
| 75 Years and over | 3 (60.0%) | 2 (40.0%) |
Disability Class by Sex by Age in Avalon
Disability Class: Hearing Difficulty
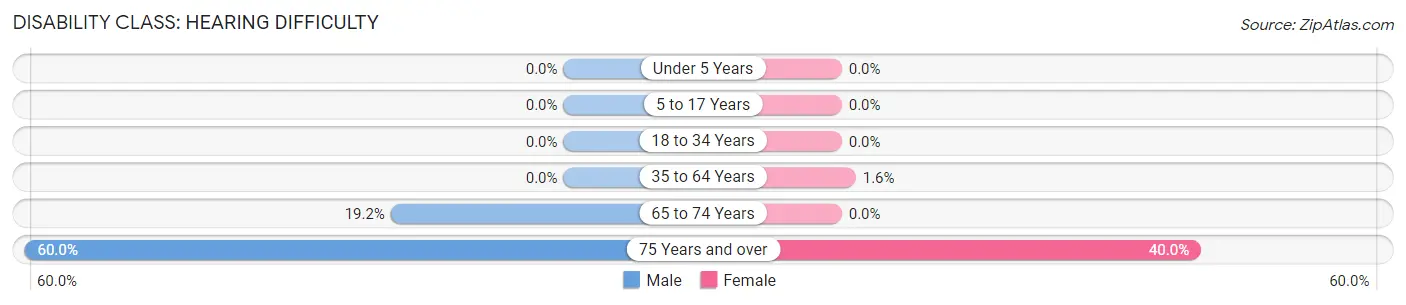
| Age Bracket | Male | Female |
| Under 5 Years | 0 (0.0%) | 0 (0.0%) |
| 5 to 17 Years | 0 (0.0%) | 0 (0.0%) |
| 18 to 34 Years | 0 (0.0%) | 0 (0.0%) |
| 35 to 64 Years | 0 (0.0%) | 1 (1.6%) |
| 65 to 74 Years | 5 (19.2%) | 0 (0.0%) |
| 75 Years and over | 3 (60.0%) | 2 (40.0%) |
Disability Class: Vision Difficulty
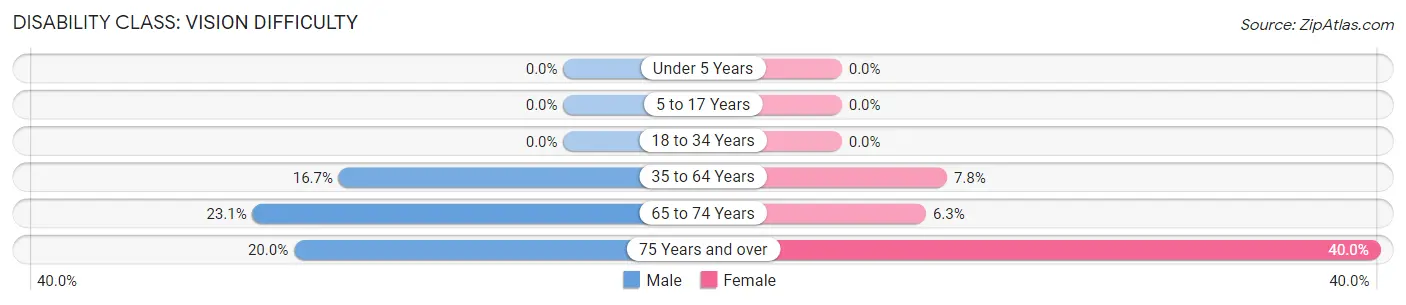
| Age Bracket | Male | Female |
| Under 5 Years | 0 (0.0%) | 0 (0.0%) |
| 5 to 17 Years | 0 (0.0%) | 0 (0.0%) |
| 18 to 34 Years | 0 (0.0%) | 0 (0.0%) |
| 35 to 64 Years | 7 (16.7%) | 5 (7.8%) |
| 65 to 74 Years | 6 (23.1%) | 1 (6.2%) |
| 75 Years and over | 1 (20.0%) | 2 (40.0%) |
Disability Class: Cognitive Difficulty
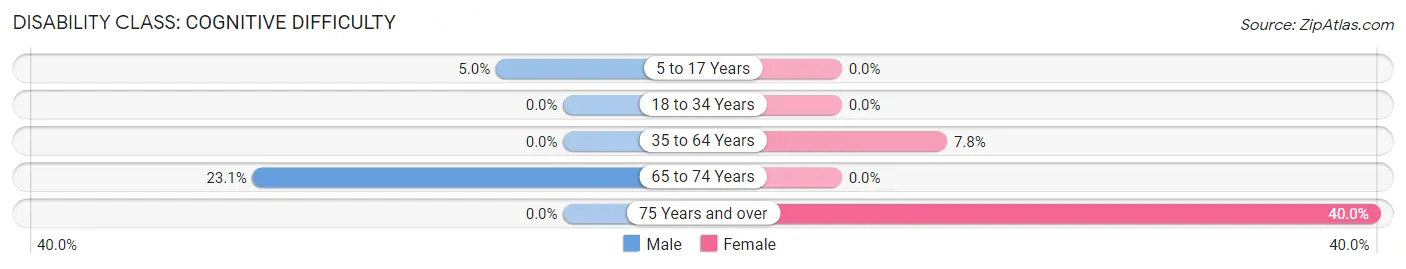
| Age Bracket | Male | Female |
| 5 to 17 Years | 1 (5.0%) | 0 (0.0%) |
| 18 to 34 Years | 0 (0.0%) | 0 (0.0%) |
| 35 to 64 Years | 0 (0.0%) | 5 (7.8%) |
| 65 to 74 Years | 6 (23.1%) | 0 (0.0%) |
| 75 Years and over | 0 (0.0%) | 2 (40.0%) |
Disability Class: Ambulatory Difficulty
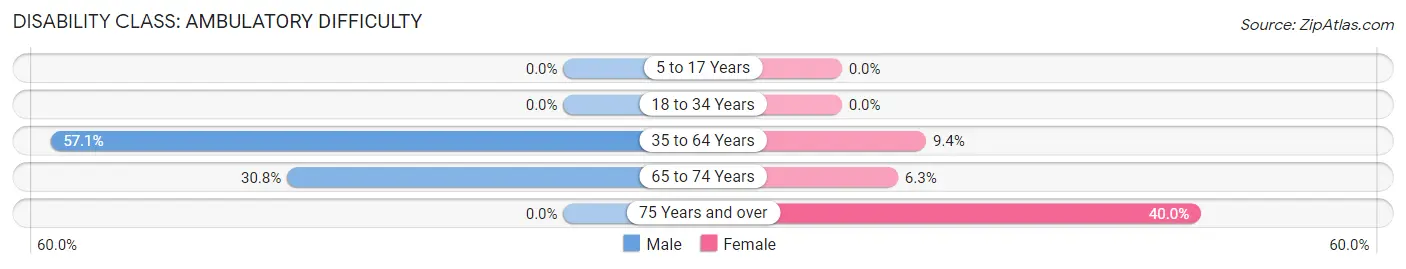
| Age Bracket | Male | Female |
| 5 to 17 Years | 0 (0.0%) | 0 (0.0%) |
| 18 to 34 Years | 0 (0.0%) | 0 (0.0%) |
| 35 to 64 Years | 24 (57.1%) | 6 (9.4%) |
| 65 to 74 Years | 8 (30.8%) | 1 (6.2%) |
| 75 Years and over | 0 (0.0%) | 2 (40.0%) |
Disability Class: Self-Care Difficulty
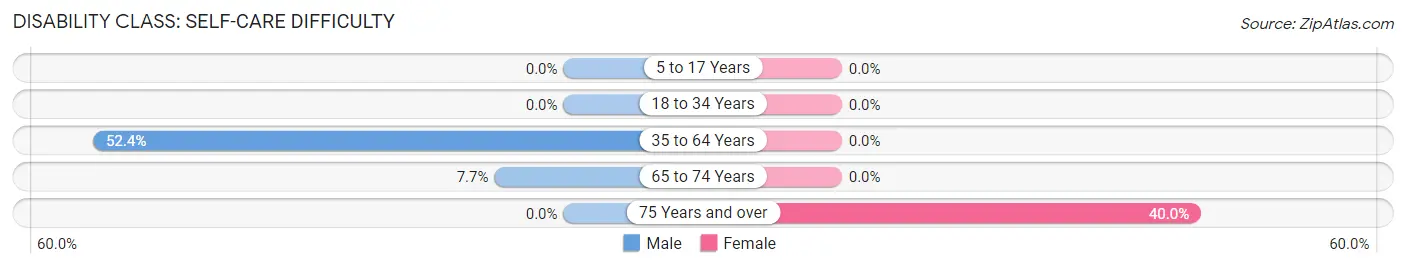
| Age Bracket | Male | Female |
| 5 to 17 Years | 0 (0.0%) | 0 (0.0%) |
| 18 to 34 Years | 0 (0.0%) | 0 (0.0%) |
| 35 to 64 Years | 22 (52.4%) | 0 (0.0%) |
| 65 to 74 Years | 2 (7.7%) | 0 (0.0%) |
| 75 Years and over | 0 (0.0%) | 2 (40.0%) |
Technology Access in Avalon
Computing Device Access in Avalon
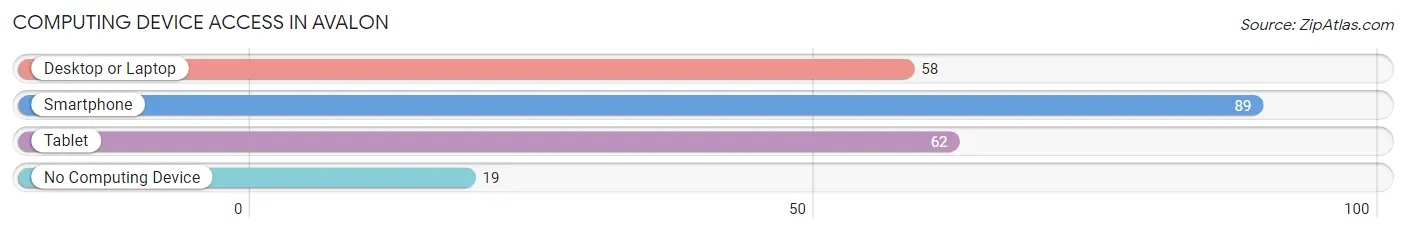
| Device Type | # Households | % Households |
| Desktop or Laptop | 58 | 52.2% |
| Smartphone | 89 | 80.2% |
| Tablet | 62 | 55.9% |
| No Computing Device | 19 | 17.1% |
| Total | 111 | 100.0% |
Internet Access in Avalon
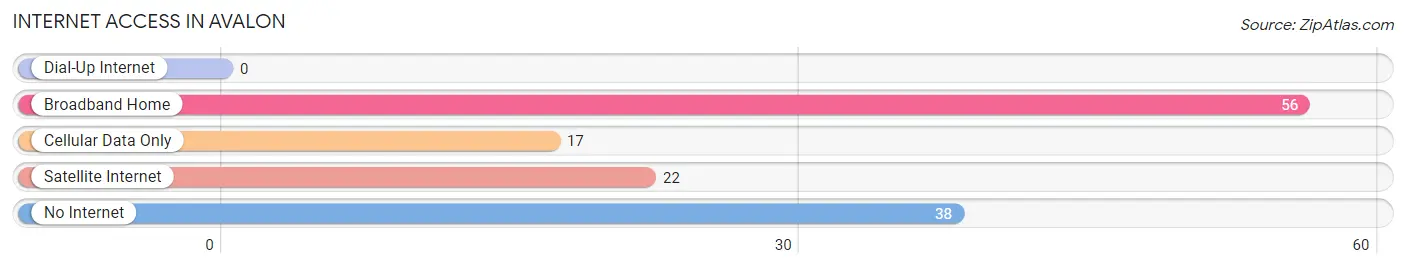
| Internet Type | # Households | % Households |
| Dial-Up Internet | 0 | 0.0% |
| Broadband Home | 56 | 50.4% |
| Cellular Data Only | 17 | 15.3% |
| Satellite Internet | 22 | 19.8% |
| No Internet | 38 | 34.2% |
| Total | 111 | 100.0% |
Avalon Summary
Avalon is a small city located in the state of Georgia, United States. It is situated in the northwest corner of the state, near the border with Alabama. The city is part of the Atlanta metropolitan area and is located in Cherokee County. As of the 2010 census, the population of Avalon was 1,845.
History
Avalon was founded in 1832 by a group of settlers from the nearby town of Canton. The town was named after the mythical island of Avalon, which was the final resting place of King Arthur in Arthurian legend. The settlers were attracted to the area due to its fertile soil and abundant natural resources.
The town quickly grew and by the mid-19th century, it had become a thriving agricultural center. The town was also home to several mills, which provided employment for many of the town’s residents.
In the late 19th century, the town began to experience a period of decline. This was due to the introduction of the railroad, which bypassed Avalon and caused many of the town’s businesses to close.
In the early 20th century, Avalon began to experience a period of growth. This was due to the introduction of the automobile, which allowed people to travel to the town more easily. The town also experienced a period of growth due to the development of the nearby city of Atlanta.
Geography
Avalon is located in the northwest corner of Georgia, near the border with Alabama. The city is situated in the foothills of the Appalachian Mountains and is surrounded by rolling hills and forests. The city is located in Cherokee County and is part of the Atlanta metropolitan area.
The city has a total area of 4.2 square miles, all of which is land. The city is located at an elevation of 890 feet above sea level.
Economy
Avalon’s economy is largely based on agriculture and tourism. The city is home to several farms, which produce a variety of crops, including corn, soybeans, and cotton. The city is also home to several wineries, which produce a variety of wines.
The city is also home to several tourist attractions, including the historic Avalon Theater and the Avalon Museum of History. The city is also home to several restaurants, shops, and other businesses.
Demographics
As of the 2010 census, the population of Avalon was 1,845. The racial makeup of the city was 79.2% White, 15.2% African American, 0.3% Native American, 0.7% Asian, 0.1% Pacific Islander, and 4.5% from other races. Hispanic or Latino of any race were 3.2% of the population.
The median income for a household in the city was $41,250, and the median income for a family was $50,000. The per capita income for the city was $20,945. About 11.2% of families and 14.2% of the population were below the poverty line, including 19.2% of those under age 18 and 8.2% of those age 65 or over.
Common Questions
What is the Total Population of Avalon?
Total Population of Avalon is 285.
What is the Total Male Population of Avalon?
Total Male Population of Avalon is 153.
What is the Total Female Population of Avalon?
Total Female Population of Avalon is 132.
What is the Ratio of Males per 100 Females in Avalon?
There are 115.91 Males per 100 Females in Avalon.
What is the Ratio of Females per 100 Males in Avalon?
There are 86.27 Females per 100 Males in Avalon.
What is the Median Population Age in Avalon?
Median Population Age in Avalon is 47.3 Years.
What is the Average Family Size in Avalon
Average Family Size in Avalon is 2.9 People.
What is the Average Household Size in Avalon
Average Household Size in Avalon is 2.6 People.
What is Per Capita Income in Avalon?
Per Capita income in Avalon is $25,702.
What is the Median Household income in Avalon?
Median Household Income in Avalon is $43,906.
What is Inequality or Gini Index in Avalon?
Inequality or Gini Index in Avalon is 0.39.
How Large is the Labor Force in Avalon?
There are 115 People in the Labor Forcein in Avalon.
What is the Percentage of People in the Labor Force in Avalon?
45.8% of People are in the Labor Force in Avalon.