Zip Codes with the Highest Percentage of Population Employed in Computer & Mathematics in Seneca, SC
RELATED REPORTS & OPTIONS
Computer & Mathematics
Seneca
Compare Zip Codes
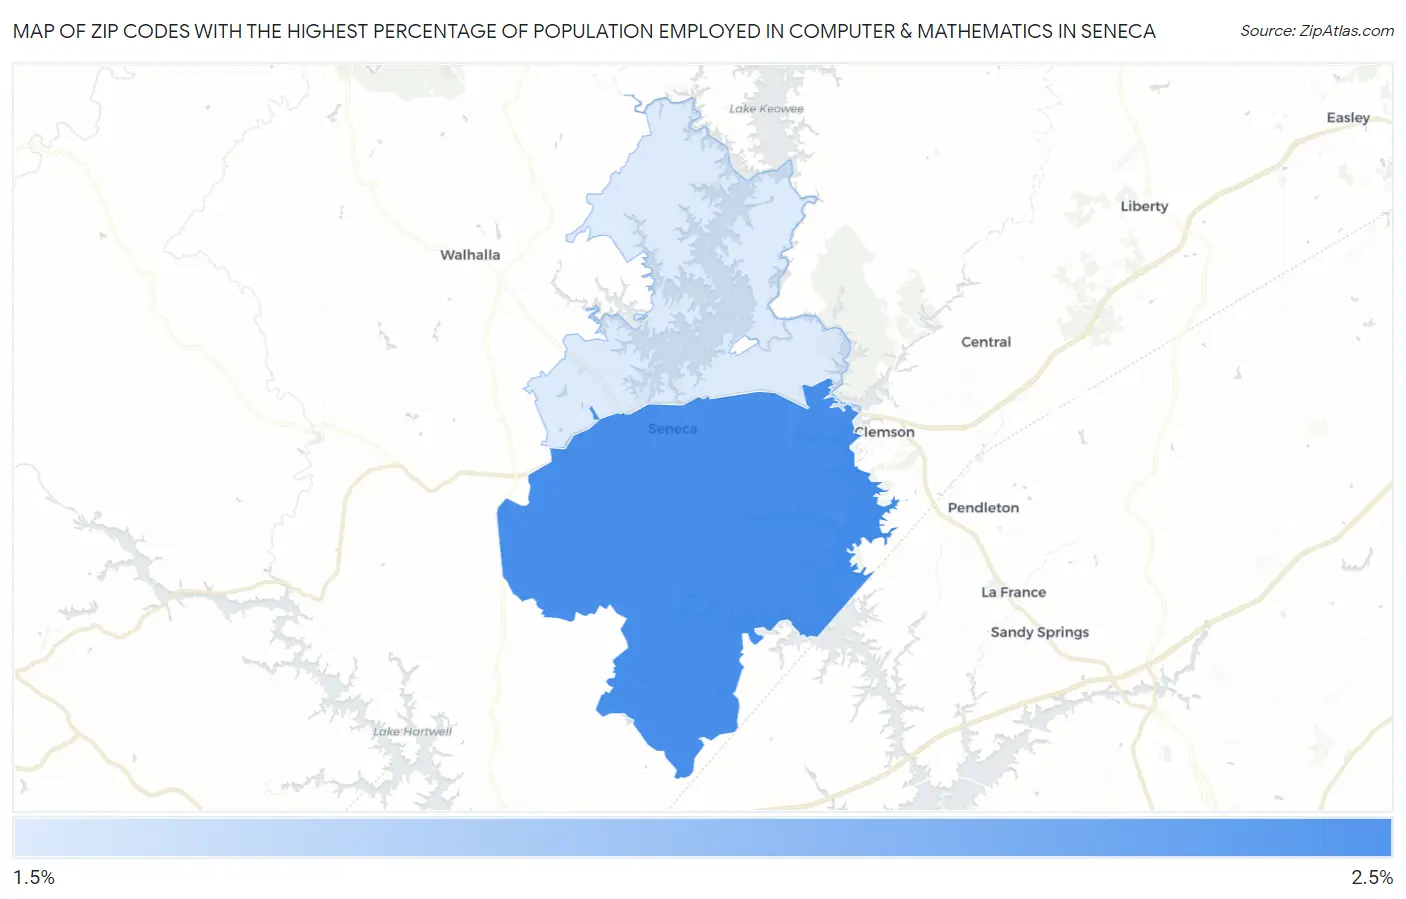
Map of Zip Codes with the Highest Percentage of Population Employed in Computer & Mathematics in Seneca
0.0%
2.5%
Zip Codes with the Highest Percentage of Population Employed in Computer & Mathematics in Seneca, SC
| Zip Code | % Employed | vs State | vs National | |
| 1. | 29678 | 2.1% | 2.4%(-0.295)#123 | 3.5%(-1.40)#11,234 |
| 2. | 29672 | 1.8% | 2.4%(-0.646)#148 | 3.5%(-1.75)#12,871 |
1
Common Questions
What are the Top Zip Codes with the Highest Percentage of Population Employed in Computer & Mathematics in Seneca, SC?
Top Zip Codes with the Highest Percentage of Population Employed in Computer & Mathematics in Seneca, SC are:
What zip code has the Highest Percentage of Population Employed in Computer & Mathematics in Seneca, SC?
29678 has the Highest Percentage of Population Employed in Computer & Mathematics in Seneca, SC with 2.1%.
What is the Percentage of Population Employed in Computer & Mathematics in South Carolina?
Percentage of Population Employed in Computer & Mathematics in South Carolina is 2.4%.
What is the Percentage of Population Employed in Computer & Mathematics in the United States?
Percentage of Population Employed in Computer & Mathematics in the United States is 3.5%.