Winnsboro Mills, SC
Winnsboro Mills Map
Winnsboro Mills Overview
1,682
TOTAL POPULATION
886
MALE POPULATION
796
FEMALE POPULATION
111.31
MALES / 100 FEMALES
89.84
FEMALES / 100 MALES
44.0
MEDIAN AGE
3.2
AVG FAMILY SIZE
2.3
AVG HOUSEHOLD SIZE
$20,812
PER CAPITA INCOME
$50,385
AVG FAMILY INCOME
$34,708
AVG HOUSEHOLD INCOME
12.1%
WAGE / INCOME GAP [ % ]
87.9¢/ $1
WAGE / INCOME GAP [ $ ]
0.40
INEQUALITY / GINI INDEX
772
LABOR FORCE [ PEOPLE ]
50.2%
PERCENT IN LABOR FORCE
16.2%
UNEMPLOYMENT RATE
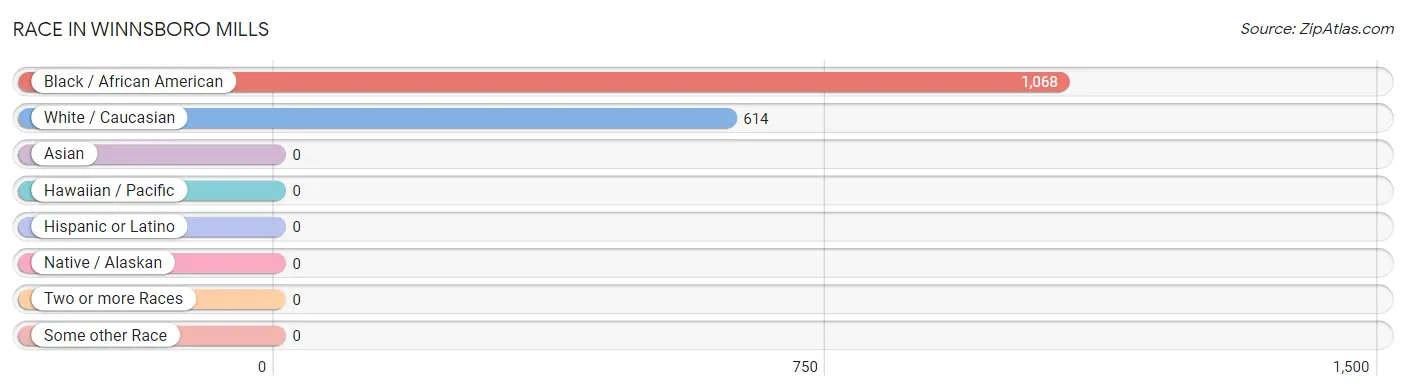
Race in Winnsboro Mills
The most populous races in Winnsboro Mills are Black / African American (1,068 | 63.5%), and White / Caucasian (614 | 36.5%).
| Race | # Population | % Population |
| Asian | 0 | 0.0% |
| Black / African American | 1,068 | 63.5% |
| Hawaiian / Pacific | 0 | 0.0% |
| Hispanic or Latino | 0 | 0.0% |
| Native / Alaskan | 0 | 0.0% |
| White / Caucasian | 614 | 36.5% |
| Two or more Races | 0 | 0.0% |
| Some other Race | 0 | 0.0% |
| Total | 1,682 | 100.0% |
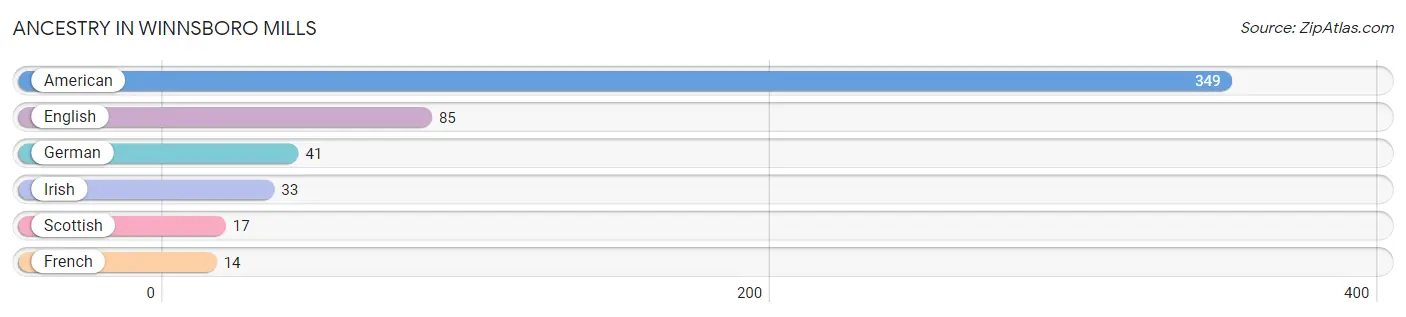
Ancestry in Winnsboro Mills
The most populous ancestries reported in Winnsboro Mills are American (349 | 20.7%), English (85 | 5.1%), German (41 | 2.4%), Irish (33 | 2.0%), and Scottish (17 | 1.0%), together accounting for 31.2% of all Winnsboro Mills residents.
| Ancestry | # Population | % Population |
| American | 349 | 20.7% |
| English | 85 | 5.1% |
| French | 14 | 0.8% |
| German | 41 | 2.4% |
| Irish | 33 | 2.0% |
| Scottish | 17 | 1.0% | View All 6 Rows |
Immigrants in Winnsboro Mills

| Immigration Origin | # Population | % Population | View All 0 Rows |
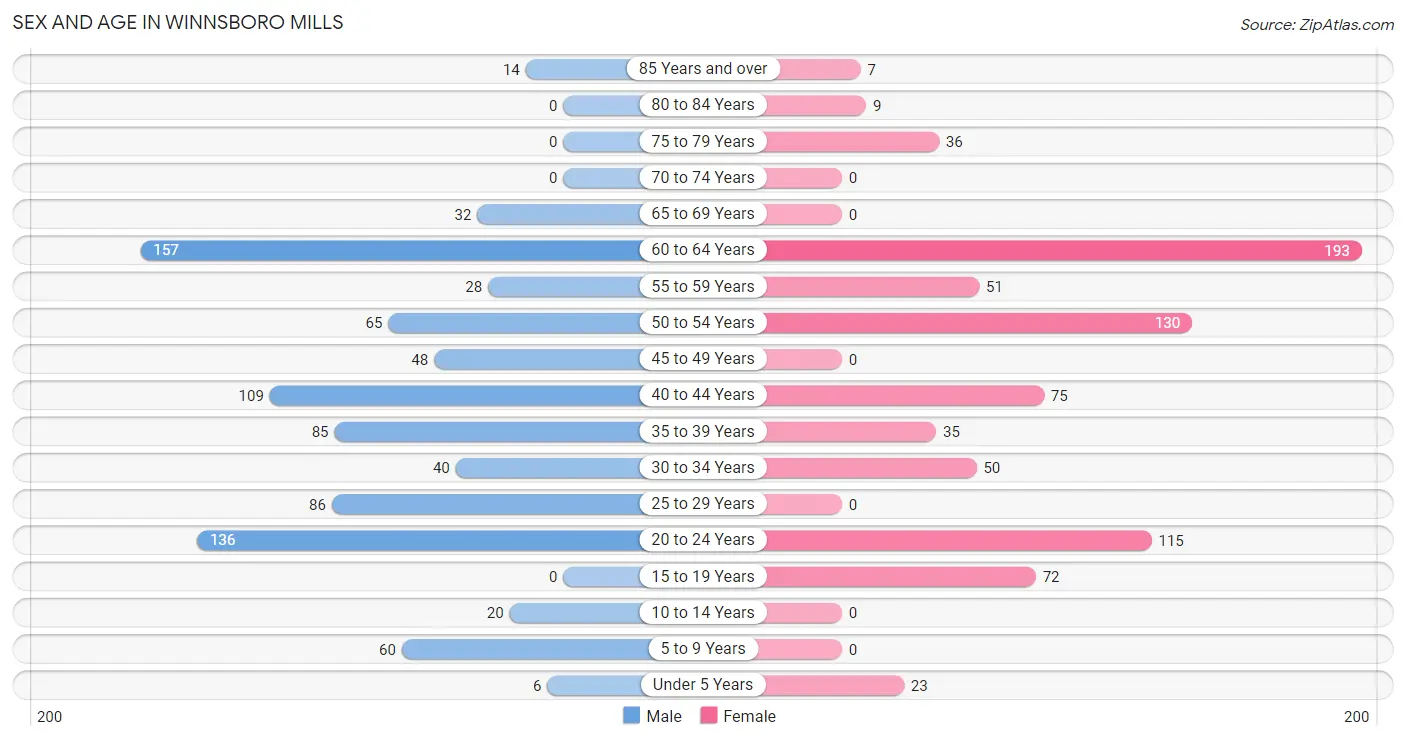
Sex and Age in Winnsboro Mills
Sex and Age in Winnsboro Mills
The most populous age groups in Winnsboro Mills are 60 to 64 Years (157 | 17.7%) for men and 60 to 64 Years (193 | 24.2%) for women.
| Age Bracket | Male | Female |
| Under 5 Years | 6 (0.7%) | 23 (2.9%) |
| 5 to 9 Years | 60 (6.8%) | 0 (0.0%) |
| 10 to 14 Years | 20 (2.3%) | 0 (0.0%) |
| 15 to 19 Years | 0 (0.0%) | 72 (9.0%) |
| 20 to 24 Years | 136 (15.3%) | 115 (14.4%) |
| 25 to 29 Years | 86 (9.7%) | 0 (0.0%) |
| 30 to 34 Years | 40 (4.5%) | 50 (6.3%) |
| 35 to 39 Years | 85 (9.6%) | 35 (4.4%) |
| 40 to 44 Years | 109 (12.3%) | 75 (9.4%) |
| 45 to 49 Years | 48 (5.4%) | 0 (0.0%) |
| 50 to 54 Years | 65 (7.3%) | 130 (16.3%) |
| 55 to 59 Years | 28 (3.2%) | 51 (6.4%) |
| 60 to 64 Years | 157 (17.7%) | 193 (24.2%) |
| 65 to 69 Years | 32 (3.6%) | 0 (0.0%) |
| 70 to 74 Years | 0 (0.0%) | 0 (0.0%) |
| 75 to 79 Years | 0 (0.0%) | 36 (4.5%) |
| 80 to 84 Years | 0 (0.0%) | 9 (1.1%) |
| 85 Years and over | 14 (1.6%) | 7 (0.9%) |
| Total | 886 (100.0%) | 796 (100.0%) |
Families and Households in Winnsboro Mills
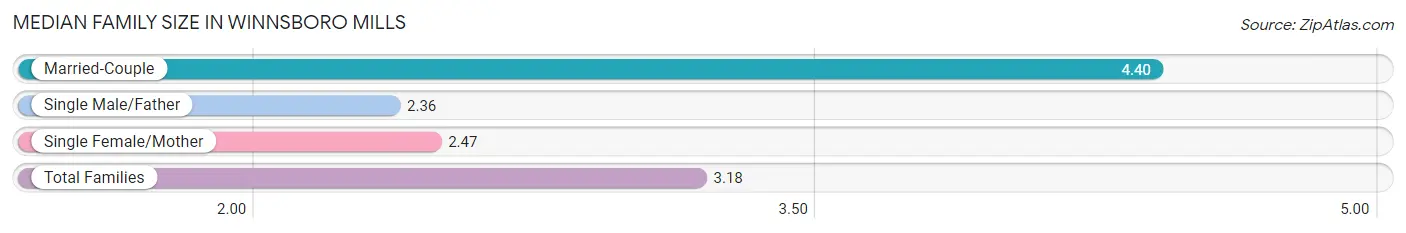
Median Family Size in Winnsboro Mills
The median family size in Winnsboro Mills is 3.18 persons per family, with married-couple families (154 | 37.2%) accounting for the largest median family size of 4.4 persons per family. On the other hand, single male/father families (28 | 6.8%) represent the smallest median family size with 2.36 persons per family.
| Family Type | # Families | Family Size |
| Married-Couple | 154 (37.2%) | 4.40 |
| Single Male/Father | 28 (6.8%) | 2.36 |
| Single Female/Mother | 232 (56.0%) | 2.47 |
| Total Families | 414 (100.0%) | 3.18 |
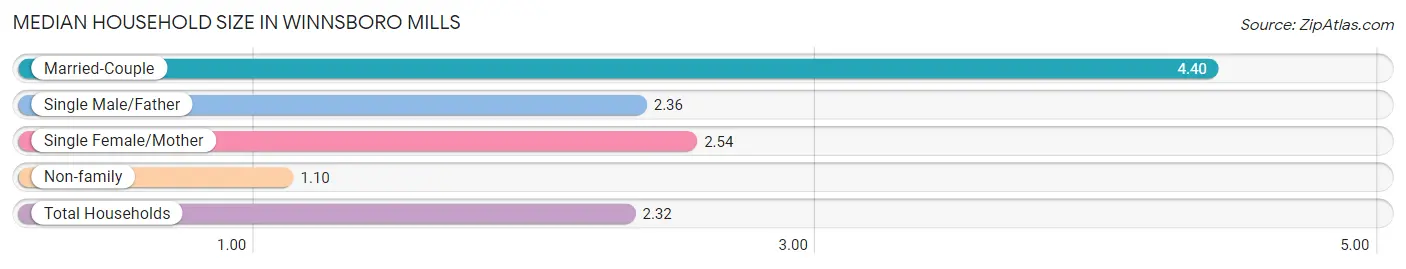
Median Household Size in Winnsboro Mills
The median household size in Winnsboro Mills is 2.32 persons per household, with married-couple households (154 | 21.4%) accounting for the largest median household size of 4.4 persons per household. non-family households (306 | 42.5%) represent the smallest median household size with 1.10 persons per household.
| Household Type | # Households | Household Size |
| Married-Couple | 154 (21.4%) | 4.40 |
| Single Male/Father | 28 (3.9%) | 2.36 |
| Single Female/Mother | 232 (32.2%) | 2.54 |
| Non-family | 306 (42.5%) | 1.10 |
| Total Households | 720 (100.0%) | 2.32 |
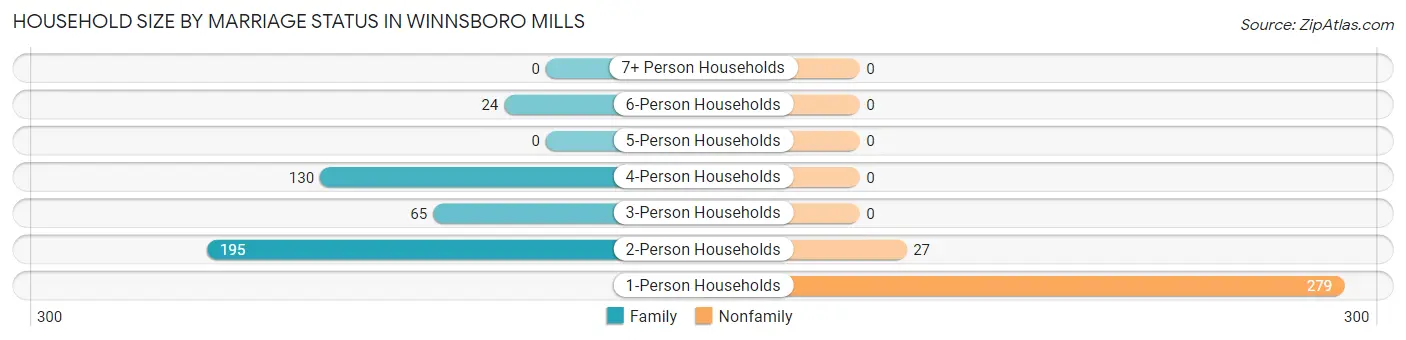
Household Size by Marriage Status in Winnsboro Mills
Out of a total of 720 households in Winnsboro Mills, 414 (57.5%) are family households, while 306 (42.5%) are nonfamily households. The most numerous type of family households are 2-person households, comprising 195, and the most common type of nonfamily households are 1-person households, comprising 279.
| Household Size | Family Households | Nonfamily Households |
| 1-Person Households | - | 279 (38.8%) |
| 2-Person Households | 195 (27.1%) | 27 (3.7%) |
| 3-Person Households | 65 (9.0%) | 0 (0.0%) |
| 4-Person Households | 130 (18.1%) | 0 (0.0%) |
| 5-Person Households | 0 (0.0%) | 0 (0.0%) |
| 6-Person Households | 24 (3.3%) | 0 (0.0%) |
| 7+ Person Households | 0 (0.0%) | 0 (0.0%) |
| Total | 414 (57.5%) | 306 (42.5%) |
Female Fertility in Winnsboro Mills
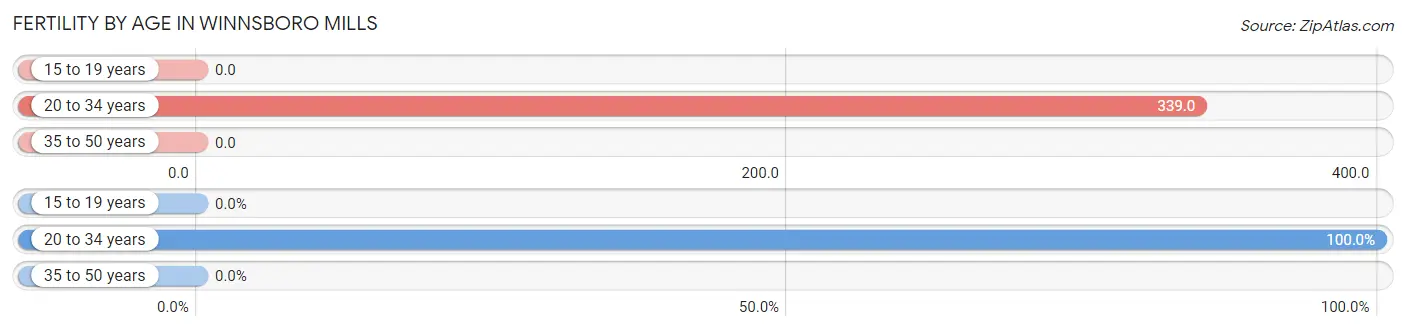
Fertility by Age in Winnsboro Mills
Average fertility rate in Winnsboro Mills is 161.0 births per 1,000 women. Women in the age bracket of 20 to 34 years have the highest fertility rate with 339.0 births per 1,000 women. Women in the age bracket of 20 to 34 years acount for 100.0% of all women with births.
| Age Bracket | Women with Births | Births / 1,000 Women |
| 15 to 19 years | 0 (0.0%) | 0.0 |
| 20 to 34 years | 56 (100.0%) | 339.0 |
| 35 to 50 years | 0 (0.0%) | 0.0 |
| Total | 56 (100.0%) | 161.0 |
Fertility by Age by Marriage Status in Winnsboro Mills
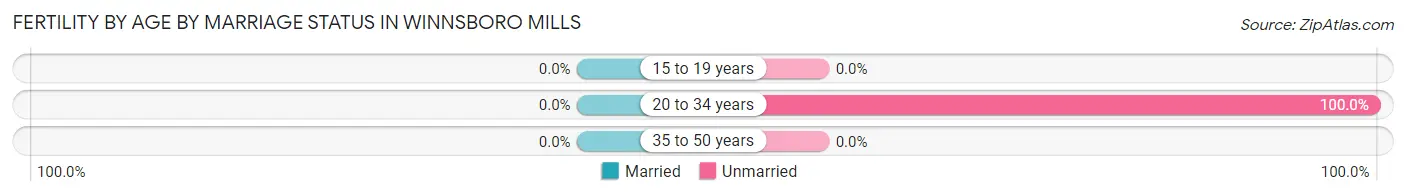
| Age Bracket | Married | Unmarried |
| 15 to 19 years | 0 (0.0%) | 0 (0.0%) |
| 20 to 34 years | 0 (0.0%) | 56 (100.0%) |
| 35 to 50 years | 0 (0.0%) | 0 (0.0%) |
| Total | 0 (0.0%) | 56 (100.0%) |
Fertility by Education in Winnsboro Mills
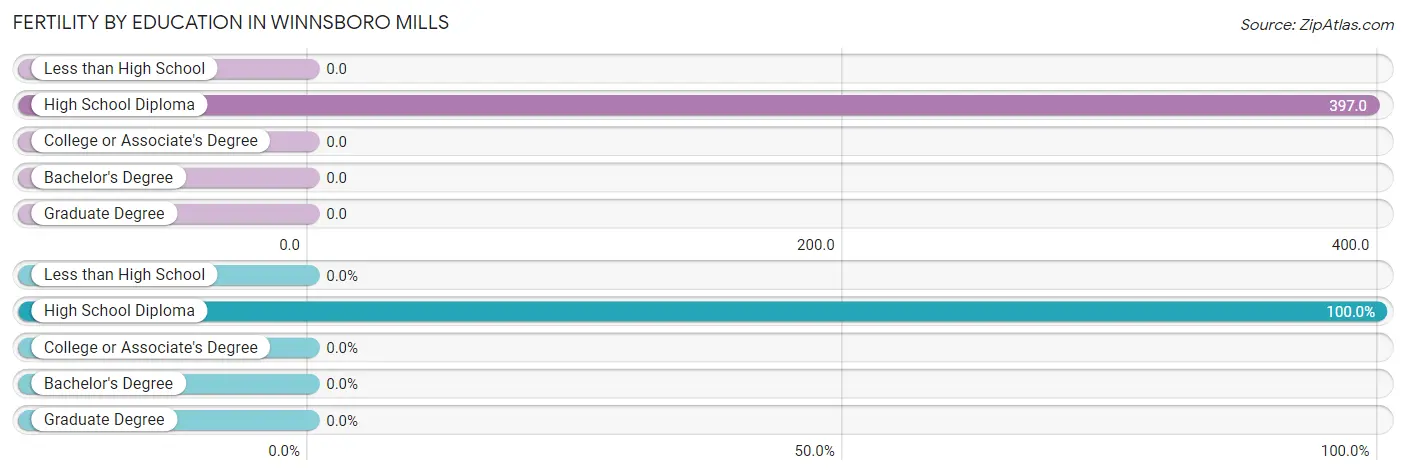
| Educational Attainment | Women with Births | Births / 1,000 Women |
| Less than High School | 0 (0.0%) | 0.0 |
| High School Diploma | 56 (100.0%) | 397.0 |
| College or Associate's Degree | 0 (0.0%) | 0.0 |
| Bachelor's Degree | 0 (0.0%) | 0.0 |
| Graduate Degree | 0 (0.0%) | 0.0 |
| Total | 56 (100.0%) | 161.0 |
Fertility by Education by Marriage Status in Winnsboro Mills
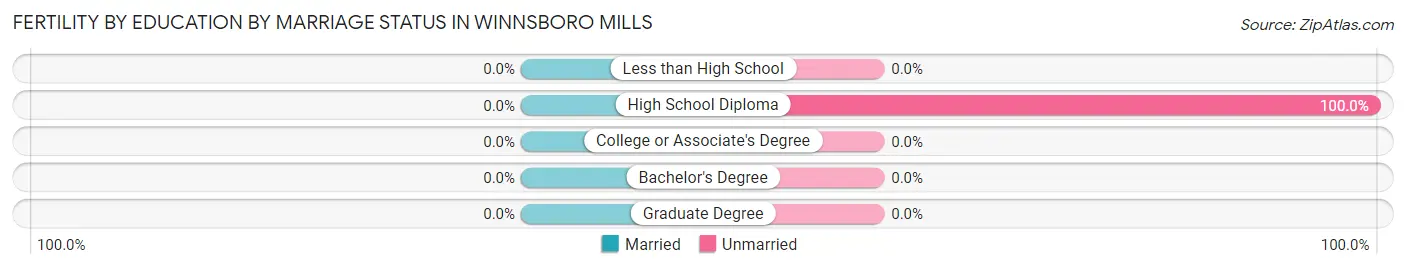
| Educational Attainment | Married | Unmarried |
| Less than High School | 0 (0.0%) | 0 (0.0%) |
| High School Diploma | 0 (0.0%) | 56 (100.0%) |
| College or Associate's Degree | 0 (0.0%) | 0 (0.0%) |
| Bachelor's Degree | 0 (0.0%) | 0 (0.0%) |
| Graduate Degree | 0 (0.0%) | 0 (0.0%) |
| Total | 0 (0.0%) | 56 (100.0%) |
Income in Winnsboro Mills
Income Overview in Winnsboro Mills
Per Capita Income in Winnsboro Mills is $20,812, while median incomes of families and households are $50,385 and $34,708 respectively.
| Characteristic | Number | Measure |
| Per Capita Income | 1,682 | $20,812 |
| Median Family Income | 414 | $50,385 |
| Mean Family Income | 414 | $54,877 |
| Median Household Income | 720 | $34,708 |
| Mean Household Income | 720 | $46,083 |
| Income Deficit | 414 | $0 |
| Wage / Income Gap (%) | 1,682 | 12.06% |
| Wage / Income Gap ($) | 1,682 | 87.94¢ per $1 |
| Gini / Inequality Index | 1,682 | 0.40 |
Earnings by Sex in Winnsboro Mills
Average Earnings in Winnsboro Mills are $24,527, $22,669 for men and $25,777 for women, a difference of 12.1%.
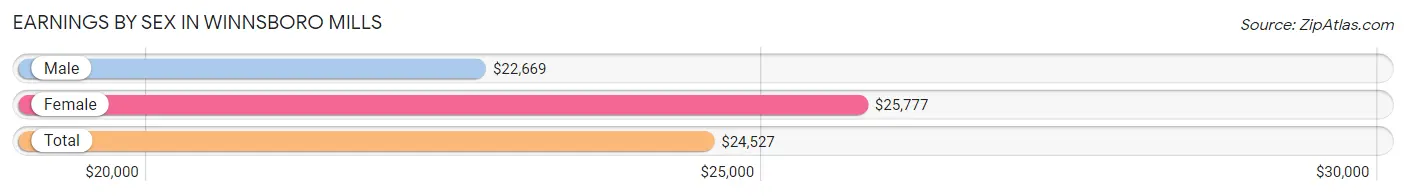
| Sex | Number | Average Earnings |
| Male | 425 (48.8%) | $22,669 |
| Female | 445 (51.1%) | $25,777 |
| Total | 870 (100.0%) | $24,527 |
Earnings by Sex by Income Bracket in Winnsboro Mills
The most common earnings brackets in Winnsboro Mills are $2,499 or less for men (68 | 16.0%) and $50,000 to $54,999 for women (72 | 16.2%).
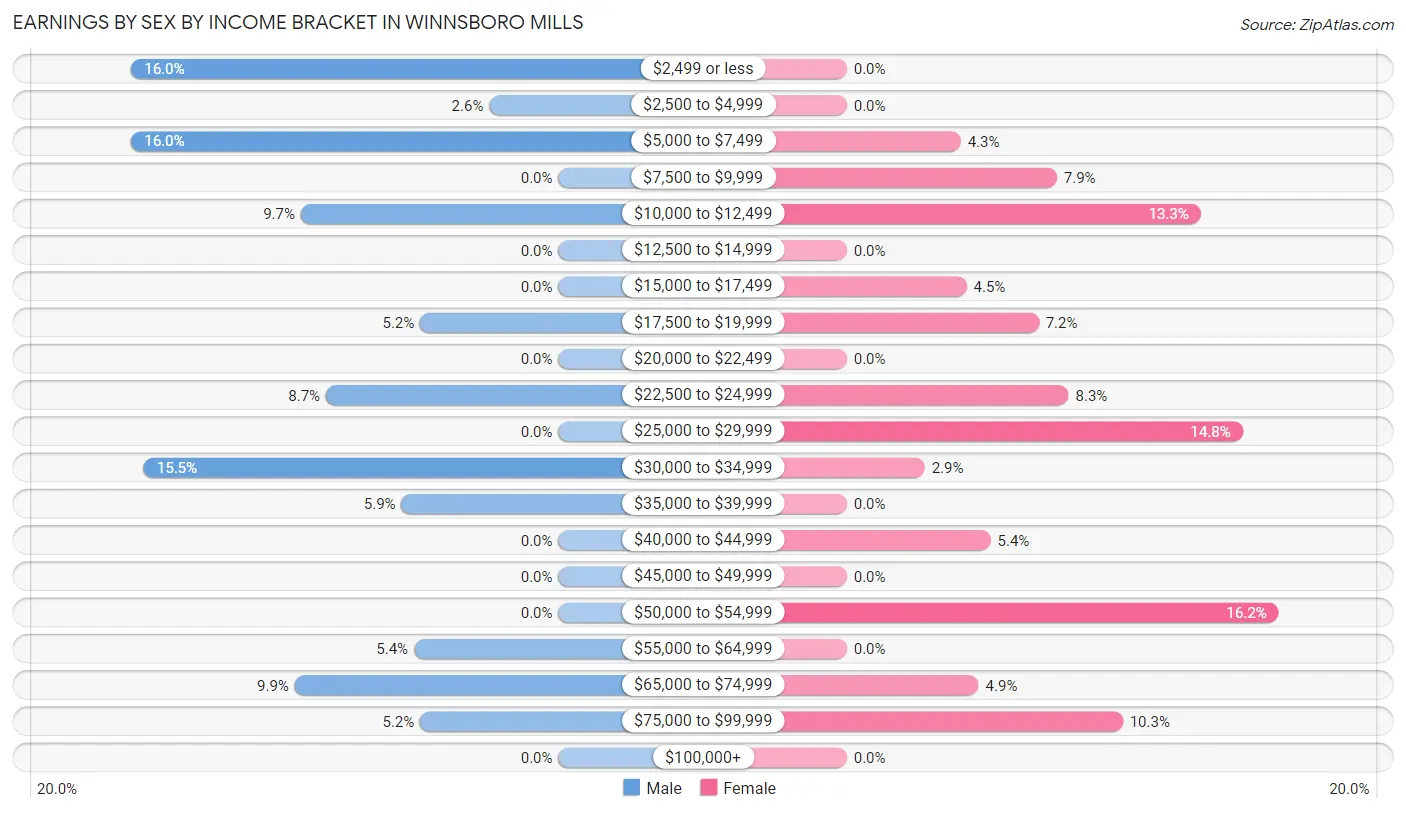
| Income | Male | Female |
| $2,499 or less | 68 (16.0%) | 0 (0.0%) |
| $2,500 to $4,999 | 11 (2.6%) | 0 (0.0%) |
| $5,000 to $7,499 | 68 (16.0%) | 19 (4.3%) |
| $7,500 to $9,999 | 0 (0.0%) | 35 (7.9%) |
| $10,000 to $12,499 | 41 (9.7%) | 59 (13.3%) |
| $12,500 to $14,999 | 0 (0.0%) | 0 (0.0%) |
| $15,000 to $17,499 | 0 (0.0%) | 20 (4.5%) |
| $17,500 to $19,999 | 22 (5.2%) | 32 (7.2%) |
| $20,000 to $22,499 | 0 (0.0%) | 0 (0.0%) |
| $22,500 to $24,999 | 37 (8.7%) | 37 (8.3%) |
| $25,000 to $29,999 | 0 (0.0%) | 66 (14.8%) |
| $30,000 to $34,999 | 66 (15.5%) | 13 (2.9%) |
| $35,000 to $39,999 | 25 (5.9%) | 0 (0.0%) |
| $40,000 to $44,999 | 0 (0.0%) | 24 (5.4%) |
| $45,000 to $49,999 | 0 (0.0%) | 0 (0.0%) |
| $50,000 to $54,999 | 0 (0.0%) | 72 (16.2%) |
| $55,000 to $64,999 | 23 (5.4%) | 0 (0.0%) |
| $65,000 to $74,999 | 42 (9.9%) | 22 (4.9%) |
| $75,000 to $99,999 | 22 (5.2%) | 46 (10.3%) |
| $100,000+ | 0 (0.0%) | 0 (0.0%) |
| Total | 425 (100.0%) | 445 (100.0%) |
Earnings by Sex by Educational Attainment in Winnsboro Mills
Average earnings in Winnsboro Mills are $24,966 for men and $27,140 for women, a difference of 8.0%. Men with an educational attainment of high school diploma enjoy the highest average annual earnings of $32,917, while those with high school diploma education earn the least with $32,917. Women with an educational attainment of college or associate's degree earn the most with the average annual earnings of $68,239, while those with high school diploma education have the smallest earnings of $26,025.
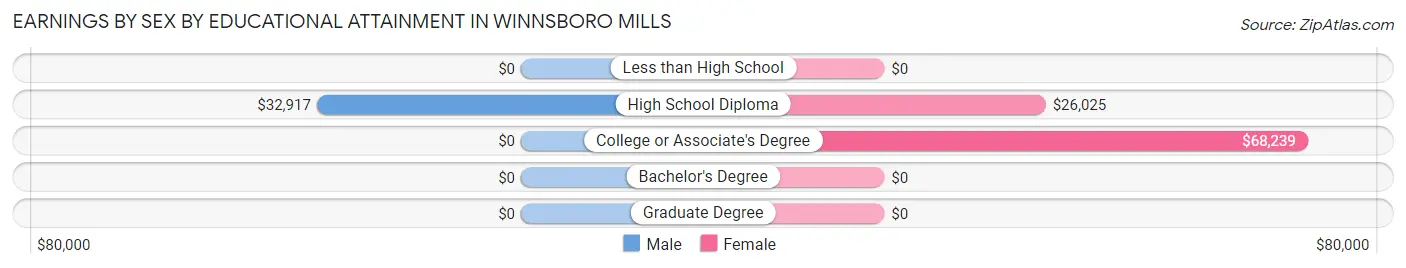
| Educational Attainment | Male Income | Female Income |
| Less than High School | - | - |
| High School Diploma | $32,917 | $26,025 |
| College or Associate's Degree | - | - |
| Bachelor's Degree | - | - |
| Graduate Degree | - | - |
| Total | $24,966 | $27,140 |
Family Income in Winnsboro Mills
Family Income Brackets in Winnsboro Mills
According to the Winnsboro Mills family income data, there are 146 families falling into the $50,000 to $74,999 income range, which is the most common income bracket and makes up 35.3% of all families.
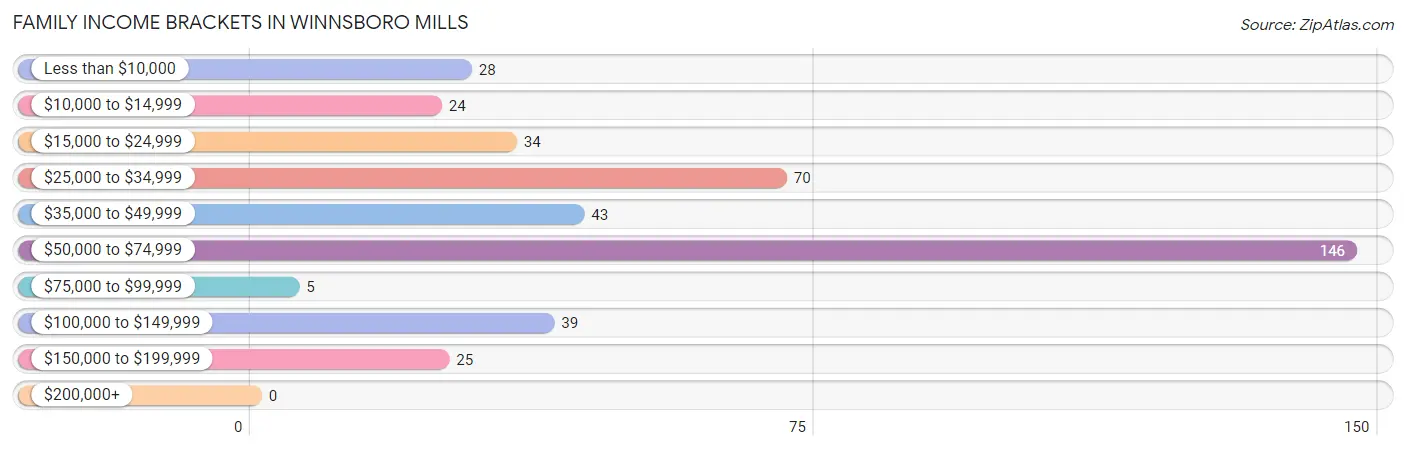
| Income Bracket | # Families | % Families |
| Less than $10,000 | 28 | 6.8% |
| $10,000 to $14,999 | 24 | 5.8% |
| $15,000 to $24,999 | 34 | 8.2% |
| $25,000 to $34,999 | 70 | 16.9% |
| $35,000 to $49,999 | 43 | 10.4% |
| $50,000 to $74,999 | 146 | 35.3% |
| $75,000 to $99,999 | 5 | 1.2% |
| $100,000 to $149,999 | 39 | 9.4% |
| $150,000 to $199,999 | 25 | 6.0% |
| $200,000+ | 0 | 0.0% |
Family Income by Famaliy Size in Winnsboro Mills
4-person families (117 | 28.3%) account for the highest median family income in Winnsboro Mills with $58,811 per family, while 2-person families (195 | 47.1%) have the highest median income of $16,469 per family member.
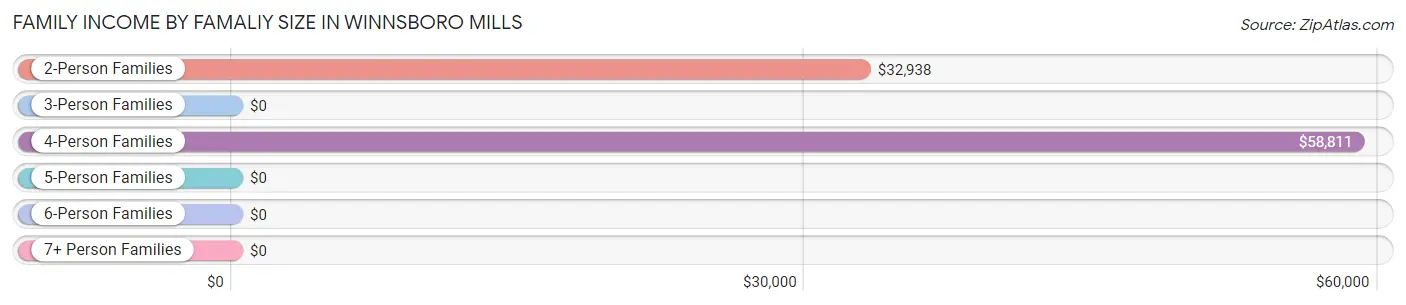
| Income Bracket | # Families | Median Income |
| 2-Person Families | 195 (47.1%) | $32,938 |
| 3-Person Families | 78 (18.8%) | $0 |
| 4-Person Families | 117 (28.3%) | $58,811 |
| 5-Person Families | 0 (0.0%) | $0 |
| 6-Person Families | 24 (5.8%) | $0 |
| 7+ Person Families | 0 (0.0%) | $0 |
| Total | 414 (100.0%) | $50,385 |
Family Income by Number of Earners in Winnsboro Mills
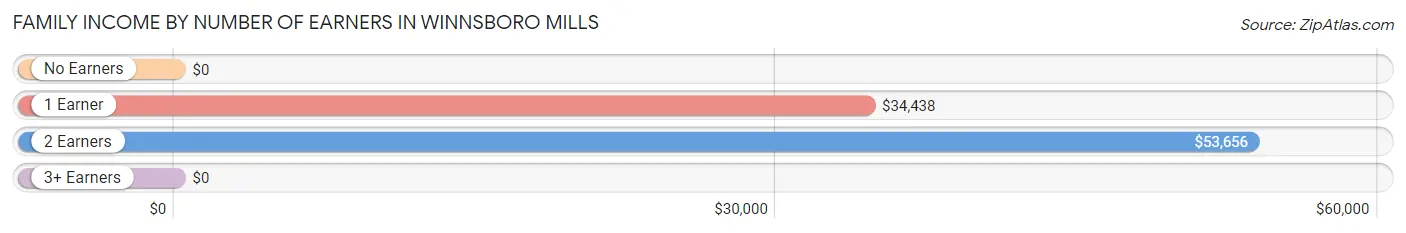
| Number of Earners | # Families | Median Income |
| No Earners | 54 (13.0%) | $0 |
| 1 Earner | 205 (49.5%) | $34,438 |
| 2 Earners | 135 (32.6%) | $53,656 |
| 3+ Earners | 20 (4.8%) | $0 |
| Total | 414 (100.0%) | $50,385 |
Household Income in Winnsboro Mills
Household Income Brackets in Winnsboro Mills
With 200 households falling in the category, the $50,000 to $74,999 income range is the most frequent in Winnsboro Mills, accounting for 27.8% of all households.
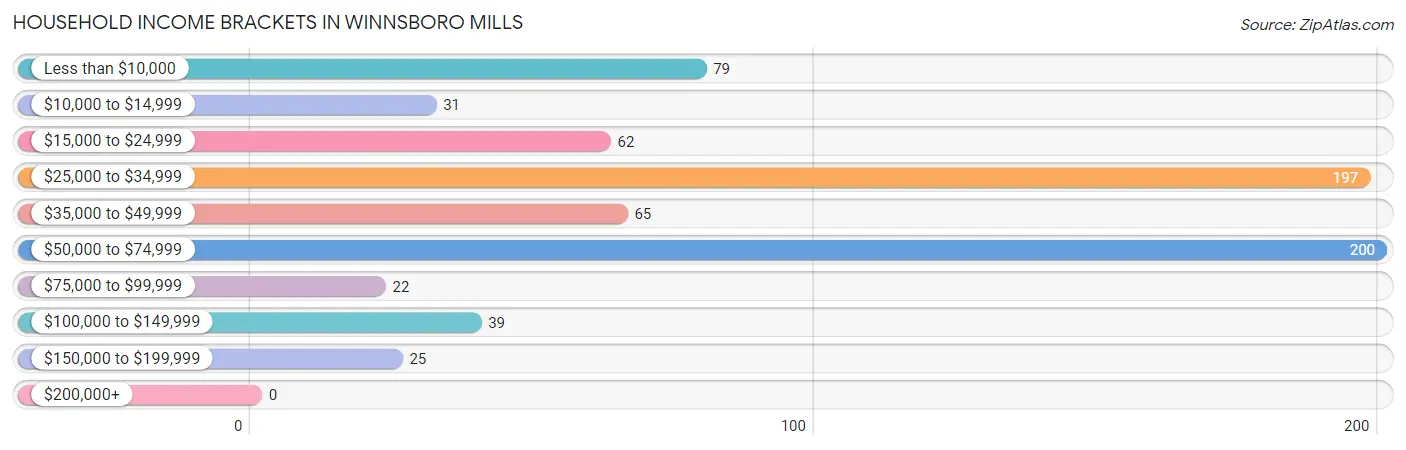
| Income Bracket | # Households | % Households |
| Less than $10,000 | 79 | 11.0% |
| $10,000 to $14,999 | 31 | 4.3% |
| $15,000 to $24,999 | 62 | 8.6% |
| $25,000 to $34,999 | 197 | 27.4% |
| $35,000 to $49,999 | 65 | 9.0% |
| $50,000 to $74,999 | 200 | 27.8% |
| $75,000 to $99,999 | 22 | 3.1% |
| $100,000 to $149,999 | 39 | 5.4% |
| $150,000 to $199,999 | 25 | 3.5% |
| $200,000+ | 0 | 0.0% |
Household Income by Householder Age in Winnsboro Mills
The median household income in Winnsboro Mills is $34,708, with the highest median household income of $51,034 found in the 45 to 64 years age bracket for the primary householder. A total of 493 households (68.5%) fall into this category. Meanwhile, the 15 to 24 years age bracket for the primary householder has the lowest median household income of $0, with 40 households (5.6%) in this group.
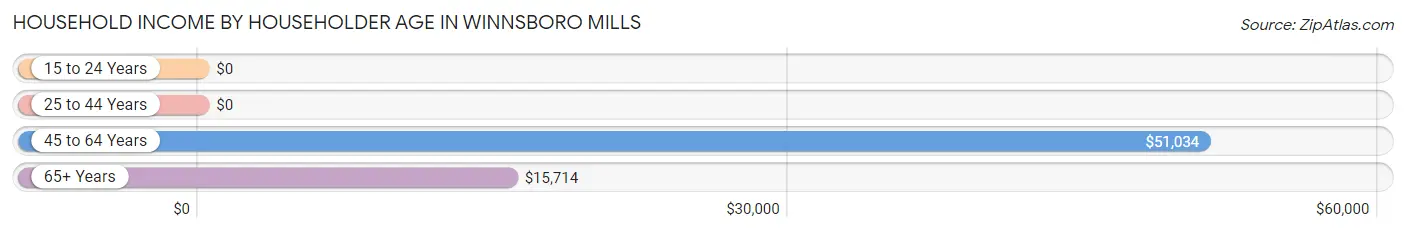
| Income Bracket | # Households | Median Income |
| 15 to 24 Years | 40 (5.6%) | $0 |
| 25 to 44 Years | 117 (16.3%) | $0 |
| 45 to 64 Years | 493 (68.5%) | $51,034 |
| 65+ Years | 70 (9.7%) | $15,714 |
| Total | 720 (100.0%) | $34,708 |
Poverty in Winnsboro Mills
Income Below Poverty by Sex and Age in Winnsboro Mills
With 16.5% poverty level for males and 34.7% for females among the residents of Winnsboro Mills, under 5 year old males and under 5 year old females are the most vulnerable to poverty, with 6 males (100.0%) and 23 females (100.0%) in their respective age groups living below the poverty level.
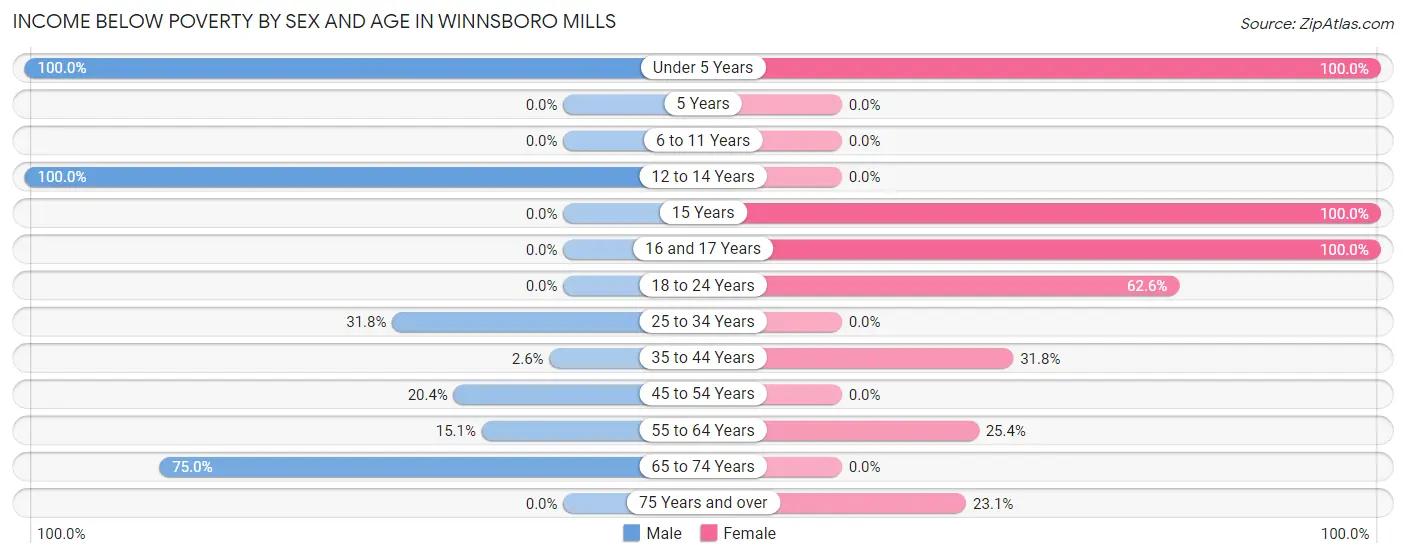
| Age Bracket | Male | Female |
| Under 5 Years | 6 (100.0%) | 23 (100.0%) |
| 5 Years | 0 (0.0%) | 0 (0.0%) |
| 6 to 11 Years | 0 (0.0%) | 0 (0.0%) |
| 12 to 14 Years | 20 (100.0%) | 0 (0.0%) |
| 15 Years | 0 (0.0%) | 36 (100.0%) |
| 16 and 17 Years | 0 (0.0%) | 36 (100.0%) |
| 18 to 24 Years | 0 (0.0%) | 72 (62.6%) |
| 25 to 34 Years | 40 (31.8%) | 0 (0.0%) |
| 35 to 44 Years | 5 (2.6%) | 35 (31.8%) |
| 45 to 54 Years | 23 (20.3%) | 0 (0.0%) |
| 55 to 64 Years | 28 (15.1%) | 62 (25.4%) |
| 65 to 74 Years | 24 (75.0%) | 0 (0.0%) |
| 75 Years and over | 0 (0.0%) | 12 (23.1%) |
| Total | 146 (16.5%) | 276 (34.7%) |
Income Above Poverty by Sex and Age in Winnsboro Mills
According to the poverty statistics in Winnsboro Mills, males aged 5 years and females aged 25 to 34 years are the age groups that are most secure financially, with 100.0% of males and 100.0% of females in these age groups living above the poverty line.
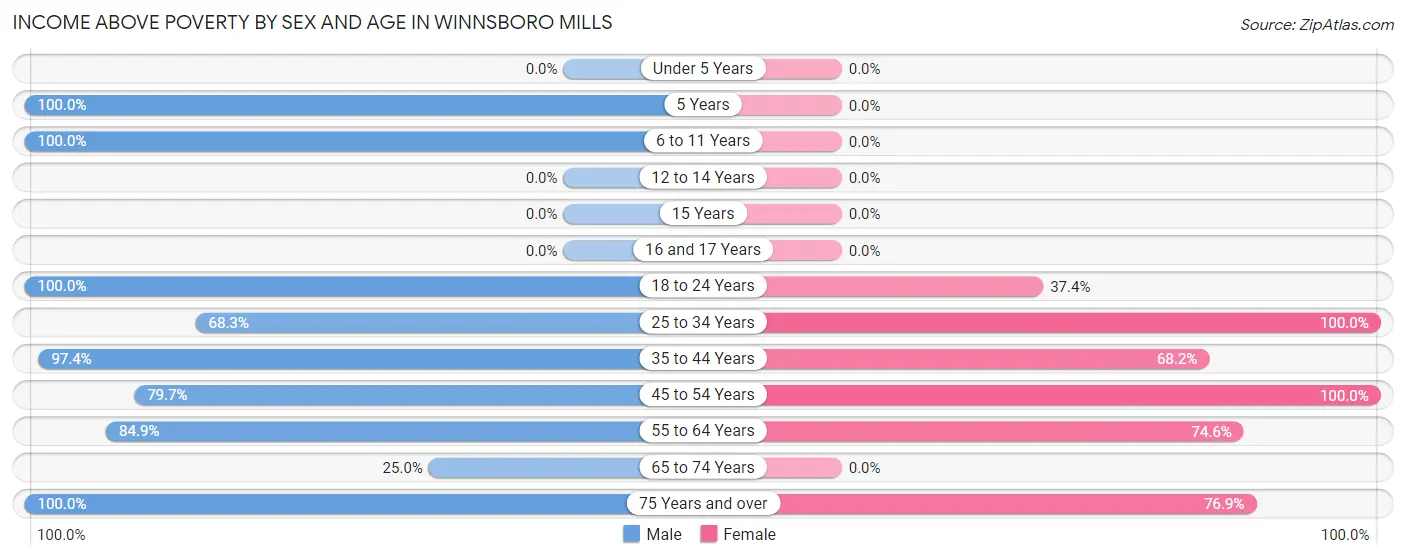
| Age Bracket | Male | Female |
| Under 5 Years | 0 (0.0%) | 0 (0.0%) |
| 5 Years | 25 (100.0%) | 0 (0.0%) |
| 6 to 11 Years | 35 (100.0%) | 0 (0.0%) |
| 12 to 14 Years | 0 (0.0%) | 0 (0.0%) |
| 15 Years | 0 (0.0%) | 0 (0.0%) |
| 16 and 17 Years | 0 (0.0%) | 0 (0.0%) |
| 18 to 24 Years | 136 (100.0%) | 43 (37.4%) |
| 25 to 34 Years | 86 (68.2%) | 50 (100.0%) |
| 35 to 44 Years | 189 (97.4%) | 75 (68.2%) |
| 45 to 54 Years | 90 (79.6%) | 130 (100.0%) |
| 55 to 64 Years | 157 (84.9%) | 182 (74.6%) |
| 65 to 74 Years | 8 (25.0%) | 0 (0.0%) |
| 75 Years and over | 14 (100.0%) | 40 (76.9%) |
| Total | 740 (83.5%) | 520 (65.3%) |
Income Below Poverty Among Married-Couple Families in Winnsboro Mills
The poverty statistics for married-couple families in Winnsboro Mills show that 22.1% or 34 of the total 154 families live below the poverty line. Families with 3 or 4 children have the highest poverty rate of 100.0%, comprising of 24 families. On the other hand, families with no children have the lowest poverty rate of 7.7%, which includes 10 families.
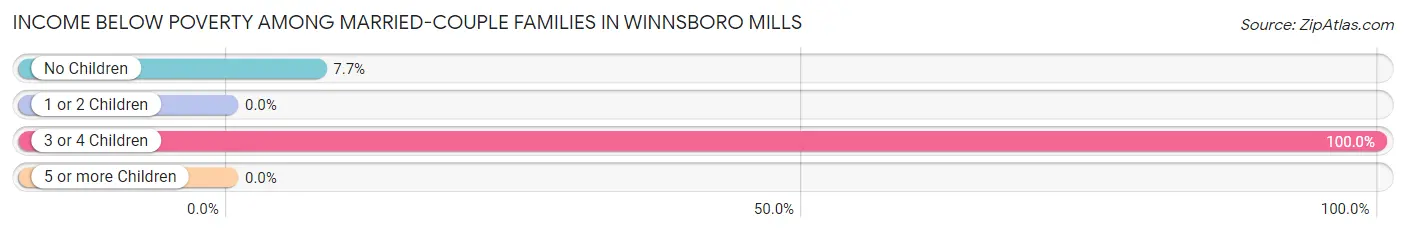
| Children | Above Poverty | Below Poverty |
| No Children | 120 (92.3%) | 10 (7.7%) |
| 1 or 2 Children | 0 (0.0%) | 0 (0.0%) |
| 3 or 4 Children | 0 (0.0%) | 24 (100.0%) |
| 5 or more Children | 0 (0.0%) | 0 (0.0%) |
| Total | 120 (77.9%) | 34 (22.1%) |
Income Below Poverty Among Single-Parent Households in Winnsboro Mills
According to the poverty data in Winnsboro Mills, 100.0% or 28 single-father households and 5.6% or 13 single-mother households are living below the poverty line. Among single-father households, those with no children have the highest poverty rate, with 23 households (100.0%) experiencing poverty. Likewise, among single-mother households, those with 1 or 2 children have the highest poverty rate, with 13 households (13.0%) falling below the poverty line.
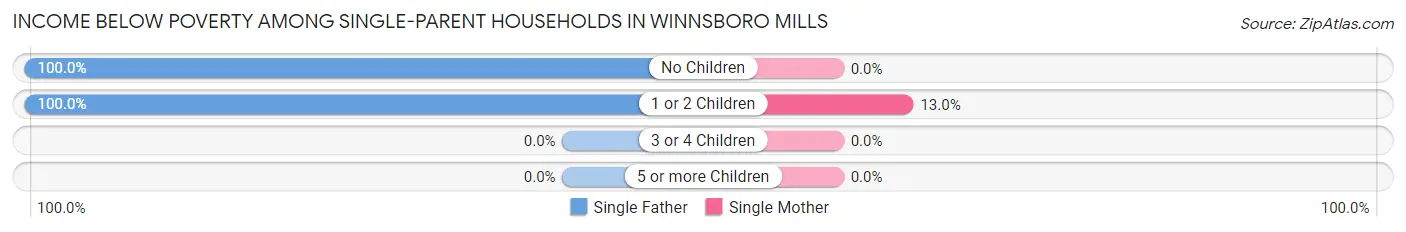
| Children | Single Father | Single Mother |
| No Children | 23 (100.0%) | 0 (0.0%) |
| 1 or 2 Children | 5 (100.0%) | 13 (13.0%) |
| 3 or 4 Children | 0 (0.0%) | 0 (0.0%) |
| 5 or more Children | 0 (0.0%) | 0 (0.0%) |
| Total | 28 (100.0%) | 13 (5.6%) |
Income Below Poverty Among Married-Couple vs Single-Parent Households in Winnsboro Mills
The poverty data for Winnsboro Mills shows that 34 of the married-couple family households (22.1%) and 41 of the single-parent households (15.8%) are living below the poverty level. Within the married-couple family households, those with 3 or 4 children have the highest poverty rate, with 24 households (100.0%) falling below the poverty line. Among the single-parent households, those with 1 or 2 children have the highest poverty rate, with 18 household (17.1%) living below poverty.
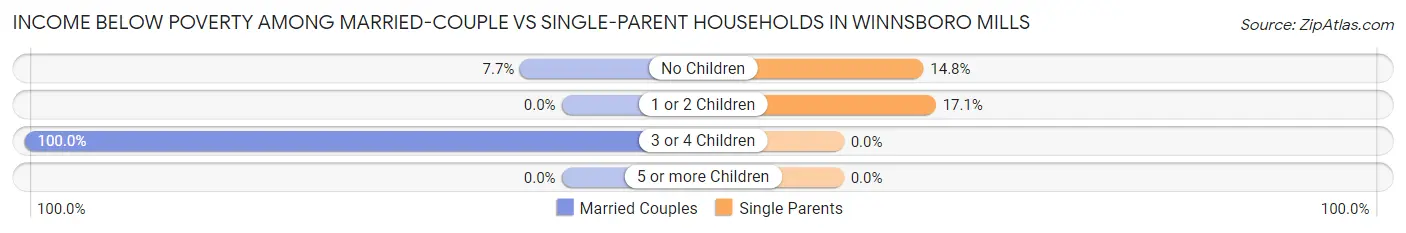
| Children | Married-Couple Families | Single-Parent Households |
| No Children | 10 (7.7%) | 23 (14.8%) |
| 1 or 2 Children | 0 (0.0%) | 18 (17.1%) |
| 3 or 4 Children | 24 (100.0%) | 0 (0.0%) |
| 5 or more Children | 0 (0.0%) | 0 (0.0%) |
| Total | 34 (22.1%) | 41 (15.8%) |
Employment Characteristics in Winnsboro Mills
Employment by Class of Employer in Winnsboro Mills
Among the 634 employed individuals in Winnsboro Mills, private company employees (354 | 55.8%), state government employees (140 | 22.1%), and local government employees (68 | 10.7%) make up the most common classes of employment.
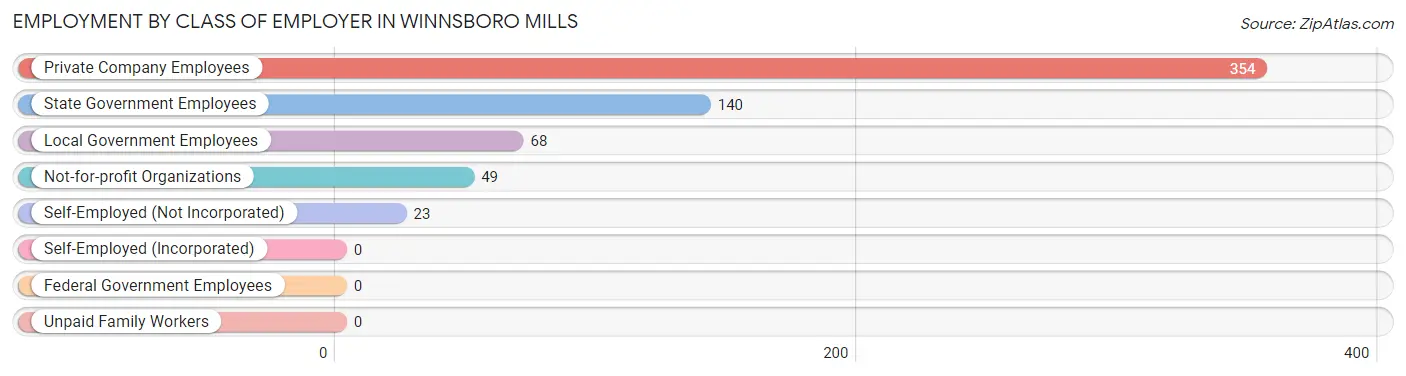
| Employer Class | # Employees | % Employees |
| Private Company Employees | 354 | 55.8% |
| Self-Employed (Incorporated) | 0 | 0.0% |
| Self-Employed (Not Incorporated) | 23 | 3.6% |
| Not-for-profit Organizations | 49 | 7.7% |
| Local Government Employees | 68 | 10.7% |
| State Government Employees | 140 | 22.1% |
| Federal Government Employees | 0 | 0.0% |
| Unpaid Family Workers | 0 | 0.0% |
| Total | 634 | 100.0% |
Employment Status by Age in Winnsboro Mills
According to the labor force statistics for Winnsboro Mills, out of the total population over 16 years of age (1,537), 50.2% or 772 individuals are in the labor force, with 16.2% or 125 of them unemployed. The age group with the highest labor force participation rate is 25 to 29 years, with 100.0% or 86 individuals in the labor force. Within the labor force, the 35 to 44 years age range has the highest percentage of unemployed individuals, with 67.1% or 94 of them being unemployed.
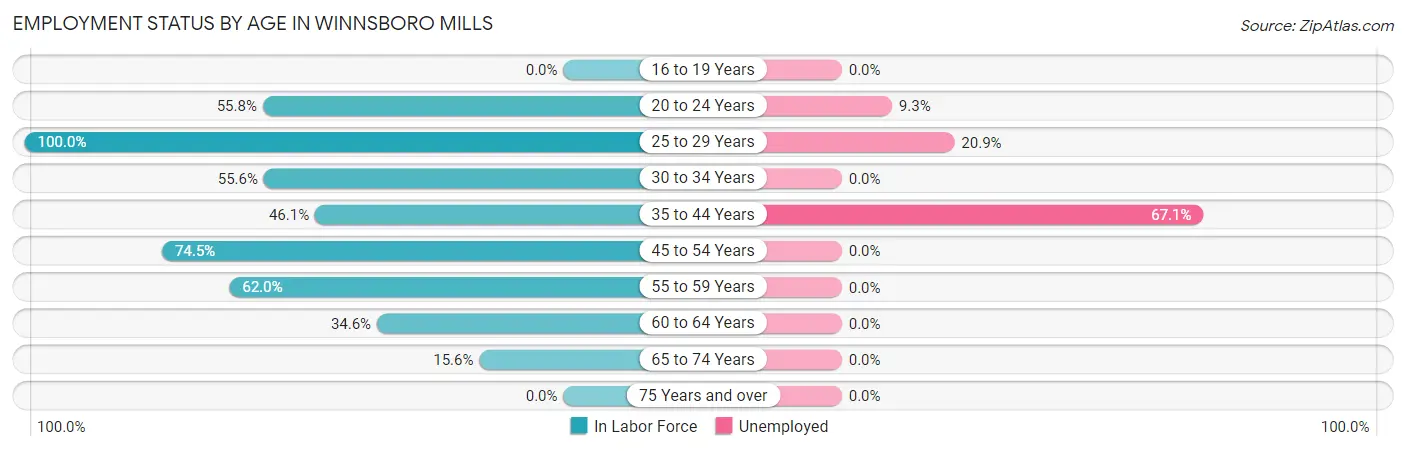
| Age Bracket | In Labor Force | Unemployed |
| 16 to 19 Years | 0 (0.0%) | 0 (0.0%) |
| 20 to 24 Years | 140 (55.8%) | 13 (9.3%) |
| 25 to 29 Years | 86 (100.0%) | 18 (20.9%) |
| 30 to 34 Years | 50 (55.6%) | 0 (0.0%) |
| 35 to 44 Years | 140 (46.1%) | 94 (67.1%) |
| 45 to 54 Years | 181 (74.5%) | 0 (0.0%) |
| 55 to 59 Years | 49 (62.0%) | 0 (0.0%) |
| 60 to 64 Years | 121 (34.6%) | 0 (0.0%) |
| 65 to 74 Years | 5 (15.6%) | 0 (0.0%) |
| 75 Years and over | 0 (0.0%) | 0 (0.0%) |
| Total | 772 (50.2%) | 125 (16.2%) |
Employment Status by Educational Attainment in Winnsboro Mills
According to labor force statistics for Winnsboro Mills, 54.4% of individuals (627) out of the total population between 25 and 64 years of age (1,152) are in the labor force, with 17.9% or 112 of them being unemployed. The group with the highest labor force participation rate are those with the educational attainment of bachelor's degree or higher, with 88.6% or 39 individuals in the labor force. Within the labor force, individuals with less than high school education have the highest percentage of unemployment, with 34.8% or 57 of them being unemployed.
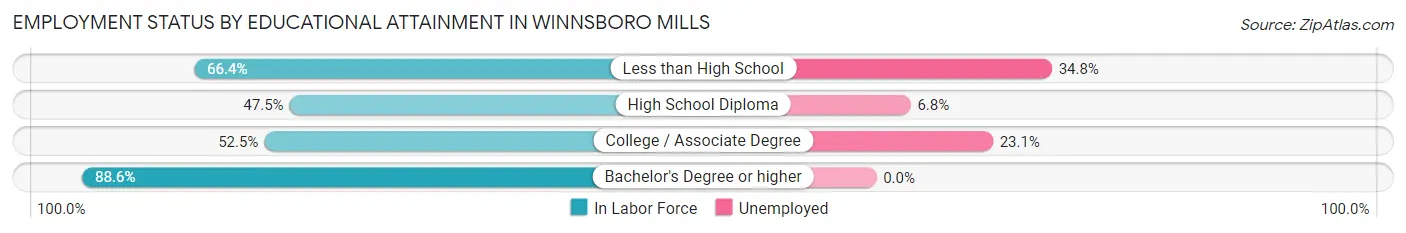
| Educational Attainment | In Labor Force | Unemployed |
| Less than High School | 164 (66.4%) | 86 (34.8%) |
| High School Diploma | 264 (47.5%) | 38 (6.8%) |
| College / Associate Degree | 160 (52.5%) | 70 (23.1%) |
| Bachelor's Degree or higher | 39 (88.6%) | 0 (0.0%) |
| Total | 627 (54.4%) | 206 (17.9%) |
Employment Occupations by Sex in Winnsboro Mills
Management, Business, Science and Arts Occupations
The most common Management, Business, Science and Arts occupations in Winnsboro Mills are Management (68 | 10.5%), Computers, Engineering & Science (46 | 7.1%), Computers & Mathematics (46 | 7.1%), Community & Social Service (22 | 3.4%), and Education Instruction & Library (22 | 3.4%).
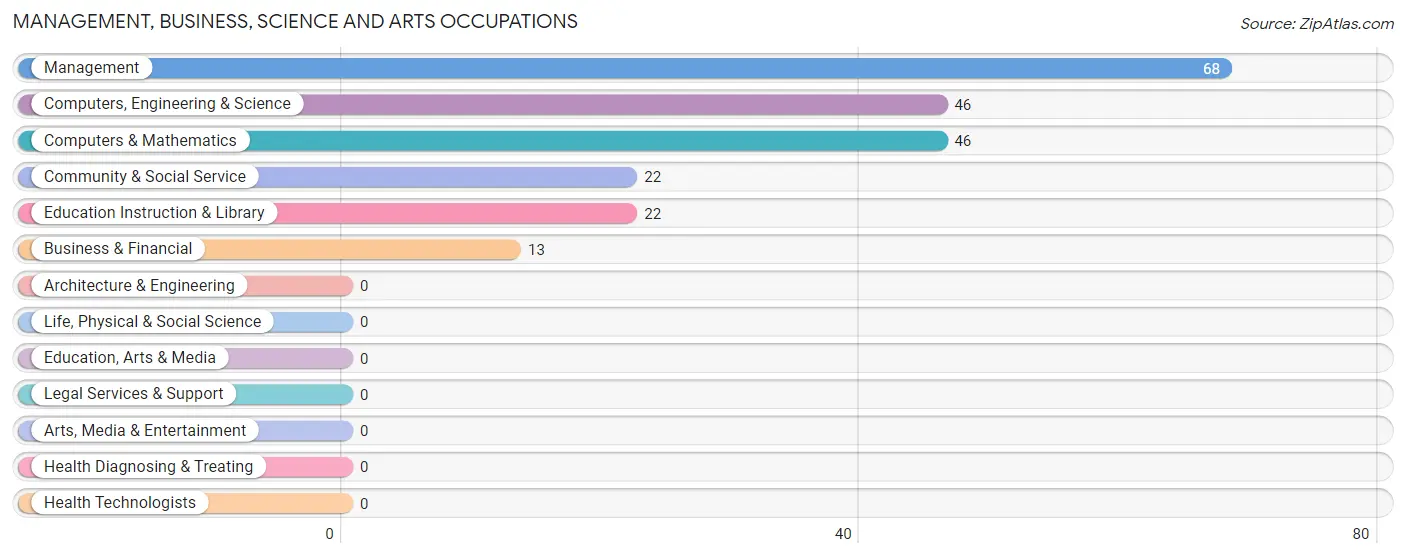
Management, Business, Science and Arts Occupations by Sex
Within the Management, Business, Science and Arts occupations in Winnsboro Mills, the most male-oriented occupations are Community & Social Service (100.0%), Education Instruction & Library (100.0%), and Management (70.6%), while the most female-oriented occupations are Business & Financial (100.0%), Computers, Engineering & Science (100.0%), and Computers & Mathematics (100.0%).
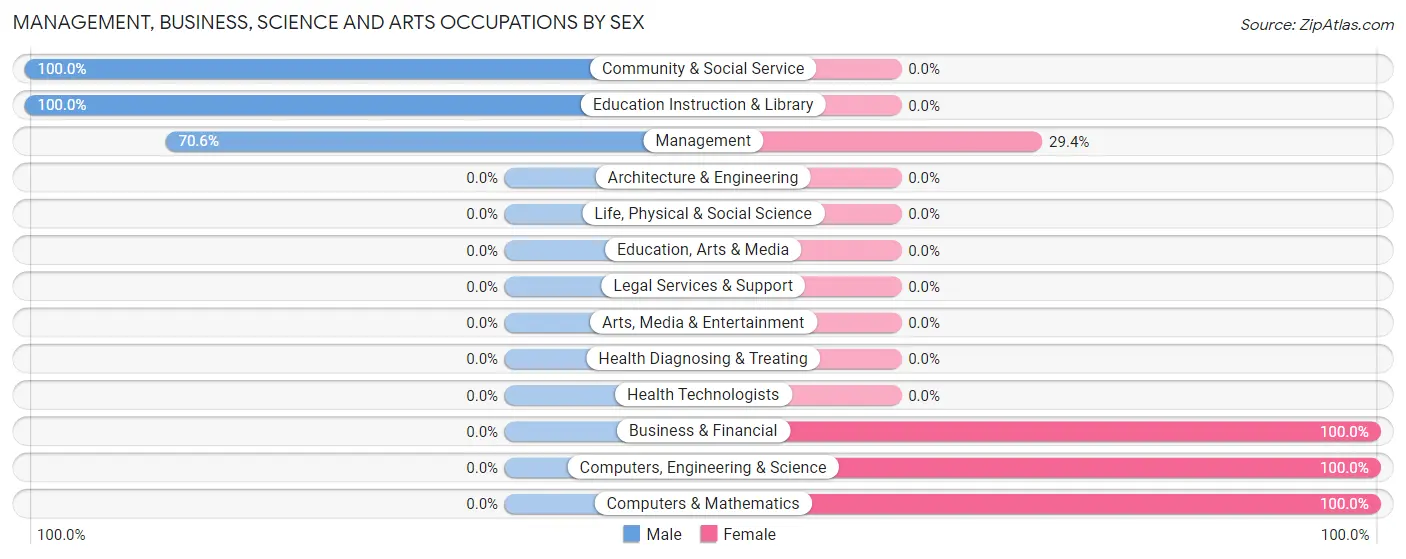
| Occupation | Male | Female |
| Management | 48 (70.6%) | 20 (29.4%) |
| Business & Financial | 0 (0.0%) | 13 (100.0%) |
| Computers, Engineering & Science | 0 (0.0%) | 46 (100.0%) |
| Computers & Mathematics | 0 (0.0%) | 46 (100.0%) |
| Architecture & Engineering | 0 (0.0%) | 0 (0.0%) |
| Life, Physical & Social Science | 0 (0.0%) | 0 (0.0%) |
| Community & Social Service | 22 (100.0%) | 0 (0.0%) |
| Education, Arts & Media | 0 (0.0%) | 0 (0.0%) |
| Legal Services & Support | 0 (0.0%) | 0 (0.0%) |
| Education Instruction & Library | 22 (100.0%) | 0 (0.0%) |
| Arts, Media & Entertainment | 0 (0.0%) | 0 (0.0%) |
| Health Diagnosing & Treating | 0 (0.0%) | 0 (0.0%) |
| Health Technologists | 0 (0.0%) | 0 (0.0%) |
| Total (Category) | 70 (47.0%) | 79 (53.0%) |
| Total (Overall) | 269 (41.6%) | 378 (58.4%) |
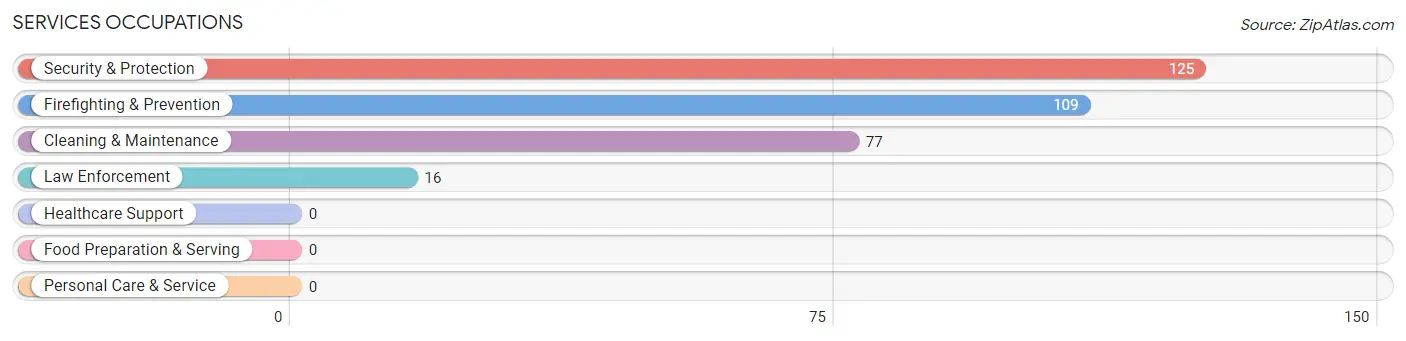
Services Occupations
The most common Services occupations in Winnsboro Mills are Security & Protection (125 | 19.3%), Firefighting & Prevention (109 | 16.9%), Cleaning & Maintenance (77 | 11.9%), and Law Enforcement (16 | 2.5%).
Services Occupations by Sex
Within the Services occupations in Winnsboro Mills, the most male-oriented occupations are Firefighting & Prevention (100.0%), and Security & Protection (87.2%), while the most female-oriented occupations are Law Enforcement (100.0%), Cleaning & Maintenance (100.0%), and Security & Protection (12.8%).
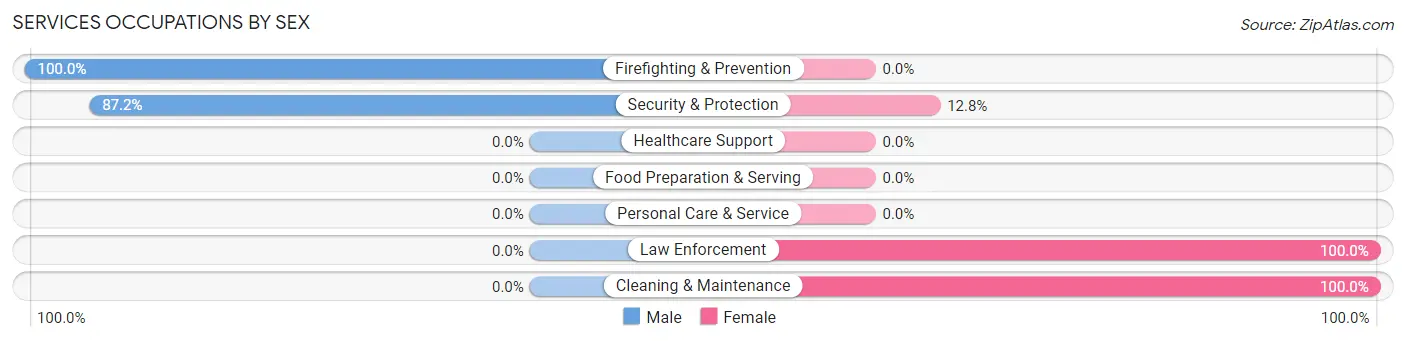
| Occupation | Male | Female |
| Healthcare Support | 0 (0.0%) | 0 (0.0%) |
| Security & Protection | 109 (87.2%) | 16 (12.8%) |
| Firefighting & Prevention | 109 (100.0%) | 0 (0.0%) |
| Law Enforcement | 0 (0.0%) | 16 (100.0%) |
| Food Preparation & Serving | 0 (0.0%) | 0 (0.0%) |
| Cleaning & Maintenance | 0 (0.0%) | 77 (100.0%) |
| Personal Care & Service | 0 (0.0%) | 0 (0.0%) |
| Total (Category) | 109 (54.0%) | 93 (46.0%) |
| Total (Overall) | 269 (41.6%) | 378 (58.4%) |
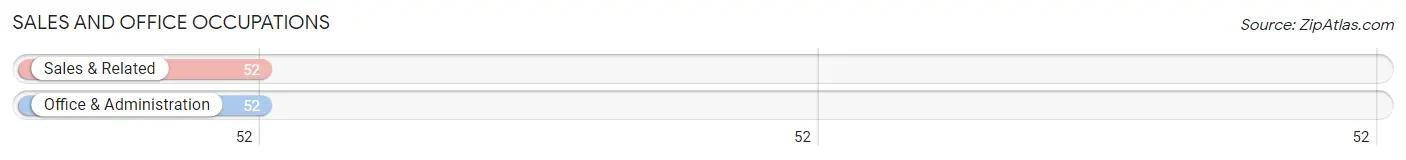
Sales and Office Occupations
The most common Sales and Office occupations in Winnsboro Mills are Sales & Related (52 | 8.0%), and Office & Administration (52 | 8.0%).
Sales and Office Occupations by Sex
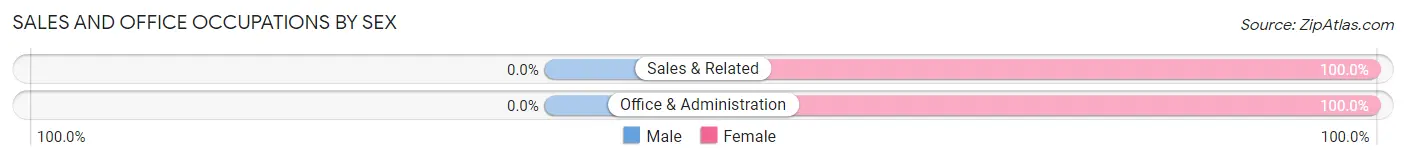
| Occupation | Male | Female |
| Sales & Related | 0 (0.0%) | 52 (100.0%) |
| Office & Administration | 0 (0.0%) | 52 (100.0%) |
| Total (Category) | 0 (0.0%) | 104 (100.0%) |
| Total (Overall) | 269 (41.6%) | 378 (58.4%) |
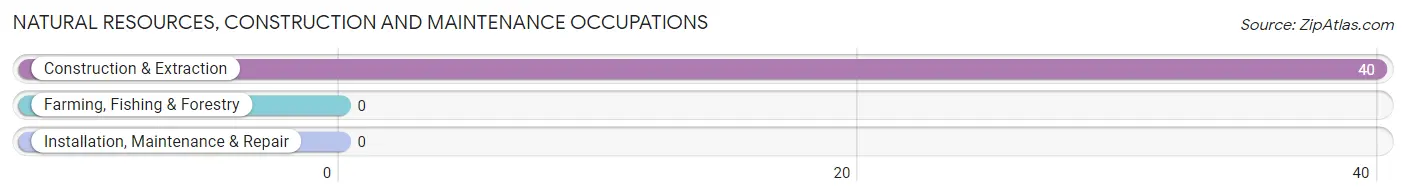
Natural Resources, Construction and Maintenance Occupations
The most common Natural Resources, Construction and Maintenance occupations in Winnsboro Mills are , and Construction & Extraction (40 | 6.2%).
Natural Resources, Construction and Maintenance Occupations by Sex
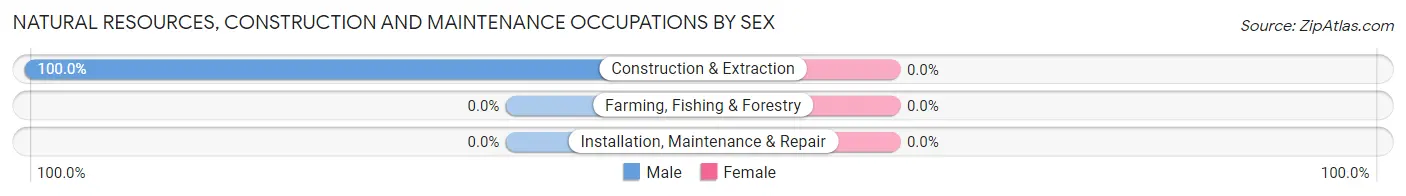
| Occupation | Male | Female |
| Farming, Fishing & Forestry | 0 (0.0%) | 0 (0.0%) |
| Construction & Extraction | 40 (100.0%) | 0 (0.0%) |
| Installation, Maintenance & Repair | 0 (0.0%) | 0 (0.0%) |
| Total (Category) | 40 (100.0%) | 0 (0.0%) |
| Total (Overall) | 269 (41.6%) | 378 (58.4%) |
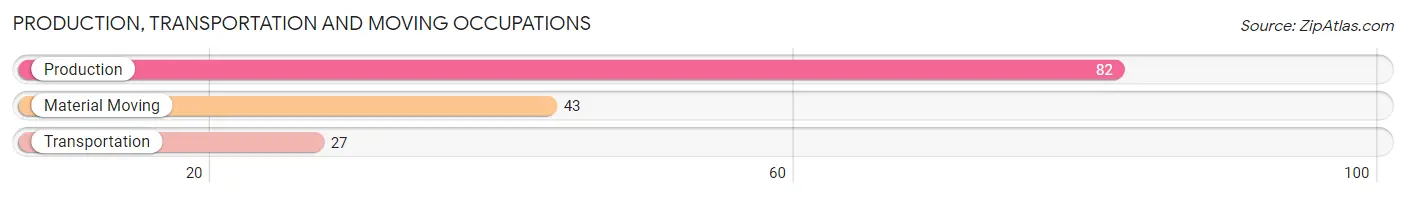
Production, Transportation and Moving Occupations
The most common Production, Transportation and Moving occupations in Winnsboro Mills are Production (82 | 12.7%), Material Moving (43 | 6.7%), and Transportation (27 | 4.2%).
Production, Transportation and Moving Occupations by Sex
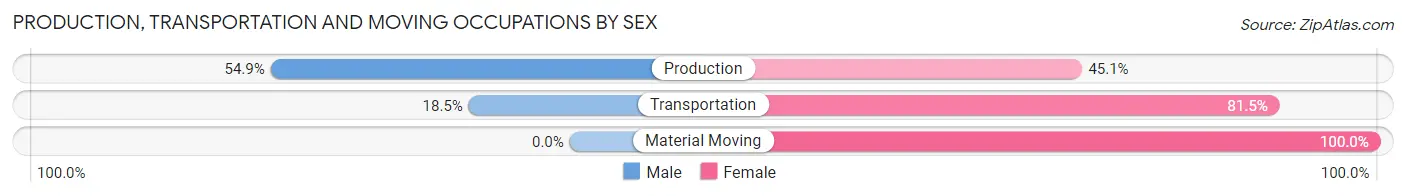
| Occupation | Male | Female |
| Production | 45 (54.9%) | 37 (45.1%) |
| Transportation | 5 (18.5%) | 22 (81.5%) |
| Material Moving | 0 (0.0%) | 43 (100.0%) |
| Total (Category) | 50 (32.9%) | 102 (67.1%) |
| Total (Overall) | 269 (41.6%) | 378 (58.4%) |
Employment Industries by Sex in Winnsboro Mills
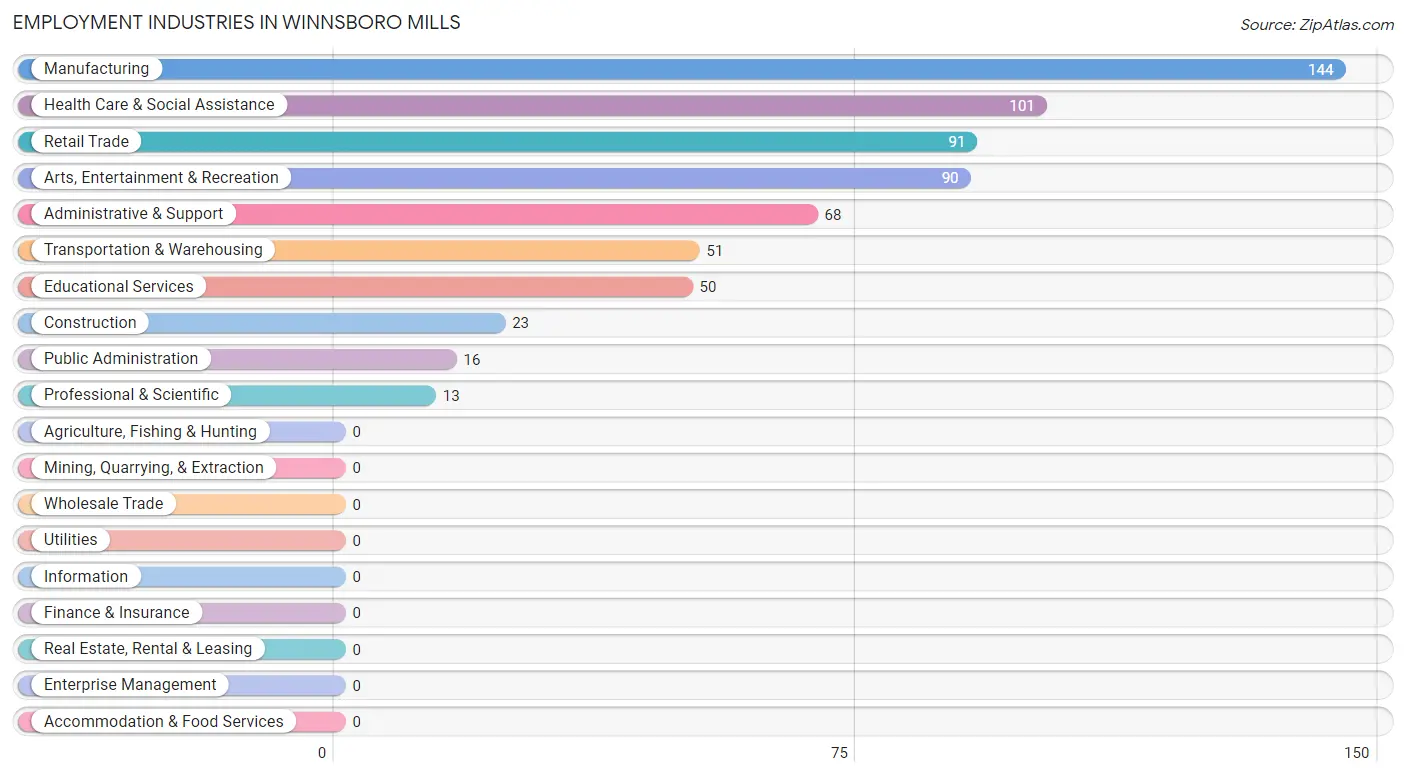
Employment Industries in Winnsboro Mills
The major employment industries in Winnsboro Mills include Manufacturing (144 | 22.3%), Health Care & Social Assistance (101 | 15.6%), Retail Trade (91 | 14.1%), Arts, Entertainment & Recreation (90 | 13.9%), and Administrative & Support (68 | 10.5%).
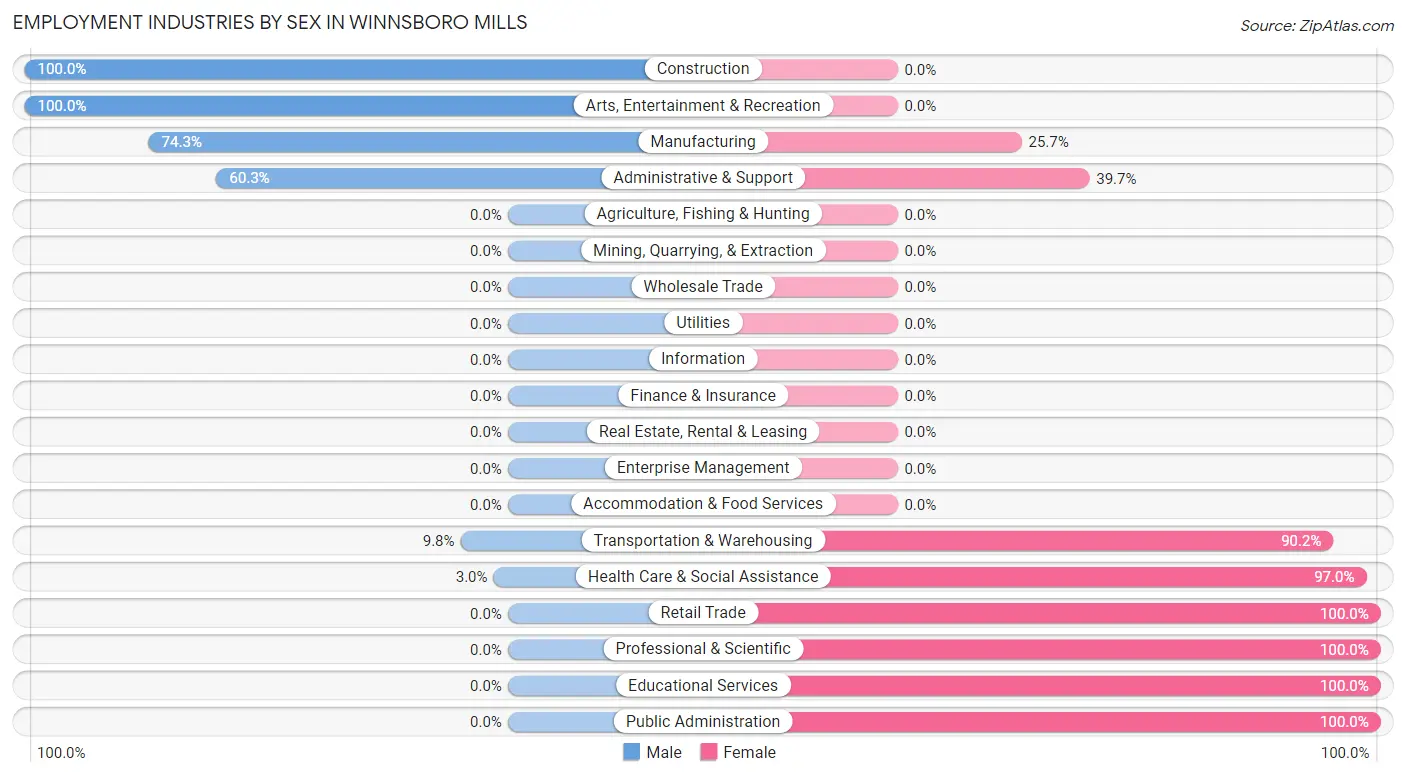
Employment Industries by Sex in Winnsboro Mills
The Winnsboro Mills industries that see more men than women are Construction (100.0%), Arts, Entertainment & Recreation (100.0%), and Manufacturing (74.3%), whereas the industries that tend to have a higher number of women are Retail Trade (100.0%), Professional & Scientific (100.0%), and Educational Services (100.0%).
| Industry | Male | Female |
| Agriculture, Fishing & Hunting | 0 (0.0%) | 0 (0.0%) |
| Mining, Quarrying, & Extraction | 0 (0.0%) | 0 (0.0%) |
| Construction | 23 (100.0%) | 0 (0.0%) |
| Manufacturing | 107 (74.3%) | 37 (25.7%) |
| Wholesale Trade | 0 (0.0%) | 0 (0.0%) |
| Retail Trade | 0 (0.0%) | 91 (100.0%) |
| Transportation & Warehousing | 5 (9.8%) | 46 (90.2%) |
| Utilities | 0 (0.0%) | 0 (0.0%) |
| Information | 0 (0.0%) | 0 (0.0%) |
| Finance & Insurance | 0 (0.0%) | 0 (0.0%) |
| Real Estate, Rental & Leasing | 0 (0.0%) | 0 (0.0%) |
| Professional & Scientific | 0 (0.0%) | 13 (100.0%) |
| Enterprise Management | 0 (0.0%) | 0 (0.0%) |
| Administrative & Support | 41 (60.3%) | 27 (39.7%) |
| Educational Services | 0 (0.0%) | 50 (100.0%) |
| Health Care & Social Assistance | 3 (3.0%) | 98 (97.0%) |
| Arts, Entertainment & Recreation | 90 (100.0%) | 0 (0.0%) |
| Accommodation & Food Services | 0 (0.0%) | 0 (0.0%) |
| Public Administration | 0 (0.0%) | 16 (100.0%) |
| Total | 269 (41.6%) | 378 (58.4%) |
Education in Winnsboro Mills
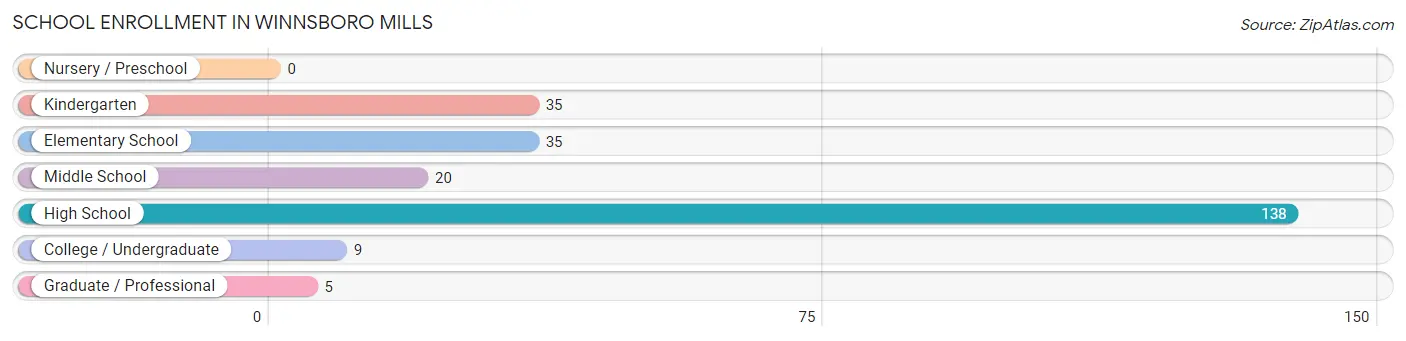
School Enrollment in Winnsboro Mills
The most common levels of schooling among the 242 students in Winnsboro Mills are high school (138 | 57.0%), kindergarten (35 | 14.5%), and elementary school (35 | 14.5%).
| School Level | # Students | % Students |
| Nursery / Preschool | 0 | 0.0% |
| Kindergarten | 35 | 14.5% |
| Elementary School | 35 | 14.5% |
| Middle School | 20 | 8.3% |
| High School | 138 | 57.0% |
| College / Undergraduate | 9 | 3.7% |
| Graduate / Professional | 5 | 2.1% |
| Total | 242 | 100.0% |
School Enrollment by Age by Funding Source in Winnsboro Mills
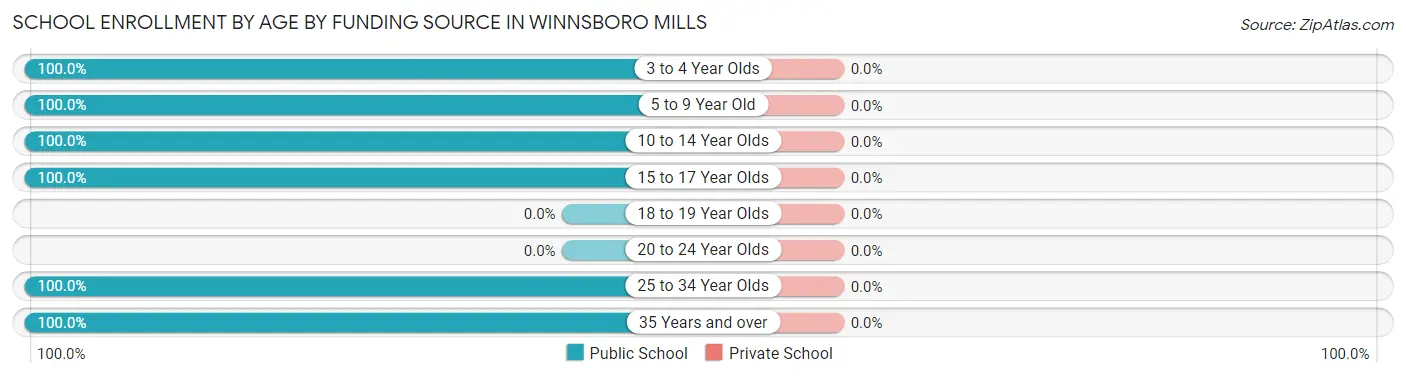
| Age Bracket | Public School | Private School |
| 3 to 4 Year Olds | 10 (100.0%) | 0 (0.0%) |
| 5 to 9 Year Old | 60 (100.0%) | 0 (0.0%) |
| 10 to 14 Year Olds | 20 (100.0%) | 0 (0.0%) |
| 15 to 17 Year Olds | 72 (100.0%) | 0 (0.0%) |
| 18 to 19 Year Olds | 0 (0.0%) | 0 (0.0%) |
| 20 to 24 Year Olds | 0 (0.0%) | 0 (0.0%) |
| 25 to 34 Year Olds | 46 (100.0%) | 0 (0.0%) |
| 35 Years and over | 34 (100.0%) | 0 (0.0%) |
| Total | 242 (100.0%) | 0 (0.0%) |
Educational Attainment by Field of Study in Winnsboro Mills
Business (22 | 50.0%), psychology (17 | 38.6%), and liberal arts & history (5 | 11.4%) are the most common fields of study among 44 individuals in Winnsboro Mills who have obtained a bachelor's degree or higher.
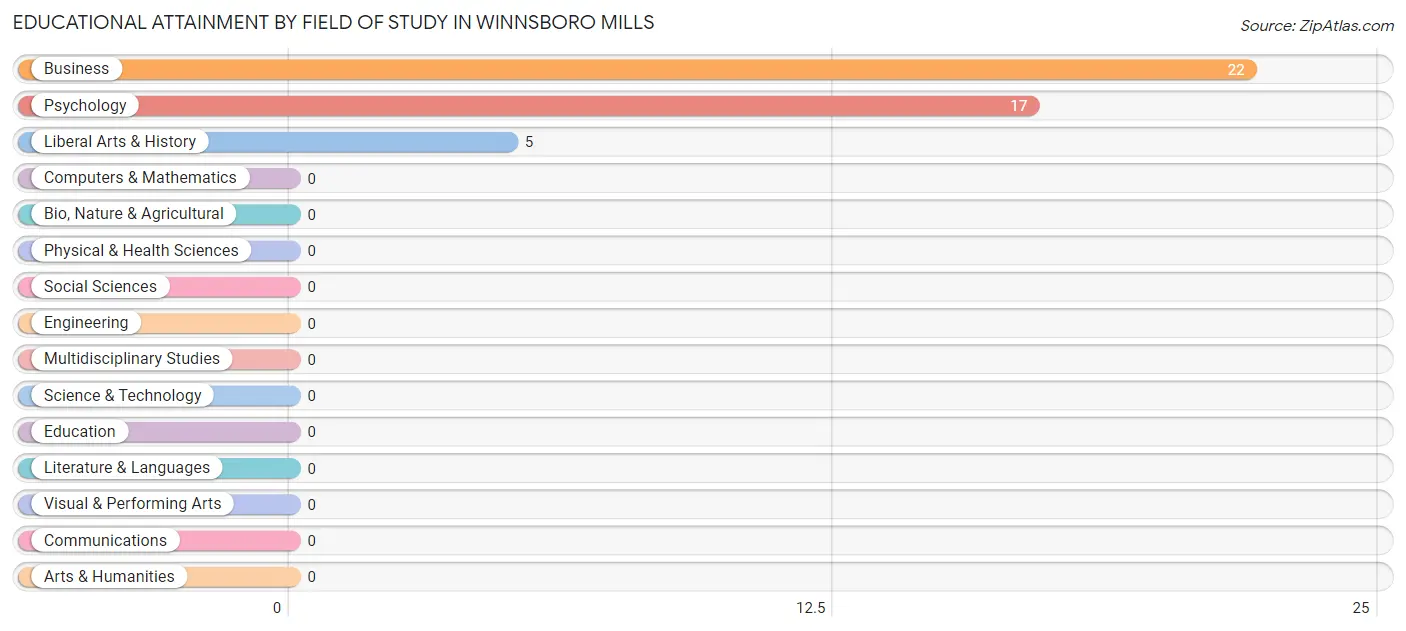
| Field of Study | # Graduates | % Graduates |
| Computers & Mathematics | 0 | 0.0% |
| Bio, Nature & Agricultural | 0 | 0.0% |
| Physical & Health Sciences | 0 | 0.0% |
| Psychology | 17 | 38.6% |
| Social Sciences | 0 | 0.0% |
| Engineering | 0 | 0.0% |
| Multidisciplinary Studies | 0 | 0.0% |
| Science & Technology | 0 | 0.0% |
| Business | 22 | 50.0% |
| Education | 0 | 0.0% |
| Literature & Languages | 0 | 0.0% |
| Liberal Arts & History | 5 | 11.4% |
| Visual & Performing Arts | 0 | 0.0% |
| Communications | 0 | 0.0% |
| Arts & Humanities | 0 | 0.0% |
| Total | 44 | 100.0% |
Transportation & Commute in Winnsboro Mills
Vehicle Availability by Sex in Winnsboro Mills
The most prevalent vehicle ownership categories in Winnsboro Mills are males with 3 vehicles (87, accounting for 32.7%) and females with 3 vehicles (36, making up 23.8%).
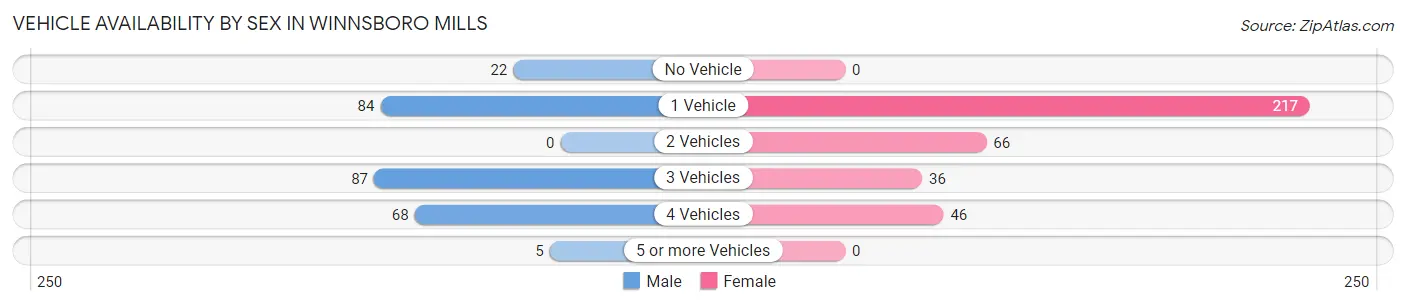
| Vehicles Available | Male | Female |
| No Vehicle | 22 (8.3%) | 0 (0.0%) |
| 1 Vehicle | 84 (31.6%) | 217 (59.5%) |
| 2 Vehicles | 0 (0.0%) | 66 (18.1%) |
| 3 Vehicles | 87 (32.7%) | 36 (9.9%) |
| 4 Vehicles | 68 (25.6%) | 46 (12.6%) |
| 5 or more Vehicles | 5 (1.9%) | 0 (0.0%) |
| Total | 266 (100.0%) | 365 (100.0%) |
Commute Time in Winnsboro Mills
The most frequently occuring commute durations in Winnsboro Mills are 15 to 19 minutes (216 commuters, 35.2%), 10 to 14 minutes (113 commuters, 18.4%), and 5 to 9 minutes (89 commuters, 14.5%).
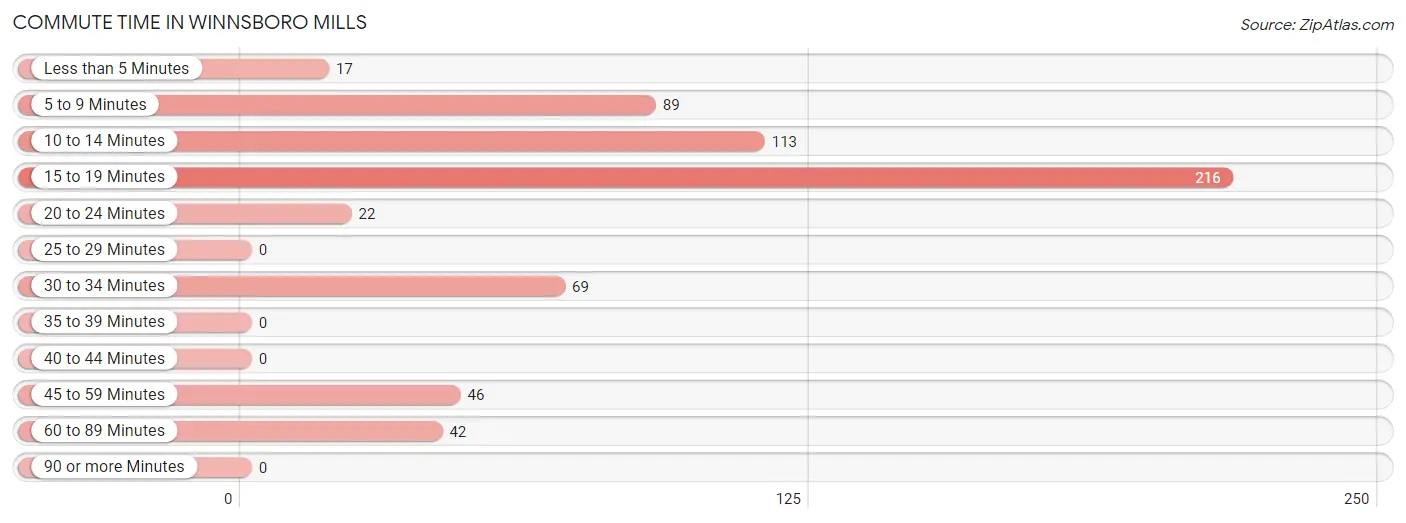
| Commute Time | # Commuters | % Commuters |
| Less than 5 Minutes | 17 | 2.8% |
| 5 to 9 Minutes | 89 | 14.5% |
| 10 to 14 Minutes | 113 | 18.4% |
| 15 to 19 Minutes | 216 | 35.2% |
| 20 to 24 Minutes | 22 | 3.6% |
| 25 to 29 Minutes | 0 | 0.0% |
| 30 to 34 Minutes | 69 | 11.2% |
| 35 to 39 Minutes | 0 | 0.0% |
| 40 to 44 Minutes | 0 | 0.0% |
| 45 to 59 Minutes | 46 | 7.5% |
| 60 to 89 Minutes | 42 | 6.8% |
| 90 or more Minutes | 0 | 0.0% |
Commute Time by Sex in Winnsboro Mills
The most common commute times in Winnsboro Mills are 15 to 19 minutes (180 commuters, 66.9%) for males and 10 to 14 minutes (105 commuters, 30.4%) for females.
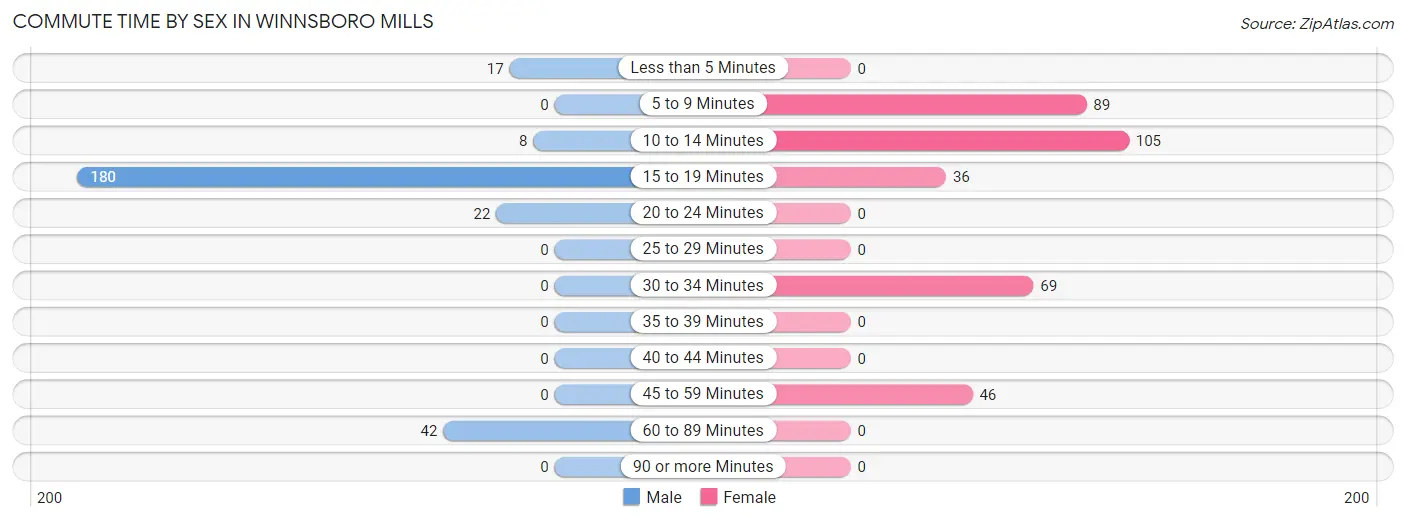
| Commute Time | Male | Female |
| Less than 5 Minutes | 17 (6.3%) | 0 (0.0%) |
| 5 to 9 Minutes | 0 (0.0%) | 89 (25.8%) |
| 10 to 14 Minutes | 8 (3.0%) | 105 (30.4%) |
| 15 to 19 Minutes | 180 (66.9%) | 36 (10.4%) |
| 20 to 24 Minutes | 22 (8.2%) | 0 (0.0%) |
| 25 to 29 Minutes | 0 (0.0%) | 0 (0.0%) |
| 30 to 34 Minutes | 0 (0.0%) | 69 (20.0%) |
| 35 to 39 Minutes | 0 (0.0%) | 0 (0.0%) |
| 40 to 44 Minutes | 0 (0.0%) | 0 (0.0%) |
| 45 to 59 Minutes | 0 (0.0%) | 46 (13.3%) |
| 60 to 89 Minutes | 42 (15.6%) | 0 (0.0%) |
| 90 or more Minutes | 0 (0.0%) | 0 (0.0%) |
Time of Departure to Work by Sex in Winnsboro Mills
The most frequent times of departure to work in Winnsboro Mills are 5:30 AM to 5:59 AM (108, 40.2%) for males and 7:00 AM to 7:29 AM (89, 25.8%) for females.
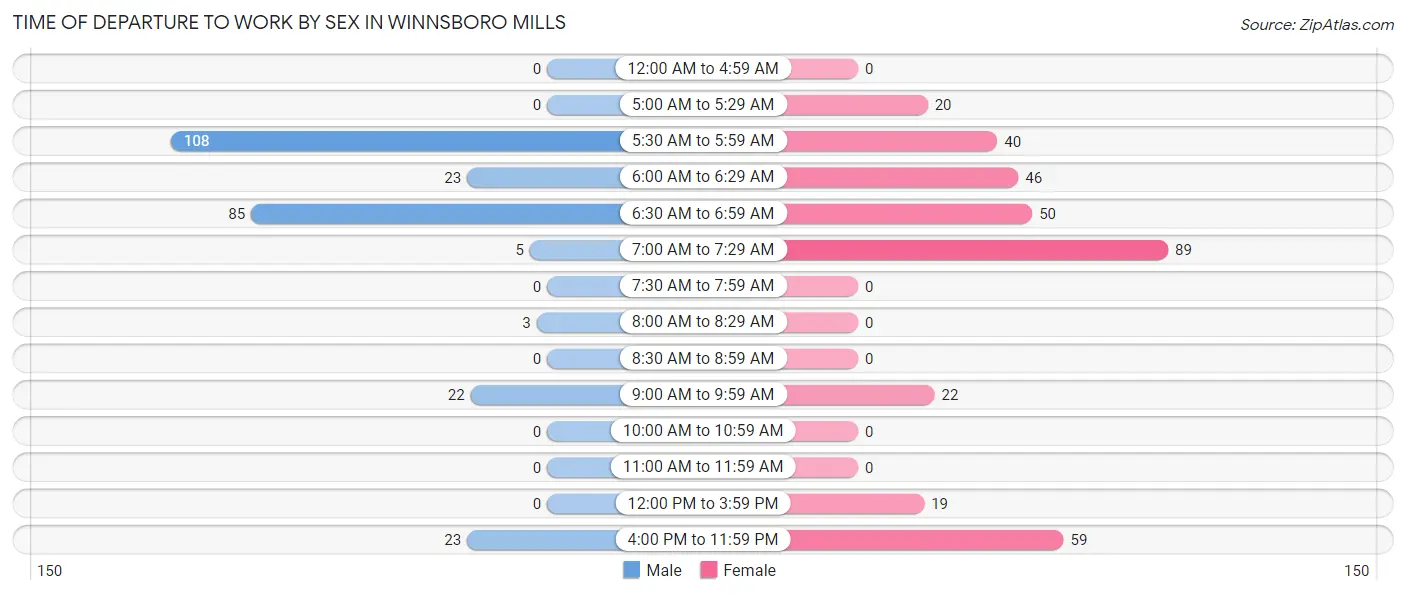
| Time of Departure | Male | Female |
| 12:00 AM to 4:59 AM | 0 (0.0%) | 0 (0.0%) |
| 5:00 AM to 5:29 AM | 0 (0.0%) | 20 (5.8%) |
| 5:30 AM to 5:59 AM | 108 (40.2%) | 40 (11.6%) |
| 6:00 AM to 6:29 AM | 23 (8.6%) | 46 (13.3%) |
| 6:30 AM to 6:59 AM | 85 (31.6%) | 50 (14.5%) |
| 7:00 AM to 7:29 AM | 5 (1.9%) | 89 (25.8%) |
| 7:30 AM to 7:59 AM | 0 (0.0%) | 0 (0.0%) |
| 8:00 AM to 8:29 AM | 3 (1.1%) | 0 (0.0%) |
| 8:30 AM to 8:59 AM | 0 (0.0%) | 0 (0.0%) |
| 9:00 AM to 9:59 AM | 22 (8.2%) | 22 (6.4%) |
| 10:00 AM to 10:59 AM | 0 (0.0%) | 0 (0.0%) |
| 11:00 AM to 11:59 AM | 0 (0.0%) | 0 (0.0%) |
| 12:00 PM to 3:59 PM | 0 (0.0%) | 19 (5.5%) |
| 4:00 PM to 11:59 PM | 23 (8.6%) | 59 (17.1%) |
| Total | 269 (100.0%) | 345 (100.0%) |
Housing Occupancy in Winnsboro Mills
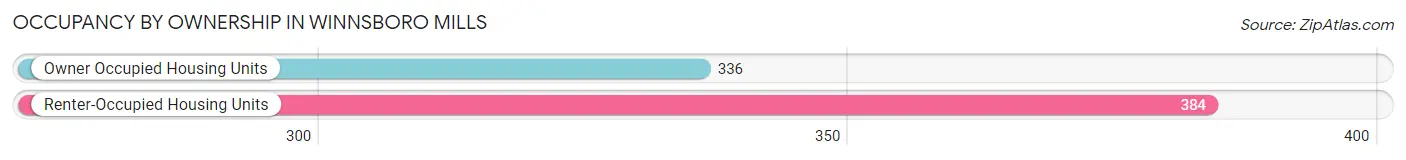
Occupancy by Ownership in Winnsboro Mills
Of the total 720 dwellings in Winnsboro Mills, owner-occupied units account for 336 (46.7%), while renter-occupied units make up 384 (53.3%).
| Occupancy | # Housing Units | % Housing Units |
| Owner Occupied Housing Units | 336 | 46.7% |
| Renter-Occupied Housing Units | 384 | 53.3% |
| Total Occupied Housing Units | 720 | 100.0% |
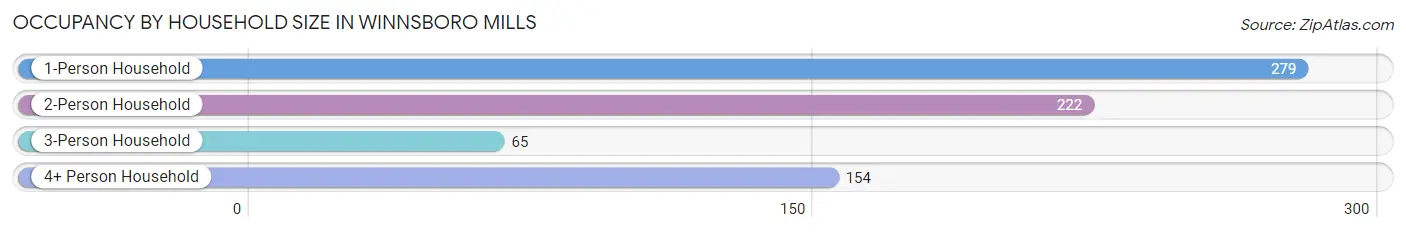
Occupancy by Household Size in Winnsboro Mills
| Household Size | # Housing Units | % Housing Units |
| 1-Person Household | 279 | 38.8% |
| 2-Person Household | 222 | 30.8% |
| 3-Person Household | 65 | 9.0% |
| 4+ Person Household | 154 | 21.4% |
| Total Housing Units | 720 | 100.0% |
Occupancy by Ownership by Household Size in Winnsboro Mills
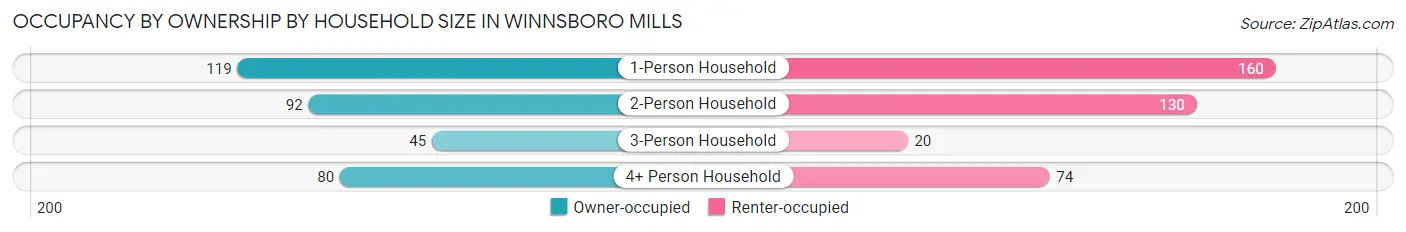
| Household Size | Owner-occupied | Renter-occupied |
| 1-Person Household | 119 (42.6%) | 160 (57.4%) |
| 2-Person Household | 92 (41.4%) | 130 (58.6%) |
| 3-Person Household | 45 (69.2%) | 20 (30.8%) |
| 4+ Person Household | 80 (51.9%) | 74 (48.0%) |
| Total Housing Units | 336 (46.7%) | 384 (53.3%) |
Occupancy by Educational Attainment in Winnsboro Mills
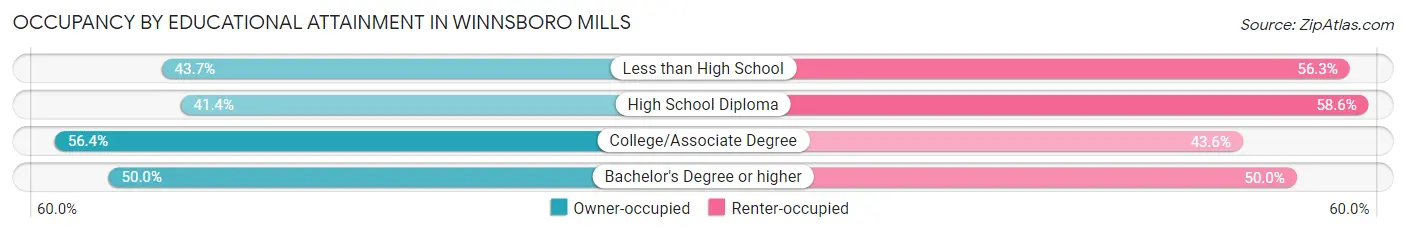
| Household Size | Owner-occupied | Renter-occupied |
| Less than High School | 45 (43.7%) | 58 (56.3%) |
| High School Diploma | 150 (41.4%) | 212 (58.6%) |
| College/Associate Degree | 119 (56.4%) | 92 (43.6%) |
| Bachelor's Degree or higher | 22 (50.0%) | 22 (50.0%) |
Occupancy by Age of Householder in Winnsboro Mills
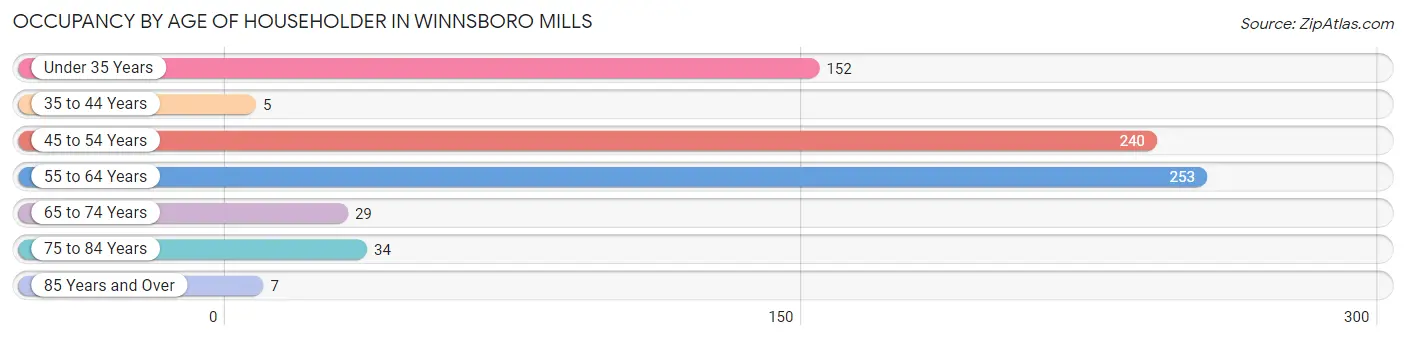
| Age Bracket | # Households | % Households |
| Under 35 Years | 152 | 21.1% |
| 35 to 44 Years | 5 | 0.7% |
| 45 to 54 Years | 240 | 33.3% |
| 55 to 64 Years | 253 | 35.1% |
| 65 to 74 Years | 29 | 4.0% |
| 75 to 84 Years | 34 | 4.7% |
| 85 Years and Over | 7 | 1.0% |
| Total | 720 | 100.0% |
Housing Finances in Winnsboro Mills
Median Income by Occupancy in Winnsboro Mills
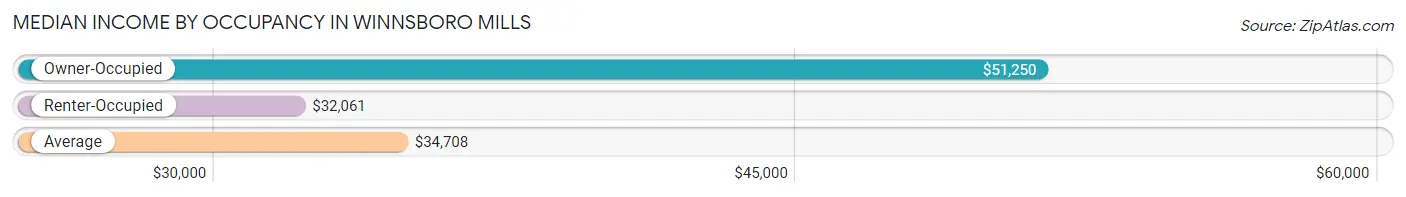
| Occupancy Type | # Households | Median Income |
| Owner-Occupied | 336 (46.7%) | $51,250 |
| Renter-Occupied | 384 (53.3%) | $32,061 |
| Average | 720 (100.0%) | $34,708 |
Occupancy by Householder Income Bracket in Winnsboro Mills
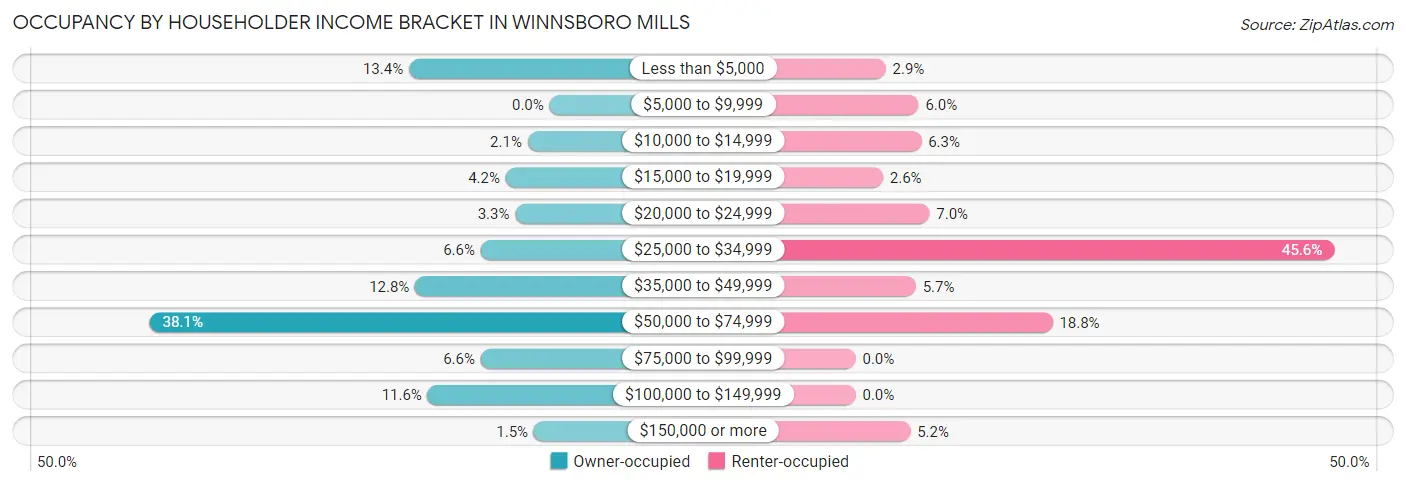
| Income Bracket | Owner-occupied | Renter-occupied |
| Less than $5,000 | 45 (13.4%) | 11 (2.9%) |
| $5,000 to $9,999 | 0 (0.0%) | 23 (6.0%) |
| $10,000 to $14,999 | 7 (2.1%) | 24 (6.2%) |
| $15,000 to $19,999 | 14 (4.2%) | 10 (2.6%) |
| $20,000 to $24,999 | 11 (3.3%) | 27 (7.0%) |
| $25,000 to $34,999 | 22 (6.6%) | 175 (45.6%) |
| $35,000 to $49,999 | 43 (12.8%) | 22 (5.7%) |
| $50,000 to $74,999 | 128 (38.1%) | 72 (18.8%) |
| $75,000 to $99,999 | 22 (6.6%) | 0 (0.0%) |
| $100,000 to $149,999 | 39 (11.6%) | 0 (0.0%) |
| $150,000 or more | 5 (1.5%) | 20 (5.2%) |
| Total | 336 (100.0%) | 384 (100.0%) |
Monthly Housing Cost Tiers in Winnsboro Mills
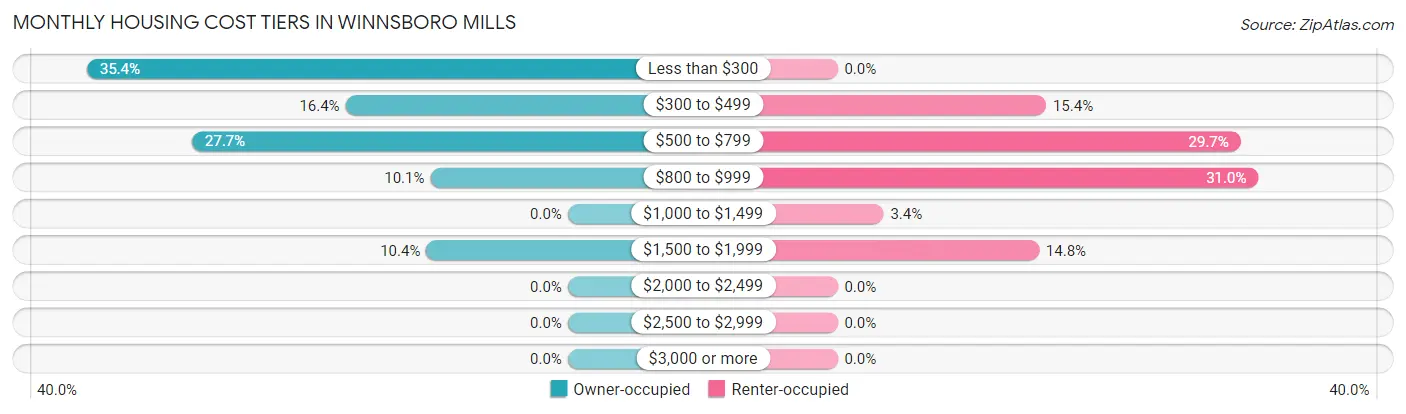
| Monthly Cost | Owner-occupied | Renter-occupied |
| Less than $300 | 119 (35.4%) | 0 (0.0%) |
| $300 to $499 | 55 (16.4%) | 59 (15.4%) |
| $500 to $799 | 93 (27.7%) | 114 (29.7%) |
| $800 to $999 | 34 (10.1%) | 119 (31.0%) |
| $1,000 to $1,499 | 0 (0.0%) | 13 (3.4%) |
| $1,500 to $1,999 | 35 (10.4%) | 57 (14.8%) |
| $2,000 to $2,499 | 0 (0.0%) | 0 (0.0%) |
| $2,500 to $2,999 | 0 (0.0%) | 0 (0.0%) |
| $3,000 or more | 0 (0.0%) | 0 (0.0%) |
| Total | 336 (100.0%) | 384 (100.0%) |
Physical Housing Characteristics in Winnsboro Mills
Housing Structures in Winnsboro Mills
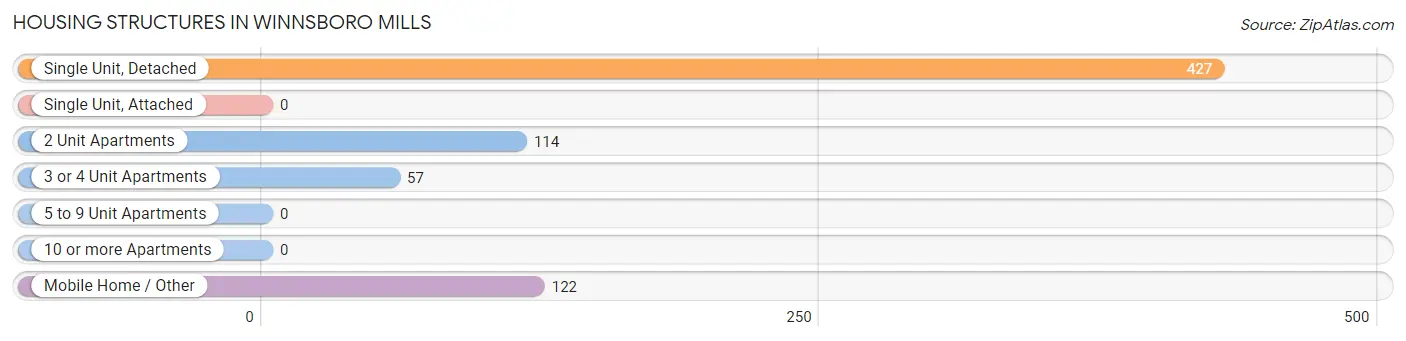
| Structure Type | # Housing Units | % Housing Units |
| Single Unit, Detached | 427 | 59.3% |
| Single Unit, Attached | 0 | 0.0% |
| 2 Unit Apartments | 114 | 15.8% |
| 3 or 4 Unit Apartments | 57 | 7.9% |
| 5 to 9 Unit Apartments | 0 | 0.0% |
| 10 or more Apartments | 0 | 0.0% |
| Mobile Home / Other | 122 | 16.9% |
| Total | 720 | 100.0% |
Housing Structures by Occupancy in Winnsboro Mills
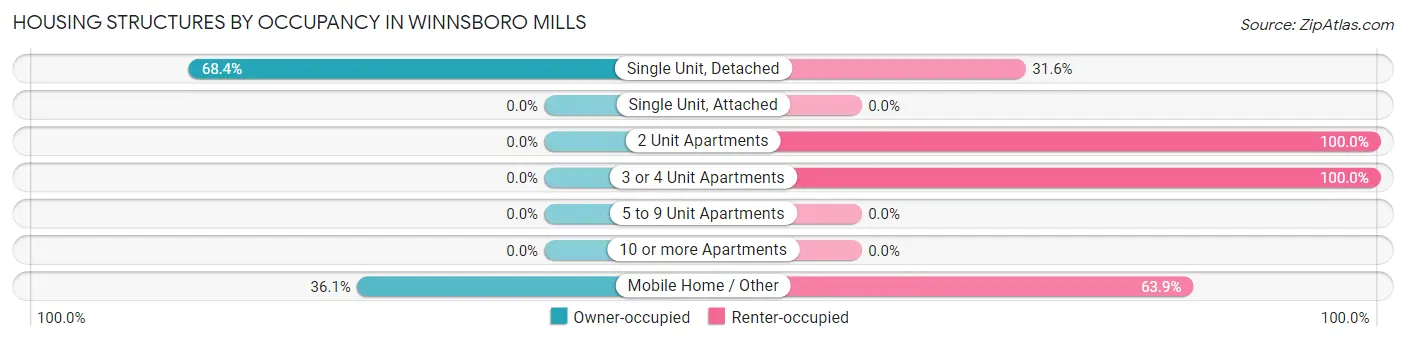
| Structure Type | Owner-occupied | Renter-occupied |
| Single Unit, Detached | 292 (68.4%) | 135 (31.6%) |
| Single Unit, Attached | 0 (0.0%) | 0 (0.0%) |
| 2 Unit Apartments | 0 (0.0%) | 114 (100.0%) |
| 3 or 4 Unit Apartments | 0 (0.0%) | 57 (100.0%) |
| 5 to 9 Unit Apartments | 0 (0.0%) | 0 (0.0%) |
| 10 or more Apartments | 0 (0.0%) | 0 (0.0%) |
| Mobile Home / Other | 44 (36.1%) | 78 (63.9%) |
| Total | 336 (46.7%) | 384 (53.3%) |
Housing Structures by Number of Rooms in Winnsboro Mills
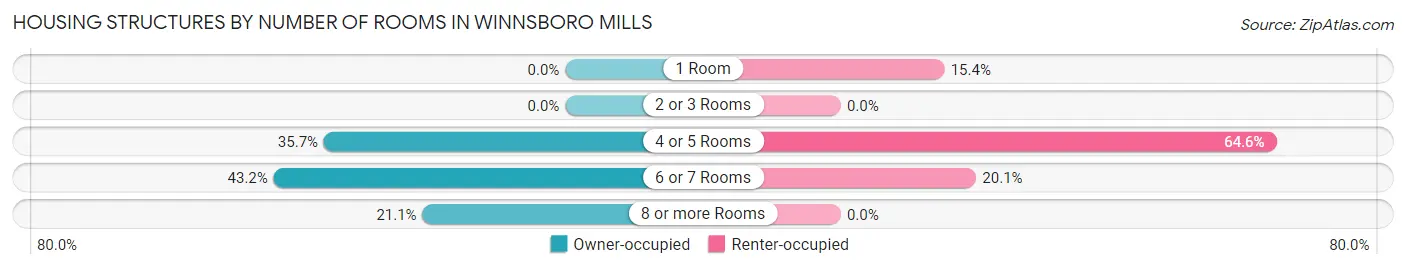
| Number of Rooms | Owner-occupied | Renter-occupied |
| 1 Room | 0 (0.0%) | 59 (15.4%) |
| 2 or 3 Rooms | 0 (0.0%) | 0 (0.0%) |
| 4 or 5 Rooms | 120 (35.7%) | 248 (64.6%) |
| 6 or 7 Rooms | 145 (43.1%) | 77 (20.1%) |
| 8 or more Rooms | 71 (21.1%) | 0 (0.0%) |
| Total | 336 (100.0%) | 384 (100.0%) |
Housing Structure by Heating Type in Winnsboro Mills
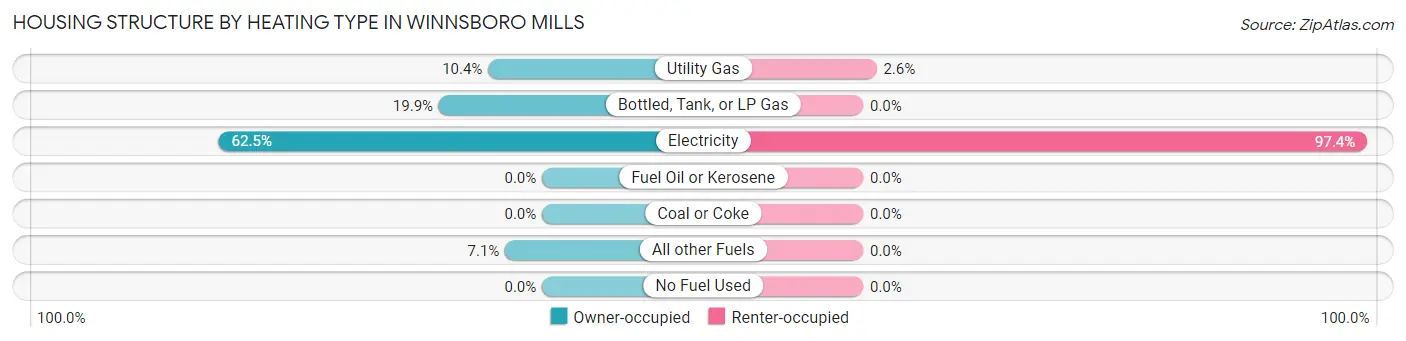
| Heating Type | Owner-occupied | Renter-occupied |
| Utility Gas | 35 (10.4%) | 10 (2.6%) |
| Bottled, Tank, or LP Gas | 67 (19.9%) | 0 (0.0%) |
| Electricity | 210 (62.5%) | 374 (97.4%) |
| Fuel Oil or Kerosene | 0 (0.0%) | 0 (0.0%) |
| Coal or Coke | 0 (0.0%) | 0 (0.0%) |
| All other Fuels | 24 (7.1%) | 0 (0.0%) |
| No Fuel Used | 0 (0.0%) | 0 (0.0%) |
| Total | 336 (100.0%) | 384 (100.0%) |
Household Vehicle Usage in Winnsboro Mills
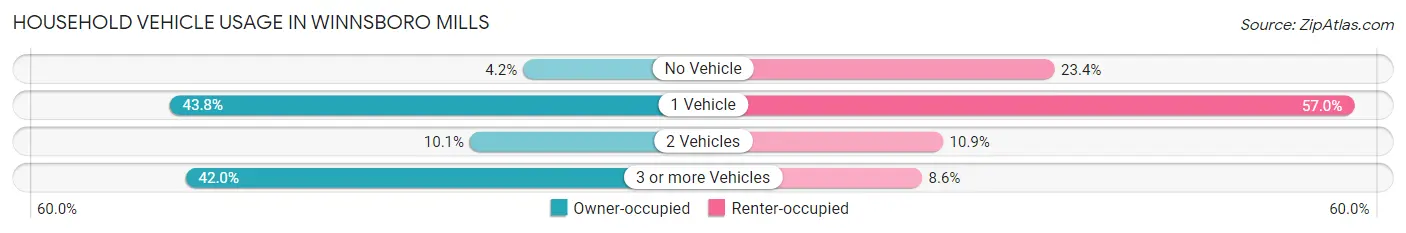
| Vehicles per Household | Owner-occupied | Renter-occupied |
| No Vehicle | 14 (4.2%) | 90 (23.4%) |
| 1 Vehicle | 147 (43.8%) | 219 (57.0%) |
| 2 Vehicles | 34 (10.1%) | 42 (10.9%) |
| 3 or more Vehicles | 141 (42.0%) | 33 (8.6%) |
| Total | 336 (100.0%) | 384 (100.0%) |
Real Estate & Mortgages in Winnsboro Mills
Real Estate and Mortgage Overview in Winnsboro Mills
| Characteristic | Without Mortgage | With Mortgage |
| Housing Units | 198 | 138 |
| Median Property Value | $51,600 | $93,800 |
| Median Household Income | $40,000 | $5 |
| Monthly Housing Costs | $234 | $0 |
| Real Estate Taxes | - | - |
Property Value by Mortgage Status in Winnsboro Mills
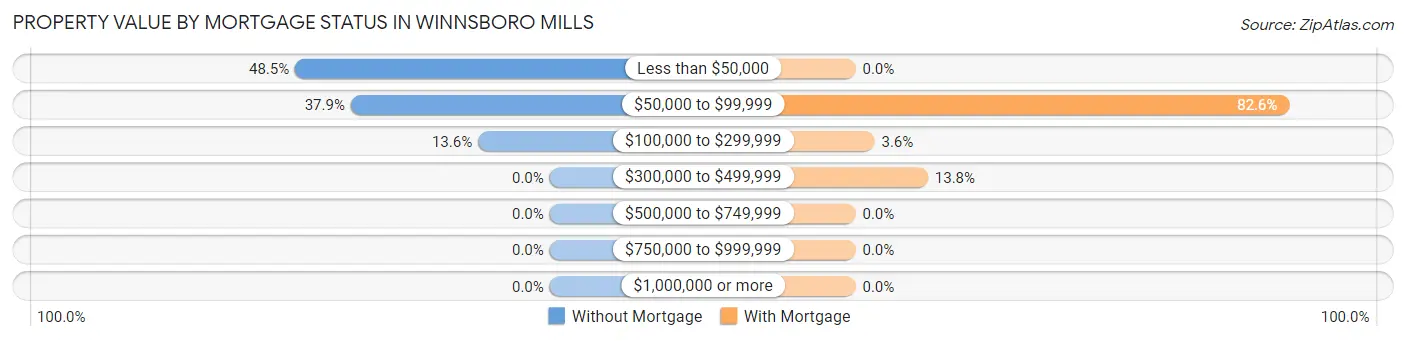
| Property Value | Without Mortgage | With Mortgage |
| Less than $50,000 | 96 (48.5%) | 0 (0.0%) |
| $50,000 to $99,999 | 75 (37.9%) | 114 (82.6%) |
| $100,000 to $299,999 | 27 (13.6%) | 5 (3.6%) |
| $300,000 to $499,999 | 0 (0.0%) | 19 (13.8%) |
| $500,000 to $749,999 | 0 (0.0%) | 0 (0.0%) |
| $750,000 to $999,999 | 0 (0.0%) | 0 (0.0%) |
| $1,000,000 or more | 0 (0.0%) | 0 (0.0%) |
| Total | 198 (100.0%) | 138 (100.0%) |
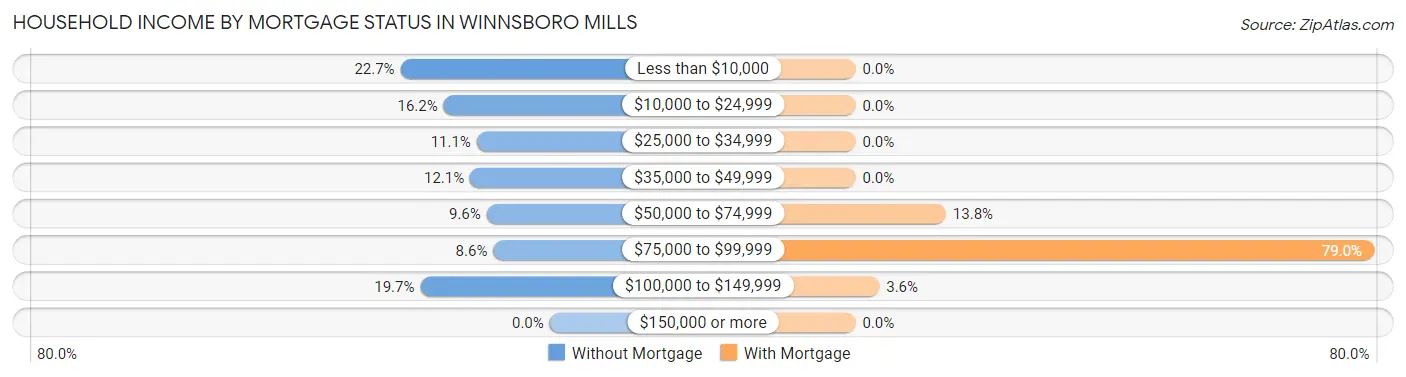
Household Income by Mortgage Status in Winnsboro Mills
| Household Income | Without Mortgage | With Mortgage |
| Less than $10,000 | 45 (22.7%) | 0 (0.0%) |
| $10,000 to $24,999 | 32 (16.2%) | 0 (0.0%) |
| $25,000 to $34,999 | 22 (11.1%) | 0 (0.0%) |
| $35,000 to $49,999 | 24 (12.1%) | 0 (0.0%) |
| $50,000 to $74,999 | 19 (9.6%) | 19 (13.8%) |
| $75,000 to $99,999 | 17 (8.6%) | 109 (79.0%) |
| $100,000 to $149,999 | 39 (19.7%) | 5 (3.6%) |
| $150,000 or more | 0 (0.0%) | 0 (0.0%) |
| Total | 198 (100.0%) | 138 (100.0%) |
Property Value to Household Income Ratio in Winnsboro Mills
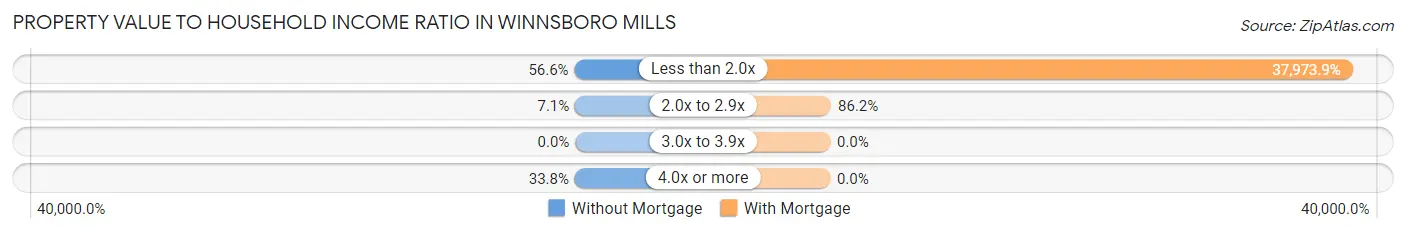
| Value-to-Income Ratio | Without Mortgage | With Mortgage |
| Less than 2.0x | 112 (56.6%) | 52,404 (37,973.9%) |
| 2.0x to 2.9x | 14 (7.1%) | 119 (86.2%) |
| 3.0x to 3.9x | 0 (0.0%) | 0 (0.0%) |
| 4.0x or more | 67 (33.8%) | 0 (0.0%) |
| Total | 198 (100.0%) | 138 (100.0%) |
Real Estate Taxes by Mortgage Status in Winnsboro Mills
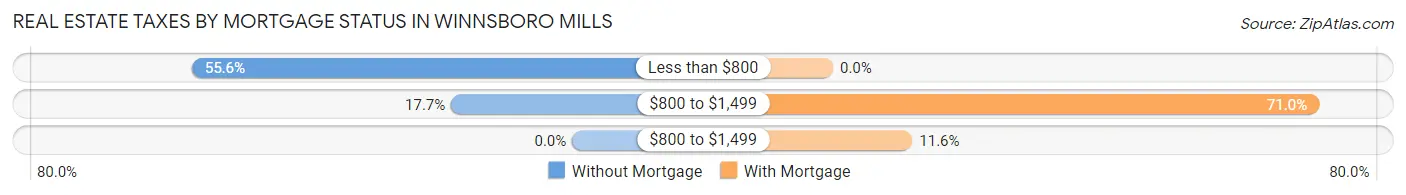
| Property Taxes | Without Mortgage | With Mortgage |
| Less than $800 | 110 (55.6%) | 0 (0.0%) |
| $800 to $1,499 | 35 (17.7%) | 98 (71.0%) |
| $800 to $1,499 | 0 (0.0%) | 16 (11.6%) |
| Total | 198 (100.0%) | 138 (100.0%) |
Health & Disability in Winnsboro Mills
Health Insurance Coverage by Age in Winnsboro Mills
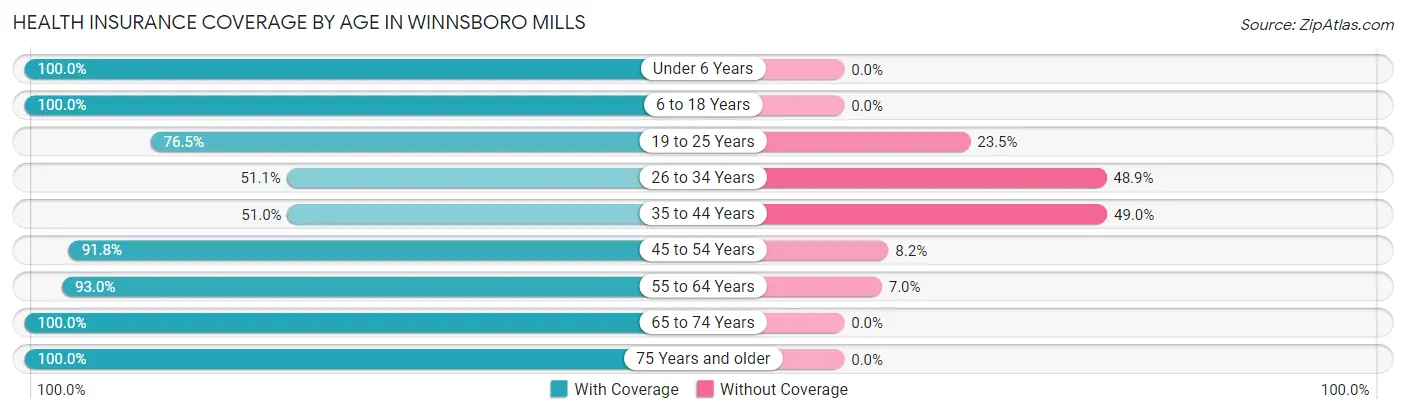
| Age Bracket | With Coverage | Without Coverage |
| Under 6 Years | 54 (100.0%) | 0 (0.0%) |
| 6 to 18 Years | 127 (100.0%) | 0 (0.0%) |
| 19 to 25 Years | 192 (76.5%) | 59 (23.5%) |
| 26 to 34 Years | 90 (51.1%) | 86 (48.9%) |
| 35 to 44 Years | 155 (51.0%) | 149 (49.0%) |
| 45 to 54 Years | 223 (91.8%) | 20 (8.2%) |
| 55 to 64 Years | 399 (93.0%) | 30 (7.0%) |
| 65 to 74 Years | 32 (100.0%) | 0 (0.0%) |
| 75 Years and older | 66 (100.0%) | 0 (0.0%) |
| Total | 1,338 (79.5%) | 344 (20.4%) |
Health Insurance Coverage by Citizenship Status in Winnsboro Mills
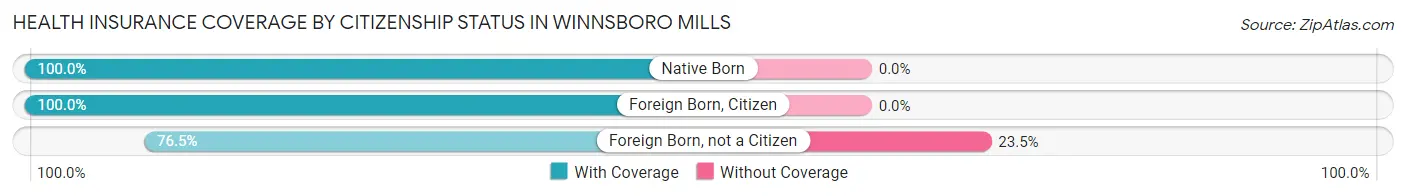
| Citizenship Status | With Coverage | Without Coverage |
| Native Born | 54 (100.0%) | 0 (0.0%) |
| Foreign Born, Citizen | 127 (100.0%) | 0 (0.0%) |
| Foreign Born, not a Citizen | 192 (76.5%) | 59 (23.5%) |
Health Insurance Coverage by Household Income in Winnsboro Mills
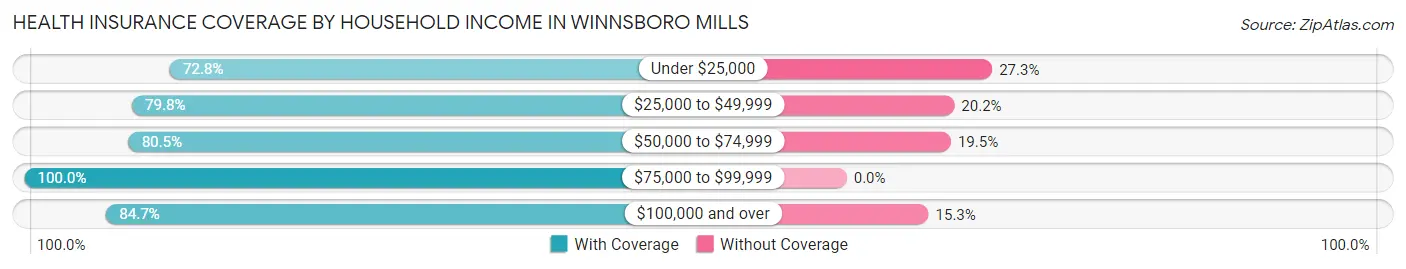
| Household Income | With Coverage | Without Coverage |
| Under $25,000 | 307 (72.8%) | 115 (27.3%) |
| $25,000 to $49,999 | 305 (79.8%) | 77 (20.2%) |
| $50,000 to $74,999 | 437 (80.5%) | 106 (19.5%) |
| $75,000 to $99,999 | 25 (100.0%) | 0 (0.0%) |
| $100,000 and over | 254 (84.7%) | 46 (15.3%) |
Public vs Private Health Insurance Coverage by Age in Winnsboro Mills
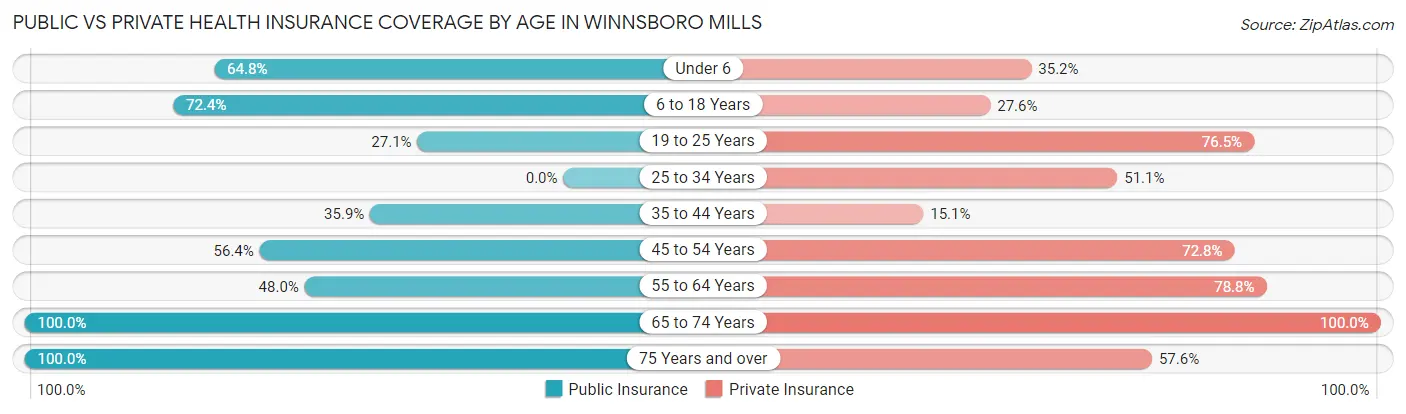
| Age Bracket | Public Insurance | Private Insurance |
| Under 6 | 35 (64.8%) | 19 (35.2%) |
| 6 to 18 Years | 92 (72.4%) | 35 (27.6%) |
| 19 to 25 Years | 68 (27.1%) | 192 (76.5%) |
| 25 to 34 Years | 0 (0.0%) | 90 (51.1%) |
| 35 to 44 Years | 109 (35.9%) | 46 (15.1%) |
| 45 to 54 Years | 137 (56.4%) | 177 (72.8%) |
| 55 to 64 Years | 206 (48.0%) | 338 (78.8%) |
| 65 to 74 Years | 32 (100.0%) | 32 (100.0%) |
| 75 Years and over | 66 (100.0%) | 38 (57.6%) |
| Total | 745 (44.3%) | 967 (57.5%) |
Disability Status by Sex by Age in Winnsboro Mills
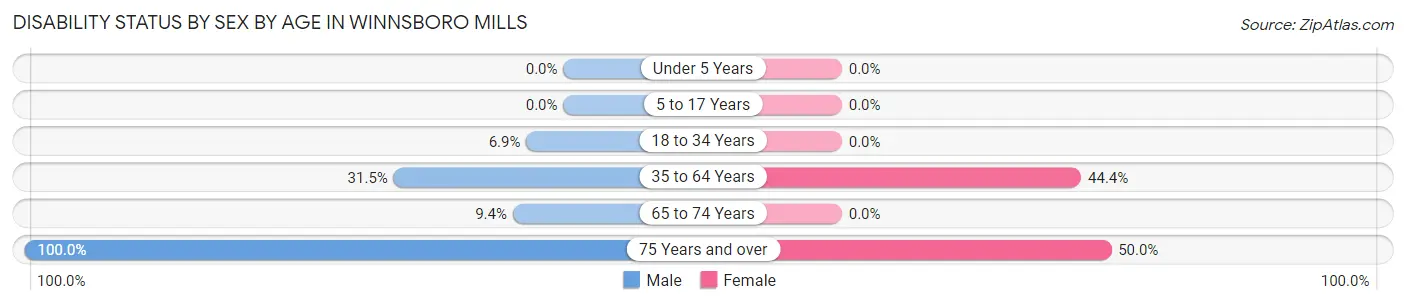
| Age Bracket | Male | Female |
| Under 5 Years | 0 (0.0%) | 0 (0.0%) |
| 5 to 17 Years | 0 (0.0%) | 0 (0.0%) |
| 18 to 34 Years | 18 (6.9%) | 0 (0.0%) |
| 35 to 64 Years | 155 (31.5%) | 215 (44.4%) |
| 65 to 74 Years | 3 (9.4%) | 0 (0.0%) |
| 75 Years and over | 14 (100.0%) | 26 (50.0%) |
Disability Class by Sex by Age in Winnsboro Mills
Disability Class: Hearing Difficulty
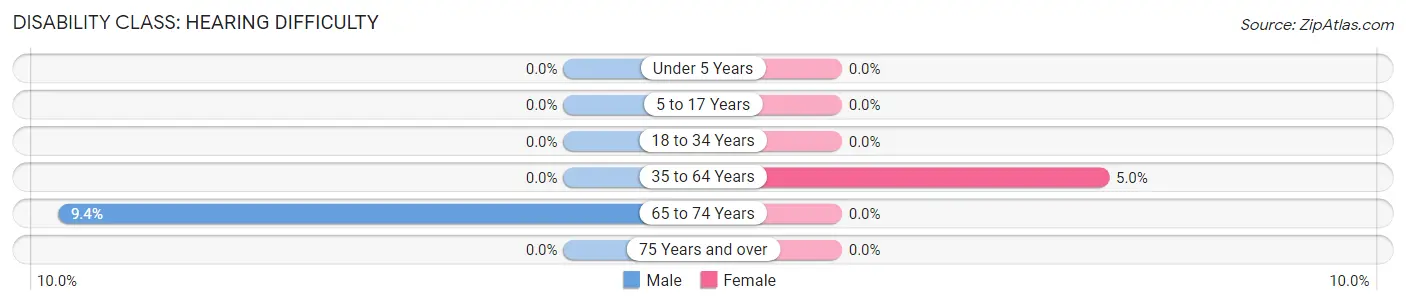
| Age Bracket | Male | Female |
| Under 5 Years | 0 (0.0%) | 0 (0.0%) |
| 5 to 17 Years | 0 (0.0%) | 0 (0.0%) |
| 18 to 34 Years | 0 (0.0%) | 0 (0.0%) |
| 35 to 64 Years | 0 (0.0%) | 24 (5.0%) |
| 65 to 74 Years | 3 (9.4%) | 0 (0.0%) |
| 75 Years and over | 0 (0.0%) | 0 (0.0%) |
Disability Class: Vision Difficulty
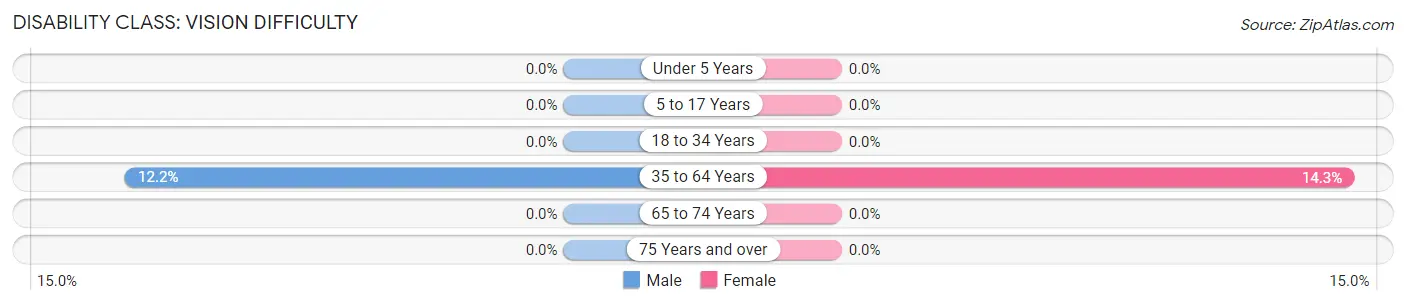
| Age Bracket | Male | Female |
| Under 5 Years | 0 (0.0%) | 0 (0.0%) |
| 5 to 17 Years | 0 (0.0%) | 0 (0.0%) |
| 18 to 34 Years | 0 (0.0%) | 0 (0.0%) |
| 35 to 64 Years | 60 (12.2%) | 69 (14.3%) |
| 65 to 74 Years | 0 (0.0%) | 0 (0.0%) |
| 75 Years and over | 0 (0.0%) | 0 (0.0%) |
Disability Class: Cognitive Difficulty
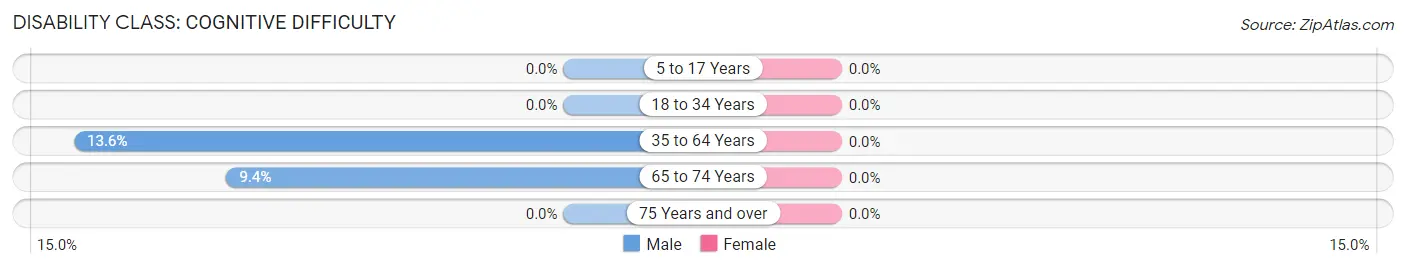
| Age Bracket | Male | Female |
| 5 to 17 Years | 0 (0.0%) | 0 (0.0%) |
| 18 to 34 Years | 0 (0.0%) | 0 (0.0%) |
| 35 to 64 Years | 67 (13.6%) | 0 (0.0%) |
| 65 to 74 Years | 3 (9.4%) | 0 (0.0%) |
| 75 Years and over | 0 (0.0%) | 0 (0.0%) |
Disability Class: Ambulatory Difficulty
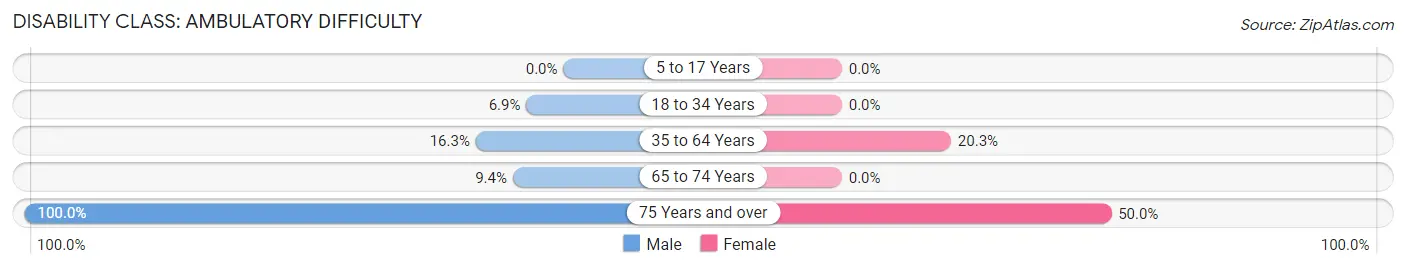
| Age Bracket | Male | Female |
| 5 to 17 Years | 0 (0.0%) | 0 (0.0%) |
| 18 to 34 Years | 18 (6.9%) | 0 (0.0%) |
| 35 to 64 Years | 80 (16.3%) | 98 (20.3%) |
| 65 to 74 Years | 3 (9.4%) | 0 (0.0%) |
| 75 Years and over | 14 (100.0%) | 26 (50.0%) |
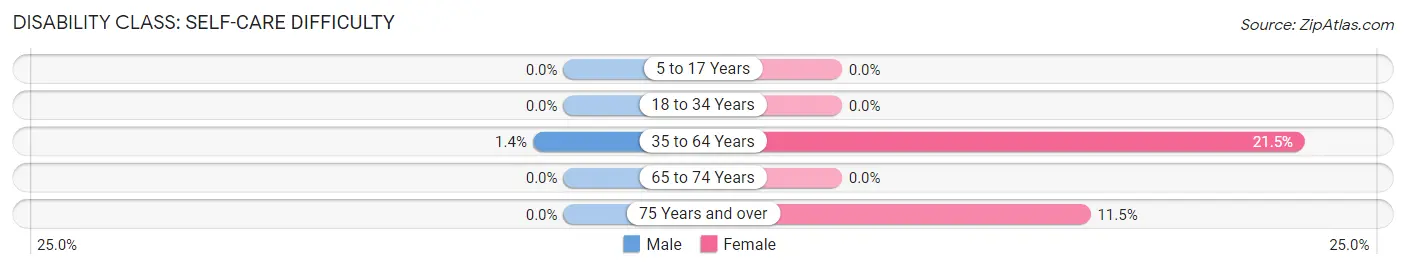
Disability Class: Self-Care Difficulty
| Age Bracket | Male | Female |
| 5 to 17 Years | 0 (0.0%) | 0 (0.0%) |
| 18 to 34 Years | 0 (0.0%) | 0 (0.0%) |
| 35 to 64 Years | 7 (1.4%) | 104 (21.5%) |
| 65 to 74 Years | 0 (0.0%) | 0 (0.0%) |
| 75 Years and over | 0 (0.0%) | 6 (11.5%) |
Technology Access in Winnsboro Mills
Computing Device Access in Winnsboro Mills
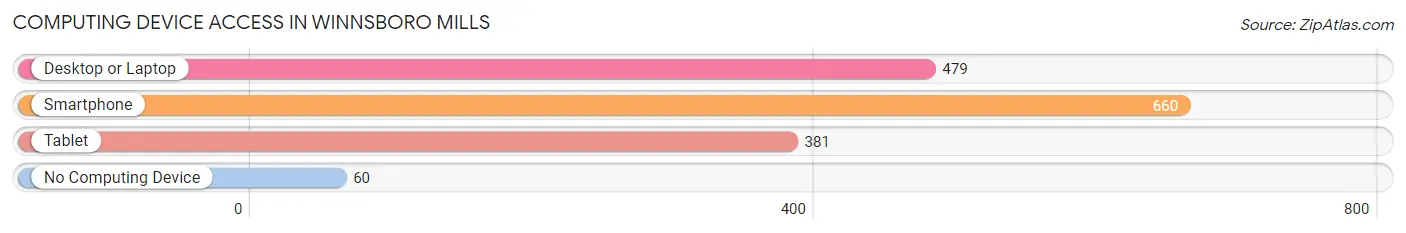
| Device Type | # Households | % Households |
| Desktop or Laptop | 479 | 66.5% |
| Smartphone | 660 | 91.7% |
| Tablet | 381 | 52.9% |
| No Computing Device | 60 | 8.3% |
| Total | 720 | 100.0% |
Internet Access in Winnsboro Mills
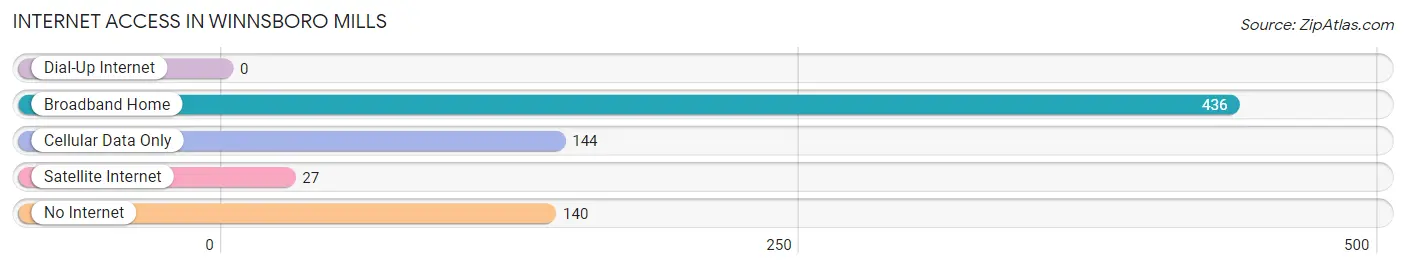
| Internet Type | # Households | % Households |
| Dial-Up Internet | 0 | 0.0% |
| Broadband Home | 436 | 60.6% |
| Cellular Data Only | 144 | 20.0% |
| Satellite Internet | 27 | 3.7% |
| No Internet | 140 | 19.4% |
| Total | 720 | 100.0% |
Winnsboro Mills Summary
Winnsboro Mills is a small unincorporated community located in Fairfield County, South Carolina. It is situated along the banks of the Broad River, approximately 25 miles northwest of Columbia, the state capital. The community is named after the nearby Winnsboro Mill, which was built in 1820 and is still in operation today.
History
The area around Winnsboro Mills was first settled in the late 1700s by Scots-Irish immigrants. The town was officially established in 1820 when the Winnsboro Mill was built. The mill was built by William Richardson, a local planter, and was used to grind wheat and corn. The mill was powered by the Broad River, which provided a reliable source of water for the mill.
In the mid-1800s, the town began to grow and prosper. The railroad arrived in 1854, connecting Winnsboro Mills to Columbia and other nearby towns. This allowed the town to become a major trading center for the surrounding area. The town also became a popular tourist destination, as it was located near several popular attractions, such as the Congaree National Park.
In the late 1800s, the town began to decline. The railroad was rerouted, bypassing Winnsboro Mills, and the mill was no longer able to compete with larger, more modern mills. The town slowly declined until the mid-1900s, when it began to experience a resurgence. The mill was renovated and reopened in the 1950s, and the town began to attract new businesses and residents.
Geography
Winnsboro Mills is located in Fairfield County, South Carolina. It is situated along the banks of the Broad River, approximately 25 miles northwest of Columbia, the state capital. The town is located in a rural area, surrounded by rolling hills and forests. The climate is humid subtropical, with hot, humid summers and mild winters.
Economy
The economy of Winnsboro Mills is largely based on agriculture and tourism. The town is home to the Winnsboro Mill, which is still in operation today. The mill produces flour, cornmeal, and other products. The town is also home to several small businesses, including restaurants, shops, and a bed and breakfast.
Tourism is an important part of the local economy. The town is located near several popular attractions, such as the Congaree National Park and the South Carolina State House. The town also hosts several annual festivals and events, such as the Winnsboro Cotton Festival and the Winnsboro Art Festival.
Demographics
As of the 2010 census, the population of Winnsboro Mills was 1,845. The racial makeup of the town was 79.3% White, 17.2% African American, 0.3% Native American, 0.7% Asian, 0.1% Pacific Islander, and 2.4% from other races. The median household income was $37,917, and the median family income was $45,938. The per capita income was $19,945.
Conclusion
Winnsboro Mills is a small unincorporated community located in Fairfield County, South Carolina. It is situated along the banks of the Broad River, approximately 25 miles northwest of Columbia, the state capital. The town was established in 1820 when the Winnsboro Mill was built, and it has since become a popular tourist destination. The economy of Winnsboro Mills is largely based on agriculture and tourism, and the town is home to several small businesses. As of the 2010 census, the population of Winnsboro Mills was 1,845.
Common Questions
What is the Total Population of Winnsboro Mills?
Total Population of Winnsboro Mills is 1,682.
What is the Total Male Population of Winnsboro Mills?
Total Male Population of Winnsboro Mills is 886.
What is the Total Female Population of Winnsboro Mills?
Total Female Population of Winnsboro Mills is 796.
What is the Ratio of Males per 100 Females in Winnsboro Mills?
There are 111.31 Males per 100 Females in Winnsboro Mills.
What is the Ratio of Females per 100 Males in Winnsboro Mills?
There are 89.84 Females per 100 Males in Winnsboro Mills.
What is the Median Population Age in Winnsboro Mills?
Median Population Age in Winnsboro Mills is 44.0 Years.
What is the Average Family Size in Winnsboro Mills
Average Family Size in Winnsboro Mills is 3.2 People.
What is the Average Household Size in Winnsboro Mills
Average Household Size in Winnsboro Mills is 2.3 People.
What is Per Capita Income in Winnsboro Mills?
Per Capita income in Winnsboro Mills is $20,812.
What is the Median Family Income in Winnsboro Mills?
Median Family Income in Winnsboro Mills is $50,385.
What is the Median Household income in Winnsboro Mills?
Median Household Income in Winnsboro Mills is $34,708.
What is Income or Wage Gap in Winnsboro Mills?
Income or Wage Gap in Winnsboro Mills is 12.1%.
Women in Winnsboro Mills earn 87.9 cents for every dollar earned by a man.
What is Inequality or Gini Index in Winnsboro Mills?
Inequality or Gini Index in Winnsboro Mills is 0.40.
How Large is the Labor Force in Winnsboro Mills?
There are 772 People in the Labor Forcein in Winnsboro Mills.
What is the Percentage of People in the Labor Force in Winnsboro Mills?
50.2% of People are in the Labor Force in Winnsboro Mills.
What is the Unemployment Rate in Winnsboro Mills?
Unemployment Rate in Winnsboro Mills is 16.2%.