Cities with the Highest Percentage of Population Employed in Computer & Mathematics in New Hampshire
RELATED REPORTS & OPTIONS
Computer & Mathematics
New Hampshire
Compare Cities
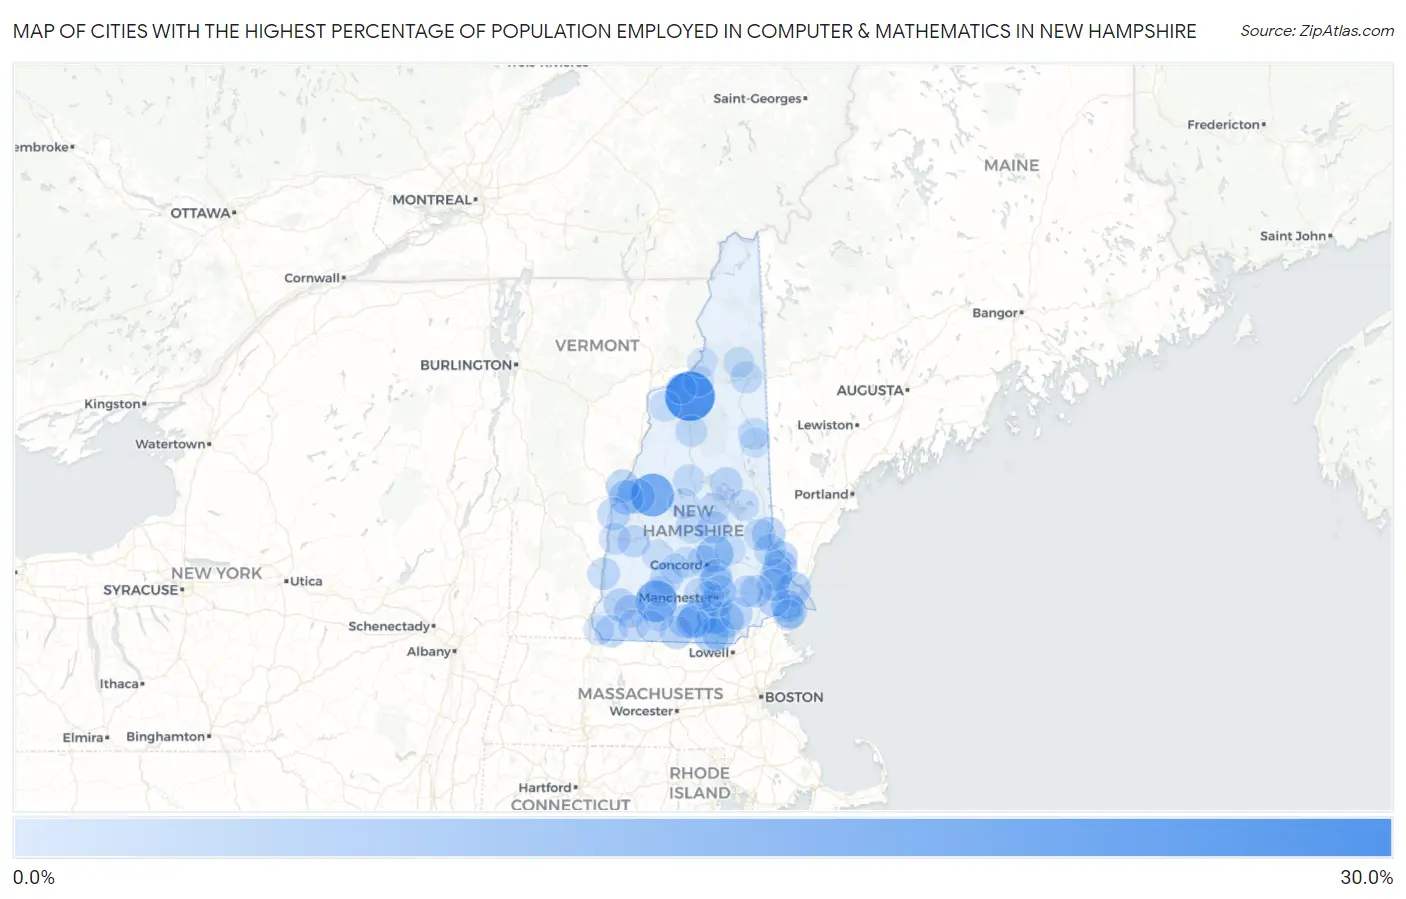
Map of Cities with the Highest Percentage of Population Employed in Computer & Mathematics in New Hampshire
0.0%
30.0%
Cities with the Highest Percentage of Population Employed in Computer & Mathematics in New Hampshire
| City | % Employed | vs State | vs National | |
| 1. | Bethlehem | 28.8% | 4.1%(+24.8)#1 | 3.5%(+25.3)#75 |
| 2. | Canaan | 18.6% | 4.1%(+14.6)#2 | 3.5%(+15.1)#197 |
| 3. | Hancock | 16.7% | 4.1%(+12.6)#3 | 3.5%(+13.1)#243 |
| 4. | Klondike Corner | 10.5% | 4.1%(+6.49)#4 | 3.5%(+7.02)#649 |
| 5. | Amherst | 9.6% | 4.1%(+5.55)#5 | 3.5%(+6.09)#812 |
| 6. | Loudon | 9.5% | 4.1%(+5.49)#6 | 3.5%(+6.02)#824 |
| 7. | Londonderry | 7.1% | 4.1%(+3.01)#7 | 3.5%(+3.55)#1,568 |
| 8. | Enfield | 7.1% | 4.1%(+3.01)#8 | 3.5%(+3.54)#1,571 |
| 9. | Nashua | 6.7% | 4.1%(+2.67)#9 | 3.5%(+3.21)#1,744 |
| 10. | Lebanon | 6.5% | 4.1%(+2.41)#10 | 3.5%(+2.94)#1,887 |
| 11. | Dover | 6.4% | 4.1%(+2.33)#11 | 3.5%(+2.86)#1,918 |
| 12. | Portsmouth | 6.3% | 4.1%(+2.22)#12 | 3.5%(+2.75)#1,983 |
| 13. | East Merrimack | 5.5% | 4.1%(+1.48)#13 | 3.5%(+2.01)#2,547 |
| 14. | Hooksett | 5.5% | 4.1%(+1.40)#14 | 3.5%(+1.93)#2,607 |
| 15. | Hampton Beach | 5.4% | 4.1%(+1.37)#15 | 3.5%(+1.90)#2,644 |
| 16. | Milton | 5.2% | 4.1%(+1.18)#16 | 3.5%(+1.72)#2,819 |
| 17. | Hudson | 5.1% | 4.1%(+1.07)#17 | 3.5%(+1.60)#2,942 |
| 18. | Wilton | 5.1% | 4.1%(+1.01)#18 | 3.5%(+1.55)#3,003 |
| 19. | Hanover | 4.8% | 4.1%(+0.715)#19 | 3.5%(+1.25)#3,356 |
| 20. | Somersworth | 4.4% | 4.1%(+0.337)#20 | 3.5%(+0.869)#3,832 |
| 21. | Hampton | 4.3% | 4.1%(+0.258)#21 | 3.5%(+0.790)#3,958 |
| 22. | Keene | 4.3% | 4.1%(+0.254)#22 | 3.5%(+0.786)#3,963 |
| 23. | Greenville | 4.1% | 4.1%(+0.021)#23 | 3.5%(+0.553)#4,354 |
| 24. | Exeter | 4.0% | 4.1%(-0.050)#24 | 3.5%(+0.482)#4,441 |
| 25. | Suissevale | 4.0% | 4.1%(-0.057)#25 | 3.5%(+0.475)#4,457 |
| 26. | Milford | 4.0% | 4.1%(-0.062)#26 | 3.5%(+0.470)#4,470 |
| 27. | Durham | 3.9% | 4.1%(-0.149)#27 | 3.5%(+0.383)#4,623 |
| 28. | Plainfield | 3.9% | 4.1%(-0.173)#28 | 3.5%(+0.359)#4,671 |
| 29. | Marlborough | 3.7% | 4.1%(-0.311)#29 | 3.5%(+0.221)#4,921 |
| 30. | Manchester | 3.7% | 4.1%(-0.356)#30 | 3.5%(+0.176)#5,010 |
| 31. | Derry | 3.6% | 4.1%(-0.440)#31 | 3.5%(+0.092)#5,172 |
| 32. | Newmarket | 3.6% | 4.1%(-0.495)#32 | 3.5%(+0.037)#5,285 |
| 33. | Belmont | 3.6% | 4.1%(-0.502)#33 | 3.5%(+0.030)#5,300 |
| 34. | Epping | 3.4% | 4.1%(-0.655)#34 | 3.5%(-0.123)#5,634 |
| 35. | Concord | 3.3% | 4.1%(-0.713)#35 | 3.5%(-0.181)#5,765 |
| 36. | Hillsborough | 3.3% | 4.1%(-0.715)#36 | 3.5%(-0.183)#5,767 |
| 37. | Winchester | 3.3% | 4.1%(-0.723)#37 | 3.5%(-0.191)#5,784 |
| 38. | North Walpole | 3.3% | 4.1%(-0.767)#38 | 3.5%(-0.235)#5,888 |
| 39. | Rochester | 3.2% | 4.1%(-0.845)#39 | 3.5%(-0.313)#6,085 |
| 40. | Newport | 3.1% | 4.1%(-0.921)#40 | 3.5%(-0.389)#6,267 |
| 41. | South Hooksett | 2.9% | 4.1%(-1.19)#41 | 3.5%(-0.660)#6,929 |
| 42. | Goffstown | 2.8% | 4.1%(-1.29)#42 | 3.5%(-0.758)#7,202 |
| 43. | Franklin | 2.7% | 4.1%(-1.32)#43 | 3.5%(-0.786)#7,275 |
| 44. | Raymond | 2.6% | 4.1%(-1.44)#44 | 3.5%(-0.909)#7,603 |
| 45. | Farmington | 2.5% | 4.1%(-1.56)#45 | 3.5%(-1.03)#7,951 |
| 46. | Suncook | 2.5% | 4.1%(-1.57)#46 | 3.5%(-1.04)#7,971 |
| 47. | Laconia | 2.4% | 4.1%(-1.62)#47 | 3.5%(-1.09)#8,133 |
| 48. | Gorham | 2.4% | 4.1%(-1.70)#48 | 3.5%(-1.17)#8,400 |
| 49. | Claremont | 2.3% | 4.1%(-1.72)#49 | 3.5%(-1.18)#8,460 |
| 50. | Lincoln | 2.3% | 4.1%(-1.76)#50 | 3.5%(-1.23)#8,623 |
| 51. | North Conway | 2.1% | 4.1%(-1.98)#51 | 3.5%(-1.45)#9,403 |
| 52. | Plymouth | 2.0% | 4.1%(-2.05)#52 | 3.5%(-1.52)#9,617 |
| 53. | Contoocook | 2.0% | 4.1%(-2.05)#53 | 3.5%(-1.52)#9,628 |
| 54. | Jaffrey | 1.6% | 4.1%(-2.50)#54 | 3.5%(-1.97)#11,455 |
| 55. | Pittsfield | 1.5% | 4.1%(-2.55)#55 | 3.5%(-2.02)#11,661 |
| 56. | Seabrook Beach | 1.5% | 4.1%(-2.58)#56 | 3.5%(-2.05)#11,793 |
| 57. | Lisbon | 1.5% | 4.1%(-2.59)#57 | 3.5%(-2.06)#11,846 |
| 58. | Wolfeboro | 1.4% | 4.1%(-2.66)#58 | 3.5%(-2.13)#12,098 |
| 59. | Troy | 1.3% | 4.1%(-2.72)#59 | 3.5%(-2.19)#12,358 |
| 60. | Bradford | 1.3% | 4.1%(-2.78)#60 | 3.5%(-2.25)#12,655 |
| 61. | Antrim | 1.2% | 4.1%(-2.85)#61 | 3.5%(-2.32)#12,980 |
| 62. | Whitefield | 1.2% | 4.1%(-2.85)#62 | 3.5%(-2.32)#12,993 |
| 63. | Bristol | 1.1% | 4.1%(-2.98)#63 | 3.5%(-2.45)#13,598 |
| 64. | Littleton | 0.98% | 4.1%(-3.07)#64 | 3.5%(-2.54)#13,977 |
| 65. | Berlin | 0.91% | 4.1%(-3.15)#65 | 3.5%(-2.62)#14,315 |
| 66. | Hinsdale | 0.90% | 4.1%(-3.16)#66 | 3.5%(-2.63)#14,384 |
| 67. | Pinardville | 0.84% | 4.1%(-3.21)#67 | 3.5%(-2.68)#14,639 |
| 68. | Peterborough | 0.76% | 4.1%(-3.30)#68 | 3.5%(-2.77)#15,044 |
| 69. | Lancaster | 0.45% | 4.1%(-3.60)#69 | 3.5%(-3.07)#16,420 |
| 70. | Conway | 0.34% | 4.1%(-3.72)#70 | 3.5%(-3.19)#16,807 |
| 71. | Henniker | 0.14% | 4.1%(-3.91)#71 | 3.5%(-3.38)#17,210 |
1
Common Questions
What are the Top 10 Cities with the Highest Percentage of Population Employed in Computer & Mathematics in New Hampshire?
Top 10 Cities with the Highest Percentage of Population Employed in Computer & Mathematics in New Hampshire are:
What city has the Highest Percentage of Population Employed in Computer & Mathematics in New Hampshire?
Bethlehem has the Highest Percentage of Population Employed in Computer & Mathematics in New Hampshire with 28.8%.
What is the Percentage of Population Employed in Computer & Mathematics in the State of New Hampshire?
Percentage of Population Employed in Computer & Mathematics in New Hampshire is 4.1%.
What is the Percentage of Population Employed in Computer & Mathematics in the United States?
Percentage of Population Employed in Computer & Mathematics in the United States is 3.5%.