Zip Codes with the Highest Percentage of Population Employed in Computer & Mathematics in Greenville, SC
RELATED REPORTS & OPTIONS
Computer & Mathematics
Greenville
Compare Zip Codes
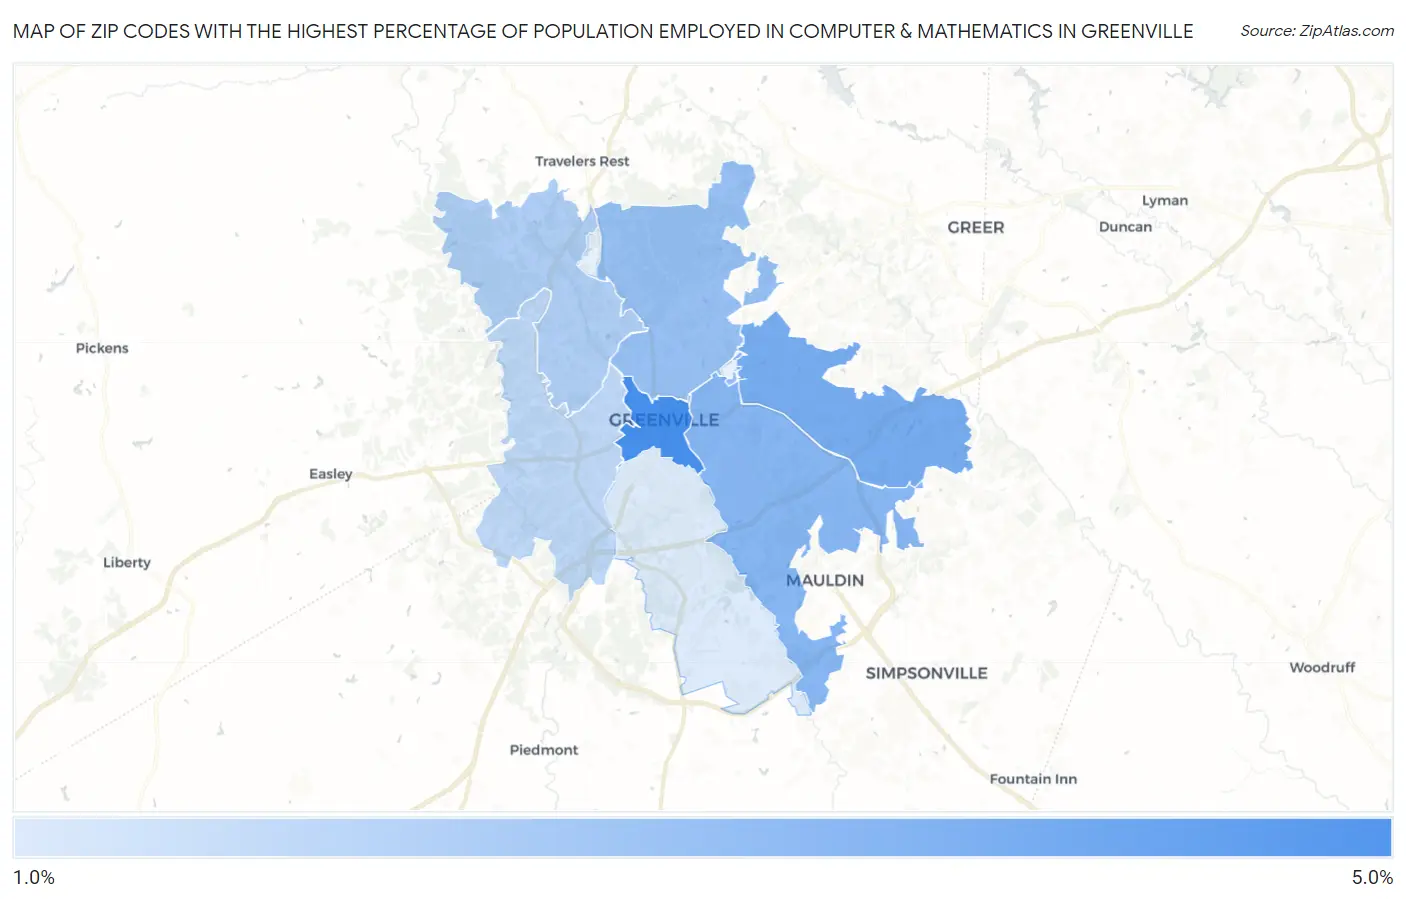
Map of Zip Codes with the Highest Percentage of Population Employed in Computer & Mathematics in Greenville
0.0%
5.0%
Zip Codes with the Highest Percentage of Population Employed in Computer & Mathematics in Greenville, SC
| Zip Code | % Employed | vs State | vs National | |
| 1. | 29601 | 4.9% | 2.4%(+2.52)#18 | 3.5%(+1.41)#3,437 |
| 2. | 29615 | 3.7% | 2.4%(+1.30)#42 | 3.5%(+0.191)#5,684 |
| 3. | 29607 | 3.3% | 2.4%(+0.879)#57 | 3.5%(-0.226)#6,787 |
| 4. | 29609 | 2.9% | 2.4%(+0.468)#77 | 3.5%(-0.637)#8,148 |
| 5. | 29617 | 2.3% | 2.4%(-0.118)#112 | 3.5%(-1.22)#10,437 |
| 6. | 29611 | 1.9% | 2.4%(-0.488)#133 | 3.5%(-1.59)#12,142 |
| 7. | 29605 | 1.2% | 2.4%(-1.25)#205 | 3.5%(-2.35)#16,281 |
1
Common Questions
What are the Top 5 Zip Codes with the Highest Percentage of Population Employed in Computer & Mathematics in Greenville, SC?
Top 5 Zip Codes with the Highest Percentage of Population Employed in Computer & Mathematics in Greenville, SC are:
What zip code has the Highest Percentage of Population Employed in Computer & Mathematics in Greenville, SC?
29601 has the Highest Percentage of Population Employed in Computer & Mathematics in Greenville, SC with 4.9%.
What is the Percentage of Population Employed in Computer & Mathematics in Greenville, SC?
Percentage of Population Employed in Computer & Mathematics in Greenville is 2.8%.
What is the Percentage of Population Employed in Computer & Mathematics in South Carolina?
Percentage of Population Employed in Computer & Mathematics in South Carolina is 2.4%.
What is the Percentage of Population Employed in Computer & Mathematics in the United States?
Percentage of Population Employed in Computer & Mathematics in the United States is 3.5%.