Cities with the Highest Percentage of Population Employed in Computer & Mathematics in Kentucky
RELATED REPORTS & OPTIONS
Computer & Mathematics
Kentucky
Compare Cities
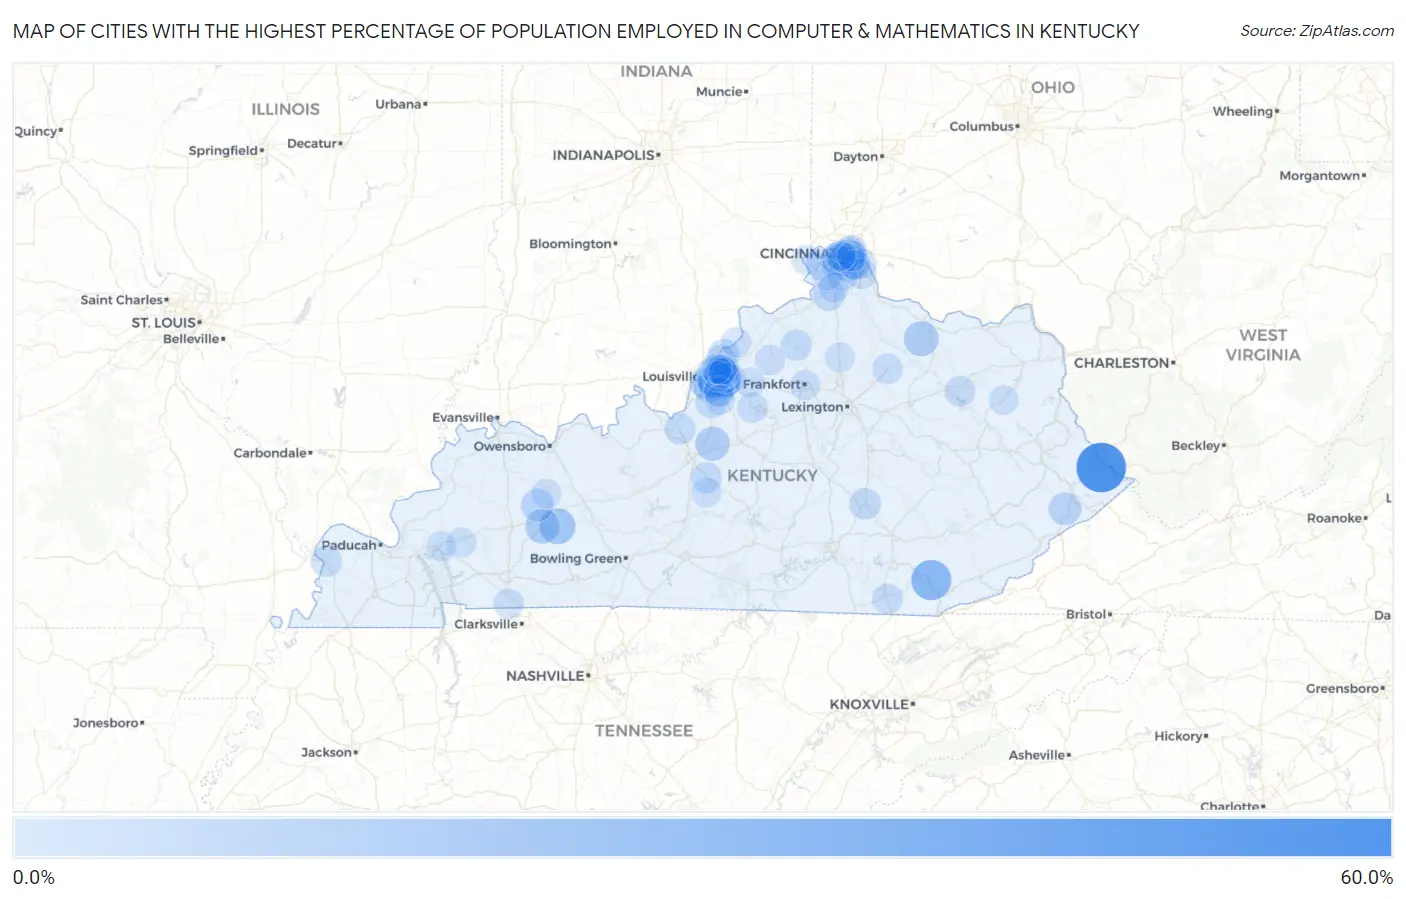
Map of Cities with the Highest Percentage of Population Employed in Computer & Mathematics in Kentucky
0.0%
60.0%
Cities with the Highest Percentage of Population Employed in Computer & Mathematics in Kentucky
| City | % Employed | vs State | vs National | |
| 1. | Belfry | 53.3% | 2.2%(+51.2)#1 | 3.5%(+49.8)#16 |
| 2. | Flat Lick | 28.5% | 2.2%(+26.3)#2 | 3.5%(+24.9)#77 |
| 3. | Hurstbourne | 22.7% | 2.2%(+20.6)#3 | 3.5%(+19.2)#127 |
| 4. | Hurstbourne Acres | 18.7% | 2.2%(+16.5)#4 | 3.5%(+15.1)#196 |
| 5. | Drakesboro | 17.7% | 2.2%(+15.6)#5 | 3.5%(+14.2)#215 |
| 6. | Mays Lick | 15.0% | 2.2%(+12.8)#6 | 3.5%(+11.5)#317 |
| 7. | Greenville | 14.6% | 2.2%(+12.5)#7 | 3.5%(+11.1)#334 |
| 8. | Boston | 13.3% | 2.2%(+11.2)#8 | 3.5%(+9.81)#405 |
| 9. | Riverwood | 12.5% | 2.2%(+10.3)#9 | 3.5%(+8.93)#460 |
| 10. | Thornhill | 10.6% | 2.2%(+8.47)#10 | 3.5%(+7.11)#636 |
| 11. | Virgie | 9.9% | 2.2%(+7.73)#11 | 3.5%(+6.37)#749 |
| 12. | Parkway Village | 9.8% | 2.2%(+7.63)#12 | 3.5%(+6.27)#772 |
| 13. | Bremen | 9.6% | 2.2%(+7.47)#13 | 3.5%(+6.11)#806 |
| 14. | Hickory Hill | 8.8% | 2.2%(+6.66)#14 | 3.5%(+5.30)#977 |
| 15. | Highland Heights | 8.7% | 2.2%(+6.52)#15 | 3.5%(+5.16)#1,010 |
| 16. | Old Brownsboro Place | 8.7% | 2.2%(+6.51)#16 | 3.5%(+5.15)#1,014 |
| 17. | Lincolnshire | 8.0% | 2.2%(+5.84)#17 | 3.5%(+4.48)#1,218 |
| 18. | Kingsley | 8.0% | 2.2%(+5.82)#18 | 3.5%(+4.46)#1,229 |
| 19. | Dayton | 8.0% | 2.2%(+5.81)#19 | 3.5%(+4.45)#1,232 |
| 20. | Verona | 7.8% | 2.2%(+5.64)#20 | 3.5%(+4.28)#1,298 |
| 21. | Westwood | 7.8% | 2.2%(+5.62)#21 | 3.5%(+4.26)#1,307 |
| 22. | Goshen | 7.4% | 2.2%(+5.19)#22 | 3.5%(+3.83)#1,451 |
| 23. | Mount Vernon | 7.2% | 2.2%(+5.06)#23 | 3.5%(+3.70)#1,502 |
| 24. | St Matthews | 7.1% | 2.2%(+4.97)#24 | 3.5%(+3.60)#1,545 |
| 25. | Strathmoor Village | 6.7% | 2.2%(+4.50)#25 | 3.5%(+3.14)#1,772 |
| 26. | Meadow Vale | 6.6% | 2.2%(+4.49)#26 | 3.5%(+3.12)#1,786 |
| 27. | Bancroft | 6.6% | 2.2%(+4.41)#27 | 3.5%(+3.05)#1,831 |
| 28. | Hunters Hollow | 6.5% | 2.2%(+4.31)#28 | 3.5%(+2.95)#1,884 |
| 29. | Woodlawn | 6.4% | 2.2%(+4.26)#29 | 3.5%(+2.90)#1,909 |
| 30. | West Van Lear | 6.4% | 2.2%(+4.24)#30 | 3.5%(+2.88)#1,913 |
| 31. | Gratz | 6.2% | 2.2%(+4.09)#31 | 3.5%(+2.73)#1,995 |
| 32. | Wickliffe | 6.2% | 2.2%(+4.03)#32 | 3.5%(+2.67)#2,042 |
| 33. | Beechwood Village | 6.2% | 2.2%(+4.00)#33 | 3.5%(+2.64)#2,058 |
| 34. | Meadowbrook Farm | 6.0% | 2.2%(+3.84)#34 | 3.5%(+2.48)#2,170 |
| 35. | Seneca Gardens | 5.9% | 2.2%(+3.76)#35 | 3.5%(+2.40)#2,230 |
| 36. | Hodgenville | 5.9% | 2.2%(+3.74)#36 | 3.5%(+2.38)#2,245 |
| 37. | Fort Knox | 5.7% | 2.2%(+3.51)#37 | 3.5%(+2.15)#2,425 |
| 38. | West Buechel | 5.7% | 2.2%(+3.50)#38 | 3.5%(+2.14)#2,431 |
| 39. | Brownsboro Farm | 5.5% | 2.2%(+3.37)#39 | 3.5%(+2.01)#2,540 |
| 40. | Newport | 5.5% | 2.2%(+3.37)#40 | 3.5%(+2.01)#2,546 |
| 41. | Cambridge | 5.4% | 2.2%(+3.24)#41 | 3.5%(+1.88)#2,670 |
| 42. | Wilder | 5.4% | 2.2%(+3.20)#42 | 3.5%(+1.84)#2,711 |
| 43. | Barbourmeade | 5.3% | 2.2%(+3.09)#43 | 3.5%(+1.73)#2,813 |
| 44. | Erlanger | 5.2% | 2.2%(+3.08)#44 | 3.5%(+1.72)#2,818 |
| 45. | Crescent Springs | 5.2% | 2.2%(+3.00)#45 | 3.5%(+1.64)#2,895 |
| 46. | Lakeview Heights | 5.1% | 2.2%(+2.98)#46 | 3.5%(+1.62)#2,924 |
| 47. | Taylor Mill | 5.1% | 2.2%(+2.98)#47 | 3.5%(+1.62)#2,932 |
| 48. | Goose Creek | 5.1% | 2.2%(+2.92)#48 | 3.5%(+1.56)#2,986 |
| 49. | Wellington | 5.0% | 2.2%(+2.88)#49 | 3.5%(+1.51)#3,048 |
| 50. | Villa Hills | 5.0% | 2.2%(+2.81)#50 | 3.5%(+1.44)#3,125 |
| 51. | Taylorsville | 4.9% | 2.2%(+2.74)#51 | 3.5%(+1.38)#3,195 |
| 52. | Fort Campbell North | 4.9% | 2.2%(+2.70)#52 | 3.5%(+1.34)#3,252 |
| 53. | Bellevue | 4.8% | 2.2%(+2.68)#53 | 3.5%(+1.32)#3,275 |
| 54. | River Bluff | 4.7% | 2.2%(+2.56)#54 | 3.5%(+1.20)#3,404 |
| 55. | Millersburg | 4.7% | 2.2%(+2.55)#55 | 3.5%(+1.18)#3,429 |
| 56. | Alexandria | 4.7% | 2.2%(+2.53)#56 | 3.5%(+1.17)#3,455 |
| 57. | Emlyn | 4.7% | 2.2%(+2.52)#57 | 3.5%(+1.16)#3,466 |
| 58. | Burlington | 4.7% | 2.2%(+2.51)#58 | 3.5%(+1.15)#3,471 |
| 59. | Eminence | 4.6% | 2.2%(+2.47)#59 | 3.5%(+1.11)#3,531 |
| 60. | Middletown | 4.6% | 2.2%(+2.42)#60 | 3.5%(+1.06)#3,581 |
| 61. | Lyndon | 4.6% | 2.2%(+2.42)#61 | 3.5%(+1.06)#3,582 |
| 62. | Norwood | 4.6% | 2.2%(+2.41)#62 | 3.5%(+1.04)#3,601 |
| 63. | Westport | 4.4% | 2.2%(+2.28)#63 | 3.5%(+0.920)#3,743 |
| 64. | Melbourne | 4.4% | 2.2%(+2.26)#64 | 3.5%(+0.895)#3,785 |
| 65. | Wildwood | 4.4% | 2.2%(+2.22)#65 | 3.5%(+0.861)#3,846 |
| 66. | Fort Wright | 4.3% | 2.2%(+2.18)#66 | 3.5%(+0.823)#3,892 |
| 67. | Southgate | 4.2% | 2.2%(+2.02)#67 | 3.5%(+0.658)#4,156 |
| 68. | Independence | 4.2% | 2.2%(+2.02)#68 | 3.5%(+0.658)#4,157 |
| 69. | Jeffersontown | 4.2% | 2.2%(+2.00)#69 | 3.5%(+0.641)#4,208 |
| 70. | Plantation | 4.1% | 2.2%(+1.97)#70 | 3.5%(+0.606)#4,266 |
| 71. | Park Hills | 4.0% | 2.2%(+1.87)#71 | 3.5%(+0.512)#4,397 |
| 72. | Union | 4.0% | 2.2%(+1.87)#72 | 3.5%(+0.510)#4,401 |
| 73. | Cold Spring | 4.0% | 2.2%(+1.87)#73 | 3.5%(+0.509)#4,402 |
| 74. | Ludlow | 4.0% | 2.2%(+1.83)#74 | 3.5%(+0.465)#4,478 |
| 75. | Lynnview | 4.0% | 2.2%(+1.80)#75 | 3.5%(+0.441)#4,528 |
| 76. | Glenview Manor | 4.0% | 2.2%(+1.80)#76 | 3.5%(+0.436)#4,533 |
| 77. | Crossgate | 4.0% | 2.2%(+1.80)#77 | 3.5%(+0.436)#4,534 |
| 78. | Graymoor Devondale | 4.0% | 2.2%(+1.79)#78 | 3.5%(+0.429)#4,545 |
| 79. | Frankfort | 3.9% | 2.2%(+1.74)#79 | 3.5%(+0.375)#4,635 |
| 80. | Spring Mill | 3.8% | 2.2%(+1.68)#80 | 3.5%(+0.322)#4,730 |
| 81. | Bromley | 3.8% | 2.2%(+1.66)#81 | 3.5%(+0.296)#4,785 |
| 82. | Broeck Pointe | 3.8% | 2.2%(+1.65)#82 | 3.5%(+0.292)#4,790 |
| 83. | Fort Thomas | 3.8% | 2.2%(+1.63)#83 | 3.5%(+0.271)#4,835 |
| 84. | Princeton | 3.8% | 2.2%(+1.60)#84 | 3.5%(+0.234)#4,894 |
| 85. | Sycamore | 3.7% | 2.2%(+1.59)#85 | 3.5%(+0.225)#4,912 |
| 86. | Moorland | 3.7% | 2.2%(+1.58)#86 | 3.5%(+0.217)#4,931 |
| 87. | Walton | 3.7% | 2.2%(+1.51)#87 | 3.5%(+0.146)#5,066 |
| 88. | Rolling Hills | 3.7% | 2.2%(+1.50)#88 | 3.5%(+0.142)#5,076 |
| 89. | Hollow Creek | 3.6% | 2.2%(+1.47)#89 | 3.5%(+0.112)#5,136 |
| 90. | Richlawn | 3.6% | 2.2%(+1.47)#90 | 3.5%(+0.112)#5,138 |
| 91. | Simpsonville | 3.6% | 2.2%(+1.40)#91 | 3.5%(+0.035)#5,289 |
| 92. | Spring Valley | 3.5% | 2.2%(+1.38)#92 | 3.5%(+0.020)#5,323 |
| 93. | Sandy Hook | 3.5% | 2.2%(+1.36)#93 | 3.5%(-0.003)#5,380 |
| 94. | Magnolia | 3.5% | 2.2%(+1.36)#94 | 3.5%(-0.006)#5,383 |
| 95. | Heritage Creek | 3.5% | 2.2%(+1.34)#95 | 3.5%(-0.022)#5,423 |
| 96. | Eddyville | 3.5% | 2.2%(+1.33)#96 | 3.5%(-0.035)#5,439 |
| 97. | Glenview | 3.5% | 2.2%(+1.32)#97 | 3.5%(-0.040)#5,457 |
| 98. | Sadieville | 3.4% | 2.2%(+1.28)#98 | 3.5%(-0.076)#5,531 |
| 99. | Island | 3.4% | 2.2%(+1.27)#99 | 3.5%(-0.093)#5,570 |
| 100. | Petersburg | 3.4% | 2.2%(+1.26)#100 | 3.5%(-0.106)#5,600 |
Common Questions
What are the Top 10 Cities with the Highest Percentage of Population Employed in Computer & Mathematics in Kentucky?
Top 10 Cities with the Highest Percentage of Population Employed in Computer & Mathematics in Kentucky are:
#1
53.3%
#2
28.5%
#3
22.7%
#4
18.7%
#5
17.7%
#6
15.0%
#7
14.6%
#8
13.3%
#9
12.5%
#10
10.6%
What city has the Highest Percentage of Population Employed in Computer & Mathematics in Kentucky?
Belfry has the Highest Percentage of Population Employed in Computer & Mathematics in Kentucky with 53.3%.
What is the Percentage of Population Employed in Computer & Mathematics in the State of Kentucky?
Percentage of Population Employed in Computer & Mathematics in Kentucky is 2.2%.
What is the Percentage of Population Employed in Computer & Mathematics in the United States?
Percentage of Population Employed in Computer & Mathematics in the United States is 3.5%.