Cities with the Lowest Child Poverty Level Among Boys Under the Age of 16 in Kentucky
RELATED REPORTS & OPTIONS
Lowest Poverty | Boys 0-16
Kentucky
Compare Cities
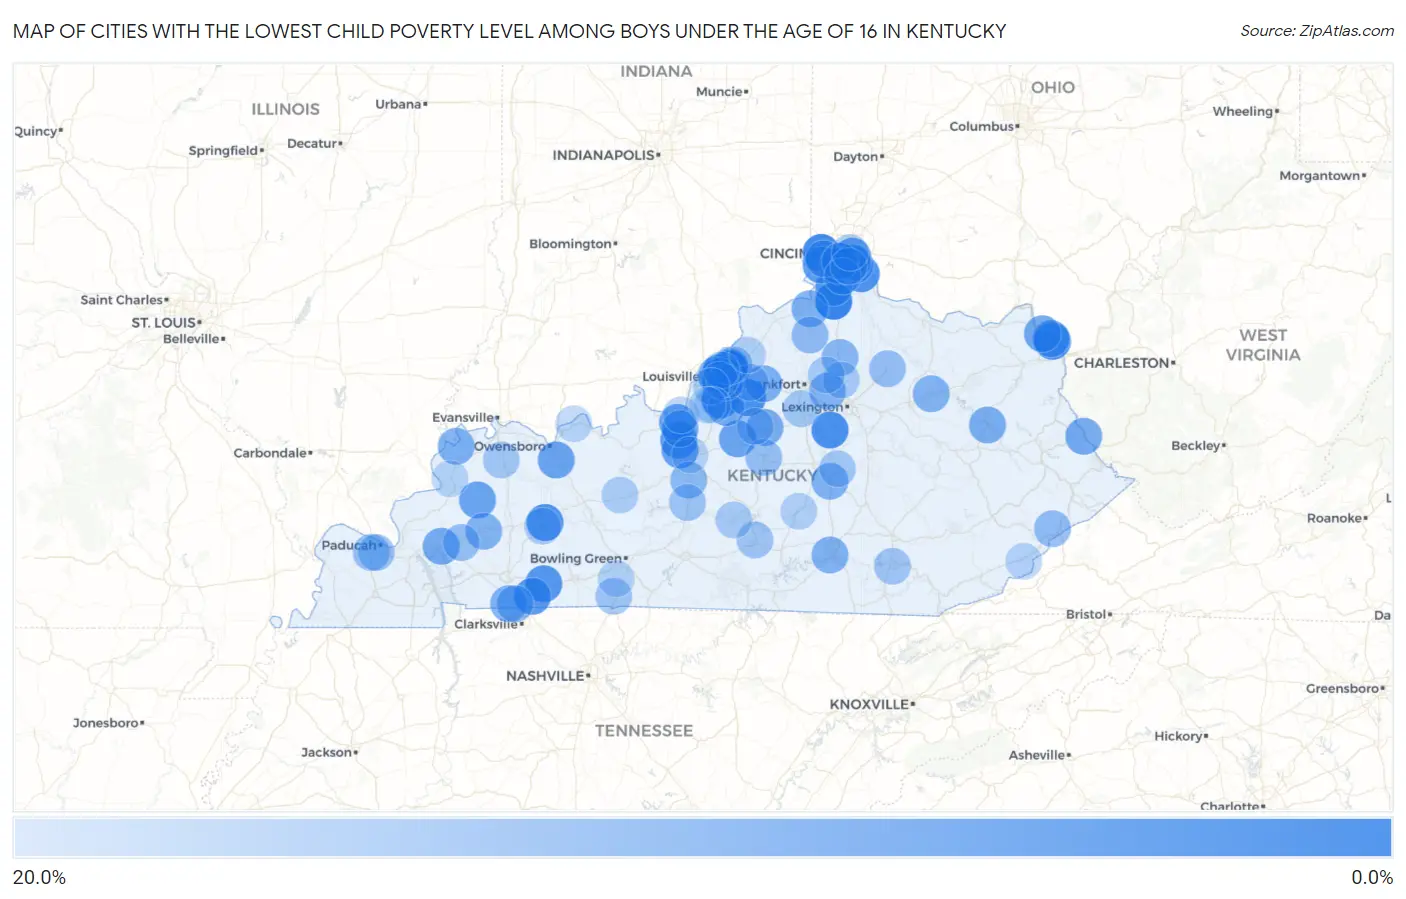
Map of Cities with the Lowest Child Poverty Level Among Boys Under the Age of 16 in Kentucky
20.0%
0.0%
Cities with the Lowest Child Poverty Level Among Boys Under the Age of 16 in Kentucky
| City | Child Poverty (Boys) | vs State | vs National | |
| 1. | Langdon Place | 0.91% | 21.1%(-20.2)#1 | 16.9%(-16.0)#143 |
| 2. | St Matthews | 0.92% | 21.1%(-20.2)#2 | 16.9%(-16.0)#146 |
| 3. | Crittenden | 0.96% | 21.1%(-20.2)#3 | 16.9%(-15.9)#153 |
| 4. | Worthington Hills | 1.3% | 21.1%(-19.9)#4 | 16.9%(-15.6)#280 |
| 5. | Fort Wright | 1.5% | 21.1%(-19.7)#5 | 16.9%(-15.4)#357 |
| 6. | Francisville | 1.7% | 21.1%(-19.4)#6 | 16.9%(-15.2)#461 |
| 7. | Anchorage | 1.9% | 21.1%(-19.2)#7 | 16.9%(-15.0)#581 |
| 8. | Bancroft | 2.2% | 21.1%(-19.0)#8 | 16.9%(-14.7)#742 |
| 9. | Plantation | 2.3% | 21.1%(-18.8)#9 | 16.9%(-14.6)#846 |
| 10. | Heritage Creek | 2.7% | 21.1%(-18.4)#10 | 16.9%(-14.2)#1,070 |
| 11. | Wilmore | 3.1% | 21.1%(-18.1)#11 | 16.9%(-13.8)#1,281 |
| 12. | Elk Creek | 3.2% | 21.1%(-17.9)#12 | 16.9%(-13.7)#1,391 |
| 13. | Alexandria | 3.4% | 21.1%(-17.7)#13 | 16.9%(-13.5)#1,493 |
| 14. | Bellefonte | 3.6% | 21.1%(-17.6)#14 | 16.9%(-13.3)#1,578 |
| 15. | Bellemeade | 3.6% | 21.1%(-17.6)#15 | 16.9%(-13.3)#1,581 |
| 16. | Thruston | 3.8% | 21.1%(-17.3)#16 | 16.9%(-13.1)#1,708 |
| 17. | Powderly | 3.8% | 21.1%(-17.3)#17 | 16.9%(-13.1)#1,734 |
| 18. | Walton | 4.1% | 21.1%(-17.1)#18 | 16.9%(-12.8)#1,861 |
| 19. | Vine Grove | 4.6% | 21.1%(-16.5)#19 | 16.9%(-12.3)#2,177 |
| 20. | Elkton | 4.6% | 21.1%(-16.5)#20 | 16.9%(-12.3)#2,181 |
| 21. | Trenton | 4.8% | 21.1%(-16.4)#21 | 16.9%(-12.1)#2,258 |
| 22. | Burlington | 5.0% | 21.1%(-16.1)#22 | 16.9%(-11.9)#2,404 |
| 23. | Cold Spring | 5.7% | 21.1%(-15.4)#23 | 16.9%(-11.2)#2,866 |
| 24. | Fort Thomas | 6.0% | 21.1%(-15.1)#24 | 16.9%(-10.9)#3,013 |
| 25. | Rineyville | 6.4% | 21.1%(-14.8)#25 | 16.9%(-10.5)#3,256 |
| 26. | Edgewood | 6.5% | 21.1%(-14.6)#26 | 16.9%(-10.4)#3,316 |
| 27. | Muldraugh | 6.5% | 21.1%(-14.6)#27 | 16.9%(-10.4)#3,328 |
| 28. | Russell | 6.9% | 21.1%(-14.3)#28 | 16.9%(-10.0)#3,535 |
| 29. | Masonville | 6.9% | 21.1%(-14.2)#29 | 16.9%(-9.98)#3,568 |
| 30. | Bardstown | 7.1% | 21.1%(-14.1)#30 | 16.9%(-9.82)#3,656 |
| 31. | Erlanger | 7.2% | 21.1%(-14.0)#31 | 16.9%(-9.75)#3,713 |
| 32. | Providence | 7.3% | 21.1%(-13.8)#32 | 16.9%(-9.60)#3,790 |
| 33. | Hebron | 7.5% | 21.1%(-13.7)#33 | 16.9%(-9.44)#3,877 |
| 34. | Wurtland | 7.9% | 21.1%(-13.3)#34 | 16.9%(-9.04)#4,100 |
| 35. | Warfield | 8.3% | 21.1%(-12.8)#35 | 16.9%(-8.57)#4,391 |
| 36. | Fort Knox | 8.4% | 21.1%(-12.7)#36 | 16.9%(-8.47)#4,452 |
| 37. | Mount Washington | 8.5% | 21.1%(-12.7)#37 | 16.9%(-8.44)#4,475 |
| 38. | Eddyville | 8.6% | 21.1%(-12.6)#38 | 16.9%(-8.35)#4,517 |
| 39. | Middletown | 8.8% | 21.1%(-12.3)#39 | 16.9%(-8.06)#4,696 |
| 40. | Highland Heights | 8.9% | 21.1%(-12.3)#40 | 16.9%(-8.02)#4,709 |
| 41. | West Liberty | 9.0% | 21.1%(-12.1)#41 | 16.9%(-7.87)#4,774 |
| 42. | Fincastle | 9.1% | 21.1%(-12.1)#42 | 16.9%(-7.81)#4,813 |
| 43. | Chaplin | 9.2% | 21.1%(-12.0)#43 | 16.9%(-7.75)#4,874 |
| 44. | Uniontown | 9.2% | 21.1%(-12.0)#44 | 16.9%(-7.72)#4,895 |
| 45. | Fort Campbell North | 9.3% | 21.1%(-11.8)#45 | 16.9%(-7.56)#4,986 |
| 46. | Briarwood | 9.4% | 21.1%(-11.8)#46 | 16.9%(-7.53)#5,006 |
| 47. | Shelbyville | 9.4% | 21.1%(-11.7)#47 | 16.9%(-7.49)#5,029 |
| 48. | Glencoe | 9.5% | 21.1%(-11.6)#48 | 16.9%(-7.38)#5,083 |
| 49. | Maryhill Estates | 9.7% | 21.1%(-11.5)#49 | 16.9%(-7.23)#5,161 |
| 50. | Stanford | 9.8% | 21.1%(-11.4)#50 | 16.9%(-7.13)#5,206 |
| 51. | Owingsville | 10.0% | 21.1%(-11.1)#51 | 16.9%(-6.86)#5,380 |
| 52. | Midway | 10.1% | 21.1%(-11.0)#52 | 16.9%(-6.79)#5,413 |
| 53. | Burnside | 10.1% | 21.1%(-11.0)#53 | 16.9%(-6.79)#5,416 |
| 54. | Dawson Springs | 10.2% | 21.1%(-11.0)#54 | 16.9%(-6.72)#5,438 |
| 55. | Oak Grove | 10.6% | 21.1%(-10.5)#55 | 16.9%(-6.30)#5,660 |
| 56. | Sadieville | 10.9% | 21.1%(-10.2)#56 | 16.9%(-5.99)#5,825 |
| 57. | Fort Mitchell | 11.1% | 21.1%(-10.0)#57 | 16.9%(-5.80)#5,891 |
| 58. | Independence | 11.3% | 21.1%(-9.88)#58 | 16.9%(-5.64)#5,997 |
| 59. | Sonora | 11.3% | 21.1%(-9.88)#59 | 16.9%(-5.64)#5,999 |
| 60. | Owenton | 11.6% | 21.1%(-9.58)#60 | 16.9%(-5.34)#6,132 |
| 61. | Fleming Neon | 11.6% | 21.1%(-9.58)#61 | 16.9%(-5.33)#6,136 |
| 62. | Crestwood | 11.8% | 21.1%(-9.37)#62 | 16.9%(-5.13)#6,267 |
| 63. | Lyndon | 12.0% | 21.1%(-9.18)#63 | 16.9%(-4.94)#6,354 |
| 64. | Massac | 12.4% | 21.1%(-8.76)#64 | 16.9%(-4.51)#6,552 |
| 65. | Millersburg | 12.5% | 21.1%(-8.65)#65 | 16.9%(-4.40)#6,609 |
| 66. | Princeton | 12.7% | 21.1%(-8.40)#66 | 16.9%(-4.16)#6,741 |
| 67. | Springfield | 12.8% | 21.1%(-8.38)#67 | 16.9%(-4.14)#6,750 |
| 68. | Bloomfield | 12.9% | 21.1%(-8.27)#68 | 16.9%(-4.03)#6,815 |
| 69. | Simpsonville | 13.0% | 21.1%(-8.16)#69 | 16.9%(-3.92)#6,857 |
| 70. | Beechwood Village | 13.0% | 21.1%(-8.16)#70 | 16.9%(-3.92)#6,858 |
| 71. | Jeffersontown | 13.1% | 21.1%(-8.06)#71 | 16.9%(-3.82)#6,903 |
| 72. | Hendron | 13.3% | 21.1%(-7.88)#72 | 16.9%(-3.64)#6,999 |
| 73. | Bonnieville | 13.6% | 21.1%(-7.51)#73 | 16.9%(-3.27)#7,208 |
| 74. | Orchard Grass Hills | 13.7% | 21.1%(-7.41)#74 | 16.9%(-3.16)#7,248 |
| 75. | Columbia | 13.9% | 21.1%(-7.29)#75 | 16.9%(-3.05)#7,310 |
| 76. | Franklin | 13.9% | 21.1%(-7.29)#76 | 16.9%(-3.05)#7,311 |
| 77. | Corbin | 13.9% | 21.1%(-7.25)#77 | 16.9%(-3.01)#7,334 |
| 78. | Robards | 14.3% | 21.1%(-6.86)#78 | 16.9%(-2.62)#7,508 |
| 79. | Lancaster | 14.3% | 21.1%(-6.82)#79 | 16.9%(-2.58)#7,563 |
| 80. | Lawrenceburg | 14.4% | 21.1%(-6.77)#80 | 16.9%(-2.52)#7,577 |
| 81. | Georgetown | 14.5% | 21.1%(-6.64)#81 | 16.9%(-2.39)#7,625 |
| 82. | Greensburg | 14.8% | 21.1%(-6.33)#82 | 16.9%(-2.09)#7,766 |
| 83. | Stamping Ground | 14.9% | 21.1%(-6.28)#83 | 16.9%(-2.04)#7,803 |
| 84. | Taylor Mill | 15.0% | 21.1%(-6.18)#84 | 16.9%(-1.93)#7,843 |
| 85. | Bellevue | 15.0% | 21.1%(-6.16)#85 | 16.9%(-1.92)#7,851 |
| 86. | Greenville | 15.1% | 21.1%(-6.02)#86 | 16.9%(-1.78)#7,903 |
| 87. | St Regis Park | 15.2% | 21.1%(-6.00)#87 | 16.9%(-1.75)#7,918 |
| 88. | Caneyville | 15.2% | 21.1%(-5.91)#88 | 16.9%(-1.67)#7,968 |
| 89. | Barbourmeade | 15.3% | 21.1%(-5.89)#89 | 16.9%(-1.65)#7,970 |
| 90. | Watterson Park | 15.6% | 21.1%(-5.59)#90 | 16.9%(-1.35)#8,108 |
| 91. | Liberty | 15.6% | 21.1%(-5.52)#91 | 16.9%(-1.28)#8,134 |
| 92. | La Grange | 15.8% | 21.1%(-5.30)#92 | 16.9%(-1.06)#8,252 |
| 93. | Woodburn | 16.0% | 21.1%(-5.15)#93 | 16.9%(-0.904)#8,327 |
| 94. | Hillview | 16.0% | 21.1%(-5.13)#94 | 16.9%(-0.884)#8,337 |
| 95. | West Point | 16.2% | 21.1%(-4.98)#95 | 16.9%(-0.736)#8,399 |
| 96. | Benham | 16.2% | 21.1%(-4.93)#96 | 16.9%(-0.688)#8,427 |
| 97. | Elizabethtown | 16.4% | 21.1%(-4.71)#97 | 16.9%(-0.468)#8,534 |
| 98. | Lewisport | 16.5% | 21.1%(-4.64)#98 | 16.9%(-0.394)#8,564 |
| 99. | Sturgis | 16.5% | 21.1%(-4.63)#99 | 16.9%(-0.390)#8,565 |
| 100. | Brooks | 16.7% | 21.1%(-4.48)#100 | 16.9%(-0.237)#8,618 |
Common Questions
What are the Top 10 Cities with the Lowest Child Poverty Level Among Boys Under the Age of 16 in Kentucky?
Top 10 Cities with the Lowest Child Poverty Level Among Boys Under the Age of 16 in Kentucky are:
#1
0.91%
#2
0.92%
#3
0.96%
#4
1.3%
#5
1.5%
#6
1.7%
#7
1.9%
#8
2.2%
#9
2.3%
#10
2.7%
What city has the Lowest Child Poverty Level Among Boys Under the Age of 16 in Kentucky?
Langdon Place has the Lowest Child Poverty Level Among Boys Under the Age of 16 in Kentucky with 0.91%.
What is the Poverty Level Among Boys Under the Age of 16 in the State of Kentucky?
Poverty Level Among Boys Under the Age of 16 in Kentucky is 21.1%.
What is the Poverty Level Among Boys Under the Age of 16 in the United States?
Poverty Level Among Boys Under the Age of 16 in the United States is 16.9%.