Bell Acres borough, PA
Bell Acres borough Overview
1,615
TOTAL POPULATION
804
MALE POPULATION
811
FEMALE POPULATION
99.14
MALES / 100 FEMALES
100.87
FEMALES / 100 MALES
43.7
MEDIAN AGE
3.1
AVG FAMILY SIZE
2.8
AVG HOUSEHOLD SIZE
$83,020
PER CAPITA INCOME
$164,792
AVG FAMILY INCOME
$156,382
AVG HOUSEHOLD INCOME
46.9%
WAGE / INCOME GAP [ % ]
53.1¢/ $1
WAGE / INCOME GAP [ $ ]
0.51
INEQUALITY / GINI INDEX
856
LABOR FORCE [ PEOPLE ]
66.6%
PERCENT IN LABOR FORCE
2.6%
UNEMPLOYMENT RATE
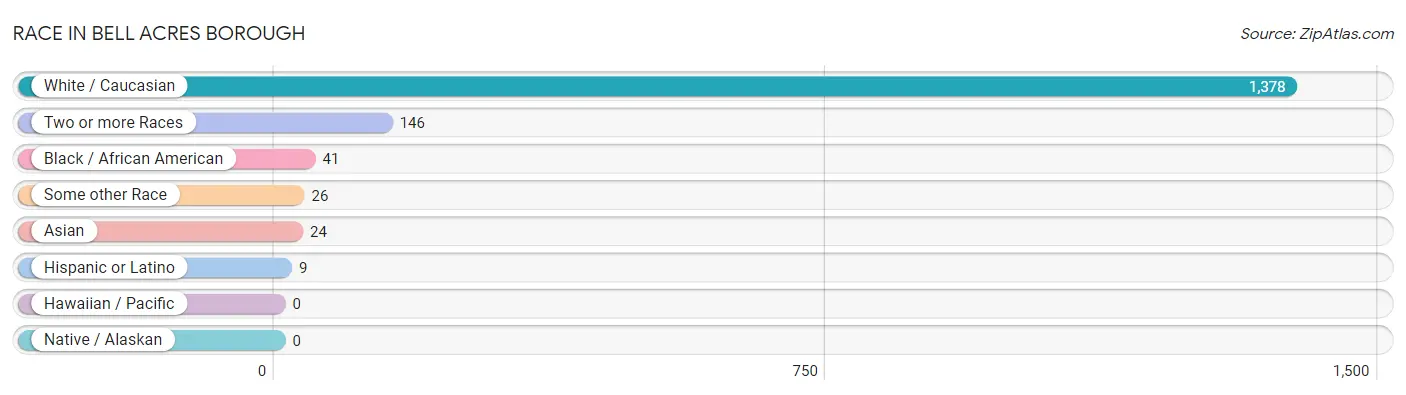
Race in Bell Acres borough
The most populous races in Bell Acres borough are White / Caucasian (1,378 | 85.3%), Two or more Races (146 | 9.0%), and Black / African American (41 | 2.5%).
| Race | # Population | % Population |
| Asian | 24 | 1.5% |
| Black / African American | 41 | 2.5% |
| Hawaiian / Pacific | 0 | 0.0% |
| Hispanic or Latino | 9 | 0.6% |
| Native / Alaskan | 0 | 0.0% |
| White / Caucasian | 1,378 | 85.3% |
| Two or more Races | 146 | 9.0% |
| Some other Race | 26 | 1.6% |
| Total | 1,615 | 100.0% |
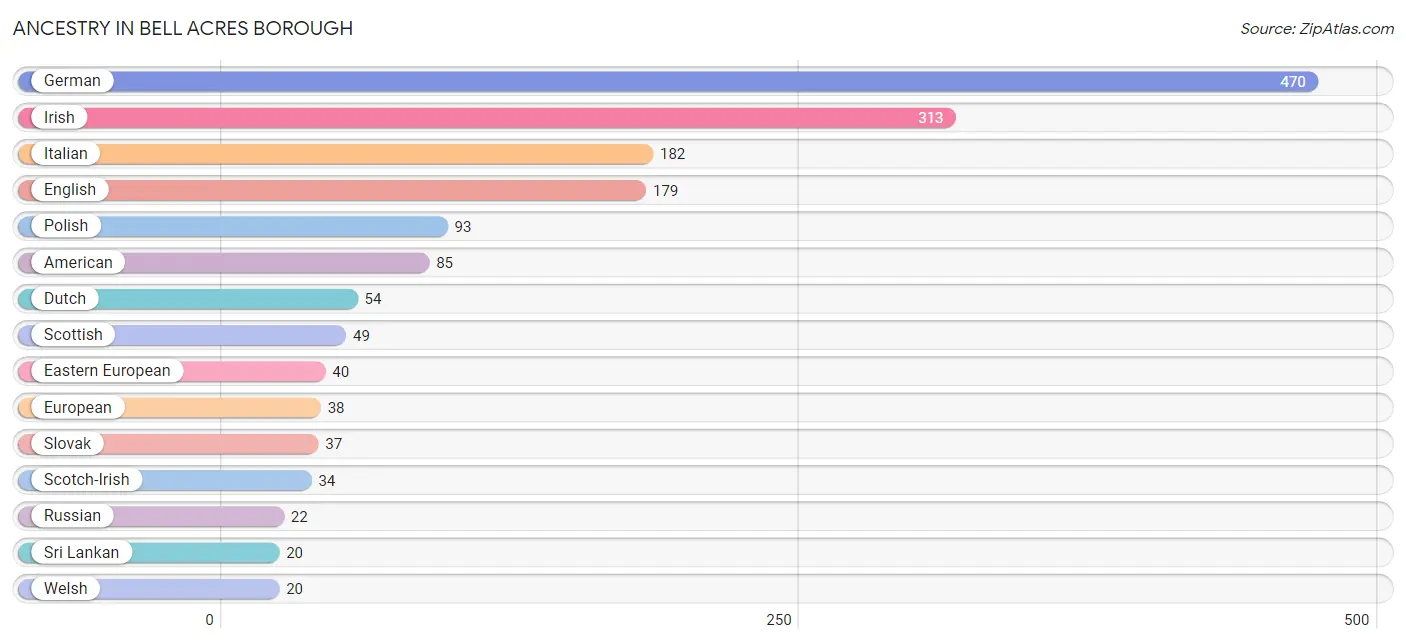
Ancestry in Bell Acres borough
The most populous ancestries reported in Bell Acres borough are German (470 | 29.1%), Irish (313 | 19.4%), Italian (182 | 11.3%), English (179 | 11.1%), and Polish (93 | 5.8%), together accounting for 76.6% of all Bell Acres borough residents.
| Ancestry | # Population | % Population |
| American | 85 | 5.3% |
| Armenian | 6 | 0.4% |
| Austrian | 3 | 0.2% |
| Belgian | 13 | 0.8% |
| British | 6 | 0.4% |
| Burmese | 13 | 0.8% |
| Croatian | 16 | 1.0% |
| Czech | 14 | 0.9% |
| Dutch | 54 | 3.3% |
| Eastern European | 40 | 2.5% |
| English | 179 | 11.1% |
| European | 38 | 2.4% |
| French | 17 | 1.1% |
| French Canadian | 2 | 0.1% |
| German | 470 | 29.1% |
| Greek | 12 | 0.7% |
| Hungarian | 13 | 0.8% |
| Indian (Asian) | 12 | 0.7% |
| Irish | 313 | 19.4% |
| Italian | 182 | 11.3% |
| Korean | 2 | 0.1% |
| Laotian | 4 | 0.3% |
| Lithuanian | 5 | 0.3% |
| Pennsylvania German | 11 | 0.7% |
| Polish | 93 | 5.8% |
| Russian | 22 | 1.4% |
| Scandinavian | 6 | 0.4% |
| Scotch-Irish | 34 | 2.1% |
| Scottish | 49 | 3.0% |
| Serbian | 7 | 0.4% |
| Slovak | 37 | 2.3% |
| Slovene | 3 | 0.2% |
| Spanish | 9 | 0.6% |
| Sri Lankan | 20 | 1.2% |
| Ukrainian | 16 | 1.0% |
| Welsh | 20 | 1.2% |
| Yugoslavian | 5 | 0.3% | View All 37 Rows |
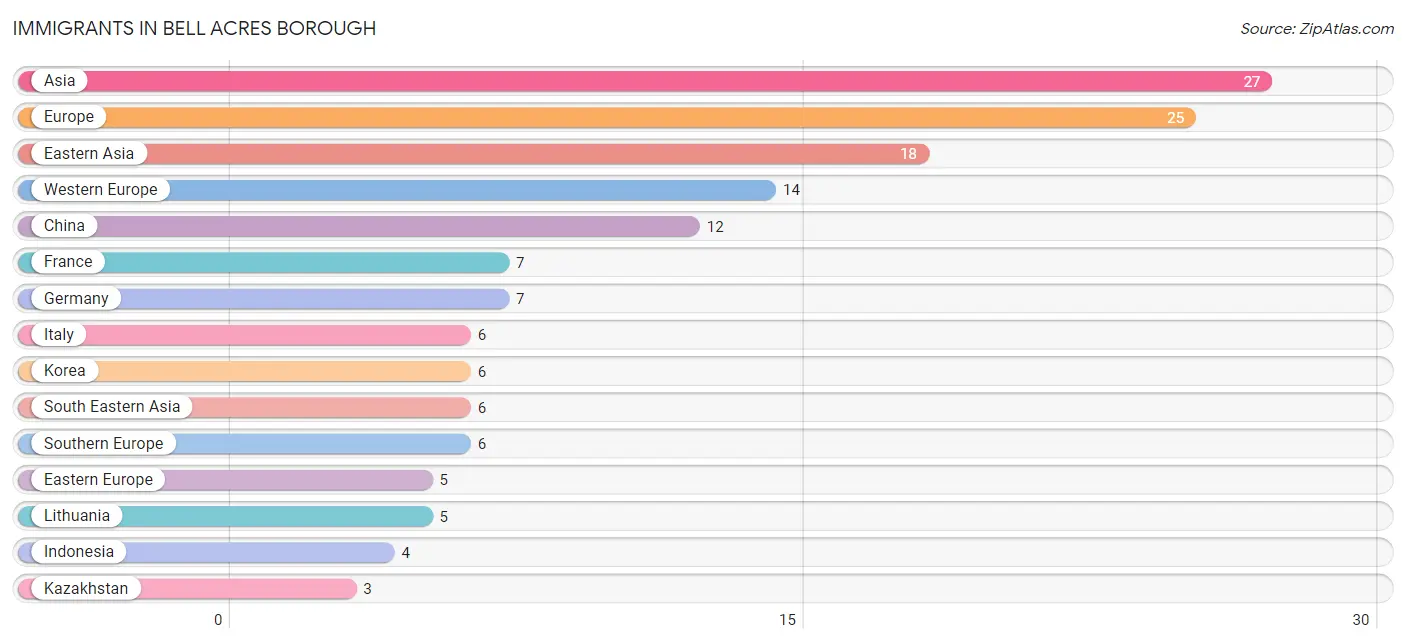
Immigrants in Bell Acres borough
The most numerous immigrant groups reported in Bell Acres borough came from Asia (27 | 1.7%), Europe (25 | 1.5%), Eastern Asia (18 | 1.1%), Western Europe (14 | 0.9%), and China (12 | 0.7%), together accounting for 5.9% of all Bell Acres borough residents.
| Immigration Origin | # Population | % Population |
| Asia | 27 | 1.7% |
| China | 12 | 0.7% |
| Eastern Asia | 18 | 1.1% |
| Eastern Europe | 5 | 0.3% |
| Europe | 25 | 1.5% |
| France | 7 | 0.4% |
| Germany | 7 | 0.4% |
| Indonesia | 4 | 0.3% |
| Italy | 6 | 0.4% |
| Kazakhstan | 3 | 0.2% |
| Korea | 6 | 0.4% |
| Lithuania | 5 | 0.3% |
| Philippines | 2 | 0.1% |
| South Central Asia | 3 | 0.2% |
| South Eastern Asia | 6 | 0.4% |
| Southern Europe | 6 | 0.4% |
| Taiwan | 3 | 0.2% |
| Western Europe | 14 | 0.9% | View All 18 Rows |
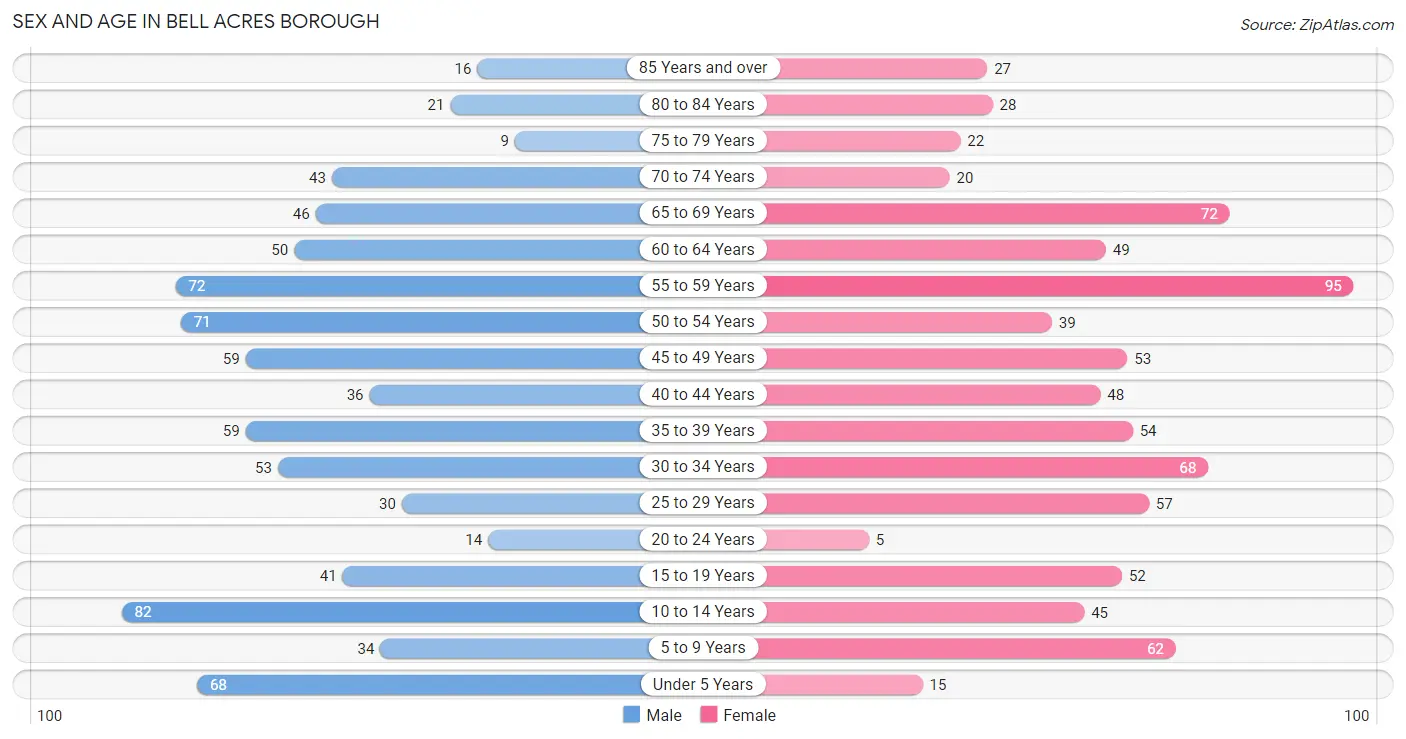
Sex and Age in Bell Acres borough
Sex and Age in Bell Acres borough
The most populous age groups in Bell Acres borough are 10 to 14 Years (82 | 10.2%) for men and 55 to 59 Years (95 | 11.7%) for women.
| Age Bracket | Male | Female |
| Under 5 Years | 68 (8.5%) | 15 (1.8%) |
| 5 to 9 Years | 34 (4.2%) | 62 (7.6%) |
| 10 to 14 Years | 82 (10.2%) | 45 (5.6%) |
| 15 to 19 Years | 41 (5.1%) | 52 (6.4%) |
| 20 to 24 Years | 14 (1.7%) | 5 (0.6%) |
| 25 to 29 Years | 30 (3.7%) | 57 (7.0%) |
| 30 to 34 Years | 53 (6.6%) | 68 (8.4%) |
| 35 to 39 Years | 59 (7.3%) | 54 (6.7%) |
| 40 to 44 Years | 36 (4.5%) | 48 (5.9%) |
| 45 to 49 Years | 59 (7.3%) | 53 (6.5%) |
| 50 to 54 Years | 71 (8.8%) | 39 (4.8%) |
| 55 to 59 Years | 72 (9.0%) | 95 (11.7%) |
| 60 to 64 Years | 50 (6.2%) | 49 (6.0%) |
| 65 to 69 Years | 46 (5.7%) | 72 (8.9%) |
| 70 to 74 Years | 43 (5.3%) | 20 (2.5%) |
| 75 to 79 Years | 9 (1.1%) | 22 (2.7%) |
| 80 to 84 Years | 21 (2.6%) | 28 (3.5%) |
| 85 Years and over | 16 (2.0%) | 27 (3.3%) |
| Total | 804 (100.0%) | 811 (100.0%) |
Families and Households in Bell Acres borough
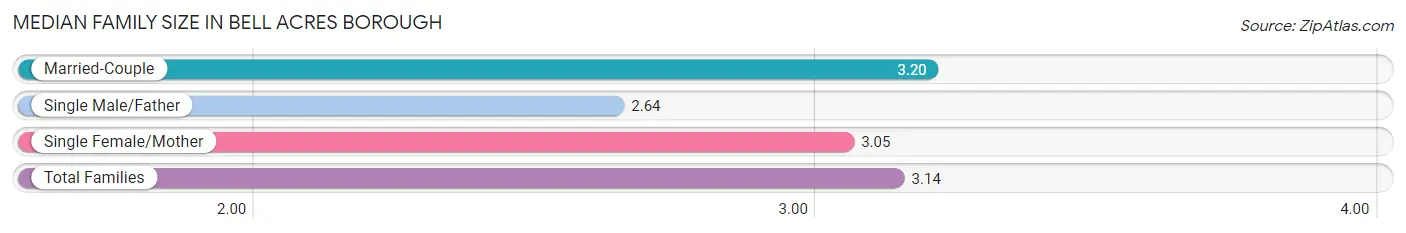
Median Family Size in Bell Acres borough
The median family size in Bell Acres borough is 3.14 persons per family, with married-couple families (356 | 76.7%) accounting for the largest median family size of 3.2 persons per family. On the other hand, single male/father families (28 | 6.0%) represent the smallest median family size with 2.64 persons per family.
| Family Type | # Families | Family Size |
| Married-Couple | 356 (76.7%) | 3.20 |
| Single Male/Father | 28 (6.0%) | 2.64 |
| Single Female/Mother | 80 (17.2%) | 3.05 |
| Total Families | 464 (100.0%) | 3.14 |
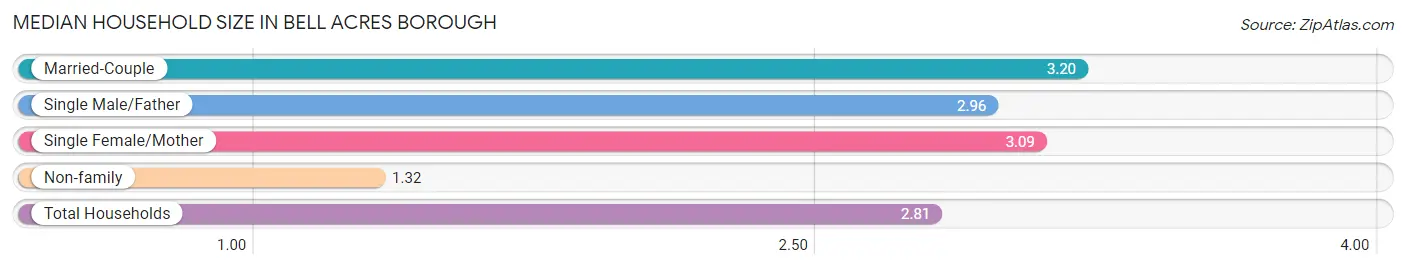
Median Household Size in Bell Acres borough
The median household size in Bell Acres borough is 2.81 persons per household, with married-couple households (356 | 61.9%) accounting for the largest median household size of 3.2 persons per household. non-family households (111 | 19.3%) represent the smallest median household size with 1.32 persons per household.
| Household Type | # Households | Household Size |
| Married-Couple | 356 (61.9%) | 3.20 |
| Single Male/Father | 28 (4.9%) | 2.96 |
| Single Female/Mother | 80 (13.9%) | 3.09 |
| Non-family | 111 (19.3%) | 1.32 |
| Total Households | 575 (100.0%) | 2.81 |
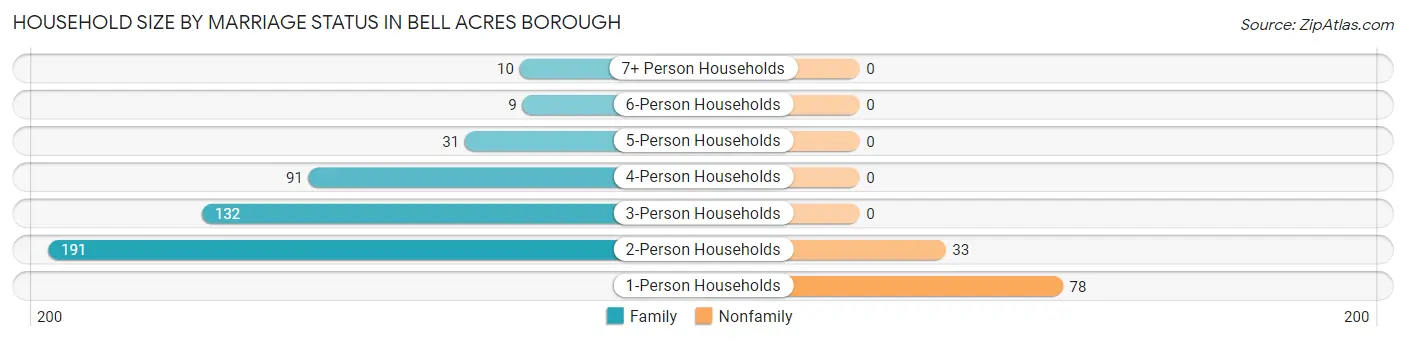
Household Size by Marriage Status in Bell Acres borough
Out of a total of 575 households in Bell Acres borough, 464 (80.7%) are family households, while 111 (19.3%) are nonfamily households. The most numerous type of family households are 2-person households, comprising 191, and the most common type of nonfamily households are 1-person households, comprising 78.
| Household Size | Family Households | Nonfamily Households |
| 1-Person Households | - | 78 (13.6%) |
| 2-Person Households | 191 (33.2%) | 33 (5.7%) |
| 3-Person Households | 132 (23.0%) | 0 (0.0%) |
| 4-Person Households | 91 (15.8%) | 0 (0.0%) |
| 5-Person Households | 31 (5.4%) | 0 (0.0%) |
| 6-Person Households | 9 (1.6%) | 0 (0.0%) |
| 7+ Person Households | 10 (1.7%) | 0 (0.0%) |
| Total | 464 (80.7%) | 111 (19.3%) |
Female Fertility in Bell Acres borough
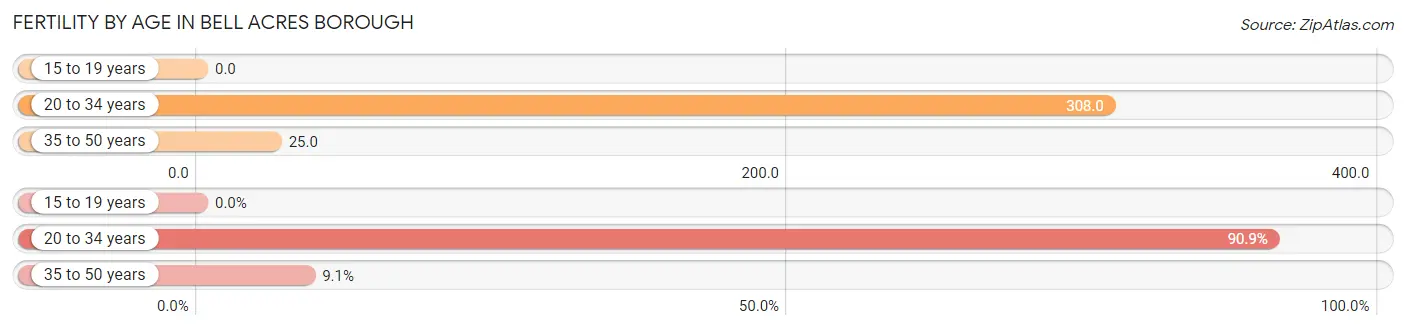
Fertility by Age in Bell Acres borough
Average fertility rate in Bell Acres borough is 129.0 births per 1,000 women. Women in the age bracket of 20 to 34 years have the highest fertility rate with 308.0 births per 1,000 women. Women in the age bracket of 20 to 34 years acount for 90.9% of all women with births.
| Age Bracket | Women with Births | Births / 1,000 Women |
| 15 to 19 years | 0 (0.0%) | 0.0 |
| 20 to 34 years | 40 (90.9%) | 308.0 |
| 35 to 50 years | 4 (9.1%) | 25.0 |
| Total | 44 (100.0%) | 129.0 |
Fertility by Age by Marriage Status in Bell Acres borough
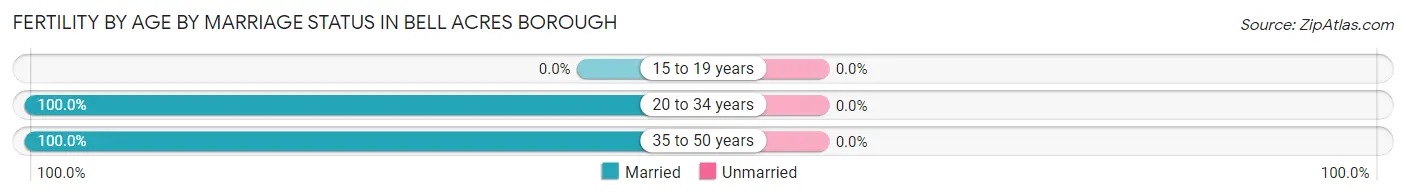
| Age Bracket | Married | Unmarried |
| 15 to 19 years | 0 (0.0%) | 0 (0.0%) |
| 20 to 34 years | 40 (100.0%) | 0 (0.0%) |
| 35 to 50 years | 4 (100.0%) | 0 (0.0%) |
| Total | 44 (100.0%) | 0 (0.0%) |
Fertility by Education in Bell Acres borough
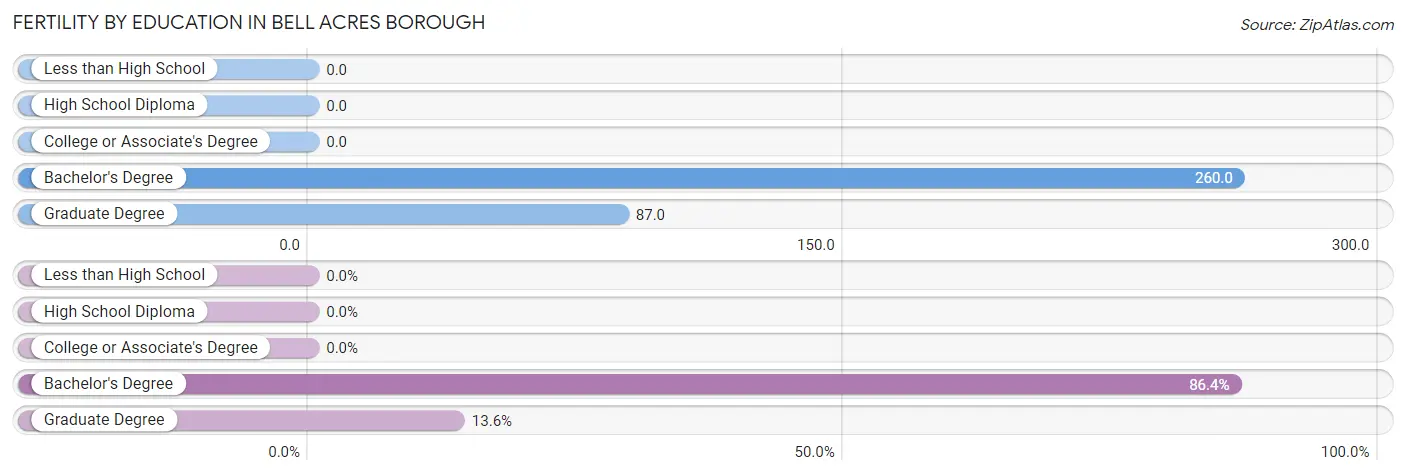
| Educational Attainment | Women with Births | Births / 1,000 Women |
| Less than High School | 0 (0.0%) | 0.0 |
| High School Diploma | 0 (0.0%) | 0.0 |
| College or Associate's Degree | 0 (0.0%) | 0.0 |
| Bachelor's Degree | 38 (86.4%) | 260.0 |
| Graduate Degree | 6 (13.6%) | 87.0 |
| Total | 44 (100.0%) | 129.0 |
Fertility by Education by Marriage Status in Bell Acres borough
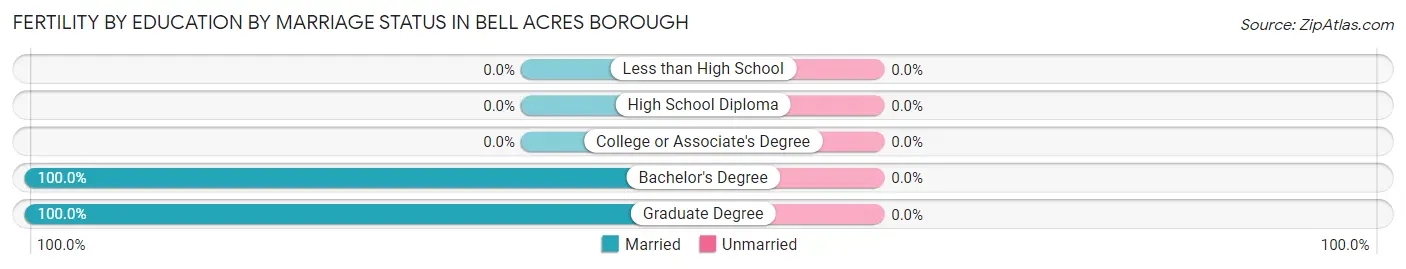
| Educational Attainment | Married | Unmarried |
| Less than High School | 0 (0.0%) | 0 (0.0%) |
| High School Diploma | 0 (0.0%) | 0 (0.0%) |
| College or Associate's Degree | 0 (0.0%) | 0 (0.0%) |
| Bachelor's Degree | 38 (100.0%) | 0 (0.0%) |
| Graduate Degree | 6 (100.0%) | 0 (0.0%) |
| Total | 44 (100.0%) | 0 (0.0%) |
Income in Bell Acres borough
Income Overview in Bell Acres borough
Per Capita Income in Bell Acres borough is $83,020, while median incomes of families and households are $164,792 and $156,382 respectively.
| Characteristic | Number | Measure |
| Per Capita Income | 1,615 | $83,020 |
| Median Family Income | 464 | $164,792 |
| Mean Family Income | 464 | $255,583 |
| Median Household Income | 575 | $156,382 |
| Mean Household Income | 575 | $232,105 |
| Income Deficit | 464 | $0 |
| Wage / Income Gap (%) | 1,615 | 46.91% |
| Wage / Income Gap ($) | 1,615 | 53.09¢ per $1 |
| Gini / Inequality Index | 1,615 | 0.51 |
Earnings by Sex in Bell Acres borough
Average Earnings in Bell Acres borough are $70,848, $87,813 for men and $46,618 for women, a difference of 46.9%.
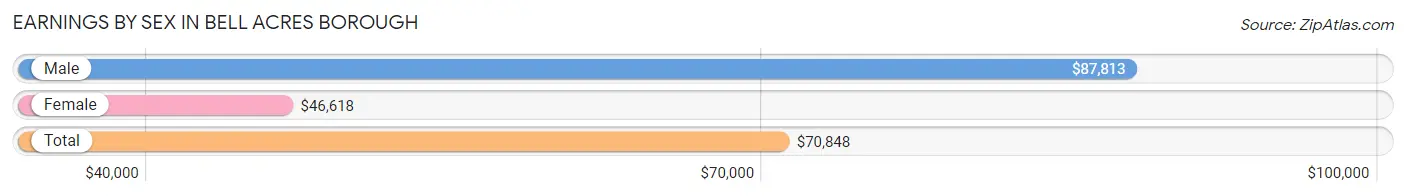
| Sex | Number | Average Earnings |
| Male | 471 (51.5%) | $87,813 |
| Female | 444 (48.5%) | $46,618 |
| Total | 915 (100.0%) | $70,848 |
Earnings by Sex by Income Bracket in Bell Acres borough
The most common earnings brackets in Bell Acres borough are $100,000+ for men (215 | 45.7%) and $75,000 to $99,999 for women (96 | 21.6%).
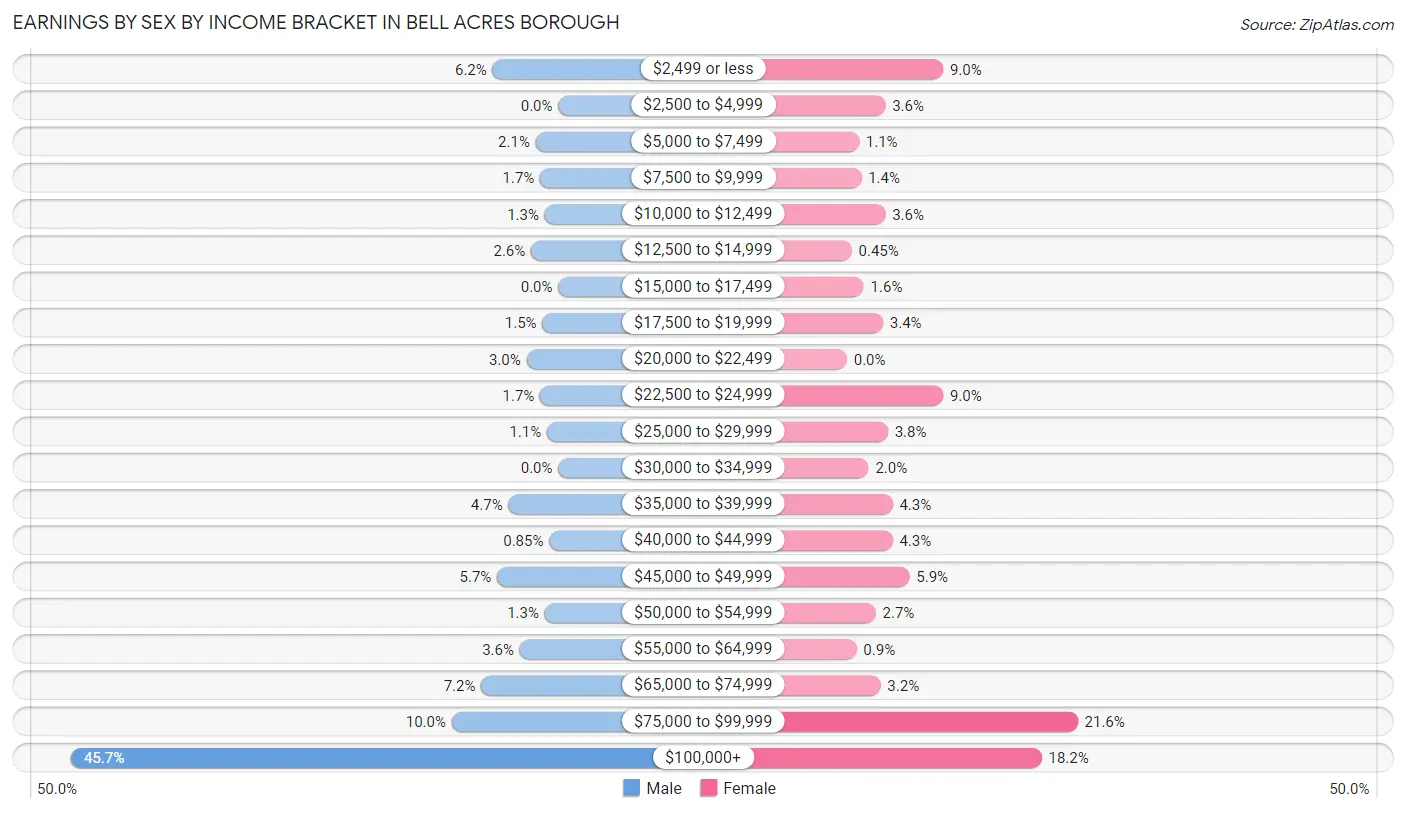
| Income | Male | Female |
| $2,499 or less | 29 (6.2%) | 40 (9.0%) |
| $2,500 to $4,999 | 0 (0.0%) | 16 (3.6%) |
| $5,000 to $7,499 | 10 (2.1%) | 5 (1.1%) |
| $7,500 to $9,999 | 8 (1.7%) | 6 (1.3%) |
| $10,000 to $12,499 | 6 (1.3%) | 16 (3.6%) |
| $12,500 to $14,999 | 12 (2.5%) | 2 (0.4%) |
| $15,000 to $17,499 | 0 (0.0%) | 7 (1.6%) |
| $17,500 to $19,999 | 7 (1.5%) | 15 (3.4%) |
| $20,000 to $22,499 | 14 (3.0%) | 0 (0.0%) |
| $22,500 to $24,999 | 8 (1.7%) | 40 (9.0%) |
| $25,000 to $29,999 | 5 (1.1%) | 17 (3.8%) |
| $30,000 to $34,999 | 0 (0.0%) | 9 (2.0%) |
| $35,000 to $39,999 | 22 (4.7%) | 19 (4.3%) |
| $40,000 to $44,999 | 4 (0.9%) | 19 (4.3%) |
| $45,000 to $49,999 | 27 (5.7%) | 26 (5.9%) |
| $50,000 to $54,999 | 6 (1.3%) | 12 (2.7%) |
| $55,000 to $64,999 | 17 (3.6%) | 4 (0.9%) |
| $65,000 to $74,999 | 34 (7.2%) | 14 (3.2%) |
| $75,000 to $99,999 | 47 (10.0%) | 96 (21.6%) |
| $100,000+ | 215 (45.7%) | 81 (18.2%) |
| Total | 471 (100.0%) | 444 (100.0%) |
Earnings by Sex by Educational Attainment in Bell Acres borough
Average earnings in Bell Acres borough are $93,542 for men and $51,250 for women, a difference of 45.2%. Men with an educational attainment of graduate degree enjoy the highest average annual earnings of $223,958, while those with high school diploma education earn the least with $36,591. Women with an educational attainment of graduate degree earn the most with the average annual earnings of $88,750, while those with high school diploma education have the smallest earnings of $18,906.
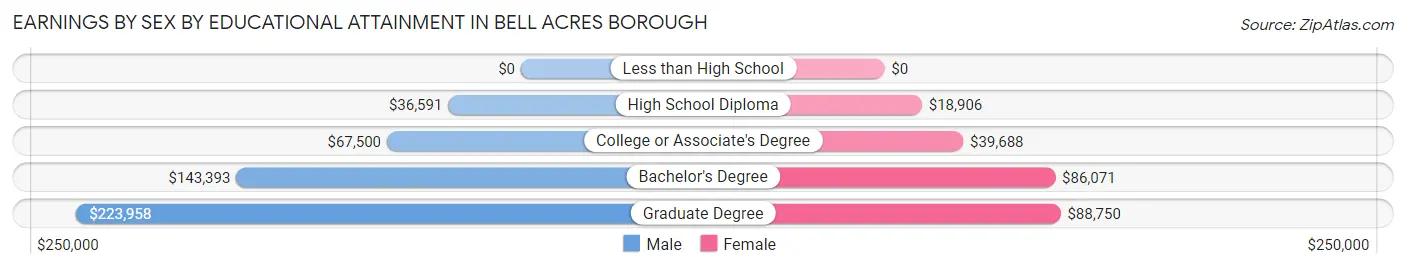
| Educational Attainment | Male Income | Female Income |
| Less than High School | - | - |
| High School Diploma | $36,591 | $18,906 |
| College or Associate's Degree | $67,500 | $39,688 |
| Bachelor's Degree | $143,393 | $86,071 |
| Graduate Degree | $223,958 | $88,750 |
| Total | $93,542 | $51,250 |
Family Income in Bell Acres borough
Family Income Brackets in Bell Acres borough
According to the Bell Acres borough family income data, there are 188 families falling into the $200,000+ income range, which is the most common income bracket and makes up 40.5% of all families. Conversely, the less than $10,000 income bracket is the least frequent group with only 5 families (1.1%) belonging to this category.
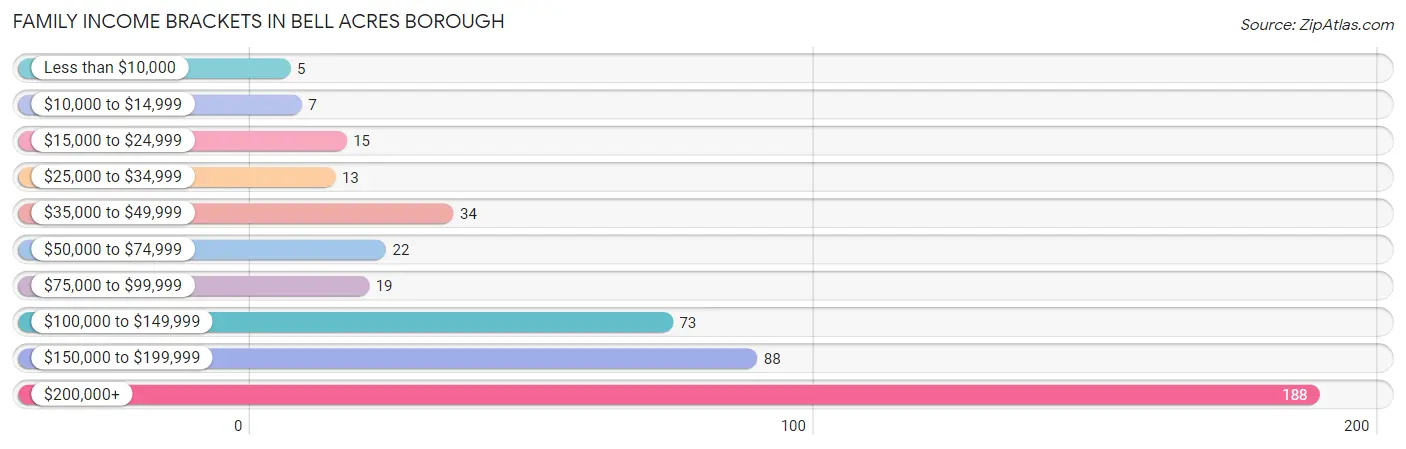
| Income Bracket | # Families | % Families |
| Less than $10,000 | 5 | 1.1% |
| $10,000 to $14,999 | 7 | 1.5% |
| $15,000 to $24,999 | 15 | 3.2% |
| $25,000 to $34,999 | 13 | 2.8% |
| $35,000 to $49,999 | 34 | 7.3% |
| $50,000 to $74,999 | 22 | 4.7% |
| $75,000 to $99,999 | 19 | 4.1% |
| $100,000 to $149,999 | 73 | 15.7% |
| $150,000 to $199,999 | 88 | 19.0% |
| $200,000+ | 188 | 40.5% |
Family Income by Famaliy Size in Bell Acres borough
7+ person families (10 | 2.2%) account for the highest median family income in Bell Acres borough with $250,001 per family, while 3-person families (124 | 26.7%) have the highest median income of $62,197 per family member.
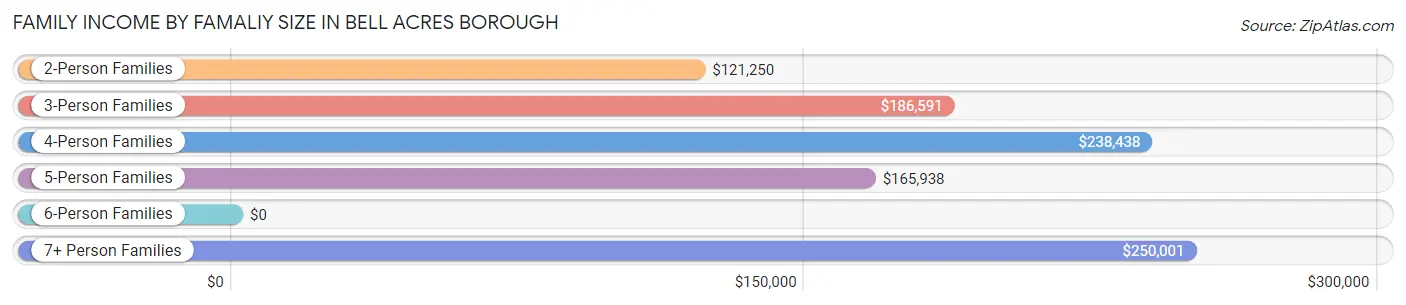
| Income Bracket | # Families | Median Income |
| 2-Person Families | 199 (42.9%) | $121,250 |
| 3-Person Families | 124 (26.7%) | $186,591 |
| 4-Person Families | 95 (20.5%) | $238,438 |
| 5-Person Families | 27 (5.8%) | $165,938 |
| 6-Person Families | 9 (1.9%) | $0 |
| 7+ Person Families | 10 (2.2%) | $250,001 |
| Total | 464 (100.0%) | $164,792 |
Family Income by Number of Earners in Bell Acres borough
The median family income in Bell Acres borough is $164,792, with families comprising 3+ earners (59) having the highest median family income of $208,125, while families with no earners (60) have the lowest median family income of $62,500, accounting for 12.7% and 12.9% of families, respectively.
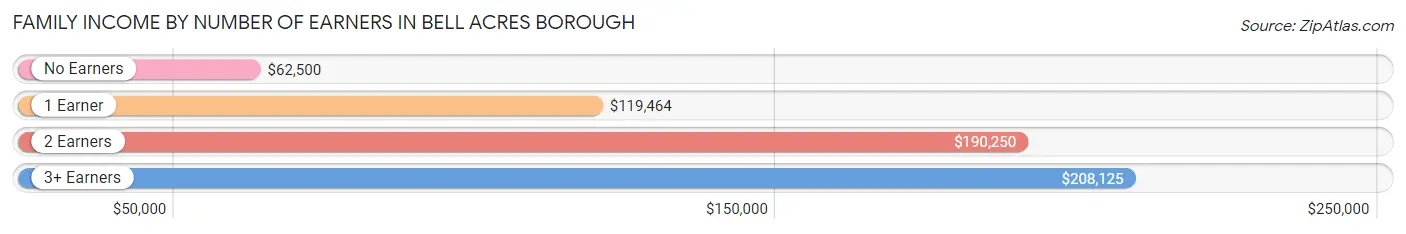
| Number of Earners | # Families | Median Income |
| No Earners | 60 (12.9%) | $62,500 |
| 1 Earner | 117 (25.2%) | $119,464 |
| 2 Earners | 228 (49.1%) | $190,250 |
| 3+ Earners | 59 (12.7%) | $208,125 |
| Total | 464 (100.0%) | $164,792 |
Household Income in Bell Acres borough
Household Income Brackets in Bell Acres borough
With 205 households falling in the category, the $200,000+ income range is the most frequent in Bell Acres borough, accounting for 35.6% of all households. In contrast, only 8 households (1.4%) fall into the less than $10,000 income bracket, making it the least populous group.
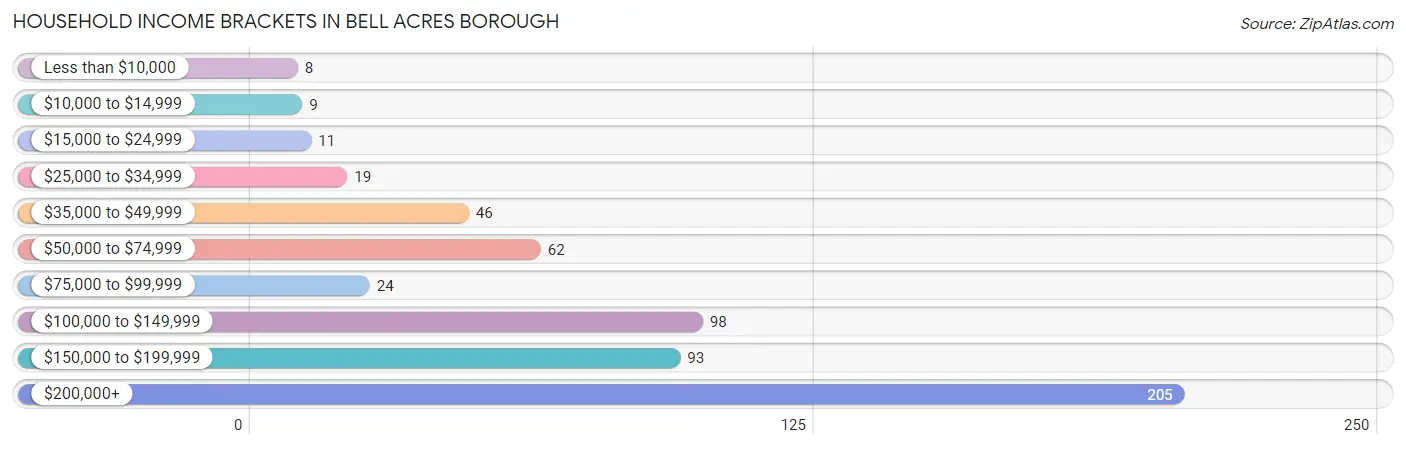
| Income Bracket | # Households | % Households |
| Less than $10,000 | 8 | 1.4% |
| $10,000 to $14,999 | 9 | 1.6% |
| $15,000 to $24,999 | 11 | 1.9% |
| $25,000 to $34,999 | 19 | 3.3% |
| $35,000 to $49,999 | 46 | 8.0% |
| $50,000 to $74,999 | 62 | 10.8% |
| $75,000 to $99,999 | 24 | 4.2% |
| $100,000 to $149,999 | 98 | 17.0% |
| $150,000 to $199,999 | 93 | 16.2% |
| $200,000+ | 205 | 35.7% |
Household Income by Householder Age in Bell Acres borough
The median household income in Bell Acres borough is $156,382, with the highest median household income of $188,750 found in the 45 to 64 years age bracket for the primary householder. A total of 274 households (47.6%) fall into this category. Meanwhile, the 15 to 24 years age bracket for the primary householder has the lowest median household income of $0, with 2 households (0.4%) in this group.
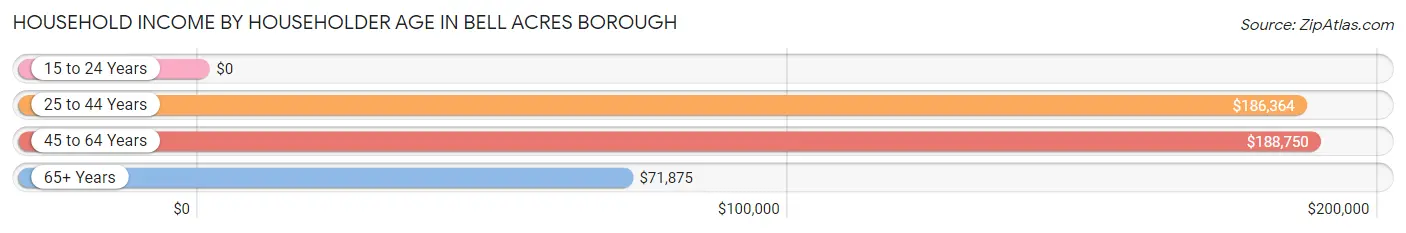
| Income Bracket | # Households | Median Income |
| 15 to 24 Years | 2 (0.4%) | $0 |
| 25 to 44 Years | 138 (24.0%) | $186,364 |
| 45 to 64 Years | 274 (47.6%) | $188,750 |
| 65+ Years | 161 (28.0%) | $71,875 |
| Total | 575 (100.0%) | $156,382 |
Poverty in Bell Acres borough
Income Below Poverty by Sex and Age in Bell Acres borough
With 3.7% poverty level for males and 9.6% for females among the residents of Bell Acres borough, 75 year old and over males and 6 to 11 year old females are the most vulnerable to poverty, with 7 males (15.2%) and 18 females (23.7%) in their respective age groups living below the poverty level.
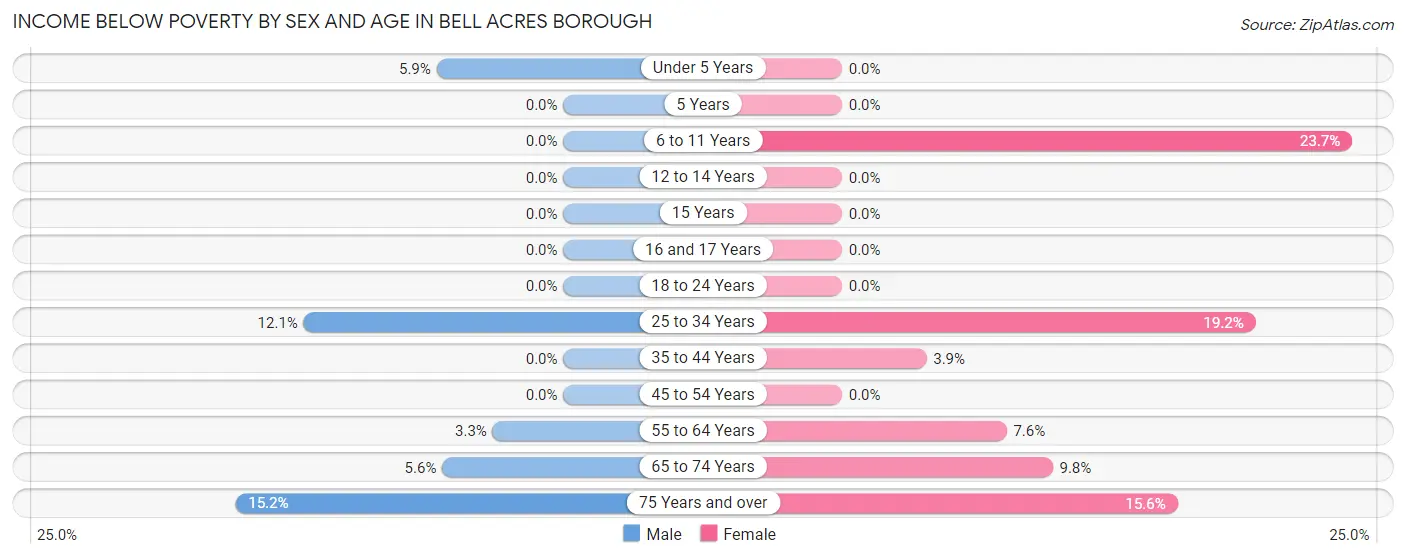
| Age Bracket | Male | Female |
| Under 5 Years | 4 (5.9%) | 0 (0.0%) |
| 5 Years | 0 (0.0%) | 0 (0.0%) |
| 6 to 11 Years | 0 (0.0%) | 18 (23.7%) |
| 12 to 14 Years | 0 (0.0%) | 0 (0.0%) |
| 15 Years | 0 (0.0%) | 0 (0.0%) |
| 16 and 17 Years | 0 (0.0%) | 0 (0.0%) |
| 18 to 24 Years | 0 (0.0%) | 0 (0.0%) |
| 25 to 34 Years | 10 (12.0%) | 24 (19.2%) |
| 35 to 44 Years | 0 (0.0%) | 4 (3.9%) |
| 45 to 54 Years | 0 (0.0%) | 0 (0.0%) |
| 55 to 64 Years | 4 (3.3%) | 11 (7.6%) |
| 65 to 74 Years | 5 (5.6%) | 9 (9.8%) |
| 75 Years and over | 7 (15.2%) | 12 (15.6%) |
| Total | 30 (3.7%) | 78 (9.6%) |
Income Above Poverty by Sex and Age in Bell Acres borough
According to the poverty statistics in Bell Acres borough, males aged 5 years and females aged under 5 years are the age groups that are most secure financially, with 100.0% of males and 100.0% of females in these age groups living above the poverty line.
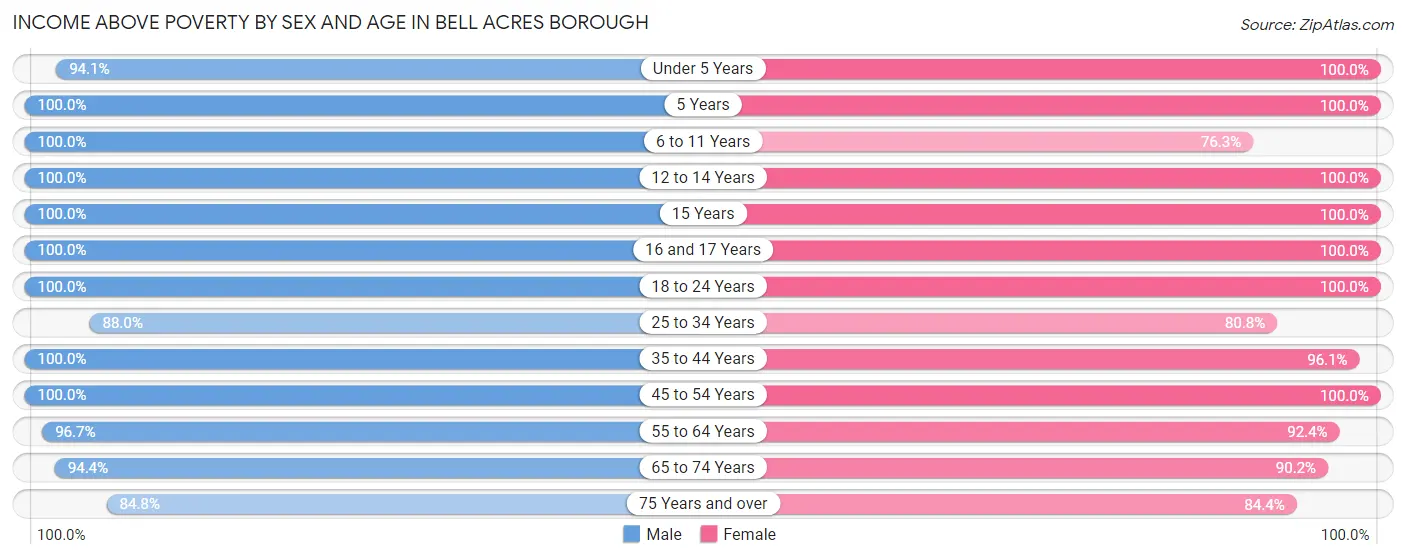
| Age Bracket | Male | Female |
| Under 5 Years | 64 (94.1%) | 15 (100.0%) |
| 5 Years | 6 (100.0%) | 13 (100.0%) |
| 6 to 11 Years | 55 (100.0%) | 58 (76.3%) |
| 12 to 14 Years | 55 (100.0%) | 18 (100.0%) |
| 15 Years | 9 (100.0%) | 14 (100.0%) |
| 16 and 17 Years | 23 (100.0%) | 20 (100.0%) |
| 18 to 24 Years | 23 (100.0%) | 23 (100.0%) |
| 25 to 34 Years | 73 (87.9%) | 101 (80.8%) |
| 35 to 44 Years | 95 (100.0%) | 98 (96.1%) |
| 45 to 54 Years | 130 (100.0%) | 92 (100.0%) |
| 55 to 64 Years | 118 (96.7%) | 133 (92.4%) |
| 65 to 74 Years | 84 (94.4%) | 83 (90.2%) |
| 75 Years and over | 39 (84.8%) | 65 (84.4%) |
| Total | 774 (96.3%) | 733 (90.4%) |
Income Below Poverty Among Married-Couple Families in Bell Acres borough
The poverty statistics for married-couple families in Bell Acres borough show that 3.4% or 12 of the total 356 families live below the poverty line. Families with 3 or 4 children have the highest poverty rate of 10.3%, comprising of 4 families. On the other hand, families with 1 or 2 children have the lowest poverty rate of 0.0%, which includes 0 families.
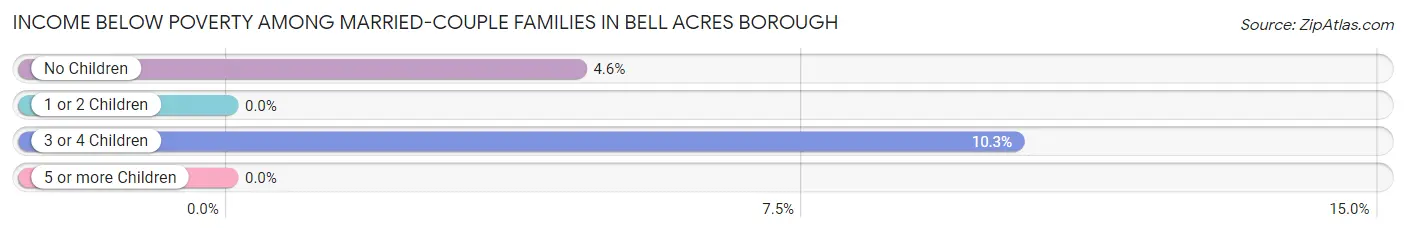
| Children | Above Poverty | Below Poverty |
| No Children | 168 (95.5%) | 8 (4.5%) |
| 1 or 2 Children | 141 (100.0%) | 0 (0.0%) |
| 3 or 4 Children | 35 (89.7%) | 4 (10.3%) |
| 5 or more Children | 0 (0.0%) | 0 (0.0%) |
| Total | 344 (96.6%) | 12 (3.4%) |
Income Below Poverty Among Single-Parent Households in Bell Acres borough
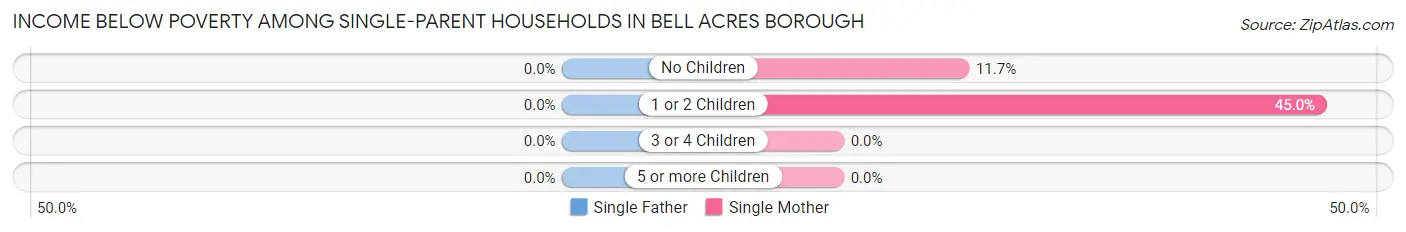
| Children | Single Father | Single Mother |
| No Children | 0 (0.0%) | 7 (11.7%) |
| 1 or 2 Children | 0 (0.0%) | 9 (45.0%) |
| 3 or 4 Children | 0 (0.0%) | 0 (0.0%) |
| 5 or more Children | 0 (0.0%) | 0 (0.0%) |
| Total | 0 (0.0%) | 16 (20.0%) |
Income Below Poverty Among Married-Couple vs Single-Parent Households in Bell Acres borough
The poverty data for Bell Acres borough shows that 12 of the married-couple family households (3.4%) and 16 of the single-parent households (14.8%) are living below the poverty level. Within the married-couple family households, those with 3 or 4 children have the highest poverty rate, with 4 households (10.3%) falling below the poverty line. Among the single-parent households, those with 1 or 2 children have the highest poverty rate, with 9 household (32.1%) living below poverty.
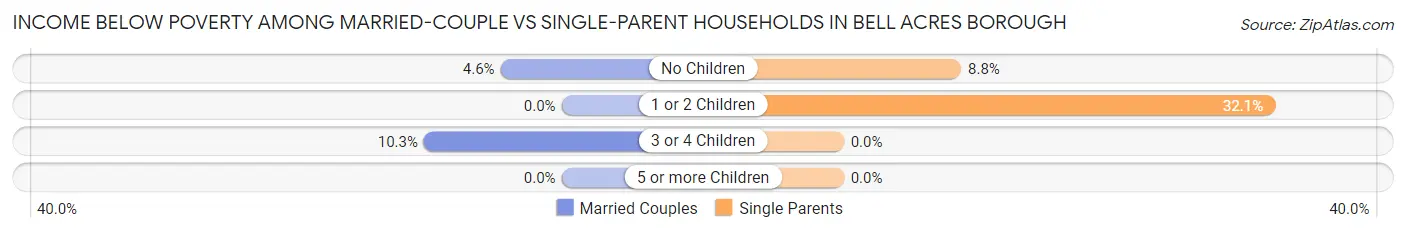
| Children | Married-Couple Families | Single-Parent Households |
| No Children | 8 (4.5%) | 7 (8.7%) |
| 1 or 2 Children | 0 (0.0%) | 9 (32.1%) |
| 3 or 4 Children | 4 (10.3%) | 0 (0.0%) |
| 5 or more Children | 0 (0.0%) | 0 (0.0%) |
| Total | 12 (3.4%) | 16 (14.8%) |
Employment Characteristics in Bell Acres borough
Employment by Class of Employer in Bell Acres borough
Among the 807 employed individuals in Bell Acres borough, private company employees (567 | 70.3%), self-employed (not incorporated) (70 | 8.7%), and not-for-profit organizations (63 | 7.8%) make up the most common classes of employment.
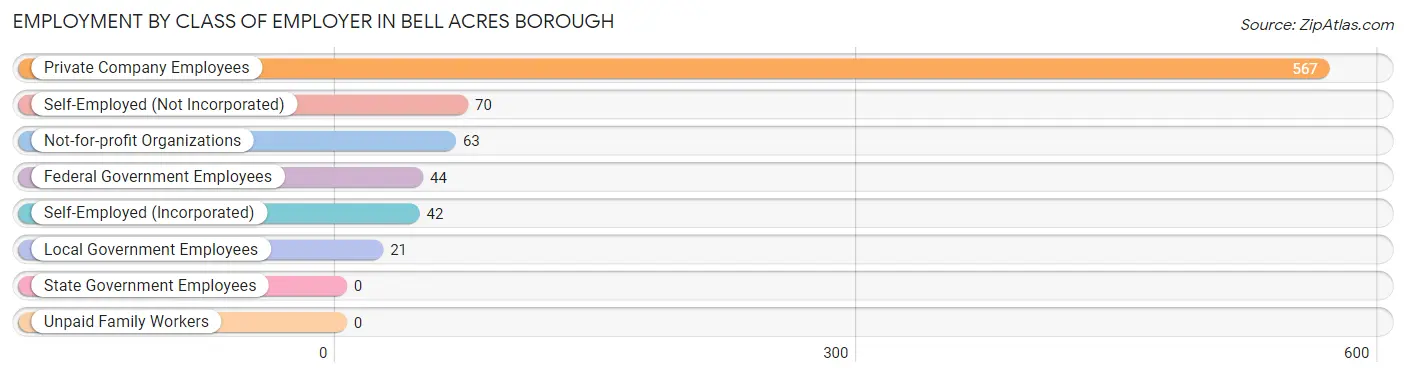
| Employer Class | # Employees | % Employees |
| Private Company Employees | 567 | 70.3% |
| Self-Employed (Incorporated) | 42 | 5.2% |
| Self-Employed (Not Incorporated) | 70 | 8.7% |
| Not-for-profit Organizations | 63 | 7.8% |
| Local Government Employees | 21 | 2.6% |
| State Government Employees | 0 | 0.0% |
| Federal Government Employees | 44 | 5.4% |
| Unpaid Family Workers | 0 | 0.0% |
| Total | 807 | 100.0% |
Employment Status by Age in Bell Acres borough
According to the labor force statistics for Bell Acres borough, out of the total population over 16 years of age (1,286), 66.6% or 856 individuals are in the labor force, with 2.6% or 22 of them unemployed. The age group with the highest labor force participation rate is 25 to 29 years, with 93.1% or 81 individuals in the labor force. Within the labor force, the 35 to 44 years age range has the highest percentage of unemployed individuals, with 8.2% or 14 of them being unemployed.
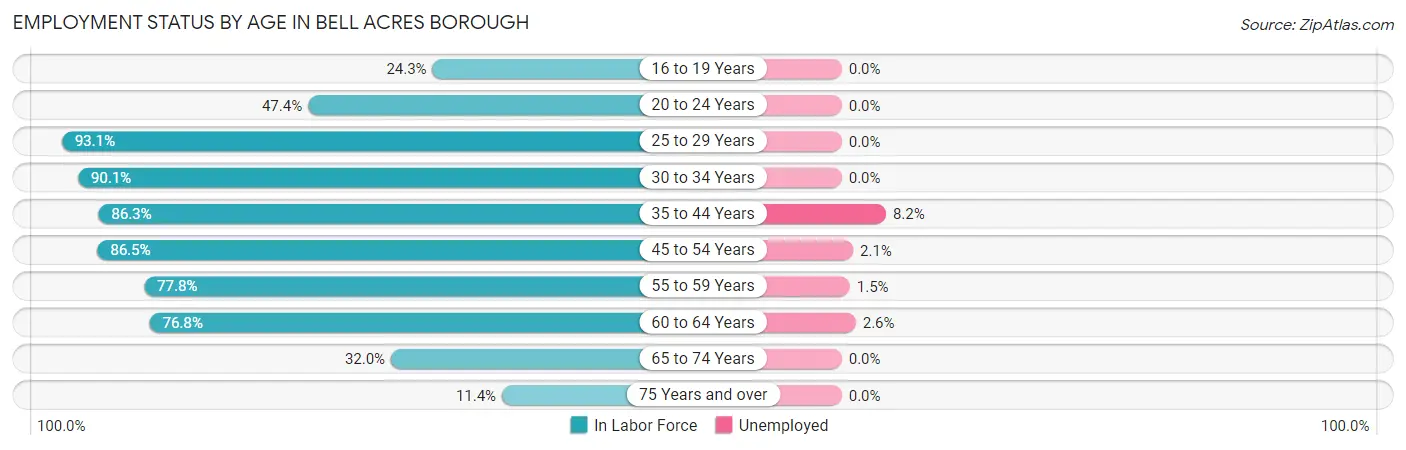
| Age Bracket | In Labor Force | Unemployed |
| 16 to 19 Years | 17 (24.3%) | 0 (0.0%) |
| 20 to 24 Years | 9 (47.4%) | 0 (0.0%) |
| 25 to 29 Years | 81 (93.1%) | 0 (0.0%) |
| 30 to 34 Years | 109 (90.1%) | 0 (0.0%) |
| 35 to 44 Years | 170 (86.3%) | 14 (8.2%) |
| 45 to 54 Years | 192 (86.5%) | 4 (2.1%) |
| 55 to 59 Years | 130 (77.8%) | 2 (1.5%) |
| 60 to 64 Years | 76 (76.8%) | 2 (2.6%) |
| 65 to 74 Years | 58 (32.0%) | 0 (0.0%) |
| 75 Years and over | 14 (11.4%) | 0 (0.0%) |
| Total | 856 (66.6%) | 22 (2.6%) |
Employment Status by Educational Attainment in Bell Acres borough
According to labor force statistics for Bell Acres borough, 84.9% of individuals (758) out of the total population between 25 and 64 years of age (893) are in the labor force, with 2.9% or 22 of them being unemployed. The group with the highest labor force participation rate are those with the educational attainment of less than high school, with 100.0% or 7 individuals in the labor force. Within the labor force, individuals with college / associate degree education have the highest percentage of unemployment, with 6.8% or 10 of them being unemployed.
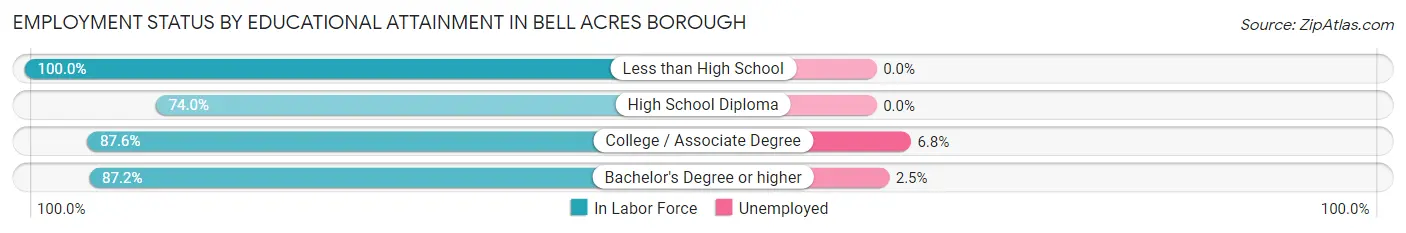
| Educational Attainment | In Labor Force | Unemployed |
| Less than High School | 7 (100.0%) | 0 (0.0%) |
| High School Diploma | 125 (74.0%) | 0 (0.0%) |
| College / Associate Degree | 148 (87.6%) | 11 (6.8%) |
| Bachelor's Degree or higher | 478 (87.2%) | 14 (2.5%) |
| Total | 758 (84.9%) | 26 (2.9%) |
Employment Occupations by Sex in Bell Acres borough
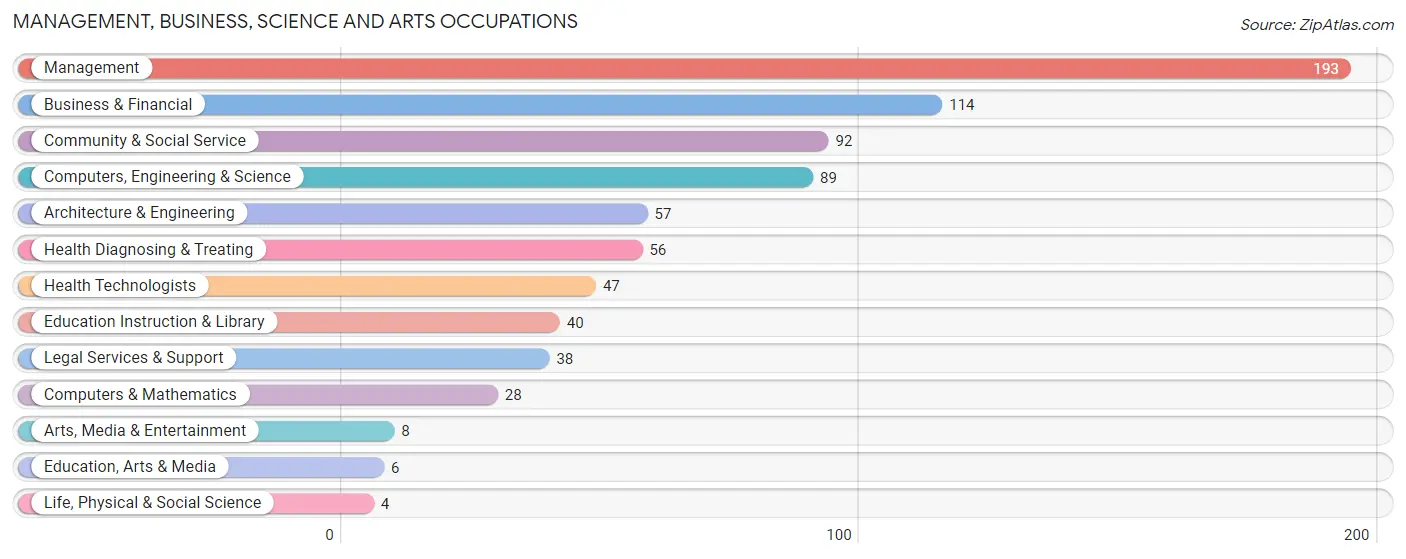
Management, Business, Science and Arts Occupations
The most common Management, Business, Science and Arts occupations in Bell Acres borough are Management (193 | 23.1%), Business & Financial (114 | 13.7%), Community & Social Service (92 | 11.0%), Computers, Engineering & Science (89 | 10.7%), and Architecture & Engineering (57 | 6.8%).
Management, Business, Science and Arts Occupations by Sex
Within the Management, Business, Science and Arts occupations in Bell Acres borough, the most male-oriented occupations are Life, Physical & Social Science (100.0%), Arts, Media & Entertainment (75.0%), and Management (73.1%), while the most female-oriented occupations are Education Instruction & Library (100.0%), Community & Social Service (69.6%), and Business & Financial (66.7%).
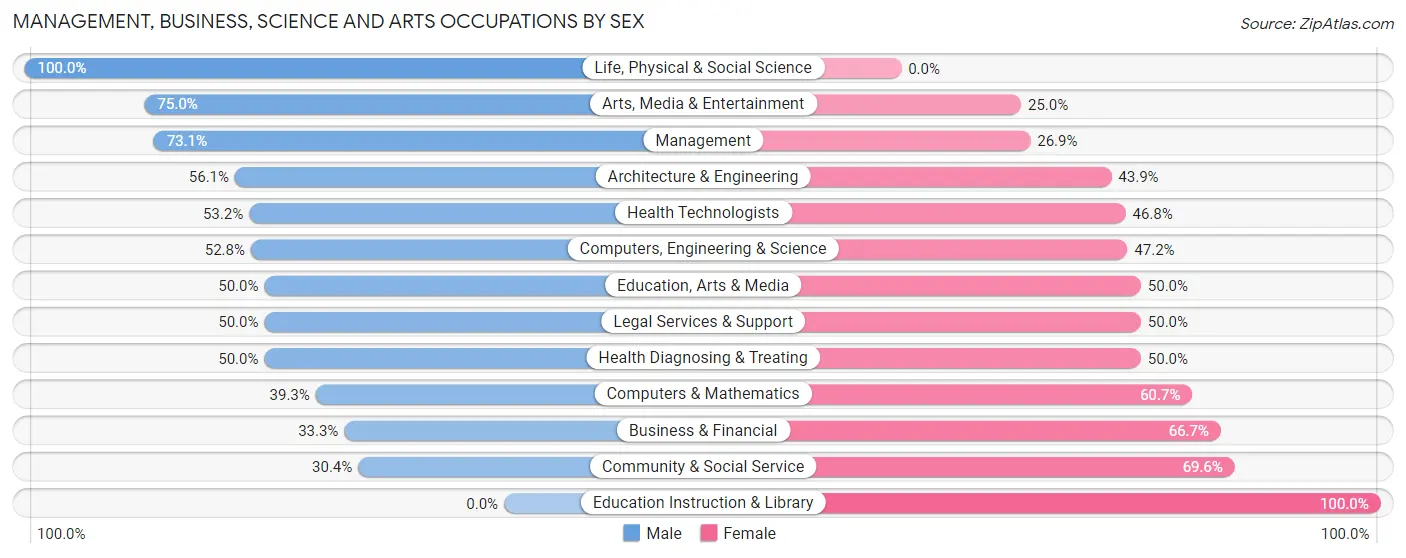
| Occupation | Male | Female |
| Management | 141 (73.1%) | 52 (26.9%) |
| Business & Financial | 38 (33.3%) | 76 (66.7%) |
| Computers, Engineering & Science | 47 (52.8%) | 42 (47.2%) |
| Computers & Mathematics | 11 (39.3%) | 17 (60.7%) |
| Architecture & Engineering | 32 (56.1%) | 25 (43.9%) |
| Life, Physical & Social Science | 4 (100.0%) | 0 (0.0%) |
| Community & Social Service | 28 (30.4%) | 64 (69.6%) |
| Education, Arts & Media | 3 (50.0%) | 3 (50.0%) |
| Legal Services & Support | 19 (50.0%) | 19 (50.0%) |
| Education Instruction & Library | 0 (0.0%) | 40 (100.0%) |
| Arts, Media & Entertainment | 6 (75.0%) | 2 (25.0%) |
| Health Diagnosing & Treating | 28 (50.0%) | 28 (50.0%) |
| Health Technologists | 25 (53.2%) | 22 (46.8%) |
| Total (Category) | 282 (51.8%) | 262 (48.2%) |
| Total (Overall) | 441 (52.9%) | 393 (47.1%) |
Services Occupations
The most common Services occupations in Bell Acres borough are Food Preparation & Serving (26 | 3.1%), Cleaning & Maintenance (8 | 1.0%), Personal Care & Service (7 | 0.8%), Security & Protection (6 | 0.7%), and Firefighting & Prevention (6 | 0.7%).

Services Occupations by Sex
Within the Services occupations in Bell Acres borough, the most male-oriented occupations are Security & Protection (66.7%), Firefighting & Prevention (66.7%), and Food Preparation & Serving (30.8%), while the most female-oriented occupations are Personal Care & Service (100.0%), Cleaning & Maintenance (75.0%), and Food Preparation & Serving (69.2%).
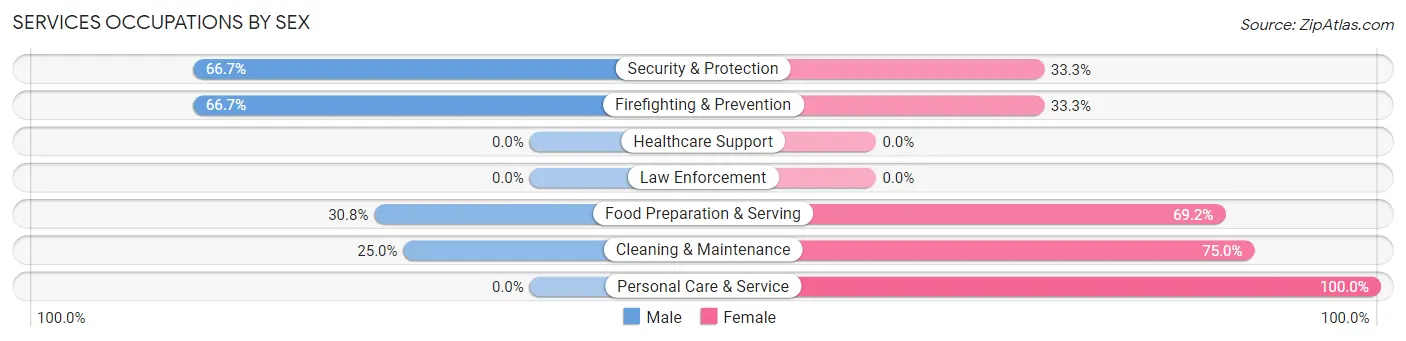
| Occupation | Male | Female |
| Healthcare Support | 0 (0.0%) | 0 (0.0%) |
| Security & Protection | 4 (66.7%) | 2 (33.3%) |
| Firefighting & Prevention | 4 (66.7%) | 2 (33.3%) |
| Law Enforcement | 0 (0.0%) | 0 (0.0%) |
| Food Preparation & Serving | 8 (30.8%) | 18 (69.2%) |
| Cleaning & Maintenance | 2 (25.0%) | 6 (75.0%) |
| Personal Care & Service | 0 (0.0%) | 7 (100.0%) |
| Total (Category) | 14 (29.8%) | 33 (70.2%) |
| Total (Overall) | 441 (52.9%) | 393 (47.1%) |
Sales and Office Occupations
The most common Sales and Office occupations in Bell Acres borough are Sales & Related (69 | 8.3%), and Office & Administration (68 | 8.2%).
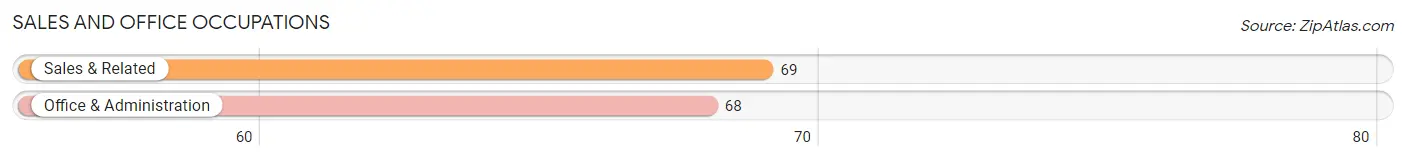
Sales and Office Occupations by Sex

| Occupation | Male | Female |
| Sales & Related | 35 (50.7%) | 34 (49.3%) |
| Office & Administration | 6 (8.8%) | 62 (91.2%) |
| Total (Category) | 41 (29.9%) | 96 (70.1%) |
| Total (Overall) | 441 (52.9%) | 393 (47.1%) |
Natural Resources, Construction and Maintenance Occupations
The most common Natural Resources, Construction and Maintenance occupations in Bell Acres borough are Construction & Extraction (20 | 2.4%), Installation, Maintenance & Repair (12 | 1.4%), and Farming, Fishing & Forestry (3 | 0.4%).
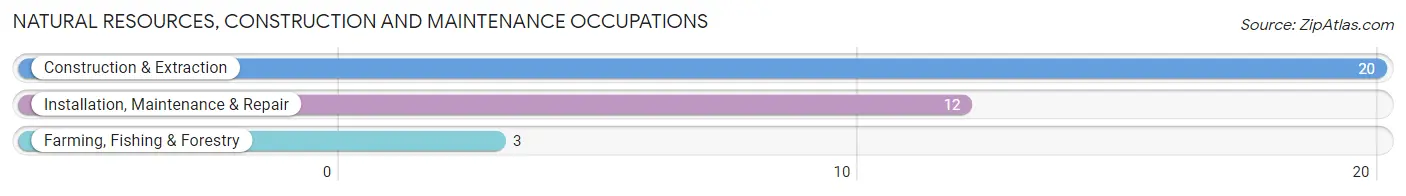
Natural Resources, Construction and Maintenance Occupations by Sex

| Occupation | Male | Female |
| Farming, Fishing & Forestry | 3 (100.0%) | 0 (0.0%) |
| Construction & Extraction | 20 (100.0%) | 0 (0.0%) |
| Installation, Maintenance & Repair | 10 (83.3%) | 2 (16.7%) |
| Total (Category) | 33 (94.3%) | 2 (5.7%) |
| Total (Overall) | 441 (52.9%) | 393 (47.1%) |
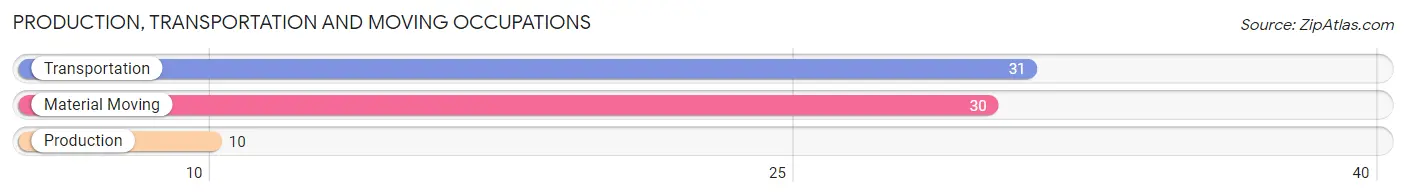
Production, Transportation and Moving Occupations
The most common Production, Transportation and Moving occupations in Bell Acres borough are Transportation (31 | 3.7%), Material Moving (30 | 3.6%), and Production (10 | 1.2%).
Production, Transportation and Moving Occupations by Sex
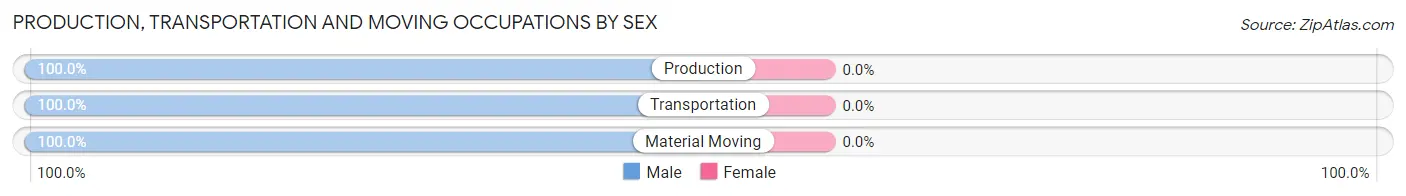
| Occupation | Male | Female |
| Production | 10 (100.0%) | 0 (0.0%) |
| Transportation | 31 (100.0%) | 0 (0.0%) |
| Material Moving | 30 (100.0%) | 0 (0.0%) |
| Total (Category) | 71 (100.0%) | 0 (0.0%) |
| Total (Overall) | 441 (52.9%) | 393 (47.1%) |
Employment Industries by Sex in Bell Acres borough
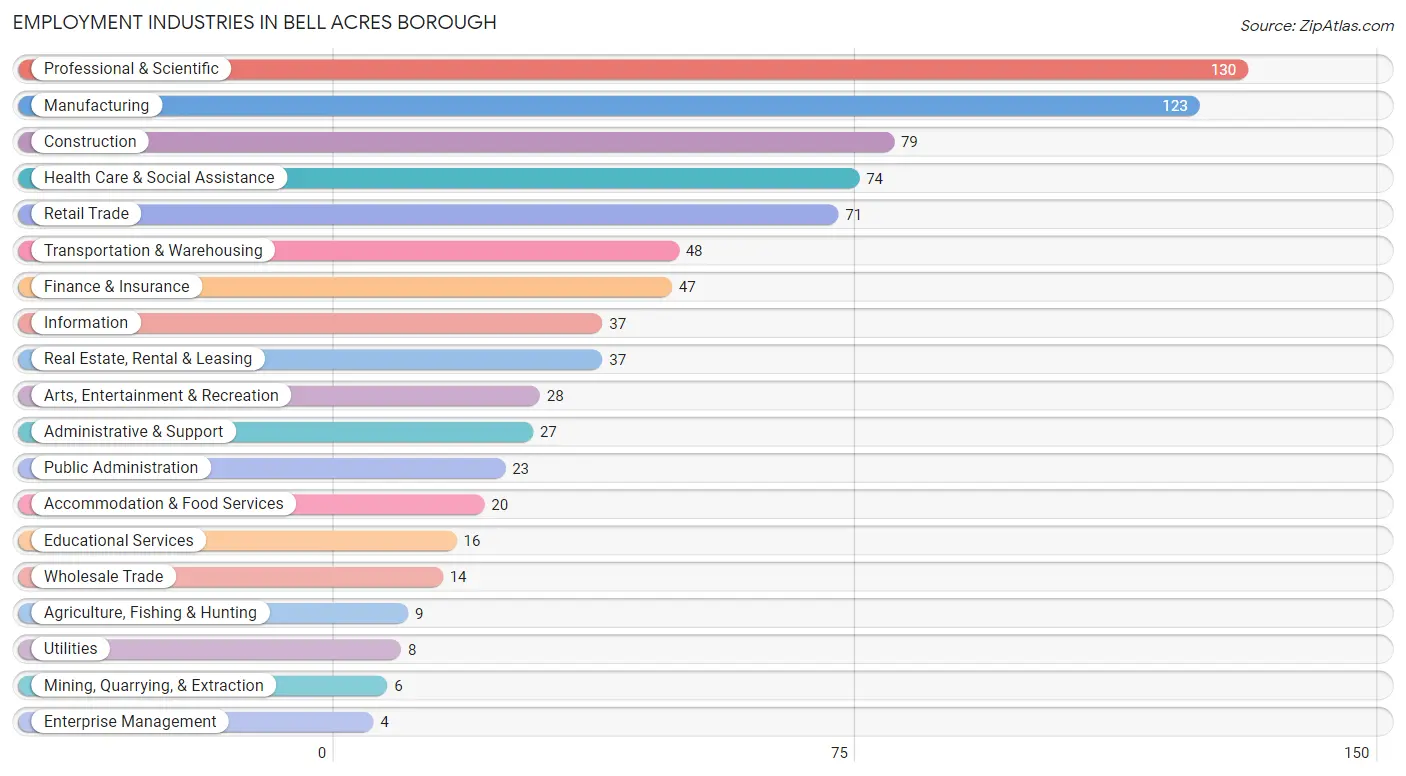
Employment Industries in Bell Acres borough
The major employment industries in Bell Acres borough include Professional & Scientific (130 | 15.6%), Manufacturing (123 | 14.7%), Construction (79 | 9.5%), Health Care & Social Assistance (74 | 8.9%), and Retail Trade (71 | 8.5%).
Employment Industries by Sex in Bell Acres borough
The Bell Acres borough industries that see more men than women are Agriculture, Fishing & Hunting (100.0%), Mining, Quarrying, & Extraction (100.0%), and Utilities (100.0%), whereas the industries that tend to have a higher number of women are Enterprise Management (100.0%), Educational Services (100.0%), and Accommodation & Food Services (100.0%).
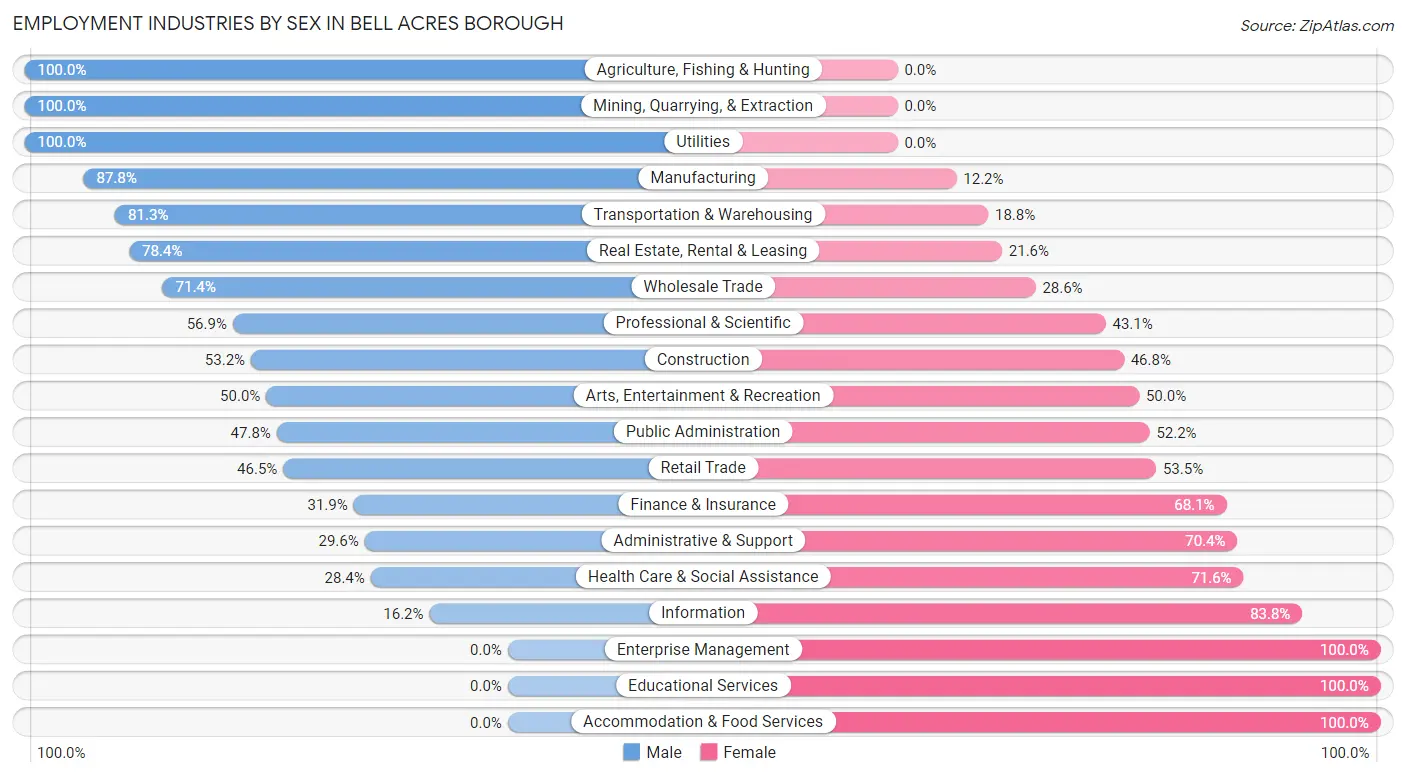
| Industry | Male | Female |
| Agriculture, Fishing & Hunting | 9 (100.0%) | 0 (0.0%) |
| Mining, Quarrying, & Extraction | 6 (100.0%) | 0 (0.0%) |
| Construction | 42 (53.2%) | 37 (46.8%) |
| Manufacturing | 108 (87.8%) | 15 (12.2%) |
| Wholesale Trade | 10 (71.4%) | 4 (28.6%) |
| Retail Trade | 33 (46.5%) | 38 (53.5%) |
| Transportation & Warehousing | 39 (81.2%) | 9 (18.8%) |
| Utilities | 8 (100.0%) | 0 (0.0%) |
| Information | 6 (16.2%) | 31 (83.8%) |
| Finance & Insurance | 15 (31.9%) | 32 (68.1%) |
| Real Estate, Rental & Leasing | 29 (78.4%) | 8 (21.6%) |
| Professional & Scientific | 74 (56.9%) | 56 (43.1%) |
| Enterprise Management | 0 (0.0%) | 4 (100.0%) |
| Administrative & Support | 8 (29.6%) | 19 (70.4%) |
| Educational Services | 0 (0.0%) | 16 (100.0%) |
| Health Care & Social Assistance | 21 (28.4%) | 53 (71.6%) |
| Arts, Entertainment & Recreation | 14 (50.0%) | 14 (50.0%) |
| Accommodation & Food Services | 0 (0.0%) | 20 (100.0%) |
| Public Administration | 11 (47.8%) | 12 (52.2%) |
| Total | 441 (52.9%) | 393 (47.1%) |
Education in Bell Acres borough
School Enrollment in Bell Acres borough
The most common levels of schooling among the 338 students in Bell Acres borough are elementary school (105 | 31.1%), middle school (95 | 28.1%), and high school (90 | 26.6%).
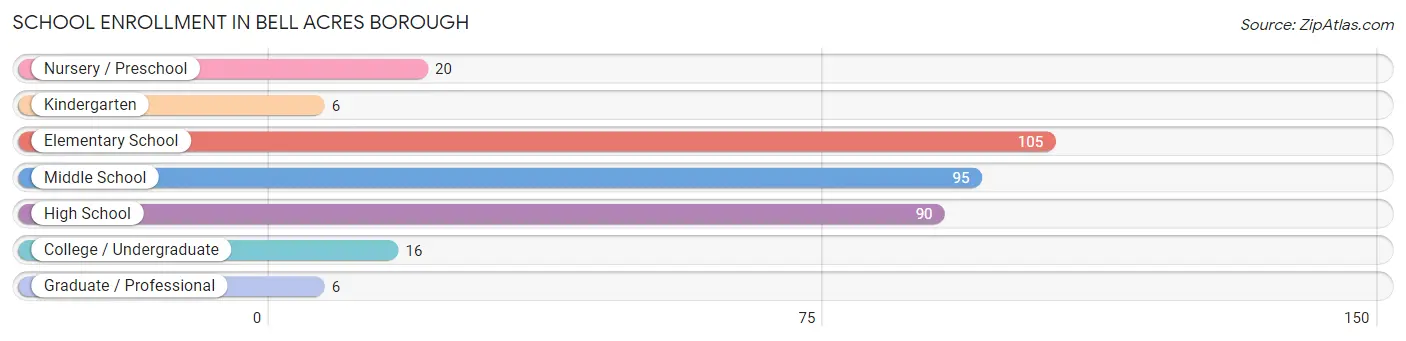
| School Level | # Students | % Students |
| Nursery / Preschool | 20 | 5.9% |
| Kindergarten | 6 | 1.8% |
| Elementary School | 105 | 31.1% |
| Middle School | 95 | 28.1% |
| High School | 90 | 26.6% |
| College / Undergraduate | 16 | 4.7% |
| Graduate / Professional | 6 | 1.8% |
| Total | 338 | 100.0% |
School Enrollment by Age by Funding Source in Bell Acres borough
Out of a total of 338 students who are enrolled in schools in Bell Acres borough, 99 (29.3%) attend a private institution, while the remaining 239 (70.7%) are enrolled in public schools. The age group of 3 to 4 year olds has the highest likelihood of being enrolled in private schools, with 9 (100.0% in the age bracket) enrolled. Conversely, the age group of 5 to 9 year old has the lowest likelihood of being enrolled in a private school, with 86 (91.5% in the age bracket) attending a public institution.
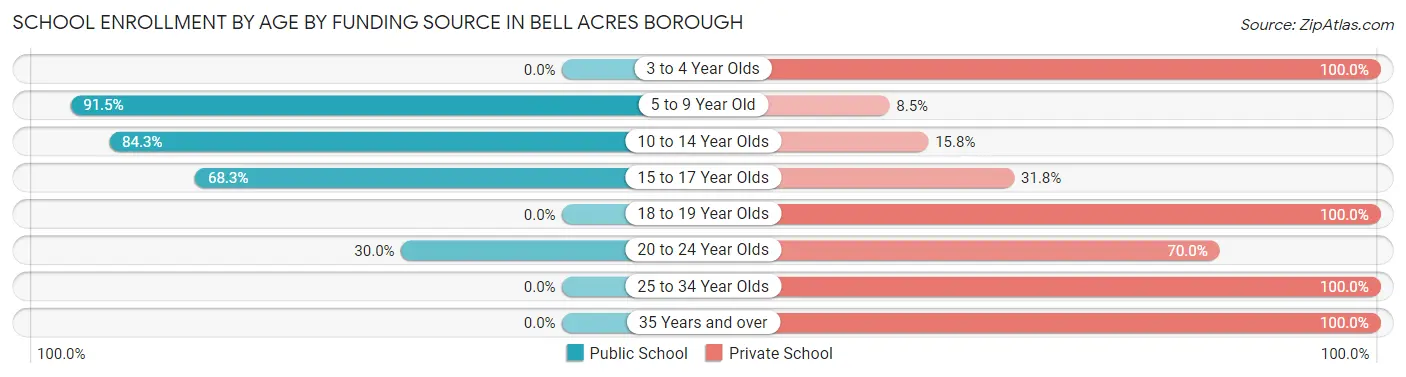
| Age Bracket | Public School | Private School |
| 3 to 4 Year Olds | 0 (0.0%) | 9 (100.0%) |
| 5 to 9 Year Old | 86 (91.5%) | 8 (8.5%) |
| 10 to 14 Year Olds | 107 (84.3%) | 20 (15.8%) |
| 15 to 17 Year Olds | 43 (68.2%) | 20 (31.8%) |
| 18 to 19 Year Olds | 0 (0.0%) | 25 (100.0%) |
| 20 to 24 Year Olds | 3 (30.0%) | 7 (70.0%) |
| 25 to 34 Year Olds | 0 (0.0%) | 6 (100.0%) |
| 35 Years and over | 0 (0.0%) | 4 (100.0%) |
| Total | 239 (70.7%) | 99 (29.3%) |
Educational Attainment by Field of Study in Bell Acres borough
Business (178 | 23.6%), engineering (123 | 16.3%), education (62 | 8.2%), liberal arts & history (52 | 6.9%), and visual & performing arts (52 | 6.9%) are the most common fields of study among 754 individuals in Bell Acres borough who have obtained a bachelor's degree or higher.
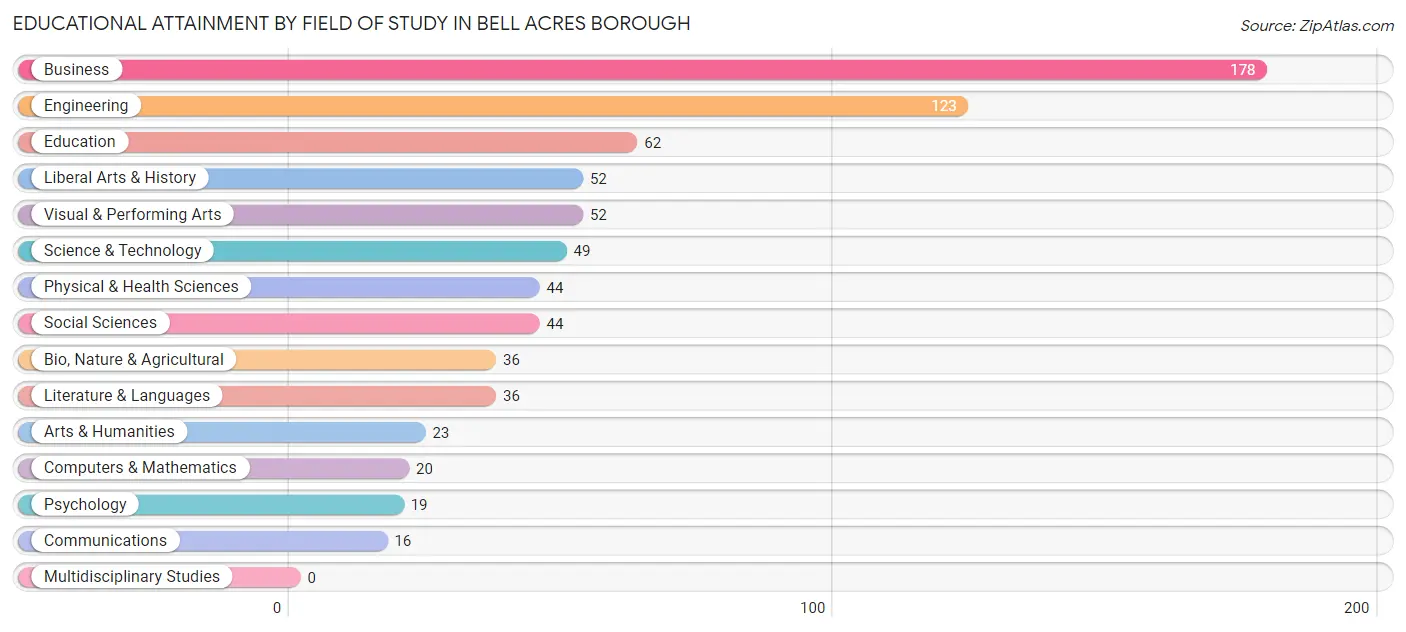
| Field of Study | # Graduates | % Graduates |
| Computers & Mathematics | 20 | 2.6% |
| Bio, Nature & Agricultural | 36 | 4.8% |
| Physical & Health Sciences | 44 | 5.8% |
| Psychology | 19 | 2.5% |
| Social Sciences | 44 | 5.8% |
| Engineering | 123 | 16.3% |
| Multidisciplinary Studies | 0 | 0.0% |
| Science & Technology | 49 | 6.5% |
| Business | 178 | 23.6% |
| Education | 62 | 8.2% |
| Literature & Languages | 36 | 4.8% |
| Liberal Arts & History | 52 | 6.9% |
| Visual & Performing Arts | 52 | 6.9% |
| Communications | 16 | 2.1% |
| Arts & Humanities | 23 | 3.0% |
| Total | 754 | 100.0% |
Transportation & Commute in Bell Acres borough
Vehicle Availability by Sex in Bell Acres borough
The most prevalent vehicle ownership categories in Bell Acres borough are males with 2 vehicles (187, accounting for 43.7%) and females with 2 vehicles (156, making up 49.3%).
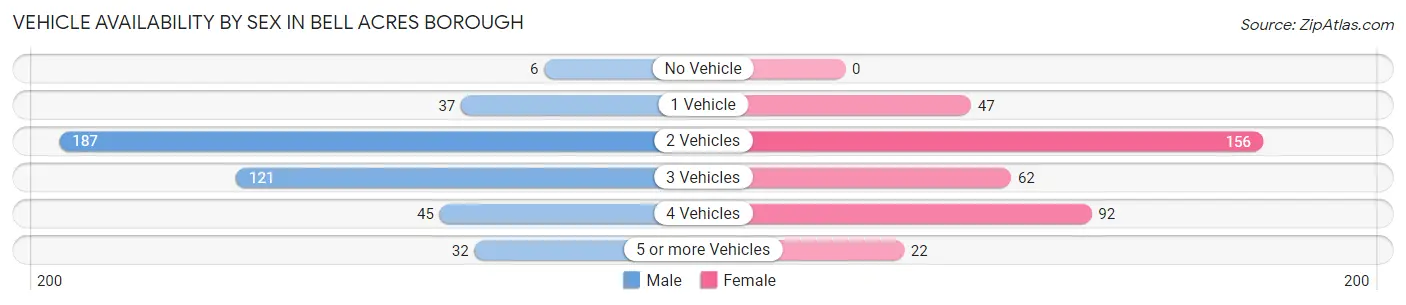
| Vehicles Available | Male | Female |
| No Vehicle | 6 (1.4%) | 0 (0.0%) |
| 1 Vehicle | 37 (8.6%) | 47 (12.4%) |
| 2 Vehicles | 187 (43.7%) | 156 (41.2%) |
| 3 Vehicles | 121 (28.3%) | 62 (16.4%) |
| 4 Vehicles | 45 (10.5%) | 92 (24.3%) |
| 5 or more Vehicles | 32 (7.5%) | 22 (5.8%) |
| Total | 428 (100.0%) | 379 (100.0%) |
Commute Time in Bell Acres borough
The most frequently occuring commute durations in Bell Acres borough are 20 to 24 minutes (116 commuters, 18.4%), 15 to 19 minutes (72 commuters, 11.5%), and 45 to 59 minutes (71 commuters, 11.3%).
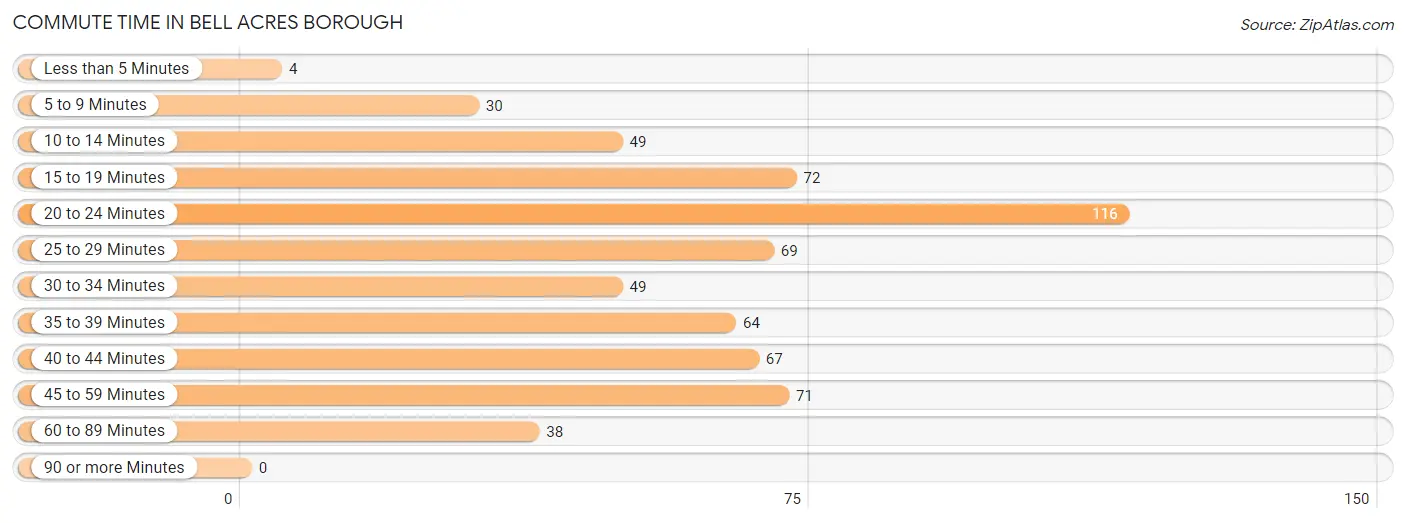
| Commute Time | # Commuters | % Commuters |
| Less than 5 Minutes | 4 | 0.6% |
| 5 to 9 Minutes | 30 | 4.8% |
| 10 to 14 Minutes | 49 | 7.8% |
| 15 to 19 Minutes | 72 | 11.5% |
| 20 to 24 Minutes | 116 | 18.4% |
| 25 to 29 Minutes | 69 | 11.0% |
| 30 to 34 Minutes | 49 | 7.8% |
| 35 to 39 Minutes | 64 | 10.2% |
| 40 to 44 Minutes | 67 | 10.6% |
| 45 to 59 Minutes | 71 | 11.3% |
| 60 to 89 Minutes | 38 | 6.0% |
| 90 or more Minutes | 0 | 0.0% |
Commute Time by Sex in Bell Acres borough
The most common commute times in Bell Acres borough are 25 to 29 minutes (54 commuters, 14.7%) for males and 20 to 24 minutes (67 commuters, 25.7%) for females.
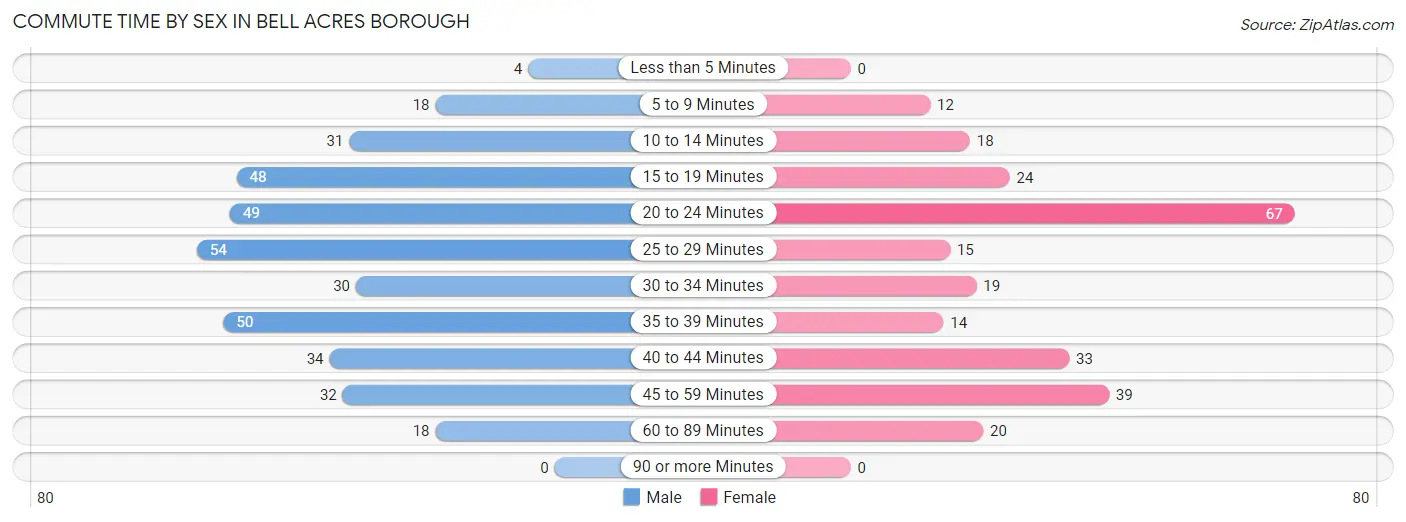
| Commute Time | Male | Female |
| Less than 5 Minutes | 4 (1.1%) | 0 (0.0%) |
| 5 to 9 Minutes | 18 (4.9%) | 12 (4.6%) |
| 10 to 14 Minutes | 31 (8.4%) | 18 (6.9%) |
| 15 to 19 Minutes | 48 (13.0%) | 24 (9.2%) |
| 20 to 24 Minutes | 49 (13.3%) | 67 (25.7%) |
| 25 to 29 Minutes | 54 (14.7%) | 15 (5.8%) |
| 30 to 34 Minutes | 30 (8.2%) | 19 (7.3%) |
| 35 to 39 Minutes | 50 (13.6%) | 14 (5.4%) |
| 40 to 44 Minutes | 34 (9.2%) | 33 (12.6%) |
| 45 to 59 Minutes | 32 (8.7%) | 39 (14.9%) |
| 60 to 89 Minutes | 18 (4.9%) | 20 (7.7%) |
| 90 or more Minutes | 0 (0.0%) | 0 (0.0%) |
Time of Departure to Work by Sex in Bell Acres borough
The most frequent times of departure to work in Bell Acres borough are 7:00 AM to 7:29 AM (130, 35.3%) for males and 7:00 AM to 7:29 AM (61, 23.4%) for females.
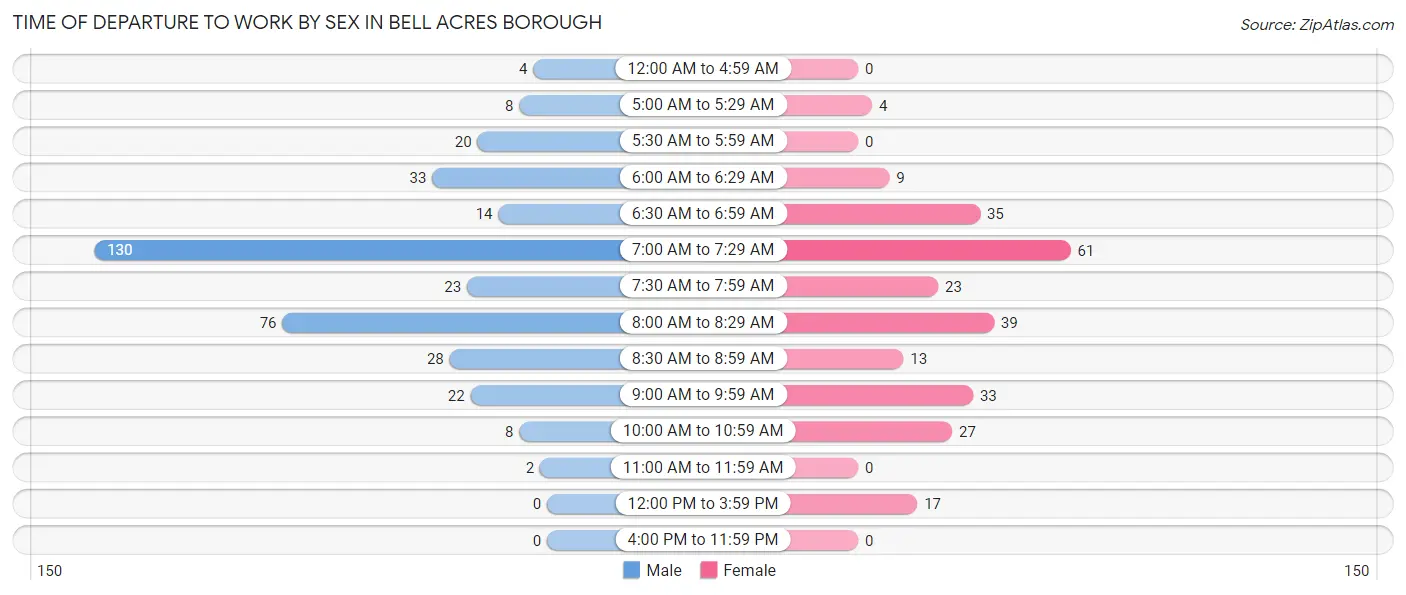
| Time of Departure | Male | Female |
| 12:00 AM to 4:59 AM | 4 (1.1%) | 0 (0.0%) |
| 5:00 AM to 5:29 AM | 8 (2.2%) | 4 (1.5%) |
| 5:30 AM to 5:59 AM | 20 (5.4%) | 0 (0.0%) |
| 6:00 AM to 6:29 AM | 33 (9.0%) | 9 (3.5%) |
| 6:30 AM to 6:59 AM | 14 (3.8%) | 35 (13.4%) |
| 7:00 AM to 7:29 AM | 130 (35.3%) | 61 (23.4%) |
| 7:30 AM to 7:59 AM | 23 (6.2%) | 23 (8.8%) |
| 8:00 AM to 8:29 AM | 76 (20.6%) | 39 (14.9%) |
| 8:30 AM to 8:59 AM | 28 (7.6%) | 13 (5.0%) |
| 9:00 AM to 9:59 AM | 22 (6.0%) | 33 (12.6%) |
| 10:00 AM to 10:59 AM | 8 (2.2%) | 27 (10.3%) |
| 11:00 AM to 11:59 AM | 2 (0.5%) | 0 (0.0%) |
| 12:00 PM to 3:59 PM | 0 (0.0%) | 17 (6.5%) |
| 4:00 PM to 11:59 PM | 0 (0.0%) | 0 (0.0%) |
| Total | 368 (100.0%) | 261 (100.0%) |
Housing Occupancy in Bell Acres borough
Occupancy by Ownership in Bell Acres borough
Of the total 575 dwellings in Bell Acres borough, owner-occupied units account for 531 (92.3%), while renter-occupied units make up 44 (7.6%).
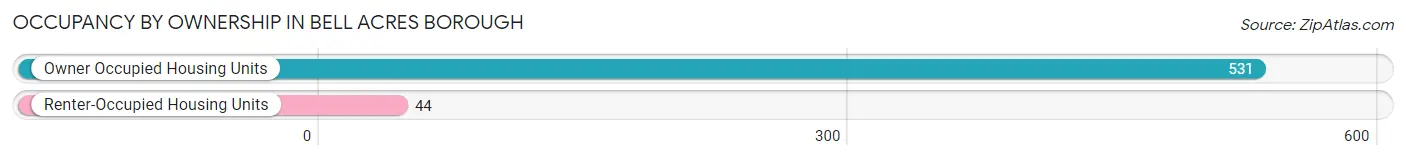
| Occupancy | # Housing Units | % Housing Units |
| Owner Occupied Housing Units | 531 | 92.3% |
| Renter-Occupied Housing Units | 44 | 7.6% |
| Total Occupied Housing Units | 575 | 100.0% |
Occupancy by Household Size in Bell Acres borough
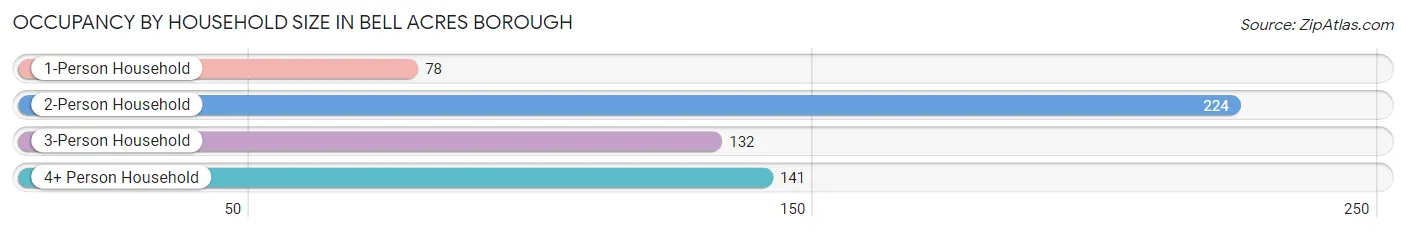
| Household Size | # Housing Units | % Housing Units |
| 1-Person Household | 78 | 13.6% |
| 2-Person Household | 224 | 39.0% |
| 3-Person Household | 132 | 23.0% |
| 4+ Person Household | 141 | 24.5% |
| Total Housing Units | 575 | 100.0% |
Occupancy by Ownership by Household Size in Bell Acres borough
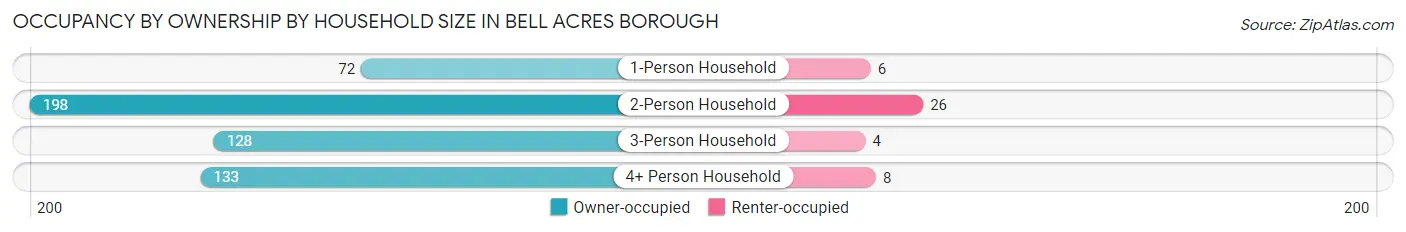
| Household Size | Owner-occupied | Renter-occupied |
| 1-Person Household | 72 (92.3%) | 6 (7.7%) |
| 2-Person Household | 198 (88.4%) | 26 (11.6%) |
| 3-Person Household | 128 (97.0%) | 4 (3.0%) |
| 4+ Person Household | 133 (94.3%) | 8 (5.7%) |
| Total Housing Units | 531 (92.3%) | 44 (7.6%) |
Occupancy by Educational Attainment in Bell Acres borough
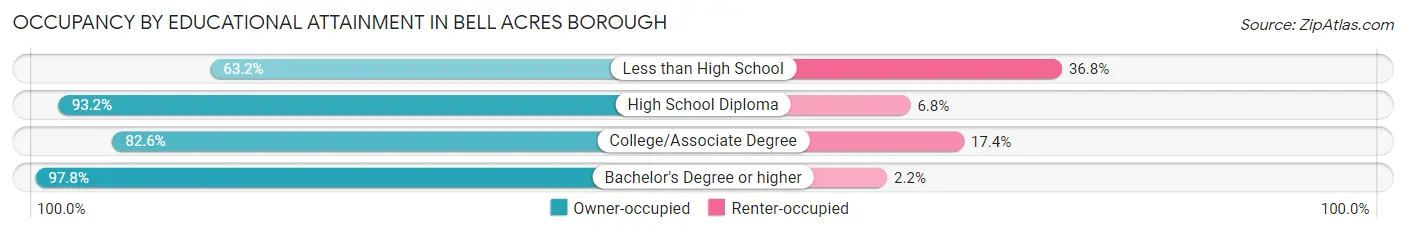
| Household Size | Owner-occupied | Renter-occupied |
| Less than High School | 12 (63.2%) | 7 (36.8%) |
| High School Diploma | 96 (93.2%) | 7 (6.8%) |
| College/Associate Degree | 109 (82.6%) | 23 (17.4%) |
| Bachelor's Degree or higher | 314 (97.8%) | 7 (2.2%) |
Occupancy by Age of Householder in Bell Acres borough
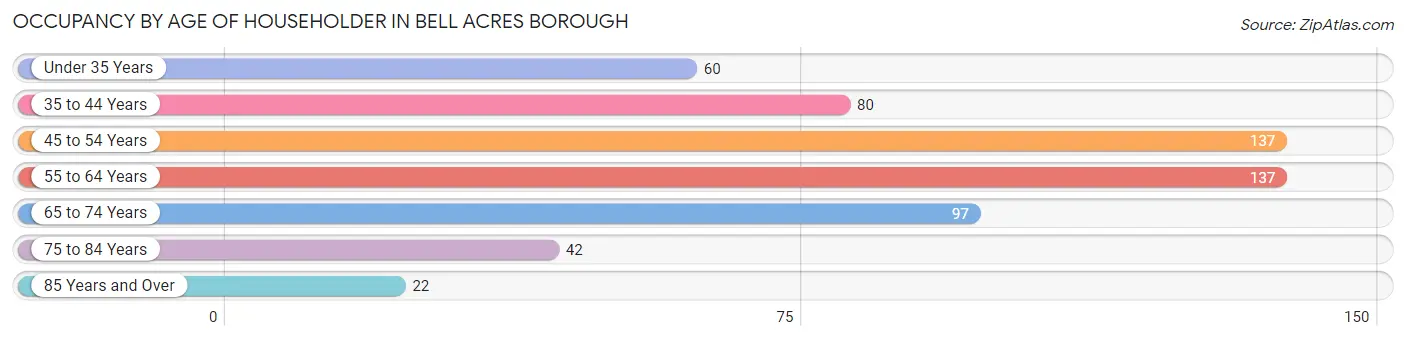
| Age Bracket | # Households | % Households |
| Under 35 Years | 60 | 10.4% |
| 35 to 44 Years | 80 | 13.9% |
| 45 to 54 Years | 137 | 23.8% |
| 55 to 64 Years | 137 | 23.8% |
| 65 to 74 Years | 97 | 16.9% |
| 75 to 84 Years | 42 | 7.3% |
| 85 Years and Over | 22 | 3.8% |
| Total | 575 | 100.0% |
Housing Finances in Bell Acres borough
Median Income by Occupancy in Bell Acres borough
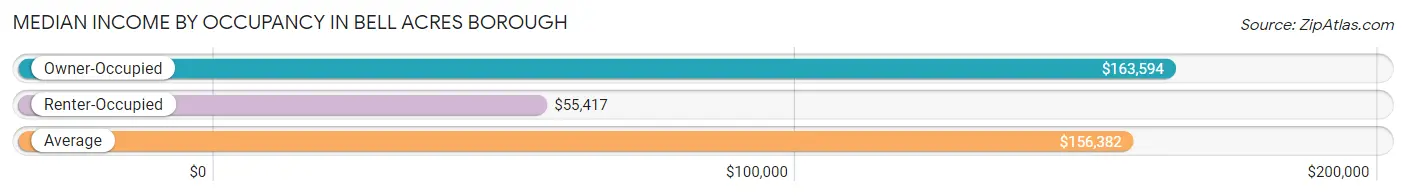
| Occupancy Type | # Households | Median Income |
| Owner-Occupied | 531 (92.3%) | $163,594 |
| Renter-Occupied | 44 (7.6%) | $55,417 |
| Average | 575 (100.0%) | $156,382 |
Occupancy by Householder Income Bracket in Bell Acres borough
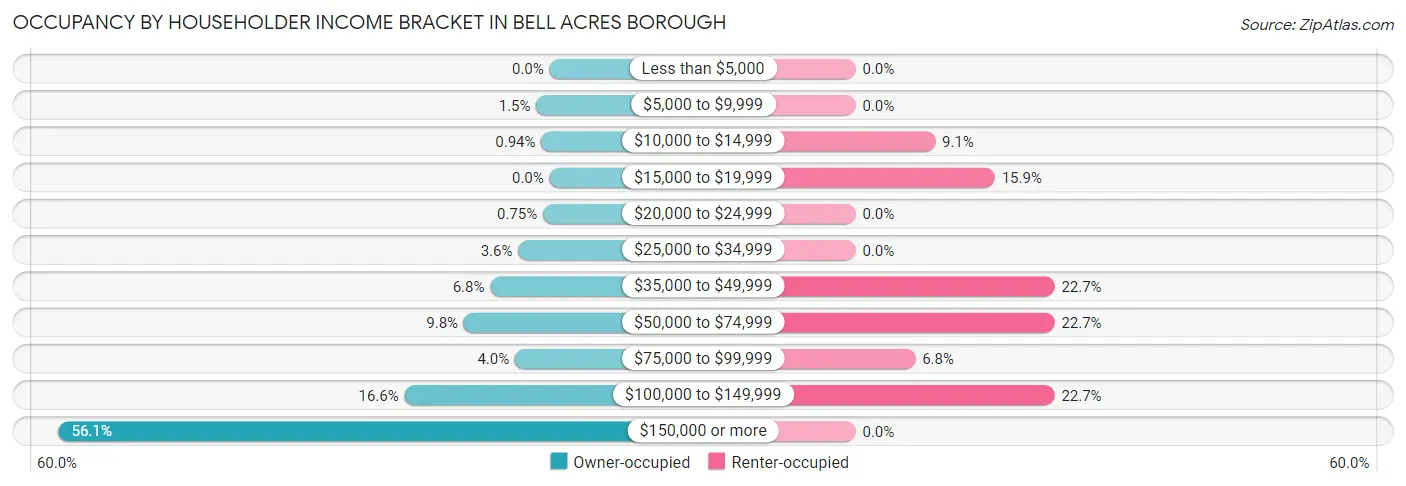
| Income Bracket | Owner-occupied | Renter-occupied |
| Less than $5,000 | 0 (0.0%) | 0 (0.0%) |
| $5,000 to $9,999 | 8 (1.5%) | 0 (0.0%) |
| $10,000 to $14,999 | 5 (0.9%) | 4 (9.1%) |
| $15,000 to $19,999 | 0 (0.0%) | 7 (15.9%) |
| $20,000 to $24,999 | 4 (0.7%) | 0 (0.0%) |
| $25,000 to $34,999 | 19 (3.6%) | 0 (0.0%) |
| $35,000 to $49,999 | 36 (6.8%) | 10 (22.7%) |
| $50,000 to $74,999 | 52 (9.8%) | 10 (22.7%) |
| $75,000 to $99,999 | 21 (4.0%) | 3 (6.8%) |
| $100,000 to $149,999 | 88 (16.6%) | 10 (22.7%) |
| $150,000 or more | 298 (56.1%) | 0 (0.0%) |
| Total | 531 (100.0%) | 44 (100.0%) |
Monthly Housing Cost Tiers in Bell Acres borough
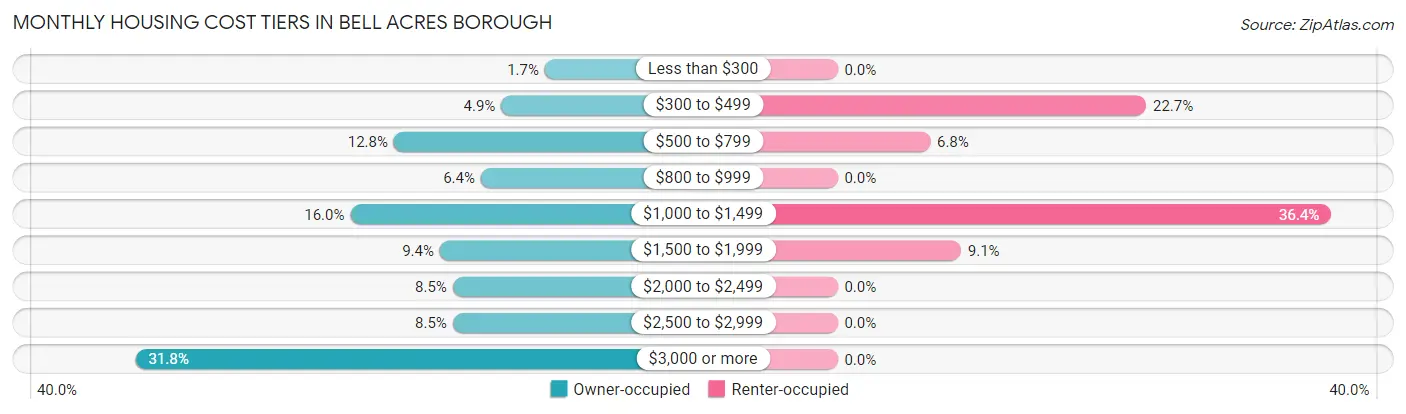
| Monthly Cost | Owner-occupied | Renter-occupied |
| Less than $300 | 9 (1.7%) | 0 (0.0%) |
| $300 to $499 | 26 (4.9%) | 10 (22.7%) |
| $500 to $799 | 68 (12.8%) | 3 (6.8%) |
| $800 to $999 | 34 (6.4%) | 0 (0.0%) |
| $1,000 to $1,499 | 85 (16.0%) | 16 (36.4%) |
| $1,500 to $1,999 | 50 (9.4%) | 4 (9.1%) |
| $2,000 to $2,499 | 45 (8.5%) | 0 (0.0%) |
| $2,500 to $2,999 | 45 (8.5%) | 0 (0.0%) |
| $3,000 or more | 169 (31.8%) | 0 (0.0%) |
| Total | 531 (100.0%) | 44 (100.0%) |
Physical Housing Characteristics in Bell Acres borough
Housing Structures in Bell Acres borough
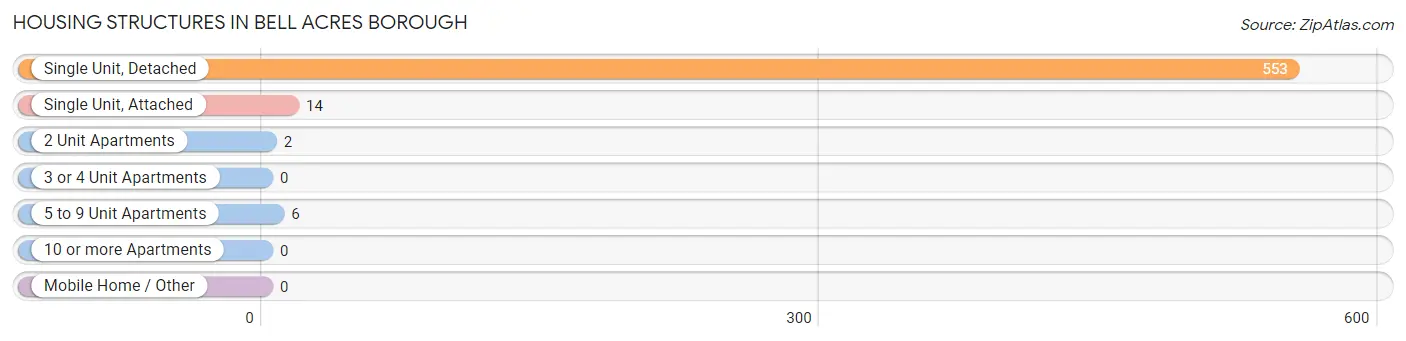
| Structure Type | # Housing Units | % Housing Units |
| Single Unit, Detached | 553 | 96.2% |
| Single Unit, Attached | 14 | 2.4% |
| 2 Unit Apartments | 2 | 0.4% |
| 3 or 4 Unit Apartments | 0 | 0.0% |
| 5 to 9 Unit Apartments | 6 | 1.0% |
| 10 or more Apartments | 0 | 0.0% |
| Mobile Home / Other | 0 | 0.0% |
| Total | 575 | 100.0% |
Housing Structures by Occupancy in Bell Acres borough
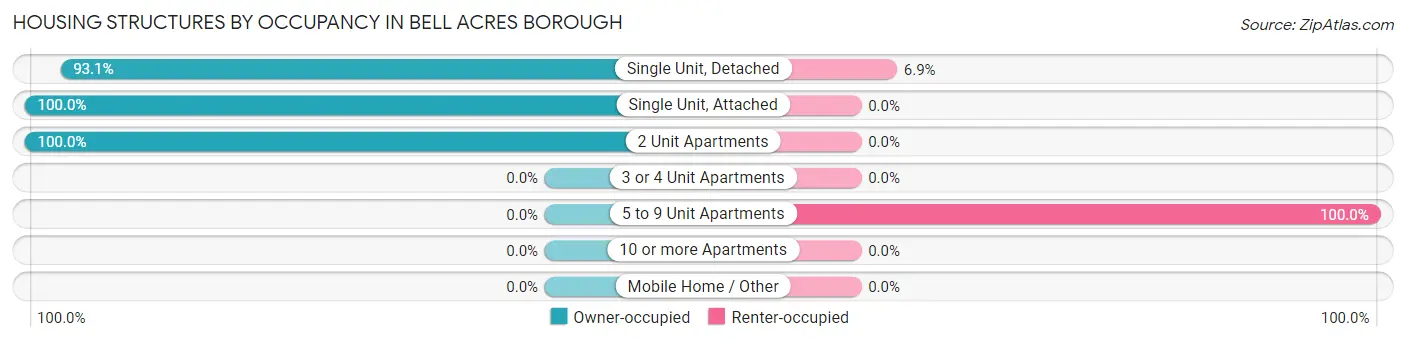
| Structure Type | Owner-occupied | Renter-occupied |
| Single Unit, Detached | 515 (93.1%) | 38 (6.9%) |
| Single Unit, Attached | 14 (100.0%) | 0 (0.0%) |
| 2 Unit Apartments | 2 (100.0%) | 0 (0.0%) |
| 3 or 4 Unit Apartments | 0 (0.0%) | 0 (0.0%) |
| 5 to 9 Unit Apartments | 0 (0.0%) | 6 (100.0%) |
| 10 or more Apartments | 0 (0.0%) | 0 (0.0%) |
| Mobile Home / Other | 0 (0.0%) | 0 (0.0%) |
| Total | 531 (92.3%) | 44 (7.6%) |
Housing Structures by Number of Rooms in Bell Acres borough
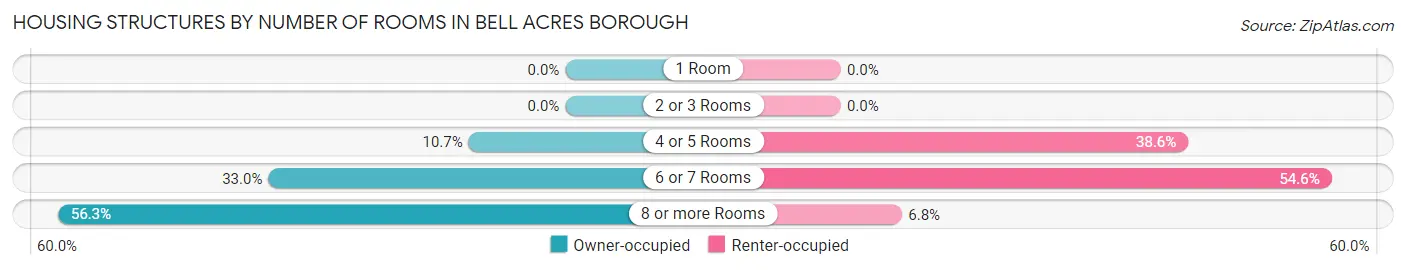
| Number of Rooms | Owner-occupied | Renter-occupied |
| 1 Room | 0 (0.0%) | 0 (0.0%) |
| 2 or 3 Rooms | 0 (0.0%) | 0 (0.0%) |
| 4 or 5 Rooms | 57 (10.7%) | 17 (38.6%) |
| 6 or 7 Rooms | 175 (33.0%) | 24 (54.5%) |
| 8 or more Rooms | 299 (56.3%) | 3 (6.8%) |
| Total | 531 (100.0%) | 44 (100.0%) |
Housing Structure by Heating Type in Bell Acres borough
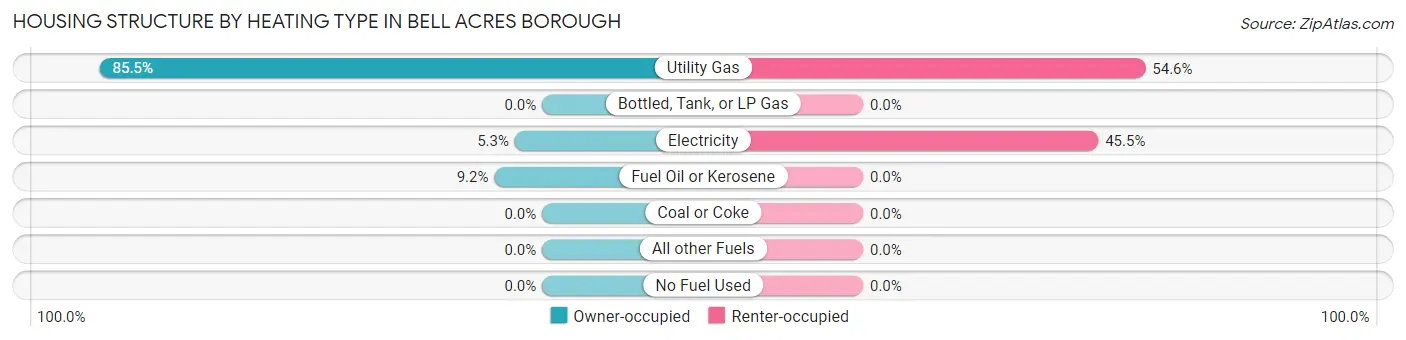
| Heating Type | Owner-occupied | Renter-occupied |
| Utility Gas | 454 (85.5%) | 24 (54.5%) |
| Bottled, Tank, or LP Gas | 0 (0.0%) | 0 (0.0%) |
| Electricity | 28 (5.3%) | 20 (45.5%) |
| Fuel Oil or Kerosene | 49 (9.2%) | 0 (0.0%) |
| Coal or Coke | 0 (0.0%) | 0 (0.0%) |
| All other Fuels | 0 (0.0%) | 0 (0.0%) |
| No Fuel Used | 0 (0.0%) | 0 (0.0%) |
| Total | 531 (100.0%) | 44 (100.0%) |
Household Vehicle Usage in Bell Acres borough
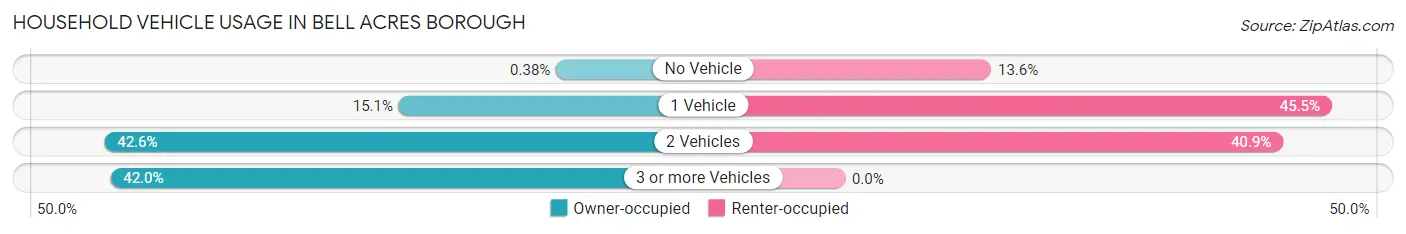
| Vehicles per Household | Owner-occupied | Renter-occupied |
| No Vehicle | 2 (0.4%) | 6 (13.6%) |
| 1 Vehicle | 80 (15.1%) | 20 (45.5%) |
| 2 Vehicles | 226 (42.6%) | 18 (40.9%) |
| 3 or more Vehicles | 223 (42.0%) | 0 (0.0%) |
| Total | 531 (100.0%) | 44 (100.0%) |
Real Estate & Mortgages in Bell Acres borough
Real Estate and Mortgage Overview in Bell Acres borough
| Characteristic | Without Mortgage | With Mortgage |
| Housing Units | 203 | 328 |
| Median Property Value | $286,100 | $435,300 |
| Median Household Income | $121,250 | $216 |
| Monthly Housing Costs | $871 | $152 |
| Real Estate Taxes | $5,270 | $5 |
Property Value by Mortgage Status in Bell Acres borough
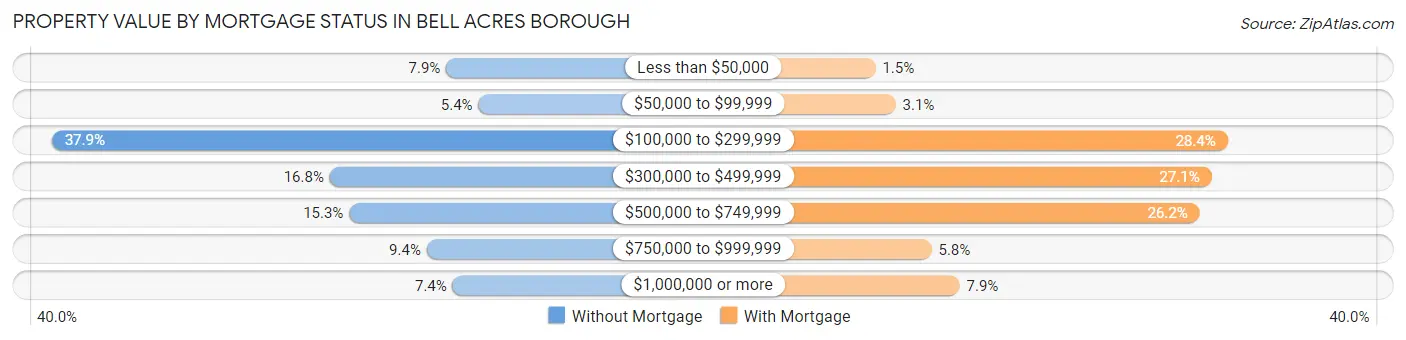
| Property Value | Without Mortgage | With Mortgage |
| Less than $50,000 | 16 (7.9%) | 5 (1.5%) |
| $50,000 to $99,999 | 11 (5.4%) | 10 (3.0%) |
| $100,000 to $299,999 | 77 (37.9%) | 93 (28.3%) |
| $300,000 to $499,999 | 34 (16.8%) | 89 (27.1%) |
| $500,000 to $749,999 | 31 (15.3%) | 86 (26.2%) |
| $750,000 to $999,999 | 19 (9.4%) | 19 (5.8%) |
| $1,000,000 or more | 15 (7.4%) | 26 (7.9%) |
| Total | 203 (100.0%) | 328 (100.0%) |
Household Income by Mortgage Status in Bell Acres borough
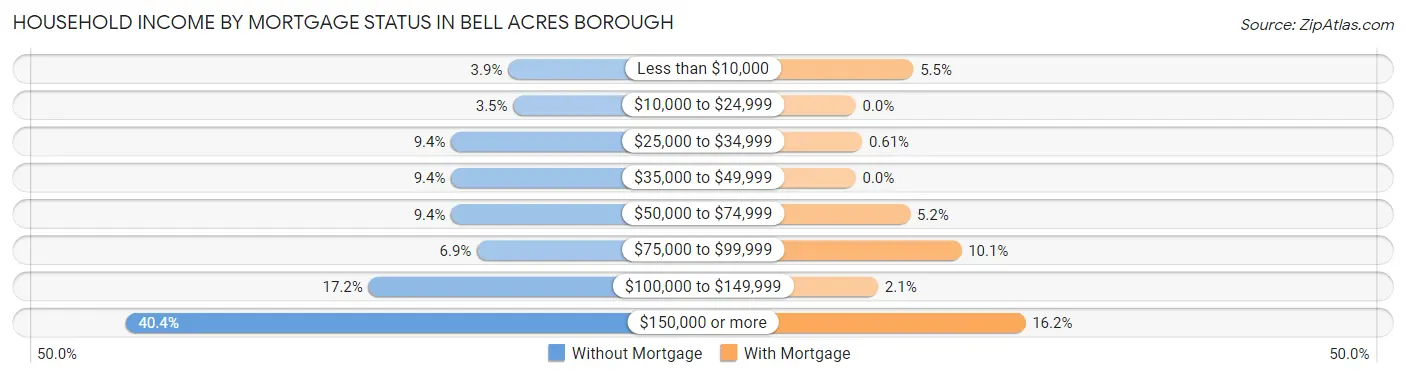
| Household Income | Without Mortgage | With Mortgage |
| Less than $10,000 | 8 (3.9%) | 18 (5.5%) |
| $10,000 to $24,999 | 7 (3.5%) | 0 (0.0%) |
| $25,000 to $34,999 | 19 (9.4%) | 2 (0.6%) |
| $35,000 to $49,999 | 19 (9.4%) | 0 (0.0%) |
| $50,000 to $74,999 | 19 (9.4%) | 17 (5.2%) |
| $75,000 to $99,999 | 14 (6.9%) | 33 (10.1%) |
| $100,000 to $149,999 | 35 (17.2%) | 7 (2.1%) |
| $150,000 or more | 82 (40.4%) | 53 (16.2%) |
| Total | 203 (100.0%) | 328 (100.0%) |
Property Value to Household Income Ratio in Bell Acres borough
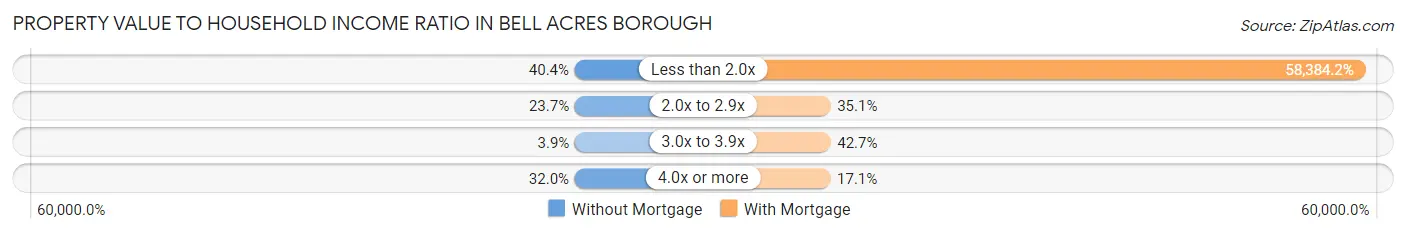
| Value-to-Income Ratio | Without Mortgage | With Mortgage |
| Less than 2.0x | 82 (40.4%) | 191,500 (58,384.1%) |
| 2.0x to 2.9x | 48 (23.6%) | 115 (35.1%) |
| 3.0x to 3.9x | 8 (3.9%) | 140 (42.7%) |
| 4.0x or more | 65 (32.0%) | 56 (17.1%) |
| Total | 203 (100.0%) | 328 (100.0%) |
Real Estate Taxes by Mortgage Status in Bell Acres borough
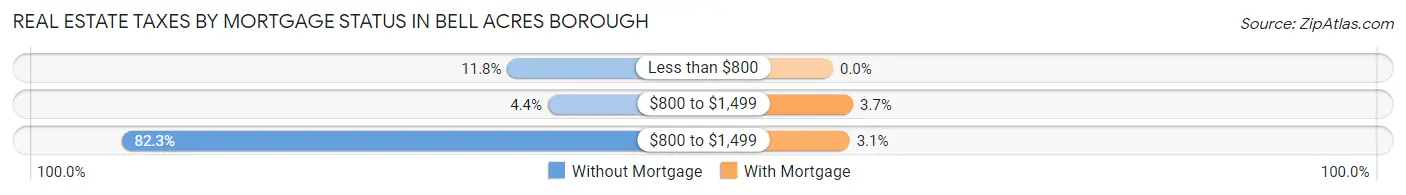
| Property Taxes | Without Mortgage | With Mortgage |
| Less than $800 | 24 (11.8%) | 0 (0.0%) |
| $800 to $1,499 | 9 (4.4%) | 12 (3.7%) |
| $800 to $1,499 | 167 (82.3%) | 10 (3.0%) |
| Total | 203 (100.0%) | 328 (100.0%) |
Health & Disability in Bell Acres borough
Health Insurance Coverage by Age in Bell Acres borough
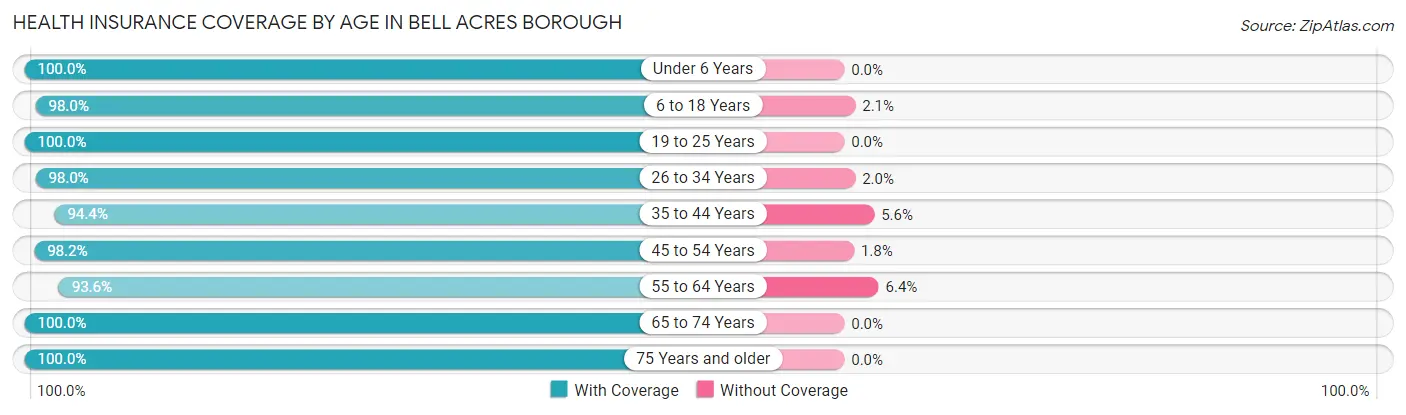
| Age Bracket | With Coverage | Without Coverage |
| Under 6 Years | 102 (100.0%) | 0 (0.0%) |
| 6 to 18 Years | 286 (98.0%) | 6 (2.1%) |
| 19 to 25 Years | 35 (100.0%) | 0 (0.0%) |
| 26 to 34 Years | 193 (98.0%) | 4 (2.0%) |
| 35 to 44 Years | 186 (94.4%) | 11 (5.6%) |
| 45 to 54 Years | 218 (98.2%) | 4 (1.8%) |
| 55 to 64 Years | 249 (93.6%) | 17 (6.4%) |
| 65 to 74 Years | 181 (100.0%) | 0 (0.0%) |
| 75 Years and older | 123 (100.0%) | 0 (0.0%) |
| Total | 1,573 (97.4%) | 42 (2.6%) |
Health Insurance Coverage by Citizenship Status in Bell Acres borough
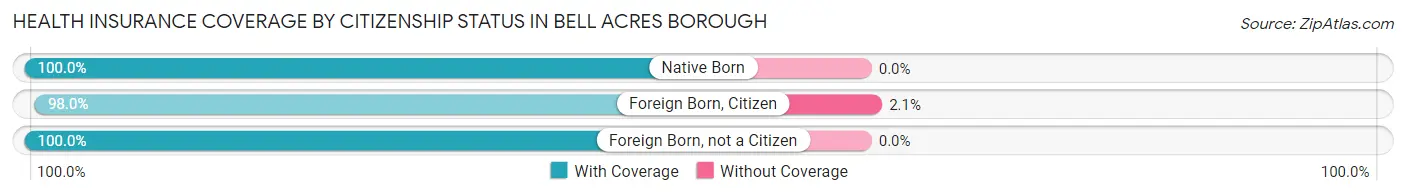
| Citizenship Status | With Coverage | Without Coverage |
| Native Born | 102 (100.0%) | 0 (0.0%) |
| Foreign Born, Citizen | 286 (98.0%) | 6 (2.1%) |
| Foreign Born, not a Citizen | 35 (100.0%) | 0 (0.0%) |
Health Insurance Coverage by Household Income in Bell Acres borough
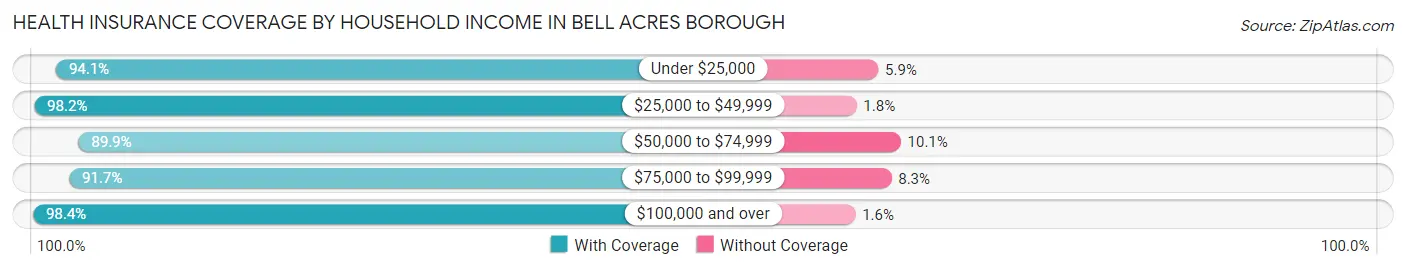
| Household Income | With Coverage | Without Coverage |
| Under $25,000 | 64 (94.1%) | 4 (5.9%) |
| $25,000 to $49,999 | 164 (98.2%) | 3 (1.8%) |
| $50,000 to $74,999 | 107 (89.9%) | 12 (10.1%) |
| $75,000 to $99,999 | 44 (91.7%) | 4 (8.3%) |
| $100,000 and over | 1,194 (98.4%) | 19 (1.6%) |
Public vs Private Health Insurance Coverage by Age in Bell Acres borough
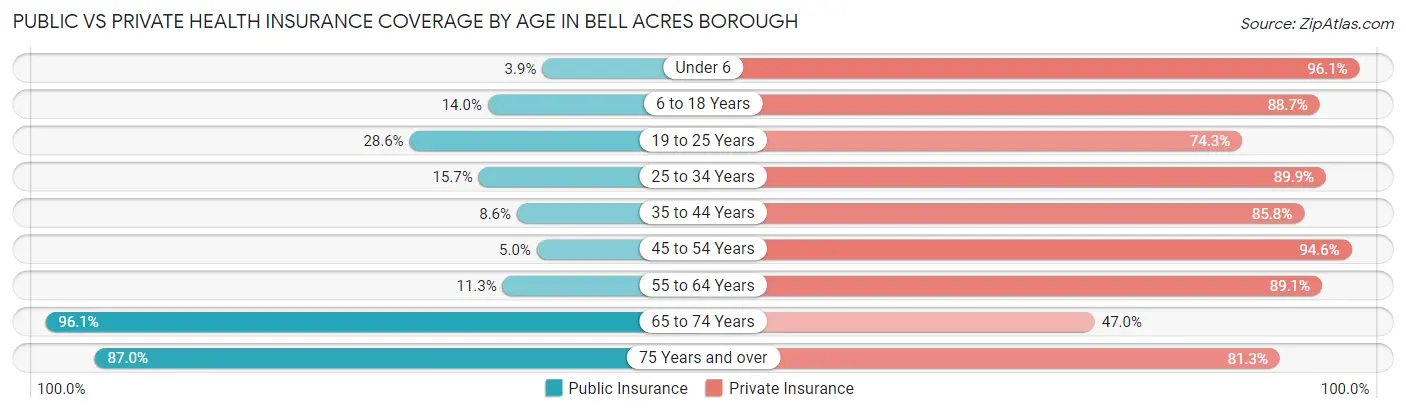
| Age Bracket | Public Insurance | Private Insurance |
| Under 6 | 4 (3.9%) | 98 (96.1%) |
| 6 to 18 Years | 41 (14.0%) | 259 (88.7%) |
| 19 to 25 Years | 10 (28.6%) | 26 (74.3%) |
| 25 to 34 Years | 31 (15.7%) | 177 (89.8%) |
| 35 to 44 Years | 17 (8.6%) | 169 (85.8%) |
| 45 to 54 Years | 11 (5.0%) | 210 (94.6%) |
| 55 to 64 Years | 30 (11.3%) | 237 (89.1%) |
| 65 to 74 Years | 174 (96.1%) | 85 (47.0%) |
| 75 Years and over | 107 (87.0%) | 100 (81.3%) |
| Total | 425 (26.3%) | 1,361 (84.3%) |
Disability Status by Sex by Age in Bell Acres borough
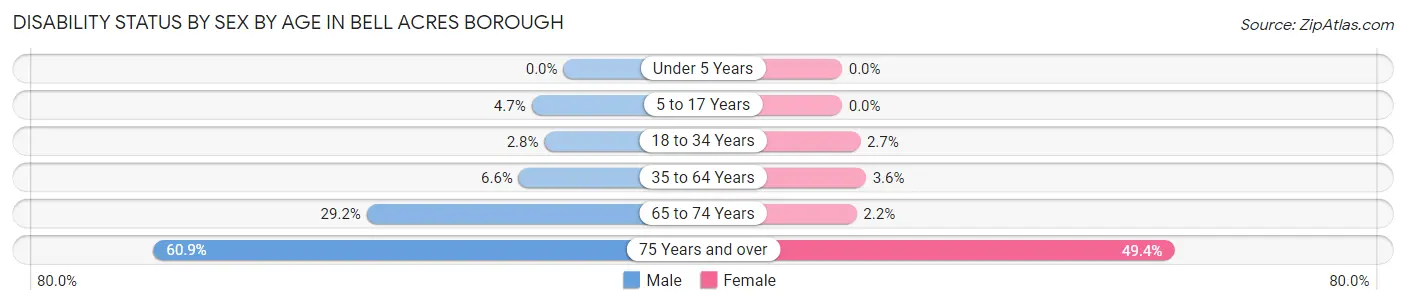
| Age Bracket | Male | Female |
| Under 5 Years | 0 (0.0%) | 0 (0.0%) |
| 5 to 17 Years | 7 (4.7%) | 0 (0.0%) |
| 18 to 34 Years | 3 (2.8%) | 4 (2.7%) |
| 35 to 64 Years | 23 (6.6%) | 12 (3.5%) |
| 65 to 74 Years | 26 (29.2%) | 2 (2.2%) |
| 75 Years and over | 28 (60.9%) | 38 (49.3%) |
Disability Class by Sex by Age in Bell Acres borough
Disability Class: Hearing Difficulty
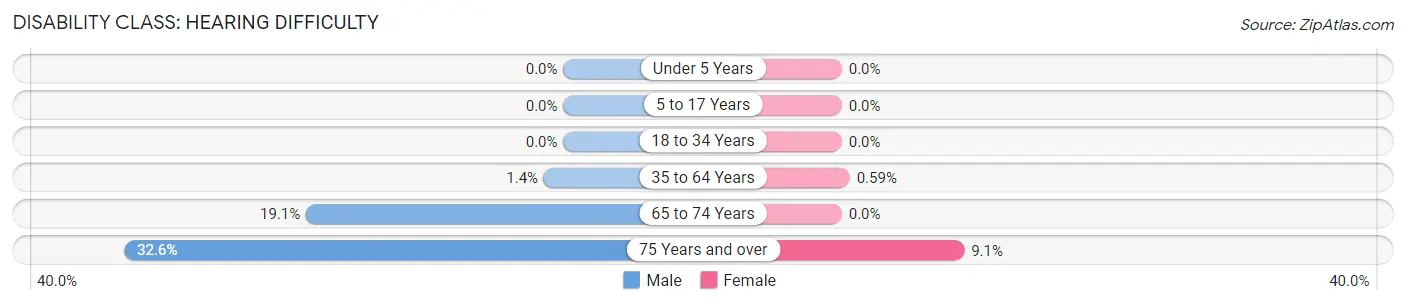
| Age Bracket | Male | Female |
| Under 5 Years | 0 (0.0%) | 0 (0.0%) |
| 5 to 17 Years | 0 (0.0%) | 0 (0.0%) |
| 18 to 34 Years | 0 (0.0%) | 0 (0.0%) |
| 35 to 64 Years | 5 (1.4%) | 2 (0.6%) |
| 65 to 74 Years | 17 (19.1%) | 0 (0.0%) |
| 75 Years and over | 15 (32.6%) | 7 (9.1%) |
Disability Class: Vision Difficulty
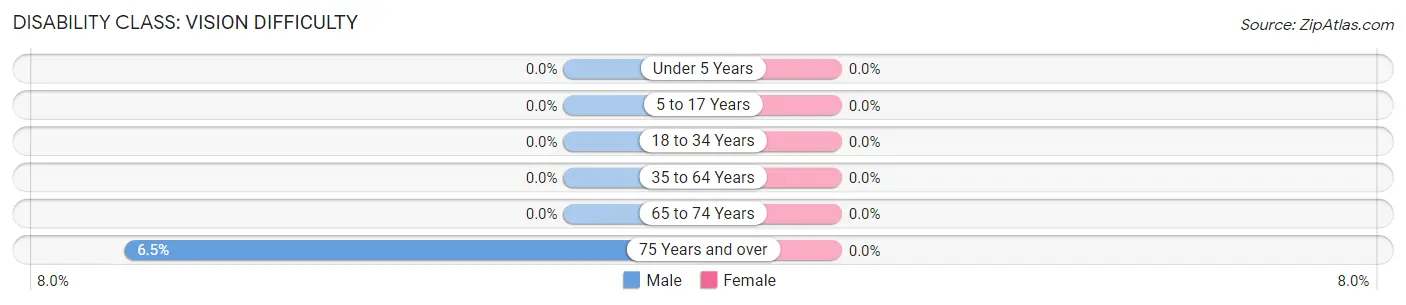
| Age Bracket | Male | Female |
| Under 5 Years | 0 (0.0%) | 0 (0.0%) |
| 5 to 17 Years | 0 (0.0%) | 0 (0.0%) |
| 18 to 34 Years | 0 (0.0%) | 0 (0.0%) |
| 35 to 64 Years | 0 (0.0%) | 0 (0.0%) |
| 65 to 74 Years | 0 (0.0%) | 0 (0.0%) |
| 75 Years and over | 3 (6.5%) | 0 (0.0%) |
Disability Class: Cognitive Difficulty
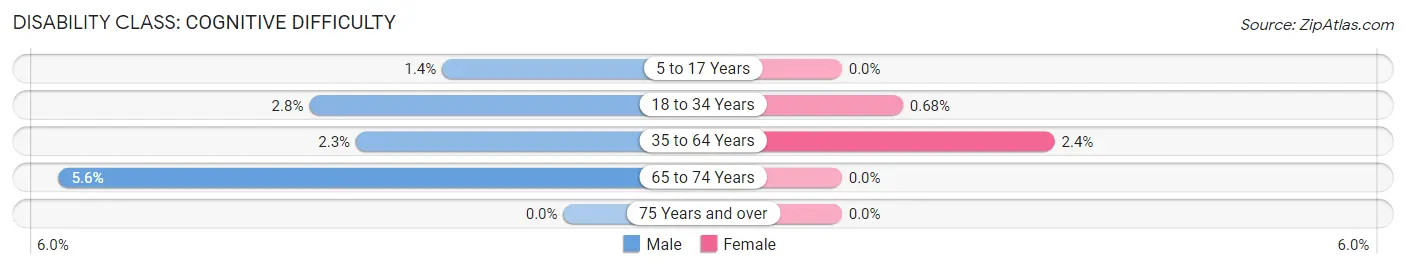
| Age Bracket | Male | Female |
| 5 to 17 Years | 2 (1.3%) | 0 (0.0%) |
| 18 to 34 Years | 3 (2.8%) | 1 (0.7%) |
| 35 to 64 Years | 8 (2.3%) | 8 (2.4%) |
| 65 to 74 Years | 5 (5.6%) | 0 (0.0%) |
| 75 Years and over | 0 (0.0%) | 0 (0.0%) |
Disability Class: Ambulatory Difficulty
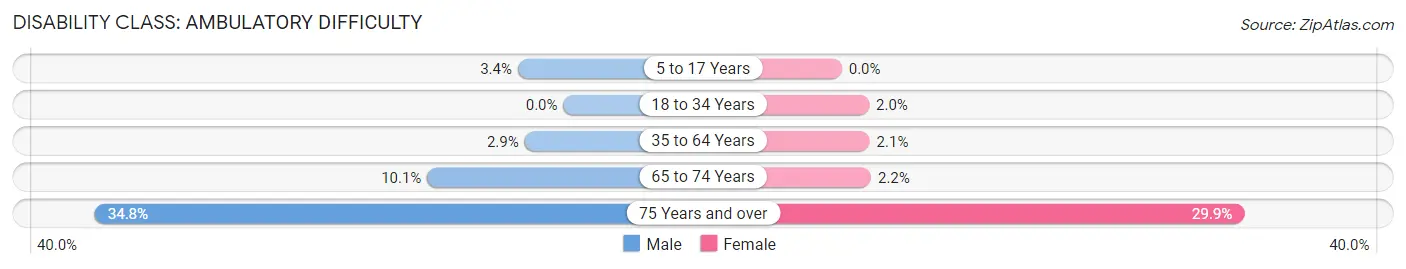
| Age Bracket | Male | Female |
| 5 to 17 Years | 5 (3.4%) | 0 (0.0%) |
| 18 to 34 Years | 0 (0.0%) | 3 (2.0%) |
| 35 to 64 Years | 10 (2.9%) | 7 (2.1%) |
| 65 to 74 Years | 9 (10.1%) | 2 (2.2%) |
| 75 Years and over | 16 (34.8%) | 23 (29.9%) |
Disability Class: Self-Care Difficulty
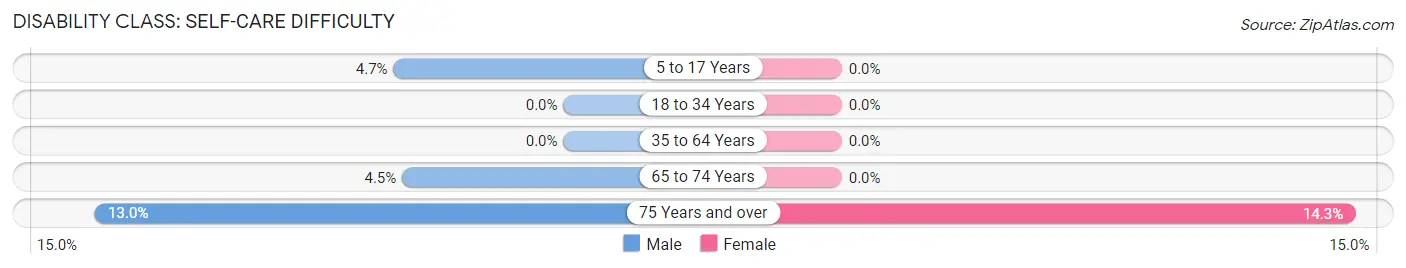
| Age Bracket | Male | Female |
| 5 to 17 Years | 7 (4.7%) | 0 (0.0%) |
| 18 to 34 Years | 0 (0.0%) | 0 (0.0%) |
| 35 to 64 Years | 0 (0.0%) | 0 (0.0%) |
| 65 to 74 Years | 4 (4.5%) | 0 (0.0%) |
| 75 Years and over | 6 (13.0%) | 11 (14.3%) |
Technology Access in Bell Acres borough
Computing Device Access in Bell Acres borough
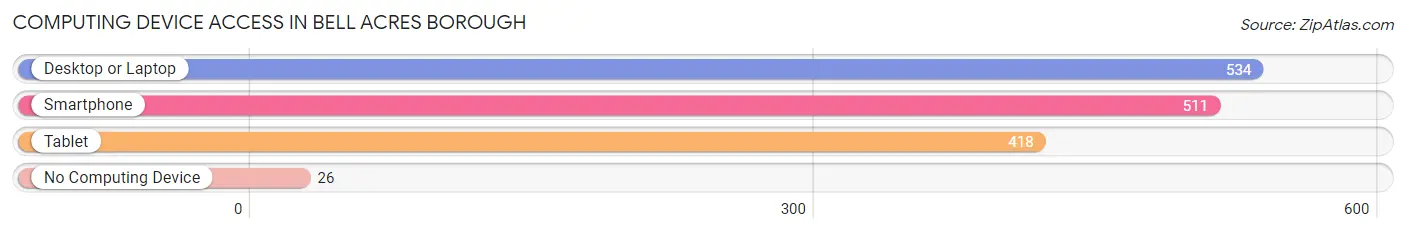
| Device Type | # Households | % Households |
| Desktop or Laptop | 534 | 92.9% |
| Smartphone | 511 | 88.9% |
| Tablet | 418 | 72.7% |
| No Computing Device | 26 | 4.5% |
| Total | 575 | 100.0% |
Internet Access in Bell Acres borough
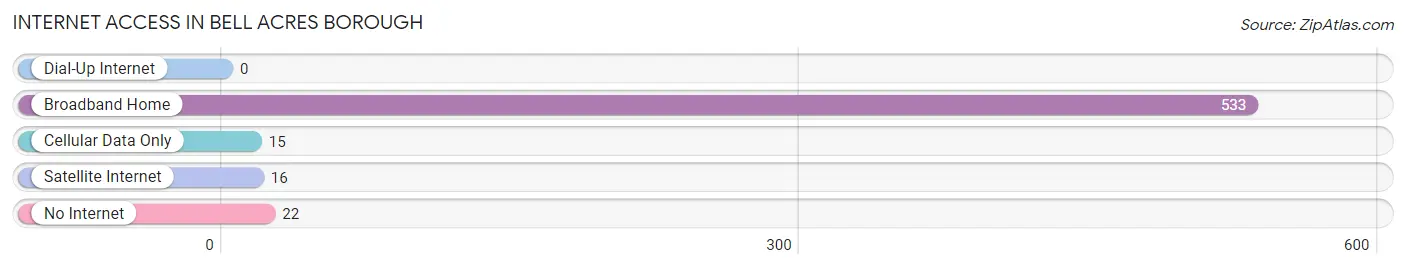
| Internet Type | # Households | % Households |
| Dial-Up Internet | 0 | 0.0% |
| Broadband Home | 533 | 92.7% |
| Cellular Data Only | 15 | 2.6% |
| Satellite Internet | 16 | 2.8% |
| No Internet | 22 | 3.8% |
| Total | 575 | 100.0% |
Bell Acres borough Summary
Bell Acres Borough is a small borough located in Allegheny County, Pennsylvania. It is situated in the North Hills region of the county, approximately 15 miles northwest of the city of Pittsburgh. The borough was incorporated in 1951 and has a population of 1,845 as of the 2010 census.
History
The area that is now Bell Acres Borough was originally inhabited by the Lenape Native Americans. The first European settlers arrived in the area in the late 1700s, and the area was known as “Bell’s Acres” after the Bell family, who were among the first settlers. The area was officially incorporated as a borough in 1951.
Geography
Bell Acres Borough is located in the North Hills region of Allegheny County, approximately 15 miles northwest of the city of Pittsburgh. The borough is situated on a plateau, with an elevation of 1,000 feet above sea level. The borough is bordered by the boroughs of Sewickley, Edgeworth, and Glen Osborne, as well as the townships of Aleppo and Leet. The borough covers an area of 1.2 square miles, all of which is land.
The borough is home to several parks and recreational areas, including the Bell Acres Park, which features a playground, basketball court, and picnic pavilion. The borough is also home to the Bell Acres Golf Course, which is a 9-hole public golf course.
Economy
The economy of Bell Acres Borough is largely based on the service industry. The borough is home to several restaurants, retail stores, and other businesses. The borough is also home to several professional offices, including law firms, accounting firms, and medical offices.
Demographics
As of the 2010 census, the population of Bell Acres Borough was 1,845. The racial makeup of the borough was 97.3% White, 0.9% African American, 0.2% Native American, 0.7% Asian, and 0.9% from other races. Hispanic or Latino of any race were 1.2% of the population.
The median household income in the borough was $76,250, and the median family income was $86,250. The per capita income for the borough was $37,845. About 4.2% of families and 5.2% of the population were below the poverty line.
Conclusion
Bell Acres Borough is a small borough located in Allegheny County, Pennsylvania. It was incorporated in 1951 and has a population of 1,845 as of the 2010 census. The borough is situated on a plateau, with an elevation of 1,000 feet above sea level. The economy of the borough is largely based on the service industry, and the median household income is $76,250. The racial makeup of the borough is 97.3% White, 0.9% African American, 0.2% Native American, 0.7% Asian, and 0.9% from other races.
Common Questions
What is the Total Population of Bell Acres borough?
Total Population of Bell Acres borough is 1,615.
What is the Total Male Population of Bell Acres borough?
Total Male Population of Bell Acres borough is 804.
What is the Total Female Population of Bell Acres borough?
Total Female Population of Bell Acres borough is 811.
What is the Ratio of Males per 100 Females in Bell Acres borough?
There are 99.14 Males per 100 Females in Bell Acres borough.
What is the Ratio of Females per 100 Males in Bell Acres borough?
There are 100.87 Females per 100 Males in Bell Acres borough.
What is the Median Population Age in Bell Acres borough?
Median Population Age in Bell Acres borough is 43.7 Years.
What is the Average Family Size in Bell Acres borough
Average Family Size in Bell Acres borough is 3.1 People.
What is the Average Household Size in Bell Acres borough
Average Household Size in Bell Acres borough is 2.8 People.
What is Per Capita Income in Bell Acres borough?
Per Capita income in Bell Acres borough is $83,020.
What is the Median Family Income in Bell Acres borough?
Median Family Income in Bell Acres borough is $164,792.
What is the Median Household income in Bell Acres borough?
Median Household Income in Bell Acres borough is $156,382.
What is Income or Wage Gap in Bell Acres borough?
Income or Wage Gap in Bell Acres borough is 46.9%.
Women in Bell Acres borough earn 53.1 cents for every dollar earned by a man.
What is Inequality or Gini Index in Bell Acres borough?
Inequality or Gini Index in Bell Acres borough is 0.51.
How Large is the Labor Force in Bell Acres borough?
There are 856 People in the Labor Forcein in Bell Acres borough.
What is the Percentage of People in the Labor Force in Bell Acres borough?
66.6% of People are in the Labor Force in Bell Acres borough.
What is the Unemployment Rate in Bell Acres borough?
Unemployment Rate in Bell Acres borough is 2.6%.