Chester Heights borough, PA
Chester Heights borough Overview
2,897
TOTAL POPULATION
1,217
MALE POPULATION
1,680
FEMALE POPULATION
72.44
MALES / 100 FEMALES
138.04
FEMALES / 100 MALES
43.9
MEDIAN AGE
2.8
AVG FAMILY SIZE
2.1
AVG HOUSEHOLD SIZE
$55,401
PER CAPITA INCOME
$137,791
AVG FAMILY INCOME
$91,447
AVG HOUSEHOLD INCOME
23.2%
WAGE / INCOME GAP [ % ]
76.8¢/ $1
WAGE / INCOME GAP [ $ ]
0.42
INEQUALITY / GINI INDEX
1,517
LABOR FORCE [ PEOPLE ]
64.6%
PERCENT IN LABOR FORCE
4.2%
UNEMPLOYMENT RATE
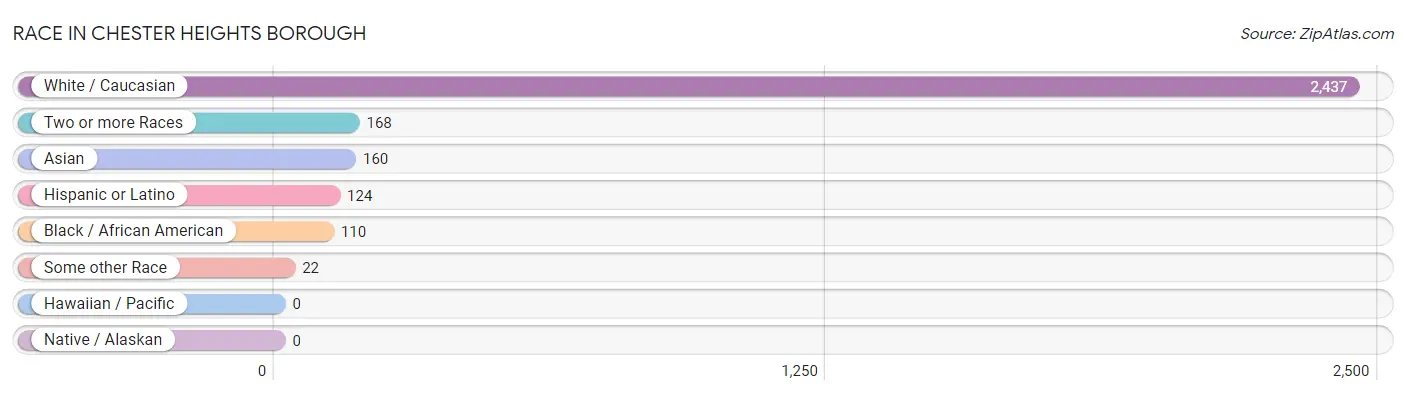
Race in Chester Heights borough
The most populous races in Chester Heights borough are White / Caucasian (2,437 | 84.1%), Two or more Races (168 | 5.8%), and Asian (160 | 5.5%).
| Race | # Population | % Population |
| Asian | 160 | 5.5% |
| Black / African American | 110 | 3.8% |
| Hawaiian / Pacific | 0 | 0.0% |
| Hispanic or Latino | 124 | 4.3% |
| Native / Alaskan | 0 | 0.0% |
| White / Caucasian | 2,437 | 84.1% |
| Two or more Races | 168 | 5.8% |
| Some other Race | 22 | 0.8% |
| Total | 2,897 | 100.0% |
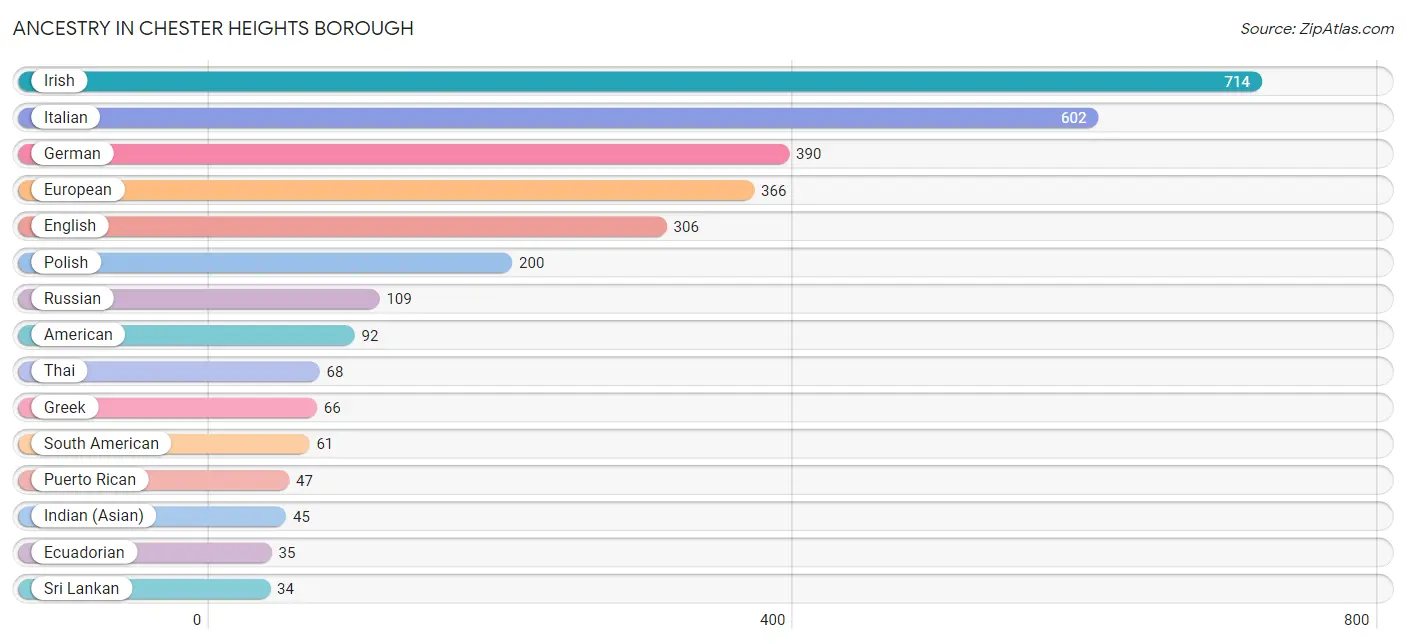
Ancestry in Chester Heights borough
The most populous ancestries reported in Chester Heights borough are Irish (714 | 24.6%), Italian (602 | 20.8%), German (390 | 13.5%), European (366 | 12.6%), and English (306 | 10.6%), together accounting for 82.1% of all Chester Heights borough residents.
| Ancestry | # Population | % Population |
| Albanian | 16 | 0.5% |
| American | 92 | 3.2% |
| Arab | 11 | 0.4% |
| Austrian | 6 | 0.2% |
| Bhutanese | 6 | 0.2% |
| British | 14 | 0.5% |
| Burmese | 33 | 1.1% |
| Colombian | 5 | 0.2% |
| Dutch | 6 | 0.2% |
| Eastern European | 10 | 0.4% |
| Ecuadorian | 35 | 1.2% |
| English | 306 | 10.6% |
| European | 366 | 12.6% |
| French | 24 | 0.8% |
| French Canadian | 3 | 0.1% |
| German | 390 | 13.5% |
| Greek | 66 | 2.3% |
| Hungarian | 19 | 0.7% |
| Indian (Asian) | 45 | 1.5% |
| Iranian | 29 | 1.0% |
| Irish | 714 | 24.6% |
| Italian | 602 | 20.8% |
| Korean | 21 | 0.7% |
| Lithuanian | 2 | 0.1% |
| Maltese | 23 | 0.8% |
| Mexican | 10 | 0.4% |
| Peruvian | 12 | 0.4% |
| Polish | 200 | 6.9% |
| Puerto Rican | 47 | 1.6% |
| Romanian | 6 | 0.2% |
| Russian | 109 | 3.8% |
| Scandinavian | 9 | 0.3% |
| Scotch-Irish | 13 | 0.4% |
| Scottish | 32 | 1.1% |
| Sierra Leonean | 11 | 0.4% |
| Slavic | 6 | 0.2% |
| Slovak | 4 | 0.1% |
| South American | 61 | 2.1% |
| Spanish | 6 | 0.2% |
| Sri Lankan | 34 | 1.2% |
| Subsaharan African | 11 | 0.4% |
| Swiss | 20 | 0.7% |
| Syrian | 11 | 0.4% |
| Thai | 68 | 2.4% |
| Ukrainian | 8 | 0.3% |
| Venezuelan | 9 | 0.3% |
| Welsh | 11 | 0.4% | View All 47 Rows |
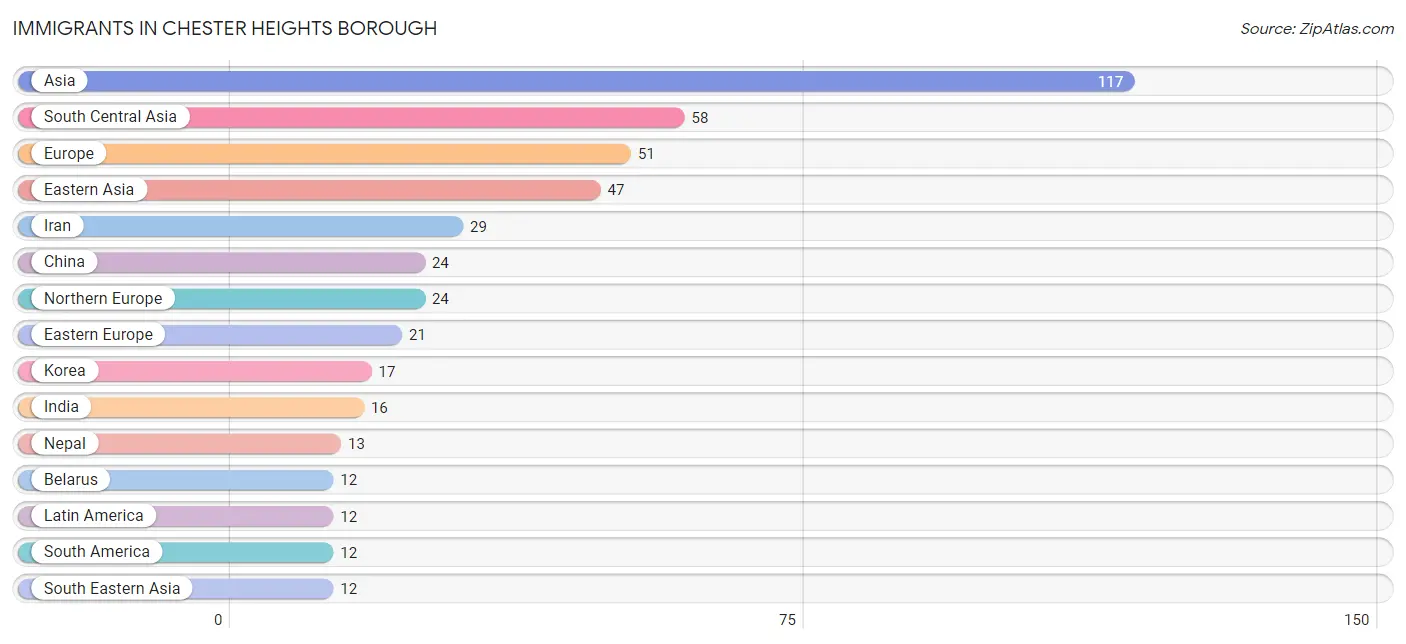
Immigrants in Chester Heights borough
The most numerous immigrant groups reported in Chester Heights borough came from Asia (117 | 4.0%), South Central Asia (58 | 2.0%), Europe (51 | 1.8%), Eastern Asia (47 | 1.6%), and Iran (29 | 1.0%), together accounting for 10.4% of all Chester Heights borough residents.
| Immigration Origin | # Population | % Population |
| Africa | 11 | 0.4% |
| Asia | 117 | 4.0% |
| Belarus | 12 | 0.4% |
| China | 24 | 0.8% |
| Eastern Asia | 47 | 1.6% |
| Eastern Europe | 21 | 0.7% |
| Europe | 51 | 1.8% |
| Greece | 6 | 0.2% |
| India | 16 | 0.5% |
| Iran | 29 | 1.0% |
| Japan | 6 | 0.2% |
| Korea | 17 | 0.6% |
| Latin America | 12 | 0.4% |
| Nepal | 13 | 0.4% |
| Northern Europe | 24 | 0.8% |
| Peru | 3 | 0.1% |
| Russia | 9 | 0.3% |
| South America | 12 | 0.4% |
| South Central Asia | 58 | 2.0% |
| South Eastern Asia | 12 | 0.4% |
| Southern Europe | 6 | 0.2% |
| Venezuela | 9 | 0.3% |
| Vietnam | 12 | 0.4% | View All 23 Rows |
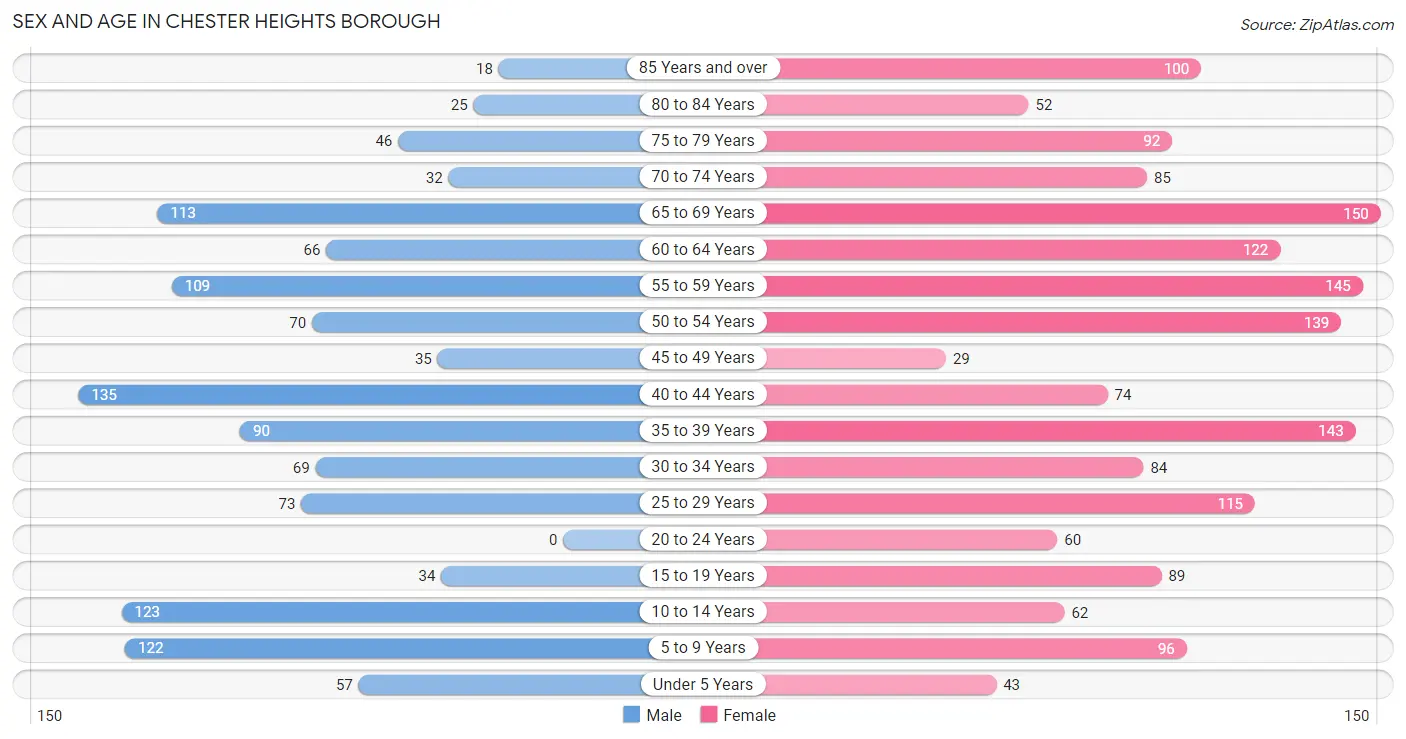
Sex and Age in Chester Heights borough
Sex and Age in Chester Heights borough
The most populous age groups in Chester Heights borough are 40 to 44 Years (135 | 11.1%) for men and 65 to 69 Years (150 | 8.9%) for women.
| Age Bracket | Male | Female |
| Under 5 Years | 57 (4.7%) | 43 (2.6%) |
| 5 to 9 Years | 122 (10.0%) | 96 (5.7%) |
| 10 to 14 Years | 123 (10.1%) | 62 (3.7%) |
| 15 to 19 Years | 34 (2.8%) | 89 (5.3%) |
| 20 to 24 Years | 0 (0.0%) | 60 (3.6%) |
| 25 to 29 Years | 73 (6.0%) | 115 (6.9%) |
| 30 to 34 Years | 69 (5.7%) | 84 (5.0%) |
| 35 to 39 Years | 90 (7.4%) | 143 (8.5%) |
| 40 to 44 Years | 135 (11.1%) | 74 (4.4%) |
| 45 to 49 Years | 35 (2.9%) | 29 (1.7%) |
| 50 to 54 Years | 70 (5.8%) | 139 (8.3%) |
| 55 to 59 Years | 109 (9.0%) | 145 (8.6%) |
| 60 to 64 Years | 66 (5.4%) | 122 (7.3%) |
| 65 to 69 Years | 113 (9.3%) | 150 (8.9%) |
| 70 to 74 Years | 32 (2.6%) | 85 (5.1%) |
| 75 to 79 Years | 46 (3.8%) | 92 (5.5%) |
| 80 to 84 Years | 25 (2.1%) | 52 (3.1%) |
| 85 Years and over | 18 (1.5%) | 100 (5.9%) |
| Total | 1,217 (100.0%) | 1,680 (100.0%) |
Families and Households in Chester Heights borough
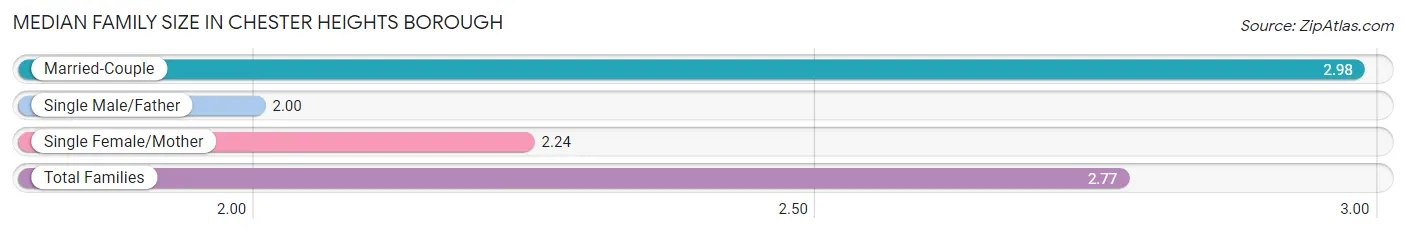
Median Family Size in Chester Heights borough
The median family size in Chester Heights borough is 2.77 persons per family, with married-couple families (570 | 73.5%) accounting for the largest median family size of 2.98 persons per family. On the other hand, single male/father families (22 | 2.8%) represent the smallest median family size with 2.00 persons per family.
| Family Type | # Families | Family Size |
| Married-Couple | 570 (73.5%) | 2.98 |
| Single Male/Father | 22 (2.8%) | 2.00 |
| Single Female/Mother | 184 (23.7%) | 2.24 |
| Total Families | 776 (100.0%) | 2.77 |
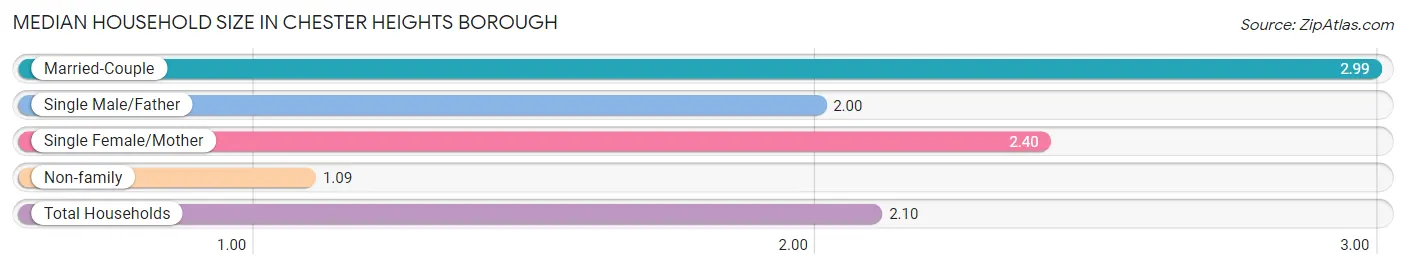
Median Household Size in Chester Heights borough
The median household size in Chester Heights borough is 2.10 persons per household, with married-couple households (570 | 42.7%) accounting for the largest median household size of 2.99 persons per household. non-family households (560 | 41.9%) represent the smallest median household size with 1.09 persons per household.
| Household Type | # Households | Household Size |
| Married-Couple | 570 (42.7%) | 2.99 |
| Single Male/Father | 22 (1.7%) | 2.00 |
| Single Female/Mother | 184 (13.8%) | 2.40 |
| Non-family | 560 (41.9%) | 1.09 |
| Total Households | 1,336 (100.0%) | 2.10 |
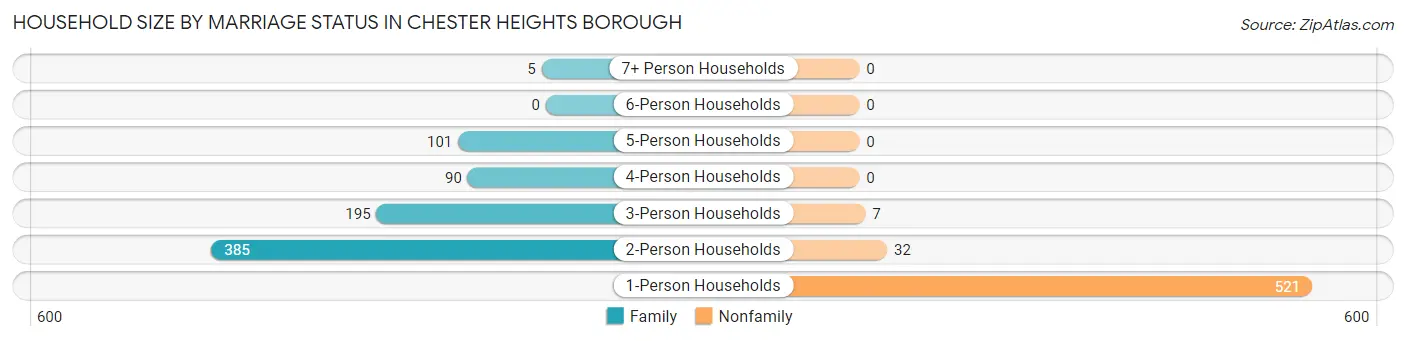
Household Size by Marriage Status in Chester Heights borough
Out of a total of 1,336 households in Chester Heights borough, 776 (58.1%) are family households, while 560 (41.9%) are nonfamily households. The most numerous type of family households are 2-person households, comprising 385, and the most common type of nonfamily households are 1-person households, comprising 521.
| Household Size | Family Households | Nonfamily Households |
| 1-Person Households | - | 521 (39.0%) |
| 2-Person Households | 385 (28.8%) | 32 (2.4%) |
| 3-Person Households | 195 (14.6%) | 7 (0.5%) |
| 4-Person Households | 90 (6.7%) | 0 (0.0%) |
| 5-Person Households | 101 (7.6%) | 0 (0.0%) |
| 6-Person Households | 0 (0.0%) | 0 (0.0%) |
| 7+ Person Households | 5 (0.4%) | 0 (0.0%) |
| Total | 776 (58.1%) | 560 (41.9%) |
Female Fertility in Chester Heights borough
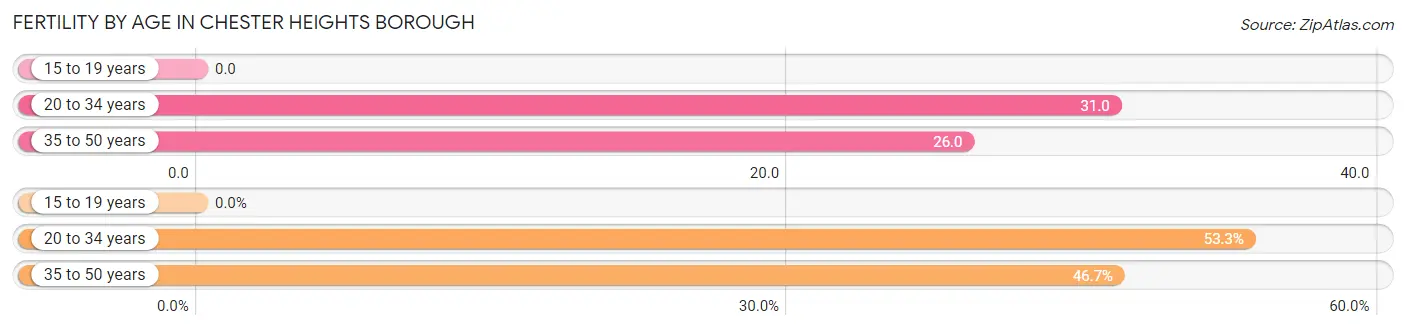
Fertility by Age in Chester Heights borough
Average fertility rate in Chester Heights borough is 24.0 births per 1,000 women. Women in the age bracket of 20 to 34 years have the highest fertility rate with 31.0 births per 1,000 women. Women in the age bracket of 20 to 34 years acount for 53.3% of all women with births.
| Age Bracket | Women with Births | Births / 1,000 Women |
| 15 to 19 years | 0 (0.0%) | 0.0 |
| 20 to 34 years | 8 (53.3%) | 31.0 |
| 35 to 50 years | 7 (46.7%) | 26.0 |
| Total | 15 (100.0%) | 24.0 |
Fertility by Age by Marriage Status in Chester Heights borough
46.7% of women with births (15) in Chester Heights borough are married. The highest percentage of unmarried women with births falls into 20 to 34 years age bracket with 100.0% of them unmarried at the time of birth, while the lowest percentage of unmarried women with births belong to 35 to 50 years age bracket with 0.0% of them unmarried.
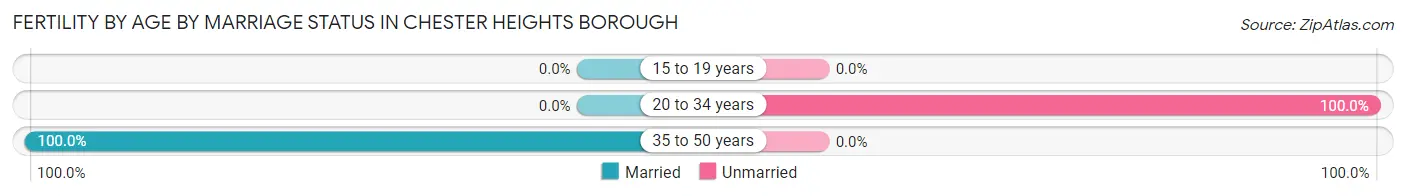
| Age Bracket | Married | Unmarried |
| 15 to 19 years | 0 (0.0%) | 0 (0.0%) |
| 20 to 34 years | 0 (0.0%) | 8 (100.0%) |
| 35 to 50 years | 7 (100.0%) | 0 (0.0%) |
| Total | 7 (46.7%) | 8 (53.3%) |
Fertility by Education in Chester Heights borough
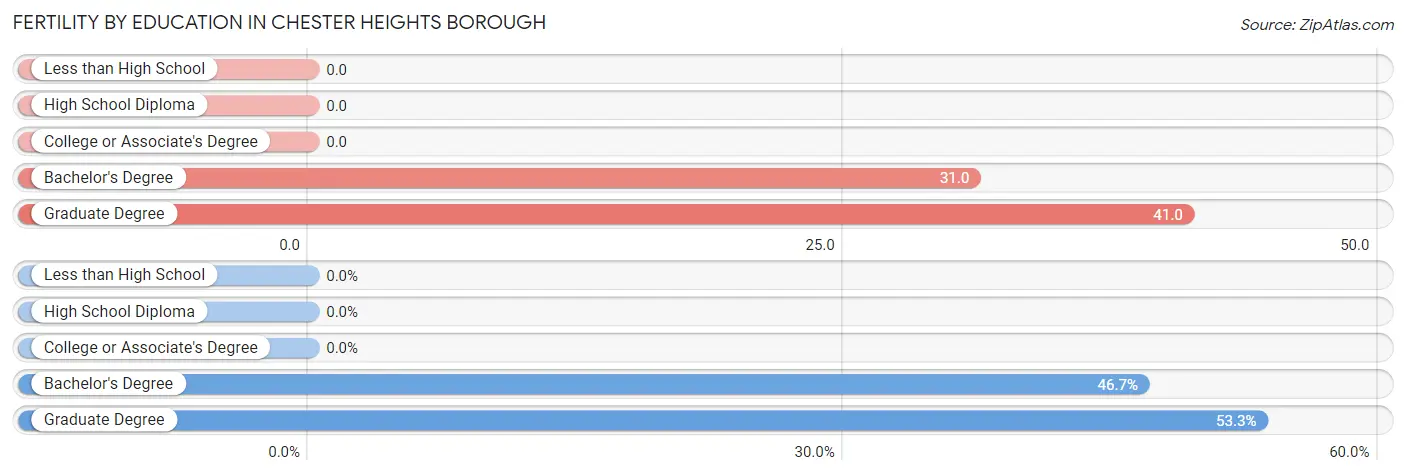
| Educational Attainment | Women with Births | Births / 1,000 Women |
| Less than High School | 0 (0.0%) | 0.0 |
| High School Diploma | 0 (0.0%) | 0.0 |
| College or Associate's Degree | 0 (0.0%) | 0.0 |
| Bachelor's Degree | 7 (46.7%) | 31.0 |
| Graduate Degree | 8 (53.3%) | 41.0 |
| Total | 15 (100.0%) | 24.0 |
Fertility by Education by Marriage Status in Chester Heights borough
53.3% of women with births in Chester Heights borough are unmarried. Women with the educational attainment of bachelor's degree are most likely to be married with 100.0% of them married at childbirth, while women with the educational attainment of graduate degree are least likely to be married with 100.0% of them unmarried at childbirth.
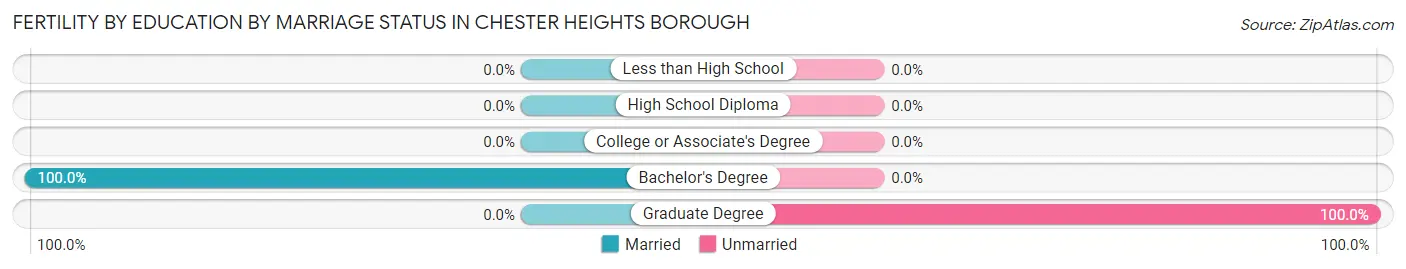
| Educational Attainment | Married | Unmarried |
| Less than High School | 0 (0.0%) | 0 (0.0%) |
| High School Diploma | 0 (0.0%) | 0 (0.0%) |
| College or Associate's Degree | 0 (0.0%) | 0 (0.0%) |
| Bachelor's Degree | 7 (100.0%) | 0 (0.0%) |
| Graduate Degree | 0 (0.0%) | 8 (100.0%) |
| Total | 7 (46.7%) | 8 (53.3%) |
Income in Chester Heights borough
Income Overview in Chester Heights borough
Per Capita Income in Chester Heights borough is $55,401, while median incomes of families and households are $137,791 and $91,447 respectively.
| Characteristic | Number | Measure |
| Per Capita Income | 2,897 | $55,401 |
| Median Family Income | 776 | $137,791 |
| Mean Family Income | 776 | $150,515 |
| Median Household Income | 1,336 | $91,447 |
| Mean Household Income | 1,336 | $118,399 |
| Income Deficit | 776 | $0 |
| Wage / Income Gap (%) | 2,897 | 23.24% |
| Wage / Income Gap ($) | 2,897 | 76.76¢ per $1 |
| Gini / Inequality Index | 2,897 | 0.42 |
Earnings by Sex in Chester Heights borough
Average Earnings in Chester Heights borough are $62,484, $78,646 for men and $60,370 for women, a difference of 23.2%.
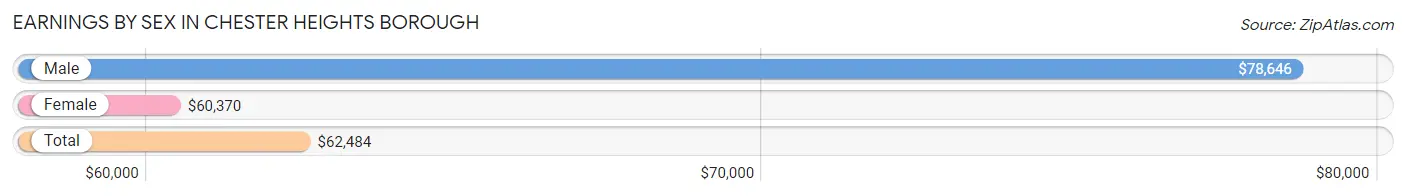
| Sex | Number | Average Earnings |
| Male | 630 (40.7%) | $78,646 |
| Female | 917 (59.3%) | $60,370 |
| Total | 1,547 (100.0%) | $62,484 |
Earnings by Sex by Income Bracket in Chester Heights borough
The most common earnings brackets in Chester Heights borough are $100,000+ for men (229 | 36.3%) and $100,000+ for women (181 | 19.7%).
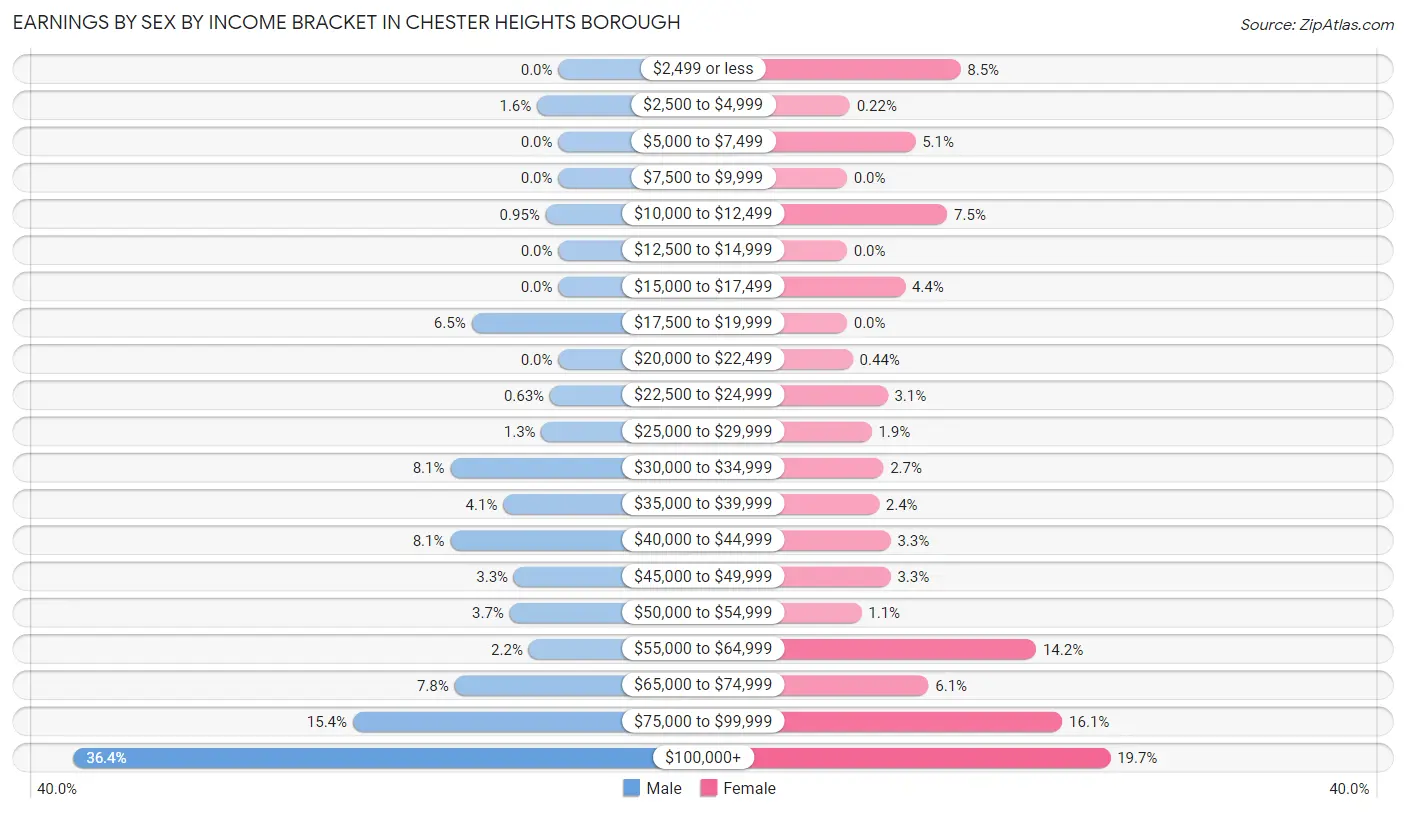
| Income | Male | Female |
| $2,499 or less | 0 (0.0%) | 78 (8.5%) |
| $2,500 to $4,999 | 10 (1.6%) | 2 (0.2%) |
| $5,000 to $7,499 | 0 (0.0%) | 47 (5.1%) |
| $7,500 to $9,999 | 0 (0.0%) | 0 (0.0%) |
| $10,000 to $12,499 | 6 (0.9%) | 69 (7.5%) |
| $12,500 to $14,999 | 0 (0.0%) | 0 (0.0%) |
| $15,000 to $17,499 | 0 (0.0%) | 40 (4.4%) |
| $17,500 to $19,999 | 41 (6.5%) | 0 (0.0%) |
| $20,000 to $22,499 | 0 (0.0%) | 4 (0.4%) |
| $22,500 to $24,999 | 4 (0.6%) | 28 (3.0%) |
| $25,000 to $29,999 | 8 (1.3%) | 17 (1.8%) |
| $30,000 to $34,999 | 51 (8.1%) | 25 (2.7%) |
| $35,000 to $39,999 | 26 (4.1%) | 22 (2.4%) |
| $40,000 to $44,999 | 51 (8.1%) | 30 (3.3%) |
| $45,000 to $49,999 | 21 (3.3%) | 30 (3.3%) |
| $50,000 to $54,999 | 23 (3.6%) | 10 (1.1%) |
| $55,000 to $64,999 | 14 (2.2%) | 130 (14.2%) |
| $65,000 to $74,999 | 49 (7.8%) | 56 (6.1%) |
| $75,000 to $99,999 | 97 (15.4%) | 148 (16.1%) |
| $100,000+ | 229 (36.3%) | 181 (19.7%) |
| Total | 630 (100.0%) | 917 (100.0%) |
Earnings by Sex by Educational Attainment in Chester Heights borough
Average earnings in Chester Heights borough are $79,167 for men and $61,919 for women, a difference of 21.8%. Men with an educational attainment of graduate degree enjoy the highest average annual earnings of $119,097, while those with high school diploma education earn the least with $68,750. Women with an educational attainment of graduate degree earn the most with the average annual earnings of $70,179, while those with high school diploma education have the smallest earnings of $35,375.
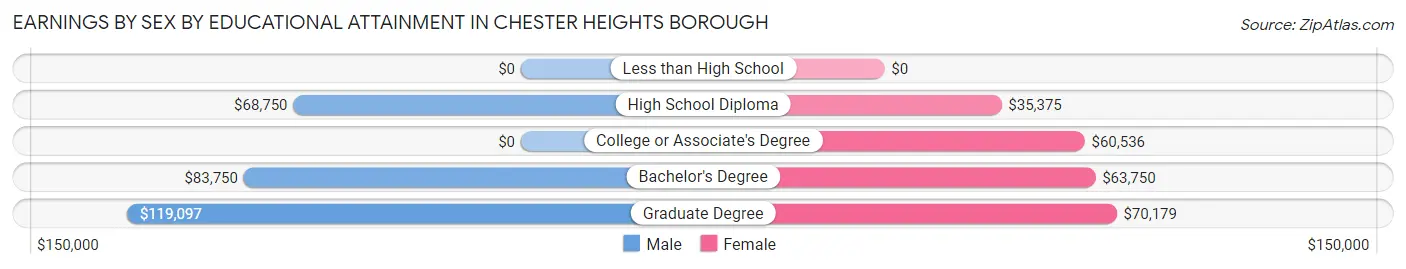
| Educational Attainment | Male Income | Female Income |
| Less than High School | - | - |
| High School Diploma | $68,750 | $35,375 |
| College or Associate's Degree | - | - |
| Bachelor's Degree | $83,750 | $63,750 |
| Graduate Degree | $119,097 | $70,179 |
| Total | $79,167 | $61,919 |
Family Income in Chester Heights borough
Family Income Brackets in Chester Heights borough
According to the Chester Heights borough family income data, there are 229 families falling into the $100,000 to $149,999 income range, which is the most common income bracket and makes up 29.5% of all families. Conversely, the $10,000 to $14,999 income bracket is the least frequent group with only 1 families (0.1%) belonging to this category.
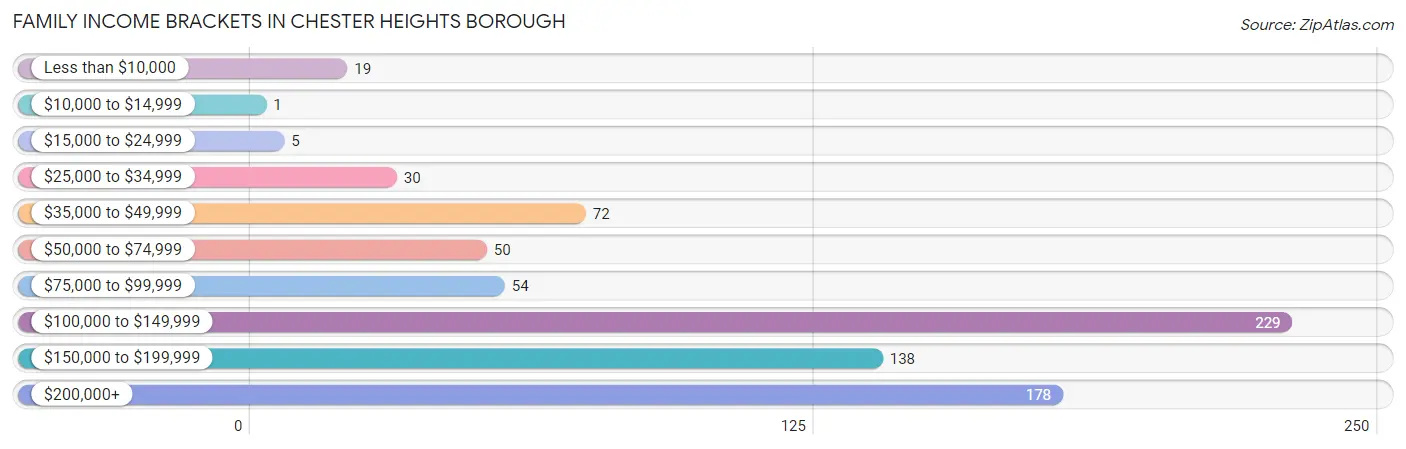
| Income Bracket | # Families | % Families |
| Less than $10,000 | 19 | 2.4% |
| $10,000 to $14,999 | 1 | 0.1% |
| $15,000 to $24,999 | 5 | 0.6% |
| $25,000 to $34,999 | 30 | 3.9% |
| $35,000 to $49,999 | 72 | 9.3% |
| $50,000 to $74,999 | 50 | 6.4% |
| $75,000 to $99,999 | 54 | 7.0% |
| $100,000 to $149,999 | 229 | 29.5% |
| $150,000 to $199,999 | 138 | 17.8% |
| $200,000+ | 178 | 22.9% |
Family Income by Famaliy Size in Chester Heights borough
3-person families (180 | 23.2%) account for the highest median family income in Chester Heights borough with $158,188 per family, while 2-person families (411 | 53.0%) have the highest median income of $60,438 per family member.
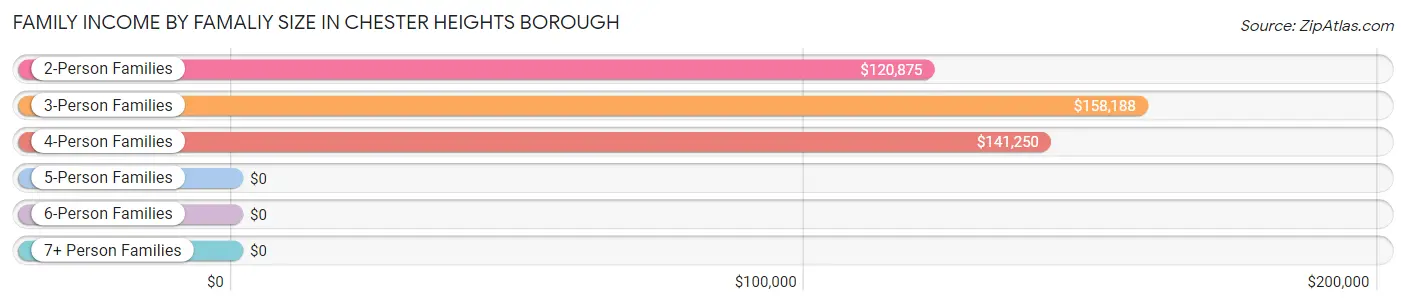
| Income Bracket | # Families | Median Income |
| 2-Person Families | 411 (53.0%) | $120,875 |
| 3-Person Families | 180 (23.2%) | $158,188 |
| 4-Person Families | 79 (10.2%) | $141,250 |
| 5-Person Families | 101 (13.0%) | $0 |
| 6-Person Families | 0 (0.0%) | $0 |
| 7+ Person Families | 5 (0.6%) | $0 |
| Total | 776 (100.0%) | $137,791 |
Family Income by Number of Earners in Chester Heights borough
The median family income in Chester Heights borough is $137,791, with families comprising 3+ earners (93) having the highest median family income of $250,001, while families with no earners (91) have the lowest median family income of $75,163, accounting for 12.0% and 11.7% of families, respectively.
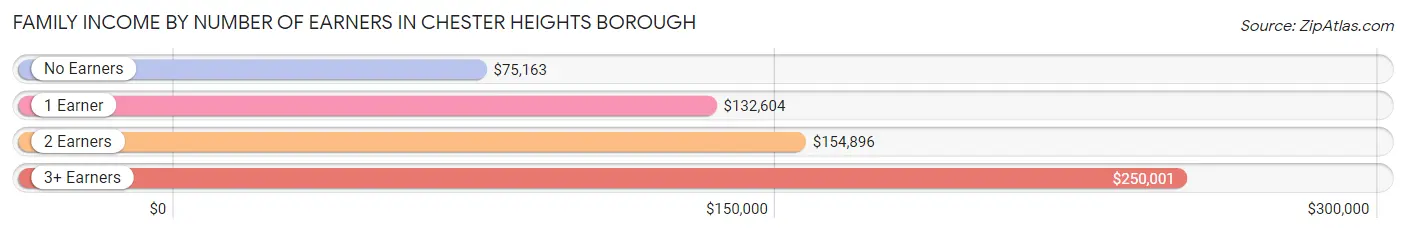
| Number of Earners | # Families | Median Income |
| No Earners | 91 (11.7%) | $75,163 |
| 1 Earner | 301 (38.8%) | $132,604 |
| 2 Earners | 291 (37.5%) | $154,896 |
| 3+ Earners | 93 (12.0%) | $250,001 |
| Total | 776 (100.0%) | $137,791 |
Household Income in Chester Heights borough
Household Income Brackets in Chester Heights borough
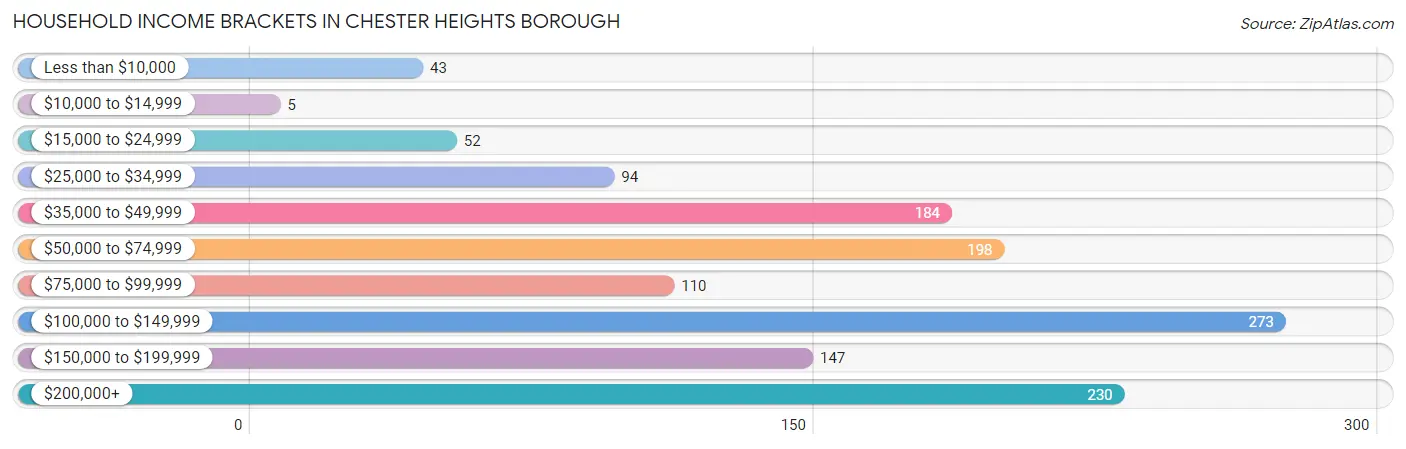
With 273 households falling in the category, the $100,000 to $149,999 income range is the most frequent in Chester Heights borough, accounting for 20.4% of all households. In contrast, only 5 households (0.4%) fall into the $10,000 to $14,999 income bracket, making it the least populous group.
| Income Bracket | # Households | % Households |
| Less than $10,000 | 43 | 3.2% |
| $10,000 to $14,999 | 5 | 0.4% |
| $15,000 to $24,999 | 52 | 3.9% |
| $25,000 to $34,999 | 94 | 7.0% |
| $35,000 to $49,999 | 184 | 13.8% |
| $50,000 to $74,999 | 198 | 14.8% |
| $75,000 to $99,999 | 110 | 8.2% |
| $100,000 to $149,999 | 273 | 20.4% |
| $150,000 to $199,999 | 147 | 11.0% |
| $200,000+ | 230 | 17.2% |
Household Income by Householder Age in Chester Heights borough
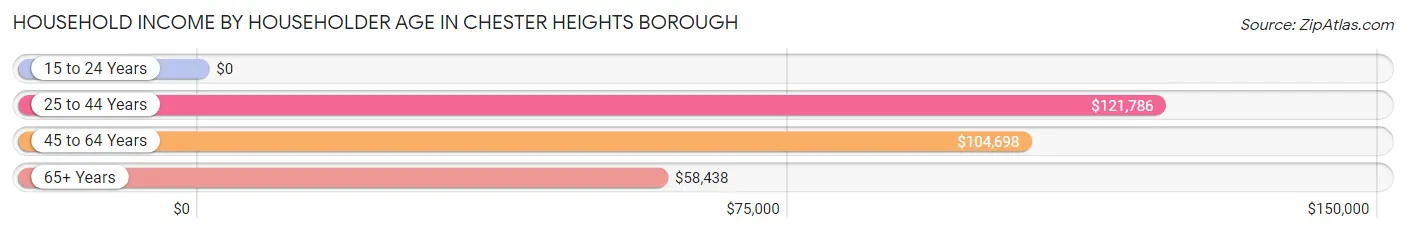
The median household income in Chester Heights borough is $91,447, with the highest median household income of $121,786 found in the 25 to 44 years age bracket for the primary householder. A total of 364 households (27.3%) fall into this category.
| Income Bracket | # Households | Median Income |
| 15 to 24 Years | 0 (0.0%) | $0 |
| 25 to 44 Years | 364 (27.3%) | $121,786 |
| 45 to 64 Years | 487 (36.4%) | $104,698 |
| 65+ Years | 485 (36.3%) | $58,438 |
| Total | 1,336 (100.0%) | $91,447 |
Poverty in Chester Heights borough
Income Below Poverty by Sex and Age in Chester Heights borough
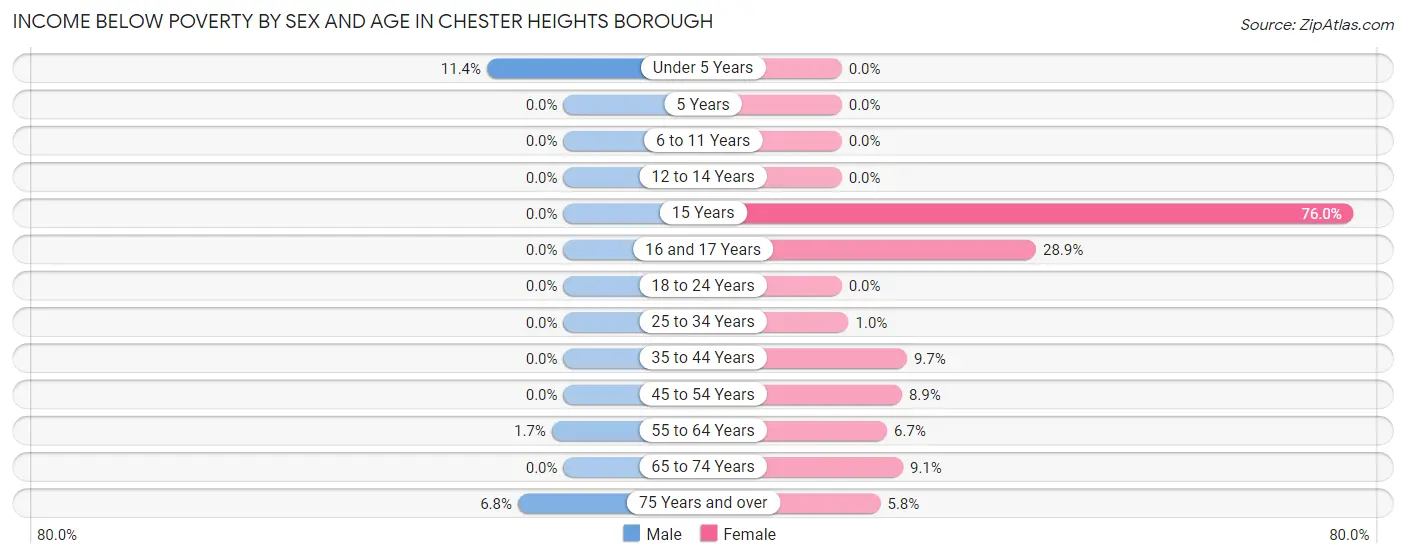
With 1.1% poverty level for males and 7.5% for females among the residents of Chester Heights borough, under 5 year old males and 15 year old females are the most vulnerable to poverty, with 5 males (11.4%) and 19 females (76.0%) in their respective age groups living below the poverty level.
| Age Bracket | Male | Female |
| Under 5 Years | 5 (11.4%) | 0 (0.0%) |
| 5 Years | 0 (0.0%) | 0 (0.0%) |
| 6 to 11 Years | 0 (0.0%) | 0 (0.0%) |
| 12 to 14 Years | 0 (0.0%) | 0 (0.0%) |
| 15 Years | 0 (0.0%) | 19 (76.0%) |
| 16 and 17 Years | 0 (0.0%) | 15 (28.8%) |
| 18 to 24 Years | 0 (0.0%) | 0 (0.0%) |
| 25 to 34 Years | 0 (0.0%) | 2 (1.0%) |
| 35 to 44 Years | 0 (0.0%) | 21 (9.7%) |
| 45 to 54 Years | 0 (0.0%) | 15 (8.9%) |
| 55 to 64 Years | 3 (1.7%) | 18 (6.7%) |
| 65 to 74 Years | 0 (0.0%) | 21 (9.1%) |
| 75 Years and over | 5 (6.8%) | 13 (5.8%) |
| Total | 13 (1.1%) | 124 (7.5%) |
Income Above Poverty by Sex and Age in Chester Heights borough
According to the poverty statistics in Chester Heights borough, males aged 5 years and females aged under 5 years are the age groups that are most secure financially, with 100.0% of males and 100.0% of females in these age groups living above the poverty line.
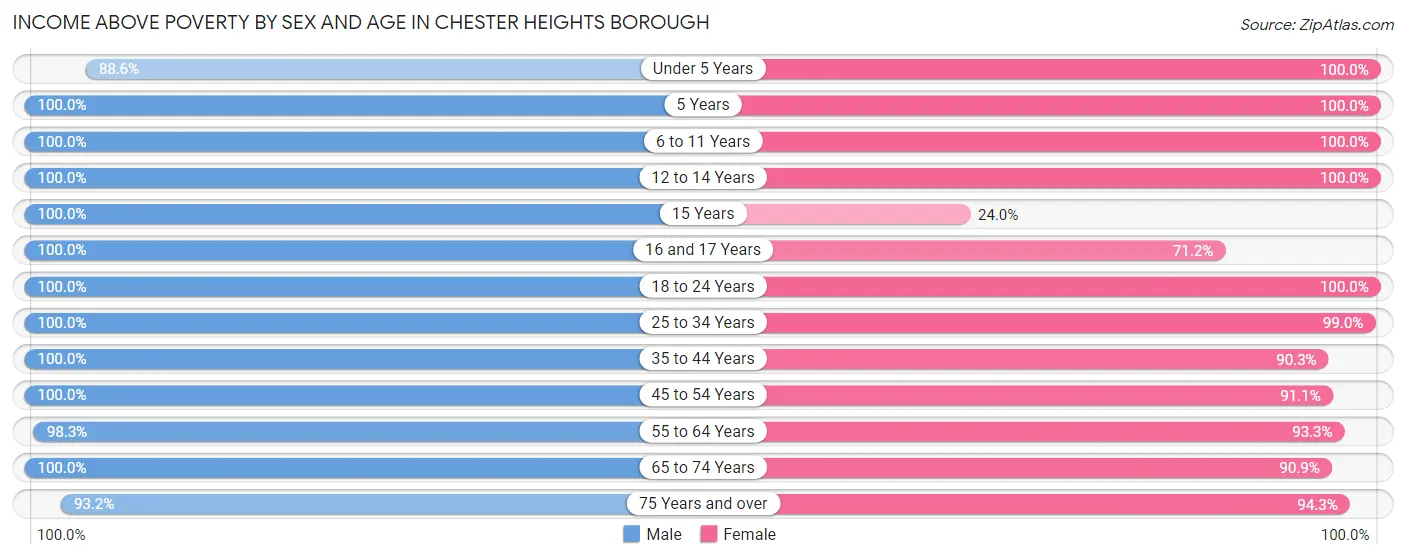
| Age Bracket | Male | Female |
| Under 5 Years | 39 (88.6%) | 43 (100.0%) |
| 5 Years | 32 (100.0%) | 55 (100.0%) |
| 6 to 11 Years | 107 (100.0%) | 73 (100.0%) |
| 12 to 14 Years | 87 (100.0%) | 25 (100.0%) |
| 15 Years | 20 (100.0%) | 6 (24.0%) |
| 16 and 17 Years | 5 (100.0%) | 37 (71.2%) |
| 18 to 24 Years | 9 (100.0%) | 72 (100.0%) |
| 25 to 34 Years | 142 (100.0%) | 197 (99.0%) |
| 35 to 44 Years | 225 (100.0%) | 196 (90.3%) |
| 45 to 54 Years | 105 (100.0%) | 153 (91.1%) |
| 55 to 64 Years | 170 (98.3%) | 249 (93.3%) |
| 65 to 74 Years | 145 (100.0%) | 210 (90.9%) |
| 75 Years and over | 69 (93.2%) | 213 (94.3%) |
| Total | 1,155 (98.9%) | 1,529 (92.5%) |
Income Below Poverty Among Married-Couple Families in Chester Heights borough
The poverty statistics for married-couple families in Chester Heights borough show that 0.9% or 5 of the total 570 families live below the poverty line. Families with no children have the highest poverty rate of 1.5%, comprising of 5 families. On the other hand, families with 1 or 2 children have the lowest poverty rate of 0.0%, which includes 0 families.
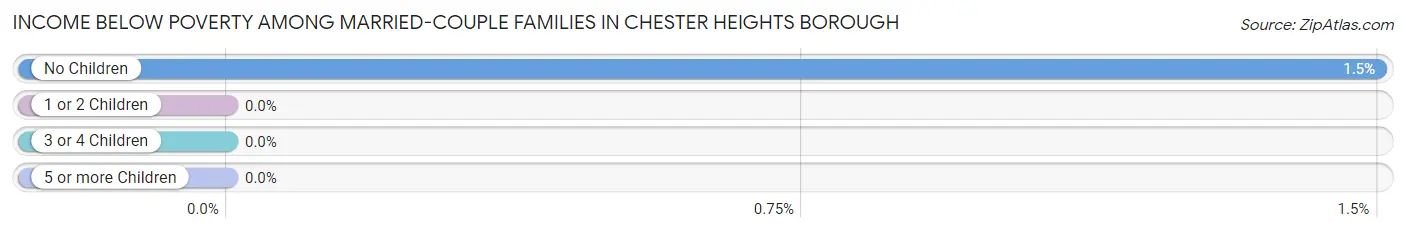
| Children | Above Poverty | Below Poverty |
| No Children | 329 (98.5%) | 5 (1.5%) |
| 1 or 2 Children | 220 (100.0%) | 0 (0.0%) |
| 3 or 4 Children | 11 (100.0%) | 0 (0.0%) |
| 5 or more Children | 5 (100.0%) | 0 (0.0%) |
| Total | 565 (99.1%) | 5 (0.9%) |
Income Below Poverty Among Single-Parent Households in Chester Heights borough
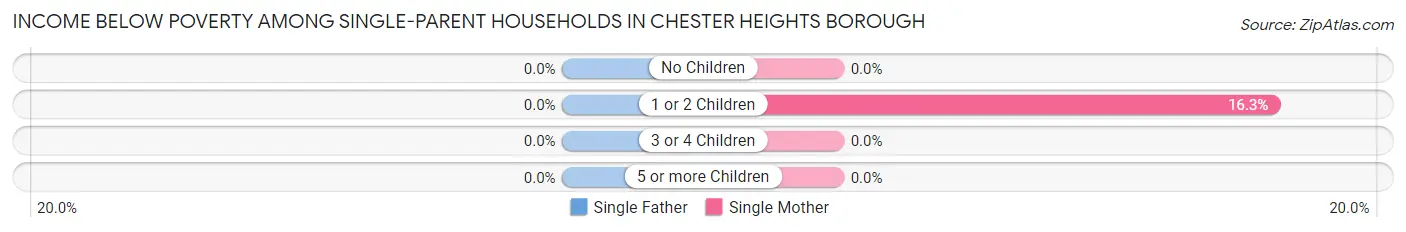
| Children | Single Father | Single Mother |
| No Children | 0 (0.0%) | 0 (0.0%) |
| 1 or 2 Children | 0 (0.0%) | 20 (16.3%) |
| 3 or 4 Children | 0 (0.0%) | 0 (0.0%) |
| 5 or more Children | 0 (0.0%) | 0 (0.0%) |
| Total | 0 (0.0%) | 20 (10.9%) |
Income Below Poverty Among Married-Couple vs Single-Parent Households in Chester Heights borough
The poverty data for Chester Heights borough shows that 5 of the married-couple family households (0.9%) and 20 of the single-parent households (9.7%) are living below the poverty level. Within the married-couple family households, those with no children have the highest poverty rate, with 5 households (1.5%) falling below the poverty line. Among the single-parent households, those with 1 or 2 children have the highest poverty rate, with 20 household (14.5%) living below poverty.
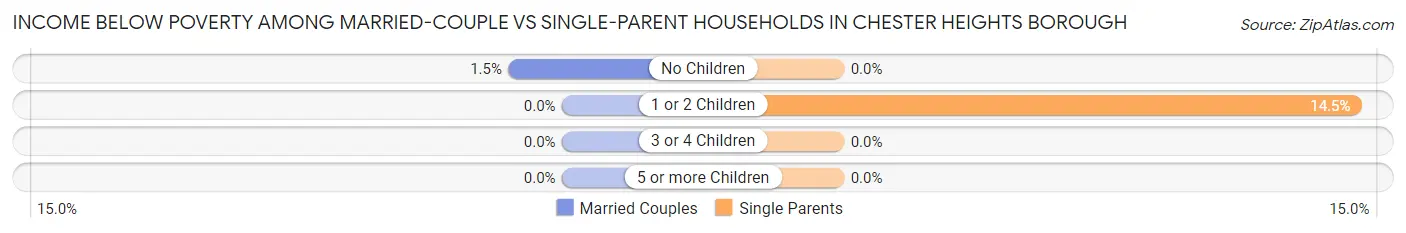
| Children | Married-Couple Families | Single-Parent Households |
| No Children | 5 (1.5%) | 0 (0.0%) |
| 1 or 2 Children | 0 (0.0%) | 20 (14.5%) |
| 3 or 4 Children | 0 (0.0%) | 0 (0.0%) |
| 5 or more Children | 0 (0.0%) | 0 (0.0%) |
| Total | 5 (0.9%) | 20 (9.7%) |
Employment Characteristics in Chester Heights borough
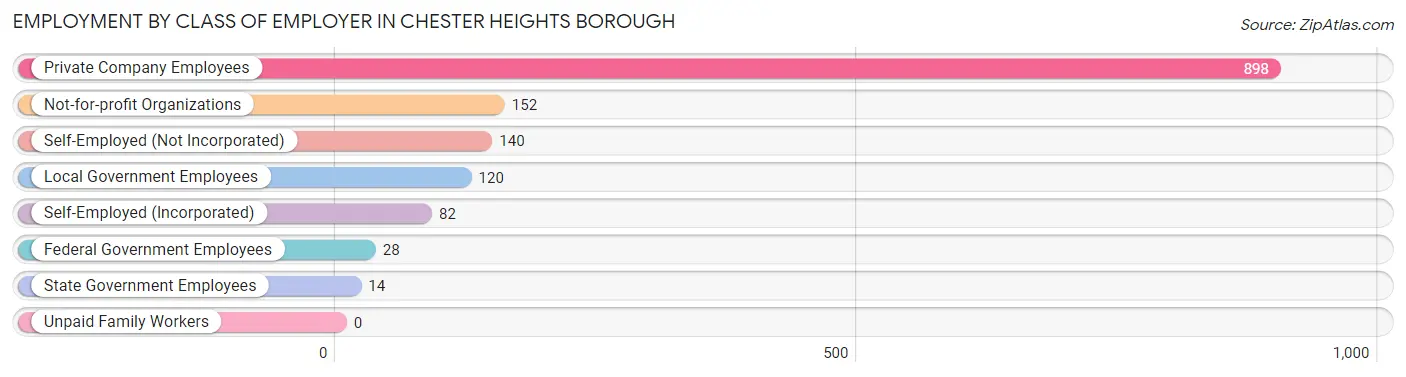
Employment by Class of Employer in Chester Heights borough
Among the 1,434 employed individuals in Chester Heights borough, private company employees (898 | 62.6%), not-for-profit organizations (152 | 10.6%), and self-employed (not incorporated) (140 | 9.8%) make up the most common classes of employment.
| Employer Class | # Employees | % Employees |
| Private Company Employees | 898 | 62.6% |
| Self-Employed (Incorporated) | 82 | 5.7% |
| Self-Employed (Not Incorporated) | 140 | 9.8% |
| Not-for-profit Organizations | 152 | 10.6% |
| Local Government Employees | 120 | 8.4% |
| State Government Employees | 14 | 1.0% |
| Federal Government Employees | 28 | 1.9% |
| Unpaid Family Workers | 0 | 0.0% |
| Total | 1,434 | 100.0% |
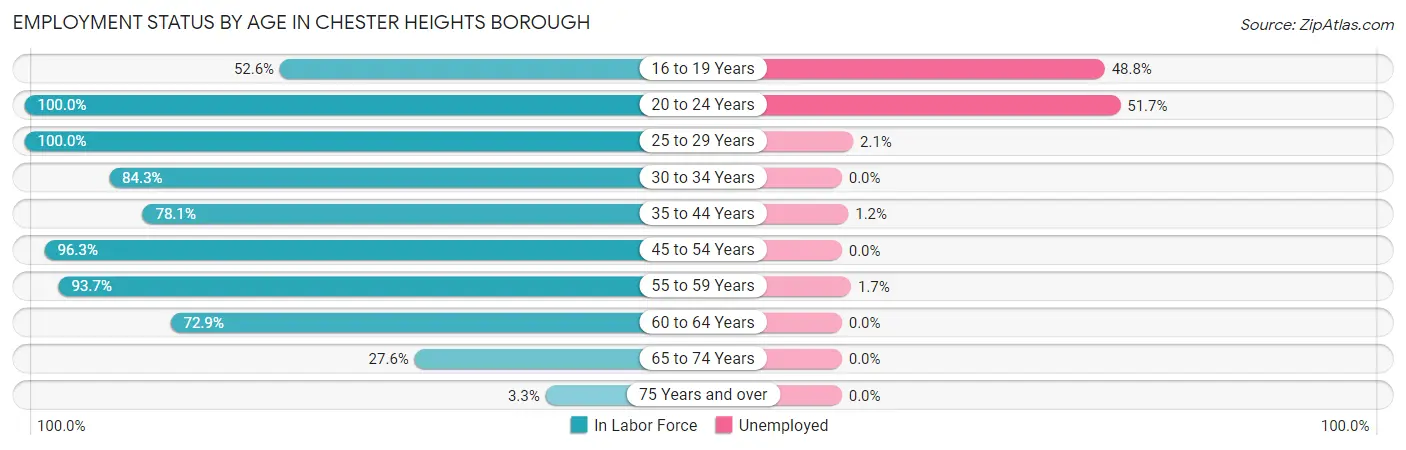
Employment Status by Age in Chester Heights borough
According to the labor force statistics for Chester Heights borough, out of the total population over 16 years of age (2,349), 64.6% or 1,517 individuals are in the labor force, with 4.2% or 64 of them unemployed. The age group with the highest labor force participation rate is 20 to 24 years, with 100.0% or 60 individuals in the labor force. Within the labor force, the 20 to 24 years age range has the highest percentage of unemployed individuals, with 51.7% or 31 of them being unemployed.
| Age Bracket | In Labor Force | Unemployed |
| 16 to 19 Years | 41 (52.6%) | 20 (48.8%) |
| 20 to 24 Years | 60 (100.0%) | 31 (51.7%) |
| 25 to 29 Years | 188 (100.0%) | 4 (2.1%) |
| 30 to 34 Years | 129 (84.3%) | 0 (0.0%) |
| 35 to 44 Years | 345 (78.1%) | 4 (1.2%) |
| 45 to 54 Years | 263 (96.3%) | 0 (0.0%) |
| 55 to 59 Years | 238 (93.7%) | 4 (1.7%) |
| 60 to 64 Years | 137 (72.9%) | 0 (0.0%) |
| 65 to 74 Years | 105 (27.6%) | 0 (0.0%) |
| 75 Years and over | 11 (3.3%) | 0 (0.0%) |
| Total | 1,517 (64.6%) | 64 (4.2%) |
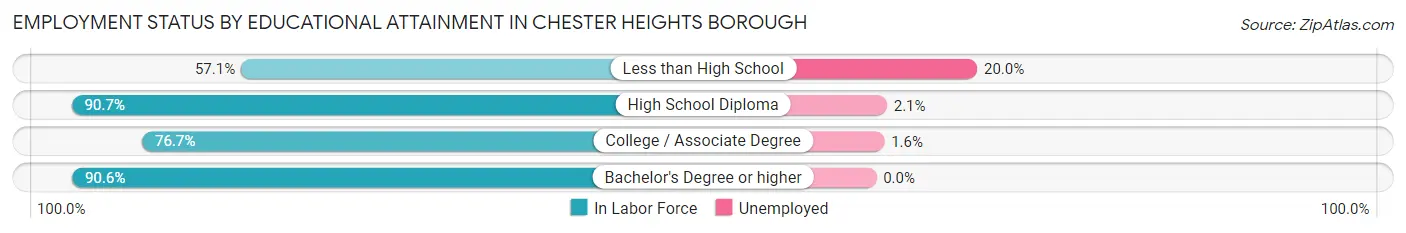
Employment Status by Educational Attainment in Chester Heights borough
According to labor force statistics for Chester Heights borough, 86.8% of individuals (1,300) out of the total population between 25 and 64 years of age (1,498) are in the labor force, with 0.9% or 12 of them being unemployed. The group with the highest labor force participation rate are those with the educational attainment of high school diploma, with 90.7% or 195 individuals in the labor force. Within the labor force, individuals with less than high school education have the highest percentage of unemployment, with 20.0% or 4 of them being unemployed.
| Educational Attainment | In Labor Force | Unemployed |
| Less than High School | 20 (57.1%) | 7 (20.0%) |
| High School Diploma | 195 (90.7%) | 5 (2.1%) |
| College / Associate Degree | 254 (76.7%) | 5 (1.6%) |
| Bachelor's Degree or higher | 831 (90.6%) | 0 (0.0%) |
| Total | 1,300 (86.8%) | 13 (0.9%) |
Employment Occupations by Sex in Chester Heights borough
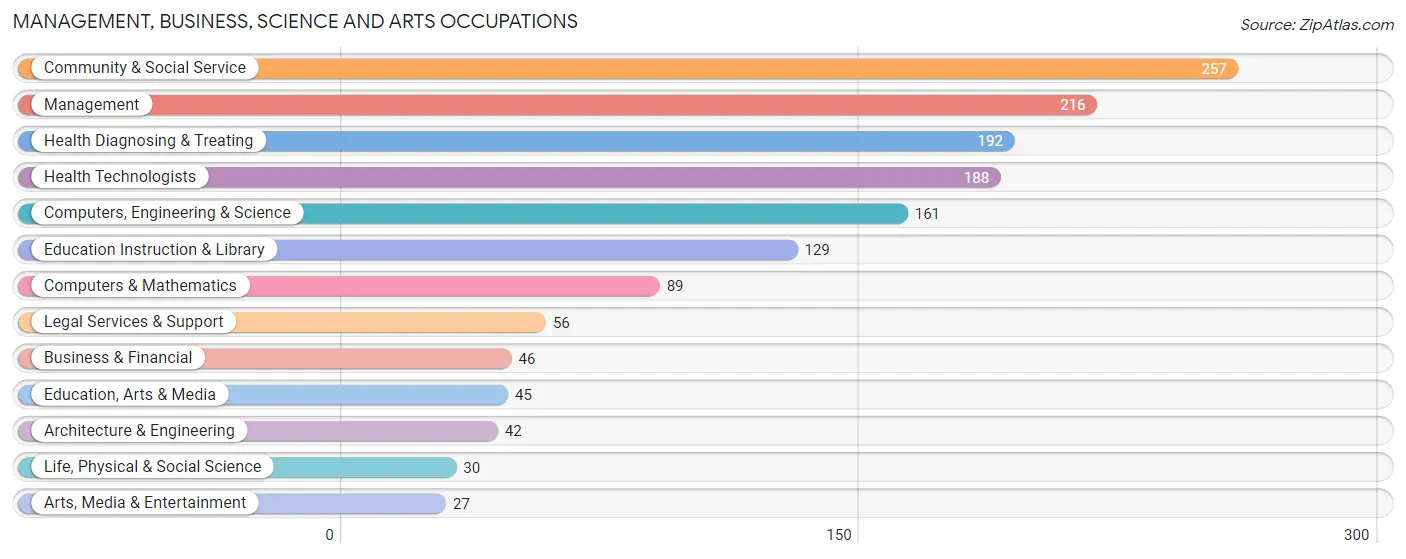
Management, Business, Science and Arts Occupations
The most common Management, Business, Science and Arts occupations in Chester Heights borough are Community & Social Service (257 | 17.7%), Management (216 | 14.9%), Health Diagnosing & Treating (192 | 13.2%), Health Technologists (188 | 12.9%), and Computers, Engineering & Science (161 | 11.1%).
Management, Business, Science and Arts Occupations by Sex
Within the Management, Business, Science and Arts occupations in Chester Heights borough, the most male-oriented occupations are Business & Financial (80.4%), Architecture & Engineering (78.6%), and Computers & Mathematics (71.9%), while the most female-oriented occupations are Education, Arts & Media (91.1%), Health Technologists (86.7%), and Health Diagnosing & Treating (84.9%).
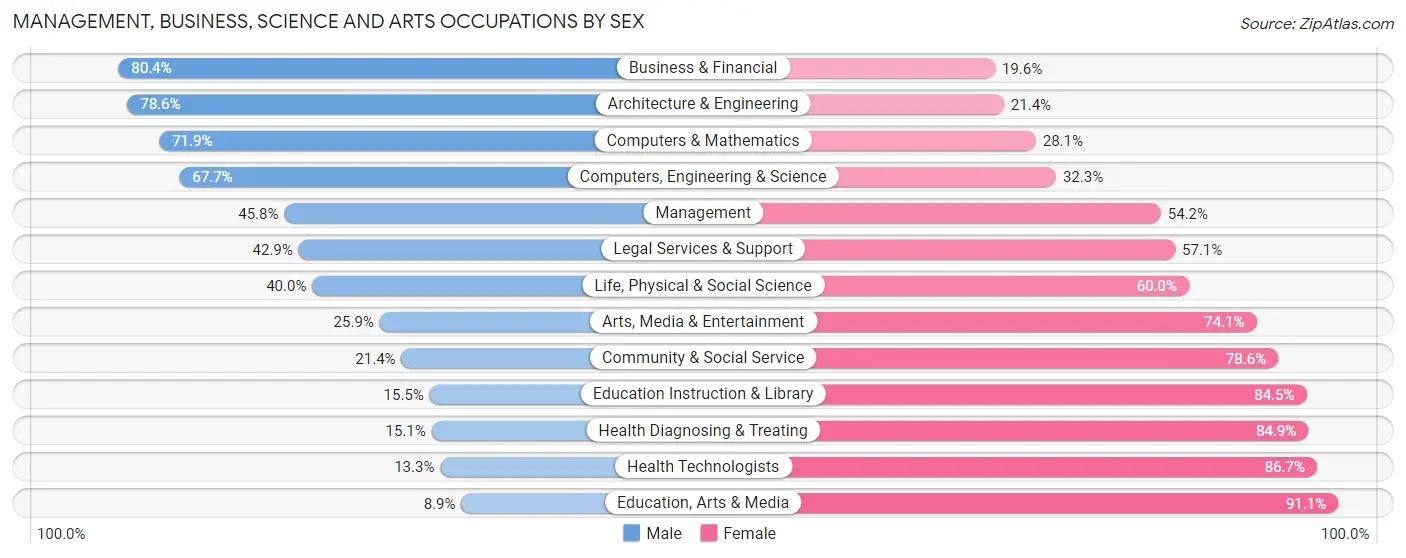
| Occupation | Male | Female |
| Management | 99 (45.8%) | 117 (54.2%) |
| Business & Financial | 37 (80.4%) | 9 (19.6%) |
| Computers, Engineering & Science | 109 (67.7%) | 52 (32.3%) |
| Computers & Mathematics | 64 (71.9%) | 25 (28.1%) |
| Architecture & Engineering | 33 (78.6%) | 9 (21.4%) |
| Life, Physical & Social Science | 12 (40.0%) | 18 (60.0%) |
| Community & Social Service | 55 (21.4%) | 202 (78.6%) |
| Education, Arts & Media | 4 (8.9%) | 41 (91.1%) |
| Legal Services & Support | 24 (42.9%) | 32 (57.1%) |
| Education Instruction & Library | 20 (15.5%) | 109 (84.5%) |
| Arts, Media & Entertainment | 7 (25.9%) | 20 (74.1%) |
| Health Diagnosing & Treating | 29 (15.1%) | 163 (84.9%) |
| Health Technologists | 25 (13.3%) | 163 (86.7%) |
| Total (Category) | 329 (37.7%) | 543 (62.3%) |
| Total (Overall) | 618 (42.5%) | 836 (57.5%) |
Services Occupations
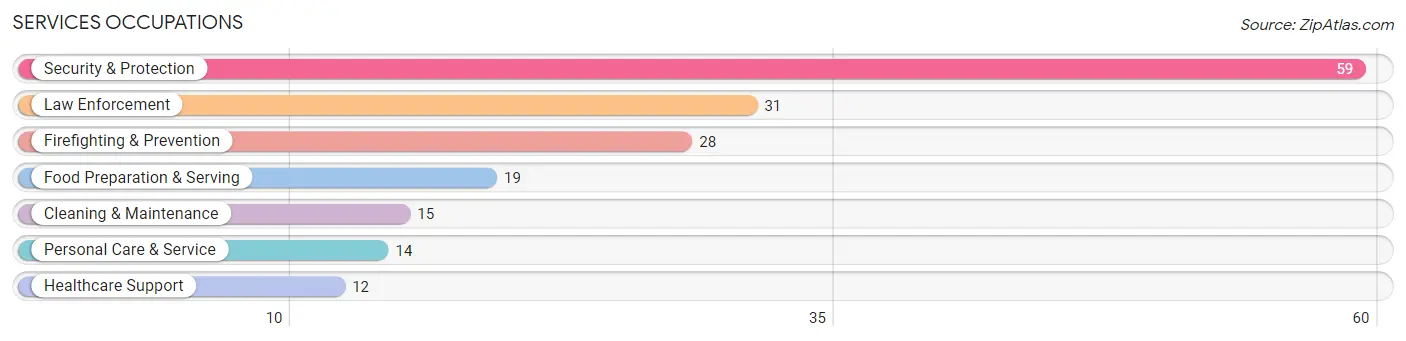
The most common Services occupations in Chester Heights borough are Security & Protection (59 | 4.1%), Law Enforcement (31 | 2.1%), Firefighting & Prevention (28 | 1.9%), Food Preparation & Serving (19 | 1.3%), and Cleaning & Maintenance (15 | 1.0%).
Services Occupations by Sex
Within the Services occupations in Chester Heights borough, the most male-oriented occupations are Law Enforcement (100.0%), Food Preparation & Serving (100.0%), and Security & Protection (69.5%), while the most female-oriented occupations are Healthcare Support (100.0%), Cleaning & Maintenance (100.0%), and Personal Care & Service (100.0%).
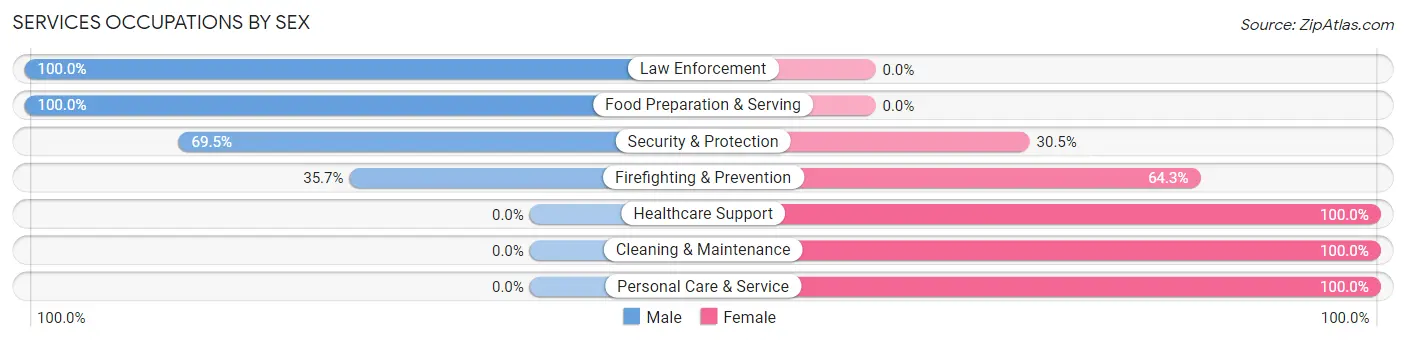
| Occupation | Male | Female |
| Healthcare Support | 0 (0.0%) | 12 (100.0%) |
| Security & Protection | 41 (69.5%) | 18 (30.5%) |
| Firefighting & Prevention | 10 (35.7%) | 18 (64.3%) |
| Law Enforcement | 31 (100.0%) | 0 (0.0%) |
| Food Preparation & Serving | 19 (100.0%) | 0 (0.0%) |
| Cleaning & Maintenance | 0 (0.0%) | 15 (100.0%) |
| Personal Care & Service | 0 (0.0%) | 14 (100.0%) |
| Total (Category) | 60 (50.4%) | 59 (49.6%) |
| Total (Overall) | 618 (42.5%) | 836 (57.5%) |
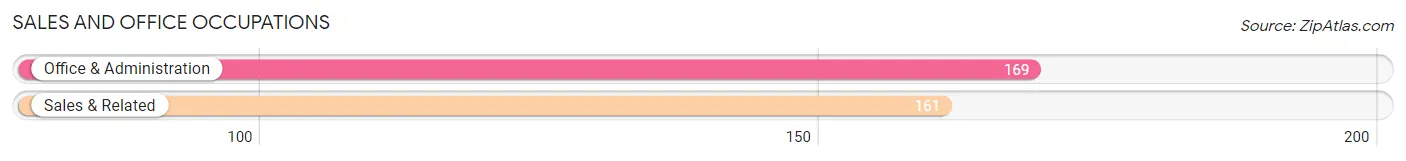
Sales and Office Occupations
The most common Sales and Office occupations in Chester Heights borough are Office & Administration (169 | 11.6%), and Sales & Related (161 | 11.1%).
Sales and Office Occupations by Sex
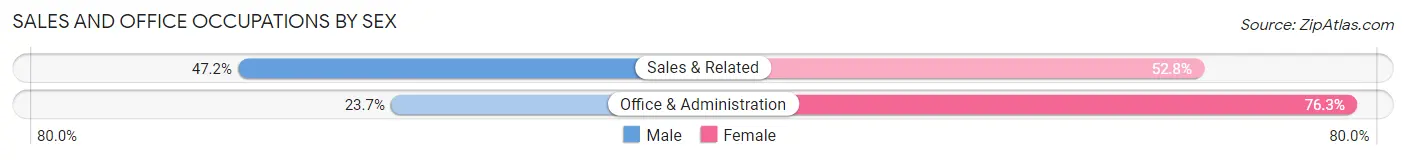
| Occupation | Male | Female |
| Sales & Related | 76 (47.2%) | 85 (52.8%) |
| Office & Administration | 40 (23.7%) | 129 (76.3%) |
| Total (Category) | 116 (35.1%) | 214 (64.8%) |
| Total (Overall) | 618 (42.5%) | 836 (57.5%) |
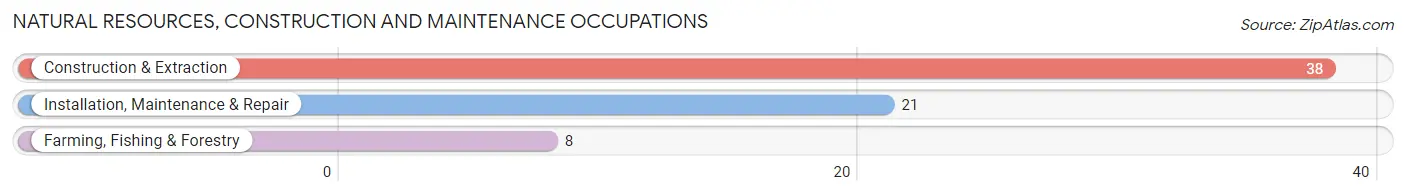
Natural Resources, Construction and Maintenance Occupations
The most common Natural Resources, Construction and Maintenance occupations in Chester Heights borough are Construction & Extraction (38 | 2.6%), Installation, Maintenance & Repair (21 | 1.4%), and Farming, Fishing & Forestry (8 | 0.5%).
Natural Resources, Construction and Maintenance Occupations by Sex
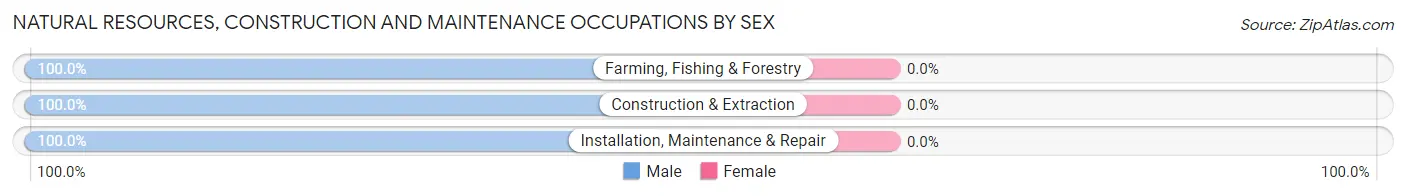
| Occupation | Male | Female |
| Farming, Fishing & Forestry | 8 (100.0%) | 0 (0.0%) |
| Construction & Extraction | 38 (100.0%) | 0 (0.0%) |
| Installation, Maintenance & Repair | 21 (100.0%) | 0 (0.0%) |
| Total (Category) | 67 (100.0%) | 0 (0.0%) |
| Total (Overall) | 618 (42.5%) | 836 (57.5%) |
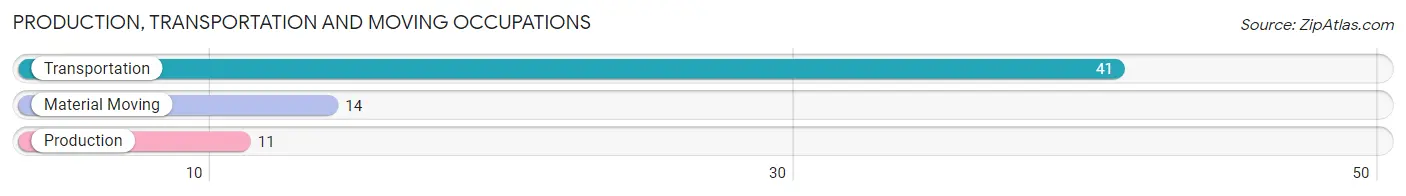
Production, Transportation and Moving Occupations
The most common Production, Transportation and Moving occupations in Chester Heights borough are Transportation (41 | 2.8%), Material Moving (14 | 1.0%), and Production (11 | 0.8%).
Production, Transportation and Moving Occupations by Sex
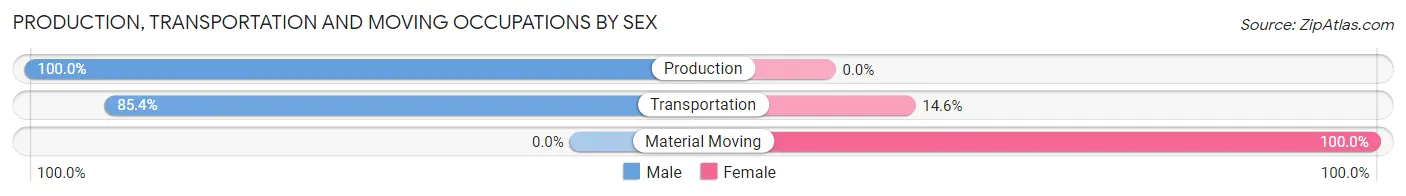
| Occupation | Male | Female |
| Production | 11 (100.0%) | 0 (0.0%) |
| Transportation | 35 (85.4%) | 6 (14.6%) |
| Material Moving | 0 (0.0%) | 14 (100.0%) |
| Total (Category) | 46 (69.7%) | 20 (30.3%) |
| Total (Overall) | 618 (42.5%) | 836 (57.5%) |
Employment Industries by Sex in Chester Heights borough
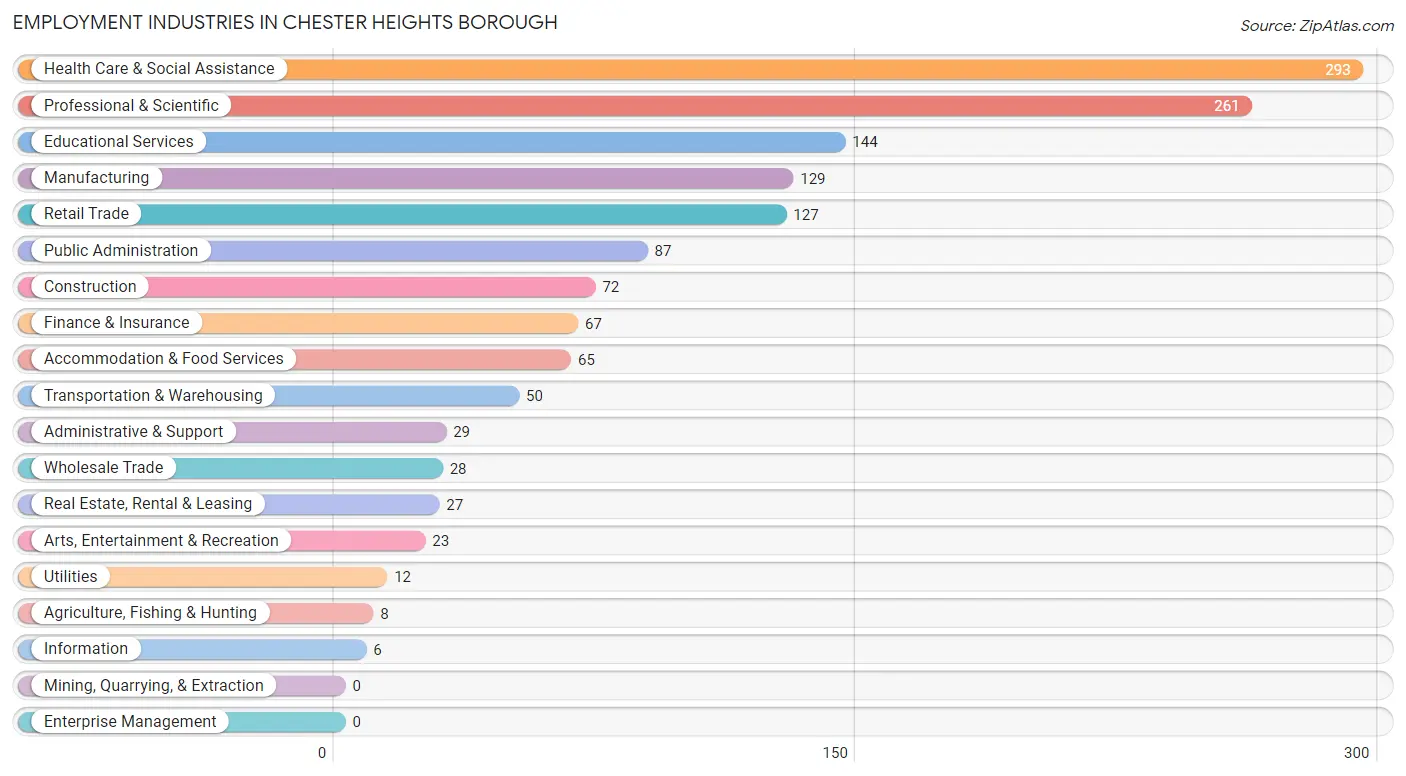
Employment Industries in Chester Heights borough
The major employment industries in Chester Heights borough include Health Care & Social Assistance (293 | 20.2%), Professional & Scientific (261 | 17.9%), Educational Services (144 | 9.9%), Manufacturing (129 | 8.9%), and Retail Trade (127 | 8.7%).
Employment Industries by Sex in Chester Heights borough
The Chester Heights borough industries that see more men than women are Agriculture, Fishing & Hunting (100.0%), Wholesale Trade (100.0%), and Information (100.0%), whereas the industries that tend to have a higher number of women are Health Care & Social Assistance (83.3%), Educational Services (81.2%), and Transportation & Warehousing (80.0%).
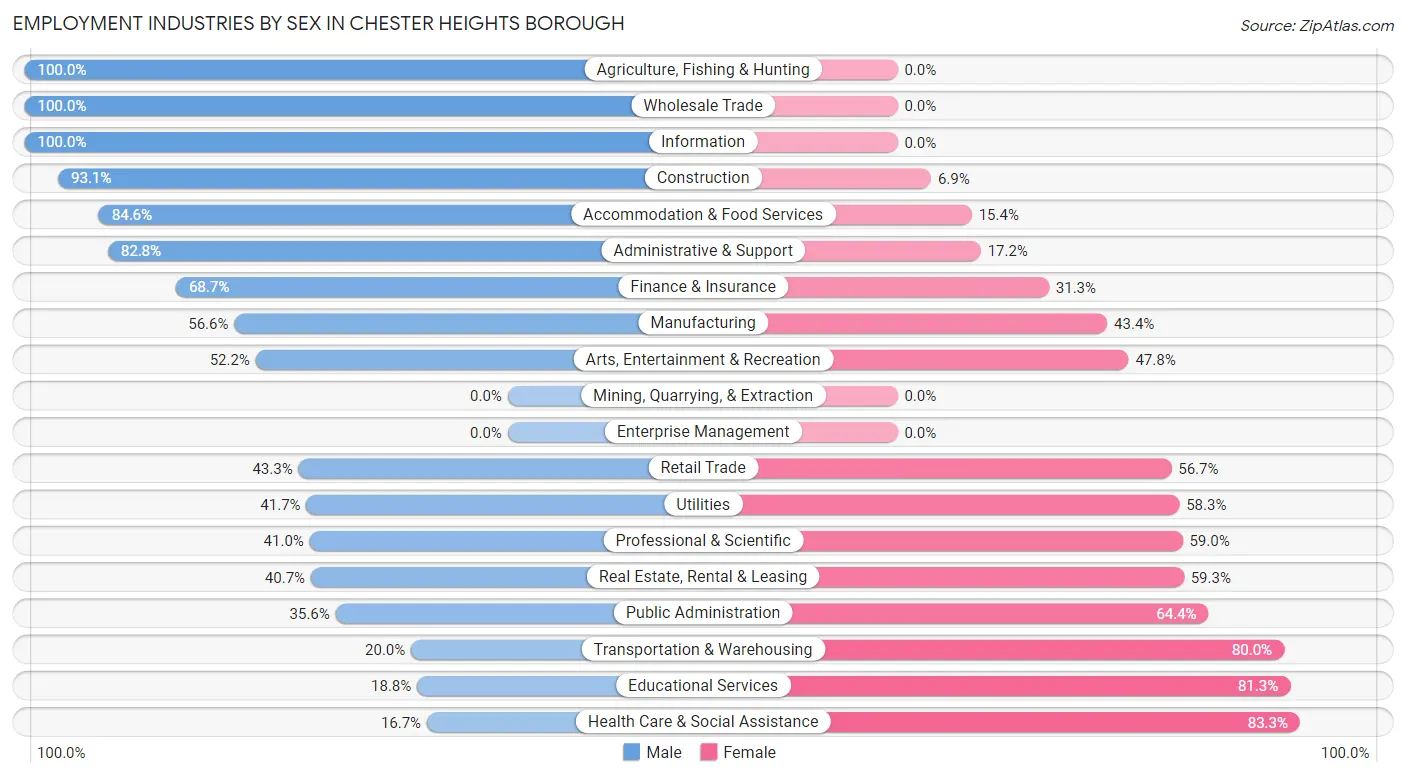
| Industry | Male | Female |
| Agriculture, Fishing & Hunting | 8 (100.0%) | 0 (0.0%) |
| Mining, Quarrying, & Extraction | 0 (0.0%) | 0 (0.0%) |
| Construction | 67 (93.1%) | 5 (6.9%) |
| Manufacturing | 73 (56.6%) | 56 (43.4%) |
| Wholesale Trade | 28 (100.0%) | 0 (0.0%) |
| Retail Trade | 55 (43.3%) | 72 (56.7%) |
| Transportation & Warehousing | 10 (20.0%) | 40 (80.0%) |
| Utilities | 5 (41.7%) | 7 (58.3%) |
| Information | 6 (100.0%) | 0 (0.0%) |
| Finance & Insurance | 46 (68.7%) | 21 (31.3%) |
| Real Estate, Rental & Leasing | 11 (40.7%) | 16 (59.3%) |
| Professional & Scientific | 107 (41.0%) | 154 (59.0%) |
| Enterprise Management | 0 (0.0%) | 0 (0.0%) |
| Administrative & Support | 24 (82.8%) | 5 (17.2%) |
| Educational Services | 27 (18.8%) | 117 (81.2%) |
| Health Care & Social Assistance | 49 (16.7%) | 244 (83.3%) |
| Arts, Entertainment & Recreation | 12 (52.2%) | 11 (47.8%) |
| Accommodation & Food Services | 55 (84.6%) | 10 (15.4%) |
| Public Administration | 31 (35.6%) | 56 (64.4%) |
| Total | 618 (42.5%) | 836 (57.5%) |
Education in Chester Heights borough
School Enrollment in Chester Heights borough
The most common levels of schooling among the 582 students in Chester Heights borough are middle school (161 | 27.7%), elementary school (124 | 21.3%), and high school (124 | 21.3%).
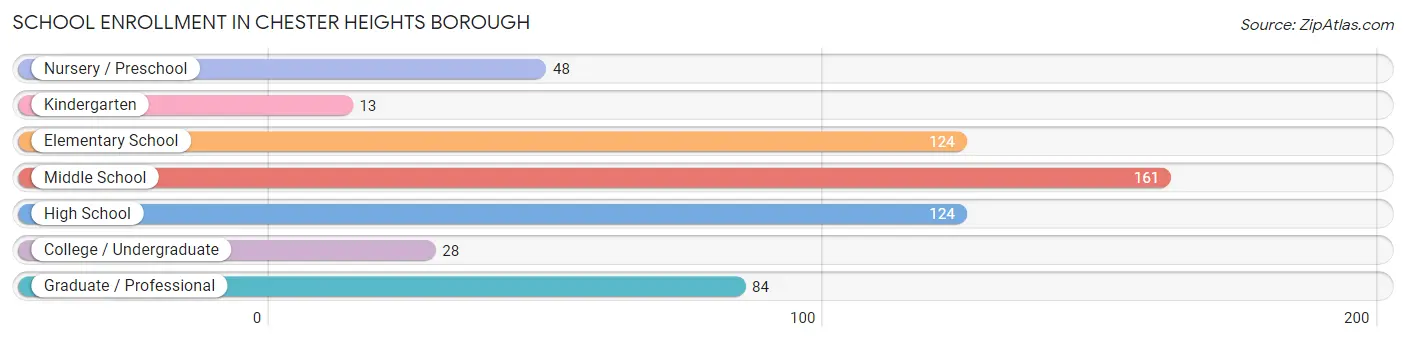
| School Level | # Students | % Students |
| Nursery / Preschool | 48 | 8.3% |
| Kindergarten | 13 | 2.2% |
| Elementary School | 124 | 21.3% |
| Middle School | 161 | 27.7% |
| High School | 124 | 21.3% |
| College / Undergraduate | 28 | 4.8% |
| Graduate / Professional | 84 | 14.4% |
| Total | 582 | 100.0% |
School Enrollment by Age by Funding Source in Chester Heights borough
Out of a total of 582 students who are enrolled in schools in Chester Heights borough, 130 (22.3%) attend a private institution, while the remaining 452 (77.7%) are enrolled in public schools. The age group of 20 to 24 year olds has the highest likelihood of being enrolled in private schools, with 14 (100.0% in the age bracket) enrolled. Conversely, the age group of 15 to 17 year olds has the lowest likelihood of being enrolled in a private school, with 96 (100.0% in the age bracket) attending a public institution.
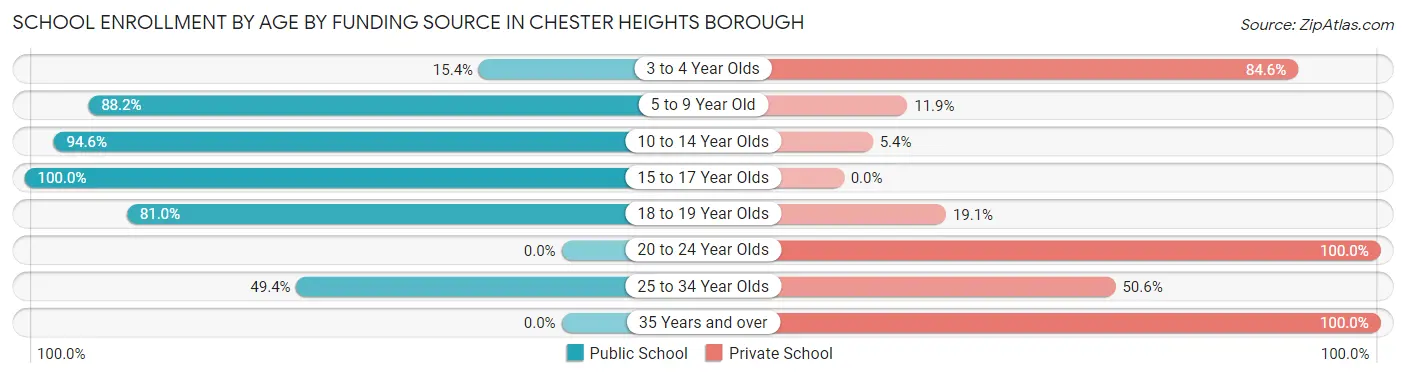
| Age Bracket | Public School | Private School |
| 3 to 4 Year Olds | 6 (15.4%) | 33 (84.6%) |
| 5 to 9 Year Old | 119 (88.1%) | 16 (11.8%) |
| 10 to 14 Year Olds | 175 (94.6%) | 10 (5.4%) |
| 15 to 17 Year Olds | 96 (100.0%) | 0 (0.0%) |
| 18 to 19 Year Olds | 17 (80.9%) | 4 (19.1%) |
| 20 to 24 Year Olds | 0 (0.0%) | 14 (100.0%) |
| 25 to 34 Year Olds | 39 (49.4%) | 40 (50.6%) |
| 35 Years and over | 0 (0.0%) | 13 (100.0%) |
| Total | 452 (77.7%) | 130 (22.3%) |
Educational Attainment by Field of Study in Chester Heights borough
Business (232 | 17.9%), education (208 | 16.0%), science & technology (204 | 15.7%), bio, nature & agricultural (148 | 11.4%), and engineering (90 | 6.9%) are the most common fields of study among 1,297 individuals in Chester Heights borough who have obtained a bachelor's degree or higher.
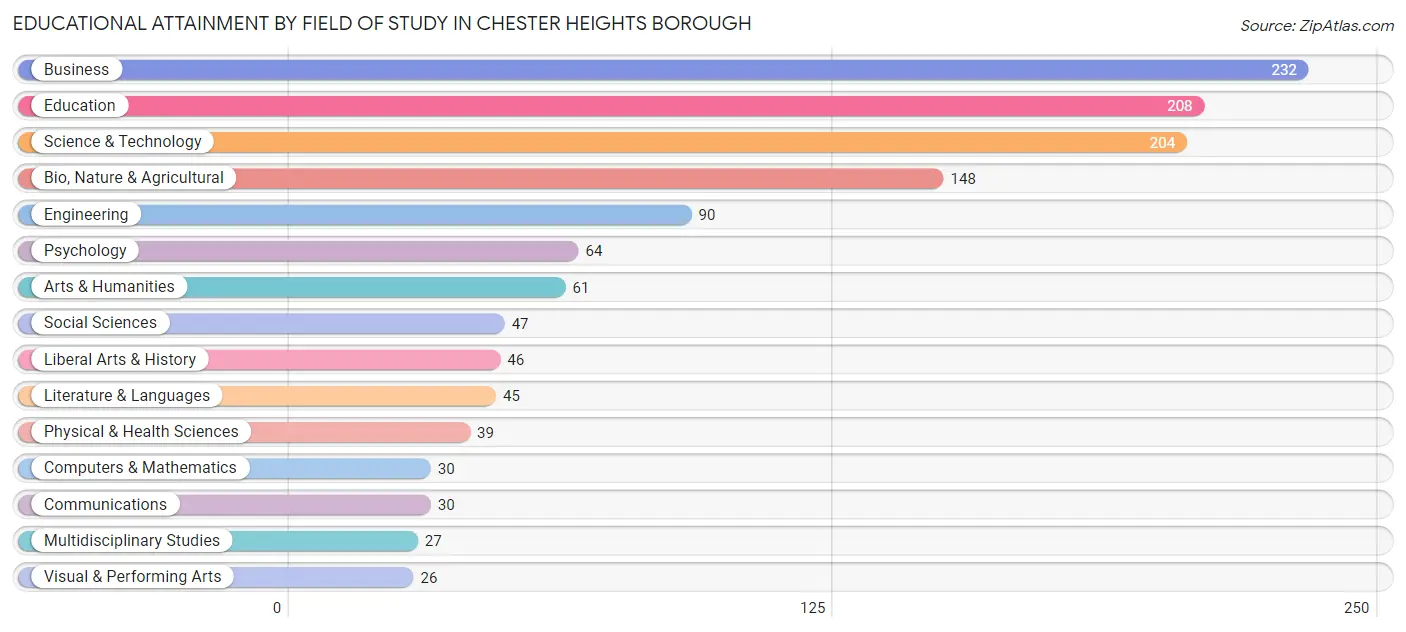
| Field of Study | # Graduates | % Graduates |
| Computers & Mathematics | 30 | 2.3% |
| Bio, Nature & Agricultural | 148 | 11.4% |
| Physical & Health Sciences | 39 | 3.0% |
| Psychology | 64 | 4.9% |
| Social Sciences | 47 | 3.6% |
| Engineering | 90 | 6.9% |
| Multidisciplinary Studies | 27 | 2.1% |
| Science & Technology | 204 | 15.7% |
| Business | 232 | 17.9% |
| Education | 208 | 16.0% |
| Literature & Languages | 45 | 3.5% |
| Liberal Arts & History | 46 | 3.5% |
| Visual & Performing Arts | 26 | 2.0% |
| Communications | 30 | 2.3% |
| Arts & Humanities | 61 | 4.7% |
| Total | 1,297 | 100.0% |
Transportation & Commute in Chester Heights borough
Vehicle Availability by Sex in Chester Heights borough
The most prevalent vehicle ownership categories in Chester Heights borough are males with 2 vehicles (344, accounting for 57.1%) and females with 2 vehicles (367, making up 41.4%).
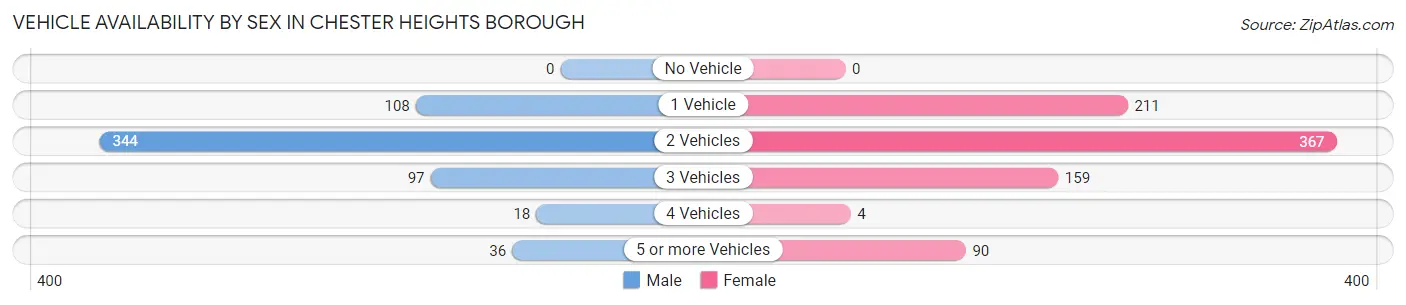
| Vehicles Available | Male | Female |
| No Vehicle | 0 (0.0%) | 0 (0.0%) |
| 1 Vehicle | 108 (17.9%) | 211 (25.4%) |
| 2 Vehicles | 344 (57.1%) | 367 (44.2%) |
| 3 Vehicles | 97 (16.1%) | 159 (19.1%) |
| 4 Vehicles | 18 (3.0%) | 4 (0.5%) |
| 5 or more Vehicles | 36 (6.0%) | 90 (10.8%) |
| Total | 603 (100.0%) | 831 (100.0%) |
Commute Time in Chester Heights borough
The most frequently occuring commute durations in Chester Heights borough are 30 to 34 minutes (279 commuters, 24.5%), 15 to 19 minutes (202 commuters, 17.7%), and 45 to 59 minutes (114 commuters, 10.0%).
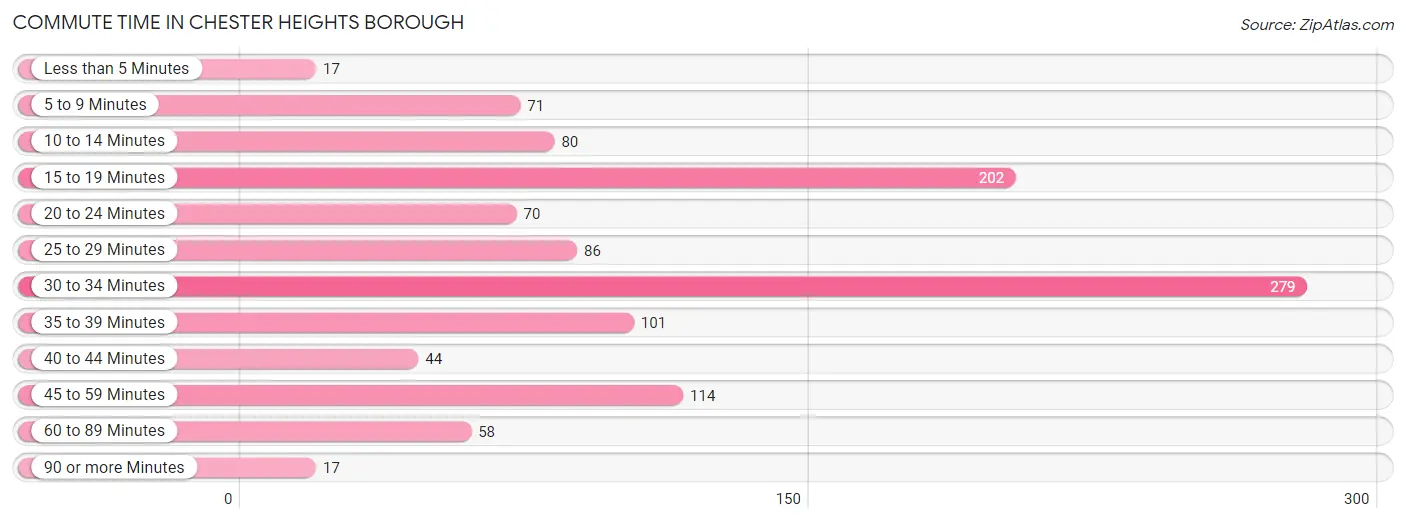
| Commute Time | # Commuters | % Commuters |
| Less than 5 Minutes | 17 | 1.5% |
| 5 to 9 Minutes | 71 | 6.2% |
| 10 to 14 Minutes | 80 | 7.0% |
| 15 to 19 Minutes | 202 | 17.7% |
| 20 to 24 Minutes | 70 | 6.1% |
| 25 to 29 Minutes | 86 | 7.5% |
| 30 to 34 Minutes | 279 | 24.5% |
| 35 to 39 Minutes | 101 | 8.9% |
| 40 to 44 Minutes | 44 | 3.9% |
| 45 to 59 Minutes | 114 | 10.0% |
| 60 to 89 Minutes | 58 | 5.1% |
| 90 or more Minutes | 17 | 1.5% |
Commute Time by Sex in Chester Heights borough
The most common commute times in Chester Heights borough are 30 to 34 minutes (95 commuters, 21.2%) for males and 30 to 34 minutes (184 commuters, 26.6%) for females.
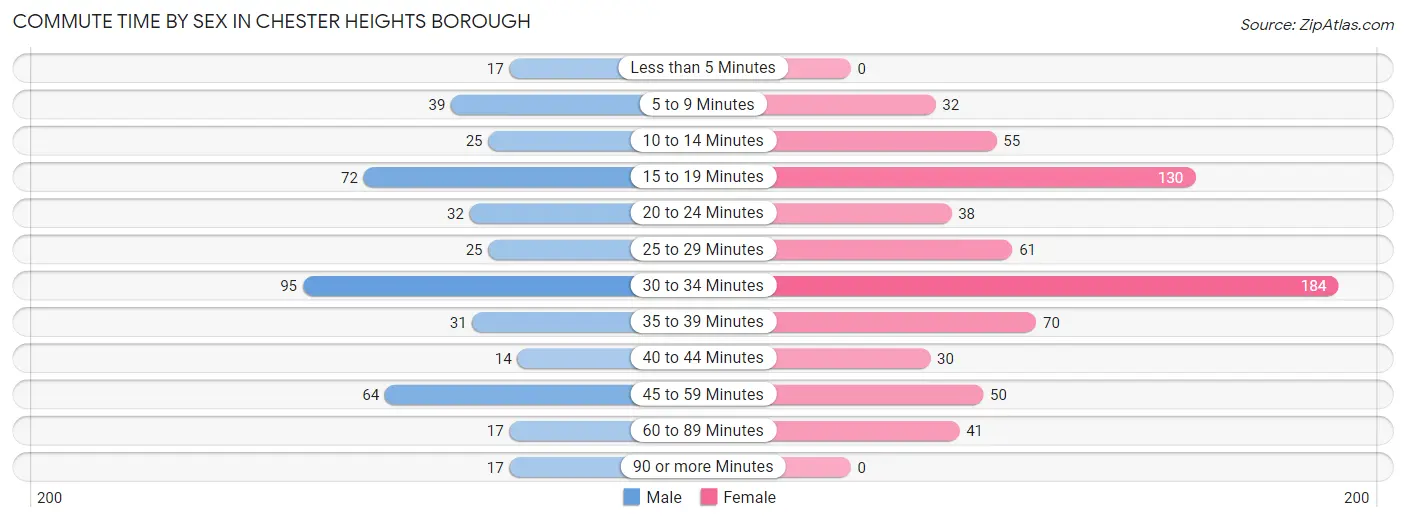
| Commute Time | Male | Female |
| Less than 5 Minutes | 17 (3.8%) | 0 (0.0%) |
| 5 to 9 Minutes | 39 (8.7%) | 32 (4.6%) |
| 10 to 14 Minutes | 25 (5.6%) | 55 (8.0%) |
| 15 to 19 Minutes | 72 (16.1%) | 130 (18.8%) |
| 20 to 24 Minutes | 32 (7.1%) | 38 (5.5%) |
| 25 to 29 Minutes | 25 (5.6%) | 61 (8.8%) |
| 30 to 34 Minutes | 95 (21.2%) | 184 (26.6%) |
| 35 to 39 Minutes | 31 (6.9%) | 70 (10.1%) |
| 40 to 44 Minutes | 14 (3.1%) | 30 (4.3%) |
| 45 to 59 Minutes | 64 (14.3%) | 50 (7.2%) |
| 60 to 89 Minutes | 17 (3.8%) | 41 (5.9%) |
| 90 or more Minutes | 17 (3.8%) | 0 (0.0%) |
Time of Departure to Work by Sex in Chester Heights borough
The most frequent times of departure to work in Chester Heights borough are 6:00 AM to 6:29 AM (73, 16.3%) for males and 7:00 AM to 7:29 AM (178, 25.8%) for females.
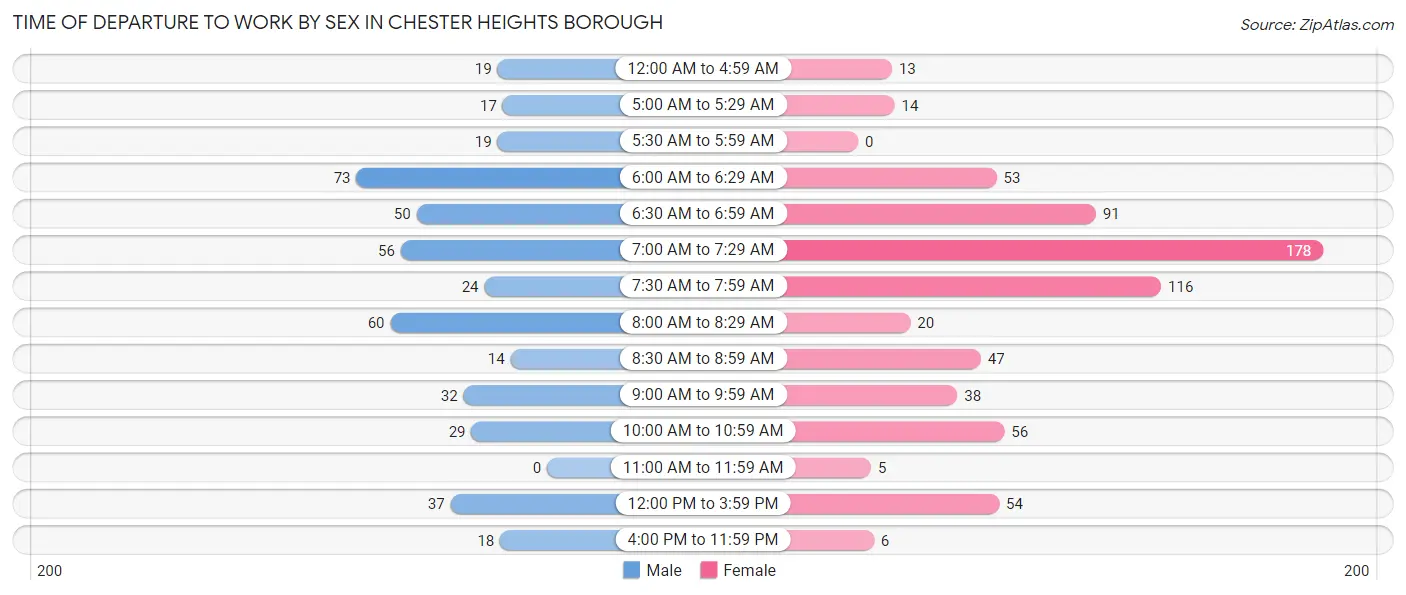
| Time of Departure | Male | Female |
| 12:00 AM to 4:59 AM | 19 (4.2%) | 13 (1.9%) |
| 5:00 AM to 5:29 AM | 17 (3.8%) | 14 (2.0%) |
| 5:30 AM to 5:59 AM | 19 (4.2%) | 0 (0.0%) |
| 6:00 AM to 6:29 AM | 73 (16.3%) | 53 (7.7%) |
| 6:30 AM to 6:59 AM | 50 (11.2%) | 91 (13.2%) |
| 7:00 AM to 7:29 AM | 56 (12.5%) | 178 (25.8%) |
| 7:30 AM to 7:59 AM | 24 (5.4%) | 116 (16.8%) |
| 8:00 AM to 8:29 AM | 60 (13.4%) | 20 (2.9%) |
| 8:30 AM to 8:59 AM | 14 (3.1%) | 47 (6.8%) |
| 9:00 AM to 9:59 AM | 32 (7.1%) | 38 (5.5%) |
| 10:00 AM to 10:59 AM | 29 (6.5%) | 56 (8.1%) |
| 11:00 AM to 11:59 AM | 0 (0.0%) | 5 (0.7%) |
| 12:00 PM to 3:59 PM | 37 (8.3%) | 54 (7.8%) |
| 4:00 PM to 11:59 PM | 18 (4.0%) | 6 (0.9%) |
| Total | 448 (100.0%) | 691 (100.0%) |
Housing Occupancy in Chester Heights borough
Occupancy by Ownership in Chester Heights borough
Of the total 1,336 dwellings in Chester Heights borough, owner-occupied units account for 932 (69.8%), while renter-occupied units make up 404 (30.2%).
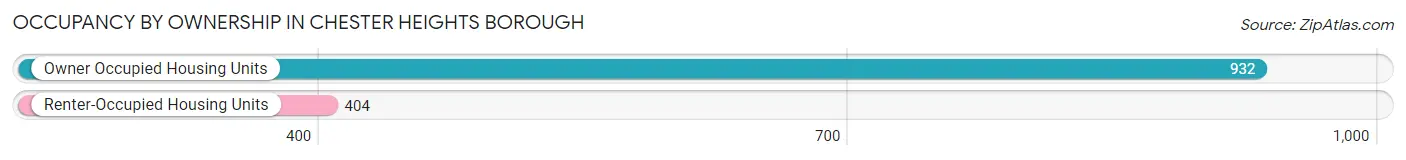
| Occupancy | # Housing Units | % Housing Units |
| Owner Occupied Housing Units | 932 | 69.8% |
| Renter-Occupied Housing Units | 404 | 30.2% |
| Total Occupied Housing Units | 1,336 | 100.0% |
Occupancy by Household Size in Chester Heights borough
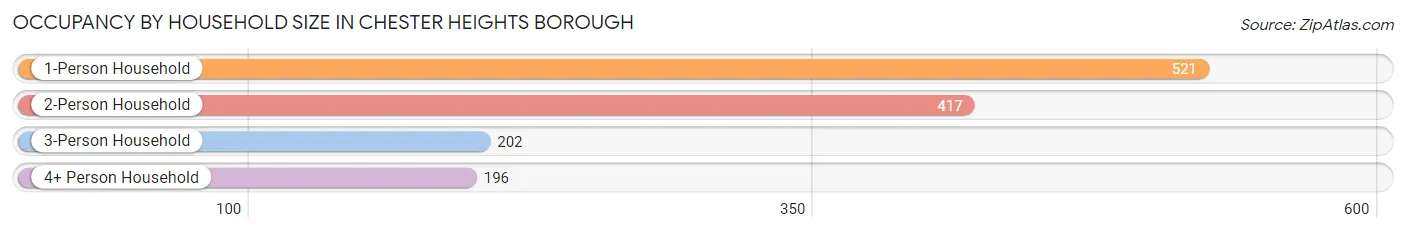
| Household Size | # Housing Units | % Housing Units |
| 1-Person Household | 521 | 39.0% |
| 2-Person Household | 417 | 31.2% |
| 3-Person Household | 202 | 15.1% |
| 4+ Person Household | 196 | 14.7% |
| Total Housing Units | 1,336 | 100.0% |
Occupancy by Ownership by Household Size in Chester Heights borough
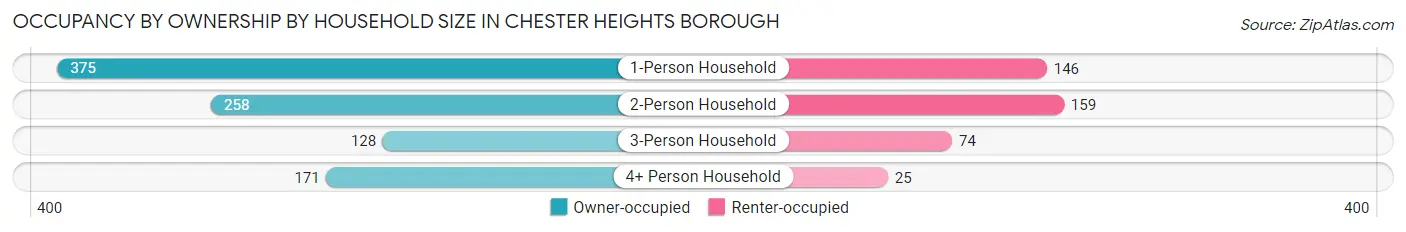
| Household Size | Owner-occupied | Renter-occupied |
| 1-Person Household | 375 (72.0%) | 146 (28.0%) |
| 2-Person Household | 258 (61.9%) | 159 (38.1%) |
| 3-Person Household | 128 (63.4%) | 74 (36.6%) |
| 4+ Person Household | 171 (87.2%) | 25 (12.8%) |
| Total Housing Units | 932 (69.8%) | 404 (30.2%) |
Occupancy by Educational Attainment in Chester Heights borough
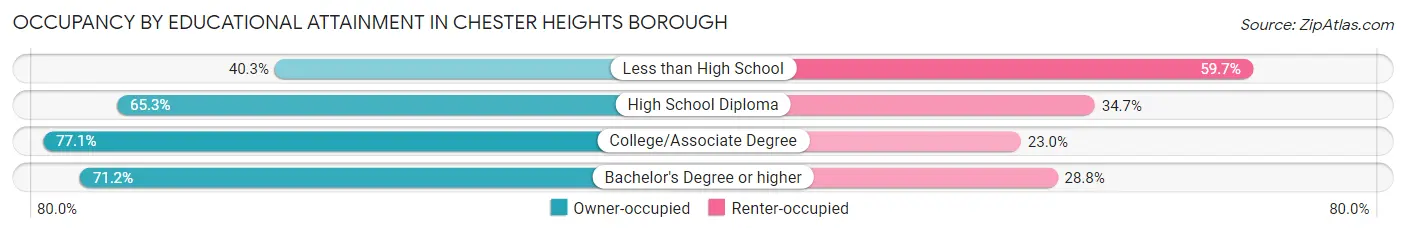
| Household Size | Owner-occupied | Renter-occupied |
| Less than High School | 25 (40.3%) | 37 (59.7%) |
| High School Diploma | 162 (65.3%) | 86 (34.7%) |
| College/Associate Degree | 188 (77.0%) | 56 (23.0%) |
| Bachelor's Degree or higher | 557 (71.2%) | 225 (28.8%) |
Occupancy by Age of Householder in Chester Heights borough
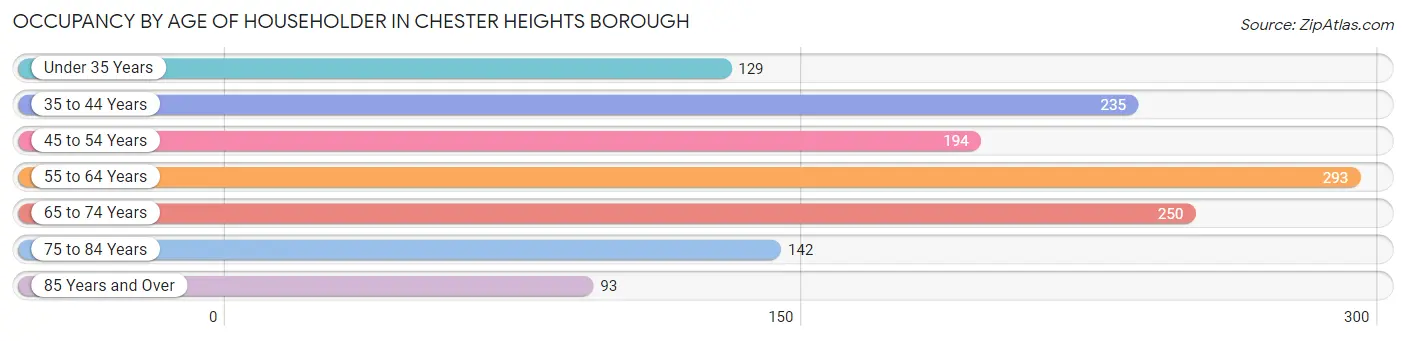
| Age Bracket | # Households | % Households |
| Under 35 Years | 129 | 9.7% |
| 35 to 44 Years | 235 | 17.6% |
| 45 to 54 Years | 194 | 14.5% |
| 55 to 64 Years | 293 | 21.9% |
| 65 to 74 Years | 250 | 18.7% |
| 75 to 84 Years | 142 | 10.6% |
| 85 Years and Over | 93 | 7.0% |
| Total | 1,336 | 100.0% |
Housing Finances in Chester Heights borough
Median Income by Occupancy in Chester Heights borough
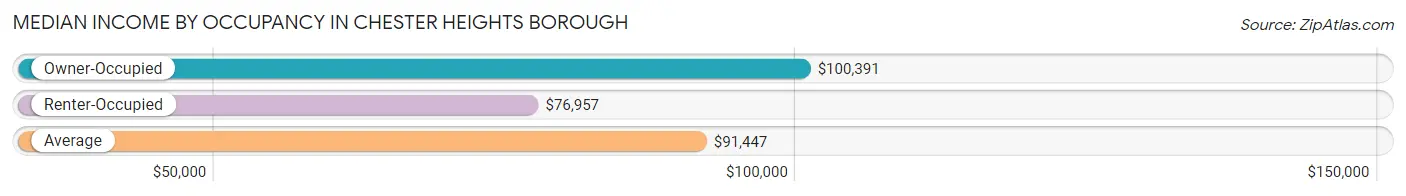
| Occupancy Type | # Households | Median Income |
| Owner-Occupied | 932 (69.8%) | $100,391 |
| Renter-Occupied | 404 (30.2%) | $76,957 |
| Average | 1,336 (100.0%) | $91,447 |
Occupancy by Householder Income Bracket in Chester Heights borough
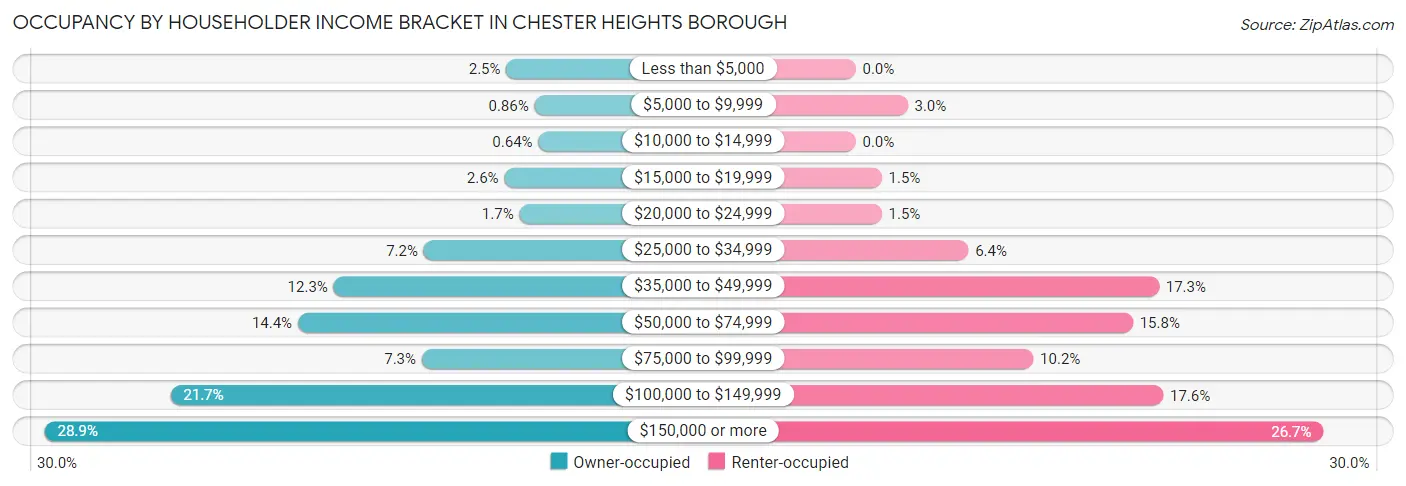
| Income Bracket | Owner-occupied | Renter-occupied |
| Less than $5,000 | 23 (2.5%) | 0 (0.0%) |
| $5,000 to $9,999 | 8 (0.9%) | 12 (3.0%) |
| $10,000 to $14,999 | 6 (0.6%) | 0 (0.0%) |
| $15,000 to $19,999 | 24 (2.6%) | 6 (1.5%) |
| $20,000 to $24,999 | 16 (1.7%) | 6 (1.5%) |
| $25,000 to $34,999 | 67 (7.2%) | 26 (6.4%) |
| $35,000 to $49,999 | 115 (12.3%) | 70 (17.3%) |
| $50,000 to $74,999 | 134 (14.4%) | 64 (15.8%) |
| $75,000 to $99,999 | 68 (7.3%) | 41 (10.2%) |
| $100,000 to $149,999 | 202 (21.7%) | 71 (17.6%) |
| $150,000 or more | 269 (28.9%) | 108 (26.7%) |
| Total | 932 (100.0%) | 404 (100.0%) |
Monthly Housing Cost Tiers in Chester Heights borough
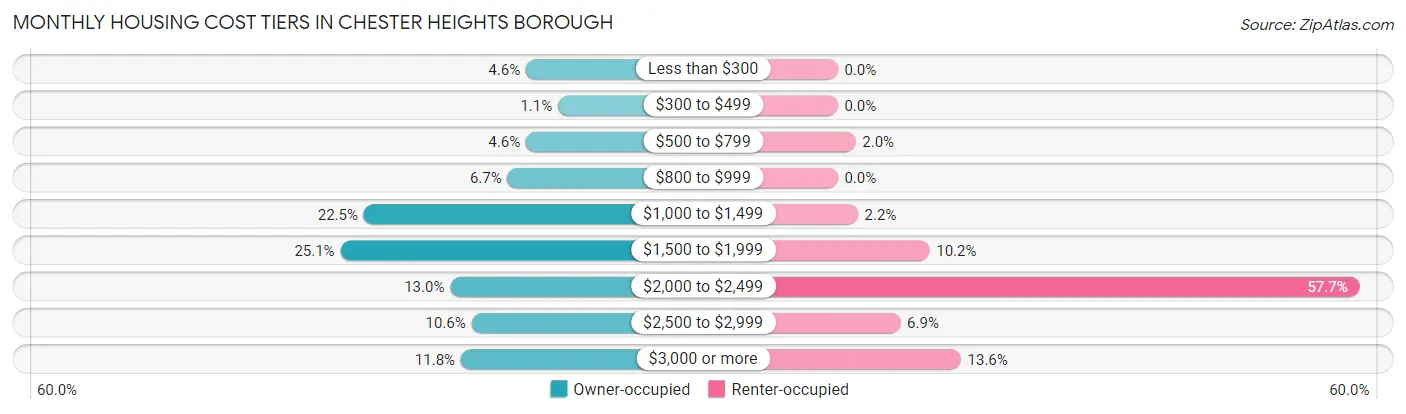
| Monthly Cost | Owner-occupied | Renter-occupied |
| Less than $300 | 43 (4.6%) | 0 (0.0%) |
| $300 to $499 | 10 (1.1%) | 0 (0.0%) |
| $500 to $799 | 43 (4.6%) | 8 (2.0%) |
| $800 to $999 | 62 (6.7%) | 0 (0.0%) |
| $1,000 to $1,499 | 210 (22.5%) | 9 (2.2%) |
| $1,500 to $1,999 | 234 (25.1%) | 41 (10.2%) |
| $2,000 to $2,499 | 121 (13.0%) | 233 (57.7%) |
| $2,500 to $2,999 | 99 (10.6%) | 28 (6.9%) |
| $3,000 or more | 110 (11.8%) | 55 (13.6%) |
| Total | 932 (100.0%) | 404 (100.0%) |
Physical Housing Characteristics in Chester Heights borough
Housing Structures in Chester Heights borough
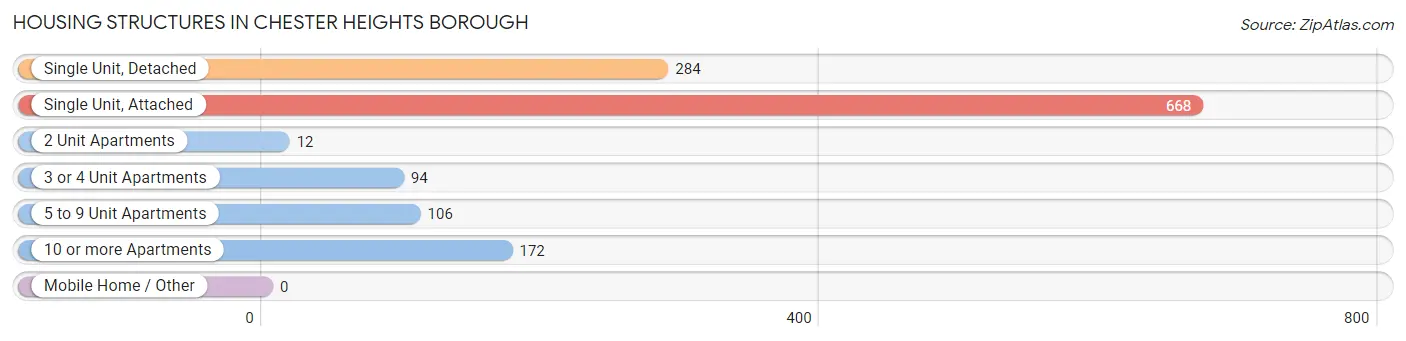
| Structure Type | # Housing Units | % Housing Units |
| Single Unit, Detached | 284 | 21.3% |
| Single Unit, Attached | 668 | 50.0% |
| 2 Unit Apartments | 12 | 0.9% |
| 3 or 4 Unit Apartments | 94 | 7.0% |
| 5 to 9 Unit Apartments | 106 | 7.9% |
| 10 or more Apartments | 172 | 12.9% |
| Mobile Home / Other | 0 | 0.0% |
| Total | 1,336 | 100.0% |
Housing Structures by Occupancy in Chester Heights borough
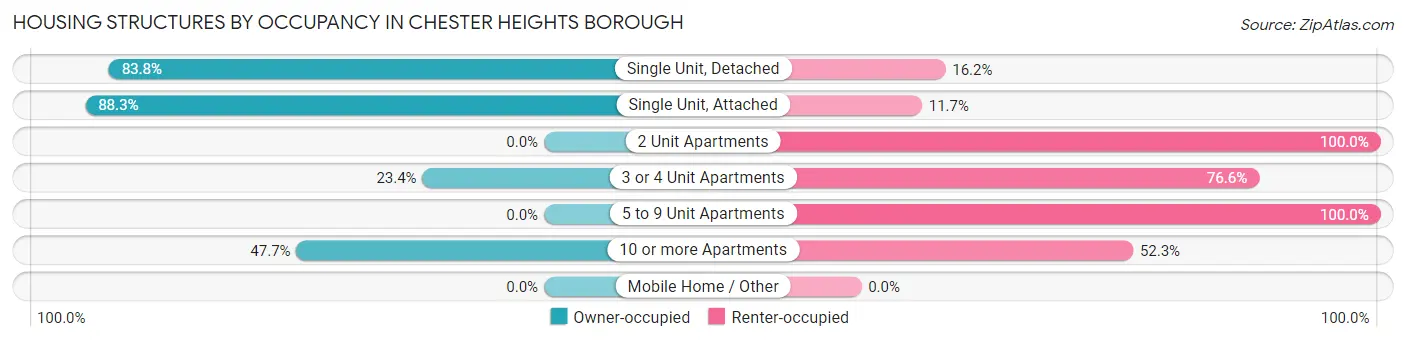
| Structure Type | Owner-occupied | Renter-occupied |
| Single Unit, Detached | 238 (83.8%) | 46 (16.2%) |
| Single Unit, Attached | 590 (88.3%) | 78 (11.7%) |
| 2 Unit Apartments | 0 (0.0%) | 12 (100.0%) |
| 3 or 4 Unit Apartments | 22 (23.4%) | 72 (76.6%) |
| 5 to 9 Unit Apartments | 0 (0.0%) | 106 (100.0%) |
| 10 or more Apartments | 82 (47.7%) | 90 (52.3%) |
| Mobile Home / Other | 0 (0.0%) | 0 (0.0%) |
| Total | 932 (69.8%) | 404 (30.2%) |
Housing Structures by Number of Rooms in Chester Heights borough
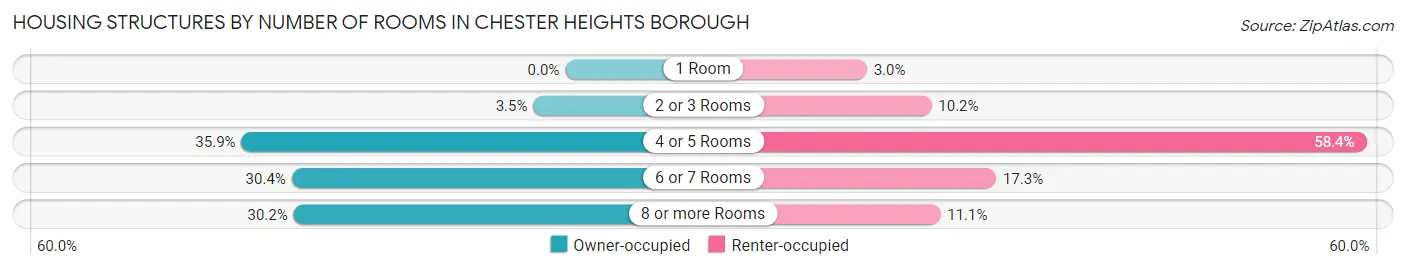
| Number of Rooms | Owner-occupied | Renter-occupied |
| 1 Room | 0 (0.0%) | 12 (3.0%) |
| 2 or 3 Rooms | 33 (3.5%) | 41 (10.2%) |
| 4 or 5 Rooms | 335 (35.9%) | 236 (58.4%) |
| 6 or 7 Rooms | 283 (30.4%) | 70 (17.3%) |
| 8 or more Rooms | 281 (30.1%) | 45 (11.1%) |
| Total | 932 (100.0%) | 404 (100.0%) |
Housing Structure by Heating Type in Chester Heights borough
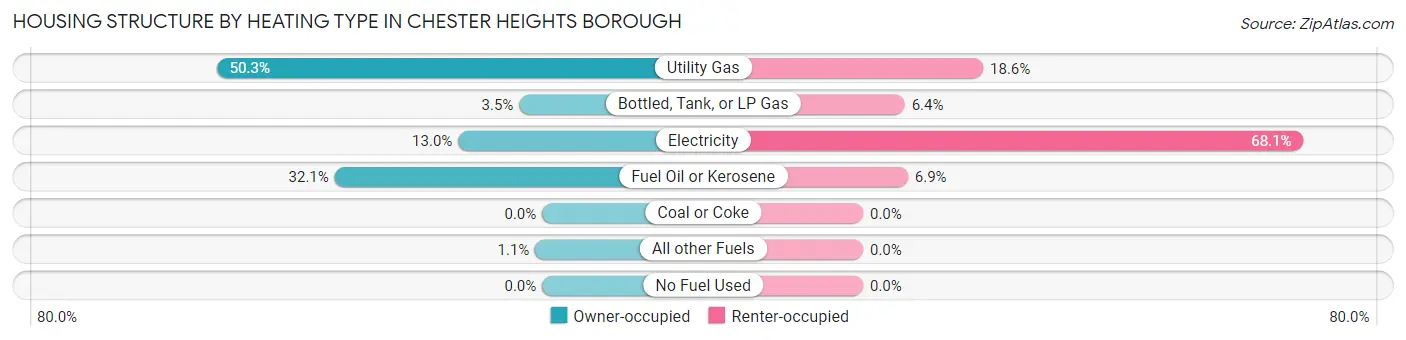
| Heating Type | Owner-occupied | Renter-occupied |
| Utility Gas | 469 (50.3%) | 75 (18.6%) |
| Bottled, Tank, or LP Gas | 33 (3.5%) | 26 (6.4%) |
| Electricity | 121 (13.0%) | 275 (68.1%) |
| Fuel Oil or Kerosene | 299 (32.1%) | 28 (6.9%) |
| Coal or Coke | 0 (0.0%) | 0 (0.0%) |
| All other Fuels | 10 (1.1%) | 0 (0.0%) |
| No Fuel Used | 0 (0.0%) | 0 (0.0%) |
| Total | 932 (100.0%) | 404 (100.0%) |
Household Vehicle Usage in Chester Heights borough
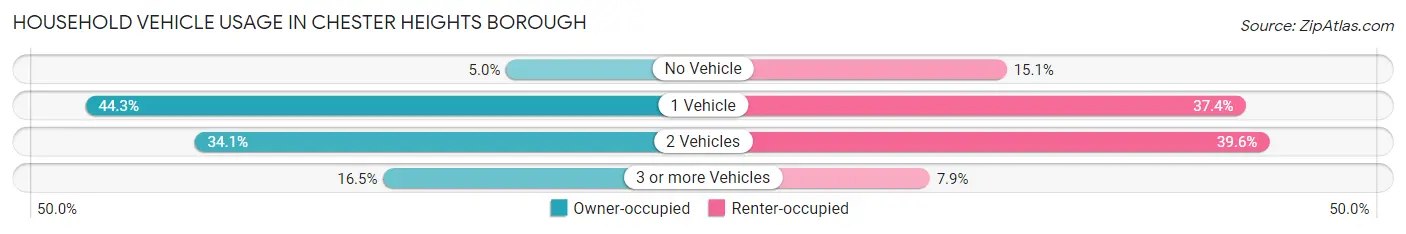
| Vehicles per Household | Owner-occupied | Renter-occupied |
| No Vehicle | 47 (5.0%) | 61 (15.1%) |
| 1 Vehicle | 413 (44.3%) | 151 (37.4%) |
| 2 Vehicles | 318 (34.1%) | 160 (39.6%) |
| 3 or more Vehicles | 154 (16.5%) | 32 (7.9%) |
| Total | 932 (100.0%) | 404 (100.0%) |
Real Estate & Mortgages in Chester Heights borough
Real Estate and Mortgage Overview in Chester Heights borough
| Characteristic | Without Mortgage | With Mortgage |
| Housing Units | 235 | 697 |
| Median Property Value | $272,600 | $289,500 |
| Median Household Income | $49,063 | $248 |
| Monthly Housing Costs | $932 | $110 |
| Real Estate Taxes | $5,519 | $17 |
Property Value by Mortgage Status in Chester Heights borough
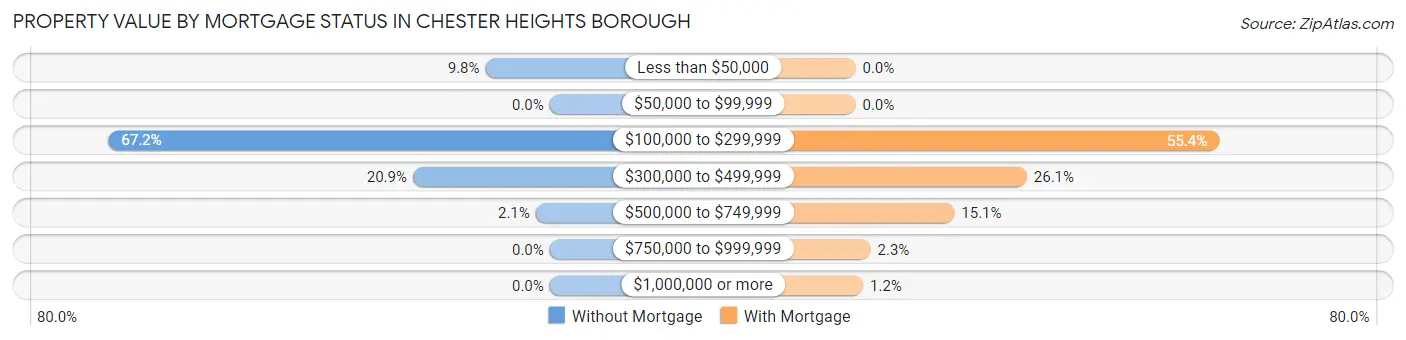
| Property Value | Without Mortgage | With Mortgage |
| Less than $50,000 | 23 (9.8%) | 0 (0.0%) |
| $50,000 to $99,999 | 0 (0.0%) | 0 (0.0%) |
| $100,000 to $299,999 | 158 (67.2%) | 386 (55.4%) |
| $300,000 to $499,999 | 49 (20.8%) | 182 (26.1%) |
| $500,000 to $749,999 | 5 (2.1%) | 105 (15.1%) |
| $750,000 to $999,999 | 0 (0.0%) | 16 (2.3%) |
| $1,000,000 or more | 0 (0.0%) | 8 (1.1%) |
| Total | 235 (100.0%) | 697 (100.0%) |
Household Income by Mortgage Status in Chester Heights borough
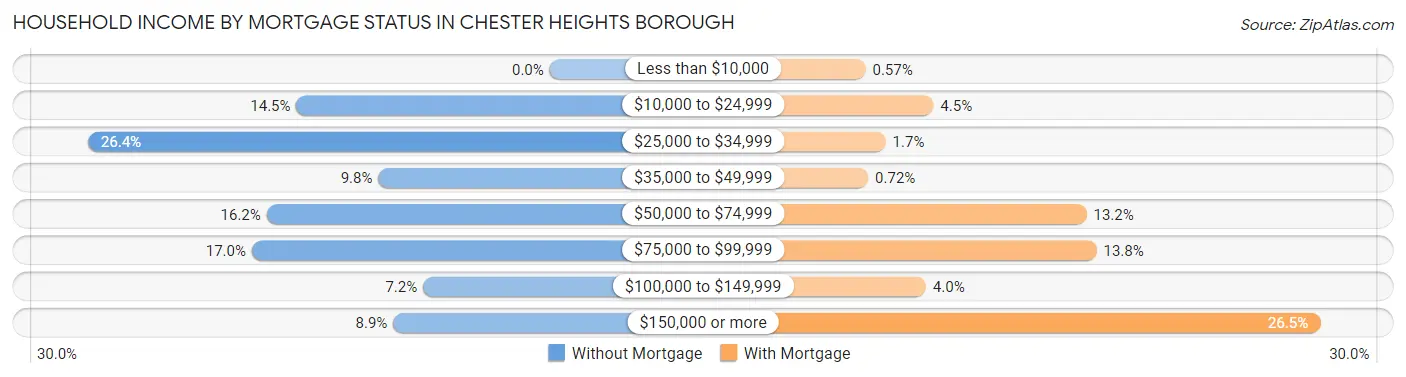
| Household Income | Without Mortgage | With Mortgage |
| Less than $10,000 | 0 (0.0%) | 4 (0.6%) |
| $10,000 to $24,999 | 34 (14.5%) | 31 (4.4%) |
| $25,000 to $34,999 | 62 (26.4%) | 12 (1.7%) |
| $35,000 to $49,999 | 23 (9.8%) | 5 (0.7%) |
| $50,000 to $74,999 | 38 (16.2%) | 92 (13.2%) |
| $75,000 to $99,999 | 40 (17.0%) | 96 (13.8%) |
| $100,000 to $149,999 | 17 (7.2%) | 28 (4.0%) |
| $150,000 or more | 21 (8.9%) | 185 (26.5%) |
| Total | 235 (100.0%) | 697 (100.0%) |
Property Value to Household Income Ratio in Chester Heights borough
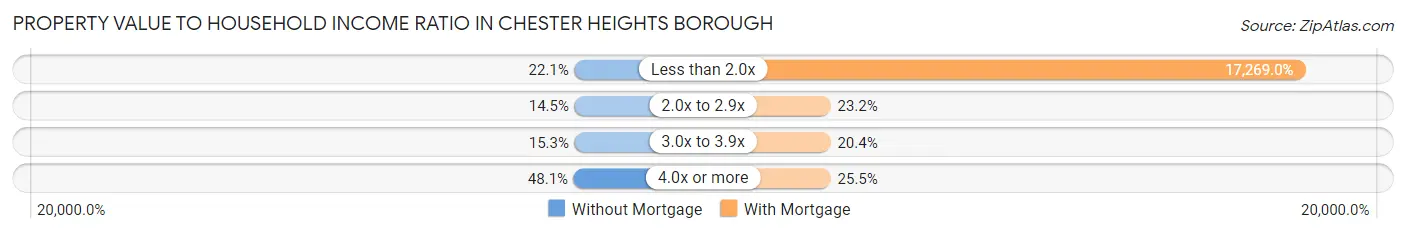
| Value-to-Income Ratio | Without Mortgage | With Mortgage |
| Less than 2.0x | 52 (22.1%) | 120,365 (17,269.0%) |
| 2.0x to 2.9x | 34 (14.5%) | 162 (23.2%) |
| 3.0x to 3.9x | 36 (15.3%) | 142 (20.4%) |
| 4.0x or more | 113 (48.1%) | 178 (25.5%) |
| Total | 235 (100.0%) | 697 (100.0%) |
Real Estate Taxes by Mortgage Status in Chester Heights borough
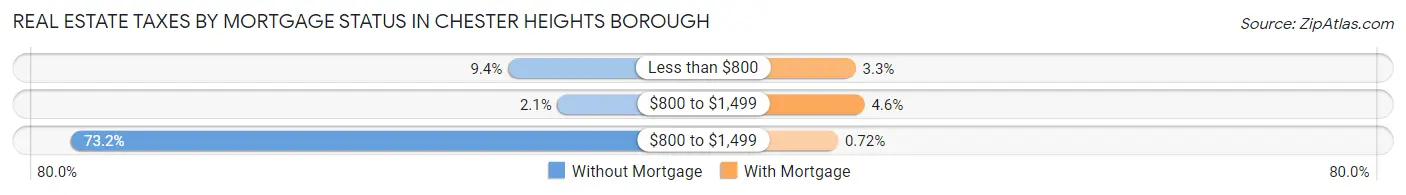
| Property Taxes | Without Mortgage | With Mortgage |
| Less than $800 | 22 (9.4%) | 23 (3.3%) |
| $800 to $1,499 | 5 (2.1%) | 32 (4.6%) |
| $800 to $1,499 | 172 (73.2%) | 5 (0.7%) |
| Total | 235 (100.0%) | 697 (100.0%) |
Health & Disability in Chester Heights borough
Health Insurance Coverage by Age in Chester Heights borough
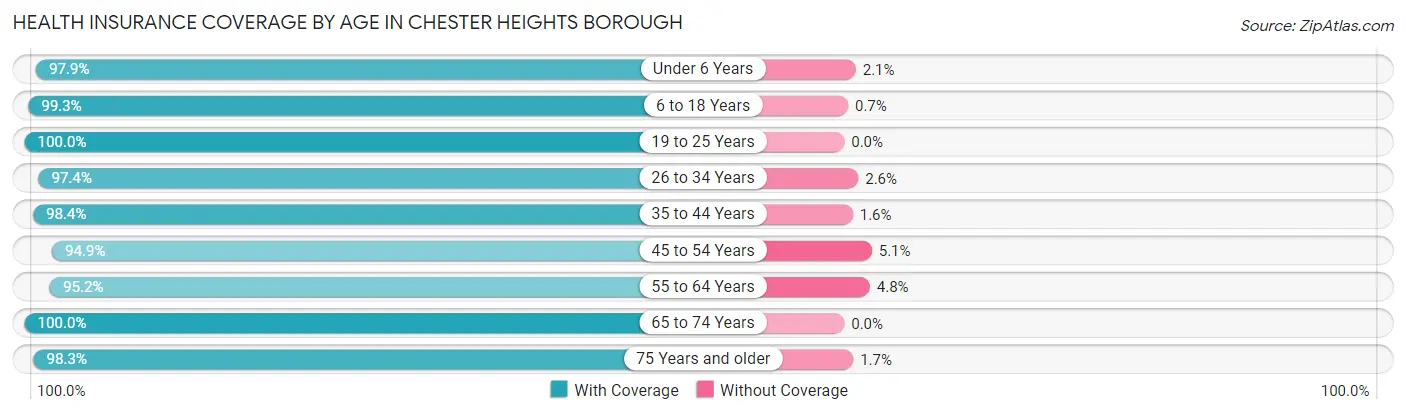
| Age Bracket | With Coverage | Without Coverage |
| Under 6 Years | 183 (97.9%) | 4 (2.1%) |
| 6 to 18 Years | 426 (99.3%) | 3 (0.7%) |
| 19 to 25 Years | 104 (100.0%) | 0 (0.0%) |
| 26 to 34 Years | 299 (97.4%) | 8 (2.6%) |
| 35 to 44 Years | 435 (98.4%) | 7 (1.6%) |
| 45 to 54 Years | 259 (94.9%) | 14 (5.1%) |
| 55 to 64 Years | 419 (95.2%) | 21 (4.8%) |
| 65 to 74 Years | 376 (100.0%) | 0 (0.0%) |
| 75 Years and older | 295 (98.3%) | 5 (1.7%) |
| Total | 2,796 (97.8%) | 62 (2.2%) |
Health Insurance Coverage by Citizenship Status in Chester Heights borough
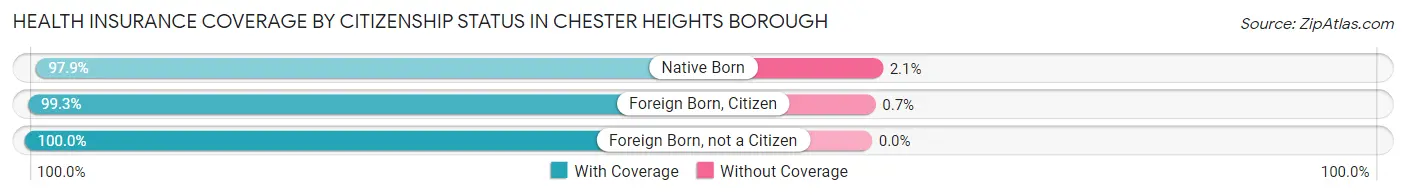
| Citizenship Status | With Coverage | Without Coverage |
| Native Born | 183 (97.9%) | 4 (2.1%) |
| Foreign Born, Citizen | 426 (99.3%) | 3 (0.7%) |
| Foreign Born, not a Citizen | 104 (100.0%) | 0 (0.0%) |
Health Insurance Coverage by Household Income in Chester Heights borough
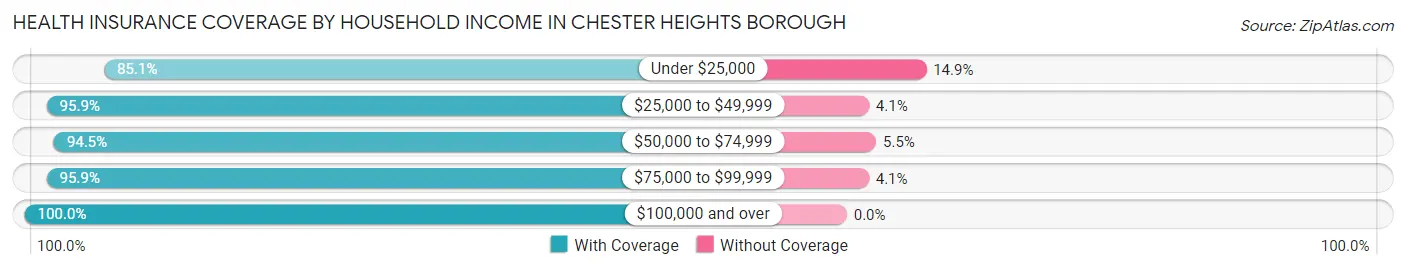
| Household Income | With Coverage | Without Coverage |
| Under $25,000 | 103 (85.1%) | 18 (14.9%) |
| $25,000 to $49,999 | 510 (95.9%) | 22 (4.1%) |
| $50,000 to $74,999 | 241 (94.5%) | 14 (5.5%) |
| $75,000 to $99,999 | 186 (95.9%) | 8 (4.1%) |
| $100,000 and over | 1,701 (100.0%) | 0 (0.0%) |
Public vs Private Health Insurance Coverage by Age in Chester Heights borough
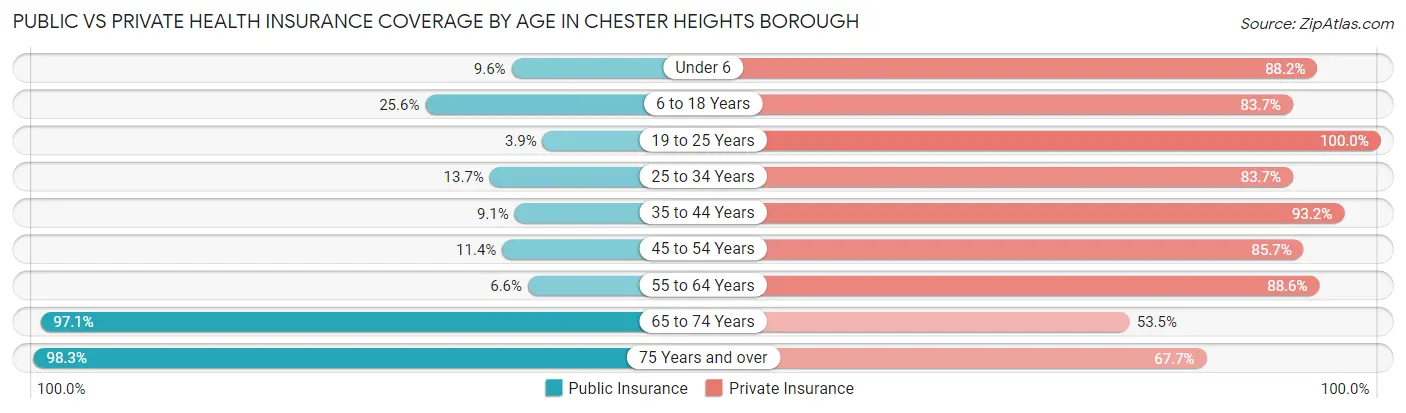
| Age Bracket | Public Insurance | Private Insurance |
| Under 6 | 18 (9.6%) | 165 (88.2%) |
| 6 to 18 Years | 110 (25.6%) | 359 (83.7%) |
| 19 to 25 Years | 4 (3.8%) | 104 (100.0%) |
| 25 to 34 Years | 42 (13.7%) | 257 (83.7%) |
| 35 to 44 Years | 40 (9.0%) | 412 (93.2%) |
| 45 to 54 Years | 31 (11.4%) | 234 (85.7%) |
| 55 to 64 Years | 29 (6.6%) | 390 (88.6%) |
| 65 to 74 Years | 365 (97.1%) | 201 (53.5%) |
| 75 Years and over | 295 (98.3%) | 203 (67.7%) |
| Total | 934 (32.7%) | 2,325 (81.4%) |
Disability Status by Sex by Age in Chester Heights borough
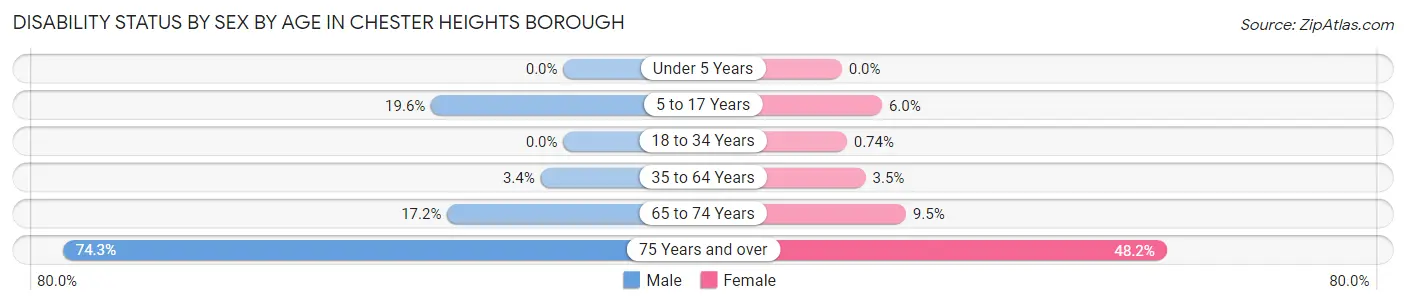
| Age Bracket | Male | Female |
| Under 5 Years | 0 (0.0%) | 0 (0.0%) |
| 5 to 17 Years | 53 (19.6%) | 14 (6.0%) |
| 18 to 34 Years | 0 (0.0%) | 2 (0.7%) |
| 35 to 64 Years | 17 (3.4%) | 23 (3.5%) |
| 65 to 74 Years | 25 (17.2%) | 22 (9.5%) |
| 75 Years and over | 55 (74.3%) | 109 (48.2%) |
Disability Class by Sex by Age in Chester Heights borough
Disability Class: Hearing Difficulty
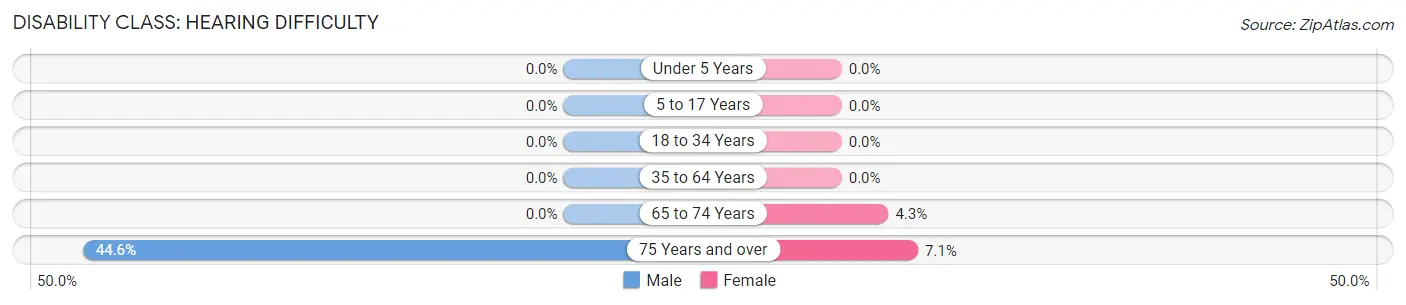
| Age Bracket | Male | Female |
| Under 5 Years | 0 (0.0%) | 0 (0.0%) |
| 5 to 17 Years | 0 (0.0%) | 0 (0.0%) |
| 18 to 34 Years | 0 (0.0%) | 0 (0.0%) |
| 35 to 64 Years | 0 (0.0%) | 0 (0.0%) |
| 65 to 74 Years | 0 (0.0%) | 10 (4.3%) |
| 75 Years and over | 33 (44.6%) | 16 (7.1%) |
Disability Class: Vision Difficulty
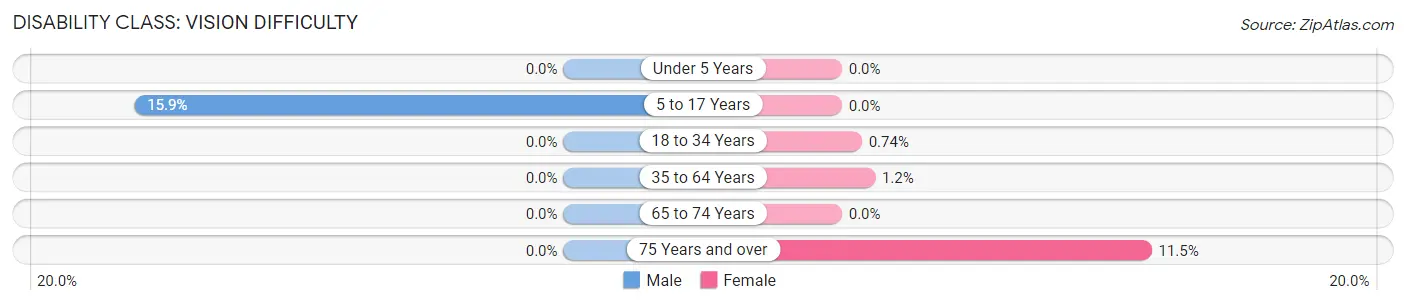
| Age Bracket | Male | Female |
| Under 5 Years | 0 (0.0%) | 0 (0.0%) |
| 5 to 17 Years | 43 (15.9%) | 0 (0.0%) |
| 18 to 34 Years | 0 (0.0%) | 2 (0.7%) |
| 35 to 64 Years | 0 (0.0%) | 8 (1.2%) |
| 65 to 74 Years | 0 (0.0%) | 0 (0.0%) |
| 75 Years and over | 0 (0.0%) | 26 (11.5%) |
Disability Class: Cognitive Difficulty
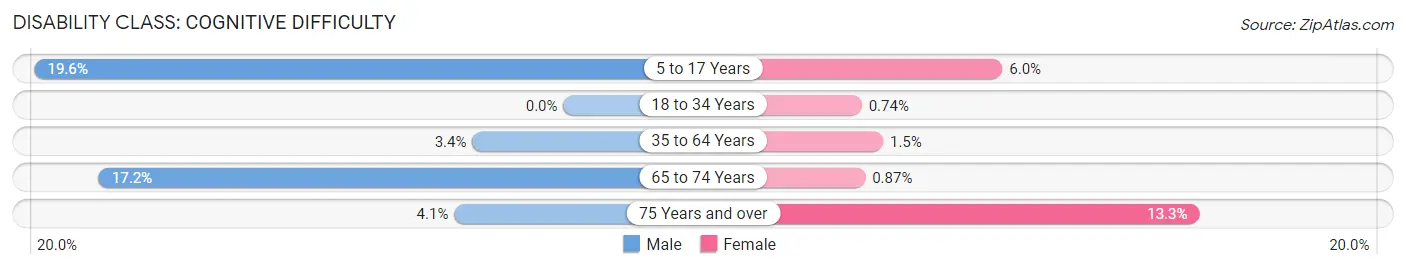
| Age Bracket | Male | Female |
| 5 to 17 Years | 53 (19.6%) | 14 (6.0%) |
| 18 to 34 Years | 0 (0.0%) | 2 (0.7%) |
| 35 to 64 Years | 17 (3.4%) | 10 (1.5%) |
| 65 to 74 Years | 25 (17.2%) | 2 (0.9%) |
| 75 Years and over | 3 (4.1%) | 30 (13.3%) |
Disability Class: Ambulatory Difficulty
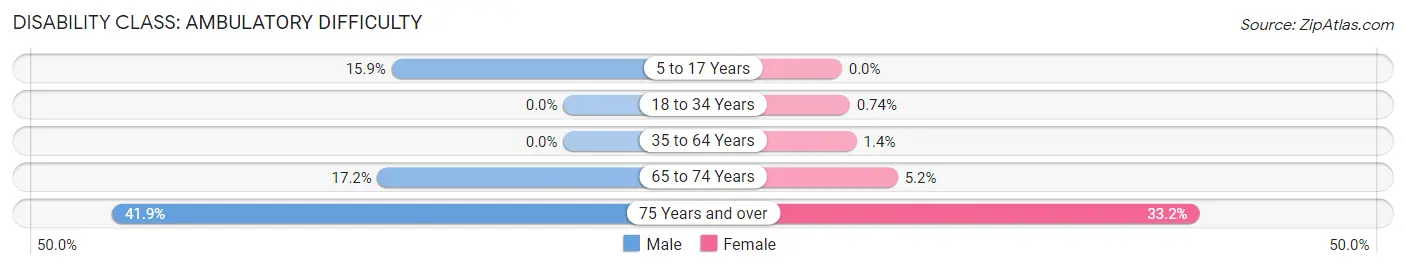
| Age Bracket | Male | Female |
| 5 to 17 Years | 43 (15.9%) | 0 (0.0%) |
| 18 to 34 Years | 0 (0.0%) | 2 (0.7%) |
| 35 to 64 Years | 0 (0.0%) | 9 (1.4%) |
| 65 to 74 Years | 25 (17.2%) | 12 (5.2%) |
| 75 Years and over | 31 (41.9%) | 75 (33.2%) |
Disability Class: Self-Care Difficulty
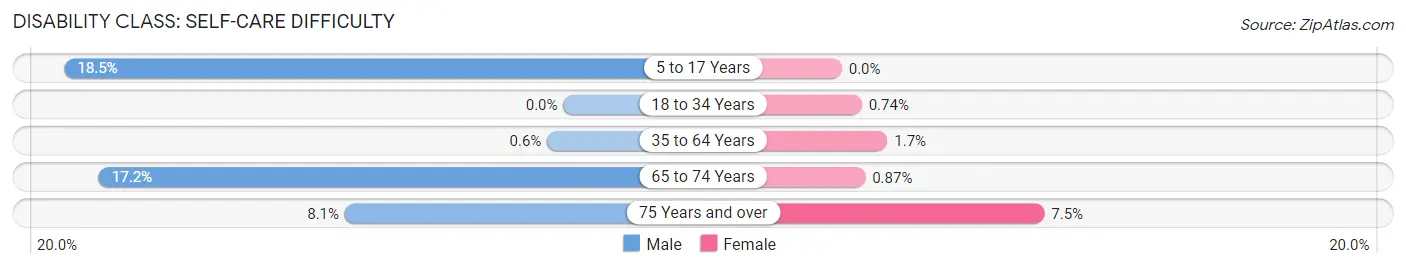
| Age Bracket | Male | Female |
| 5 to 17 Years | 50 (18.5%) | 0 (0.0%) |
| 18 to 34 Years | 0 (0.0%) | 2 (0.7%) |
| 35 to 64 Years | 3 (0.6%) | 11 (1.7%) |
| 65 to 74 Years | 25 (17.2%) | 2 (0.9%) |
| 75 Years and over | 6 (8.1%) | 17 (7.5%) |
Technology Access in Chester Heights borough
Computing Device Access in Chester Heights borough
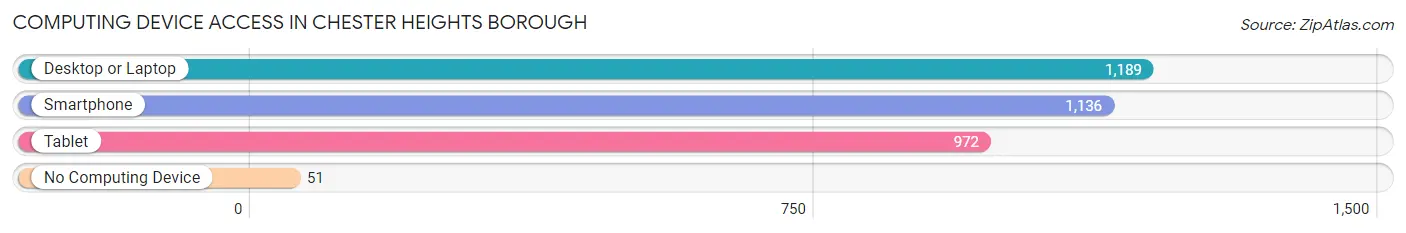
| Device Type | # Households | % Households |
| Desktop or Laptop | 1,189 | 89.0% |
| Smartphone | 1,136 | 85.0% |
| Tablet | 972 | 72.8% |
| No Computing Device | 51 | 3.8% |
| Total | 1,336 | 100.0% |
Internet Access in Chester Heights borough
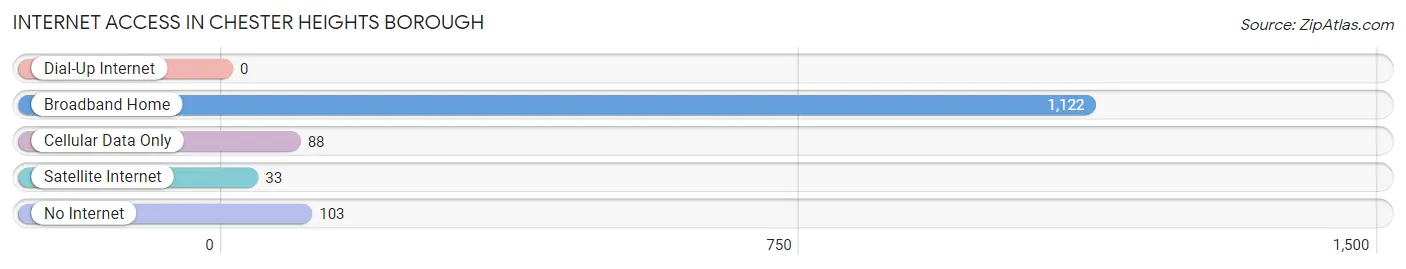
| Internet Type | # Households | % Households |
| Dial-Up Internet | 0 | 0.0% |
| Broadband Home | 1,122 | 84.0% |
| Cellular Data Only | 88 | 6.6% |
| Satellite Internet | 33 | 2.5% |
| No Internet | 103 | 7.7% |
| Total | 1,336 | 100.0% |
Chester Heights borough Summary
Chester Heights Borough is a small borough located in Delaware County, Pennsylvania. It is situated in the southeastern corner of the county, just south of the city of Chester. The borough is bordered by the boroughs of Upland, Brookhaven, and Parkside, as well as the townships of Middletown and Nether Providence. The population of Chester Heights Borough was 2,845 at the 2010 census.
History
Chester Heights Borough was originally part of the larger Chester Township, which was established in 1682. The area was first settled by English Quakers in the late 1600s. The area was known as “Chester Heights” by the early 1700s, and the name was officially adopted in 1853 when the borough was incorporated.
The borough was home to a number of prominent families, including the Cheyney family, who owned a large estate in the area. The Cheyney family was influential in the development of the borough, and their estate is now a historic site.
The borough was also home to a number of industries, including a paper mill, a brickyard, and a tannery. The paper mill was the largest employer in the area, and it closed in the late 1800s.
Geography
Chester Heights Borough is located at 39°51'N 75°24'W (39.85, -75.40). It is situated in the southeastern corner of Delaware County, just south of the city of Chester. The borough is bordered by the boroughs of Upland, Brookhaven, and Parkside, as well as the townships of Middletown and Nether Providence.
The borough has a total area of 0.9 square miles, all of which is land. The borough is located in the Piedmont region of Pennsylvania, and is characterized by rolling hills and valleys. The borough is drained by the Chester Creek, which flows through the borough and empties into the Delaware River.
Economy
The economy of Chester Heights Borough is largely based on the service sector. The borough is home to a number of small businesses, including restaurants, retail stores, and professional services. The borough is also home to a number of industrial and manufacturing businesses, including a plastics factory and a printing company.
Demographics
As of the 2010 census, the population of Chester Heights Borough was 2,845. The racial makeup of the borough was 79.2% White, 15.2% African American, 0.3% Native American, 1.2% Asian, 0.1% Pacific Islander, 1.7% from other races, and 2.4% from two or more races. Hispanic or Latino of any race were 4.2% of the population.
The median household income in the borough was $50,938, and the median family income was $60,938. The per capita income in the borough was $25,938. About 8.2% of the population was below the poverty line.
Common Questions
What is the Total Population of Chester Heights borough?
Total Population of Chester Heights borough is 2,897.
What is the Total Male Population of Chester Heights borough?
Total Male Population of Chester Heights borough is 1,217.
What is the Total Female Population of Chester Heights borough?
Total Female Population of Chester Heights borough is 1,680.
What is the Ratio of Males per 100 Females in Chester Heights borough?
There are 72.44 Males per 100 Females in Chester Heights borough.
What is the Ratio of Females per 100 Males in Chester Heights borough?
There are 138.04 Females per 100 Males in Chester Heights borough.
What is the Median Population Age in Chester Heights borough?
Median Population Age in Chester Heights borough is 43.9 Years.
What is the Average Family Size in Chester Heights borough
Average Family Size in Chester Heights borough is 2.8 People.
What is the Average Household Size in Chester Heights borough
Average Household Size in Chester Heights borough is 2.1 People.
What is Per Capita Income in Chester Heights borough?
Per Capita income in Chester Heights borough is $55,401.
What is the Median Family Income in Chester Heights borough?
Median Family Income in Chester Heights borough is $137,791.
What is the Median Household income in Chester Heights borough?
Median Household Income in Chester Heights borough is $91,447.
What is Income or Wage Gap in Chester Heights borough?
Income or Wage Gap in Chester Heights borough is 23.2%.
Women in Chester Heights borough earn 76.8 cents for every dollar earned by a man.
What is Inequality or Gini Index in Chester Heights borough?
Inequality or Gini Index in Chester Heights borough is 0.42.
How Large is the Labor Force in Chester Heights borough?
There are 1,517 People in the Labor Forcein in Chester Heights borough.
What is the Percentage of People in the Labor Force in Chester Heights borough?
64.6% of People are in the Labor Force in Chester Heights borough.
What is the Unemployment Rate in Chester Heights borough?
Unemployment Rate in Chester Heights borough is 4.2%.