Cities with the Lowest Child Poverty Level Among Boys Under the Age of 16 in Vermont
RELATED REPORTS & OPTIONS
Lowest Poverty | Boys 0-16
Vermont
Compare Cities
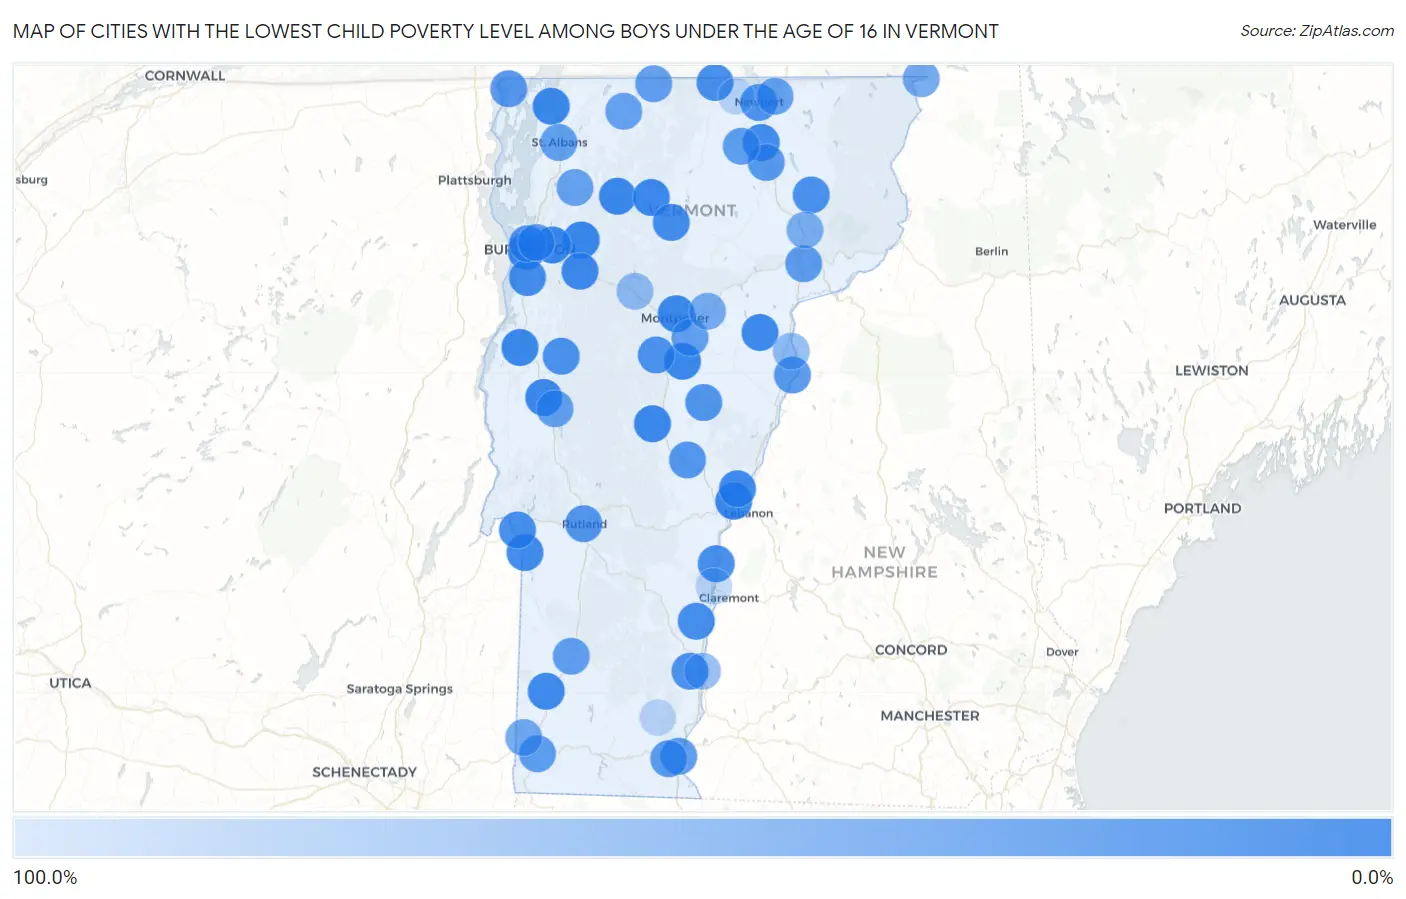
Map of Cities with the Lowest Child Poverty Level Among Boys Under the Age of 16 in Vermont
100.0%
0.0%
Cities with the Lowest Child Poverty Level Among Boys Under the Age of 16 in Vermont
| City | Child Poverty (Boys) | vs State | vs National | |
| 1. | Jericho | 1.8% | 11.2%(-9.42)#1 | 16.9%(-15.1)#533 |
| 2. | Essex Junction | 2.6% | 11.2%(-8.67)#2 | 16.9%(-14.3)#980 |
| 3. | Swanton | 2.7% | 11.2%(-8.58)#3 | 16.9%(-14.2)#1,026 |
| 4. | Williamstown | 3.1% | 11.2%(-8.10)#4 | 16.9%(-13.8)#1,325 |
| 5. | Randolph | 3.3% | 11.2%(-7.94)#5 | 16.9%(-13.6)#1,425 |
| 6. | Wilder | 3.3% | 11.2%(-7.90)#6 | 16.9%(-13.6)#1,456 |
| 7. | Montpelier | 3.4% | 11.2%(-7.84)#7 | 16.9%(-13.5)#1,492 |
| 8. | Vergennes | 3.8% | 11.2%(-7.45)#8 | 16.9%(-13.1)#1,705 |
| 9. | Jeffersonville | 3.9% | 11.2%(-7.30)#9 | 16.9%(-13.0)#1,799 |
| 10. | Middlebury | 4.3% | 11.2%(-6.98)#10 | 16.9%(-12.6)#1,968 |
| 11. | Johnson | 5.2% | 11.2%(-6.05)#11 | 16.9%(-11.7)#2,517 |
| 12. | Richmond | 5.2% | 11.2%(-6.03)#12 | 16.9%(-11.7)#2,537 |
| 13. | South Burlington | 5.7% | 11.2%(-5.52)#13 | 16.9%(-11.2)#2,853 |
| 14. | Groton | 7.5% | 11.2%(-3.74)#14 | 16.9%(-9.40)#3,893 |
| 15. | Norwich | 8.3% | 11.2%(-2.91)#15 | 16.9%(-8.57)#4,360 |
| 16. | St. George | 8.3% | 11.2%(-2.91)#16 | 16.9%(-8.57)#4,376 |
| 17. | Poultney | 8.7% | 11.2%(-2.55)#17 | 16.9%(-8.21)#4,595 |
| 18. | Arlington | 8.8% | 11.2%(-2.41)#18 | 16.9%(-8.07)#4,689 |
| 19. | Sheffield | 9.4% | 11.2%(-1.87)#19 | 16.9%(-7.53)#5,011 |
| 20. | Shelburne | 9.6% | 11.2%(-1.64)#20 | 16.9%(-7.30)#5,119 |
| 21. | Morrisville | 9.7% | 11.2%(-1.58)#21 | 16.9%(-7.24)#5,146 |
| 22. | Orleans | 10.8% | 11.2%(-0.459)#22 | 16.9%(-6.12)#5,761 |
| 23. | Fair Haven | 12.0% | 11.2%(+0.743)#23 | 16.9%(-4.92)#6,366 |
| 24. | Springfield | 12.0% | 11.2%(+0.773)#24 | 16.9%(-4.89)#6,391 |
| 25. | Castleton Four Corners | 13.2% | 11.2%(+1.91)#25 | 16.9%(-3.75)#6,950 |
| 26. | Windsor | 13.3% | 11.2%(+2.04)#26 | 16.9%(-3.62)#7,007 |
| 27. | North Troy | 13.9% | 11.2%(+2.65)#27 | 16.9%(-3.01)#7,329 |
| 28. | Saxtons River | 14.9% | 11.2%(+3.62)#28 | 16.9%(-2.04)#7,805 |
| 29. | Stamford | 15.2% | 11.2%(+3.97)#29 | 16.9%(-1.69)#7,957 |
| 30. | West Burke | 15.4% | 11.2%(+4.14)#30 | 16.9%(-1.52)#8,049 |
| 31. | Burlington | 15.6% | 11.2%(+4.35)#31 | 16.9%(-1.31)#8,121 |
| 32. | Bristol | 15.8% | 11.2%(+4.51)#32 | 16.9%(-1.15)#8,196 |
| 33. | Northfield | 17.8% | 11.2%(+6.60)#33 | 16.9%(+0.937)#9,152 |
| 34. | Pawlet | 17.9% | 11.2%(+6.61)#34 | 16.9%(+0.953)#9,170 |
| 35. | Newport | 18.1% | 11.2%(+6.84)#35 | 16.9%(+1.18)#9,244 |
| 36. | Chelsea | 19.7% | 11.2%(+8.43)#36 | 16.9%(+2.77)#9,923 |
| 37. | Danby | 21.7% | 11.2%(+10.5)#37 | 16.9%(+4.84)#10,722 |
| 38. | Rutland | 22.3% | 11.2%(+11.0)#38 | 16.9%(+5.37)#10,925 |
| 39. | South Royalton | 23.3% | 11.2%(+12.0)#39 | 16.9%(+6.35)#11,243 |
| 40. | Alburgh | 25.5% | 11.2%(+14.3)#40 | 16.9%(+8.63)#12,038 |
| 41. | Barton | 25.9% | 11.2%(+14.7)#41 | 16.9%(+9.02)#12,152 |
| 42. | Newbury | 26.1% | 11.2%(+14.8)#42 | 16.9%(+9.18)#12,208 |
| 43. | Brattleboro | 27.4% | 11.2%(+16.2)#43 | 16.9%(+10.5)#12,636 |
| 44. | West Brattleboro | 27.7% | 11.2%(+16.4)#44 | 16.9%(+10.8)#12,706 |
| 45. | St Johnsbury | 29.2% | 11.2%(+18.0)#45 | 16.9%(+12.3)#13,167 |
| 46. | Bennington | 29.6% | 11.2%(+18.4)#46 | 16.9%(+12.7)#13,262 |
| 47. | Irasburg | 31.0% | 11.2%(+19.8)#47 | 16.9%(+14.1)#13,643 |
| 48. | Winooski | 31.2% | 11.2%(+20.0)#48 | 16.9%(+14.3)#13,673 |
| 49. | Richford | 33.2% | 11.2%(+22.0)#49 | 16.9%(+16.3)#14,155 |
| 50. | Manchester Center | 33.6% | 11.2%(+22.3)#50 | 16.9%(+16.7)#14,343 |
| 51. | Barre | 35.1% | 11.2%(+23.8)#51 | 16.9%(+18.2)#14,655 |
| 52. | East Middlebury | 35.2% | 11.2%(+23.9)#52 | 16.9%(+18.3)#14,681 |
| 53. | St Albans | 35.4% | 11.2%(+24.1)#53 | 16.9%(+18.4)#14,709 |
| 54. | Derby Center | 35.4% | 11.2%(+24.1)#54 | 16.9%(+18.5)#14,725 |
| 55. | Enosburg Falls | 36.1% | 11.2%(+24.8)#55 | 16.9%(+19.2)#14,891 |
| 56. | Fairfax | 37.5% | 11.2%(+26.3)#56 | 16.9%(+20.6)#15,142 |
| 57. | North Bennington | 44.4% | 11.2%(+33.2)#57 | 16.9%(+27.5)#16,286 |
| 58. | Beecher Falls | 44.4% | 11.2%(+33.2)#58 | 16.9%(+27.5)#16,305 |
| 59. | Plainfield | 50.0% | 11.2%(+38.8)#59 | 16.9%(+33.1)#16,983 |
| 60. | Lyndonville | 52.1% | 11.2%(+40.8)#60 | 16.9%(+35.2)#17,245 |
| 61. | Wells River | 66.7% | 11.2%(+55.4)#61 | 16.9%(+49.8)#18,322 |
| 62. | Bellows Falls | 68.7% | 11.2%(+57.4)#62 | 16.9%(+51.8)#18,444 |
| 63. | Waterbury | 69.6% | 11.2%(+58.4)#63 | 16.9%(+52.7)#18,486 |
| 64. | Hartford | 100.0% | 11.2%(+88.8)#64 | 16.9%(+83.1)#19,436 |
| 65. | Ascutney | 100.0% | 11.2%(+88.8)#65 | 16.9%(+83.1)#19,456 |
| 66. | Algiers | 100.0% | 11.2%(+88.8)#66 | 16.9%(+83.1)#19,587 |
| 67. | Gilman | 100.0% | 11.2%(+88.8)#67 | 16.9%(+83.1)#19,596 |
| 68. | Newport Center | 100.0% | 11.2%(+88.8)#68 | 16.9%(+83.1)#19,616 |
| 69. | Newfane | 100.0% | 11.2%(+88.8)#69 | 16.9%(+83.1)#19,706 |
1
2Common Questions
What are the Top 10 Cities with the Lowest Child Poverty Level Among Boys Under the Age of 16 in Vermont?
Top 10 Cities with the Lowest Child Poverty Level Among Boys Under the Age of 16 in Vermont are:
#1
0.0%
#2
0.0%
#3
0.0%
#4
0.0%
#5
0.0%
#6
0.0%
#7
0.0%
#8
0.0%
#9
0.0%
#10
0.0%
What city has the Lowest Child Poverty Level Among Boys Under the Age of 16 in Vermont?
Jericho has the Lowest Child Poverty Level Among Boys Under the Age of 16 in Vermont with 1.8%.
What is the Poverty Level Among Boys Under the Age of 16 in the State of Vermont?
Poverty Level Among Boys Under the Age of 16 in Vermont is 11.2%.
What is the Poverty Level Among Boys Under the Age of 16 in the United States?
Poverty Level Among Boys Under the Age of 16 in the United States is 16.9%.