Beech Mountain Lakes, PA
Beech Mountain Lakes Map
Beech Mountain Lakes Overview
1,940
TOTAL POPULATION
1,006
MALE POPULATION
934
FEMALE POPULATION
107.71
MALES / 100 FEMALES
92.84
FEMALES / 100 MALES
48.2
MEDIAN AGE
3.7
AVG FAMILY SIZE
3.1
AVG HOUSEHOLD SIZE
$40,813
PER CAPITA INCOME
$116,979
AVG FAMILY INCOME
$109,342
AVG HOUSEHOLD INCOME
10.7%
WAGE / INCOME GAP [ % ]
89.3¢/ $1
WAGE / INCOME GAP [ $ ]
0.39
INEQUALITY / GINI INDEX
1,097
LABOR FORCE [ PEOPLE ]
72.2%
PERCENT IN LABOR FORCE
Race in Beech Mountain Lakes
The most populous races in Beech Mountain Lakes are White / Caucasian (1,797 | 92.6%), Hispanic or Latino (190 | 9.8%), and Two or more Races (133 | 6.9%).
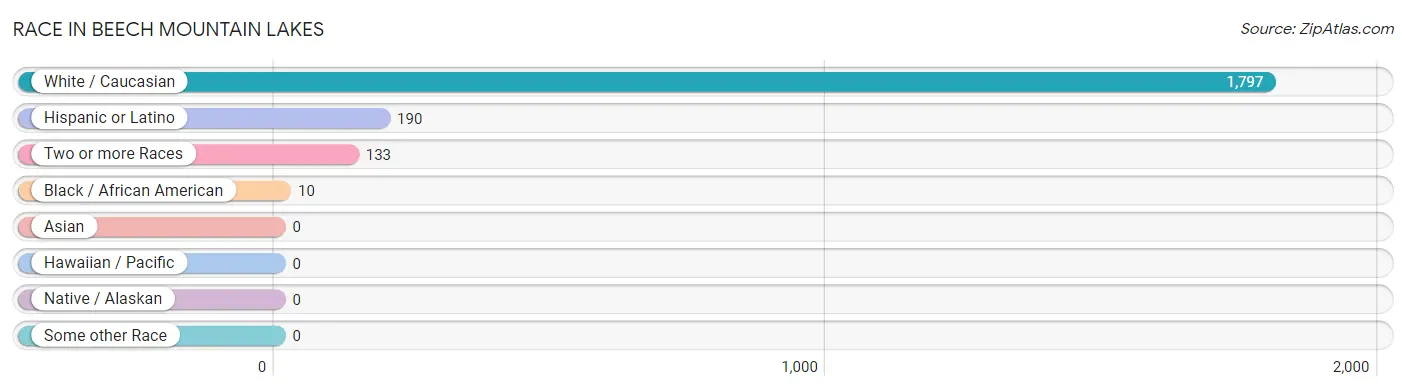
| Race | # Population | % Population |
| Asian | 0 | 0.0% |
| Black / African American | 10 | 0.5% |
| Hawaiian / Pacific | 0 | 0.0% |
| Hispanic or Latino | 190 | 9.8% |
| Native / Alaskan | 0 | 0.0% |
| White / Caucasian | 1,797 | 92.6% |
| Two or more Races | 133 | 6.9% |
| Some other Race | 0 | 0.0% |
| Total | 1,940 | 100.0% |
Ancestry in Beech Mountain Lakes
The most populous ancestries reported in Beech Mountain Lakes are Italian (591 | 30.5%), Irish (481 | 24.8%), Greek (410 | 21.1%), Polish (359 | 18.5%), and German (300 | 15.5%), together accounting for 110.4% of all Beech Mountain Lakes residents.
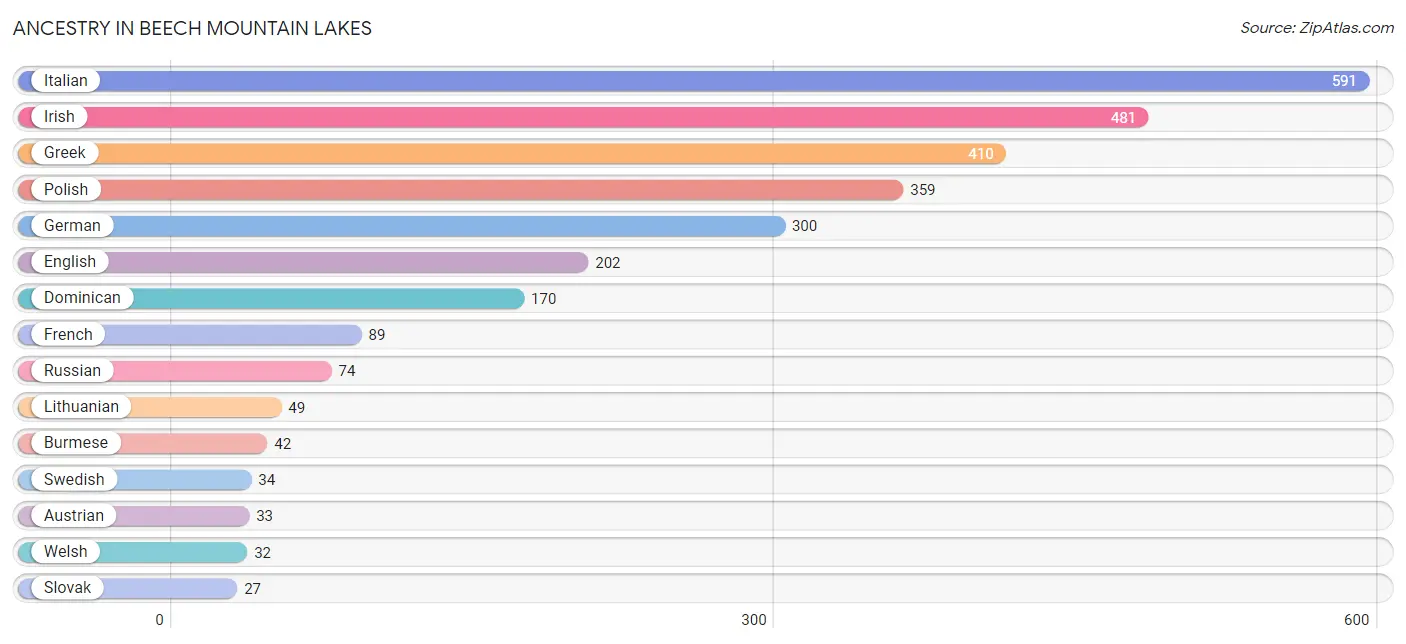
| Ancestry | # Population | % Population |
| Austrian | 33 | 1.7% |
| Burmese | 42 | 2.2% |
| Czechoslovakian | 22 | 1.1% |
| Dominican | 170 | 8.8% |
| English | 202 | 10.4% |
| French | 89 | 4.6% |
| German | 300 | 15.5% |
| Greek | 410 | 21.1% |
| Irish | 481 | 24.8% |
| Italian | 591 | 30.5% |
| Lithuanian | 49 | 2.5% |
| Polish | 359 | 18.5% |
| Puerto Rican | 20 | 1.0% |
| Russian | 74 | 3.8% |
| Scandinavian | 25 | 1.3% |
| Scotch-Irish | 19 | 1.0% |
| Scottish | 16 | 0.8% |
| Slovak | 27 | 1.4% |
| Swedish | 34 | 1.8% |
| Welsh | 32 | 1.7% |
| Yugoslavian | 12 | 0.6% | View All 21 Rows |
Immigrants in Beech Mountain Lakes
The most numerous immigrant groups reported in Beech Mountain Lakes came from Caribbean (81 | 4.2%), Dominican Republic (81 | 4.2%), Latin America (81 | 4.2%), Europe (18 | 0.9%), and Ireland (18 | 0.9%), together accounting for 14.4% of all Beech Mountain Lakes residents.
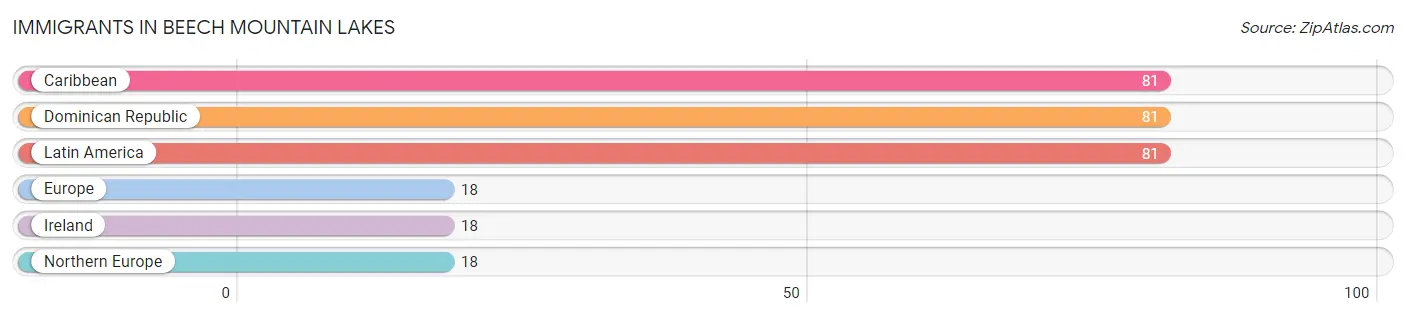
| Immigration Origin | # Population | % Population |
| Caribbean | 81 | 4.2% |
| Dominican Republic | 81 | 4.2% |
| Europe | 18 | 0.9% |
| Ireland | 18 | 0.9% |
| Latin America | 81 | 4.2% |
| Northern Europe | 18 | 0.9% | View All 6 Rows |
Sex and Age in Beech Mountain Lakes
Sex and Age in Beech Mountain Lakes
The most populous age groups in Beech Mountain Lakes are 10 to 14 Years (240 | 23.9%) for men and 45 to 49 Years (229 | 24.5%) for women.
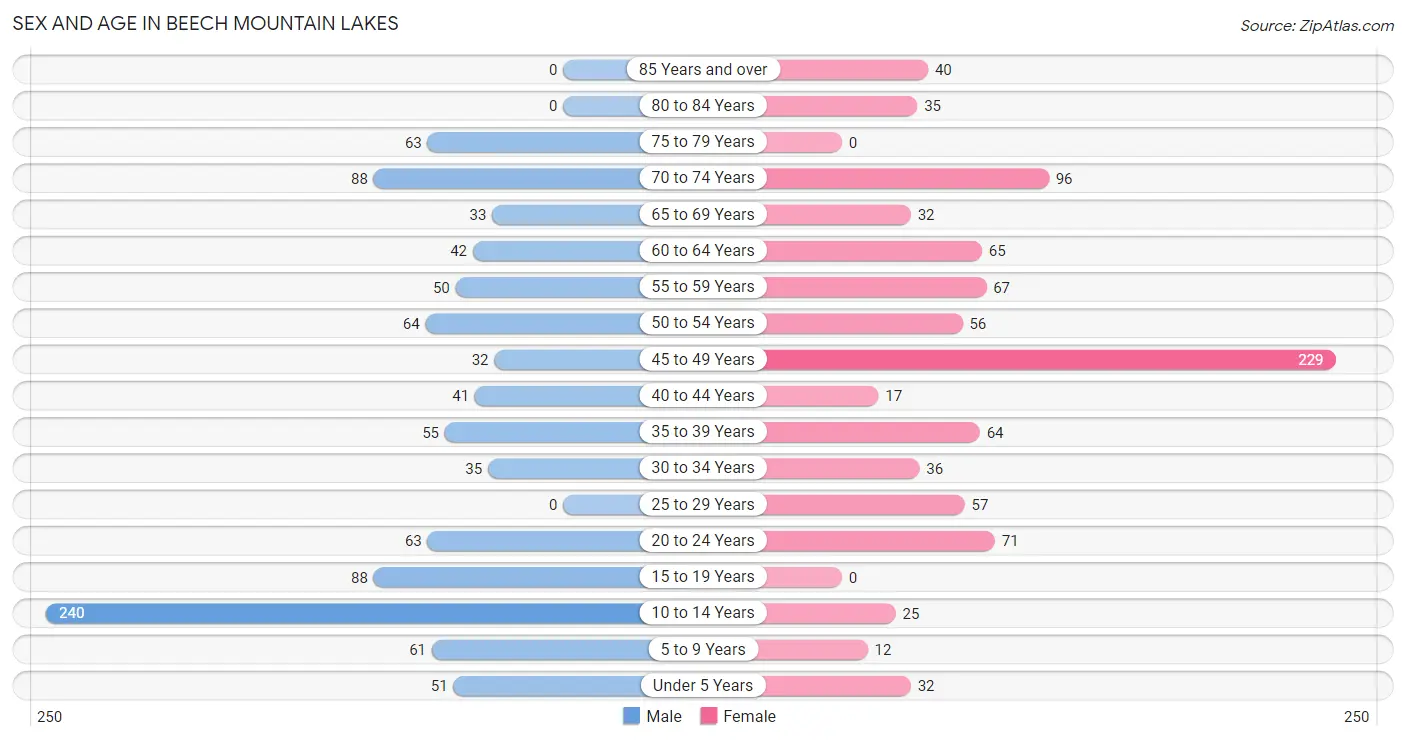
| Age Bracket | Male | Female |
| Under 5 Years | 51 (5.1%) | 32 (3.4%) |
| 5 to 9 Years | 61 (6.1%) | 12 (1.3%) |
| 10 to 14 Years | 240 (23.9%) | 25 (2.7%) |
| 15 to 19 Years | 88 (8.7%) | 0 (0.0%) |
| 20 to 24 Years | 63 (6.3%) | 71 (7.6%) |
| 25 to 29 Years | 0 (0.0%) | 57 (6.1%) |
| 30 to 34 Years | 35 (3.5%) | 36 (3.8%) |
| 35 to 39 Years | 55 (5.5%) | 64 (6.9%) |
| 40 to 44 Years | 41 (4.1%) | 17 (1.8%) |
| 45 to 49 Years | 32 (3.2%) | 229 (24.5%) |
| 50 to 54 Years | 64 (6.4%) | 56 (6.0%) |
| 55 to 59 Years | 50 (5.0%) | 67 (7.2%) |
| 60 to 64 Years | 42 (4.2%) | 65 (7.0%) |
| 65 to 69 Years | 33 (3.3%) | 32 (3.4%) |
| 70 to 74 Years | 88 (8.7%) | 96 (10.3%) |
| 75 to 79 Years | 63 (6.3%) | 0 (0.0%) |
| 80 to 84 Years | 0 (0.0%) | 35 (3.7%) |
| 85 Years and over | 0 (0.0%) | 40 (4.3%) |
| Total | 1,006 (100.0%) | 934 (100.0%) |
Families and Households in Beech Mountain Lakes
Median Family Size in Beech Mountain Lakes
The median family size in Beech Mountain Lakes is 3.69 persons per family, with married-couple families (337 | 72.3%) accounting for the largest median family size of 4.03 persons per family. On the other hand, single male/father families (31 | 6.7%) represent the smallest median family size with 1.71 persons per family.
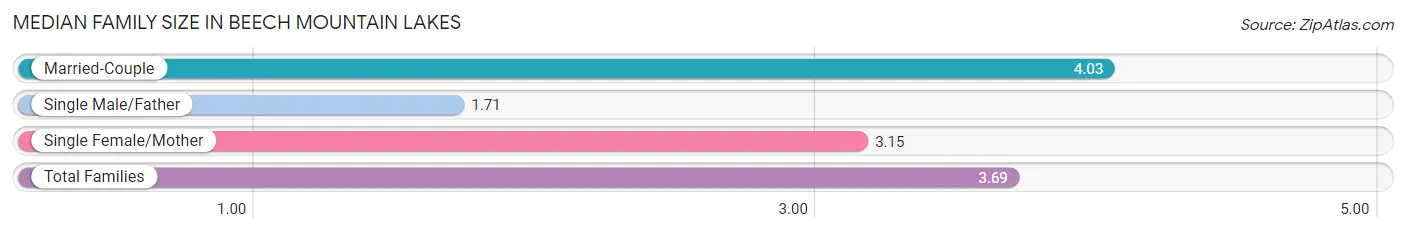
| Family Type | # Families | Family Size |
| Married-Couple | 337 (72.3%) | 4.03 |
| Single Male/Father | 31 (6.7%) | 1.71 |
| Single Female/Mother | 98 (21.0%) | 3.15 |
| Total Families | 466 (100.0%) | 3.69 |
Median Household Size in Beech Mountain Lakes
The median household size in Beech Mountain Lakes is 3.14 persons per household, with married-couple households (337 | 54.5%) accounting for the largest median household size of 4.03 persons per household. non-family households (152 | 24.6%) represent the smallest median household size with 1.16 persons per household.
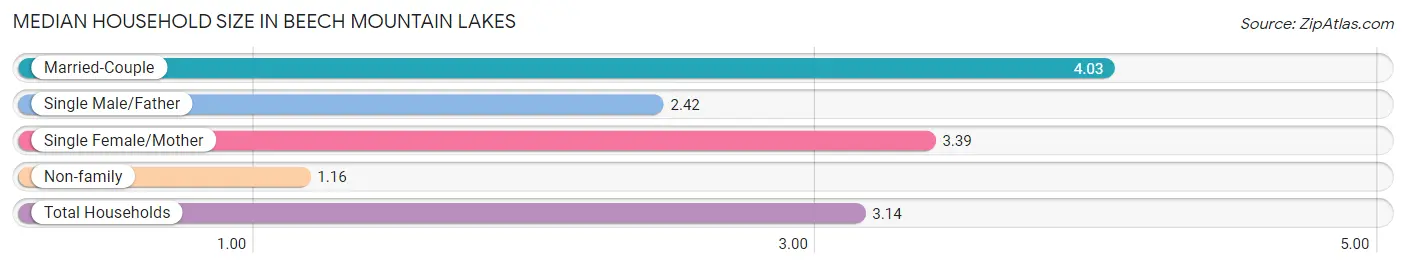
| Household Type | # Households | Household Size |
| Married-Couple | 337 (54.5%) | 4.03 |
| Single Male/Father | 31 (5.0%) | 2.42 |
| Single Female/Mother | 98 (15.9%) | 3.39 |
| Non-family | 152 (24.6%) | 1.16 |
| Total Households | 618 (100.0%) | 3.14 |
Household Size by Marriage Status in Beech Mountain Lakes
Out of a total of 618 households in Beech Mountain Lakes, 466 (75.4%) are family households, while 152 (24.6%) are nonfamily households. The most numerous type of family households are 3-person households, comprising 163, and the most common type of nonfamily households are 1-person households, comprising 129.
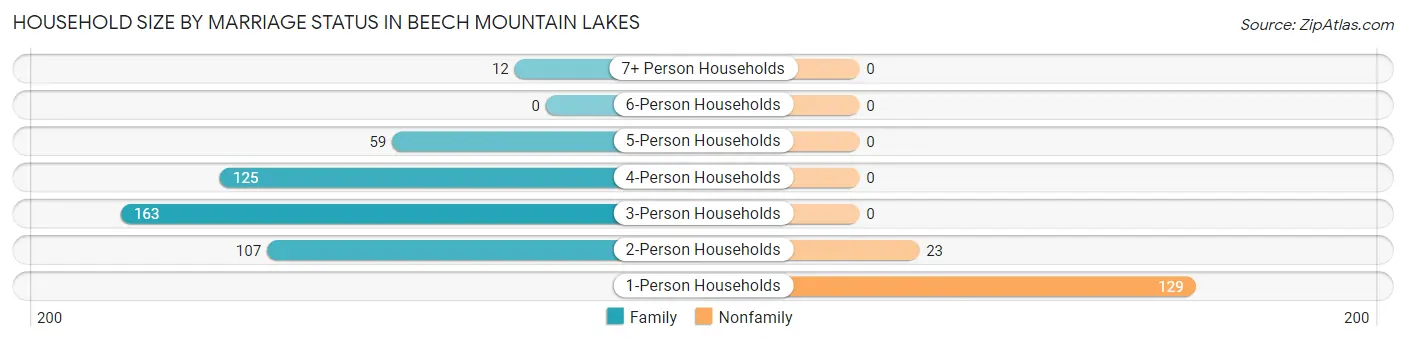
| Household Size | Family Households | Nonfamily Households |
| 1-Person Households | - | 129 (20.9%) |
| 2-Person Households | 107 (17.3%) | 23 (3.7%) |
| 3-Person Households | 163 (26.4%) | 0 (0.0%) |
| 4-Person Households | 125 (20.2%) | 0 (0.0%) |
| 5-Person Households | 59 (9.6%) | 0 (0.0%) |
| 6-Person Households | 0 (0.0%) | 0 (0.0%) |
| 7+ Person Households | 12 (1.9%) | 0 (0.0%) |
| Total | 466 (75.4%) | 152 (24.6%) |
Female Fertility in Beech Mountain Lakes
Fertility by Age in Beech Mountain Lakes
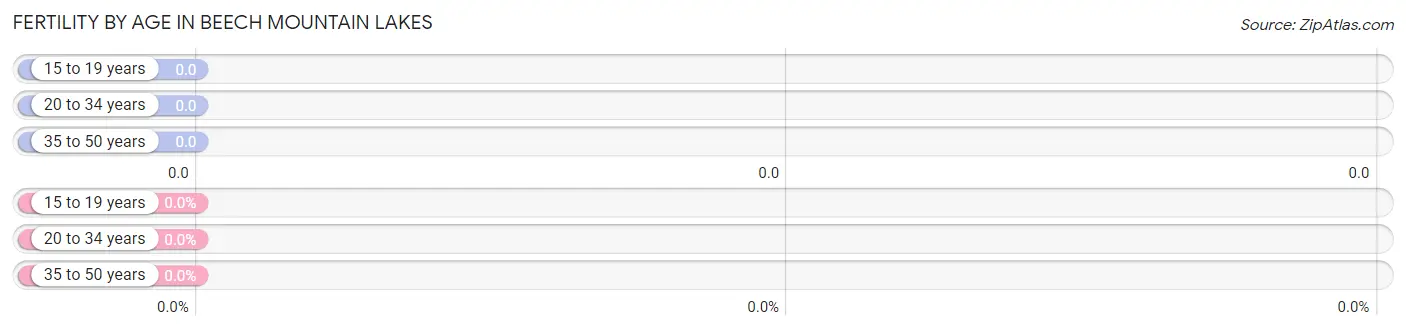
| Age Bracket | Women with Births | Births / 1,000 Women |
| 15 to 19 years | 0 (0.0%) | 0.0 |
| 20 to 34 years | 0 (0.0%) | 0.0 |
| 35 to 50 years | 0 (0.0%) | 0.0 |
| Total | 0 (0.0%) | 0.0 |
Fertility by Age by Marriage Status in Beech Mountain Lakes
| Age Bracket | Married | Unmarried |
| 15 to 19 years | 0 (0.0%) | 0 (0.0%) |
| 20 to 34 years | 0 (0.0%) | 0 (0.0%) |
| 35 to 50 years | 0 (0.0%) | 0 (0.0%) |
| Total | 0 (0.0%) | 0 (0.0%) |
Fertility by Education in Beech Mountain Lakes
| Educational Attainment | Women with Births | Births / 1,000 Women |
| Less than High School | 0 (0.0%) | 0.0 |
| High School Diploma | 0 (0.0%) | 0.0 |
| College or Associate's Degree | 0 (0.0%) | 0.0 |
| Bachelor's Degree | 0 (0.0%) | 0.0 |
| Graduate Degree | 0 (0.0%) | 0.0 |
| Total | 0 (0.0%) | 0.0 |
Fertility by Education by Marriage Status in Beech Mountain Lakes
| Educational Attainment | Married | Unmarried |
| Less than High School | 0 (0.0%) | 0 (0.0%) |
| High School Diploma | 0 (0.0%) | 0 (0.0%) |
| College or Associate's Degree | 0 (0.0%) | 0 (0.0%) |
| Bachelor's Degree | 0 (0.0%) | 0 (0.0%) |
| Graduate Degree | 0 (0.0%) | 0 (0.0%) |
| Total | 0 (0.0%) | 0 (0.0%) |
Income in Beech Mountain Lakes
Income Overview in Beech Mountain Lakes
Per Capita Income in Beech Mountain Lakes is $40,813, while median incomes of families and households are $116,979 and $109,342 respectively.
| Characteristic | Number | Measure |
| Per Capita Income | 1,940 | $40,813 |
| Median Family Income | 466 | $116,979 |
| Mean Family Income | 466 | $123,280 |
| Median Household Income | 618 | $109,342 |
| Mean Household Income | 618 | $121,112 |
| Income Deficit | 466 | $0 |
| Wage / Income Gap (%) | 1,940 | 10.67% |
| Wage / Income Gap ($) | 1,940 | 89.33¢ per $1 |
| Gini / Inequality Index | 1,940 | 0.39 |
Earnings by Sex in Beech Mountain Lakes
Average Earnings in Beech Mountain Lakes are $43,544, $48,324 for men and $43,170 for women, a difference of 10.7%.
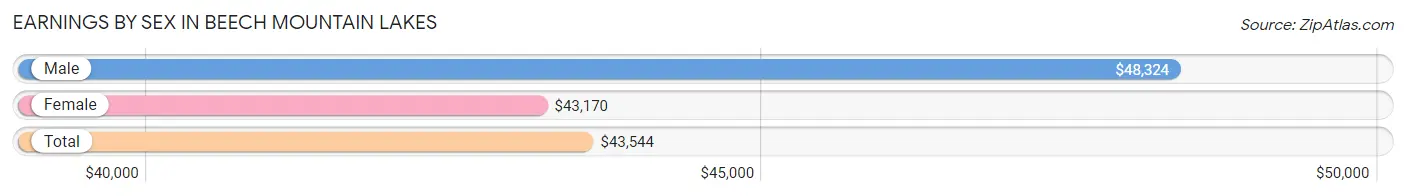
| Sex | Number | Average Earnings |
| Male | 534 (48.7%) | $48,324 |
| Female | 562 (51.3%) | $43,170 |
| Total | 1,096 (100.0%) | $43,544 |
Earnings by Sex by Income Bracket in Beech Mountain Lakes
The most common earnings brackets in Beech Mountain Lakes are $45,000 to $49,999 for men (88 | 16.5%) and $40,000 to $44,999 for women (194 | 34.5%).
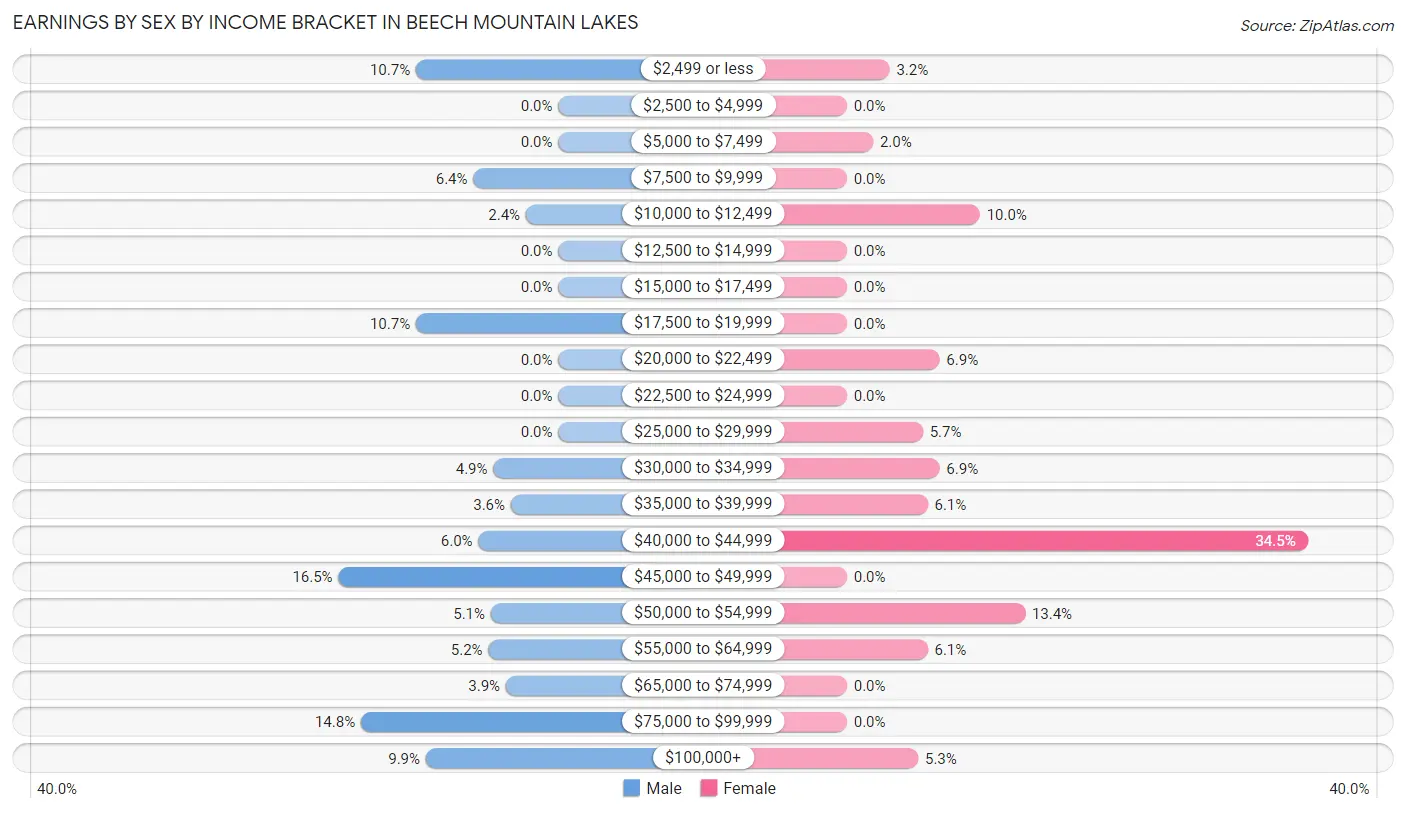
| Income | Male | Female |
| $2,499 or less | 57 (10.7%) | 18 (3.2%) |
| $2,500 to $4,999 | 0 (0.0%) | 0 (0.0%) |
| $5,000 to $7,499 | 0 (0.0%) | 11 (2.0%) |
| $7,500 to $9,999 | 34 (6.4%) | 0 (0.0%) |
| $10,000 to $12,499 | 13 (2.4%) | 56 (10.0%) |
| $12,500 to $14,999 | 0 (0.0%) | 0 (0.0%) |
| $15,000 to $17,499 | 0 (0.0%) | 0 (0.0%) |
| $17,500 to $19,999 | 57 (10.7%) | 0 (0.0%) |
| $20,000 to $22,499 | 0 (0.0%) | 39 (6.9%) |
| $22,500 to $24,999 | 0 (0.0%) | 0 (0.0%) |
| $25,000 to $29,999 | 0 (0.0%) | 32 (5.7%) |
| $30,000 to $34,999 | 26 (4.9%) | 39 (6.9%) |
| $35,000 to $39,999 | 19 (3.6%) | 34 (6.0%) |
| $40,000 to $44,999 | 32 (6.0%) | 194 (34.5%) |
| $45,000 to $49,999 | 88 (16.5%) | 0 (0.0%) |
| $50,000 to $54,999 | 27 (5.1%) | 75 (13.4%) |
| $55,000 to $64,999 | 28 (5.2%) | 34 (6.0%) |
| $65,000 to $74,999 | 21 (3.9%) | 0 (0.0%) |
| $75,000 to $99,999 | 79 (14.8%) | 0 (0.0%) |
| $100,000+ | 53 (9.9%) | 30 (5.3%) |
| Total | 534 (100.0%) | 562 (100.0%) |
Earnings by Sex by Educational Attainment in Beech Mountain Lakes
Average earnings in Beech Mountain Lakes are $50,729 for men and $43,628 for women, a difference of 14.0%. Men with an educational attainment of high school diploma enjoy the highest average annual earnings of $80,729, while those with college or associate's degree education earn the least with $49,787. Women with an educational attainment of high school diploma earn the most with the average annual earnings of $51,339, while those with college or associate's degree education have the smallest earnings of $27,266.
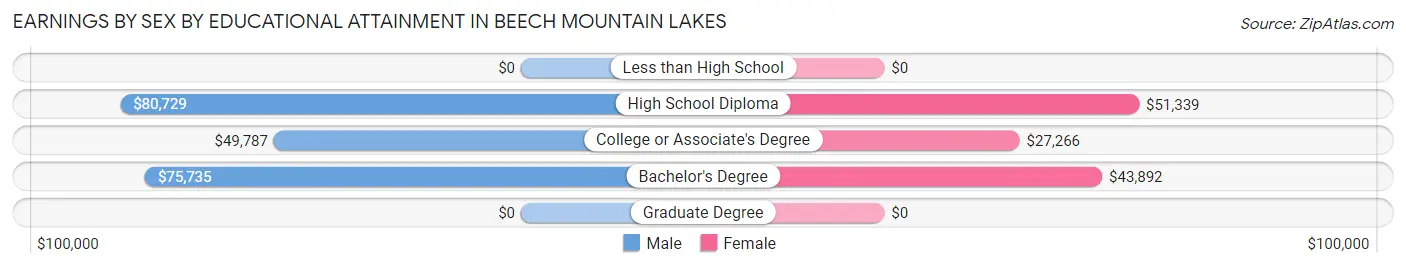
| Educational Attainment | Male Income | Female Income |
| Less than High School | - | - |
| High School Diploma | $80,729 | $51,339 |
| College or Associate's Degree | $49,787 | $27,266 |
| Bachelor's Degree | $75,735 | $43,892 |
| Graduate Degree | - | - |
| Total | $50,729 | $43,628 |
Family Income in Beech Mountain Lakes
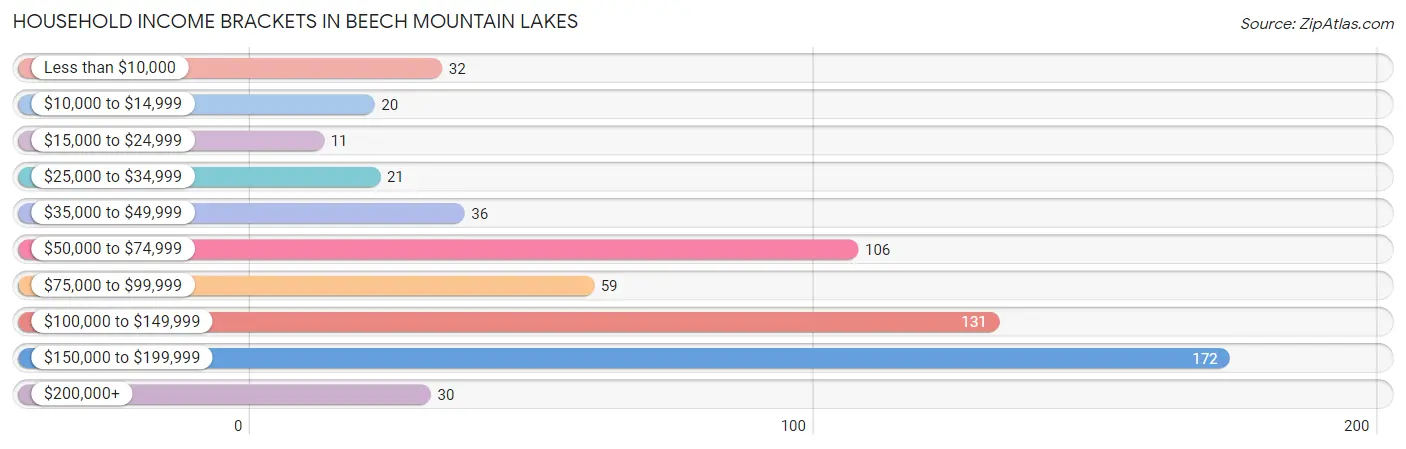
Family Income Brackets in Beech Mountain Lakes
According to the Beech Mountain Lakes family income data, there are 160 families falling into the $150,000 to $199,999 income range, which is the most common income bracket and makes up 34.3% of all families.
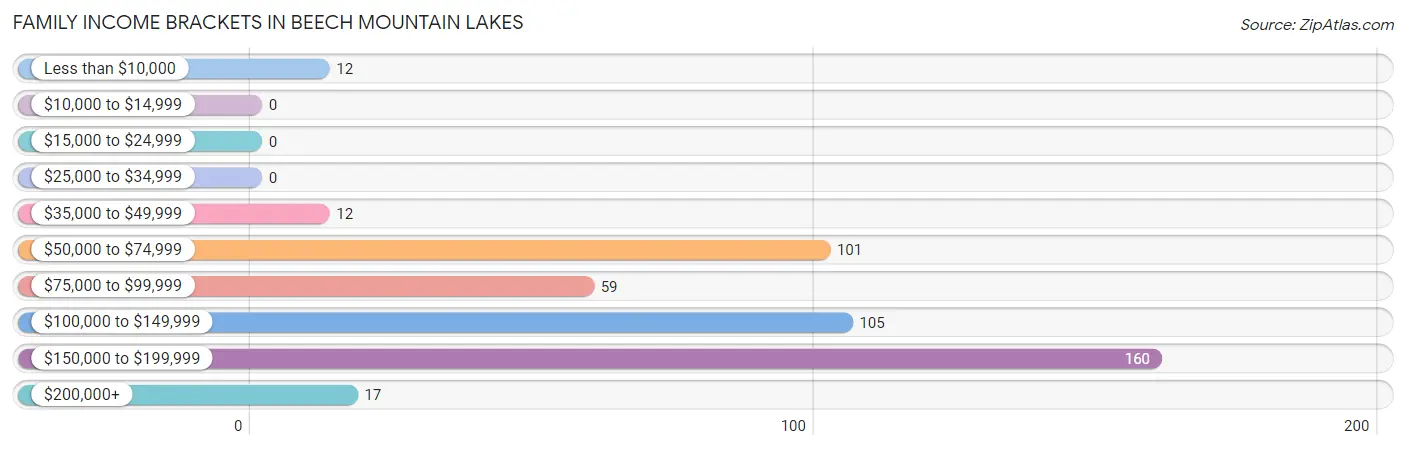
| Income Bracket | # Families | % Families |
| Less than $10,000 | 12 | 2.6% |
| $10,000 to $14,999 | 0 | 0.0% |
| $15,000 to $24,999 | 0 | 0.0% |
| $25,000 to $34,999 | 0 | 0.0% |
| $35,000 to $49,999 | 12 | 2.6% |
| $50,000 to $74,999 | 101 | 21.7% |
| $75,000 to $99,999 | 59 | 12.7% |
| $100,000 to $149,999 | 105 | 22.5% |
| $150,000 to $199,999 | 160 | 34.3% |
| $200,000+ | 17 | 3.6% |
Family Income by Famaliy Size in Beech Mountain Lakes
4-person families (125 | 26.8%) account for the highest median family income in Beech Mountain Lakes with $193,224 per family, while 4-person families (125 | 26.8%) have the highest median income of $48,306 per family member.
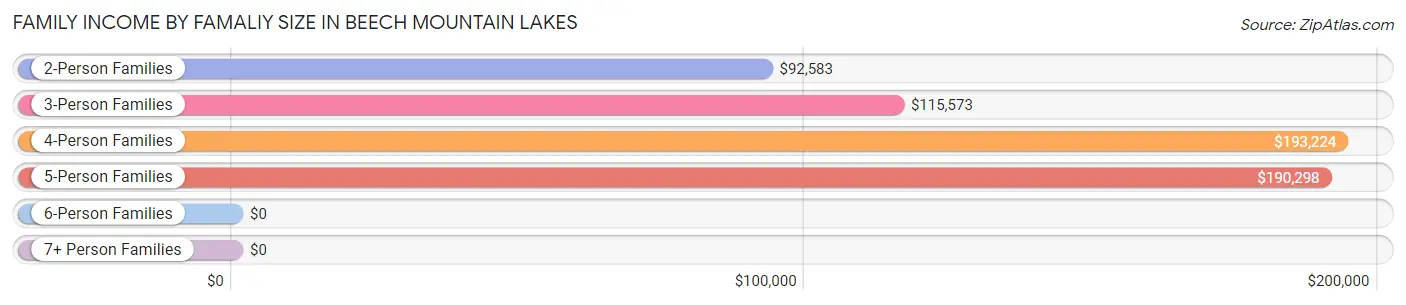
| Income Bracket | # Families | Median Income |
| 2-Person Families | 123 (26.4%) | $92,583 |
| 3-Person Families | 147 (31.6%) | $115,573 |
| 4-Person Families | 125 (26.8%) | $193,224 |
| 5-Person Families | 71 (15.2%) | $190,298 |
| 6-Person Families | 0 (0.0%) | $0 |
| 7+ Person Families | 0 (0.0%) | $0 |
| Total | 466 (100.0%) | $116,979 |
Family Income by Number of Earners in Beech Mountain Lakes
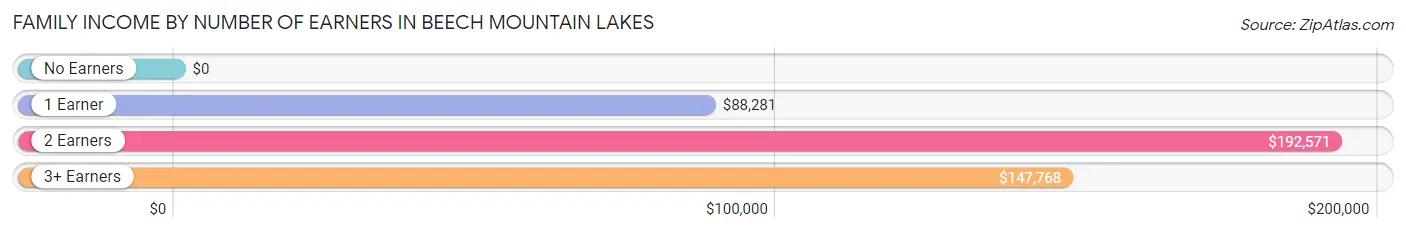
| Number of Earners | # Families | Median Income |
| No Earners | 58 (12.4%) | $0 |
| 1 Earner | 100 (21.5%) | $88,281 |
| 2 Earners | 171 (36.7%) | $192,571 |
| 3+ Earners | 137 (29.4%) | $147,768 |
| Total | 466 (100.0%) | $116,979 |
Household Income in Beech Mountain Lakes
Household Income Brackets in Beech Mountain Lakes
With 172 households falling in the category, the $150,000 to $199,999 income range is the most frequent in Beech Mountain Lakes, accounting for 27.8% of all households. In contrast, only 11 households (1.8%) fall into the $15,000 to $24,999 income bracket, making it the least populous group.
| Income Bracket | # Households | % Households |
| Less than $10,000 | 32 | 5.2% |
| $10,000 to $14,999 | 20 | 3.2% |
| $15,000 to $24,999 | 11 | 1.8% |
| $25,000 to $34,999 | 21 | 3.4% |
| $35,000 to $49,999 | 36 | 5.8% |
| $50,000 to $74,999 | 106 | 17.2% |
| $75,000 to $99,999 | 59 | 9.5% |
| $100,000 to $149,999 | 131 | 21.2% |
| $150,000 to $199,999 | 172 | 27.8% |
| $200,000+ | 30 | 4.9% |
Household Income by Householder Age in Beech Mountain Lakes
The median household income in Beech Mountain Lakes is $109,342, with the highest median household income of $133,984 found in the 25 to 44 years age bracket for the primary householder. A total of 147 households (23.8%) fall into this category.
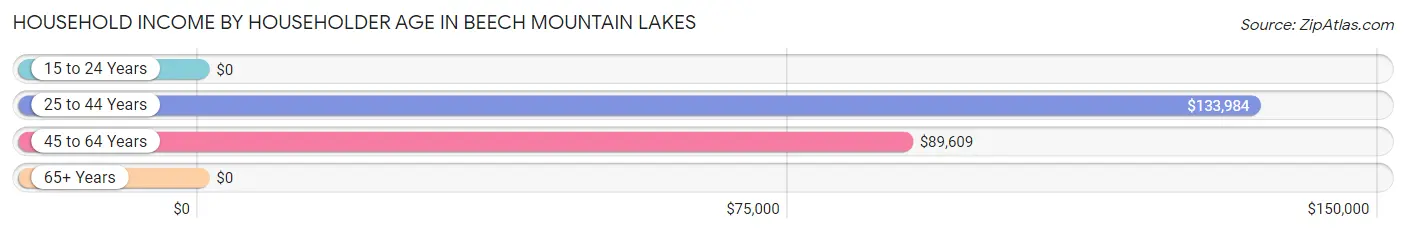
| Income Bracket | # Households | Median Income |
| 15 to 24 Years | 0 (0.0%) | $0 |
| 25 to 44 Years | 147 (23.8%) | $133,984 |
| 45 to 64 Years | 245 (39.6%) | $89,609 |
| 65+ Years | 226 (36.6%) | $0 |
| Total | 618 (100.0%) | $109,342 |
Poverty in Beech Mountain Lakes
Income Below Poverty by Sex and Age in Beech Mountain Lakes
With 1.3% poverty level for males and 8.0% for females among the residents of Beech Mountain Lakes, 12 to 14 year old males and 6 to 11 year old females are the most vulnerable to poverty, with 13 males (5.4%) and 12 females (100.0%) in their respective age groups living below the poverty level.
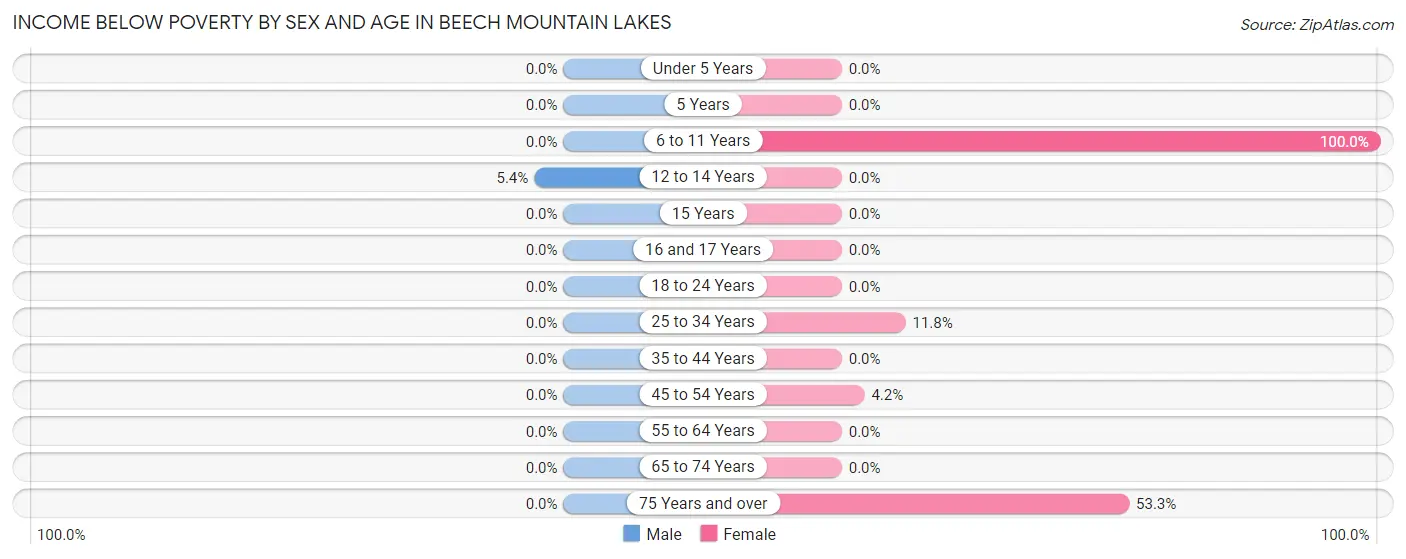
| Age Bracket | Male | Female |
| Under 5 Years | 0 (0.0%) | 0 (0.0%) |
| 5 Years | 0 (0.0%) | 0 (0.0%) |
| 6 to 11 Years | 0 (0.0%) | 12 (100.0%) |
| 12 to 14 Years | 13 (5.4%) | 0 (0.0%) |
| 15 Years | 0 (0.0%) | 0 (0.0%) |
| 16 and 17 Years | 0 (0.0%) | 0 (0.0%) |
| 18 to 24 Years | 0 (0.0%) | 0 (0.0%) |
| 25 to 34 Years | 0 (0.0%) | 11 (11.8%) |
| 35 to 44 Years | 0 (0.0%) | 0 (0.0%) |
| 45 to 54 Years | 0 (0.0%) | 12 (4.2%) |
| 55 to 64 Years | 0 (0.0%) | 0 (0.0%) |
| 65 to 74 Years | 0 (0.0%) | 0 (0.0%) |
| 75 Years and over | 0 (0.0%) | 40 (53.3%) |
| Total | 13 (1.3%) | 75 (8.0%) |
Income Above Poverty by Sex and Age in Beech Mountain Lakes
According to the poverty statistics in Beech Mountain Lakes, males aged under 5 years and females aged under 5 years are the age groups that are most secure financially, with 100.0% of males and 100.0% of females in these age groups living above the poverty line.
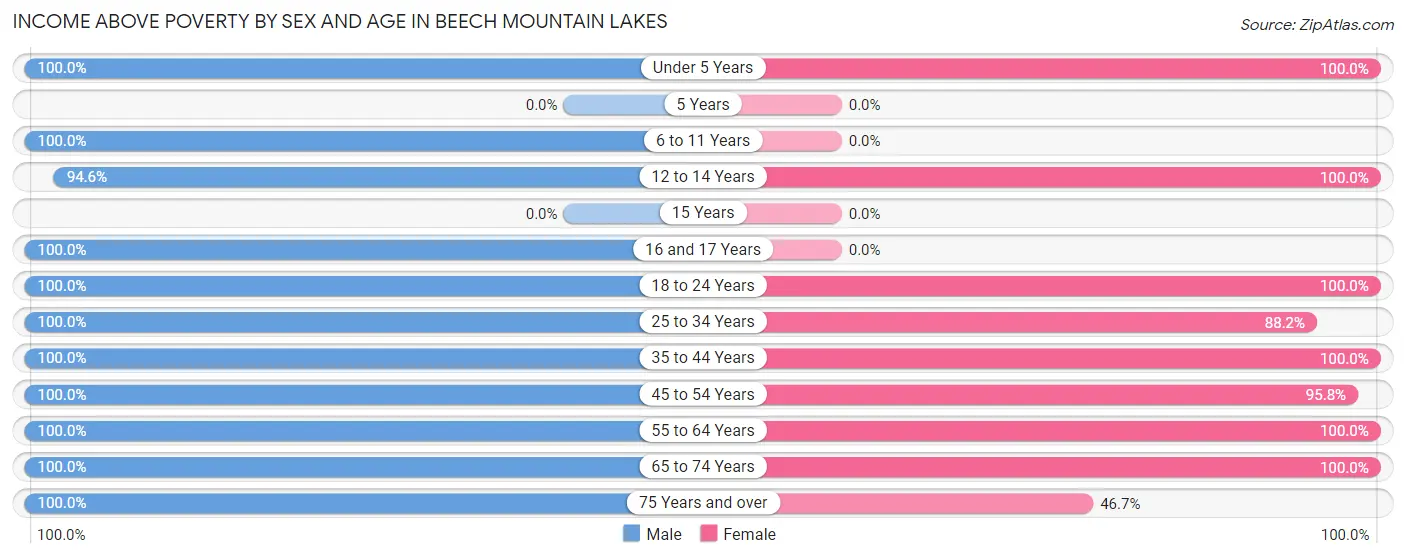
| Age Bracket | Male | Female |
| Under 5 Years | 51 (100.0%) | 32 (100.0%) |
| 5 Years | 0 (0.0%) | 0 (0.0%) |
| 6 to 11 Years | 61 (100.0%) | 0 (0.0%) |
| 12 to 14 Years | 227 (94.6%) | 25 (100.0%) |
| 15 Years | 0 (0.0%) | 0 (0.0%) |
| 16 and 17 Years | 26 (100.0%) | 0 (0.0%) |
| 18 to 24 Years | 125 (100.0%) | 71 (100.0%) |
| 25 to 34 Years | 35 (100.0%) | 82 (88.2%) |
| 35 to 44 Years | 96 (100.0%) | 81 (100.0%) |
| 45 to 54 Years | 96 (100.0%) | 273 (95.8%) |
| 55 to 64 Years | 92 (100.0%) | 132 (100.0%) |
| 65 to 74 Years | 121 (100.0%) | 128 (100.0%) |
| 75 Years and over | 63 (100.0%) | 35 (46.7%) |
| Total | 993 (98.7%) | 859 (92.0%) |
Income Below Poverty Among Married-Couple Families in Beech Mountain Lakes
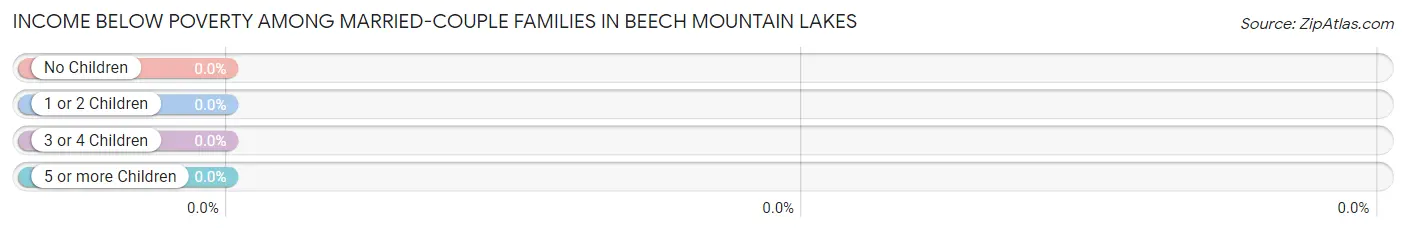
| Children | Above Poverty | Below Poverty |
| No Children | 130 (100.0%) | 0 (0.0%) |
| 1 or 2 Children | 186 (100.0%) | 0 (0.0%) |
| 3 or 4 Children | 21 (100.0%) | 0 (0.0%) |
| 5 or more Children | 0 (0.0%) | 0 (0.0%) |
| Total | 337 (100.0%) | 0 (0.0%) |
Income Below Poverty Among Single-Parent Households in Beech Mountain Lakes
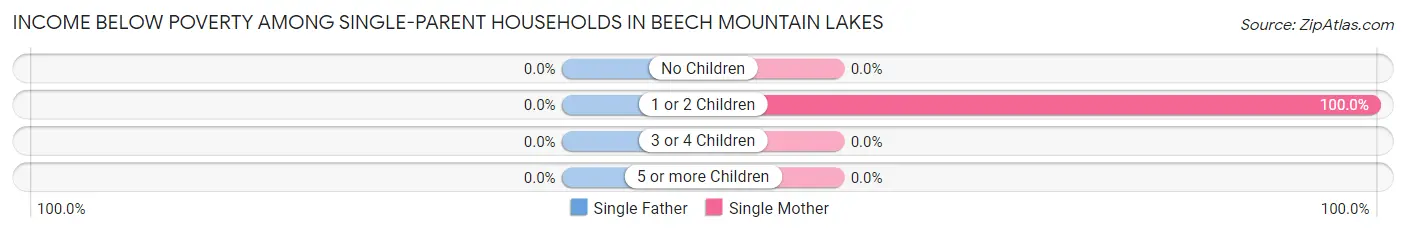
| Children | Single Father | Single Mother |
| No Children | 0 (0.0%) | 0 (0.0%) |
| 1 or 2 Children | 0 (0.0%) | 12 (100.0%) |
| 3 or 4 Children | 0 (0.0%) | 0 (0.0%) |
| 5 or more Children | 0 (0.0%) | 0 (0.0%) |
| Total | 0 (0.0%) | 12 (12.2%) |
Income Below Poverty Among Married-Couple vs Single-Parent Households in Beech Mountain Lakes
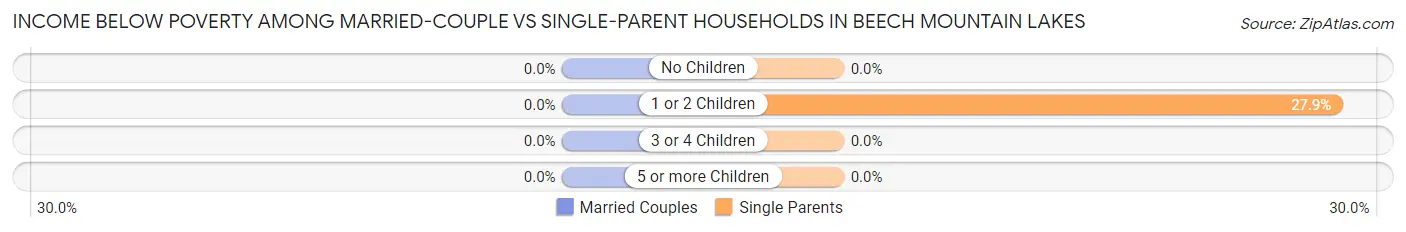
| Children | Married-Couple Families | Single-Parent Households |
| No Children | 0 (0.0%) | 0 (0.0%) |
| 1 or 2 Children | 0 (0.0%) | 12 (27.9%) |
| 3 or 4 Children | 0 (0.0%) | 0 (0.0%) |
| 5 or more Children | 0 (0.0%) | 0 (0.0%) |
| Total | 0 (0.0%) | 12 (9.3%) |
Employment Characteristics in Beech Mountain Lakes
Employment by Class of Employer in Beech Mountain Lakes
Among the 1,071 employed individuals in Beech Mountain Lakes, private company employees (800 | 74.7%), state government employees (88 | 8.2%), and self-employed (not incorporated) (79 | 7.4%) make up the most common classes of employment.
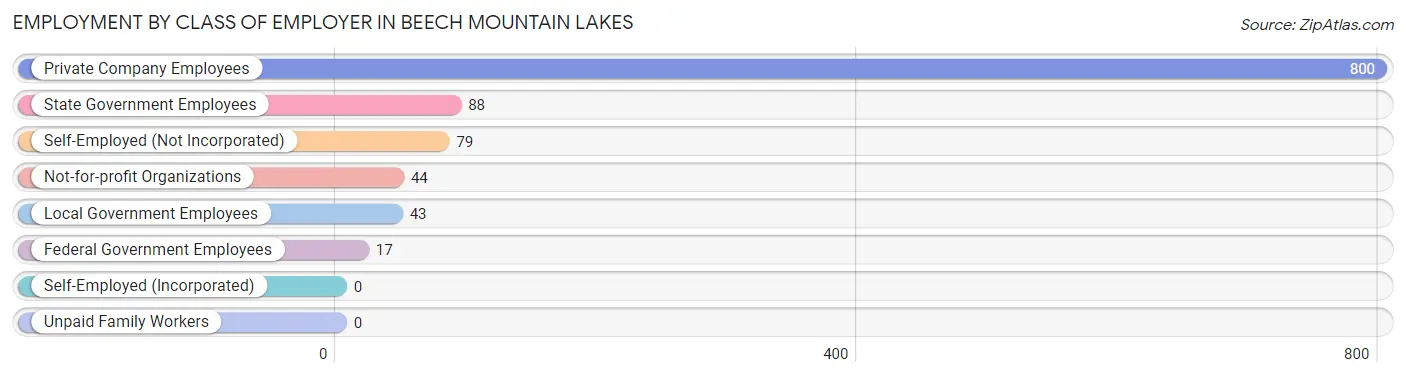
| Employer Class | # Employees | % Employees |
| Private Company Employees | 800 | 74.7% |
| Self-Employed (Incorporated) | 0 | 0.0% |
| Self-Employed (Not Incorporated) | 79 | 7.4% |
| Not-for-profit Organizations | 44 | 4.1% |
| Local Government Employees | 43 | 4.0% |
| State Government Employees | 88 | 8.2% |
| Federal Government Employees | 17 | 1.6% |
| Unpaid Family Workers | 0 | 0.0% |
| Total | 1,071 | 100.0% |
Employment Status by Age in Beech Mountain Lakes
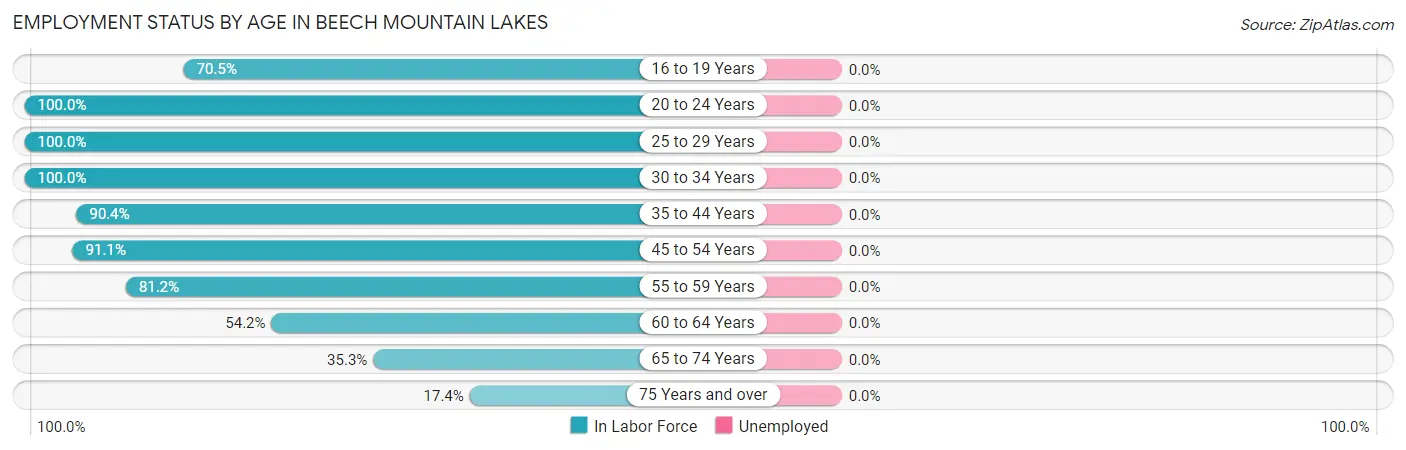
| Age Bracket | In Labor Force | Unemployed |
| 16 to 19 Years | 62 (70.5%) | 0 (0.0%) |
| 20 to 24 Years | 134 (100.0%) | 0 (0.0%) |
| 25 to 29 Years | 57 (100.0%) | 0 (0.0%) |
| 30 to 34 Years | 71 (100.0%) | 0 (0.0%) |
| 35 to 44 Years | 160 (90.4%) | 0 (0.0%) |
| 45 to 54 Years | 347 (91.1%) | 0 (0.0%) |
| 55 to 59 Years | 95 (81.2%) | 0 (0.0%) |
| 60 to 64 Years | 58 (54.2%) | 0 (0.0%) |
| 65 to 74 Years | 88 (35.3%) | 0 (0.0%) |
| 75 Years and over | 24 (17.4%) | 0 (0.0%) |
| Total | 1,097 (72.2%) | 0 (0.0%) |
Employment Status by Educational Attainment in Beech Mountain Lakes
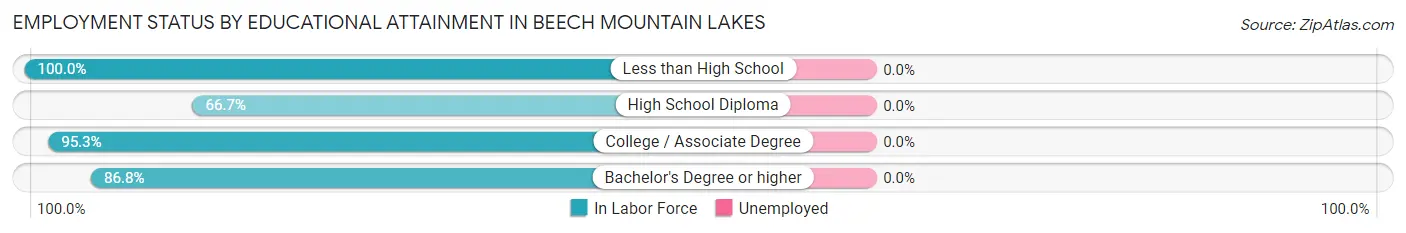
| Educational Attainment | In Labor Force | Unemployed |
| Less than High School | 48 (100.0%) | 0 (0.0%) |
| High School Diploma | 98 (66.7%) | 0 (0.0%) |
| College / Associate Degree | 241 (95.3%) | 0 (0.0%) |
| Bachelor's Degree or higher | 401 (86.8%) | 0 (0.0%) |
| Total | 788 (86.6%) | 0 (0.0%) |
Employment Occupations by Sex in Beech Mountain Lakes
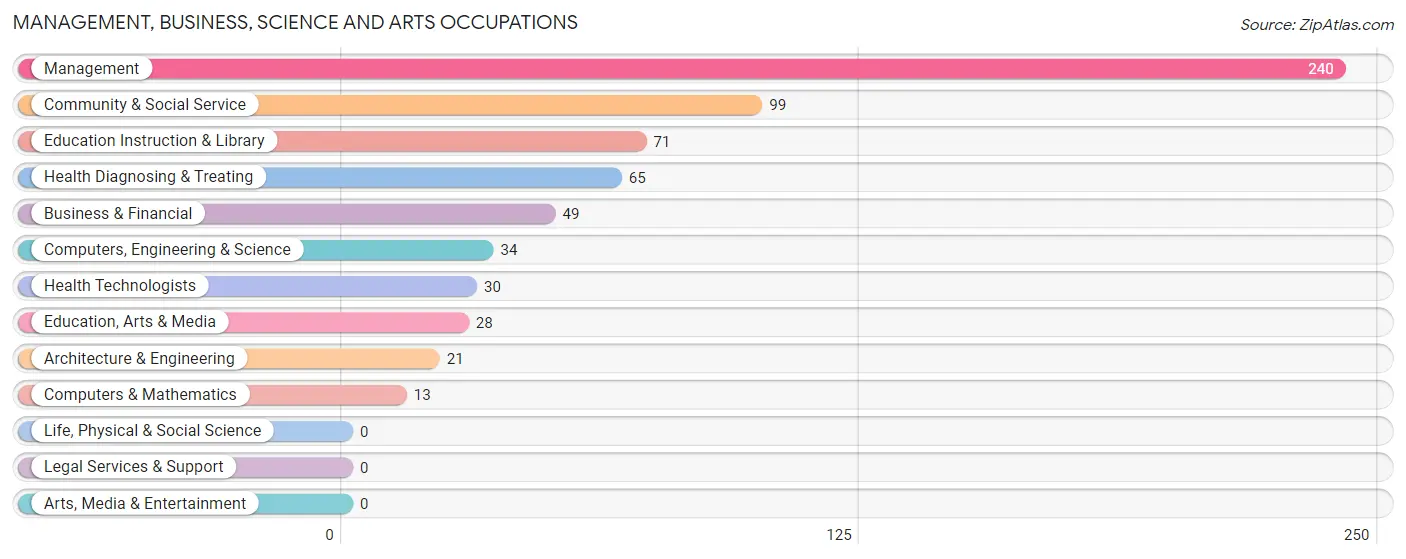
Management, Business, Science and Arts Occupations
The most common Management, Business, Science and Arts occupations in Beech Mountain Lakes are Management (240 | 21.9%), Community & Social Service (99 | 9.0%), Education Instruction & Library (71 | 6.5%), Health Diagnosing & Treating (65 | 5.9%), and Business & Financial (49 | 4.5%).
Management, Business, Science and Arts Occupations by Sex
Within the Management, Business, Science and Arts occupations in Beech Mountain Lakes, the most male-oriented occupations are Computers, Engineering & Science (100.0%), Computers & Mathematics (100.0%), and Architecture & Engineering (100.0%), while the most female-oriented occupations are Education, Arts & Media (100.0%), Health Diagnosing & Treating (100.0%), and Health Technologists (100.0%).
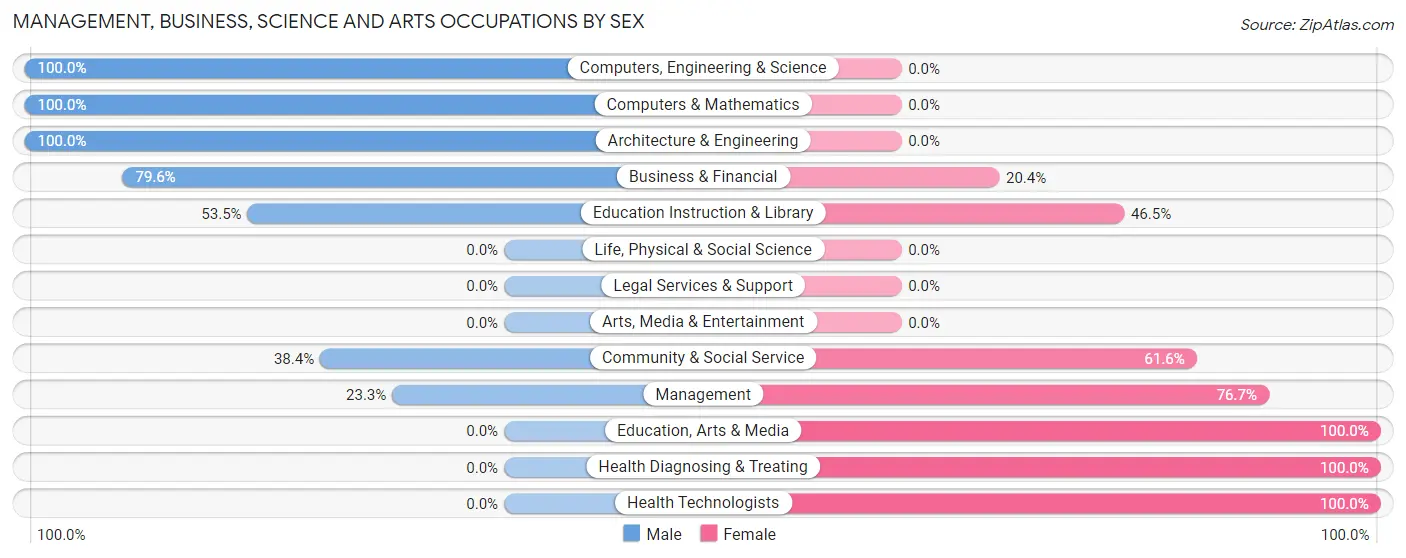
| Occupation | Male | Female |
| Management | 56 (23.3%) | 184 (76.7%) |
| Business & Financial | 39 (79.6%) | 10 (20.4%) |
| Computers, Engineering & Science | 34 (100.0%) | 0 (0.0%) |
| Computers & Mathematics | 13 (100.0%) | 0 (0.0%) |
| Architecture & Engineering | 21 (100.0%) | 0 (0.0%) |
| Life, Physical & Social Science | 0 (0.0%) | 0 (0.0%) |
| Community & Social Service | 38 (38.4%) | 61 (61.6%) |
| Education, Arts & Media | 0 (0.0%) | 28 (100.0%) |
| Legal Services & Support | 0 (0.0%) | 0 (0.0%) |
| Education Instruction & Library | 38 (53.5%) | 33 (46.5%) |
| Arts, Media & Entertainment | 0 (0.0%) | 0 (0.0%) |
| Health Diagnosing & Treating | 0 (0.0%) | 65 (100.0%) |
| Health Technologists | 0 (0.0%) | 30 (100.0%) |
| Total (Category) | 167 (34.3%) | 320 (65.7%) |
| Total (Overall) | 534 (48.7%) | 562 (51.3%) |
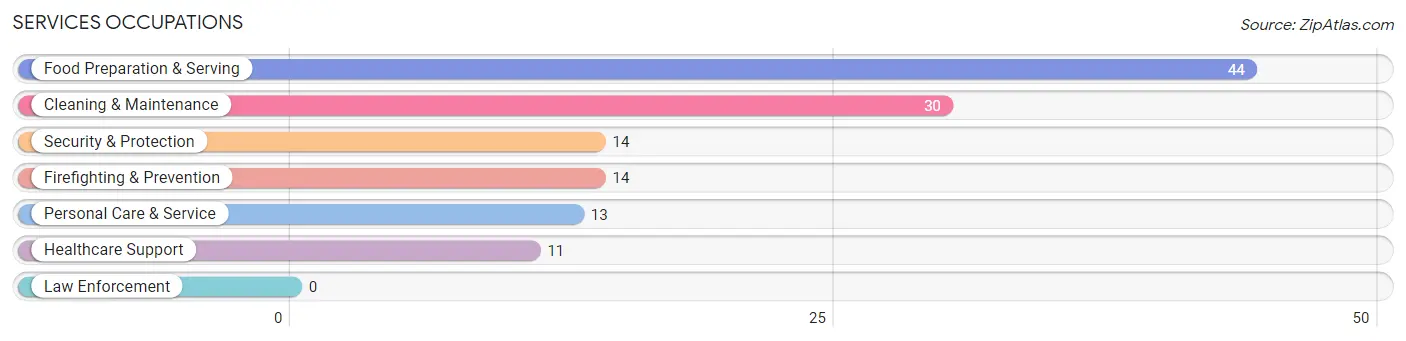
Services Occupations
The most common Services occupations in Beech Mountain Lakes are Food Preparation & Serving (44 | 4.0%), Cleaning & Maintenance (30 | 2.7%), Security & Protection (14 | 1.3%), Firefighting & Prevention (14 | 1.3%), and Personal Care & Service (13 | 1.2%).
Services Occupations by Sex
Within the Services occupations in Beech Mountain Lakes, the most male-oriented occupations are Security & Protection (100.0%), Firefighting & Prevention (100.0%), and Cleaning & Maintenance (100.0%), while the most female-oriented occupations are Healthcare Support (100.0%), and Food Preparation & Serving (70.5%).
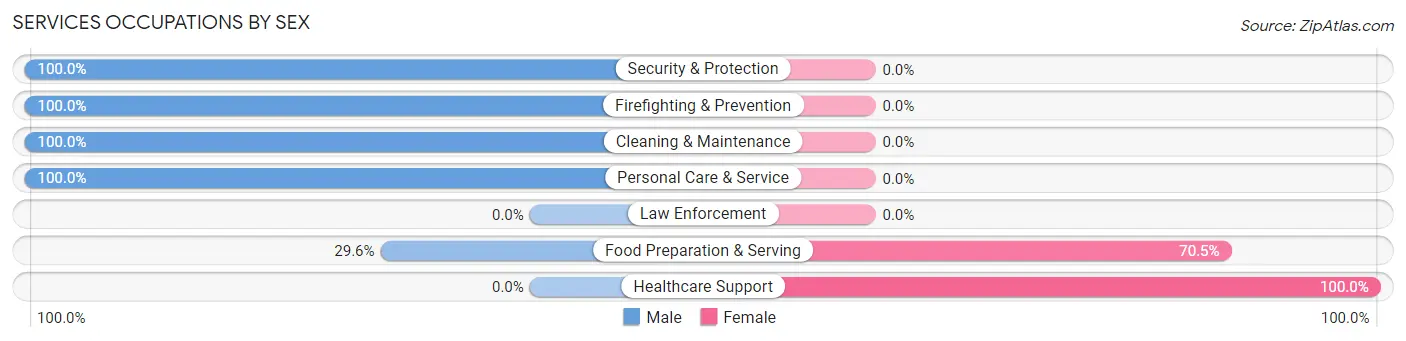
| Occupation | Male | Female |
| Healthcare Support | 0 (0.0%) | 11 (100.0%) |
| Security & Protection | 14 (100.0%) | 0 (0.0%) |
| Firefighting & Prevention | 14 (100.0%) | 0 (0.0%) |
| Law Enforcement | 0 (0.0%) | 0 (0.0%) |
| Food Preparation & Serving | 13 (29.5%) | 31 (70.5%) |
| Cleaning & Maintenance | 30 (100.0%) | 0 (0.0%) |
| Personal Care & Service | 13 (100.0%) | 0 (0.0%) |
| Total (Category) | 70 (62.5%) | 42 (37.5%) |
| Total (Overall) | 534 (48.7%) | 562 (51.3%) |
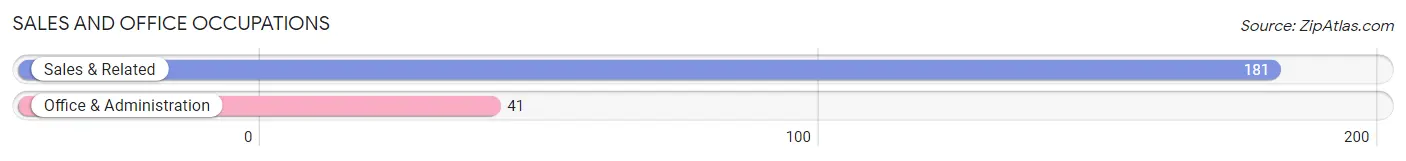
Sales and Office Occupations
The most common Sales and Office occupations in Beech Mountain Lakes are Sales & Related (181 | 16.5%), and Office & Administration (41 | 3.7%).
Sales and Office Occupations by Sex
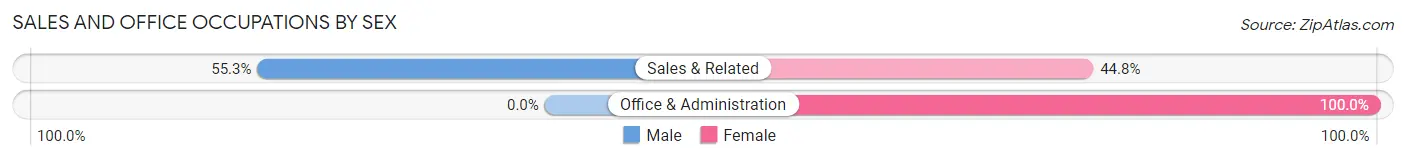
| Occupation | Male | Female |
| Sales & Related | 100 (55.2%) | 81 (44.8%) |
| Office & Administration | 0 (0.0%) | 41 (100.0%) |
| Total (Category) | 100 (45.1%) | 122 (54.9%) |
| Total (Overall) | 534 (48.7%) | 562 (51.3%) |
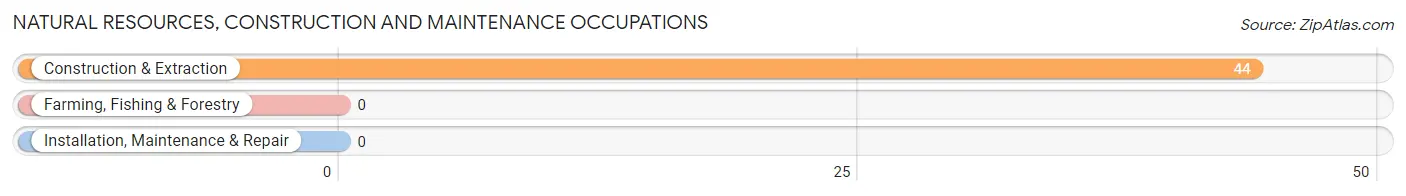
Natural Resources, Construction and Maintenance Occupations
The most common Natural Resources, Construction and Maintenance occupations in Beech Mountain Lakes are , and Construction & Extraction (44 | 4.0%).
Natural Resources, Construction and Maintenance Occupations by Sex
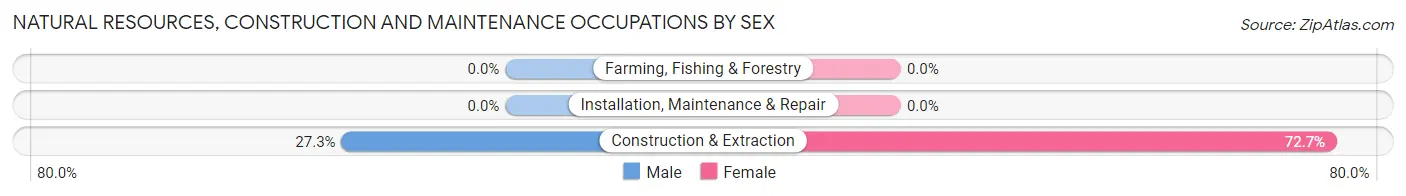
| Occupation | Male | Female |
| Farming, Fishing & Forestry | 0 (0.0%) | 0 (0.0%) |
| Construction & Extraction | 12 (27.3%) | 32 (72.7%) |
| Installation, Maintenance & Repair | 0 (0.0%) | 0 (0.0%) |
| Total (Category) | 12 (27.3%) | 32 (72.7%) |
| Total (Overall) | 534 (48.7%) | 562 (51.3%) |
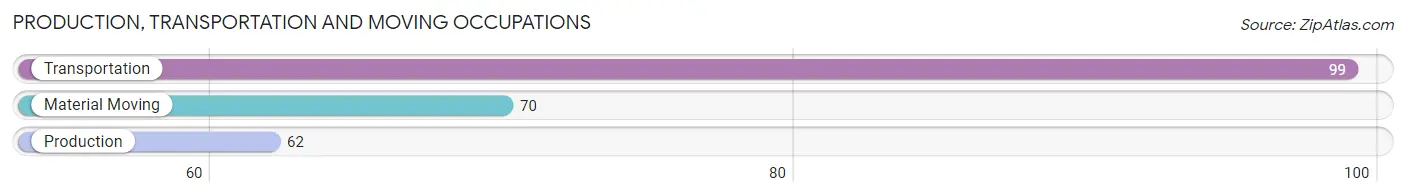
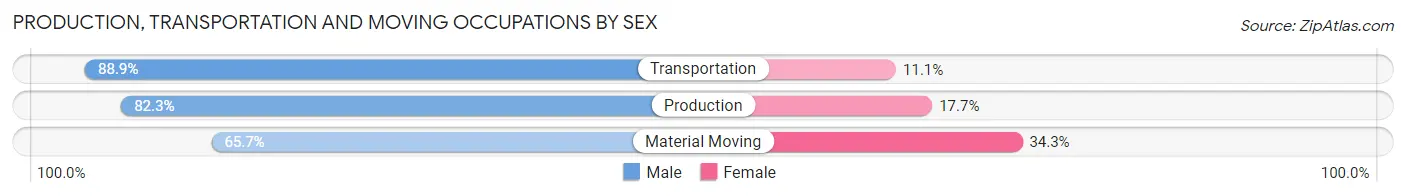
Production, Transportation and Moving Occupations
The most common Production, Transportation and Moving occupations in Beech Mountain Lakes are Transportation (99 | 9.0%), Material Moving (70 | 6.4%), and Production (62 | 5.7%).
Production, Transportation and Moving Occupations by Sex
| Occupation | Male | Female |
| Production | 51 (82.3%) | 11 (17.7%) |
| Transportation | 88 (88.9%) | 11 (11.1%) |
| Material Moving | 46 (65.7%) | 24 (34.3%) |
| Total (Category) | 185 (80.1%) | 46 (19.9%) |
| Total (Overall) | 534 (48.7%) | 562 (51.3%) |
Employment Industries by Sex in Beech Mountain Lakes
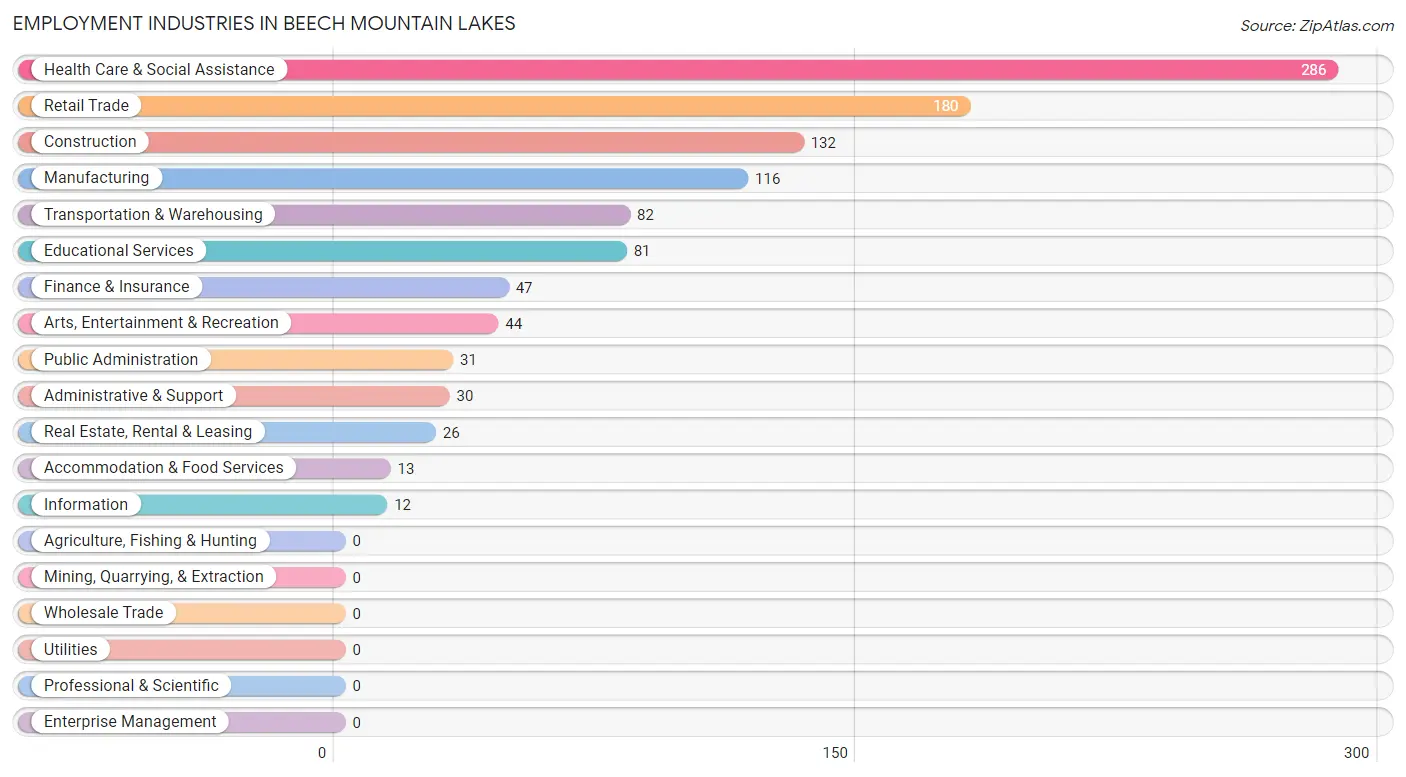
Employment Industries in Beech Mountain Lakes
The major employment industries in Beech Mountain Lakes include Health Care & Social Assistance (286 | 26.1%), Retail Trade (180 | 16.4%), Construction (132 | 12.0%), Manufacturing (116 | 10.6%), and Transportation & Warehousing (82 | 7.5%).
Employment Industries by Sex in Beech Mountain Lakes
The Beech Mountain Lakes industries that see more men than women are Manufacturing (100.0%), Information (100.0%), and Real Estate, Rental & Leasing (100.0%), whereas the industries that tend to have a higher number of women are Health Care & Social Assistance (100.0%), Arts, Entertainment & Recreation (70.5%), and Transportation & Warehousing (56.1%).
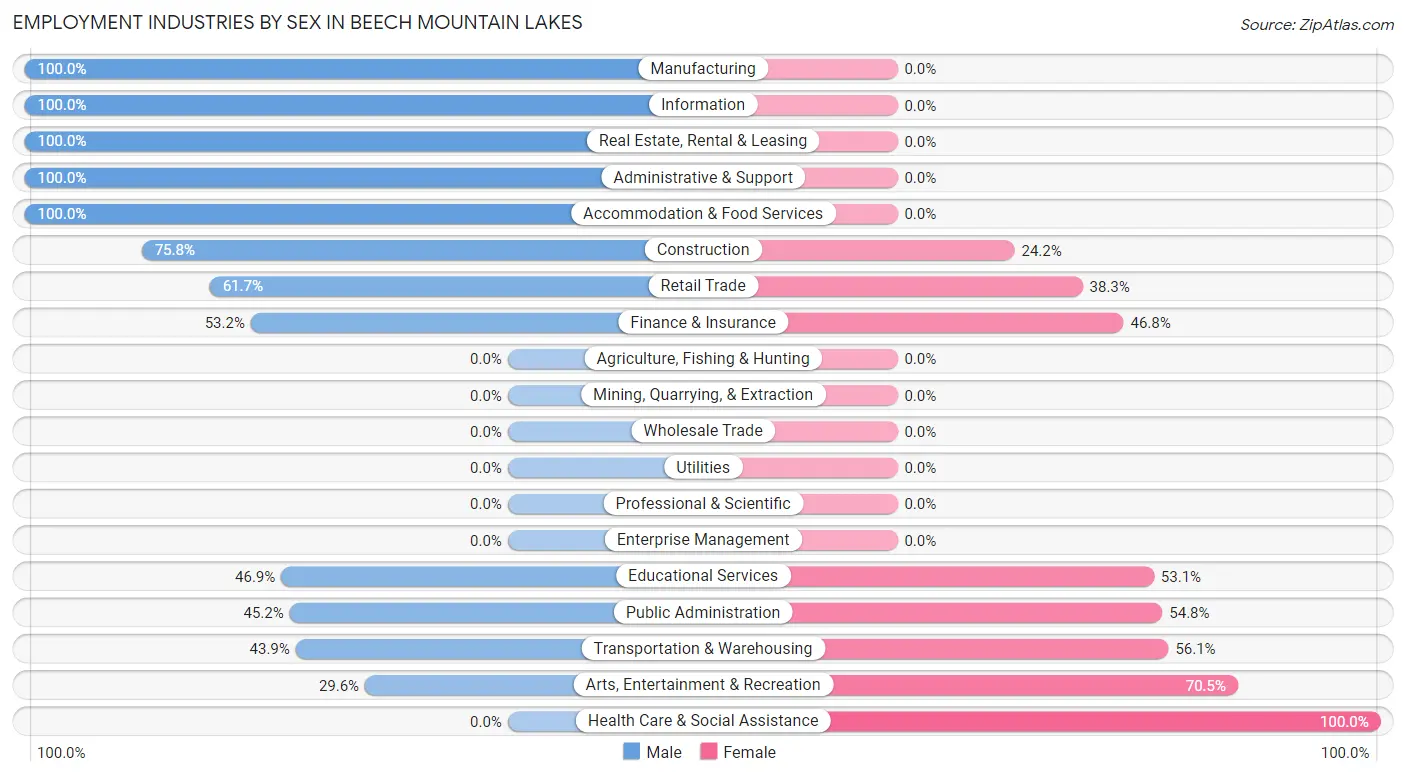
| Industry | Male | Female |
| Agriculture, Fishing & Hunting | 0 (0.0%) | 0 (0.0%) |
| Mining, Quarrying, & Extraction | 0 (0.0%) | 0 (0.0%) |
| Construction | 100 (75.8%) | 32 (24.2%) |
| Manufacturing | 116 (100.0%) | 0 (0.0%) |
| Wholesale Trade | 0 (0.0%) | 0 (0.0%) |
| Retail Trade | 111 (61.7%) | 69 (38.3%) |
| Transportation & Warehousing | 36 (43.9%) | 46 (56.1%) |
| Utilities | 0 (0.0%) | 0 (0.0%) |
| Information | 12 (100.0%) | 0 (0.0%) |
| Finance & Insurance | 25 (53.2%) | 22 (46.8%) |
| Real Estate, Rental & Leasing | 26 (100.0%) | 0 (0.0%) |
| Professional & Scientific | 0 (0.0%) | 0 (0.0%) |
| Enterprise Management | 0 (0.0%) | 0 (0.0%) |
| Administrative & Support | 30 (100.0%) | 0 (0.0%) |
| Educational Services | 38 (46.9%) | 43 (53.1%) |
| Health Care & Social Assistance | 0 (0.0%) | 286 (100.0%) |
| Arts, Entertainment & Recreation | 13 (29.5%) | 31 (70.5%) |
| Accommodation & Food Services | 13 (100.0%) | 0 (0.0%) |
| Public Administration | 14 (45.2%) | 17 (54.8%) |
| Total | 534 (48.7%) | 562 (51.3%) |
Education in Beech Mountain Lakes
School Enrollment in Beech Mountain Lakes
The most common levels of schooling among the 559 students in Beech Mountain Lakes are middle school (254 | 45.4%), college / undergraduate (133 | 23.8%), and high school (81 | 14.5%).
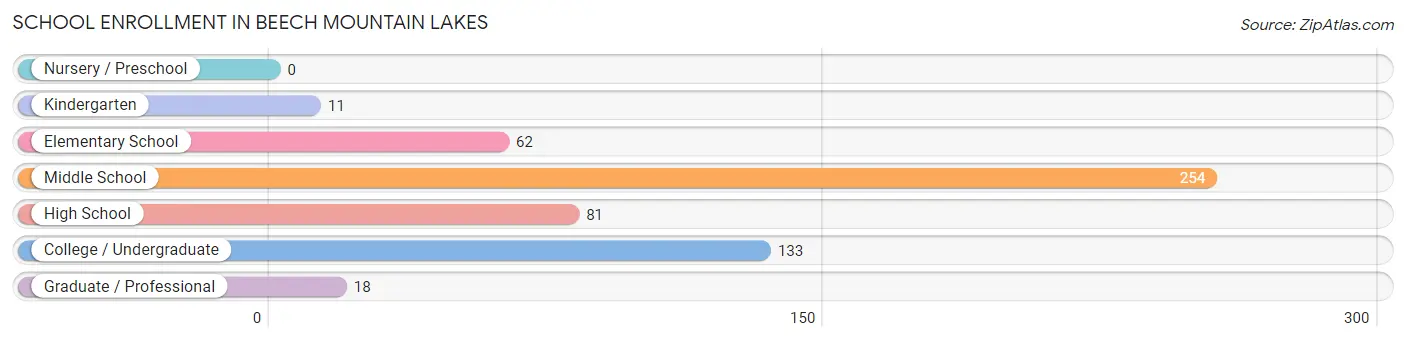
| School Level | # Students | % Students |
| Nursery / Preschool | 0 | 0.0% |
| Kindergarten | 11 | 2.0% |
| Elementary School | 62 | 11.1% |
| Middle School | 254 | 45.4% |
| High School | 81 | 14.5% |
| College / Undergraduate | 133 | 23.8% |
| Graduate / Professional | 18 | 3.2% |
| Total | 559 | 100.0% |
School Enrollment by Age by Funding Source in Beech Mountain Lakes
Out of a total of 559 students who are enrolled in schools in Beech Mountain Lakes, 85 (15.2%) attend a private institution, while the remaining 474 (84.8%) are enrolled in public schools. The age group of 25 to 34 year olds has the highest likelihood of being enrolled in private schools, with 16 (100.0% in the age bracket) enrolled. Conversely, the age group of 15 to 17 year olds has the lowest likelihood of being enrolled in a private school, with 26 (100.0% in the age bracket) attending a public institution.
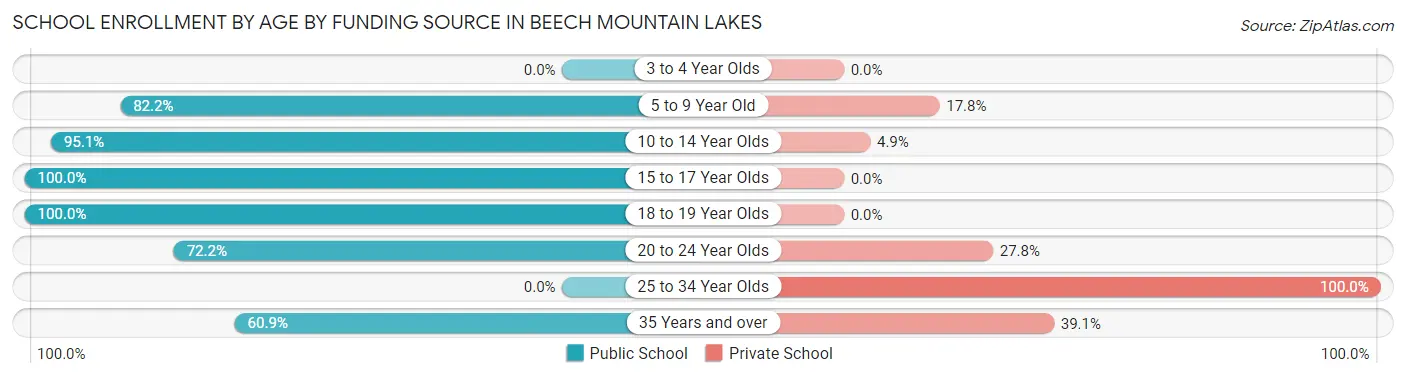
| Age Bracket | Public School | Private School |
| 3 to 4 Year Olds | 0 (0.0%) | 0 (0.0%) |
| 5 to 9 Year Old | 60 (82.2%) | 13 (17.8%) |
| 10 to 14 Year Olds | 252 (95.1%) | 13 (4.9%) |
| 15 to 17 Year Olds | 26 (100.0%) | 0 (0.0%) |
| 18 to 19 Year Olds | 43 (100.0%) | 0 (0.0%) |
| 20 to 24 Year Olds | 65 (72.2%) | 25 (27.8%) |
| 25 to 34 Year Olds | 0 (0.0%) | 16 (100.0%) |
| 35 Years and over | 28 (60.9%) | 18 (39.1%) |
| Total | 474 (84.8%) | 85 (15.2%) |
Educational Attainment by Field of Study in Beech Mountain Lakes
Arts & humanities (215 | 34.1%), business (106 | 16.8%), science & technology (103 | 16.3%), education (80 | 12.7%), and communications (33 | 5.2%) are the most common fields of study among 631 individuals in Beech Mountain Lakes who have obtained a bachelor's degree or higher.
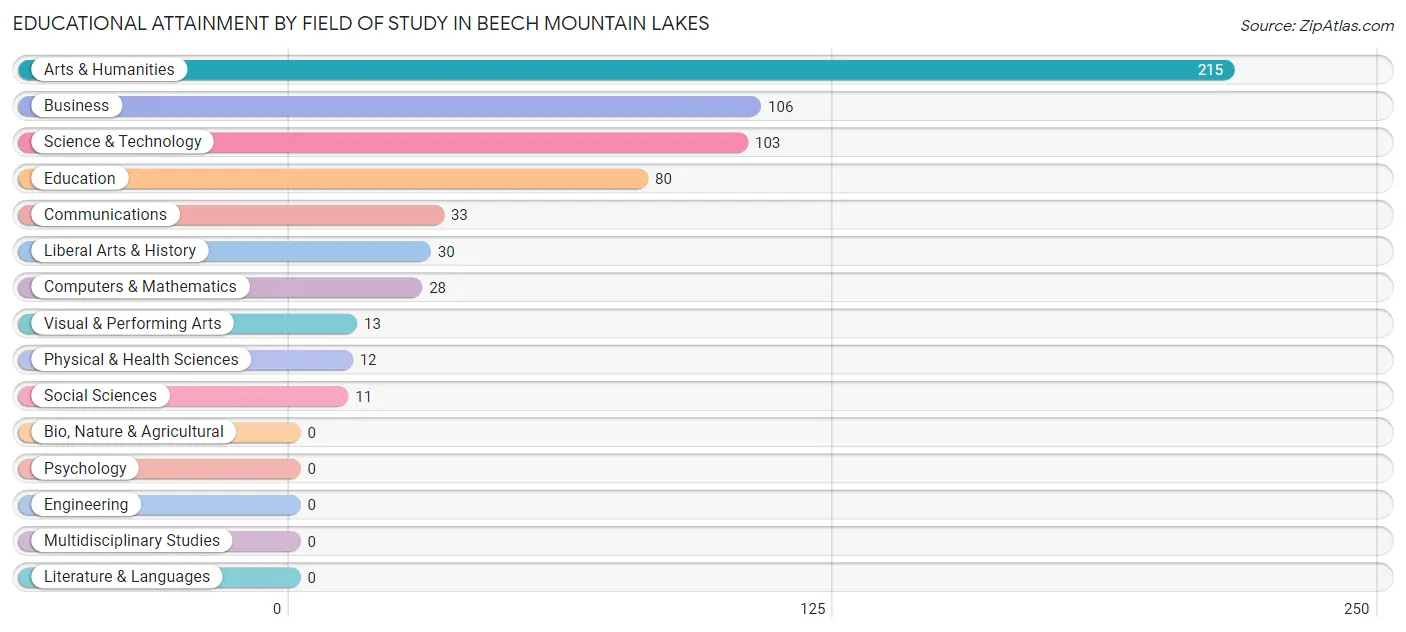
| Field of Study | # Graduates | % Graduates |
| Computers & Mathematics | 28 | 4.4% |
| Bio, Nature & Agricultural | 0 | 0.0% |
| Physical & Health Sciences | 12 | 1.9% |
| Psychology | 0 | 0.0% |
| Social Sciences | 11 | 1.7% |
| Engineering | 0 | 0.0% |
| Multidisciplinary Studies | 0 | 0.0% |
| Science & Technology | 103 | 16.3% |
| Business | 106 | 16.8% |
| Education | 80 | 12.7% |
| Literature & Languages | 0 | 0.0% |
| Liberal Arts & History | 30 | 4.8% |
| Visual & Performing Arts | 13 | 2.1% |
| Communications | 33 | 5.2% |
| Arts & Humanities | 215 | 34.1% |
| Total | 631 | 100.0% |
Transportation & Commute in Beech Mountain Lakes
Vehicle Availability by Sex in Beech Mountain Lakes
The most prevalent vehicle ownership categories in Beech Mountain Lakes are males with 3 vehicles (260, accounting for 51.1%) and females with 3 vehicles (354, making up 46.3%).
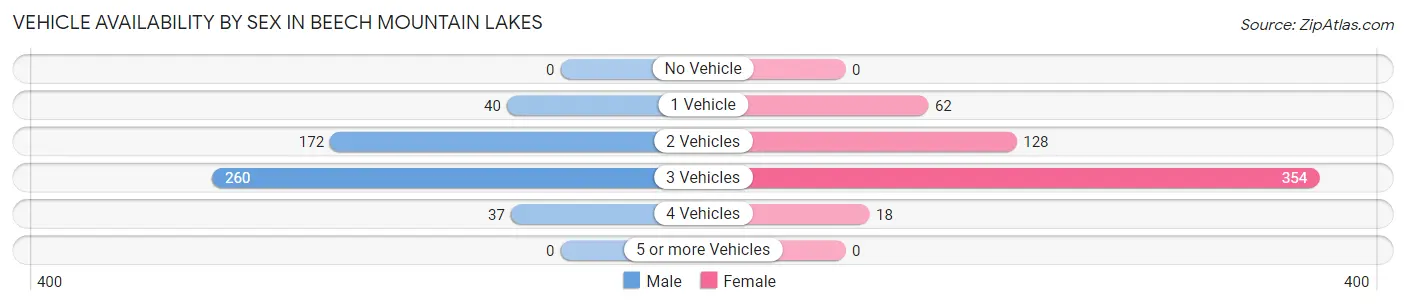
| Vehicles Available | Male | Female |
| No Vehicle | 0 (0.0%) | 0 (0.0%) |
| 1 Vehicle | 40 (7.9%) | 62 (11.0%) |
| 2 Vehicles | 172 (33.8%) | 128 (22.8%) |
| 3 Vehicles | 260 (51.1%) | 354 (63.0%) |
| 4 Vehicles | 37 (7.3%) | 18 (3.2%) |
| 5 or more Vehicles | 0 (0.0%) | 0 (0.0%) |
| Total | 509 (100.0%) | 562 (100.0%) |
Commute Time in Beech Mountain Lakes
The most frequently occuring commute durations in Beech Mountain Lakes are 5 to 9 minutes (197 commuters, 19.2%), 10 to 14 minutes (188 commuters, 18.3%), and 15 to 19 minutes (127 commuters, 12.4%).
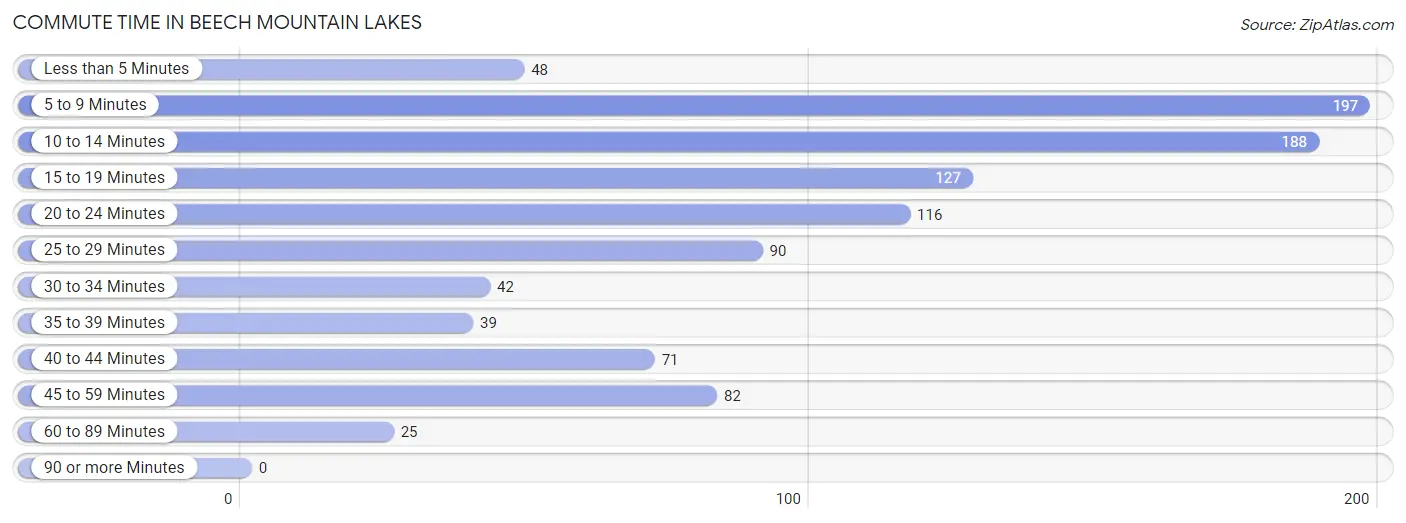
| Commute Time | # Commuters | % Commuters |
| Less than 5 Minutes | 48 | 4.7% |
| 5 to 9 Minutes | 197 | 19.2% |
| 10 to 14 Minutes | 188 | 18.3% |
| 15 to 19 Minutes | 127 | 12.4% |
| 20 to 24 Minutes | 116 | 11.3% |
| 25 to 29 Minutes | 90 | 8.8% |
| 30 to 34 Minutes | 42 | 4.1% |
| 35 to 39 Minutes | 39 | 3.8% |
| 40 to 44 Minutes | 71 | 6.9% |
| 45 to 59 Minutes | 82 | 8.0% |
| 60 to 89 Minutes | 25 | 2.4% |
| 90 or more Minutes | 0 | 0.0% |
Commute Time by Sex in Beech Mountain Lakes
The most common commute times in Beech Mountain Lakes are 10 to 14 minutes (133 commuters, 27.7%) for males and 5 to 9 minutes (184 commuters, 33.8%) for females.
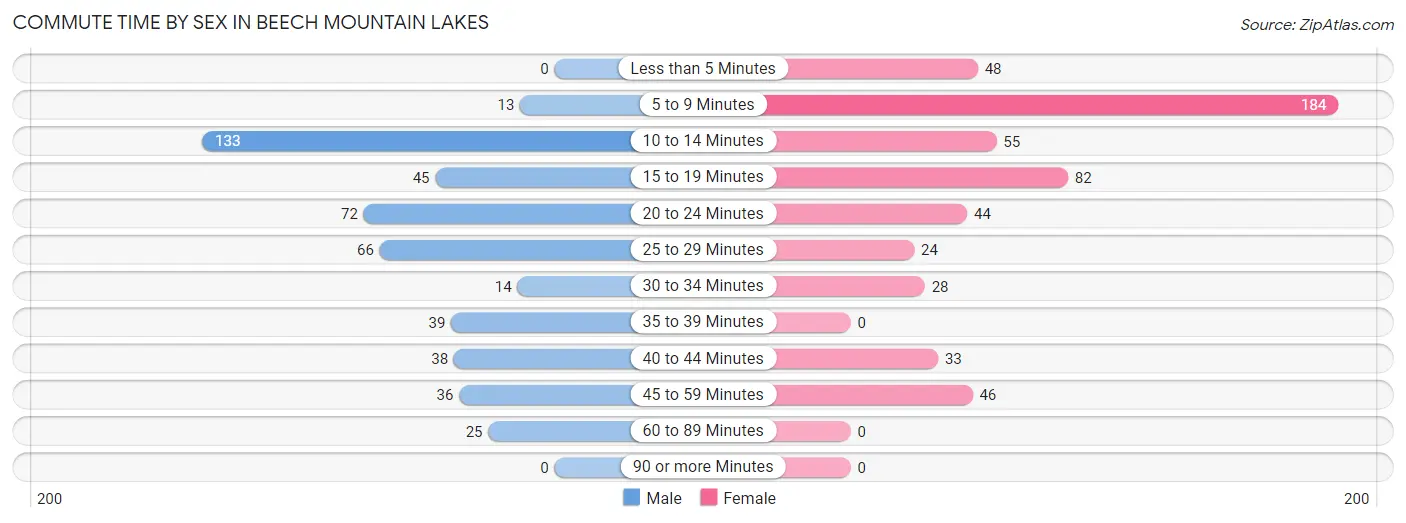
| Commute Time | Male | Female |
| Less than 5 Minutes | 0 (0.0%) | 48 (8.8%) |
| 5 to 9 Minutes | 13 (2.7%) | 184 (33.8%) |
| 10 to 14 Minutes | 133 (27.7%) | 55 (10.1%) |
| 15 to 19 Minutes | 45 (9.4%) | 82 (15.1%) |
| 20 to 24 Minutes | 72 (15.0%) | 44 (8.1%) |
| 25 to 29 Minutes | 66 (13.7%) | 24 (4.4%) |
| 30 to 34 Minutes | 14 (2.9%) | 28 (5.1%) |
| 35 to 39 Minutes | 39 (8.1%) | 0 (0.0%) |
| 40 to 44 Minutes | 38 (7.9%) | 33 (6.1%) |
| 45 to 59 Minutes | 36 (7.5%) | 46 (8.5%) |
| 60 to 89 Minutes | 25 (5.2%) | 0 (0.0%) |
| 90 or more Minutes | 0 (0.0%) | 0 (0.0%) |
Time of Departure to Work by Sex in Beech Mountain Lakes
The most frequent times of departure to work in Beech Mountain Lakes are 12:00 PM to 3:59 PM (114, 23.7%) for males and 7:00 AM to 7:29 AM (305, 56.1%) for females.
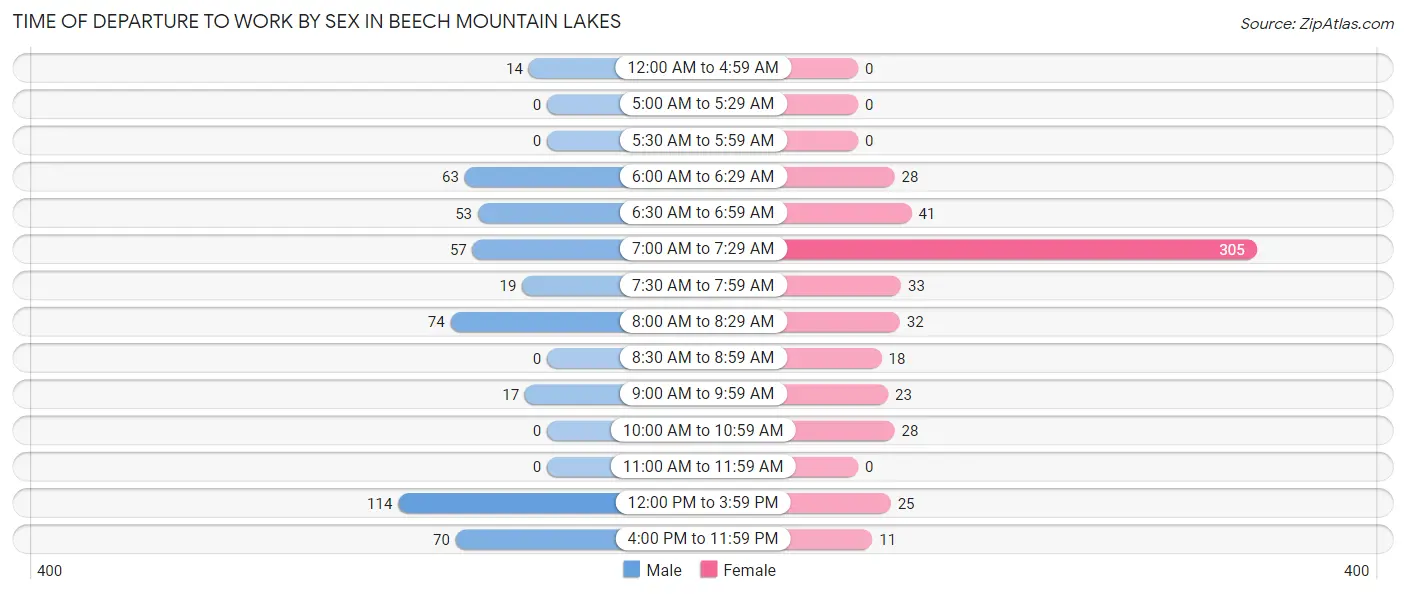
| Time of Departure | Male | Female |
| 12:00 AM to 4:59 AM | 14 (2.9%) | 0 (0.0%) |
| 5:00 AM to 5:29 AM | 0 (0.0%) | 0 (0.0%) |
| 5:30 AM to 5:59 AM | 0 (0.0%) | 0 (0.0%) |
| 6:00 AM to 6:29 AM | 63 (13.1%) | 28 (5.1%) |
| 6:30 AM to 6:59 AM | 53 (11.0%) | 41 (7.5%) |
| 7:00 AM to 7:29 AM | 57 (11.8%) | 305 (56.1%) |
| 7:30 AM to 7:59 AM | 19 (4.0%) | 33 (6.1%) |
| 8:00 AM to 8:29 AM | 74 (15.4%) | 32 (5.9%) |
| 8:30 AM to 8:59 AM | 0 (0.0%) | 18 (3.3%) |
| 9:00 AM to 9:59 AM | 17 (3.5%) | 23 (4.2%) |
| 10:00 AM to 10:59 AM | 0 (0.0%) | 28 (5.1%) |
| 11:00 AM to 11:59 AM | 0 (0.0%) | 0 (0.0%) |
| 12:00 PM to 3:59 PM | 114 (23.7%) | 25 (4.6%) |
| 4:00 PM to 11:59 PM | 70 (14.5%) | 11 (2.0%) |
| Total | 481 (100.0%) | 544 (100.0%) |
Housing Occupancy in Beech Mountain Lakes
Occupancy by Ownership in Beech Mountain Lakes
Of the total 618 dwellings in Beech Mountain Lakes, owner-occupied units account for 590 (95.5%), while renter-occupied units make up 28 (4.5%).
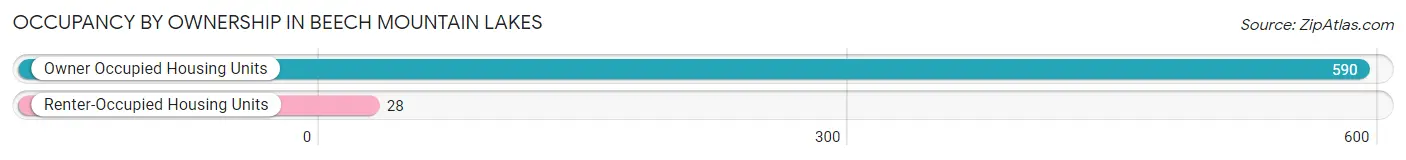
| Occupancy | # Housing Units | % Housing Units |
| Owner Occupied Housing Units | 590 | 95.5% |
| Renter-Occupied Housing Units | 28 | 4.5% |
| Total Occupied Housing Units | 618 | 100.0% |
Occupancy by Household Size in Beech Mountain Lakes
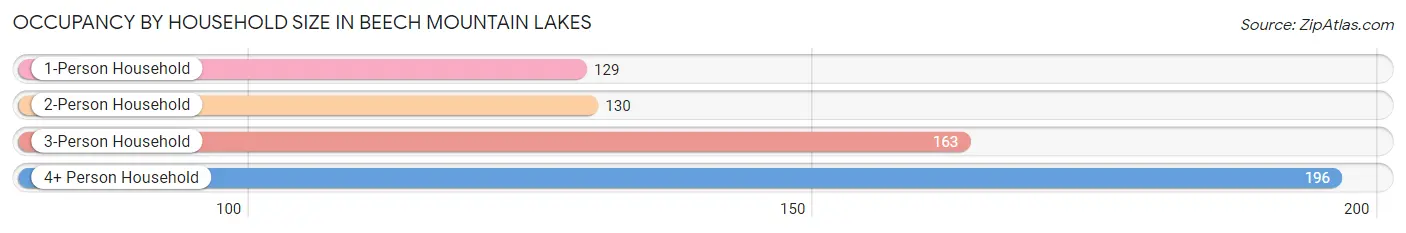
| Household Size | # Housing Units | % Housing Units |
| 1-Person Household | 129 | 20.9% |
| 2-Person Household | 130 | 21.0% |
| 3-Person Household | 163 | 26.4% |
| 4+ Person Household | 196 | 31.7% |
| Total Housing Units | 618 | 100.0% |
Occupancy by Ownership by Household Size in Beech Mountain Lakes
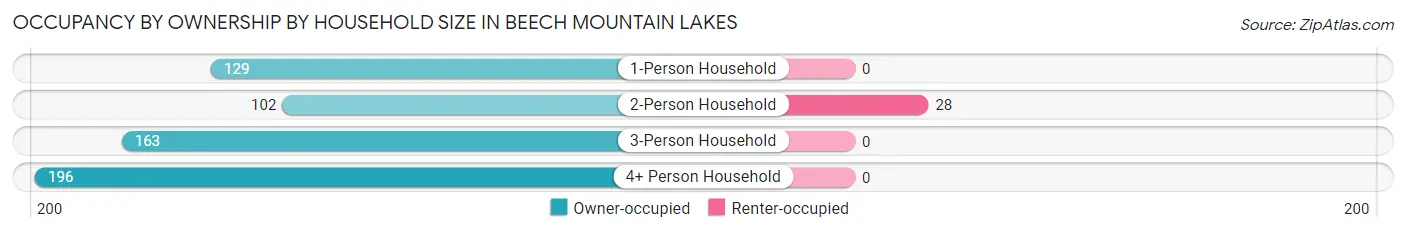
| Household Size | Owner-occupied | Renter-occupied |
| 1-Person Household | 129 (100.0%) | 0 (0.0%) |
| 2-Person Household | 102 (78.5%) | 28 (21.5%) |
| 3-Person Household | 163 (100.0%) | 0 (0.0%) |
| 4+ Person Household | 196 (100.0%) | 0 (0.0%) |
| Total Housing Units | 590 (95.5%) | 28 (4.5%) |
Occupancy by Educational Attainment in Beech Mountain Lakes
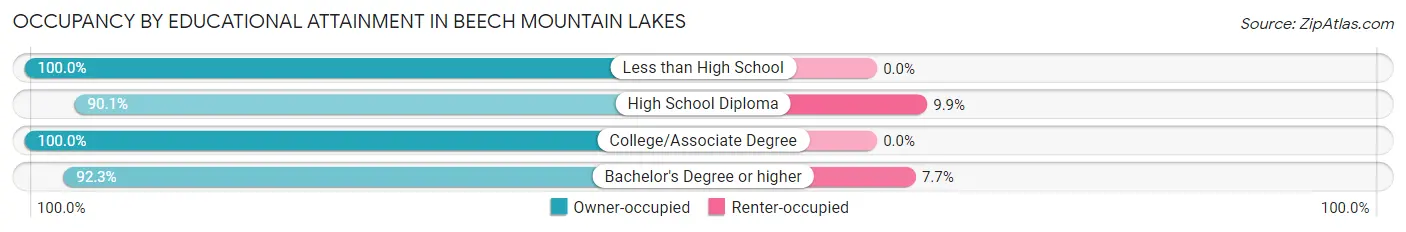
| Household Size | Owner-occupied | Renter-occupied |
| Less than High School | 21 (100.0%) | 0 (0.0%) |
| High School Diploma | 136 (90.1%) | 15 (9.9%) |
| College/Associate Degree | 277 (100.0%) | 0 (0.0%) |
| Bachelor's Degree or higher | 156 (92.3%) | 13 (7.7%) |
Occupancy by Age of Householder in Beech Mountain Lakes
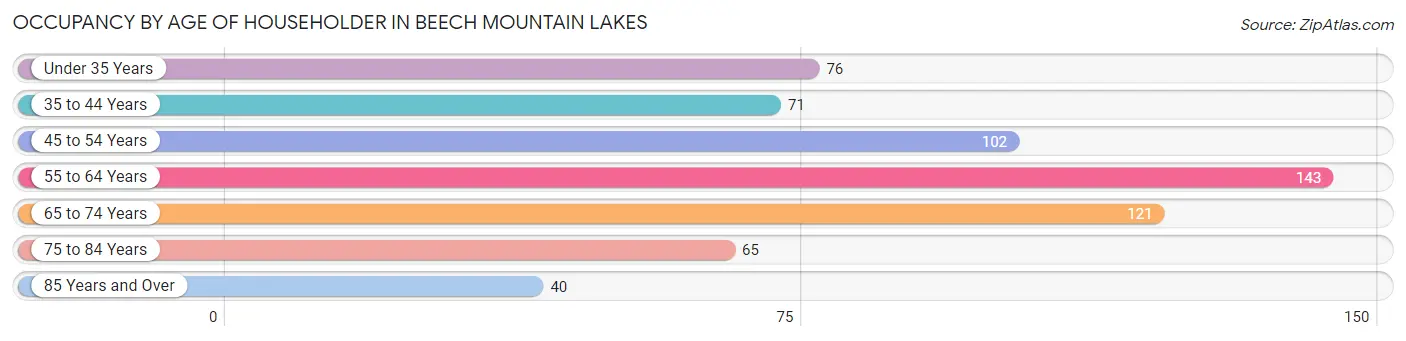
| Age Bracket | # Households | % Households |
| Under 35 Years | 76 | 12.3% |
| 35 to 44 Years | 71 | 11.5% |
| 45 to 54 Years | 102 | 16.5% |
| 55 to 64 Years | 143 | 23.1% |
| 65 to 74 Years | 121 | 19.6% |
| 75 to 84 Years | 65 | 10.5% |
| 85 Years and Over | 40 | 6.5% |
| Total | 618 | 100.0% |
Housing Finances in Beech Mountain Lakes
Median Income by Occupancy in Beech Mountain Lakes
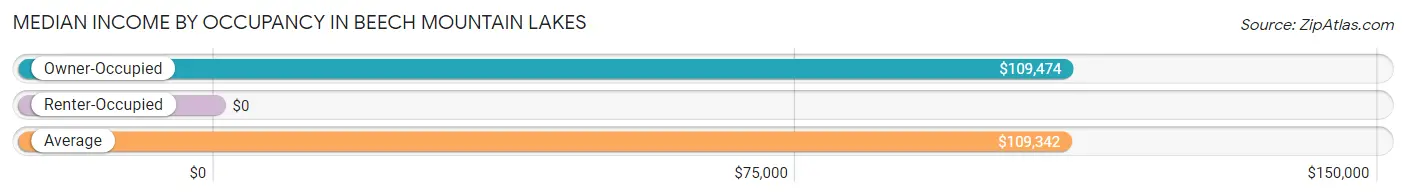
| Occupancy Type | # Households | Median Income |
| Owner-Occupied | 590 (95.5%) | $109,474 |
| Renter-Occupied | 28 (4.5%) | $0 |
| Average | 618 (100.0%) | $109,342 |
Occupancy by Householder Income Bracket in Beech Mountain Lakes
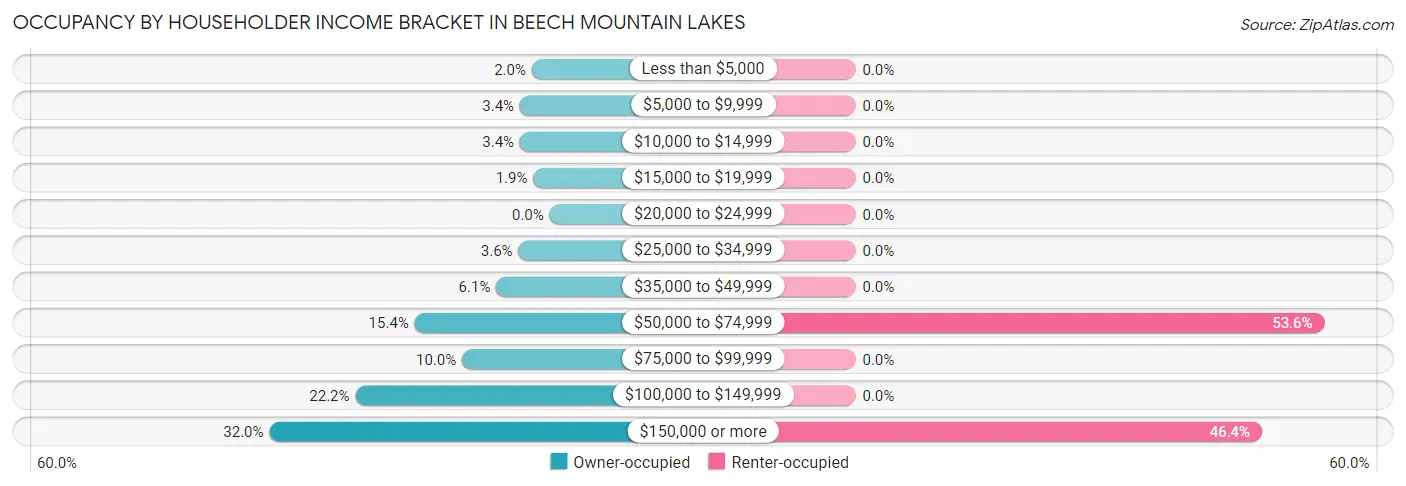
| Income Bracket | Owner-occupied | Renter-occupied |
| Less than $5,000 | 12 (2.0%) | 0 (0.0%) |
| $5,000 to $9,999 | 20 (3.4%) | 0 (0.0%) |
| $10,000 to $14,999 | 20 (3.4%) | 0 (0.0%) |
| $15,000 to $19,999 | 11 (1.9%) | 0 (0.0%) |
| $20,000 to $24,999 | 0 (0.0%) | 0 (0.0%) |
| $25,000 to $34,999 | 21 (3.6%) | 0 (0.0%) |
| $35,000 to $49,999 | 36 (6.1%) | 0 (0.0%) |
| $50,000 to $74,999 | 91 (15.4%) | 15 (53.6%) |
| $75,000 to $99,999 | 59 (10.0%) | 0 (0.0%) |
| $100,000 to $149,999 | 131 (22.2%) | 0 (0.0%) |
| $150,000 or more | 189 (32.0%) | 13 (46.4%) |
| Total | 590 (100.0%) | 28 (100.0%) |
Monthly Housing Cost Tiers in Beech Mountain Lakes
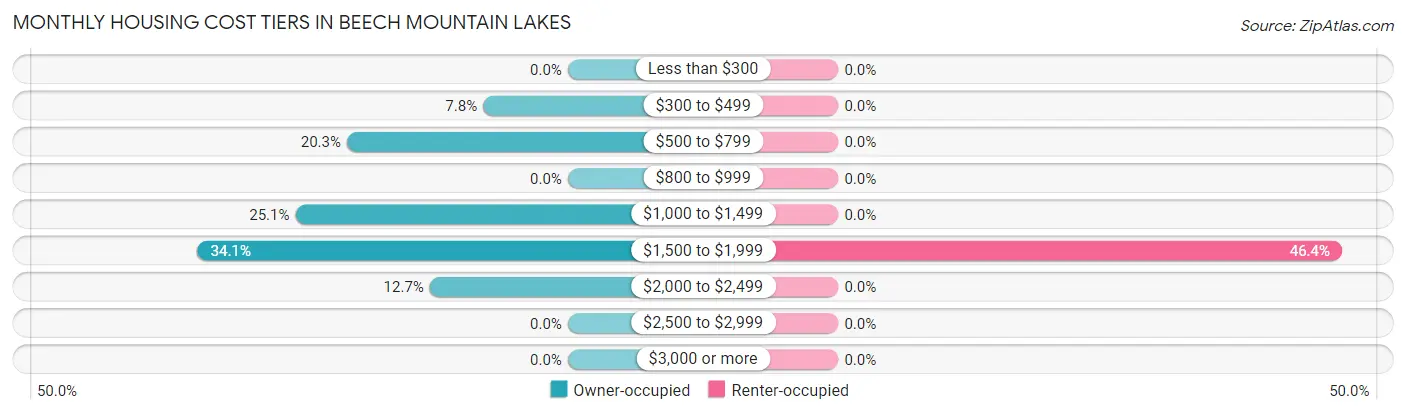
| Monthly Cost | Owner-occupied | Renter-occupied |
| Less than $300 | 0 (0.0%) | 0 (0.0%) |
| $300 to $499 | 46 (7.8%) | 0 (0.0%) |
| $500 to $799 | 120 (20.3%) | 0 (0.0%) |
| $800 to $999 | 0 (0.0%) | 0 (0.0%) |
| $1,000 to $1,499 | 148 (25.1%) | 0 (0.0%) |
| $1,500 to $1,999 | 201 (34.1%) | 13 (46.4%) |
| $2,000 to $2,499 | 75 (12.7%) | 0 (0.0%) |
| $2,500 to $2,999 | 0 (0.0%) | 0 (0.0%) |
| $3,000 or more | 0 (0.0%) | 0 (0.0%) |
| Total | 590 (100.0%) | 28 (100.0%) |
Physical Housing Characteristics in Beech Mountain Lakes
Housing Structures in Beech Mountain Lakes
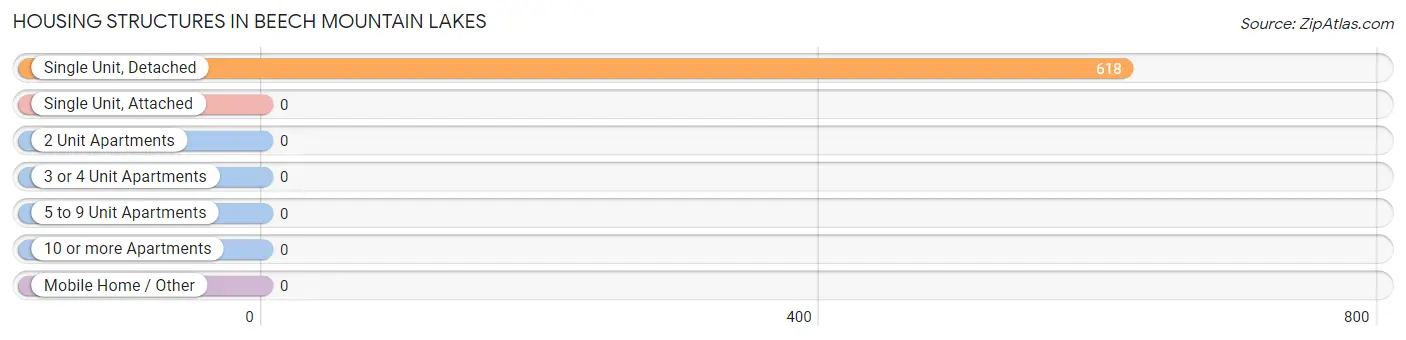
| Structure Type | # Housing Units | % Housing Units |
| Single Unit, Detached | 618 | 100.0% |
| Single Unit, Attached | 0 | 0.0% |
| 2 Unit Apartments | 0 | 0.0% |
| 3 or 4 Unit Apartments | 0 | 0.0% |
| 5 to 9 Unit Apartments | 0 | 0.0% |
| 10 or more Apartments | 0 | 0.0% |
| Mobile Home / Other | 0 | 0.0% |
| Total | 618 | 100.0% |
Housing Structures by Occupancy in Beech Mountain Lakes
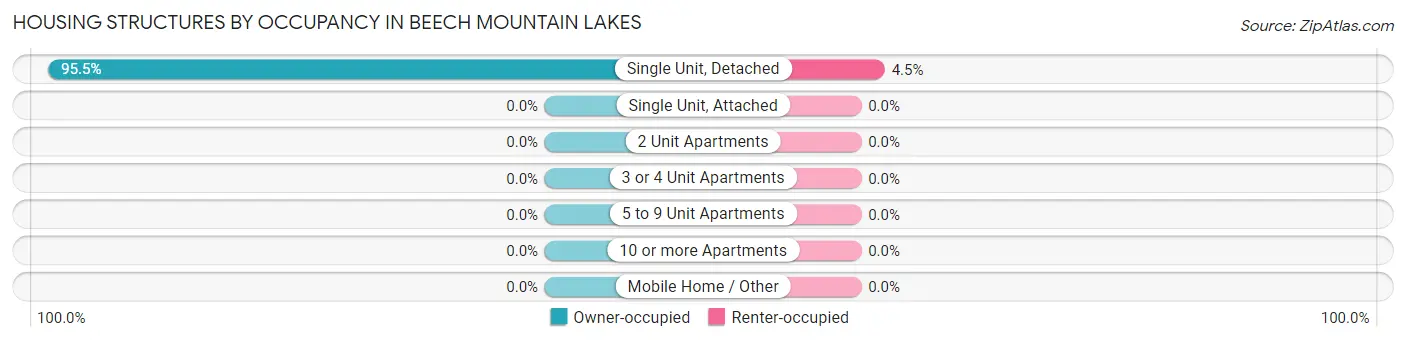
| Structure Type | Owner-occupied | Renter-occupied |
| Single Unit, Detached | 590 (95.5%) | 28 (4.5%) |
| Single Unit, Attached | 0 (0.0%) | 0 (0.0%) |
| 2 Unit Apartments | 0 (0.0%) | 0 (0.0%) |
| 3 or 4 Unit Apartments | 0 (0.0%) | 0 (0.0%) |
| 5 to 9 Unit Apartments | 0 (0.0%) | 0 (0.0%) |
| 10 or more Apartments | 0 (0.0%) | 0 (0.0%) |
| Mobile Home / Other | 0 (0.0%) | 0 (0.0%) |
| Total | 590 (95.5%) | 28 (4.5%) |
Housing Structures by Number of Rooms in Beech Mountain Lakes
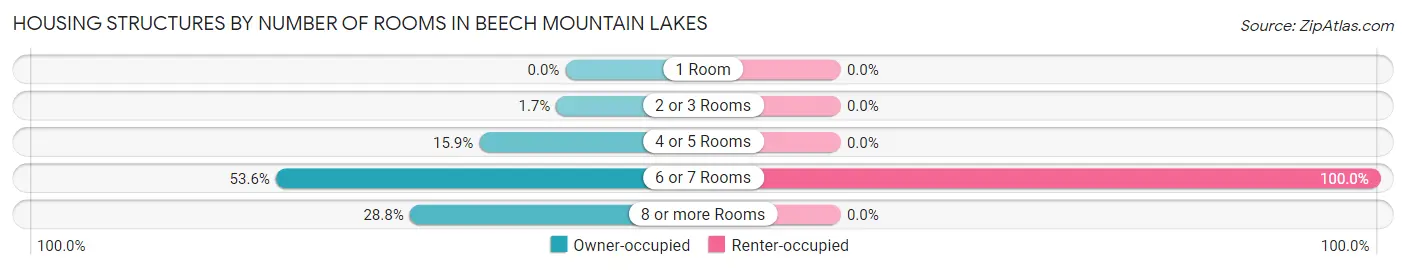
| Number of Rooms | Owner-occupied | Renter-occupied |
| 1 Room | 0 (0.0%) | 0 (0.0%) |
| 2 or 3 Rooms | 10 (1.7%) | 0 (0.0%) |
| 4 or 5 Rooms | 94 (15.9%) | 0 (0.0%) |
| 6 or 7 Rooms | 316 (53.6%) | 28 (100.0%) |
| 8 or more Rooms | 170 (28.8%) | 0 (0.0%) |
| Total | 590 (100.0%) | 28 (100.0%) |
Housing Structure by Heating Type in Beech Mountain Lakes
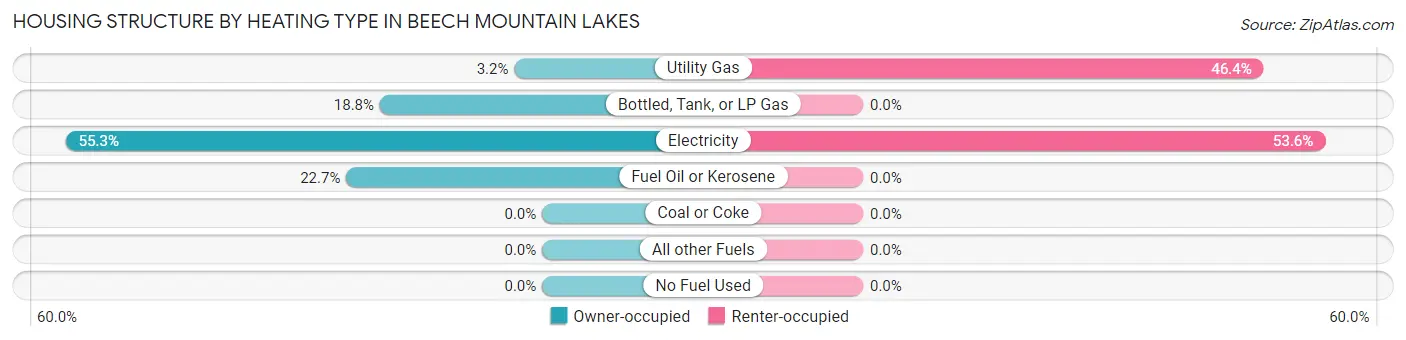
| Heating Type | Owner-occupied | Renter-occupied |
| Utility Gas | 19 (3.2%) | 13 (46.4%) |
| Bottled, Tank, or LP Gas | 111 (18.8%) | 0 (0.0%) |
| Electricity | 326 (55.2%) | 15 (53.6%) |
| Fuel Oil or Kerosene | 134 (22.7%) | 0 (0.0%) |
| Coal or Coke | 0 (0.0%) | 0 (0.0%) |
| All other Fuels | 0 (0.0%) | 0 (0.0%) |
| No Fuel Used | 0 (0.0%) | 0 (0.0%) |
| Total | 590 (100.0%) | 28 (100.0%) |
Household Vehicle Usage in Beech Mountain Lakes
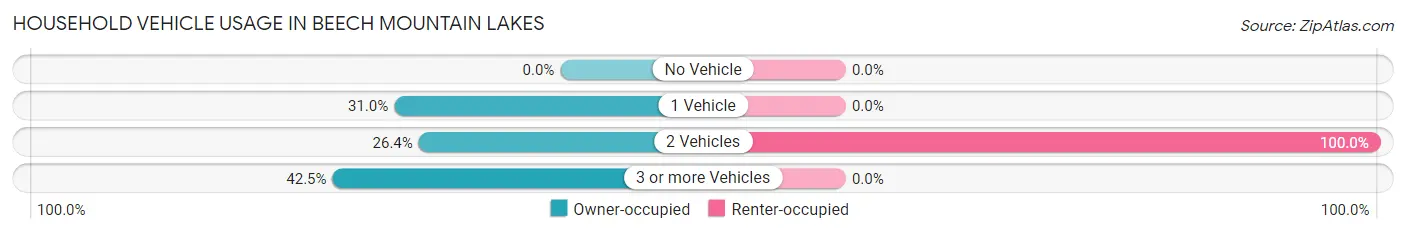
| Vehicles per Household | Owner-occupied | Renter-occupied |
| No Vehicle | 0 (0.0%) | 0 (0.0%) |
| 1 Vehicle | 183 (31.0%) | 0 (0.0%) |
| 2 Vehicles | 156 (26.4%) | 28 (100.0%) |
| 3 or more Vehicles | 251 (42.5%) | 0 (0.0%) |
| Total | 590 (100.0%) | 28 (100.0%) |
Real Estate & Mortgages in Beech Mountain Lakes
Real Estate and Mortgage Overview in Beech Mountain Lakes
| Characteristic | Without Mortgage | With Mortgage |
| Housing Units | 192 | 398 |
| Median Property Value | $173,900 | $194,000 |
| Median Household Income | $67,083 | $177 |
| Monthly Housing Costs | $572 | $0 |
| Real Estate Taxes | $2,474 | $0 |
Property Value by Mortgage Status in Beech Mountain Lakes
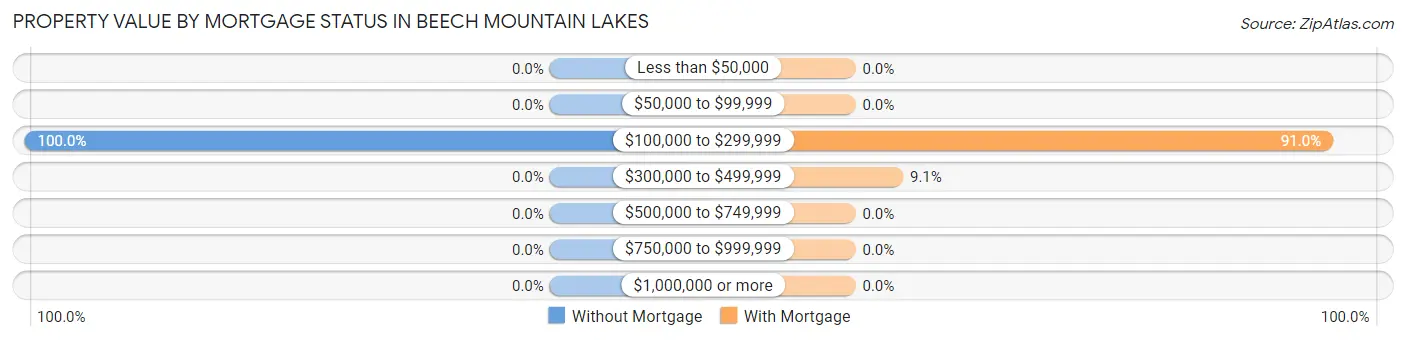
| Property Value | Without Mortgage | With Mortgage |
| Less than $50,000 | 0 (0.0%) | 0 (0.0%) |
| $50,000 to $99,999 | 0 (0.0%) | 0 (0.0%) |
| $100,000 to $299,999 | 192 (100.0%) | 362 (90.9%) |
| $300,000 to $499,999 | 0 (0.0%) | 36 (9.0%) |
| $500,000 to $749,999 | 0 (0.0%) | 0 (0.0%) |
| $750,000 to $999,999 | 0 (0.0%) | 0 (0.0%) |
| $1,000,000 or more | 0 (0.0%) | 0 (0.0%) |
| Total | 192 (100.0%) | 398 (100.0%) |
Household Income by Mortgage Status in Beech Mountain Lakes
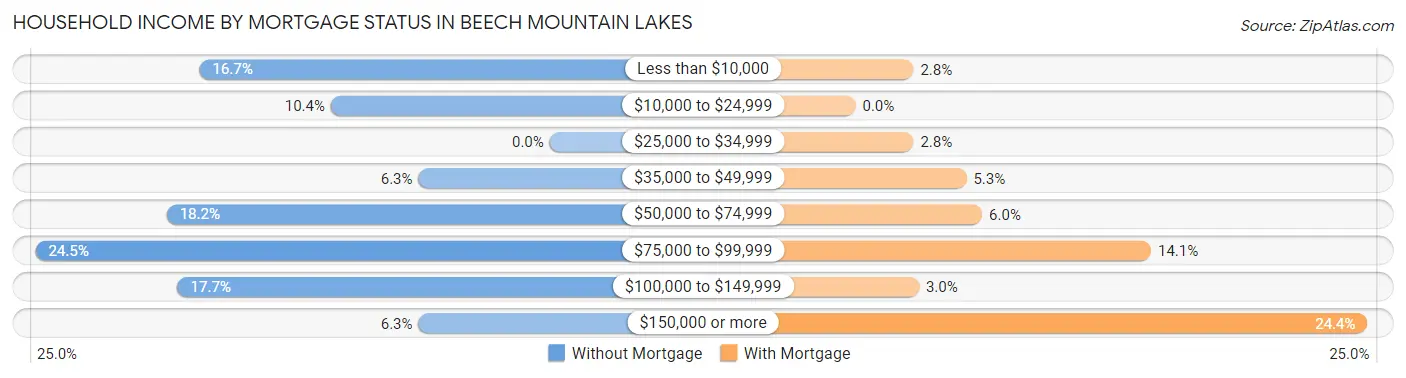
| Household Income | Without Mortgage | With Mortgage |
| Less than $10,000 | 32 (16.7%) | 11 (2.8%) |
| $10,000 to $24,999 | 20 (10.4%) | 0 (0.0%) |
| $25,000 to $34,999 | 0 (0.0%) | 11 (2.8%) |
| $35,000 to $49,999 | 12 (6.2%) | 21 (5.3%) |
| $50,000 to $74,999 | 35 (18.2%) | 24 (6.0%) |
| $75,000 to $99,999 | 47 (24.5%) | 56 (14.1%) |
| $100,000 to $149,999 | 34 (17.7%) | 12 (3.0%) |
| $150,000 or more | 12 (6.2%) | 97 (24.4%) |
| Total | 192 (100.0%) | 398 (100.0%) |
Property Value to Household Income Ratio in Beech Mountain Lakes
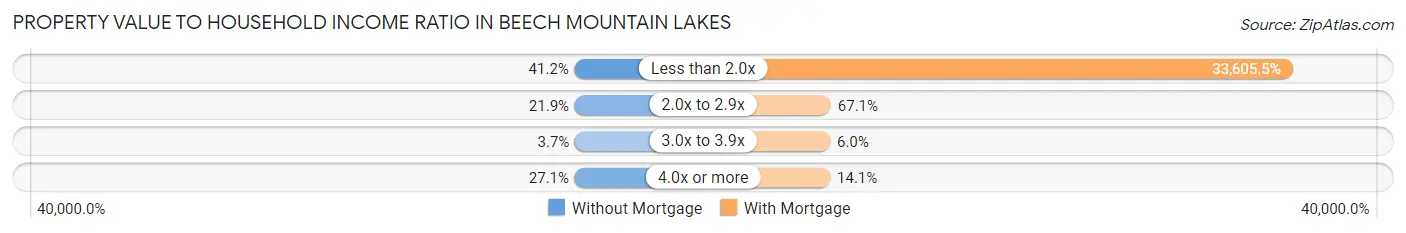
| Value-to-Income Ratio | Without Mortgage | With Mortgage |
| Less than 2.0x | 79 (41.1%) | 133,750 (33,605.5%) |
| 2.0x to 2.9x | 42 (21.9%) | 267 (67.1%) |
| 3.0x to 3.9x | 7 (3.6%) | 24 (6.0%) |
| 4.0x or more | 52 (27.1%) | 56 (14.1%) |
| Total | 192 (100.0%) | 398 (100.0%) |
Real Estate Taxes by Mortgage Status in Beech Mountain Lakes
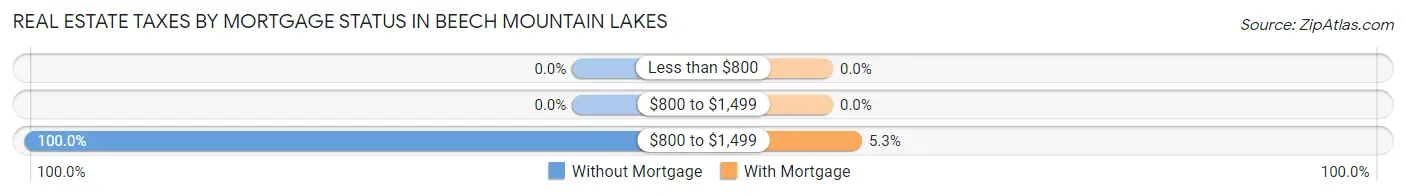
| Property Taxes | Without Mortgage | With Mortgage |
| Less than $800 | 0 (0.0%) | 0 (0.0%) |
| $800 to $1,499 | 0 (0.0%) | 0 (0.0%) |
| $800 to $1,499 | 192 (100.0%) | 21 (5.3%) |
| Total | 192 (100.0%) | 398 (100.0%) |
Health & Disability in Beech Mountain Lakes
Health Insurance Coverage by Age in Beech Mountain Lakes
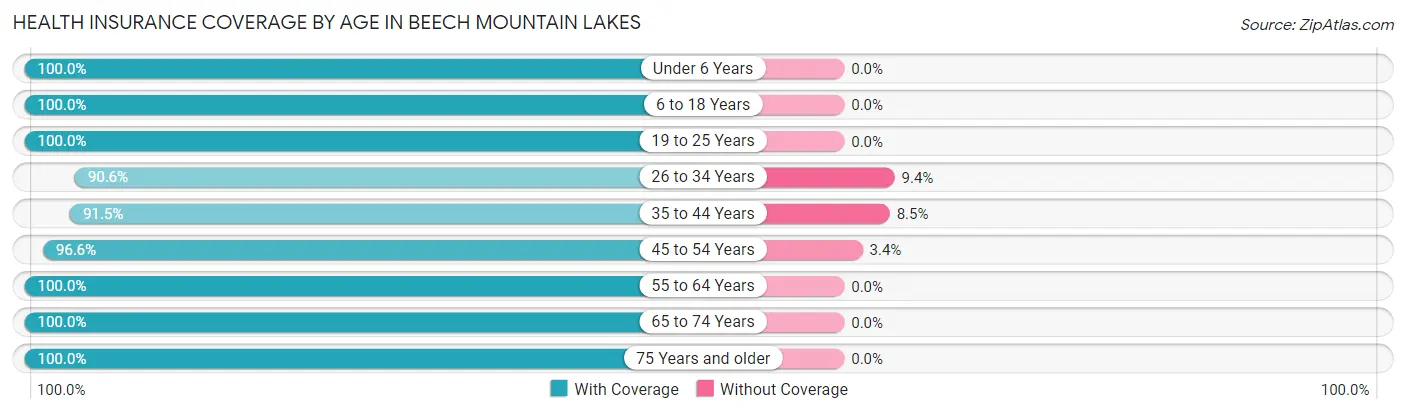
| Age Bracket | With Coverage | Without Coverage |
| Under 6 Years | 83 (100.0%) | 0 (0.0%) |
| 6 to 18 Years | 364 (100.0%) | 0 (0.0%) |
| 19 to 25 Years | 196 (100.0%) | 0 (0.0%) |
| 26 to 34 Years | 116 (90.6%) | 12 (9.4%) |
| 35 to 44 Years | 162 (91.5%) | 15 (8.5%) |
| 45 to 54 Years | 368 (96.6%) | 13 (3.4%) |
| 55 to 64 Years | 224 (100.0%) | 0 (0.0%) |
| 65 to 74 Years | 249 (100.0%) | 0 (0.0%) |
| 75 Years and older | 138 (100.0%) | 0 (0.0%) |
| Total | 1,900 (97.9%) | 40 (2.1%) |
Health Insurance Coverage by Citizenship Status in Beech Mountain Lakes
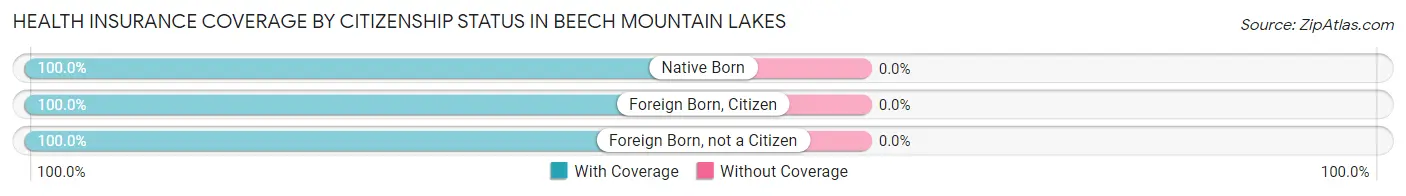
| Citizenship Status | With Coverage | Without Coverage |
| Native Born | 83 (100.0%) | 0 (0.0%) |
| Foreign Born, Citizen | 364 (100.0%) | 0 (0.0%) |
| Foreign Born, not a Citizen | 196 (100.0%) | 0 (0.0%) |
Health Insurance Coverage by Household Income in Beech Mountain Lakes
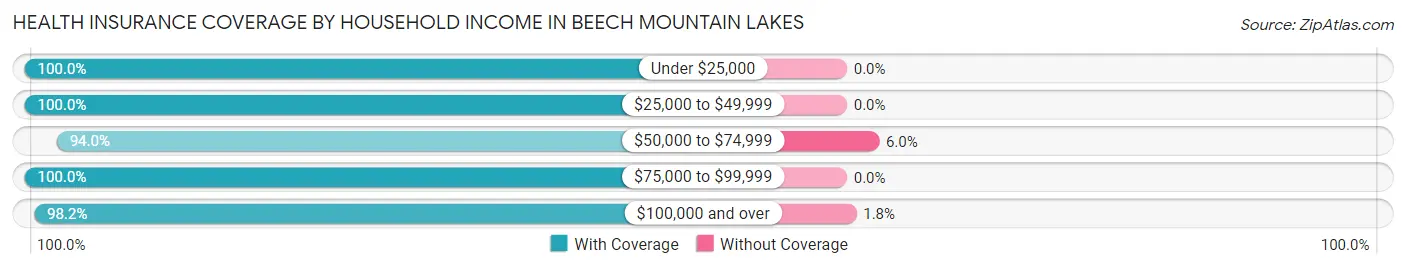
| Household Income | With Coverage | Without Coverage |
| Under $25,000 | 88 (100.0%) | 0 (0.0%) |
| $25,000 to $49,999 | 68 (100.0%) | 0 (0.0%) |
| $50,000 to $74,999 | 234 (94.0%) | 15 (6.0%) |
| $75,000 to $99,999 | 127 (100.0%) | 0 (0.0%) |
| $100,000 and over | 1,383 (98.2%) | 25 (1.8%) |
Public vs Private Health Insurance Coverage by Age in Beech Mountain Lakes
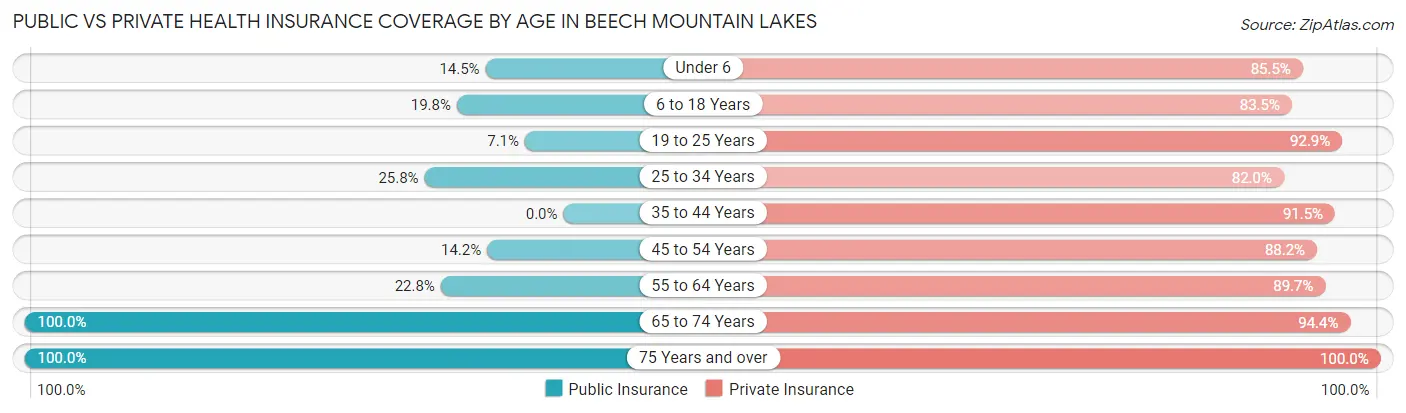
| Age Bracket | Public Insurance | Private Insurance |
| Under 6 | 12 (14.5%) | 71 (85.5%) |
| 6 to 18 Years | 72 (19.8%) | 304 (83.5%) |
| 19 to 25 Years | 14 (7.1%) | 182 (92.9%) |
| 25 to 34 Years | 33 (25.8%) | 105 (82.0%) |
| 35 to 44 Years | 0 (0.0%) | 162 (91.5%) |
| 45 to 54 Years | 54 (14.2%) | 336 (88.2%) |
| 55 to 64 Years | 51 (22.8%) | 201 (89.7%) |
| 65 to 74 Years | 249 (100.0%) | 235 (94.4%) |
| 75 Years and over | 138 (100.0%) | 138 (100.0%) |
| Total | 623 (32.1%) | 1,734 (89.4%) |
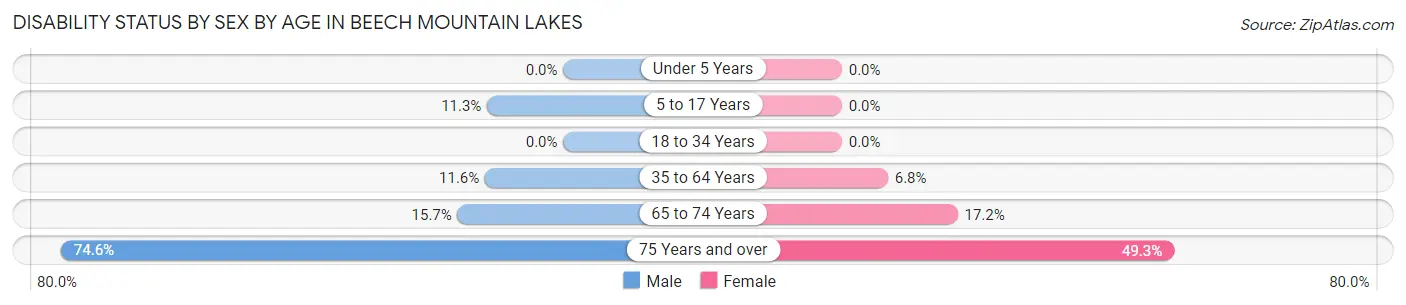
Disability Status by Sex by Age in Beech Mountain Lakes
| Age Bracket | Male | Female |
| Under 5 Years | 0 (0.0%) | 0 (0.0%) |
| 5 to 17 Years | 37 (11.3%) | 0 (0.0%) |
| 18 to 34 Years | 0 (0.0%) | 0 (0.0%) |
| 35 to 64 Years | 33 (11.6%) | 34 (6.8%) |
| 65 to 74 Years | 19 (15.7%) | 22 (17.2%) |
| 75 Years and over | 47 (74.6%) | 37 (49.3%) |
Disability Class by Sex by Age in Beech Mountain Lakes
Disability Class: Hearing Difficulty
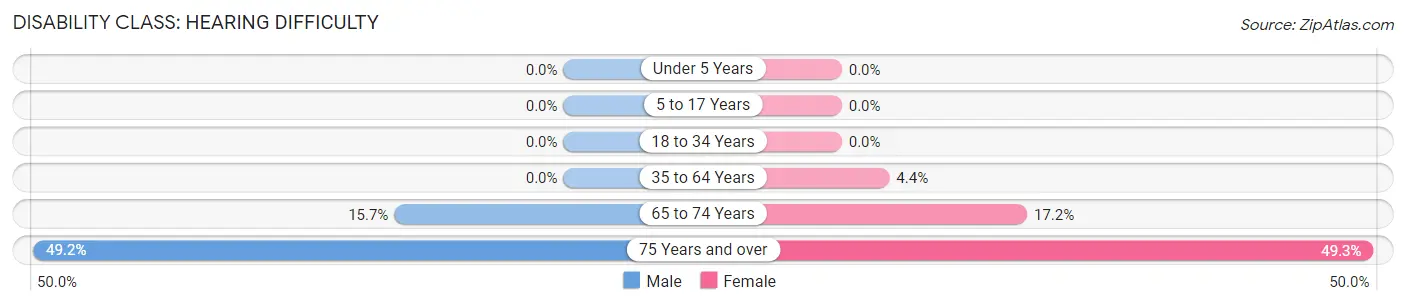
| Age Bracket | Male | Female |
| Under 5 Years | 0 (0.0%) | 0 (0.0%) |
| 5 to 17 Years | 0 (0.0%) | 0 (0.0%) |
| 18 to 34 Years | 0 (0.0%) | 0 (0.0%) |
| 35 to 64 Years | 0 (0.0%) | 22 (4.4%) |
| 65 to 74 Years | 19 (15.7%) | 22 (17.2%) |
| 75 Years and over | 31 (49.2%) | 37 (49.3%) |
Disability Class: Vision Difficulty
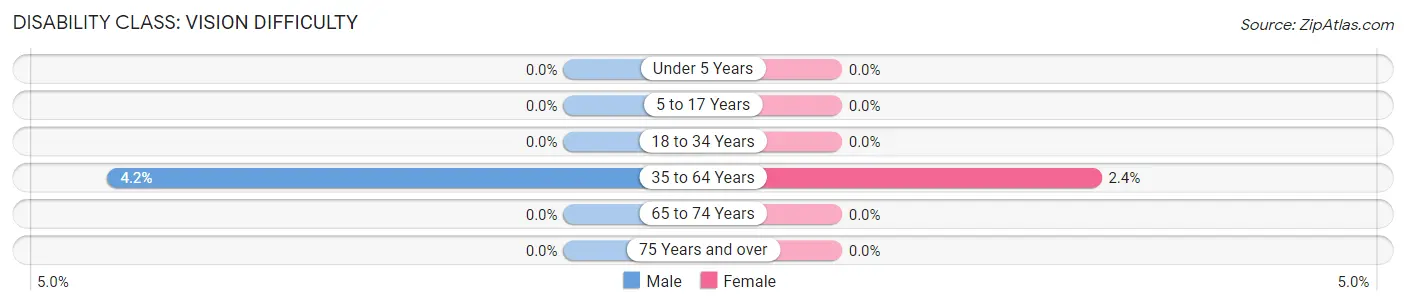
| Age Bracket | Male | Female |
| Under 5 Years | 0 (0.0%) | 0 (0.0%) |
| 5 to 17 Years | 0 (0.0%) | 0 (0.0%) |
| 18 to 34 Years | 0 (0.0%) | 0 (0.0%) |
| 35 to 64 Years | 12 (4.2%) | 12 (2.4%) |
| 65 to 74 Years | 0 (0.0%) | 0 (0.0%) |
| 75 Years and over | 0 (0.0%) | 0 (0.0%) |
Disability Class: Cognitive Difficulty
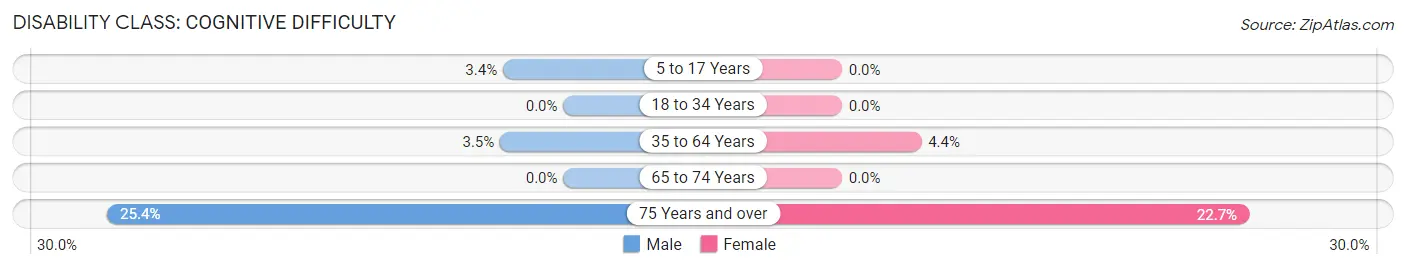
| Age Bracket | Male | Female |
| 5 to 17 Years | 11 (3.4%) | 0 (0.0%) |
| 18 to 34 Years | 0 (0.0%) | 0 (0.0%) |
| 35 to 64 Years | 10 (3.5%) | 22 (4.4%) |
| 65 to 74 Years | 0 (0.0%) | 0 (0.0%) |
| 75 Years and over | 16 (25.4%) | 17 (22.7%) |
Disability Class: Ambulatory Difficulty
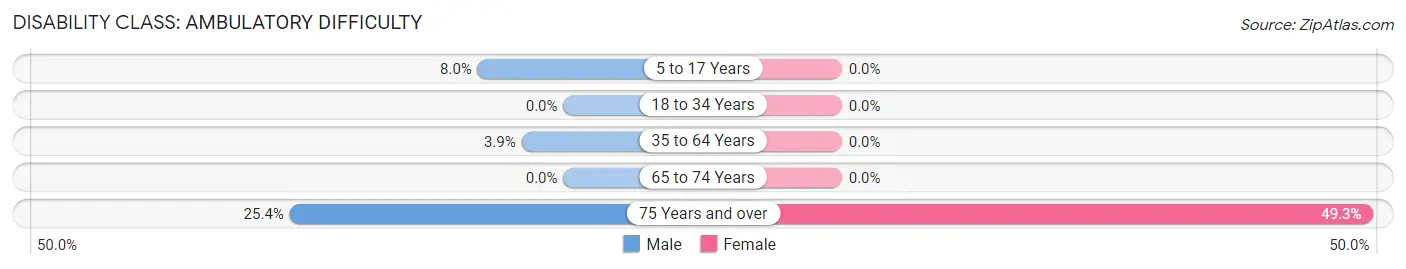
| Age Bracket | Male | Female |
| 5 to 17 Years | 26 (8.0%) | 0 (0.0%) |
| 18 to 34 Years | 0 (0.0%) | 0 (0.0%) |
| 35 to 64 Years | 11 (3.9%) | 0 (0.0%) |
| 65 to 74 Years | 0 (0.0%) | 0 (0.0%) |
| 75 Years and over | 16 (25.4%) | 37 (49.3%) |
Disability Class: Self-Care Difficulty
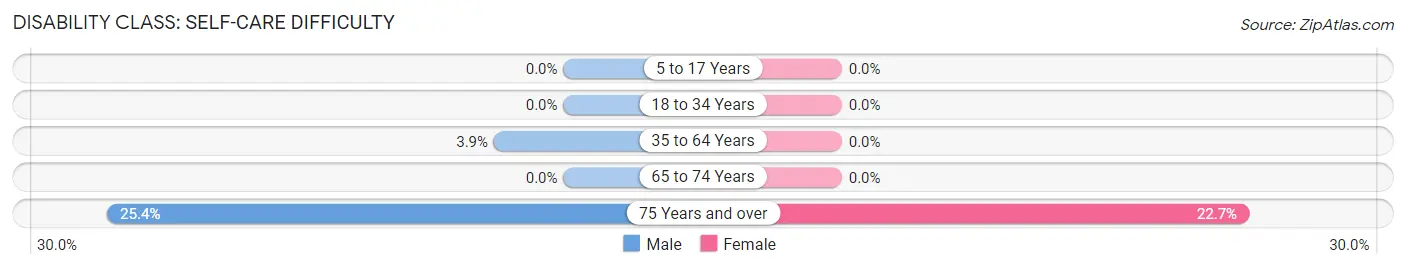
| Age Bracket | Male | Female |
| 5 to 17 Years | 0 (0.0%) | 0 (0.0%) |
| 18 to 34 Years | 0 (0.0%) | 0 (0.0%) |
| 35 to 64 Years | 11 (3.9%) | 0 (0.0%) |
| 65 to 74 Years | 0 (0.0%) | 0 (0.0%) |
| 75 Years and over | 16 (25.4%) | 17 (22.7%) |
Technology Access in Beech Mountain Lakes
Computing Device Access in Beech Mountain Lakes
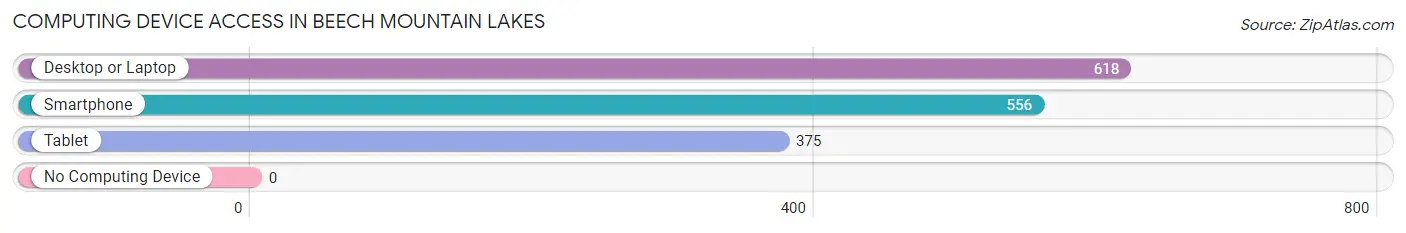
| Device Type | # Households | % Households |
| Desktop or Laptop | 618 | 100.0% |
| Smartphone | 556 | 90.0% |
| Tablet | 375 | 60.7% |
| No Computing Device | 0 | 0.0% |
| Total | 618 | 100.0% |
Internet Access in Beech Mountain Lakes
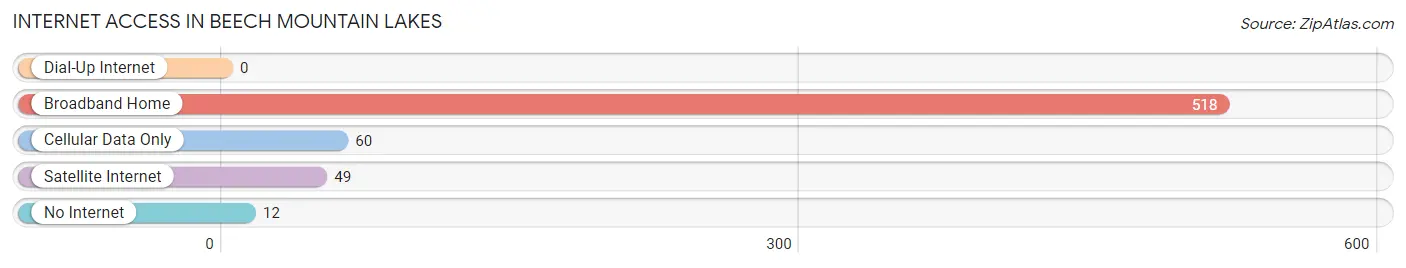
| Internet Type | # Households | % Households |
| Dial-Up Internet | 0 | 0.0% |
| Broadband Home | 518 | 83.8% |
| Cellular Data Only | 60 | 9.7% |
| Satellite Internet | 49 | 7.9% |
| No Internet | 12 | 1.9% |
| Total | 618 | 100.0% |
Beech Mountain Lakes Summary
Beech Mountain Lakes is a small community located in the Pocono Mountains of Pennsylvania. It is situated in the northern part of Monroe County, approximately two miles south of the New York border. The community is comprised of two small lakes, Beech Mountain Lake and Lake Naomi, and is surrounded by the Pocono Mountains.
History
Beech Mountain Lakes was founded in the late 1950s by a group of investors who wanted to create a resort community in the Pocono Mountains. The investors purchased a large tract of land and began to develop the area. The first homes were built in 1959 and the community was officially incorporated in 1960.
The community was originally intended to be a resort destination, and the developers built a number of amenities to attract visitors. These included a golf course, a ski resort, and a number of other recreational facilities. The community also had its own post office, which opened in 1961.
The community continued to grow throughout the 1960s and 1970s, and by the 1980s it had become a popular destination for vacationers. The community was also home to a number of businesses, including a grocery store, a hardware store, and a number of restaurants.
Geography
Beech Mountain Lakes is located in the northern part of Monroe County, approximately two miles south of the New York border. The community is situated in the Pocono Mountains, and is surrounded by a number of small lakes, including Beech Mountain Lake and Lake Naomi. The area is also home to a number of state parks, including Promised Land State Park and Tobyhanna State Park.
The community is located approximately two hours from both Philadelphia and New York City. It is also close to a number of other popular tourist destinations, including the Delaware Water Gap National Recreation Area and the Pocono Mountains.
Economy
The economy of Beech Mountain Lakes is largely based on tourism. The community is home to a number of recreational facilities, including a golf course, a ski resort, and a number of other recreational activities. The community is also home to a number of businesses, including a grocery store, a hardware store, and a number of restaurants.
The community is also home to a number of manufacturing companies, including a plastics manufacturer and a furniture manufacturer. The community is also home to a number of small businesses, including a number of retail stores and a number of service-based businesses.
Demographics
As of the 2010 census, the population of Beech Mountain Lakes was 1,845. The population is largely white (94.3%), with a small percentage of African Americans (2.2%) and Hispanics (2.2%). The median household income is $50,000, and the median age is 44.
Conclusion
Beech Mountain Lakes is a small community located in the Pocono Mountains of Pennsylvania. It is situated in the northern part of Monroe County, approximately two miles south of the New York border. The community is comprised of two small lakes, Beech Mountain Lake and Lake Naomi, and is surrounded by the Pocono Mountains. The economy of Beech Mountain Lakes is largely based on tourism, and the community is home to a number of recreational facilities, businesses, and manufacturing companies. As of the 2010 census, the population of Beech Mountain Lakes was 1,845, and the median household income is $50,000.
Common Questions
What is the Total Population of Beech Mountain Lakes?
Total Population of Beech Mountain Lakes is 1,940.
What is the Total Male Population of Beech Mountain Lakes?
Total Male Population of Beech Mountain Lakes is 1,006.
What is the Total Female Population of Beech Mountain Lakes?
Total Female Population of Beech Mountain Lakes is 934.
What is the Ratio of Males per 100 Females in Beech Mountain Lakes?
There are 107.71 Males per 100 Females in Beech Mountain Lakes.
What is the Ratio of Females per 100 Males in Beech Mountain Lakes?
There are 92.84 Females per 100 Males in Beech Mountain Lakes.
What is the Median Population Age in Beech Mountain Lakes?
Median Population Age in Beech Mountain Lakes is 48.2 Years.
What is the Average Family Size in Beech Mountain Lakes
Average Family Size in Beech Mountain Lakes is 3.7 People.
What is the Average Household Size in Beech Mountain Lakes
Average Household Size in Beech Mountain Lakes is 3.1 People.
What is Per Capita Income in Beech Mountain Lakes?
Per Capita income in Beech Mountain Lakes is $40,813.
What is the Median Family Income in Beech Mountain Lakes?
Median Family Income in Beech Mountain Lakes is $116,979.
What is the Median Household income in Beech Mountain Lakes?
Median Household Income in Beech Mountain Lakes is $109,342.
What is Income or Wage Gap in Beech Mountain Lakes?
Income or Wage Gap in Beech Mountain Lakes is 10.7%.
Women in Beech Mountain Lakes earn 89.3 cents for every dollar earned by a man.
What is Inequality or Gini Index in Beech Mountain Lakes?
Inequality or Gini Index in Beech Mountain Lakes is 0.39.
How Large is the Labor Force in Beech Mountain Lakes?
There are 1,097 People in the Labor Forcein in Beech Mountain Lakes.
What is the Percentage of People in the Labor Force in Beech Mountain Lakes?
72.2% of People are in the Labor Force in Beech Mountain Lakes.