Pleasant Gap, PA
Pleasant Gap Map
Pleasant Gap Overview
3,542
TOTAL POPULATION
1,730
MALE POPULATION
1,812
FEMALE POPULATION
95.47
MALES / 100 FEMALES
104.74
FEMALES / 100 MALES
41.7
MEDIAN AGE
3.0
AVG FAMILY SIZE
2.6
AVG HOUSEHOLD SIZE
$36,871
PER CAPITA INCOME
$86,442
AVG FAMILY INCOME
$76,104
AVG HOUSEHOLD INCOME
23.1%
WAGE / INCOME GAP [ % ]
76.9¢/ $1
WAGE / INCOME GAP [ $ ]
0.33
INEQUALITY / GINI INDEX
2,217
LABOR FORCE [ PEOPLE ]
77.8%
PERCENT IN LABOR FORCE
3.2%
UNEMPLOYMENT RATE
Pleasant Gap Area Codes
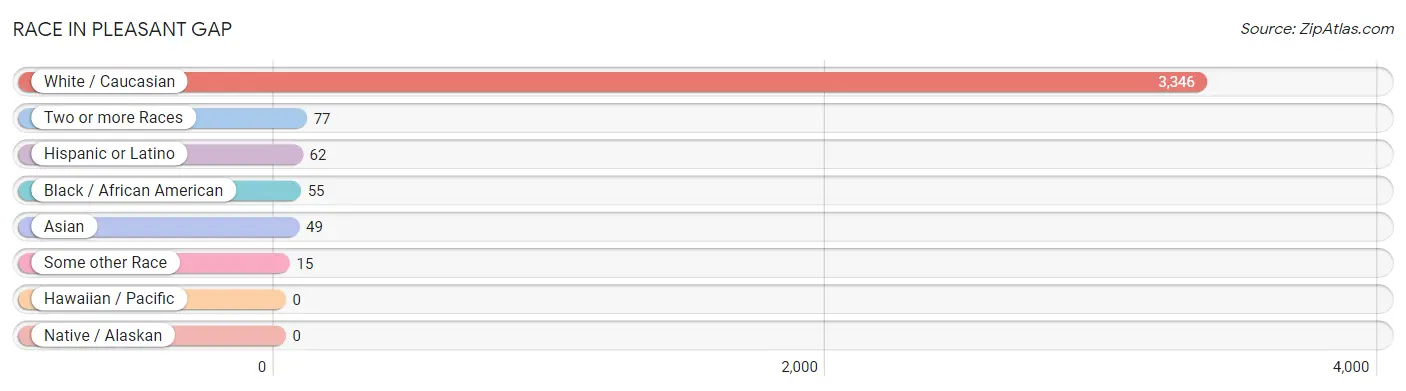
Race in Pleasant Gap
The most populous races in Pleasant Gap are White / Caucasian (3,346 | 94.5%), Two or more Races (77 | 2.2%), and Hispanic or Latino (62 | 1.8%).
| Race | # Population | % Population |
| Asian | 49 | 1.4% |
| Black / African American | 55 | 1.5% |
| Hawaiian / Pacific | 0 | 0.0% |
| Hispanic or Latino | 62 | 1.8% |
| Native / Alaskan | 0 | 0.0% |
| White / Caucasian | 3,346 | 94.5% |
| Two or more Races | 77 | 2.2% |
| Some other Race | 15 | 0.4% |
| Total | 3,542 | 100.0% |
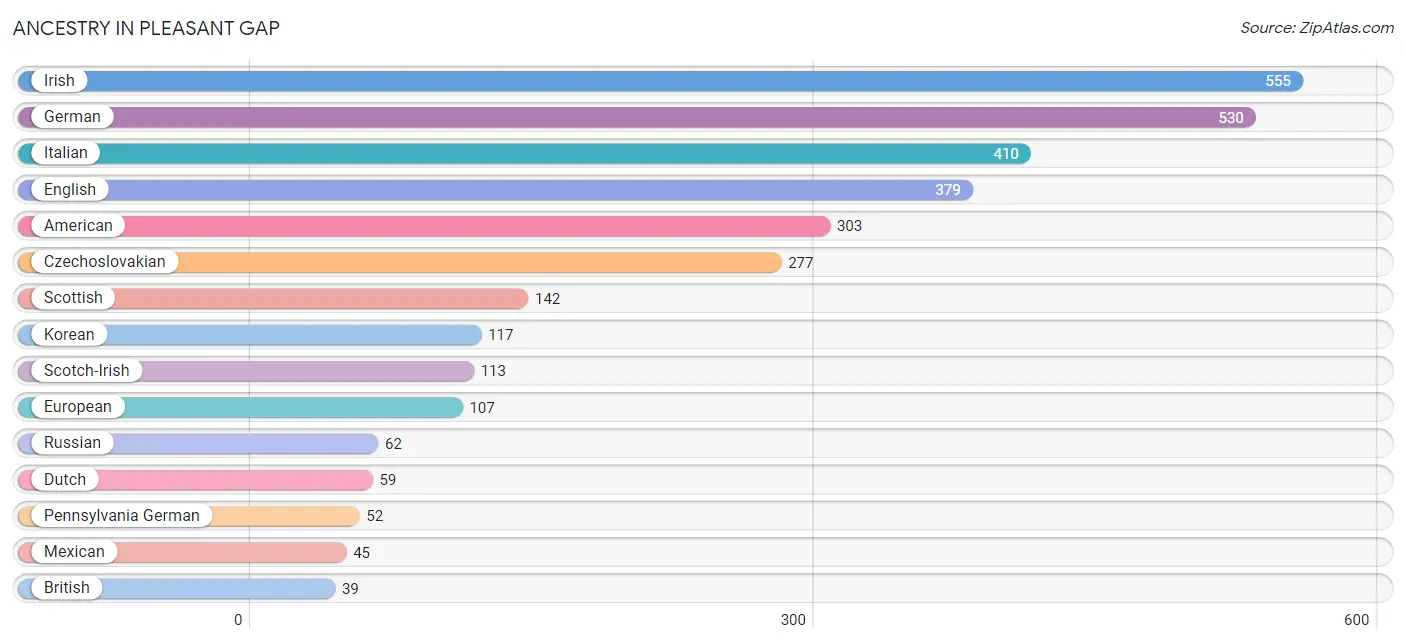
Ancestry in Pleasant Gap
The most populous ancestries reported in Pleasant Gap are Irish (555 | 15.7%), German (530 | 15.0%), Italian (410 | 11.6%), English (379 | 10.7%), and American (303 | 8.6%), together accounting for 61.5% of all Pleasant Gap residents.
| Ancestry | # Population | % Population |
| American | 303 | 8.6% |
| British | 39 | 1.1% |
| Central American | 9 | 0.3% |
| Czechoslovakian | 277 | 7.8% |
| Dutch | 59 | 1.7% |
| Eastern European | 36 | 1.0% |
| English | 379 | 10.7% |
| European | 107 | 3.0% |
| German | 530 | 15.0% |
| Irish | 555 | 15.7% |
| Italian | 410 | 11.6% |
| Jamaican | 13 | 0.4% |
| Korean | 117 | 3.3% |
| Mexican | 45 | 1.3% |
| Pennsylvania German | 52 | 1.5% |
| Polish | 15 | 0.4% |
| Russian | 62 | 1.8% |
| Salvadoran | 9 | 0.3% |
| Scotch-Irish | 113 | 3.2% |
| Scottish | 142 | 4.0% |
| Slovak | 30 | 0.9% |
| Spanish | 8 | 0.2% |
| Swedish | 33 | 0.9% |
| Welsh | 28 | 0.8% | View All 24 Rows |
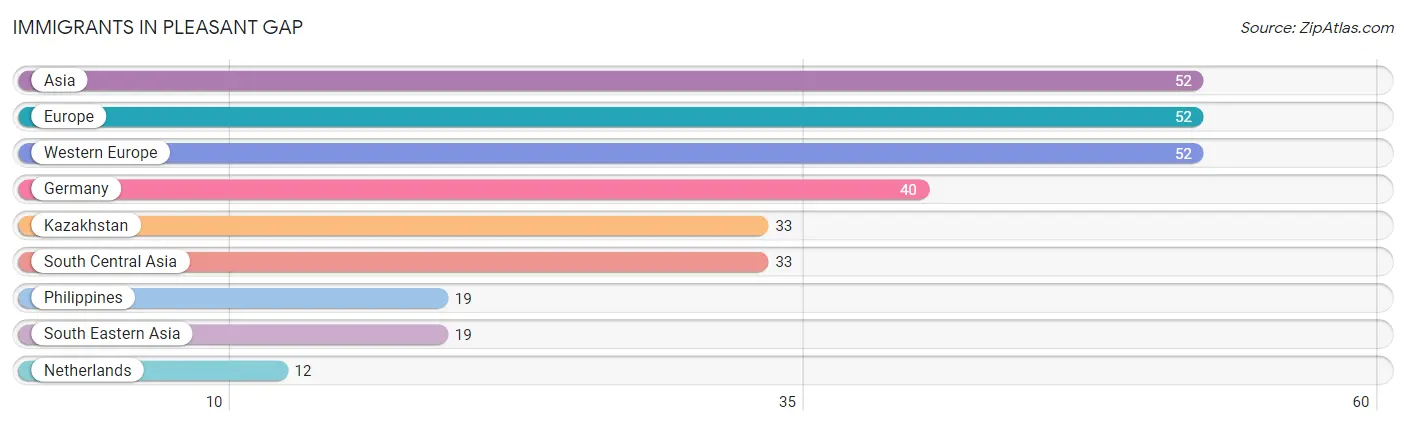
Immigrants in Pleasant Gap
The most numerous immigrant groups reported in Pleasant Gap came from Asia (52 | 1.5%), Europe (52 | 1.5%), Western Europe (52 | 1.5%), Germany (40 | 1.1%), and Kazakhstan (33 | 0.9%), together accounting for 6.5% of all Pleasant Gap residents.
| Immigration Origin | # Population | % Population |
| Asia | 52 | 1.5% |
| Europe | 52 | 1.5% |
| Germany | 40 | 1.1% |
| Kazakhstan | 33 | 0.9% |
| Netherlands | 12 | 0.3% |
| Philippines | 19 | 0.5% |
| South Central Asia | 33 | 0.9% |
| South Eastern Asia | 19 | 0.5% |
| Western Europe | 52 | 1.5% | View All 9 Rows |
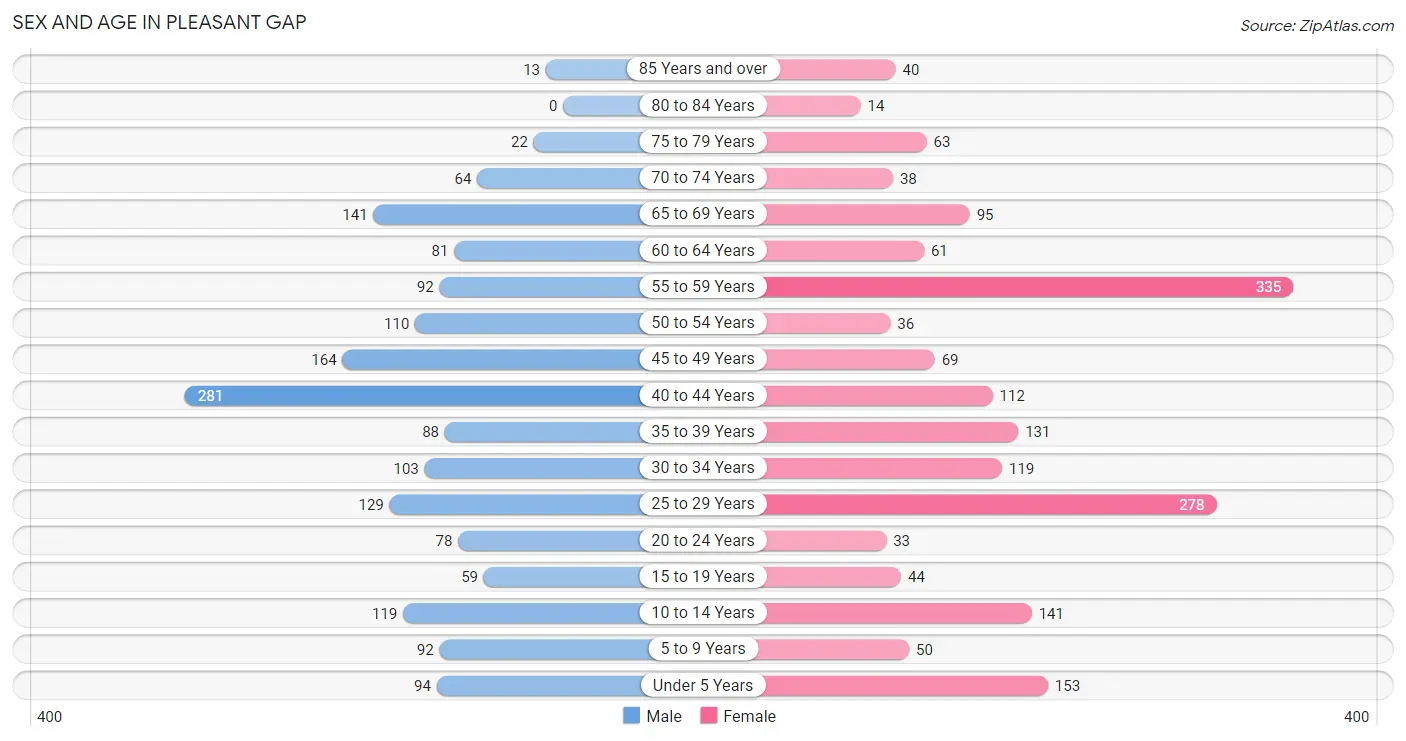
Sex and Age in Pleasant Gap
Sex and Age in Pleasant Gap
The most populous age groups in Pleasant Gap are 40 to 44 Years (281 | 16.2%) for men and 55 to 59 Years (335 | 18.5%) for women.
| Age Bracket | Male | Female |
| Under 5 Years | 94 (5.4%) | 153 (8.4%) |
| 5 to 9 Years | 92 (5.3%) | 50 (2.8%) |
| 10 to 14 Years | 119 (6.9%) | 141 (7.8%) |
| 15 to 19 Years | 59 (3.4%) | 44 (2.4%) |
| 20 to 24 Years | 78 (4.5%) | 33 (1.8%) |
| 25 to 29 Years | 129 (7.5%) | 278 (15.3%) |
| 30 to 34 Years | 103 (5.9%) | 119 (6.6%) |
| 35 to 39 Years | 88 (5.1%) | 131 (7.2%) |
| 40 to 44 Years | 281 (16.2%) | 112 (6.2%) |
| 45 to 49 Years | 164 (9.5%) | 69 (3.8%) |
| 50 to 54 Years | 110 (6.4%) | 36 (2.0%) |
| 55 to 59 Years | 92 (5.3%) | 335 (18.5%) |
| 60 to 64 Years | 81 (4.7%) | 61 (3.4%) |
| 65 to 69 Years | 141 (8.2%) | 95 (5.2%) |
| 70 to 74 Years | 64 (3.7%) | 38 (2.1%) |
| 75 to 79 Years | 22 (1.3%) | 63 (3.5%) |
| 80 to 84 Years | 0 (0.0%) | 14 (0.8%) |
| 85 Years and over | 13 (0.7%) | 40 (2.2%) |
| Total | 1,730 (100.0%) | 1,812 (100.0%) |
Families and Households in Pleasant Gap
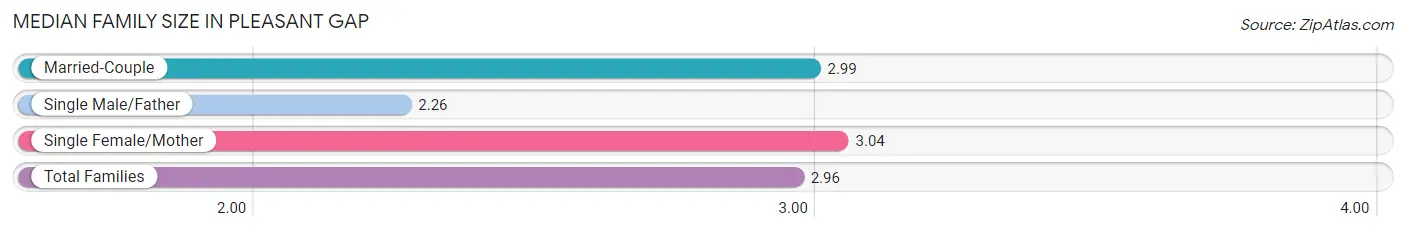
Median Family Size in Pleasant Gap
The median family size in Pleasant Gap is 2.96 persons per family, with single female/mother families (203 | 19.2%) accounting for the largest median family size of 3.04 persons per family. On the other hand, single male/father families (66 | 6.2%) represent the smallest median family size with 2.26 persons per family.
| Family Type | # Families | Family Size |
| Married-Couple | 790 (74.6%) | 2.99 |
| Single Male/Father | 66 (6.2%) | 2.26 |
| Single Female/Mother | 203 (19.2%) | 3.04 |
| Total Families | 1,059 (100.0%) | 2.96 |
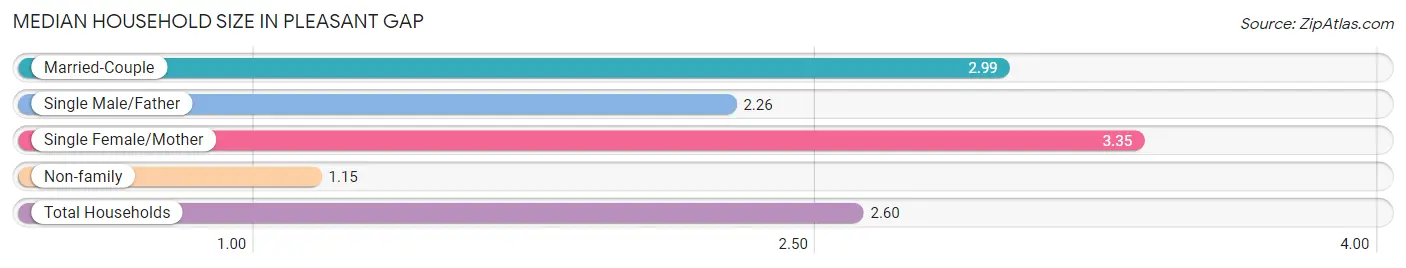
Median Household Size in Pleasant Gap
The median household size in Pleasant Gap is 2.60 persons per household, with single female/mother households (203 | 14.9%) accounting for the largest median household size of 3.35 persons per household. non-family households (302 | 22.2%) represent the smallest median household size with 1.15 persons per household.
| Household Type | # Households | Household Size |
| Married-Couple | 790 (58.1%) | 2.99 |
| Single Male/Father | 66 (4.9%) | 2.26 |
| Single Female/Mother | 203 (14.9%) | 3.35 |
| Non-family | 302 (22.2%) | 1.15 |
| Total Households | 1,361 (100.0%) | 2.60 |
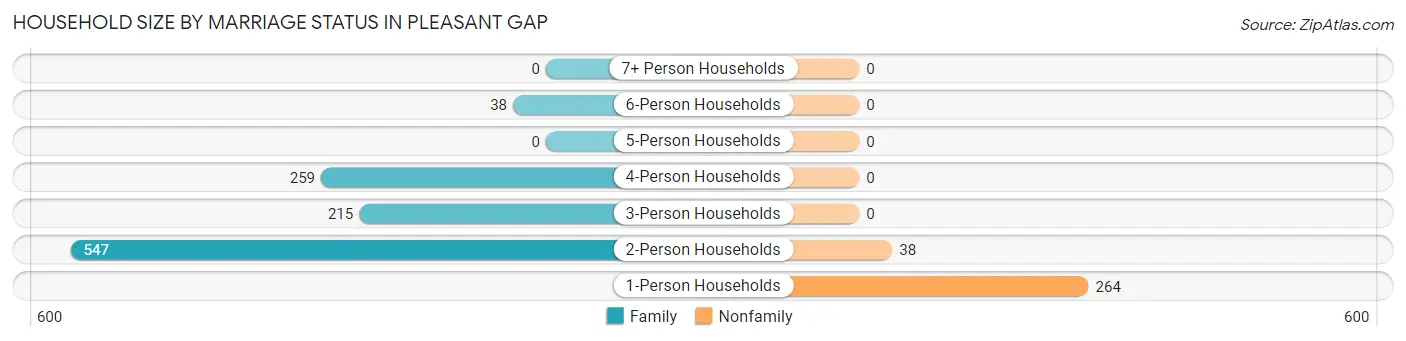
Household Size by Marriage Status in Pleasant Gap
Out of a total of 1,361 households in Pleasant Gap, 1,059 (77.8%) are family households, while 302 (22.2%) are nonfamily households. The most numerous type of family households are 2-person households, comprising 547, and the most common type of nonfamily households are 1-person households, comprising 264.
| Household Size | Family Households | Nonfamily Households |
| 1-Person Households | - | 264 (19.4%) |
| 2-Person Households | 547 (40.2%) | 38 (2.8%) |
| 3-Person Households | 215 (15.8%) | 0 (0.0%) |
| 4-Person Households | 259 (19.0%) | 0 (0.0%) |
| 5-Person Households | 0 (0.0%) | 0 (0.0%) |
| 6-Person Households | 38 (2.8%) | 0 (0.0%) |
| 7+ Person Households | 0 (0.0%) | 0 (0.0%) |
| Total | 1,059 (77.8%) | 302 (22.2%) |
Female Fertility in Pleasant Gap
Fertility by Age in Pleasant Gap
Average fertility rate in Pleasant Gap is 73.0 births per 1,000 women. Women in the age bracket of 20 to 34 years have the highest fertility rate with 88.0 births per 1,000 women. Women in the age bracket of 20 to 34 years acount for 66.7% of all women with births.
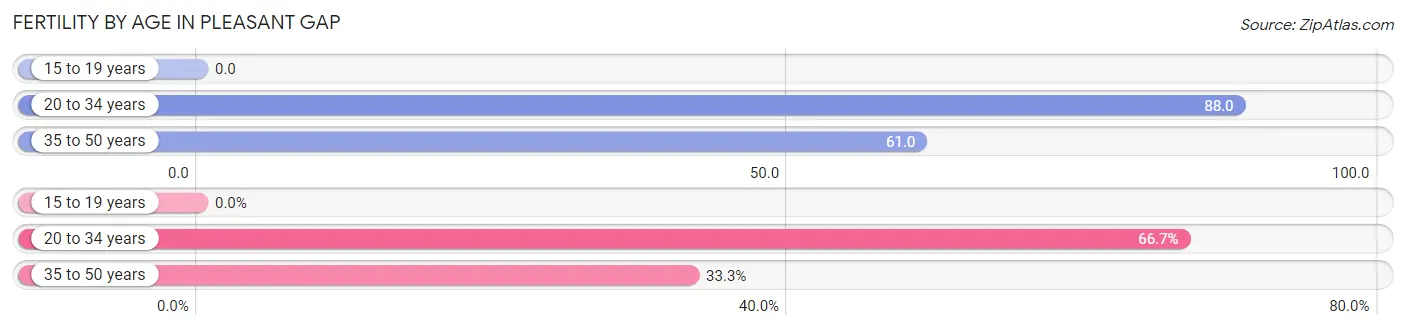
| Age Bracket | Women with Births | Births / 1,000 Women |
| 15 to 19 years | 0 (0.0%) | 0.0 |
| 20 to 34 years | 38 (66.7%) | 88.0 |
| 35 to 50 years | 19 (33.3%) | 61.0 |
| Total | 57 (100.0%) | 73.0 |
Fertility by Age by Marriage Status in Pleasant Gap
33.3% of women with births (57) in Pleasant Gap are married. The highest percentage of unmarried women with births falls into 20 to 34 years age bracket with 100.0% of them unmarried at the time of birth, while the lowest percentage of unmarried women with births belong to 35 to 50 years age bracket with 0.0% of them unmarried.
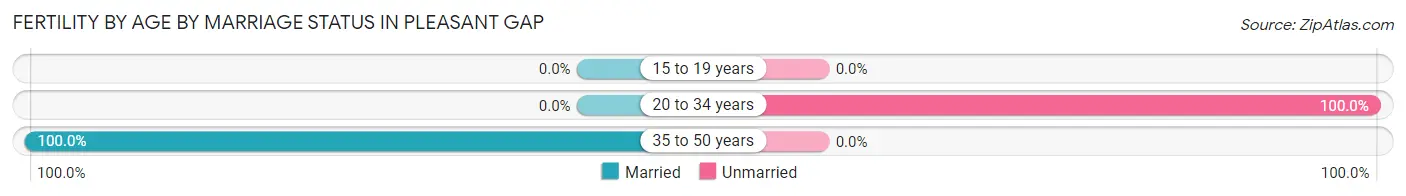
| Age Bracket | Married | Unmarried |
| 15 to 19 years | 0 (0.0%) | 0 (0.0%) |
| 20 to 34 years | 0 (0.0%) | 38 (100.0%) |
| 35 to 50 years | 19 (100.0%) | 0 (0.0%) |
| Total | 19 (33.3%) | 38 (66.7%) |
Fertility by Education in Pleasant Gap
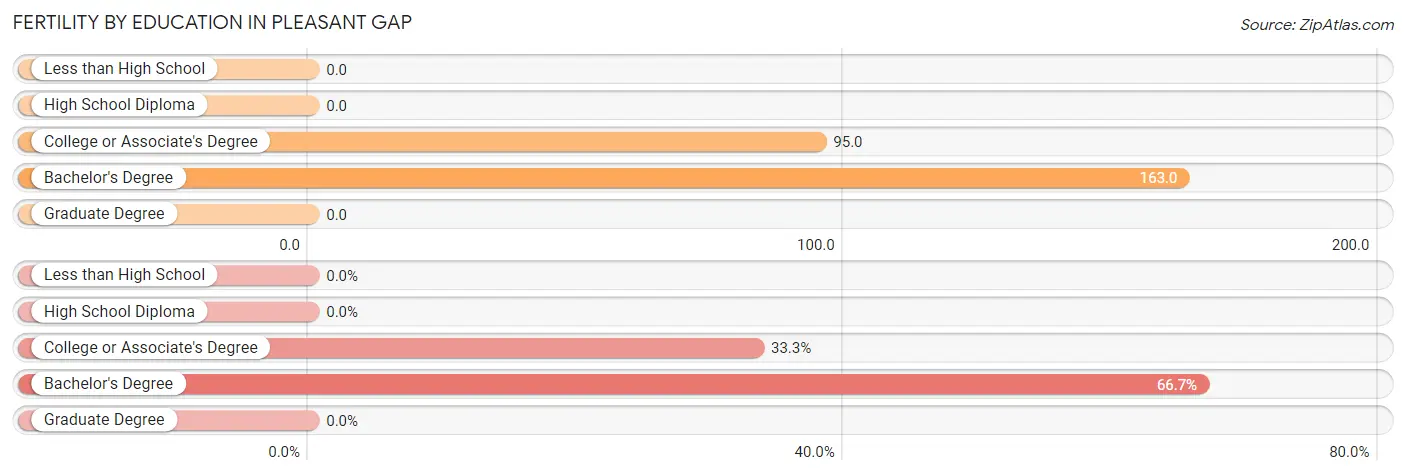
| Educational Attainment | Women with Births | Births / 1,000 Women |
| Less than High School | 0 (0.0%) | 0.0 |
| High School Diploma | 0 (0.0%) | 0.0 |
| College or Associate's Degree | 19 (33.3%) | 95.0 |
| Bachelor's Degree | 38 (66.7%) | 163.0 |
| Graduate Degree | 0 (0.0%) | 0.0 |
| Total | 57 (100.0%) | 73.0 |
Fertility by Education by Marriage Status in Pleasant Gap
66.7% of women with births in Pleasant Gap are unmarried. Women with the educational attainment of college or associate's degree are most likely to be married with 100.0% of them married at childbirth, while women with the educational attainment of bachelor's degree are least likely to be married with 100.0% of them unmarried at childbirth.
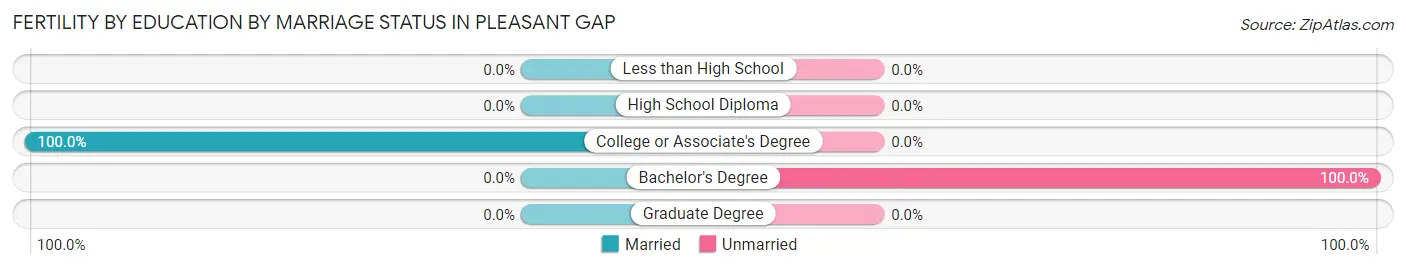
| Educational Attainment | Married | Unmarried |
| Less than High School | 0 (0.0%) | 0 (0.0%) |
| High School Diploma | 0 (0.0%) | 0 (0.0%) |
| College or Associate's Degree | 19 (100.0%) | 0 (0.0%) |
| Bachelor's Degree | 0 (0.0%) | 38 (100.0%) |
| Graduate Degree | 0 (0.0%) | 0 (0.0%) |
| Total | 19 (33.3%) | 38 (66.7%) |
Income in Pleasant Gap
Income Overview in Pleasant Gap
Per Capita Income in Pleasant Gap is $36,871, while median incomes of families and households are $86,442 and $76,104 respectively.
| Characteristic | Number | Measure |
| Per Capita Income | 3,542 | $36,871 |
| Median Family Income | 1,059 | $86,442 |
| Mean Family Income | 1,059 | $95,795 |
| Median Household Income | 1,361 | $76,104 |
| Mean Household Income | 1,361 | $89,029 |
| Income Deficit | 1,059 | $0 |
| Wage / Income Gap (%) | 3,542 | 23.09% |
| Wage / Income Gap ($) | 3,542 | 76.91¢ per $1 |
| Gini / Inequality Index | 3,542 | 0.33 |
Earnings by Sex in Pleasant Gap
Average Earnings in Pleasant Gap are $43,500, $48,214 for men and $37,083 for women, a difference of 23.1%.
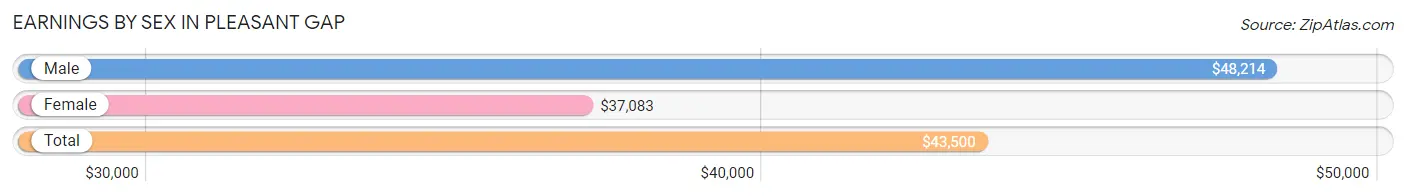
| Sex | Number | Average Earnings |
| Male | 1,176 (50.4%) | $48,214 |
| Female | 1,156 (49.6%) | $37,083 |
| Total | 2,332 (100.0%) | $43,500 |
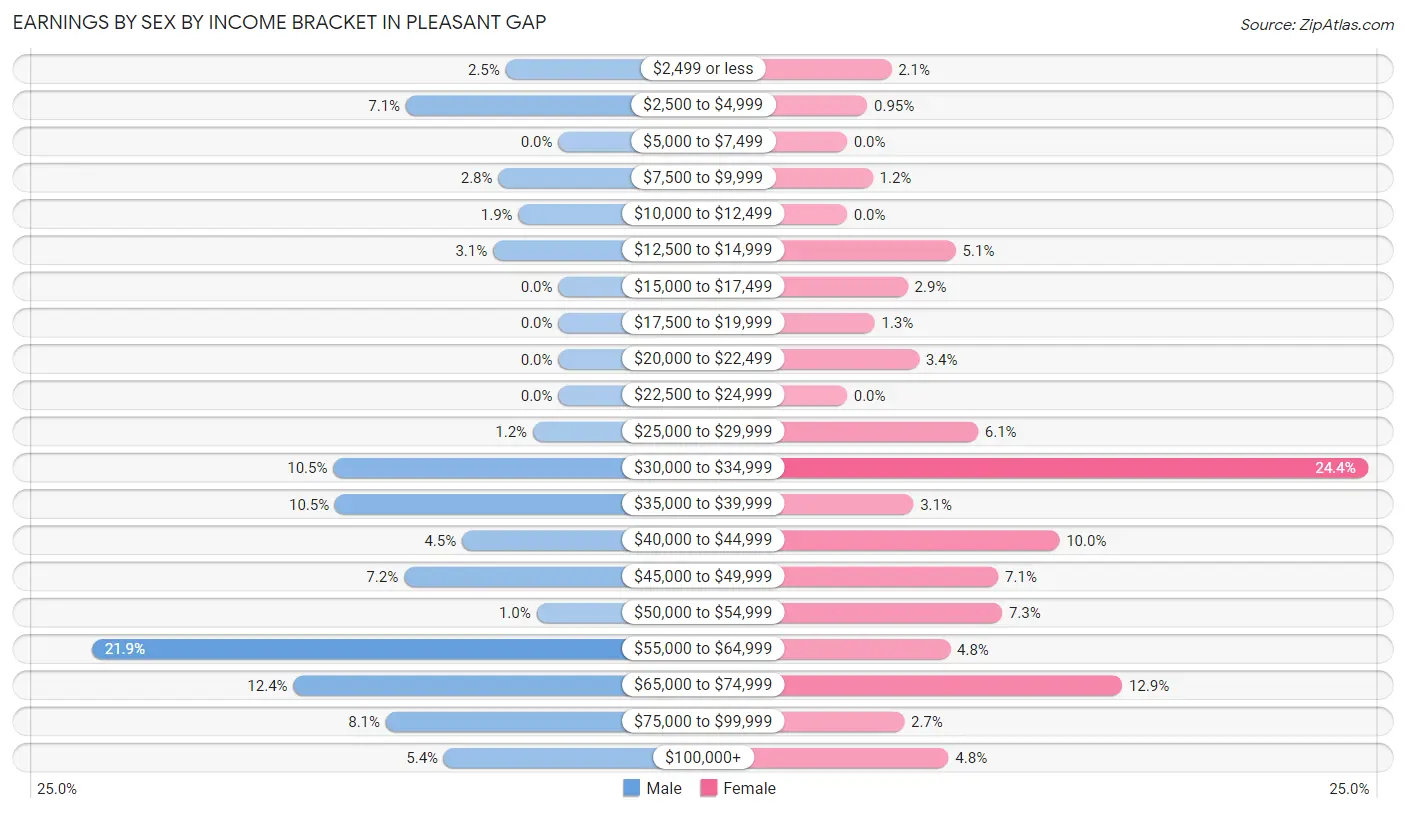
Earnings by Sex by Income Bracket in Pleasant Gap
The most common earnings brackets in Pleasant Gap are $55,000 to $64,999 for men (257 | 21.8%) and $30,000 to $34,999 for women (282 | 24.4%).
| Income | Male | Female |
| $2,499 or less | 29 (2.5%) | 24 (2.1%) |
| $2,500 to $4,999 | 84 (7.1%) | 11 (0.9%) |
| $5,000 to $7,499 | 0 (0.0%) | 0 (0.0%) |
| $7,500 to $9,999 | 33 (2.8%) | 14 (1.2%) |
| $10,000 to $12,499 | 22 (1.9%) | 0 (0.0%) |
| $12,500 to $14,999 | 36 (3.1%) | 59 (5.1%) |
| $15,000 to $17,499 | 0 (0.0%) | 33 (2.9%) |
| $17,500 to $19,999 | 0 (0.0%) | 15 (1.3%) |
| $20,000 to $22,499 | 0 (0.0%) | 39 (3.4%) |
| $22,500 to $24,999 | 0 (0.0%) | 0 (0.0%) |
| $25,000 to $29,999 | 14 (1.2%) | 71 (6.1%) |
| $30,000 to $34,999 | 124 (10.5%) | 282 (24.4%) |
| $35,000 to $39,999 | 123 (10.5%) | 36 (3.1%) |
| $40,000 to $44,999 | 53 (4.5%) | 115 (10.0%) |
| $45,000 to $49,999 | 85 (7.2%) | 82 (7.1%) |
| $50,000 to $54,999 | 12 (1.0%) | 84 (7.3%) |
| $55,000 to $64,999 | 257 (21.8%) | 56 (4.8%) |
| $65,000 to $74,999 | 146 (12.4%) | 149 (12.9%) |
| $75,000 to $99,999 | 95 (8.1%) | 31 (2.7%) |
| $100,000+ | 63 (5.4%) | 55 (4.8%) |
| Total | 1,176 (100.0%) | 1,156 (100.0%) |
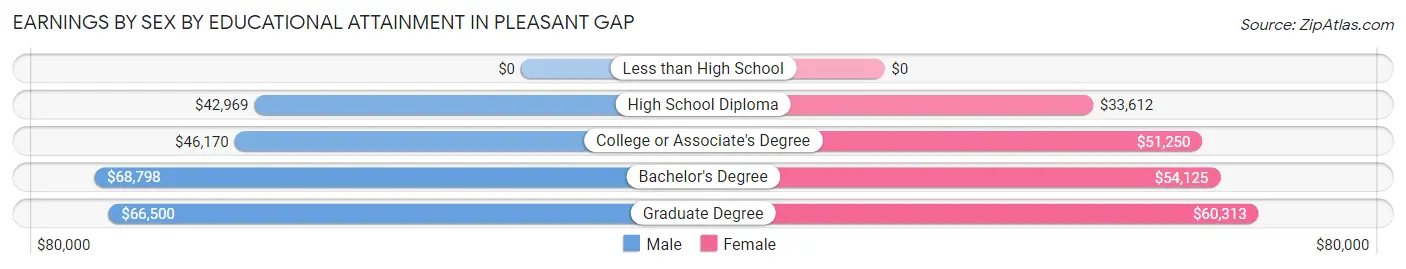
Earnings by Sex by Educational Attainment in Pleasant Gap
Average earnings in Pleasant Gap are $55,365 for men and $40,804 for women, a difference of 26.3%. Men with an educational attainment of bachelor's degree enjoy the highest average annual earnings of $68,798, while those with high school diploma education earn the least with $42,969. Women with an educational attainment of graduate degree earn the most with the average annual earnings of $60,313, while those with high school diploma education have the smallest earnings of $33,612.
| Educational Attainment | Male Income | Female Income |
| Less than High School | - | - |
| High School Diploma | $42,969 | $33,612 |
| College or Associate's Degree | $46,170 | $51,250 |
| Bachelor's Degree | $68,798 | $54,125 |
| Graduate Degree | $66,500 | $60,313 |
| Total | $55,365 | $40,804 |
Family Income in Pleasant Gap
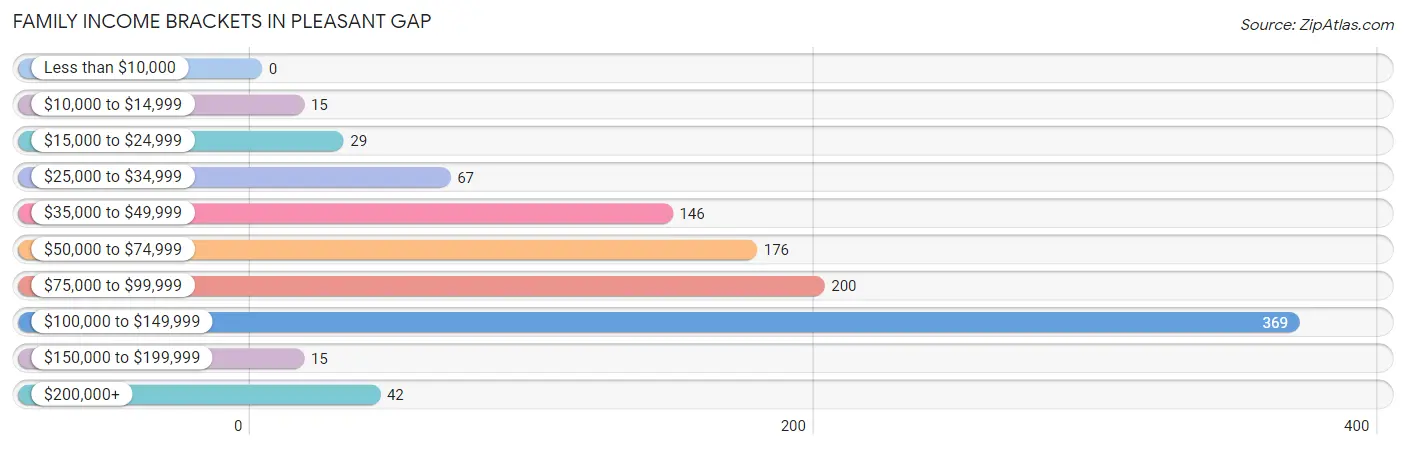
Family Income Brackets in Pleasant Gap
According to the Pleasant Gap family income data, there are 369 families falling into the $100,000 to $149,999 income range, which is the most common income bracket and makes up 34.8% of all families.
| Income Bracket | # Families | % Families |
| Less than $10,000 | 0 | 0.0% |
| $10,000 to $14,999 | 15 | 1.4% |
| $15,000 to $24,999 | 29 | 2.7% |
| $25,000 to $34,999 | 67 | 6.3% |
| $35,000 to $49,999 | 146 | 13.8% |
| $50,000 to $74,999 | 176 | 16.6% |
| $75,000 to $99,999 | 200 | 18.9% |
| $100,000 to $149,999 | 369 | 34.8% |
| $150,000 to $199,999 | 15 | 1.4% |
| $200,000+ | 42 | 4.0% |
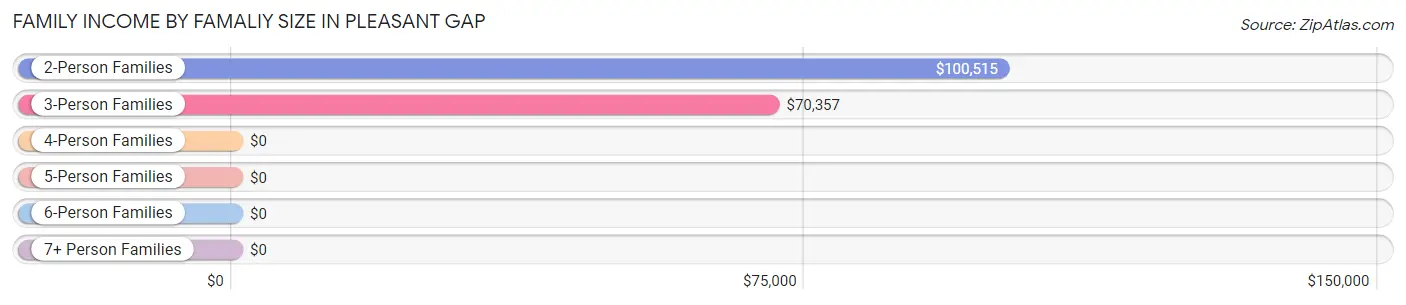
Family Income by Famaliy Size in Pleasant Gap
2-person families (561 | 53.0%) account for the highest median family income in Pleasant Gap with $100,515 per family, while 2-person families (561 | 53.0%) have the highest median income of $50,258 per family member.
| Income Bracket | # Families | Median Income |
| 2-Person Families | 561 (53.0%) | $100,515 |
| 3-Person Families | 254 (24.0%) | $70,357 |
| 4-Person Families | 206 (19.5%) | $0 |
| 5-Person Families | 0 (0.0%) | $0 |
| 6-Person Families | 38 (3.6%) | $0 |
| 7+ Person Families | 0 (0.0%) | $0 |
| Total | 1,059 (100.0%) | $86,442 |
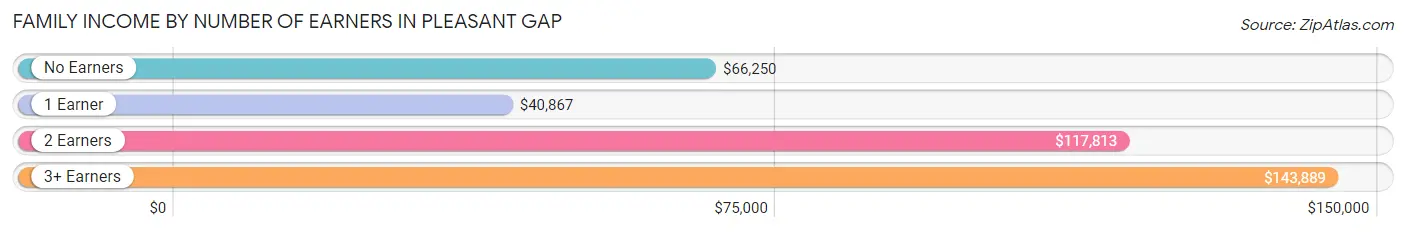
Family Income by Number of Earners in Pleasant Gap
The median family income in Pleasant Gap is $86,442, with families comprising 3+ earners (158) having the highest median family income of $143,889, while families with 1 earner (348) have the lowest median family income of $40,867, accounting for 14.9% and 32.9% of families, respectively.
| Number of Earners | # Families | Median Income |
| No Earners | 41 (3.9%) | $66,250 |
| 1 Earner | 348 (32.9%) | $40,867 |
| 2 Earners | 512 (48.3%) | $117,813 |
| 3+ Earners | 158 (14.9%) | $143,889 |
| Total | 1,059 (100.0%) | $86,442 |
Household Income in Pleasant Gap
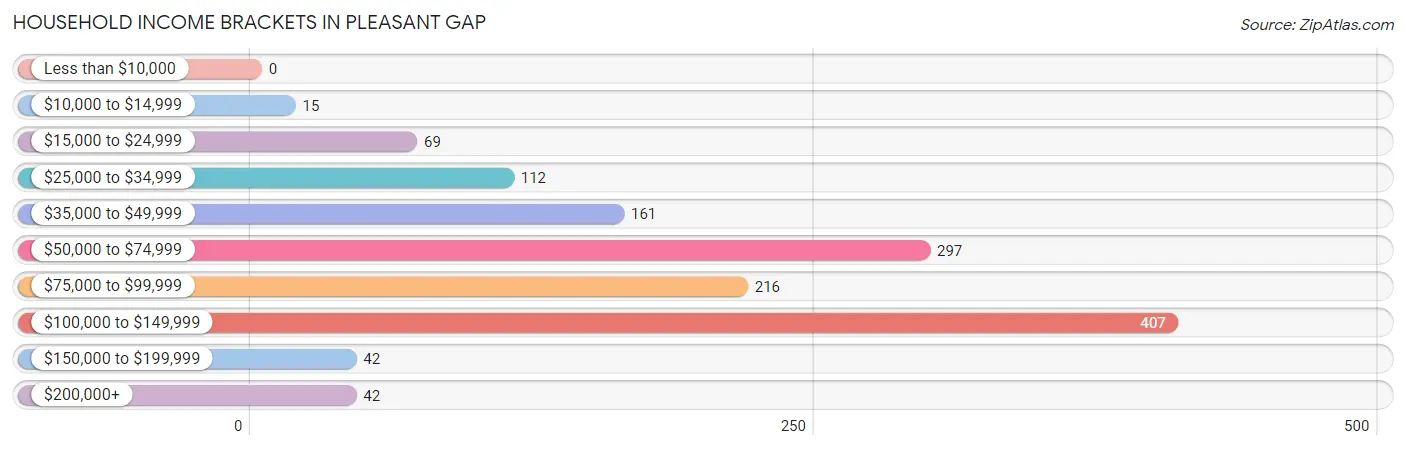
Household Income Brackets in Pleasant Gap
With 407 households falling in the category, the $100,000 to $149,999 income range is the most frequent in Pleasant Gap, accounting for 29.9% of all households.
| Income Bracket | # Households | % Households |
| Less than $10,000 | 0 | 0.0% |
| $10,000 to $14,999 | 15 | 1.1% |
| $15,000 to $24,999 | 69 | 5.1% |
| $25,000 to $34,999 | 112 | 8.2% |
| $35,000 to $49,999 | 161 | 11.8% |
| $50,000 to $74,999 | 297 | 21.8% |
| $75,000 to $99,999 | 216 | 15.9% |
| $100,000 to $149,999 | 407 | 29.9% |
| $150,000 to $199,999 | 42 | 3.1% |
| $200,000+ | 42 | 3.1% |
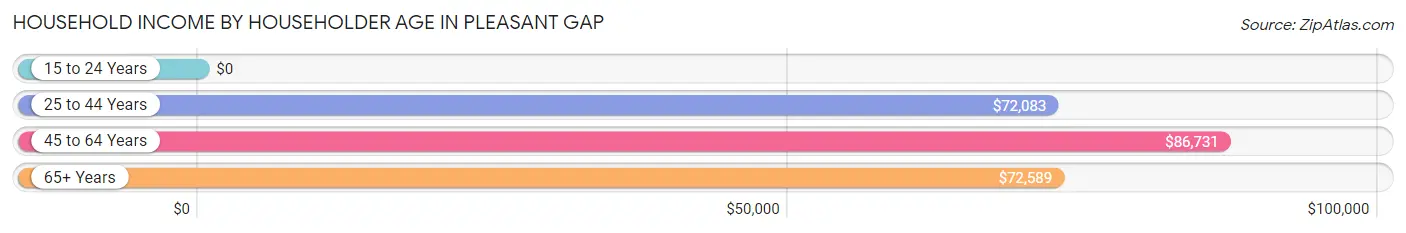
Household Income by Householder Age in Pleasant Gap
The median household income in Pleasant Gap is $76,104, with the highest median household income of $86,731 found in the 45 to 64 years age bracket for the primary householder. A total of 400 households (29.4%) fall into this category. Meanwhile, the 15 to 24 years age bracket for the primary householder has the lowest median household income of $0, with 33 households (2.4%) in this group.
| Income Bracket | # Households | Median Income |
| 15 to 24 Years | 33 (2.4%) | $0 |
| 25 to 44 Years | 525 (38.6%) | $72,083 |
| 45 to 64 Years | 400 (29.4%) | $86,731 |
| 65+ Years | 403 (29.6%) | $72,589 |
| Total | 1,361 (100.0%) | $76,104 |
Poverty in Pleasant Gap
Income Below Poverty by Sex and Age in Pleasant Gap
With 1.4% poverty level for males and 1.5% for females among the residents of Pleasant Gap, under 5 year old males and 12 to 14 year old females are the most vulnerable to poverty, with 9 males (9.6%) and 12 females (18.2%) in their respective age groups living below the poverty level.
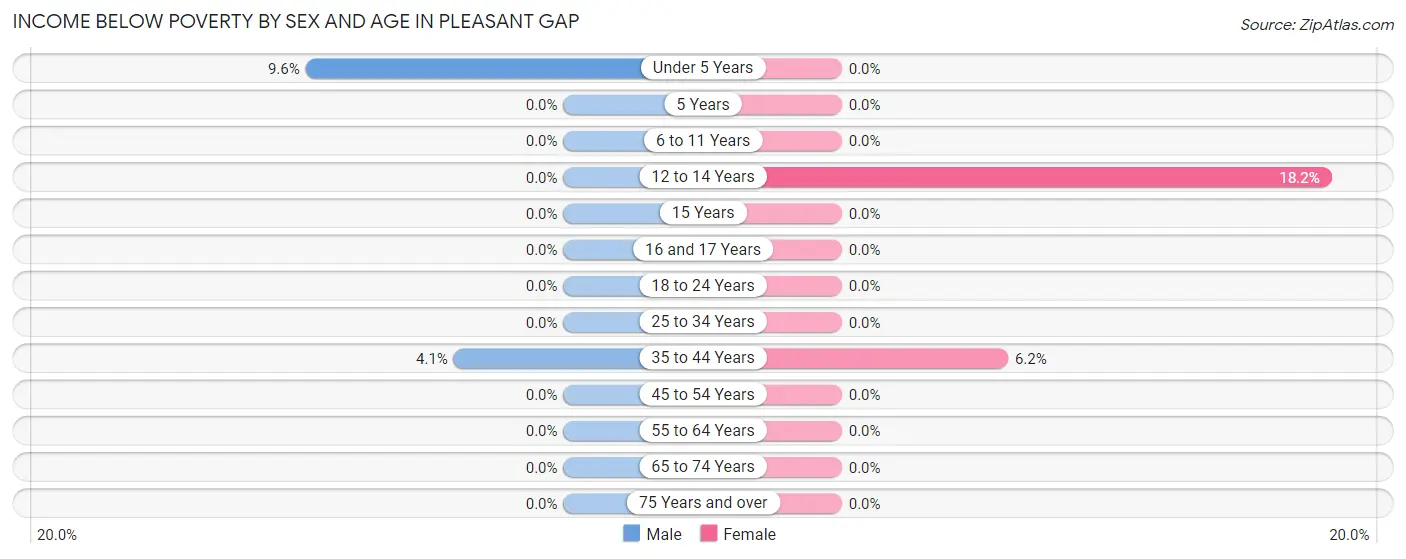
| Age Bracket | Male | Female |
| Under 5 Years | 9 (9.6%) | 0 (0.0%) |
| 5 Years | 0 (0.0%) | 0 (0.0%) |
| 6 to 11 Years | 0 (0.0%) | 0 (0.0%) |
| 12 to 14 Years | 0 (0.0%) | 12 (18.2%) |
| 15 Years | 0 (0.0%) | 0 (0.0%) |
| 16 and 17 Years | 0 (0.0%) | 0 (0.0%) |
| 18 to 24 Years | 0 (0.0%) | 0 (0.0%) |
| 25 to 34 Years | 0 (0.0%) | 0 (0.0%) |
| 35 to 44 Years | 15 (4.1%) | 15 (6.2%) |
| 45 to 54 Years | 0 (0.0%) | 0 (0.0%) |
| 55 to 64 Years | 0 (0.0%) | 0 (0.0%) |
| 65 to 74 Years | 0 (0.0%) | 0 (0.0%) |
| 75 Years and over | 0 (0.0%) | 0 (0.0%) |
| Total | 24 (1.4%) | 27 (1.5%) |
Income Above Poverty by Sex and Age in Pleasant Gap
According to the poverty statistics in Pleasant Gap, males aged 6 to 11 years and females aged under 5 years are the age groups that are most secure financially, with 100.0% of males and 100.0% of females in these age groups living above the poverty line.
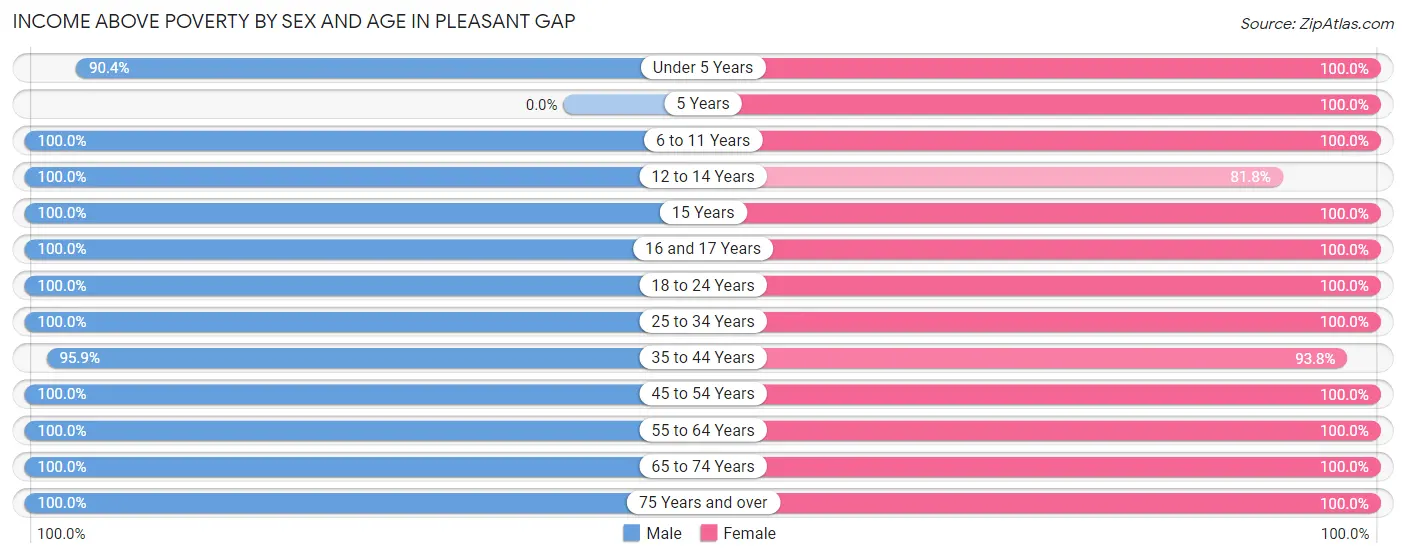
| Age Bracket | Male | Female |
| Under 5 Years | 85 (90.4%) | 153 (100.0%) |
| 5 Years | 0 (0.0%) | 16 (100.0%) |
| 6 to 11 Years | 131 (100.0%) | 109 (100.0%) |
| 12 to 14 Years | 80 (100.0%) | 54 (81.8%) |
| 15 Years | 24 (100.0%) | 20 (100.0%) |
| 16 and 17 Years | 31 (100.0%) | 24 (100.0%) |
| 18 to 24 Years | 82 (100.0%) | 33 (100.0%) |
| 25 to 34 Years | 232 (100.0%) | 397 (100.0%) |
| 35 to 44 Years | 354 (95.9%) | 228 (93.8%) |
| 45 to 54 Years | 274 (100.0%) | 105 (100.0%) |
| 55 to 64 Years | 173 (100.0%) | 396 (100.0%) |
| 65 to 74 Years | 205 (100.0%) | 133 (100.0%) |
| 75 Years and over | 35 (100.0%) | 117 (100.0%) |
| Total | 1,706 (98.6%) | 1,785 (98.5%) |
Income Below Poverty Among Married-Couple Families in Pleasant Gap
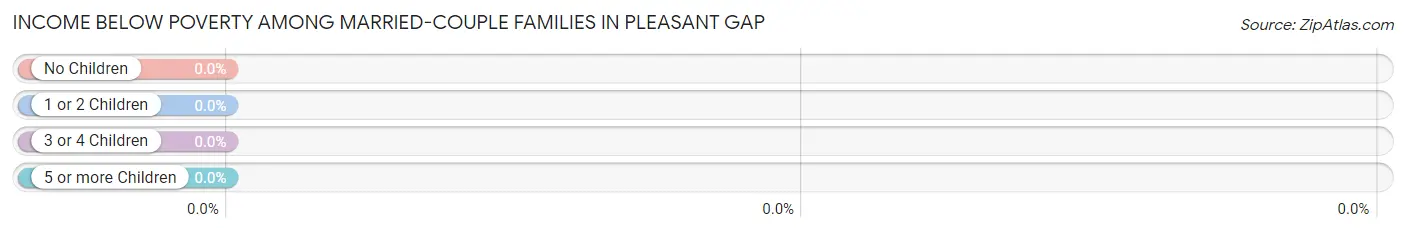
| Children | Above Poverty | Below Poverty |
| No Children | 544 (100.0%) | 0 (0.0%) |
| 1 or 2 Children | 208 (100.0%) | 0 (0.0%) |
| 3 or 4 Children | 38 (100.0%) | 0 (0.0%) |
| 5 or more Children | 0 (0.0%) | 0 (0.0%) |
| Total | 790 (100.0%) | 0 (0.0%) |
Income Below Poverty Among Single-Parent Households in Pleasant Gap
According to the poverty data in Pleasant Gap, 22.7% or 15 single-father households and 7.4% or 15 single-mother households are living below the poverty line. Among single-father households, those with 1 or 2 children have the highest poverty rate, with 15 households (100.0%) experiencing poverty. Likewise, among single-mother households, those with 1 or 2 children have the highest poverty rate, with 15 households (14.8%) falling below the poverty line.
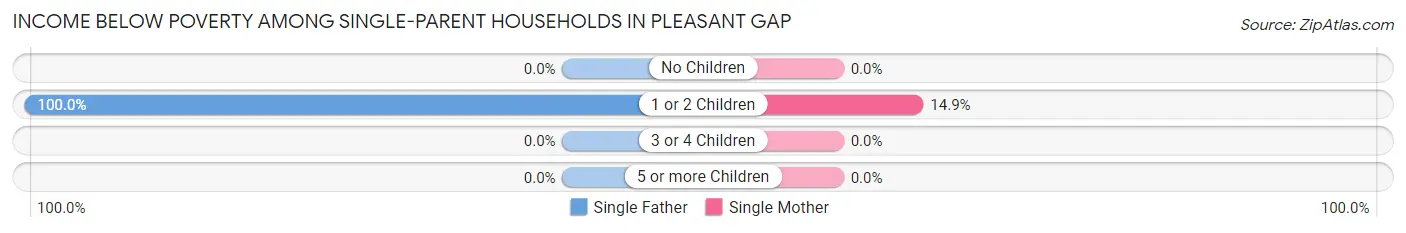
| Children | Single Father | Single Mother |
| No Children | 0 (0.0%) | 0 (0.0%) |
| 1 or 2 Children | 15 (100.0%) | 15 (14.8%) |
| 3 or 4 Children | 0 (0.0%) | 0 (0.0%) |
| 5 or more Children | 0 (0.0%) | 0 (0.0%) |
| Total | 15 (22.7%) | 15 (7.4%) |
Income Below Poverty Among Married-Couple vs Single-Parent Households in Pleasant Gap
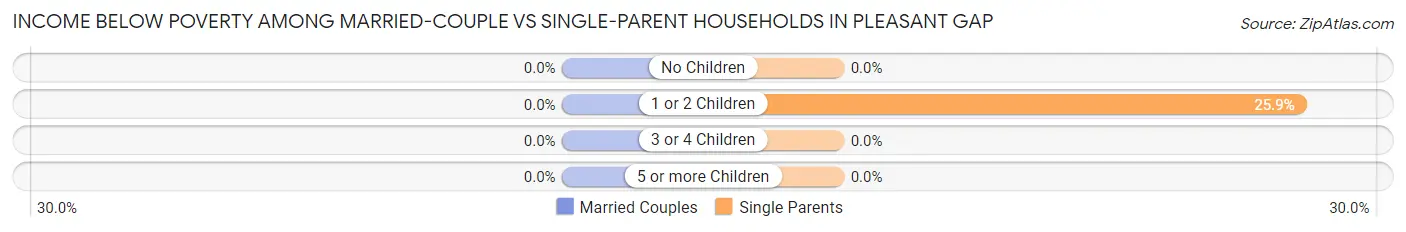
| Children | Married-Couple Families | Single-Parent Households |
| No Children | 0 (0.0%) | 0 (0.0%) |
| 1 or 2 Children | 0 (0.0%) | 30 (25.9%) |
| 3 or 4 Children | 0 (0.0%) | 0 (0.0%) |
| 5 or more Children | 0 (0.0%) | 0 (0.0%) |
| Total | 0 (0.0%) | 30 (11.2%) |
Employment Characteristics in Pleasant Gap
Employment by Class of Employer in Pleasant Gap
Among the 2,145 employed individuals in Pleasant Gap, private company employees (1,614 | 75.2%), not-for-profit organizations (217 | 10.1%), and state government employees (138 | 6.4%) make up the most common classes of employment.
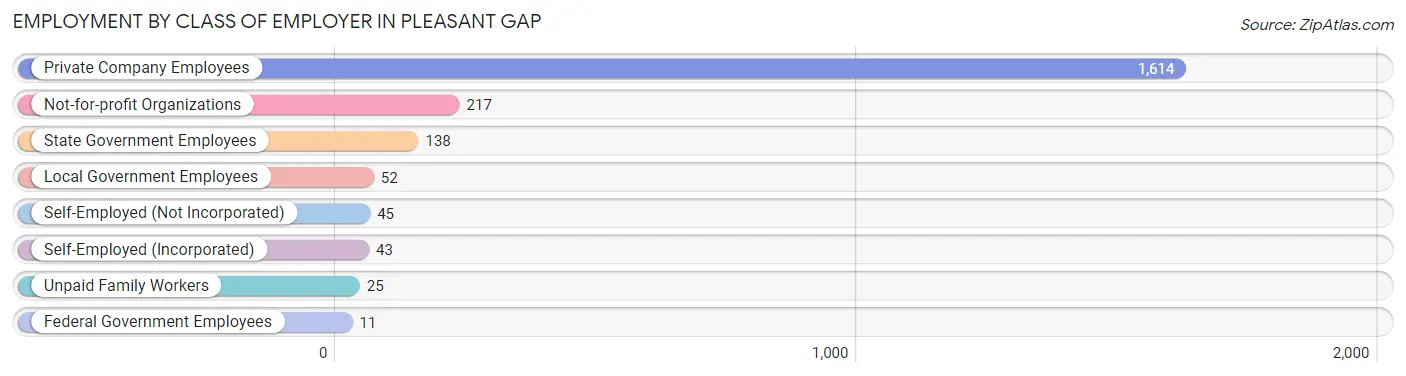
| Employer Class | # Employees | % Employees |
| Private Company Employees | 1,614 | 75.2% |
| Self-Employed (Incorporated) | 43 | 2.0% |
| Self-Employed (Not Incorporated) | 45 | 2.1% |
| Not-for-profit Organizations | 217 | 10.1% |
| Local Government Employees | 52 | 2.4% |
| State Government Employees | 138 | 6.4% |
| Federal Government Employees | 11 | 0.5% |
| Unpaid Family Workers | 25 | 1.2% |
| Total | 2,145 | 100.0% |
Employment Status by Age in Pleasant Gap
According to the labor force statistics for Pleasant Gap, out of the total population over 16 years of age (2,849), 77.8% or 2,217 individuals are in the labor force, with 3.2% or 71 of them unemployed. The age group with the highest labor force participation rate is 20 to 24 years, with 100.0% or 111 individuals in the labor force. Within the labor force, the 75 years and over age range has the highest percentage of unemployed individuals, with 56.9% or 37 of them being unemployed.
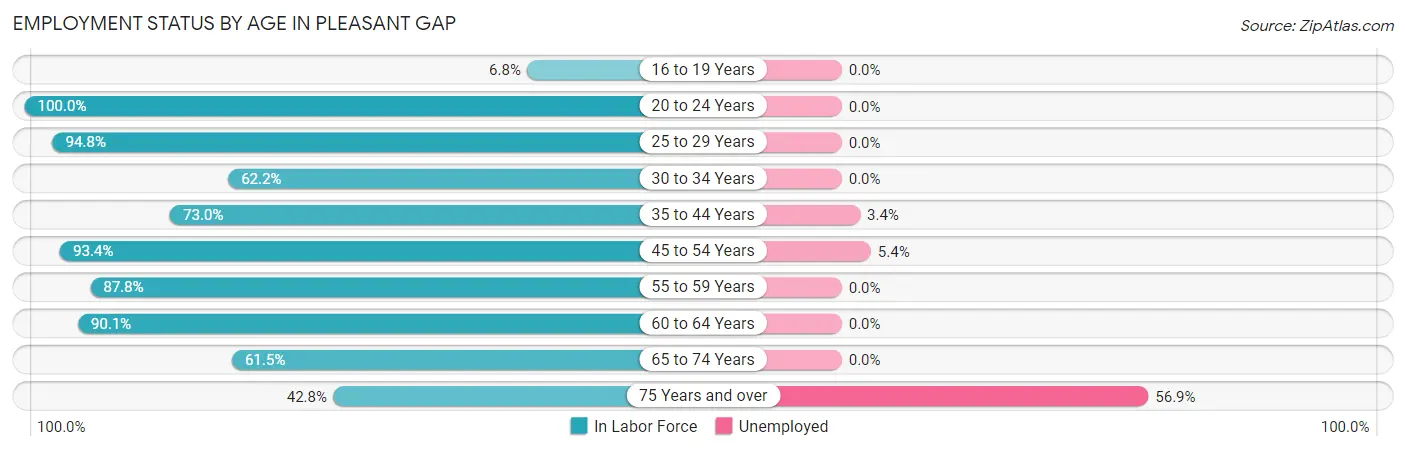
| Age Bracket | In Labor Force | Unemployed |
| 16 to 19 Years | 4 (6.8%) | 0 (0.0%) |
| 20 to 24 Years | 111 (100.0%) | 0 (0.0%) |
| 25 to 29 Years | 386 (94.8%) | 0 (0.0%) |
| 30 to 34 Years | 138 (62.2%) | 0 (0.0%) |
| 35 to 44 Years | 447 (73.0%) | 15 (3.4%) |
| 45 to 54 Years | 354 (93.4%) | 19 (5.4%) |
| 55 to 59 Years | 375 (87.8%) | 0 (0.0%) |
| 60 to 64 Years | 128 (90.1%) | 0 (0.0%) |
| 65 to 74 Years | 208 (61.5%) | 0 (0.0%) |
| 75 Years and over | 65 (42.8%) | 37 (56.9%) |
| Total | 2,217 (77.8%) | 71 (3.2%) |
Employment Status by Educational Attainment in Pleasant Gap
According to labor force statistics for Pleasant Gap, 83.5% of individuals (1,828) out of the total population between 25 and 64 years of age (2,189) are in the labor force, with 1.9% or 35 of them being unemployed. The group with the highest labor force participation rate are those with the educational attainment of less than high school, with 100.0% or 16 individuals in the labor force. Within the labor force, individuals with bachelor's degree or higher education have the highest percentage of unemployment, with 3.8% or 20 of them being unemployed.
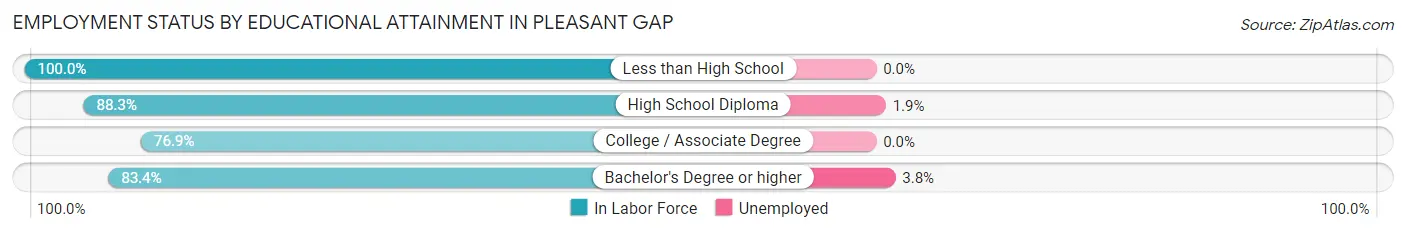
| Educational Attainment | In Labor Force | Unemployed |
| Less than High School | 16 (100.0%) | 0 (0.0%) |
| High School Diploma | 778 (88.3%) | 17 (1.9%) |
| College / Associate Degree | 517 (76.9%) | 0 (0.0%) |
| Bachelor's Degree or higher | 517 (83.4%) | 24 (3.8%) |
| Total | 1,828 (83.5%) | 42 (1.9%) |
Employment Occupations by Sex in Pleasant Gap
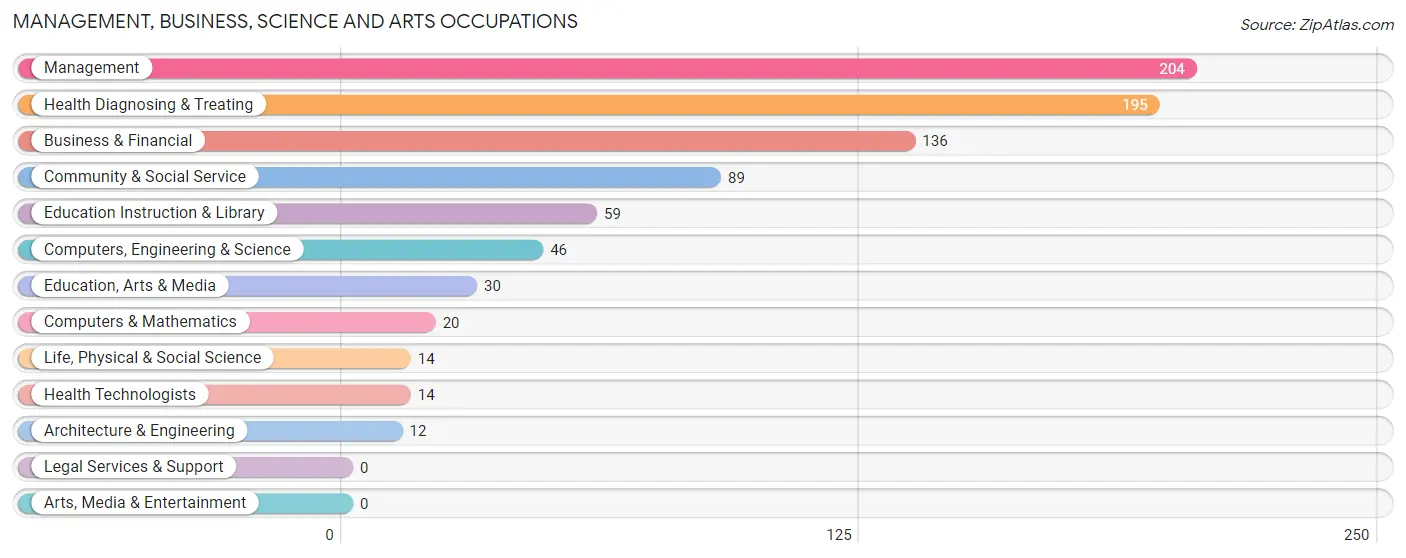
Management, Business, Science and Arts Occupations
The most common Management, Business, Science and Arts occupations in Pleasant Gap are Management (204 | 9.6%), Health Diagnosing & Treating (195 | 9.1%), Business & Financial (136 | 6.4%), Community & Social Service (89 | 4.2%), and Education Instruction & Library (59 | 2.8%).
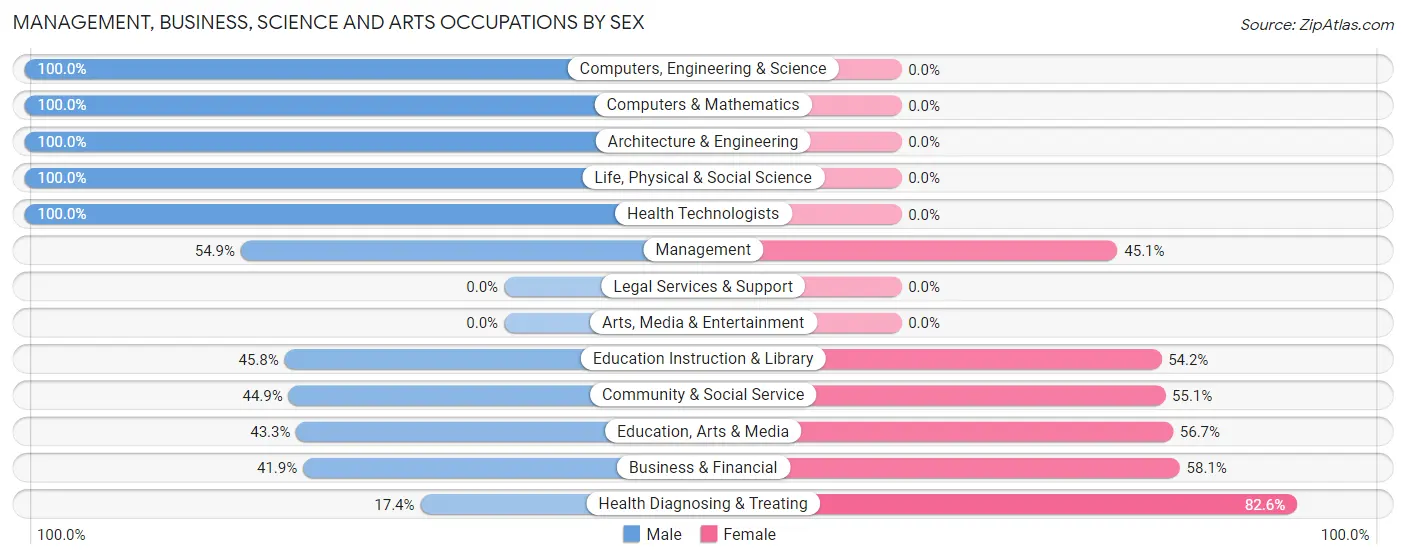
Management, Business, Science and Arts Occupations by Sex
Within the Management, Business, Science and Arts occupations in Pleasant Gap, the most male-oriented occupations are Computers, Engineering & Science (100.0%), Computers & Mathematics (100.0%), and Architecture & Engineering (100.0%), while the most female-oriented occupations are Health Diagnosing & Treating (82.6%), Business & Financial (58.1%), and Education, Arts & Media (56.7%).
| Occupation | Male | Female |
| Management | 112 (54.9%) | 92 (45.1%) |
| Business & Financial | 57 (41.9%) | 79 (58.1%) |
| Computers, Engineering & Science | 46 (100.0%) | 0 (0.0%) |
| Computers & Mathematics | 20 (100.0%) | 0 (0.0%) |
| Architecture & Engineering | 12 (100.0%) | 0 (0.0%) |
| Life, Physical & Social Science | 14 (100.0%) | 0 (0.0%) |
| Community & Social Service | 40 (44.9%) | 49 (55.1%) |
| Education, Arts & Media | 13 (43.3%) | 17 (56.7%) |
| Legal Services & Support | 0 (0.0%) | 0 (0.0%) |
| Education Instruction & Library | 27 (45.8%) | 32 (54.2%) |
| Arts, Media & Entertainment | 0 (0.0%) | 0 (0.0%) |
| Health Diagnosing & Treating | 34 (17.4%) | 161 (82.6%) |
| Health Technologists | 14 (100.0%) | 0 (0.0%) |
| Total (Category) | 289 (43.1%) | 381 (56.9%) |
| Total (Overall) | 1,101 (51.6%) | 1,033 (48.4%) |
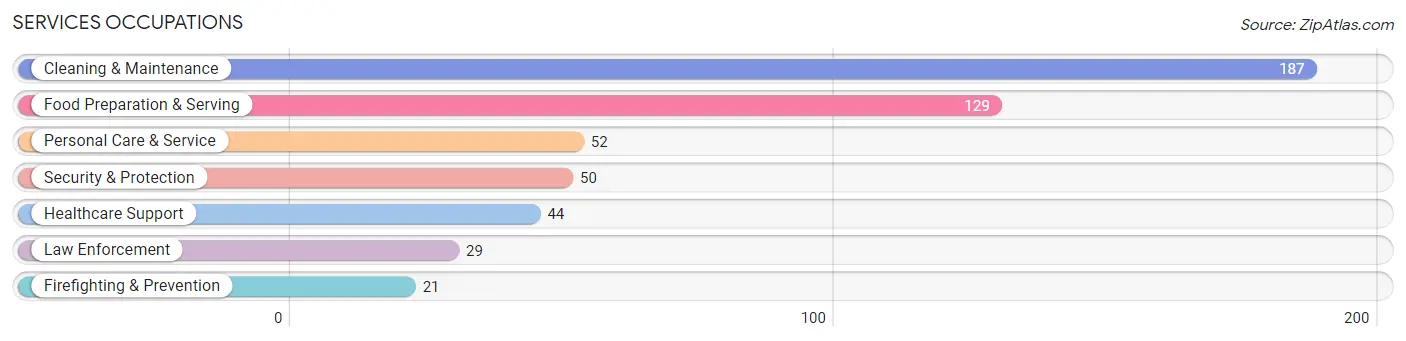
Services Occupations
The most common Services occupations in Pleasant Gap are Cleaning & Maintenance (187 | 8.8%), Food Preparation & Serving (129 | 6.0%), Personal Care & Service (52 | 2.4%), Security & Protection (50 | 2.3%), and Healthcare Support (44 | 2.1%).
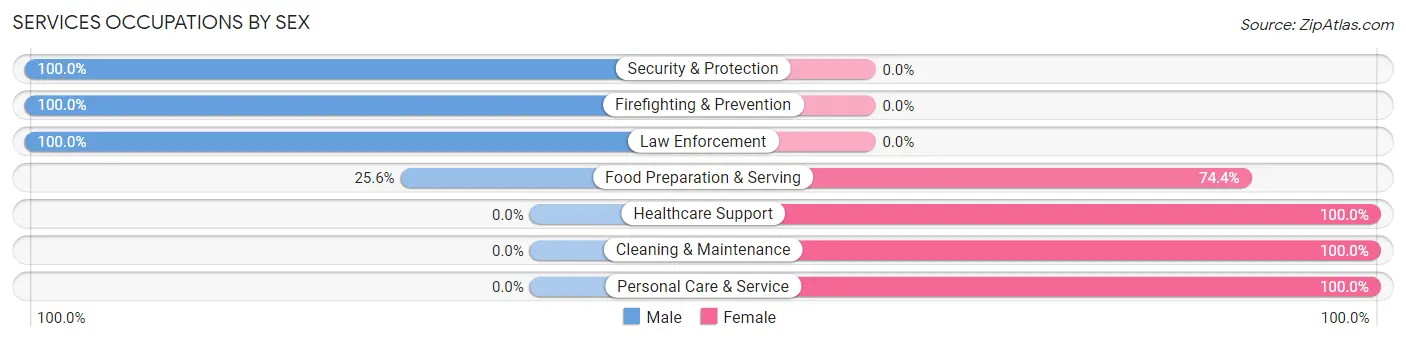
Services Occupations by Sex
Within the Services occupations in Pleasant Gap, the most male-oriented occupations are Security & Protection (100.0%), Firefighting & Prevention (100.0%), and Law Enforcement (100.0%), while the most female-oriented occupations are Healthcare Support (100.0%), Cleaning & Maintenance (100.0%), and Personal Care & Service (100.0%).
| Occupation | Male | Female |
| Healthcare Support | 0 (0.0%) | 44 (100.0%) |
| Security & Protection | 50 (100.0%) | 0 (0.0%) |
| Firefighting & Prevention | 21 (100.0%) | 0 (0.0%) |
| Law Enforcement | 29 (100.0%) | 0 (0.0%) |
| Food Preparation & Serving | 33 (25.6%) | 96 (74.4%) |
| Cleaning & Maintenance | 0 (0.0%) | 187 (100.0%) |
| Personal Care & Service | 0 (0.0%) | 52 (100.0%) |
| Total (Category) | 83 (18.0%) | 379 (82.0%) |
| Total (Overall) | 1,101 (51.6%) | 1,033 (48.4%) |
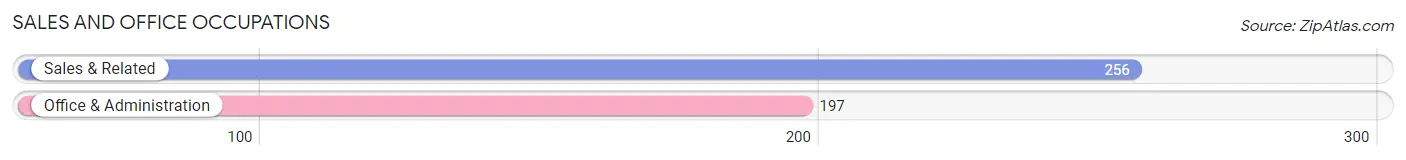
Sales and Office Occupations
The most common Sales and Office occupations in Pleasant Gap are Sales & Related (256 | 12.0%), and Office & Administration (197 | 9.2%).
Sales and Office Occupations by Sex
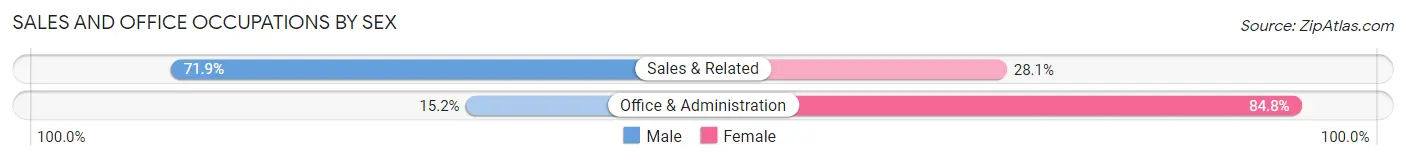
| Occupation | Male | Female |
| Sales & Related | 184 (71.9%) | 72 (28.1%) |
| Office & Administration | 30 (15.2%) | 167 (84.8%) |
| Total (Category) | 214 (47.2%) | 239 (52.8%) |
| Total (Overall) | 1,101 (51.6%) | 1,033 (48.4%) |
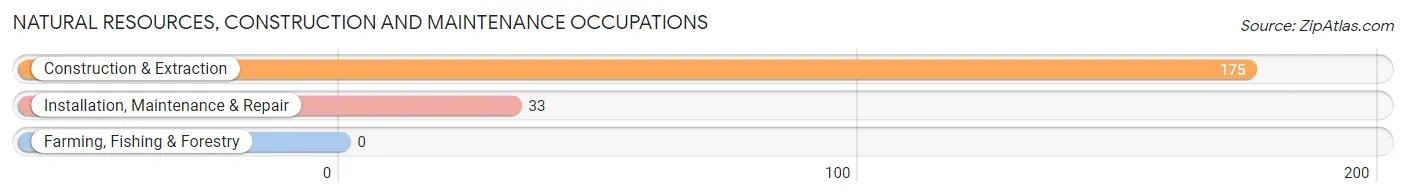
Natural Resources, Construction and Maintenance Occupations
The most common Natural Resources, Construction and Maintenance occupations in Pleasant Gap are Construction & Extraction (175 | 8.2%), and Installation, Maintenance & Repair (33 | 1.5%).
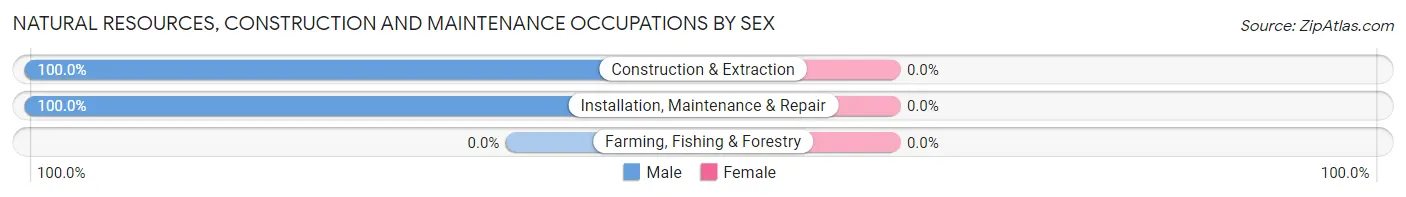
Natural Resources, Construction and Maintenance Occupations by Sex
| Occupation | Male | Female |
| Farming, Fishing & Forestry | 0 (0.0%) | 0 (0.0%) |
| Construction & Extraction | 175 (100.0%) | 0 (0.0%) |
| Installation, Maintenance & Repair | 33 (100.0%) | 0 (0.0%) |
| Total (Category) | 208 (100.0%) | 0 (0.0%) |
| Total (Overall) | 1,101 (51.6%) | 1,033 (48.4%) |
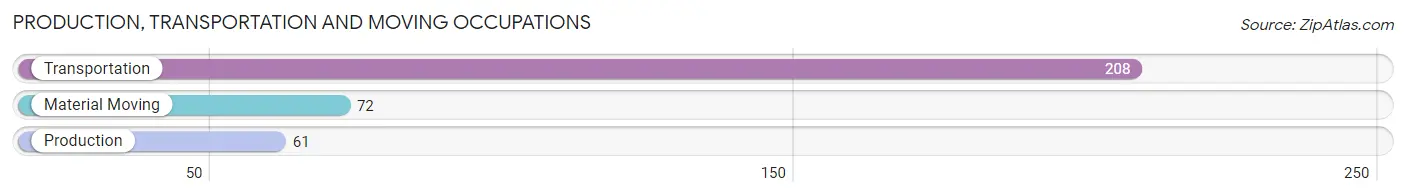
Production, Transportation and Moving Occupations
The most common Production, Transportation and Moving occupations in Pleasant Gap are Transportation (208 | 9.8%), Material Moving (72 | 3.4%), and Production (61 | 2.9%).
Production, Transportation and Moving Occupations by Sex
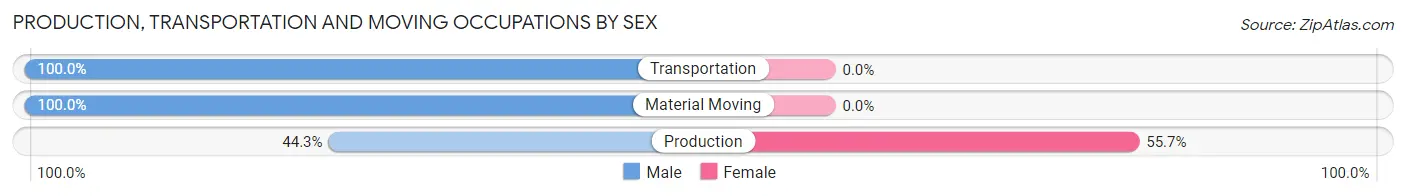
| Occupation | Male | Female |
| Production | 27 (44.3%) | 34 (55.7%) |
| Transportation | 208 (100.0%) | 0 (0.0%) |
| Material Moving | 72 (100.0%) | 0 (0.0%) |
| Total (Category) | 307 (90.0%) | 34 (10.0%) |
| Total (Overall) | 1,101 (51.6%) | 1,033 (48.4%) |
Employment Industries by Sex in Pleasant Gap
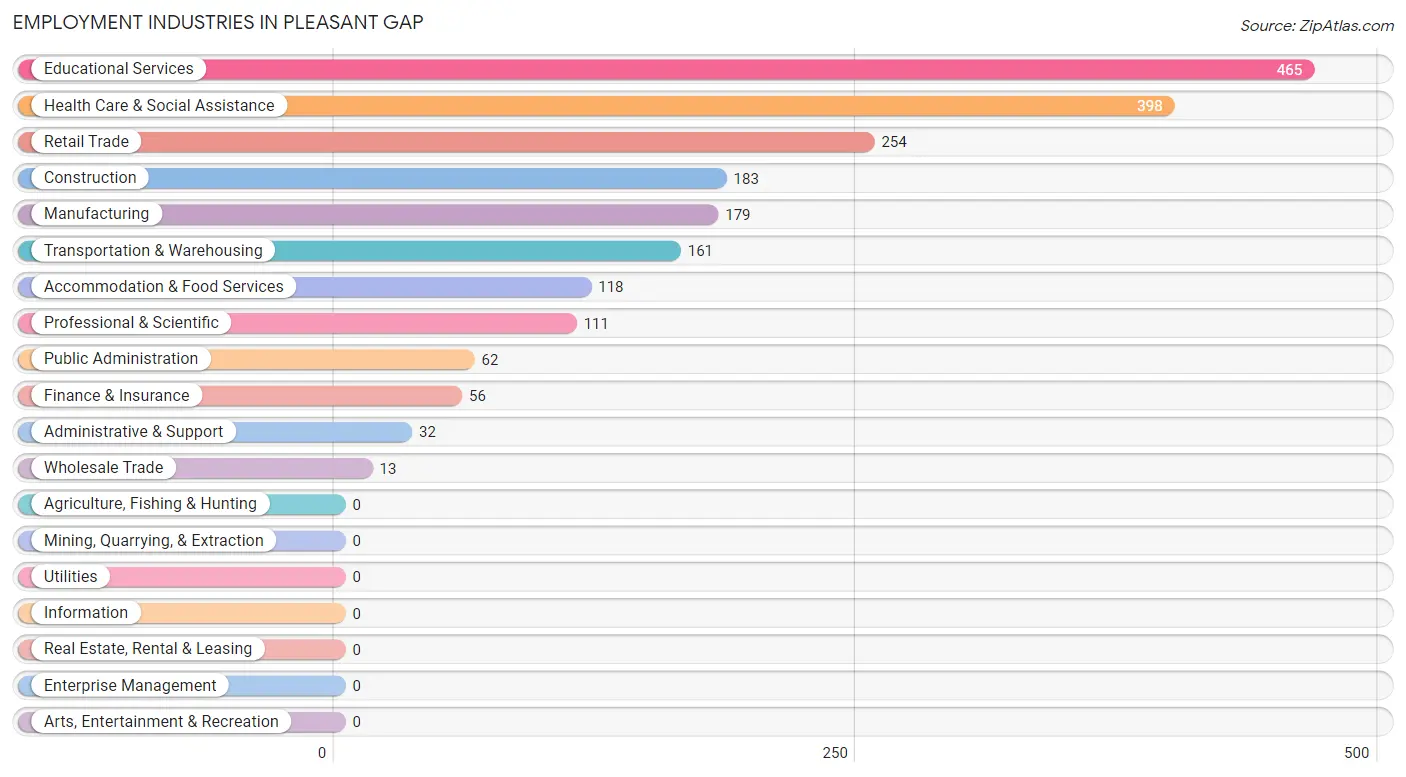
Employment Industries in Pleasant Gap
The major employment industries in Pleasant Gap include Educational Services (465 | 21.8%), Health Care & Social Assistance (398 | 18.6%), Retail Trade (254 | 11.9%), Construction (183 | 8.6%), and Manufacturing (179 | 8.4%).
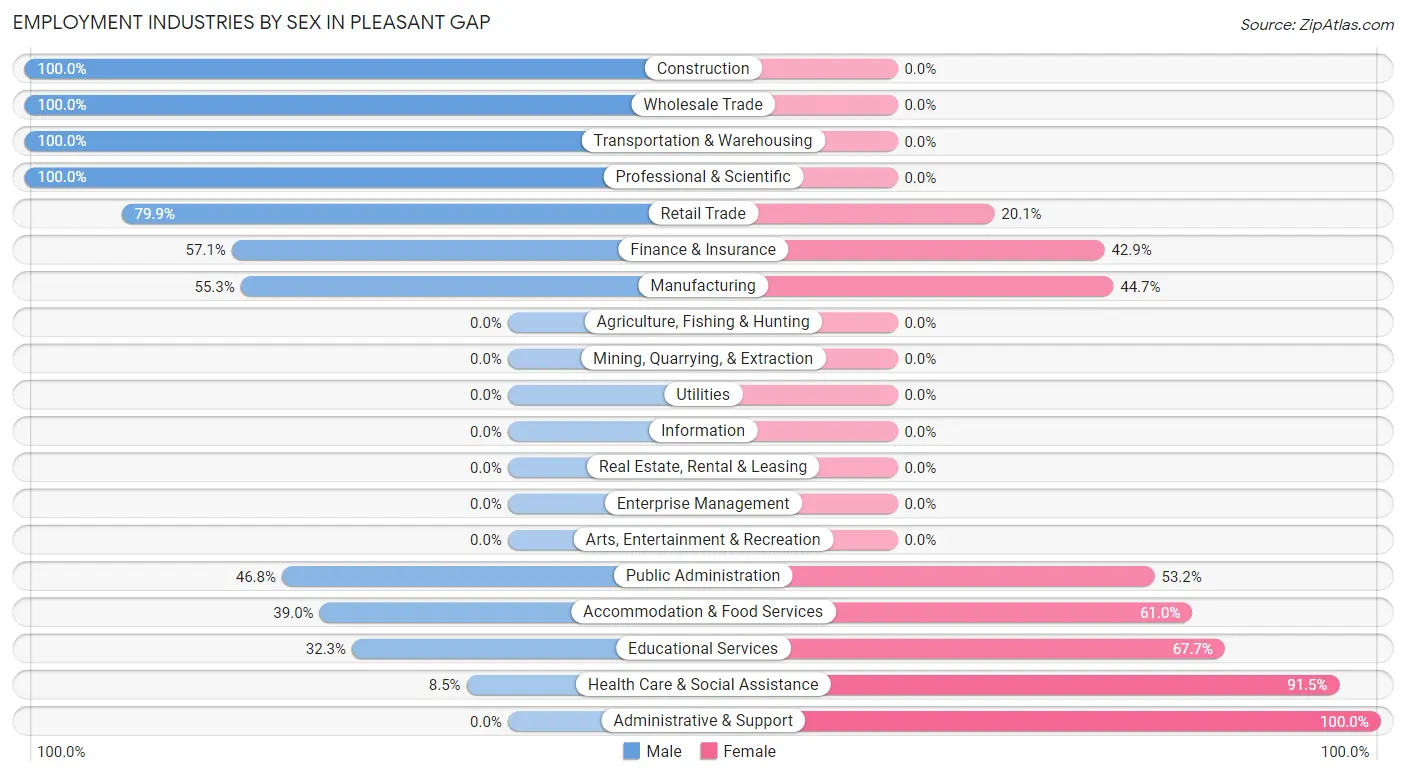
Employment Industries by Sex in Pleasant Gap
The Pleasant Gap industries that see more men than women are Construction (100.0%), Wholesale Trade (100.0%), and Transportation & Warehousing (100.0%), whereas the industries that tend to have a higher number of women are Administrative & Support (100.0%), Health Care & Social Assistance (91.5%), and Educational Services (67.7%).
| Industry | Male | Female |
| Agriculture, Fishing & Hunting | 0 (0.0%) | 0 (0.0%) |
| Mining, Quarrying, & Extraction | 0 (0.0%) | 0 (0.0%) |
| Construction | 183 (100.0%) | 0 (0.0%) |
| Manufacturing | 99 (55.3%) | 80 (44.7%) |
| Wholesale Trade | 13 (100.0%) | 0 (0.0%) |
| Retail Trade | 203 (79.9%) | 51 (20.1%) |
| Transportation & Warehousing | 161 (100.0%) | 0 (0.0%) |
| Utilities | 0 (0.0%) | 0 (0.0%) |
| Information | 0 (0.0%) | 0 (0.0%) |
| Finance & Insurance | 32 (57.1%) | 24 (42.9%) |
| Real Estate, Rental & Leasing | 0 (0.0%) | 0 (0.0%) |
| Professional & Scientific | 111 (100.0%) | 0 (0.0%) |
| Enterprise Management | 0 (0.0%) | 0 (0.0%) |
| Administrative & Support | 0 (0.0%) | 32 (100.0%) |
| Educational Services | 150 (32.3%) | 315 (67.7%) |
| Health Care & Social Assistance | 34 (8.5%) | 364 (91.5%) |
| Arts, Entertainment & Recreation | 0 (0.0%) | 0 (0.0%) |
| Accommodation & Food Services | 46 (39.0%) | 72 (61.0%) |
| Public Administration | 29 (46.8%) | 33 (53.2%) |
| Total | 1,101 (51.6%) | 1,033 (48.4%) |
Education in Pleasant Gap
School Enrollment in Pleasant Gap
The most common levels of schooling among the 659 students in Pleasant Gap are middle school (256 | 38.9%), elementary school (130 | 19.7%), and high school (103 | 15.6%).
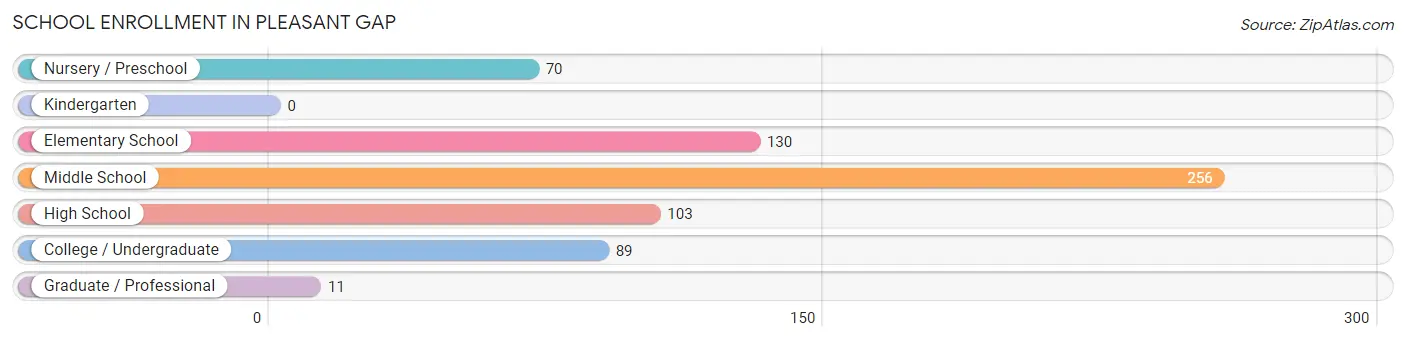
| School Level | # Students | % Students |
| Nursery / Preschool | 70 | 10.6% |
| Kindergarten | 0 | 0.0% |
| Elementary School | 130 | 19.7% |
| Middle School | 256 | 38.9% |
| High School | 103 | 15.6% |
| College / Undergraduate | 89 | 13.5% |
| Graduate / Professional | 11 | 1.7% |
| Total | 659 | 100.0% |
School Enrollment by Age by Funding Source in Pleasant Gap
Out of a total of 659 students who are enrolled in schools in Pleasant Gap, 171 (25.9%) attend a private institution, while the remaining 488 (74.1%) are enrolled in public schools. The age group of 15 to 17 year olds has the highest likelihood of being enrolled in private schools, with 55 (55.6% in the age bracket) enrolled. Conversely, the age group of 5 to 9 year old has the lowest likelihood of being enrolled in a private school, with 126 (100.0% in the age bracket) attending a public institution.
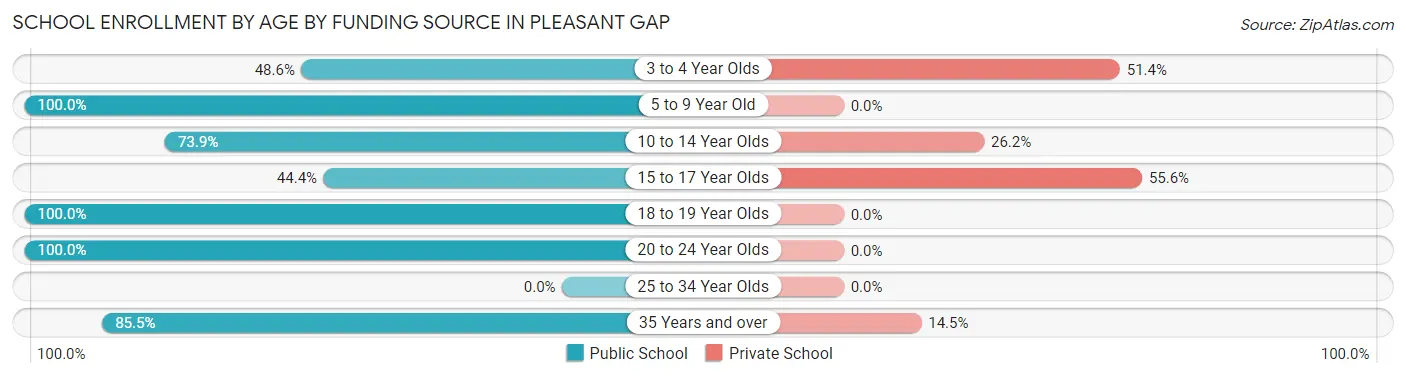
| Age Bracket | Public School | Private School |
| 3 to 4 Year Olds | 34 (48.6%) | 36 (51.4%) |
| 5 to 9 Year Old | 126 (100.0%) | 0 (0.0%) |
| 10 to 14 Year Olds | 192 (73.9%) | 68 (26.2%) |
| 15 to 17 Year Olds | 44 (44.4%) | 55 (55.6%) |
| 18 to 19 Year Olds | 4 (100.0%) | 0 (0.0%) |
| 20 to 24 Year Olds | 17 (100.0%) | 0 (0.0%) |
| 25 to 34 Year Olds | 0 (0.0%) | 0 (0.0%) |
| 35 Years and over | 71 (85.5%) | 12 (14.5%) |
| Total | 488 (74.1%) | 171 (25.9%) |
Educational Attainment by Field of Study in Pleasant Gap
Education (122 | 17.3%), business (104 | 14.8%), communications (101 | 14.3%), arts & humanities (83 | 11.8%), and science & technology (54 | 7.7%) are the most common fields of study among 704 individuals in Pleasant Gap who have obtained a bachelor's degree or higher.
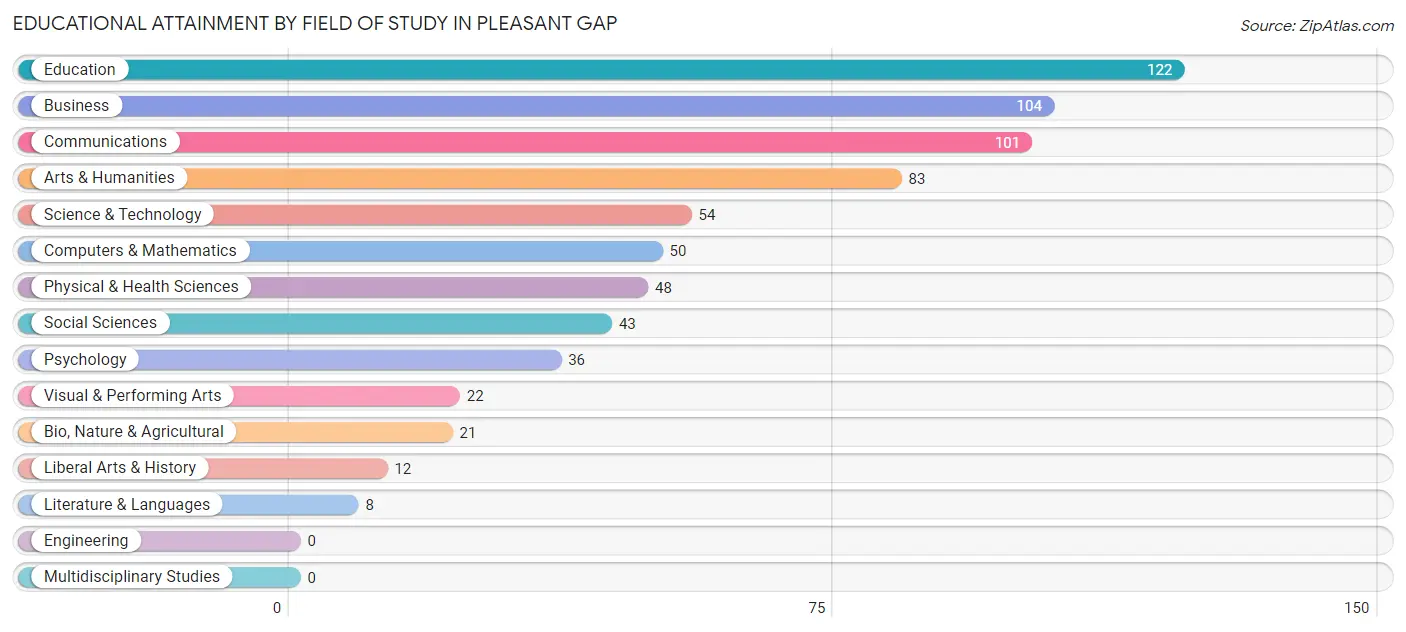
| Field of Study | # Graduates | % Graduates |
| Computers & Mathematics | 50 | 7.1% |
| Bio, Nature & Agricultural | 21 | 3.0% |
| Physical & Health Sciences | 48 | 6.8% |
| Psychology | 36 | 5.1% |
| Social Sciences | 43 | 6.1% |
| Engineering | 0 | 0.0% |
| Multidisciplinary Studies | 0 | 0.0% |
| Science & Technology | 54 | 7.7% |
| Business | 104 | 14.8% |
| Education | 122 | 17.3% |
| Literature & Languages | 8 | 1.1% |
| Liberal Arts & History | 12 | 1.7% |
| Visual & Performing Arts | 22 | 3.1% |
| Communications | 101 | 14.3% |
| Arts & Humanities | 83 | 11.8% |
| Total | 704 | 100.0% |
Transportation & Commute in Pleasant Gap
Vehicle Availability by Sex in Pleasant Gap
The most prevalent vehicle ownership categories in Pleasant Gap are males with 2 vehicles (707, accounting for 63.6%) and females with 2 vehicles (480, making up 68.4%).
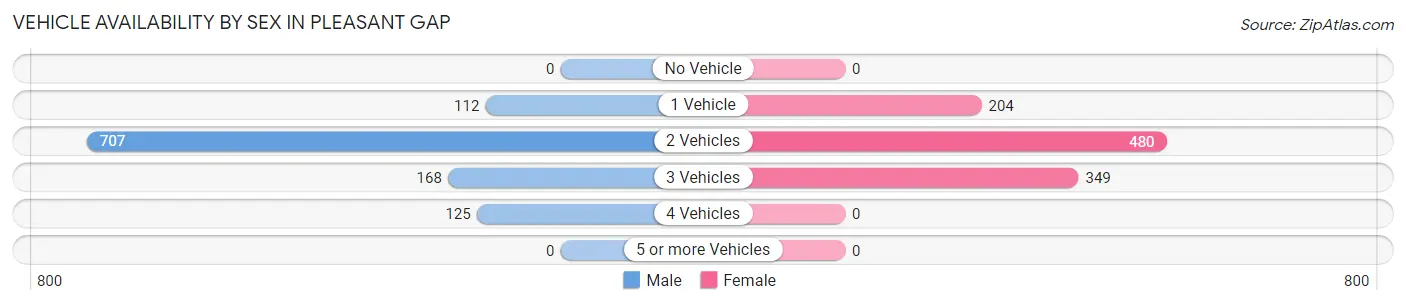
| Vehicles Available | Male | Female |
| No Vehicle | 0 (0.0%) | 0 (0.0%) |
| 1 Vehicle | 112 (10.1%) | 204 (19.8%) |
| 2 Vehicles | 707 (63.6%) | 480 (46.5%) |
| 3 Vehicles | 168 (15.1%) | 349 (33.8%) |
| 4 Vehicles | 125 (11.2%) | 0 (0.0%) |
| 5 or more Vehicles | 0 (0.0%) | 0 (0.0%) |
| Total | 1,112 (100.0%) | 1,033 (100.0%) |
Commute Time in Pleasant Gap
The most frequently occuring commute durations in Pleasant Gap are 15 to 19 minutes (648 commuters, 31.4%), 20 to 24 minutes (573 commuters, 27.8%), and 10 to 14 minutes (232 commuters, 11.2%).
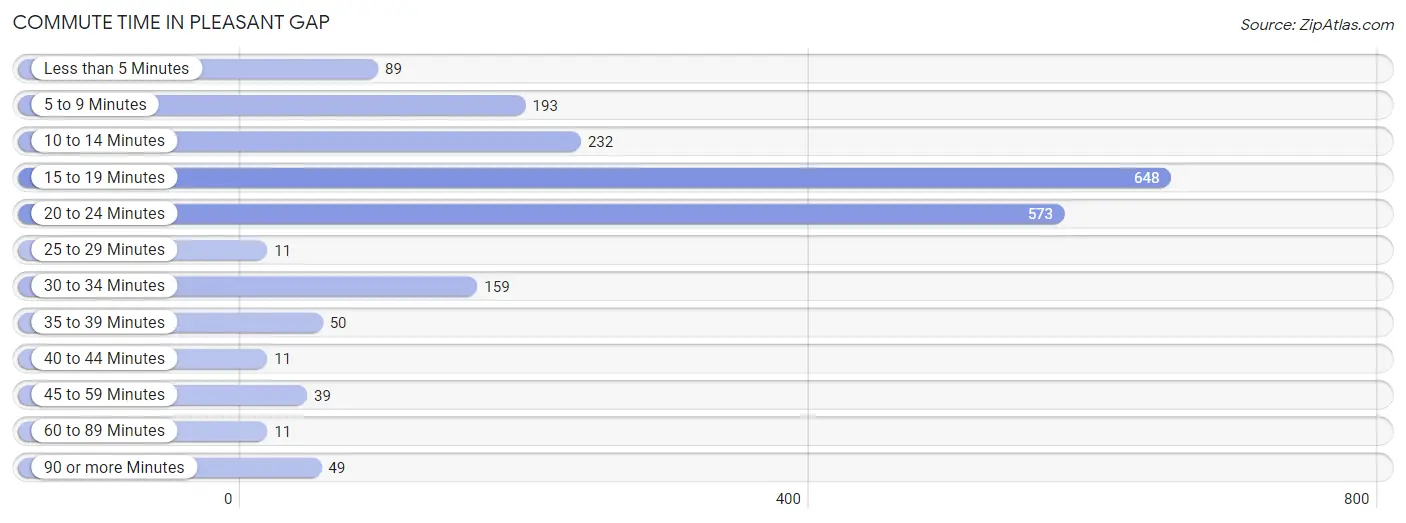
| Commute Time | # Commuters | % Commuters |
| Less than 5 Minutes | 89 | 4.3% |
| 5 to 9 Minutes | 193 | 9.3% |
| 10 to 14 Minutes | 232 | 11.2% |
| 15 to 19 Minutes | 648 | 31.4% |
| 20 to 24 Minutes | 573 | 27.8% |
| 25 to 29 Minutes | 11 | 0.5% |
| 30 to 34 Minutes | 159 | 7.7% |
| 35 to 39 Minutes | 50 | 2.4% |
| 40 to 44 Minutes | 11 | 0.5% |
| 45 to 59 Minutes | 39 | 1.9% |
| 60 to 89 Minutes | 11 | 0.5% |
| 90 or more Minutes | 49 | 2.4% |
Commute Time by Sex in Pleasant Gap
The most common commute times in Pleasant Gap are 15 to 19 minutes (262 commuters, 24.2%) for males and 15 to 19 minutes (386 commuters, 39.3%) for females.
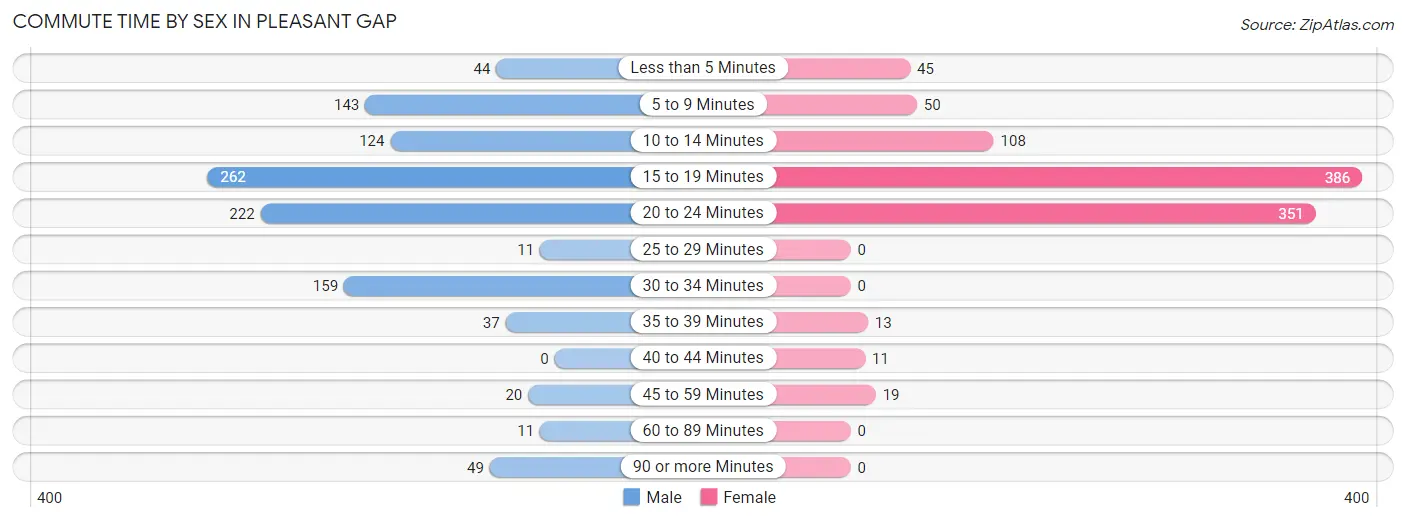
| Commute Time | Male | Female |
| Less than 5 Minutes | 44 (4.1%) | 45 (4.6%) |
| 5 to 9 Minutes | 143 (13.2%) | 50 (5.1%) |
| 10 to 14 Minutes | 124 (11.5%) | 108 (11.0%) |
| 15 to 19 Minutes | 262 (24.2%) | 386 (39.3%) |
| 20 to 24 Minutes | 222 (20.5%) | 351 (35.7%) |
| 25 to 29 Minutes | 11 (1.0%) | 0 (0.0%) |
| 30 to 34 Minutes | 159 (14.7%) | 0 (0.0%) |
| 35 to 39 Minutes | 37 (3.4%) | 13 (1.3%) |
| 40 to 44 Minutes | 0 (0.0%) | 11 (1.1%) |
| 45 to 59 Minutes | 20 (1.8%) | 19 (1.9%) |
| 60 to 89 Minutes | 11 (1.0%) | 0 (0.0%) |
| 90 or more Minutes | 49 (4.5%) | 0 (0.0%) |
Time of Departure to Work by Sex in Pleasant Gap
The most frequent times of departure to work in Pleasant Gap are 8:00 AM to 8:29 AM (181, 16.7%) for males and 6:00 AM to 6:29 AM (363, 36.9%) for females.
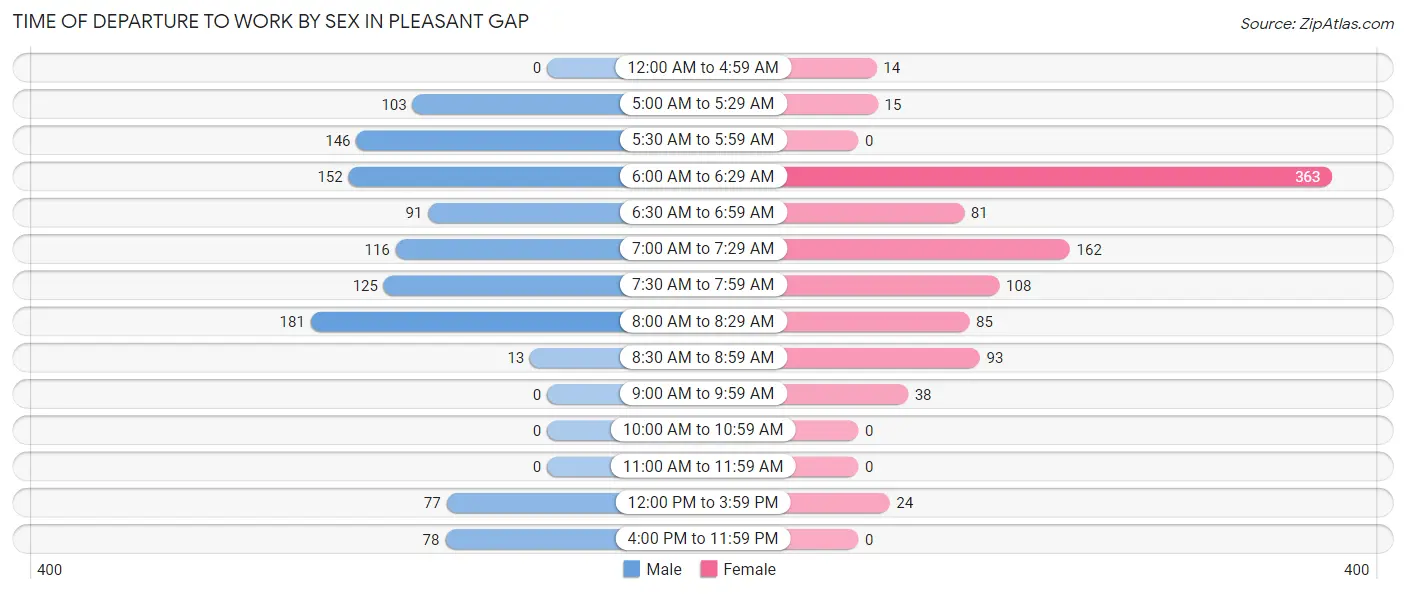
| Time of Departure | Male | Female |
| 12:00 AM to 4:59 AM | 0 (0.0%) | 14 (1.4%) |
| 5:00 AM to 5:29 AM | 103 (9.5%) | 15 (1.5%) |
| 5:30 AM to 5:59 AM | 146 (13.5%) | 0 (0.0%) |
| 6:00 AM to 6:29 AM | 152 (14.1%) | 363 (36.9%) |
| 6:30 AM to 6:59 AM | 91 (8.4%) | 81 (8.2%) |
| 7:00 AM to 7:29 AM | 116 (10.7%) | 162 (16.5%) |
| 7:30 AM to 7:59 AM | 125 (11.6%) | 108 (11.0%) |
| 8:00 AM to 8:29 AM | 181 (16.7%) | 85 (8.6%) |
| 8:30 AM to 8:59 AM | 13 (1.2%) | 93 (9.5%) |
| 9:00 AM to 9:59 AM | 0 (0.0%) | 38 (3.9%) |
| 10:00 AM to 10:59 AM | 0 (0.0%) | 0 (0.0%) |
| 11:00 AM to 11:59 AM | 0 (0.0%) | 0 (0.0%) |
| 12:00 PM to 3:59 PM | 77 (7.1%) | 24 (2.4%) |
| 4:00 PM to 11:59 PM | 78 (7.2%) | 0 (0.0%) |
| Total | 1,082 (100.0%) | 983 (100.0%) |
Housing Occupancy in Pleasant Gap
Occupancy by Ownership in Pleasant Gap
Of the total 1,361 dwellings in Pleasant Gap, owner-occupied units account for 956 (70.2%), while renter-occupied units make up 405 (29.8%).
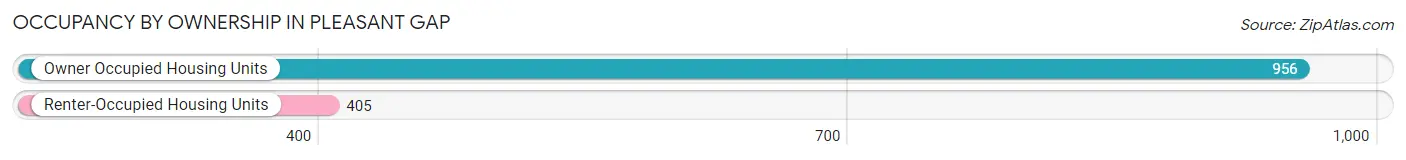
| Occupancy | # Housing Units | % Housing Units |
| Owner Occupied Housing Units | 956 | 70.2% |
| Renter-Occupied Housing Units | 405 | 29.8% |
| Total Occupied Housing Units | 1,361 | 100.0% |
Occupancy by Household Size in Pleasant Gap
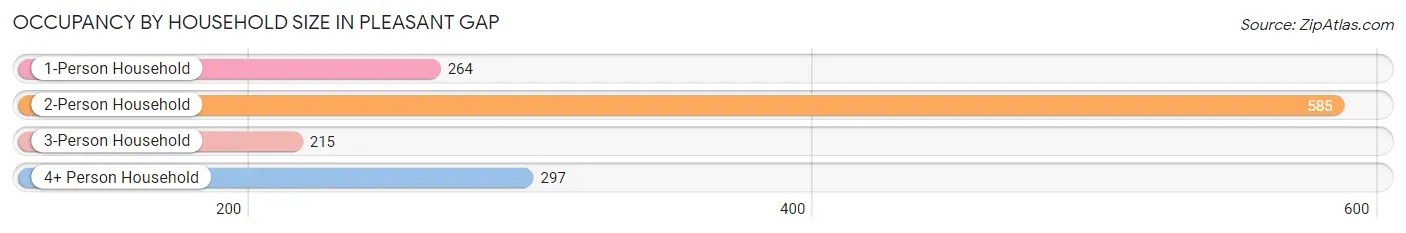
| Household Size | # Housing Units | % Housing Units |
| 1-Person Household | 264 | 19.4% |
| 2-Person Household | 585 | 43.0% |
| 3-Person Household | 215 | 15.8% |
| 4+ Person Household | 297 | 21.8% |
| Total Housing Units | 1,361 | 100.0% |
Occupancy by Ownership by Household Size in Pleasant Gap
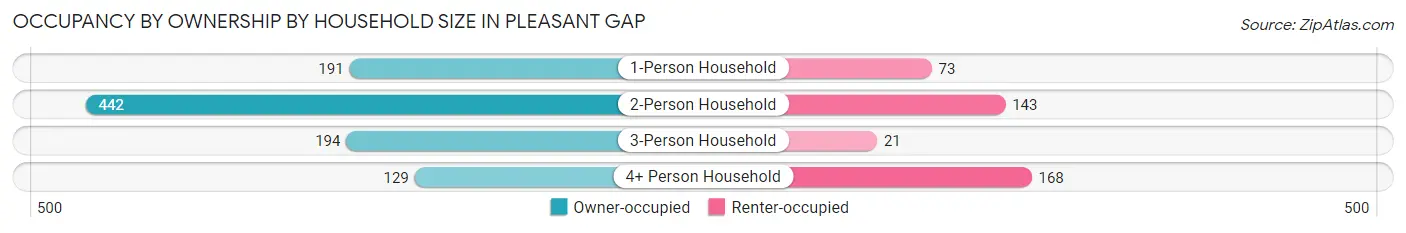
| Household Size | Owner-occupied | Renter-occupied |
| 1-Person Household | 191 (72.4%) | 73 (27.7%) |
| 2-Person Household | 442 (75.6%) | 143 (24.4%) |
| 3-Person Household | 194 (90.2%) | 21 (9.8%) |
| 4+ Person Household | 129 (43.4%) | 168 (56.6%) |
| Total Housing Units | 956 (70.2%) | 405 (29.8%) |
Occupancy by Educational Attainment in Pleasant Gap
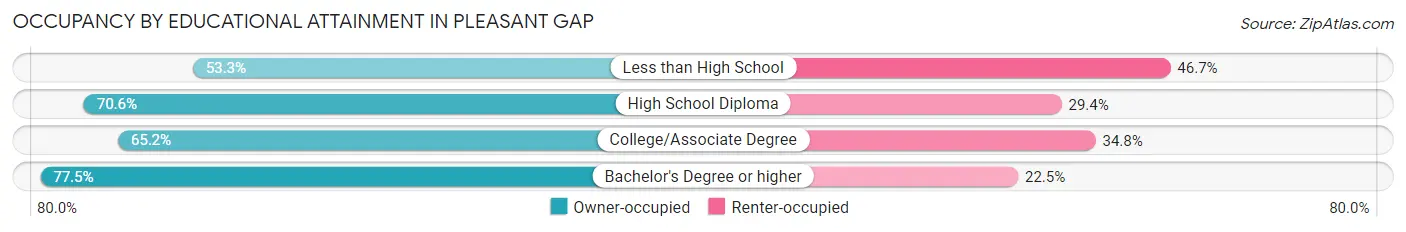
| Household Size | Owner-occupied | Renter-occupied |
| Less than High School | 16 (53.3%) | 14 (46.7%) |
| High School Diploma | 365 (70.6%) | 152 (29.4%) |
| College/Associate Degree | 296 (65.2%) | 158 (34.8%) |
| Bachelor's Degree or higher | 279 (77.5%) | 81 (22.5%) |
Occupancy by Age of Householder in Pleasant Gap
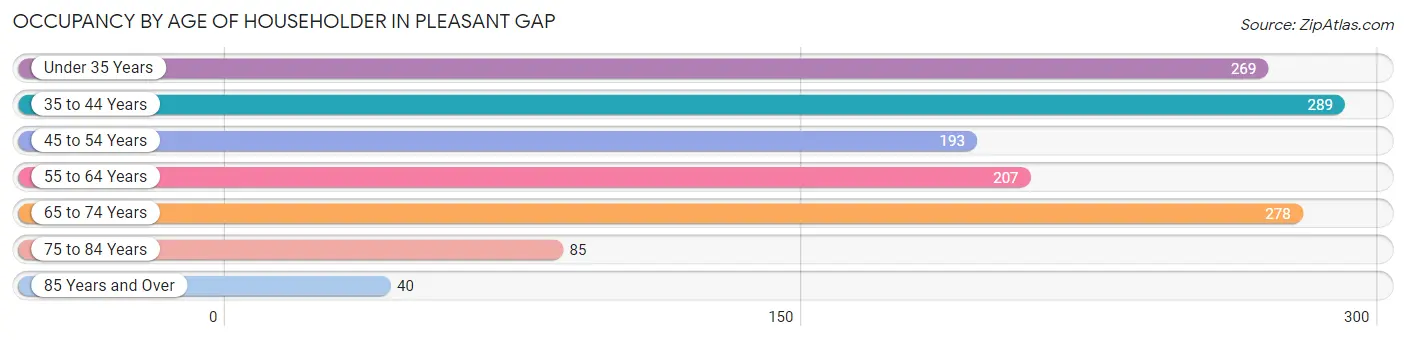
| Age Bracket | # Households | % Households |
| Under 35 Years | 269 | 19.8% |
| 35 to 44 Years | 289 | 21.2% |
| 45 to 54 Years | 193 | 14.2% |
| 55 to 64 Years | 207 | 15.2% |
| 65 to 74 Years | 278 | 20.4% |
| 75 to 84 Years | 85 | 6.2% |
| 85 Years and Over | 40 | 2.9% |
| Total | 1,361 | 100.0% |
Housing Finances in Pleasant Gap
Median Income by Occupancy in Pleasant Gap
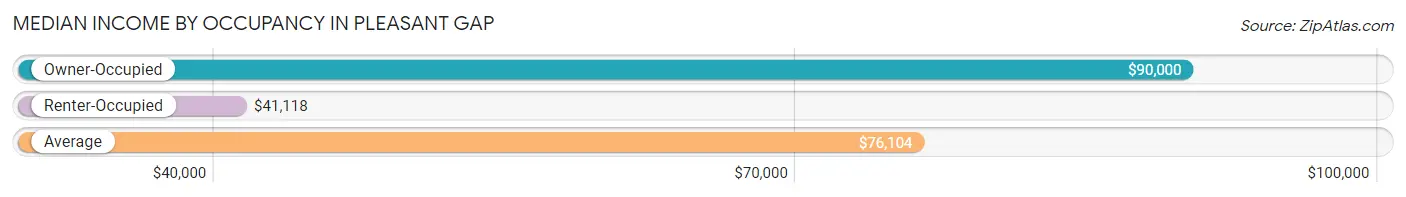
| Occupancy Type | # Households | Median Income |
| Owner-Occupied | 956 (70.2%) | $90,000 |
| Renter-Occupied | 405 (29.8%) | $41,118 |
| Average | 1,361 (100.0%) | $76,104 |
Occupancy by Householder Income Bracket in Pleasant Gap
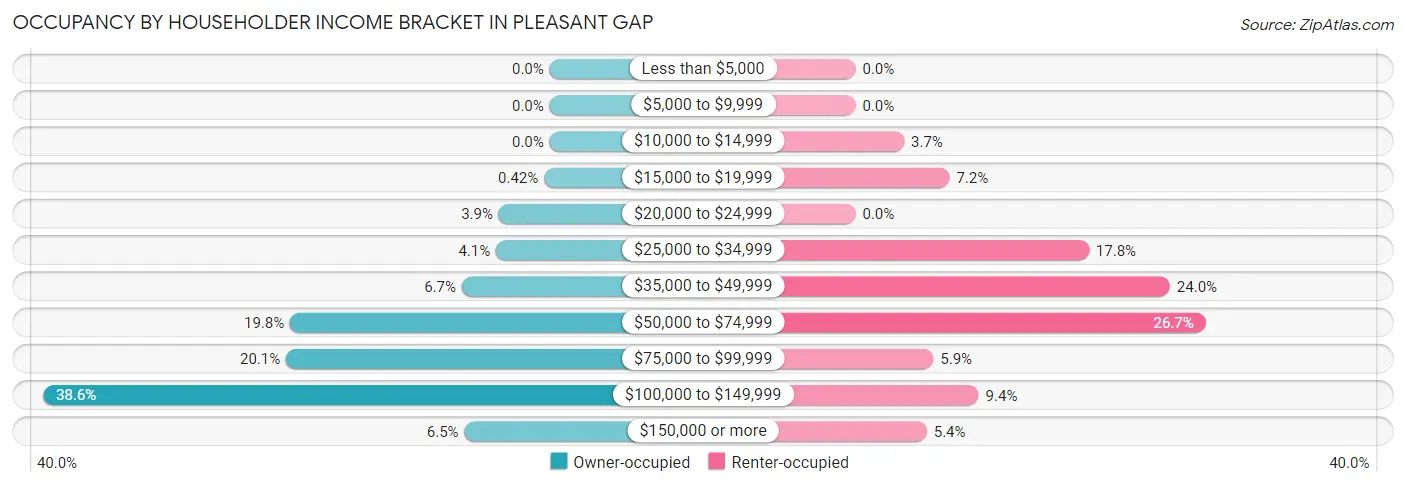
| Income Bracket | Owner-occupied | Renter-occupied |
| Less than $5,000 | 0 (0.0%) | 0 (0.0%) |
| $5,000 to $9,999 | 0 (0.0%) | 0 (0.0%) |
| $10,000 to $14,999 | 0 (0.0%) | 15 (3.7%) |
| $15,000 to $19,999 | 4 (0.4%) | 29 (7.2%) |
| $20,000 to $24,999 | 37 (3.9%) | 0 (0.0%) |
| $25,000 to $34,999 | 39 (4.1%) | 72 (17.8%) |
| $35,000 to $49,999 | 64 (6.7%) | 97 (23.9%) |
| $50,000 to $74,999 | 189 (19.8%) | 108 (26.7%) |
| $75,000 to $99,999 | 192 (20.1%) | 24 (5.9%) |
| $100,000 to $149,999 | 369 (38.6%) | 38 (9.4%) |
| $150,000 or more | 62 (6.5%) | 22 (5.4%) |
| Total | 956 (100.0%) | 405 (100.0%) |
Monthly Housing Cost Tiers in Pleasant Gap
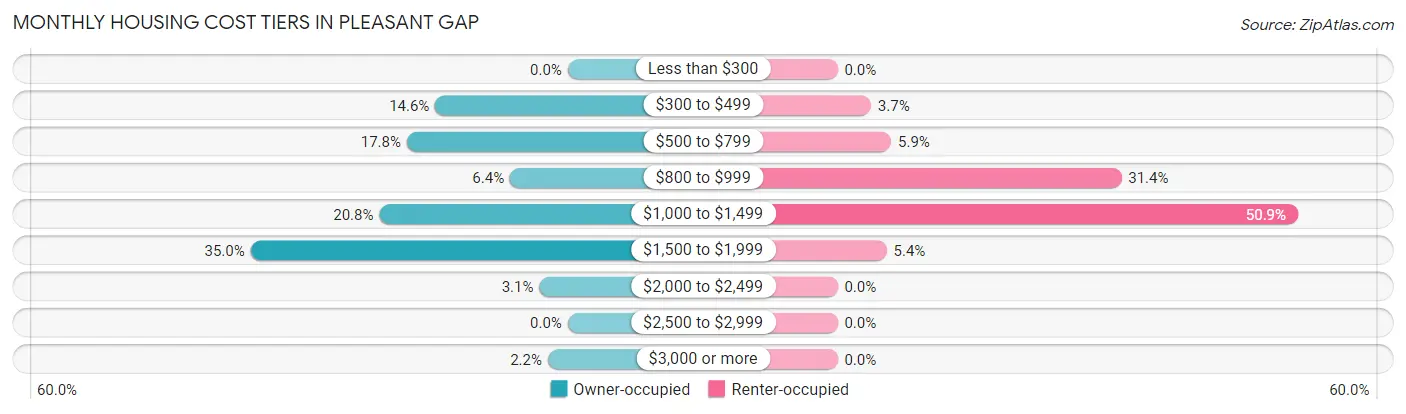
| Monthly Cost | Owner-occupied | Renter-occupied |
| Less than $300 | 0 (0.0%) | 0 (0.0%) |
| $300 to $499 | 140 (14.6%) | 15 (3.7%) |
| $500 to $799 | 170 (17.8%) | 24 (5.9%) |
| $800 to $999 | 61 (6.4%) | 127 (31.4%) |
| $1,000 to $1,499 | 199 (20.8%) | 206 (50.9%) |
| $1,500 to $1,999 | 335 (35.0%) | 22 (5.4%) |
| $2,000 to $2,499 | 30 (3.1%) | 0 (0.0%) |
| $2,500 to $2,999 | 0 (0.0%) | 0 (0.0%) |
| $3,000 or more | 21 (2.2%) | 0 (0.0%) |
| Total | 956 (100.0%) | 405 (100.0%) |
Physical Housing Characteristics in Pleasant Gap
Housing Structures in Pleasant Gap
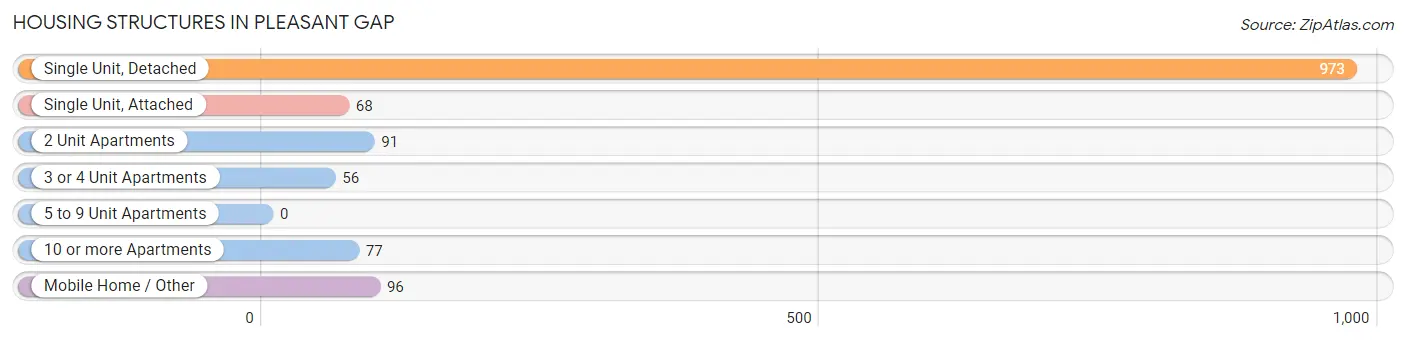
| Structure Type | # Housing Units | % Housing Units |
| Single Unit, Detached | 973 | 71.5% |
| Single Unit, Attached | 68 | 5.0% |
| 2 Unit Apartments | 91 | 6.7% |
| 3 or 4 Unit Apartments | 56 | 4.1% |
| 5 to 9 Unit Apartments | 0 | 0.0% |
| 10 or more Apartments | 77 | 5.7% |
| Mobile Home / Other | 96 | 7.0% |
| Total | 1,361 | 100.0% |
Housing Structures by Occupancy in Pleasant Gap
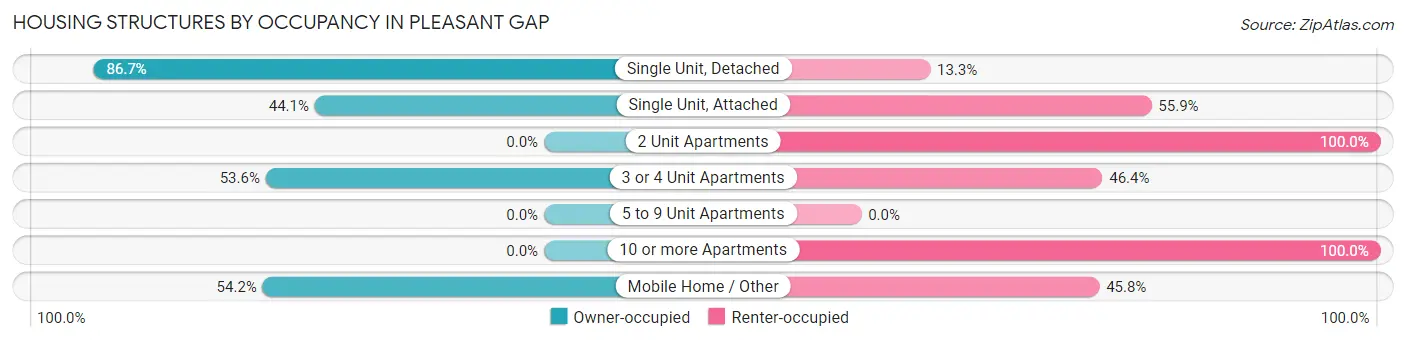
| Structure Type | Owner-occupied | Renter-occupied |
| Single Unit, Detached | 844 (86.7%) | 129 (13.3%) |
| Single Unit, Attached | 30 (44.1%) | 38 (55.9%) |
| 2 Unit Apartments | 0 (0.0%) | 91 (100.0%) |
| 3 or 4 Unit Apartments | 30 (53.6%) | 26 (46.4%) |
| 5 to 9 Unit Apartments | 0 (0.0%) | 0 (0.0%) |
| 10 or more Apartments | 0 (0.0%) | 77 (100.0%) |
| Mobile Home / Other | 52 (54.2%) | 44 (45.8%) |
| Total | 956 (70.2%) | 405 (29.8%) |
Housing Structures by Number of Rooms in Pleasant Gap
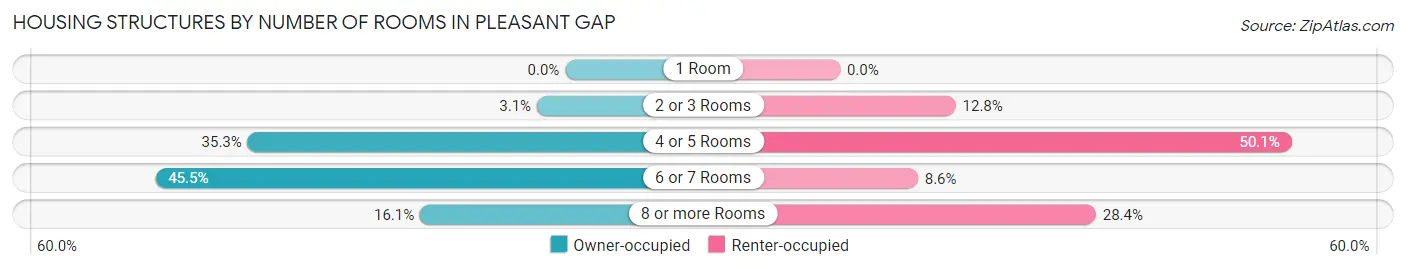
| Number of Rooms | Owner-occupied | Renter-occupied |
| 1 Room | 0 (0.0%) | 0 (0.0%) |
| 2 or 3 Rooms | 30 (3.1%) | 52 (12.8%) |
| 4 or 5 Rooms | 337 (35.2%) | 203 (50.1%) |
| 6 or 7 Rooms | 435 (45.5%) | 35 (8.6%) |
| 8 or more Rooms | 154 (16.1%) | 115 (28.4%) |
| Total | 956 (100.0%) | 405 (100.0%) |
Housing Structure by Heating Type in Pleasant Gap
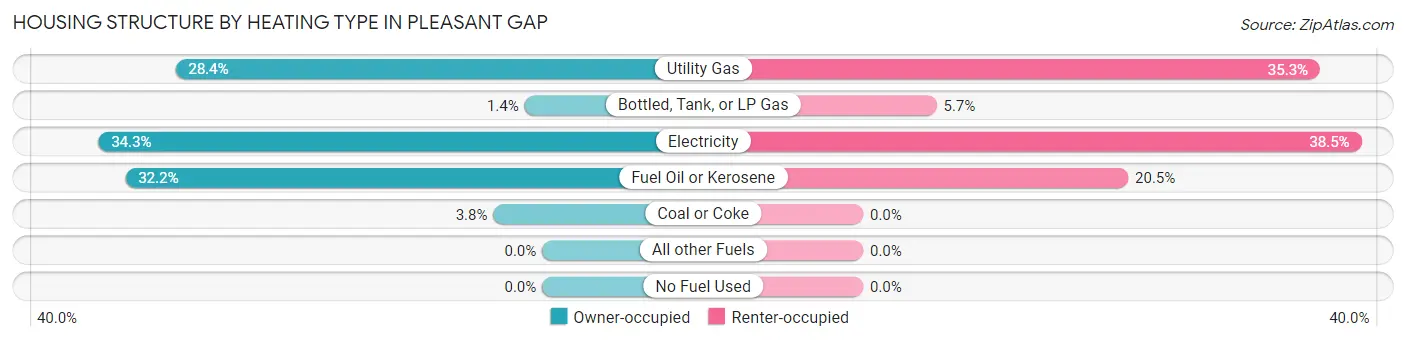
| Heating Type | Owner-occupied | Renter-occupied |
| Utility Gas | 271 (28.3%) | 143 (35.3%) |
| Bottled, Tank, or LP Gas | 13 (1.4%) | 23 (5.7%) |
| Electricity | 328 (34.3%) | 156 (38.5%) |
| Fuel Oil or Kerosene | 308 (32.2%) | 83 (20.5%) |
| Coal or Coke | 36 (3.8%) | 0 (0.0%) |
| All other Fuels | 0 (0.0%) | 0 (0.0%) |
| No Fuel Used | 0 (0.0%) | 0 (0.0%) |
| Total | 956 (100.0%) | 405 (100.0%) |
Household Vehicle Usage in Pleasant Gap
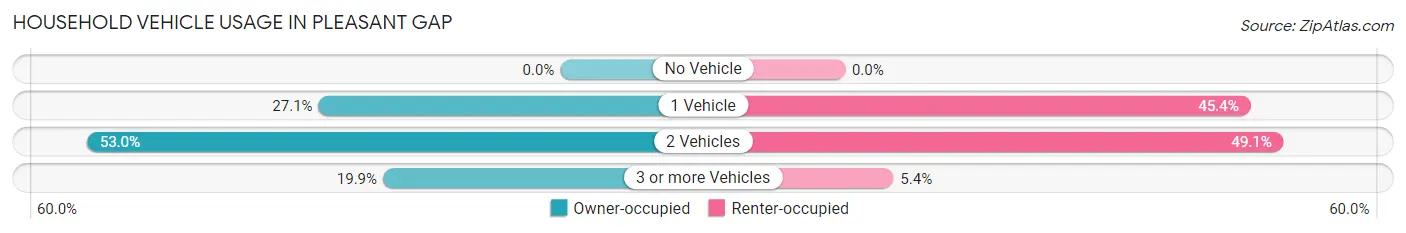
| Vehicles per Household | Owner-occupied | Renter-occupied |
| No Vehicle | 0 (0.0%) | 0 (0.0%) |
| 1 Vehicle | 259 (27.1%) | 184 (45.4%) |
| 2 Vehicles | 507 (53.0%) | 199 (49.1%) |
| 3 or more Vehicles | 190 (19.9%) | 22 (5.4%) |
| Total | 956 (100.0%) | 405 (100.0%) |
Real Estate & Mortgages in Pleasant Gap
Real Estate and Mortgage Overview in Pleasant Gap
| Characteristic | Without Mortgage | With Mortgage |
| Housing Units | 293 | 663 |
| Median Property Value | $208,800 | $216,800 |
| Median Household Income | $101,642 | $31 |
| Monthly Housing Costs | $521 | $21 |
| Real Estate Taxes | $1,867 | $0 |
Property Value by Mortgage Status in Pleasant Gap
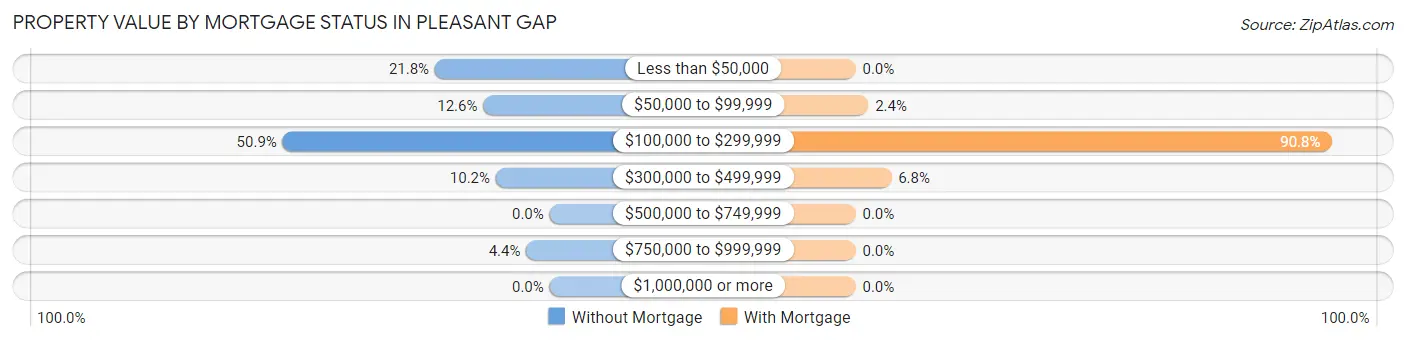
| Property Value | Without Mortgage | With Mortgage |
| Less than $50,000 | 64 (21.8%) | 0 (0.0%) |
| $50,000 to $99,999 | 37 (12.6%) | 16 (2.4%) |
| $100,000 to $299,999 | 149 (50.8%) | 602 (90.8%) |
| $300,000 to $499,999 | 30 (10.2%) | 45 (6.8%) |
| $500,000 to $749,999 | 0 (0.0%) | 0 (0.0%) |
| $750,000 to $999,999 | 13 (4.4%) | 0 (0.0%) |
| $1,000,000 or more | 0 (0.0%) | 0 (0.0%) |
| Total | 293 (100.0%) | 663 (100.0%) |
Household Income by Mortgage Status in Pleasant Gap
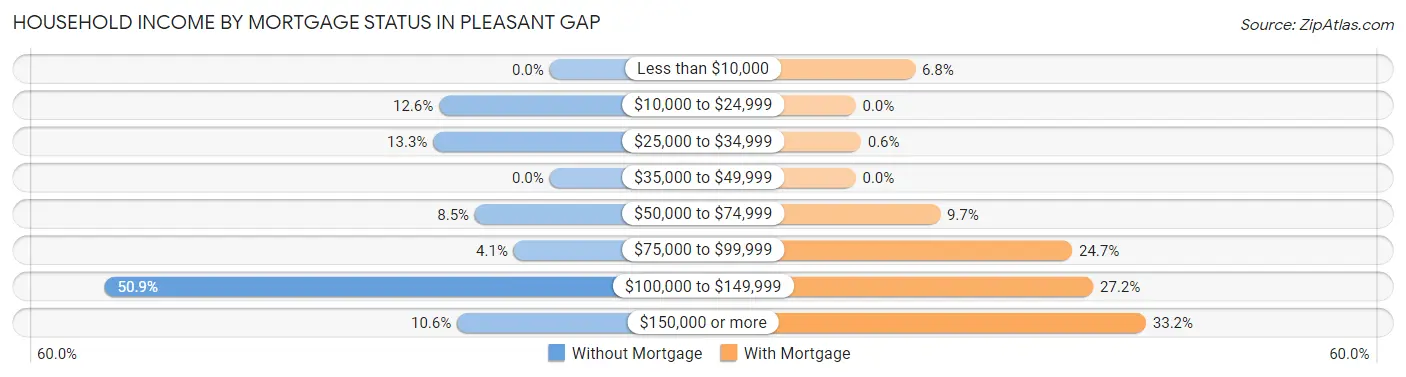
| Household Income | Without Mortgage | With Mortgage |
| Less than $10,000 | 0 (0.0%) | 45 (6.8%) |
| $10,000 to $24,999 | 37 (12.6%) | 0 (0.0%) |
| $25,000 to $34,999 | 39 (13.3%) | 4 (0.6%) |
| $35,000 to $49,999 | 0 (0.0%) | 0 (0.0%) |
| $50,000 to $74,999 | 25 (8.5%) | 64 (9.7%) |
| $75,000 to $99,999 | 12 (4.1%) | 164 (24.7%) |
| $100,000 to $149,999 | 149 (50.8%) | 180 (27.2%) |
| $150,000 or more | 31 (10.6%) | 220 (33.2%) |
| Total | 293 (100.0%) | 663 (100.0%) |
Property Value to Household Income Ratio in Pleasant Gap
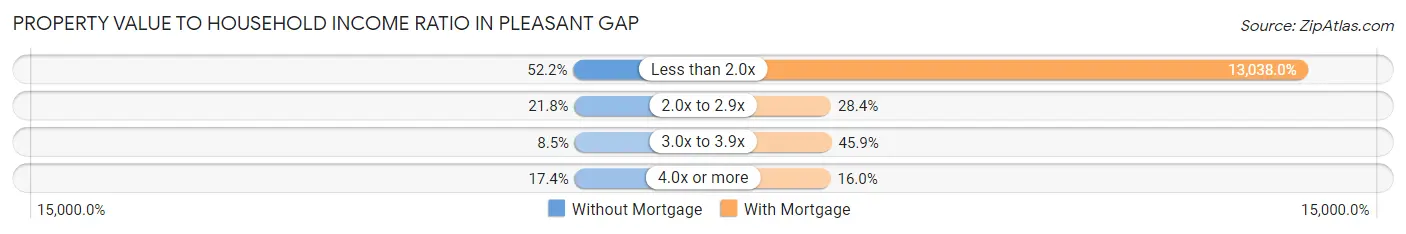
| Value-to-Income Ratio | Without Mortgage | With Mortgage |
| Less than 2.0x | 153 (52.2%) | 86,442 (13,038.0%) |
| 2.0x to 2.9x | 64 (21.8%) | 188 (28.4%) |
| 3.0x to 3.9x | 25 (8.5%) | 304 (45.9%) |
| 4.0x or more | 51 (17.4%) | 106 (16.0%) |
| Total | 293 (100.0%) | 663 (100.0%) |
Real Estate Taxes by Mortgage Status in Pleasant Gap
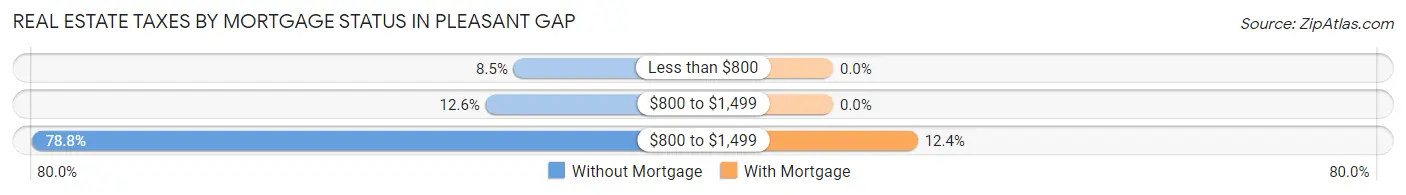
| Property Taxes | Without Mortgage | With Mortgage |
| Less than $800 | 25 (8.5%) | 0 (0.0%) |
| $800 to $1,499 | 37 (12.6%) | 0 (0.0%) |
| $800 to $1,499 | 231 (78.8%) | 82 (12.4%) |
| Total | 293 (100.0%) | 663 (100.0%) |
Health & Disability in Pleasant Gap
Health Insurance Coverage by Age in Pleasant Gap
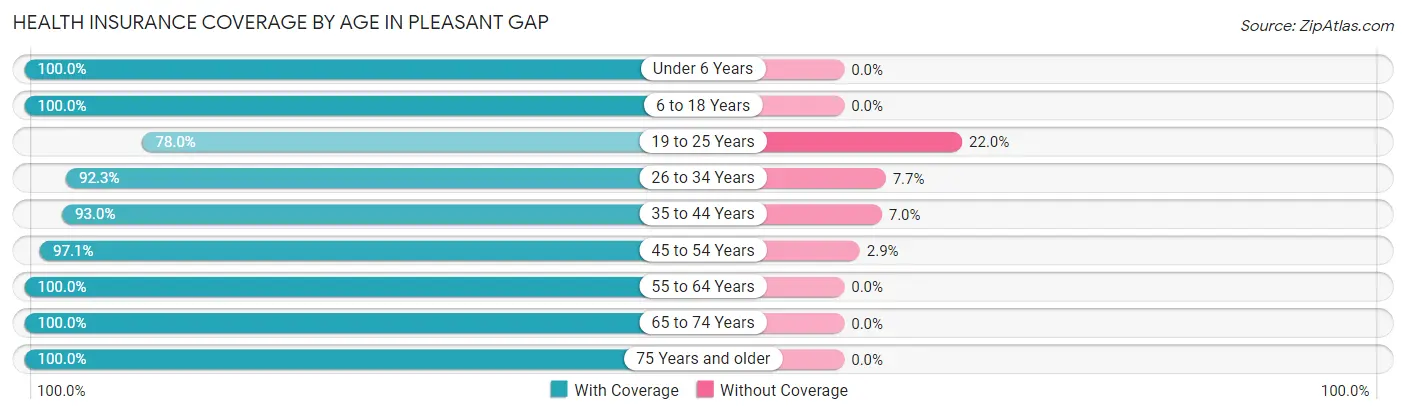
| Age Bracket | With Coverage | Without Coverage |
| Under 6 Years | 263 (100.0%) | 0 (0.0%) |
| 6 to 18 Years | 489 (100.0%) | 0 (0.0%) |
| 19 to 25 Years | 103 (78.0%) | 29 (22.0%) |
| 26 to 34 Years | 561 (92.3%) | 47 (7.7%) |
| 35 to 44 Years | 559 (93.0%) | 42 (7.0%) |
| 45 to 54 Years | 368 (97.1%) | 11 (2.9%) |
| 55 to 64 Years | 569 (100.0%) | 0 (0.0%) |
| 65 to 74 Years | 338 (100.0%) | 0 (0.0%) |
| 75 Years and older | 152 (100.0%) | 0 (0.0%) |
| Total | 3,402 (96.4%) | 129 (3.6%) |
Health Insurance Coverage by Citizenship Status in Pleasant Gap
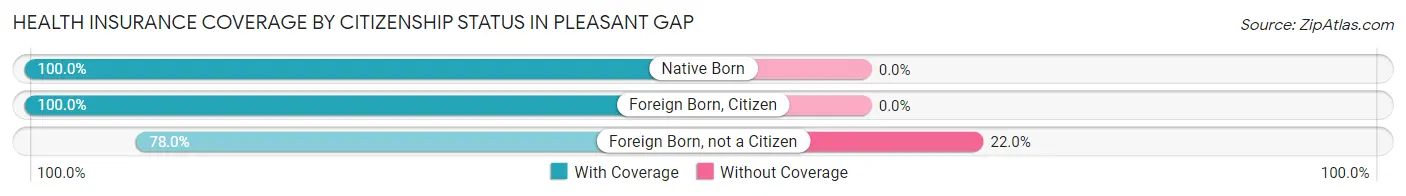
| Citizenship Status | With Coverage | Without Coverage |
| Native Born | 263 (100.0%) | 0 (0.0%) |
| Foreign Born, Citizen | 489 (100.0%) | 0 (0.0%) |
| Foreign Born, not a Citizen | 103 (78.0%) | 29 (22.0%) |
Health Insurance Coverage by Household Income in Pleasant Gap
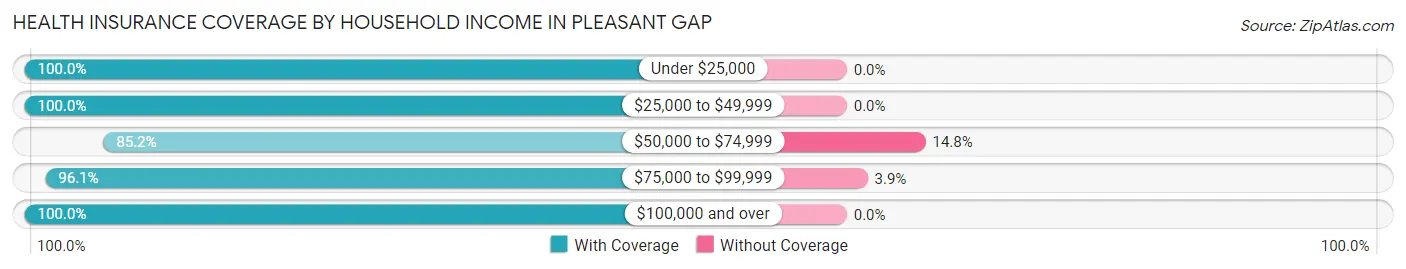
| Household Income | With Coverage | Without Coverage |
| Under $25,000 | 120 (100.0%) | 0 (0.0%) |
| $25,000 to $49,999 | 632 (100.0%) | 0 (0.0%) |
| $50,000 to $74,999 | 595 (85.2%) | 103 (14.8%) |
| $75,000 to $99,999 | 642 (96.1%) | 26 (3.9%) |
| $100,000 and over | 1,413 (100.0%) | 0 (0.0%) |
Public vs Private Health Insurance Coverage by Age in Pleasant Gap
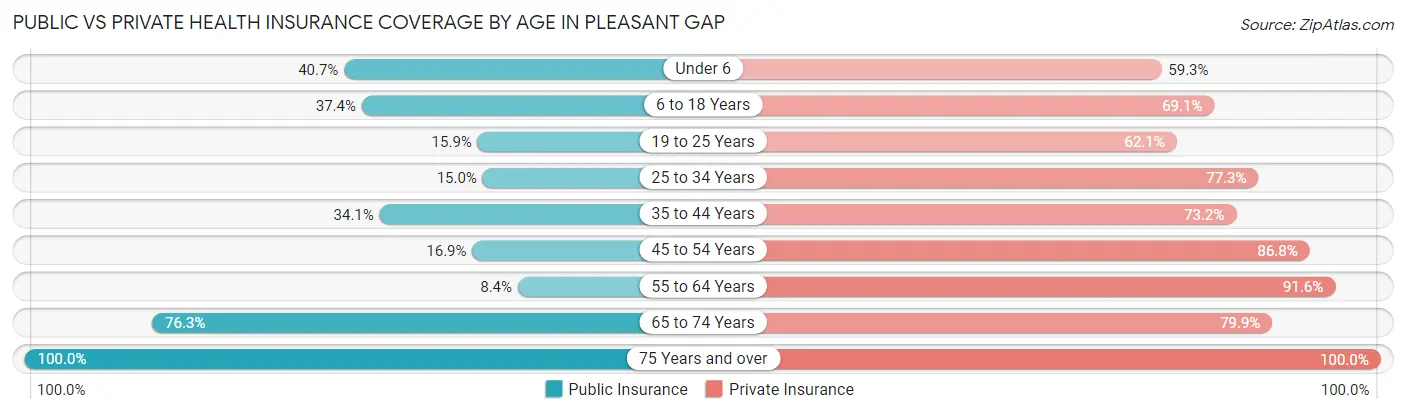
| Age Bracket | Public Insurance | Private Insurance |
| Under 6 | 107 (40.7%) | 156 (59.3%) |
| 6 to 18 Years | 183 (37.4%) | 338 (69.1%) |
| 19 to 25 Years | 21 (15.9%) | 82 (62.1%) |
| 25 to 34 Years | 91 (15.0%) | 470 (77.3%) |
| 35 to 44 Years | 205 (34.1%) | 440 (73.2%) |
| 45 to 54 Years | 64 (16.9%) | 329 (86.8%) |
| 55 to 64 Years | 48 (8.4%) | 521 (91.6%) |
| 65 to 74 Years | 258 (76.3%) | 270 (79.9%) |
| 75 Years and over | 152 (100.0%) | 152 (100.0%) |
| Total | 1,129 (32.0%) | 2,758 (78.1%) |
Disability Status by Sex by Age in Pleasant Gap
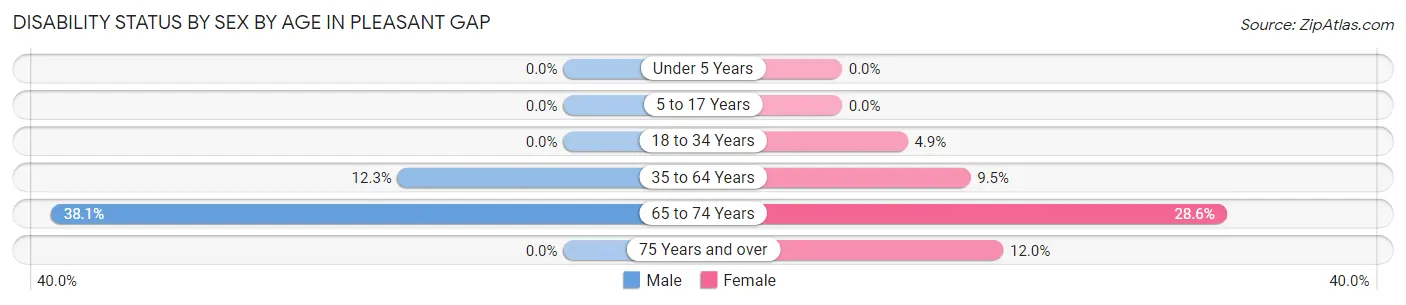
| Age Bracket | Male | Female |
| Under 5 Years | 0 (0.0%) | 0 (0.0%) |
| 5 to 17 Years | 0 (0.0%) | 0 (0.0%) |
| 18 to 34 Years | 0 (0.0%) | 21 (4.9%) |
| 35 to 64 Years | 99 (12.3%) | 71 (9.5%) |
| 65 to 74 Years | 78 (38.1%) | 38 (28.6%) |
| 75 Years and over | 0 (0.0%) | 14 (12.0%) |
Disability Class by Sex by Age in Pleasant Gap
Disability Class: Hearing Difficulty
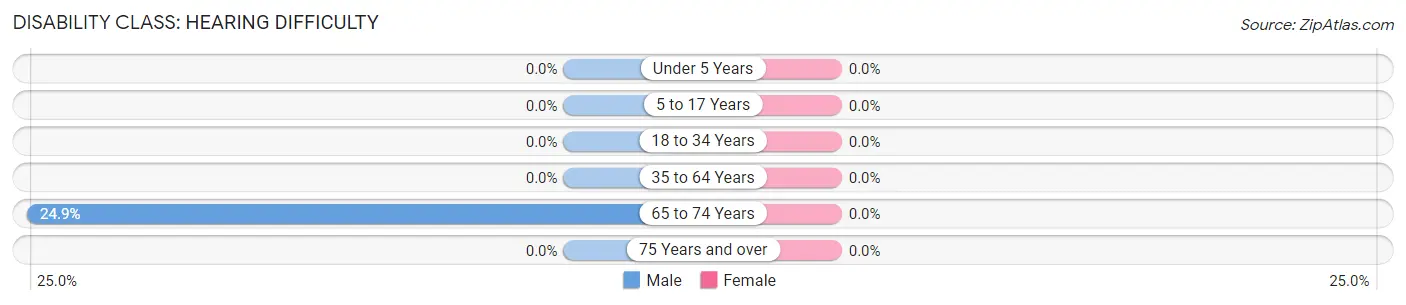
| Age Bracket | Male | Female |
| Under 5 Years | 0 (0.0%) | 0 (0.0%) |
| 5 to 17 Years | 0 (0.0%) | 0 (0.0%) |
| 18 to 34 Years | 0 (0.0%) | 0 (0.0%) |
| 35 to 64 Years | 0 (0.0%) | 0 (0.0%) |
| 65 to 74 Years | 51 (24.9%) | 0 (0.0%) |
| 75 Years and over | 0 (0.0%) | 0 (0.0%) |
Disability Class: Vision Difficulty
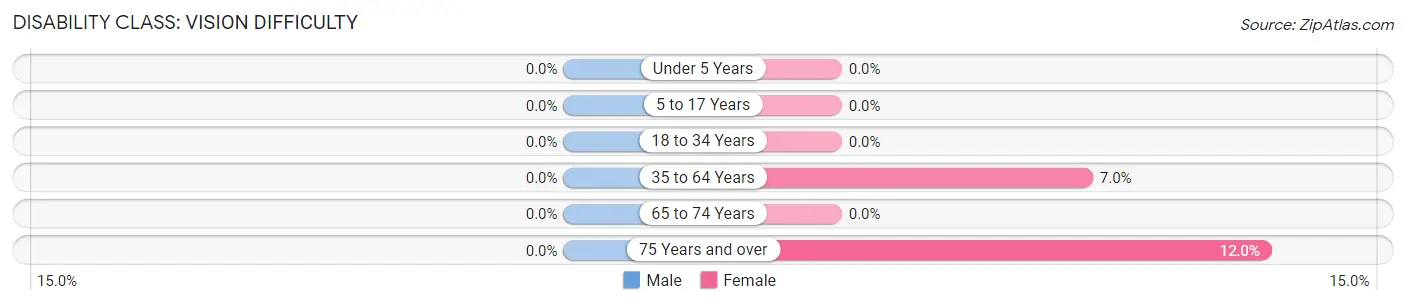
| Age Bracket | Male | Female |
| Under 5 Years | 0 (0.0%) | 0 (0.0%) |
| 5 to 17 Years | 0 (0.0%) | 0 (0.0%) |
| 18 to 34 Years | 0 (0.0%) | 0 (0.0%) |
| 35 to 64 Years | 0 (0.0%) | 52 (7.0%) |
| 65 to 74 Years | 0 (0.0%) | 0 (0.0%) |
| 75 Years and over | 0 (0.0%) | 14 (12.0%) |
Disability Class: Cognitive Difficulty
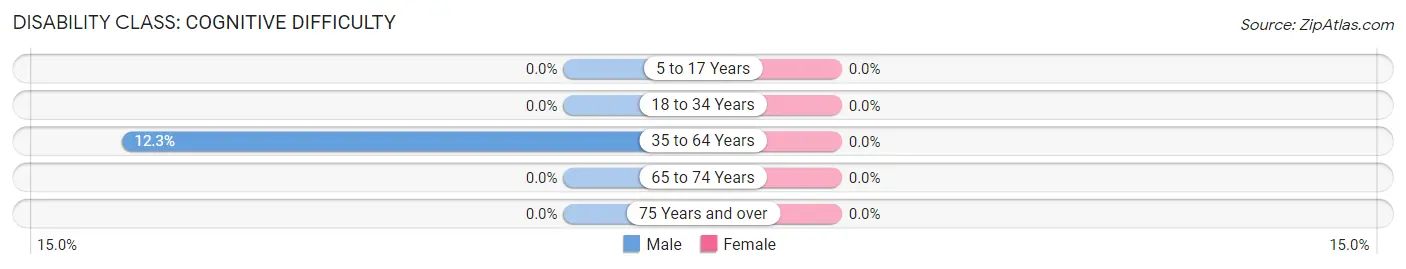
| Age Bracket | Male | Female |
| 5 to 17 Years | 0 (0.0%) | 0 (0.0%) |
| 18 to 34 Years | 0 (0.0%) | 0 (0.0%) |
| 35 to 64 Years | 99 (12.3%) | 0 (0.0%) |
| 65 to 74 Years | 0 (0.0%) | 0 (0.0%) |
| 75 Years and over | 0 (0.0%) | 0 (0.0%) |
Disability Class: Ambulatory Difficulty
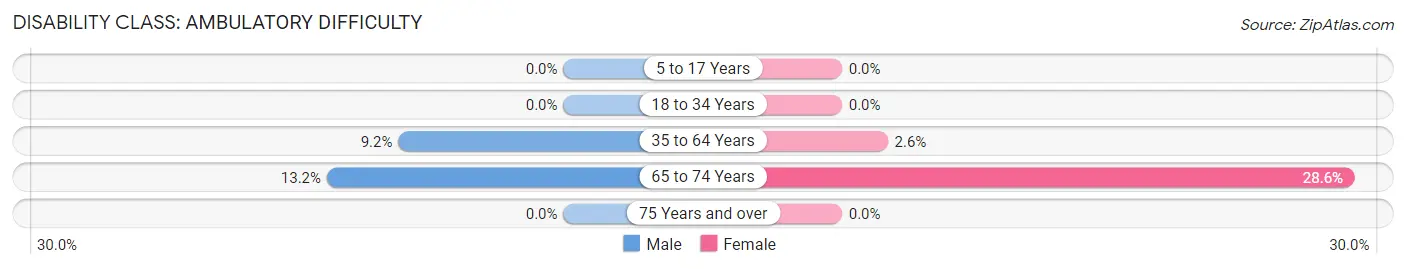
| Age Bracket | Male | Female |
| 5 to 17 Years | 0 (0.0%) | 0 (0.0%) |
| 18 to 34 Years | 0 (0.0%) | 0 (0.0%) |
| 35 to 64 Years | 74 (9.2%) | 19 (2.5%) |
| 65 to 74 Years | 27 (13.2%) | 38 (28.6%) |
| 75 Years and over | 0 (0.0%) | 0 (0.0%) |
Disability Class: Self-Care Difficulty
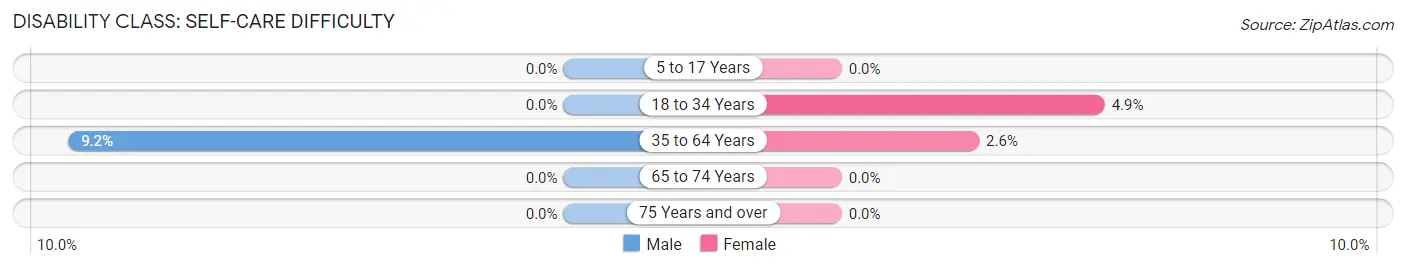
| Age Bracket | Male | Female |
| 5 to 17 Years | 0 (0.0%) | 0 (0.0%) |
| 18 to 34 Years | 0 (0.0%) | 21 (4.9%) |
| 35 to 64 Years | 74 (9.2%) | 19 (2.5%) |
| 65 to 74 Years | 0 (0.0%) | 0 (0.0%) |
| 75 Years and over | 0 (0.0%) | 0 (0.0%) |
Technology Access in Pleasant Gap
Computing Device Access in Pleasant Gap
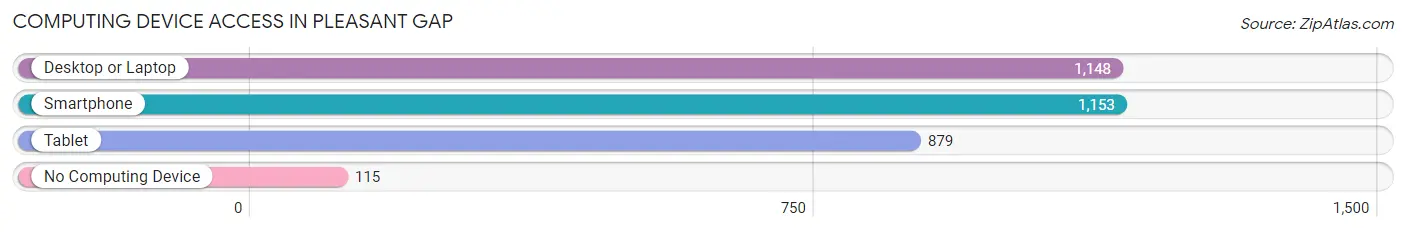
| Device Type | # Households | % Households |
| Desktop or Laptop | 1,148 | 84.4% |
| Smartphone | 1,153 | 84.7% |
| Tablet | 879 | 64.6% |
| No Computing Device | 115 | 8.5% |
| Total | 1,361 | 100.0% |
Internet Access in Pleasant Gap
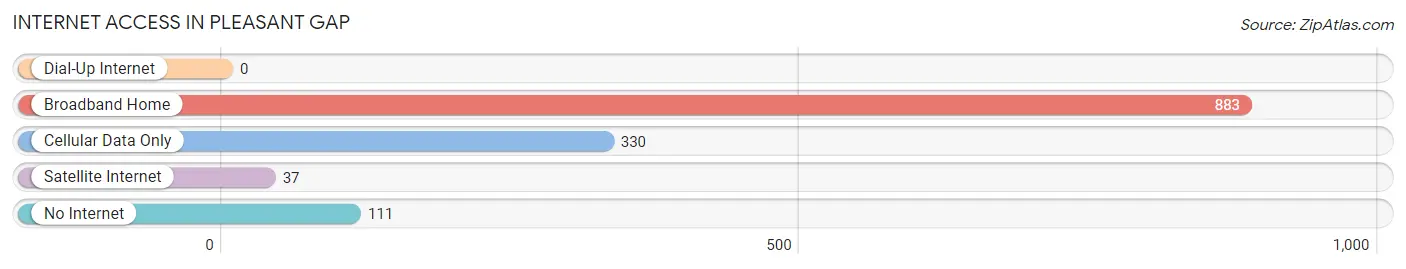
| Internet Type | # Households | % Households |
| Dial-Up Internet | 0 | 0.0% |
| Broadband Home | 883 | 64.9% |
| Cellular Data Only | 330 | 24.2% |
| Satellite Internet | 37 | 2.7% |
| No Internet | 111 | 8.2% |
| Total | 1,361 | 100.0% |
Pleasant Gap Summary
Pleasant Gap is a small borough located in Centre County, Pennsylvania. It is situated in the Nittany Valley, a region of the Appalachian Mountains. The population of Pleasant Gap was 1,845 at the 2010 census.
History
Pleasant Gap was first settled in the late 1700s by German and Irish immigrants. The town was originally known as “Gap” due to its location between two mountains. In 1845, the name was changed to Pleasant Gap. The town was incorporated in 1875.
The town was a major stop on the Pennsylvania Railroad, which ran through the Nittany Valley. The railroad brought many new people to the area, and the town grew rapidly. In the late 1800s, Pleasant Gap was a bustling center of commerce and industry. The town had several stores, a hotel, a post office, a bank, and a variety of other businesses.
Geography
Pleasant Gap is located in the Nittany Valley, a region of the Appalachian Mountains. The town is situated at the intersection of two major highways, US Route 322 and PA Route 45. The town is surrounded by rolling hills and farmland. The nearby Nittany Mountain is a popular destination for hikers and outdoor enthusiasts.
Economy
Pleasant Gap’s economy is largely based on agriculture and tourism. The town is home to several farms, which produce a variety of crops, including corn, soybeans, and hay. The town is also a popular destination for tourists, who come to enjoy the area’s natural beauty and outdoor activities.
Demographics
As of the 2010 census, the population of Pleasant Gap was 1,845. The racial makeup of the town was 97.3% White, 0.7% African American, 0.2% Native American, 0.3% Asian, and 1.5% from other races. The median household income was $45,938, and the median family income was $54,938.
Pleasant Gap is a small, rural town with a rich history and a strong sense of community. The town is home to a diverse population of people who are proud of their heritage and their town. The town’s economy is largely based on agriculture and tourism, and the town is a popular destination for outdoor enthusiasts. Pleasant Gap is a great place to live, work, and play.
Common Questions
What is the Total Population of Pleasant Gap?
Total Population of Pleasant Gap is 3,542.
What is the Total Male Population of Pleasant Gap?
Total Male Population of Pleasant Gap is 1,730.
What is the Total Female Population of Pleasant Gap?
Total Female Population of Pleasant Gap is 1,812.
What is the Ratio of Males per 100 Females in Pleasant Gap?
There are 95.47 Males per 100 Females in Pleasant Gap.
What is the Ratio of Females per 100 Males in Pleasant Gap?
There are 104.74 Females per 100 Males in Pleasant Gap.
What is the Median Population Age in Pleasant Gap?
Median Population Age in Pleasant Gap is 41.7 Years.
What is the Average Family Size in Pleasant Gap
Average Family Size in Pleasant Gap is 3.0 People.
What is the Average Household Size in Pleasant Gap
Average Household Size in Pleasant Gap is 2.6 People.
What is Per Capita Income in Pleasant Gap?
Per Capita income in Pleasant Gap is $36,871.
What is the Median Family Income in Pleasant Gap?
Median Family Income in Pleasant Gap is $86,442.
What is the Median Household income in Pleasant Gap?
Median Household Income in Pleasant Gap is $76,104.
What is Income or Wage Gap in Pleasant Gap?
Income or Wage Gap in Pleasant Gap is 23.1%.
Women in Pleasant Gap earn 76.9 cents for every dollar earned by a man.
What is Inequality or Gini Index in Pleasant Gap?
Inequality or Gini Index in Pleasant Gap is 0.33.
How Large is the Labor Force in Pleasant Gap?
There are 2,217 People in the Labor Forcein in Pleasant Gap.
What is the Percentage of People in the Labor Force in Pleasant Gap?
77.8% of People are in the Labor Force in Pleasant Gap.
What is the Unemployment Rate in Pleasant Gap?
Unemployment Rate in Pleasant Gap is 3.2%.