Hulmeville borough, PA
Hulmeville borough Overview
953
TOTAL POPULATION
507
MALE POPULATION
446
FEMALE POPULATION
113.68
MALES / 100 FEMALES
87.97
FEMALES / 100 MALES
39.4
MEDIAN AGE
3.0
AVG FAMILY SIZE
2.8
AVG HOUSEHOLD SIZE
$47,067
PER CAPITA INCOME
$124,712
AVG FAMILY INCOME
$116,500
AVG HOUSEHOLD INCOME
39.9%
WAGE / INCOME GAP [ % ]
60.1¢/ $1
WAGE / INCOME GAP [ $ ]
0.35
INEQUALITY / GINI INDEX
536
LABOR FORCE [ PEOPLE ]
71.1%
PERCENT IN LABOR FORCE
7.6%
UNEMPLOYMENT RATE
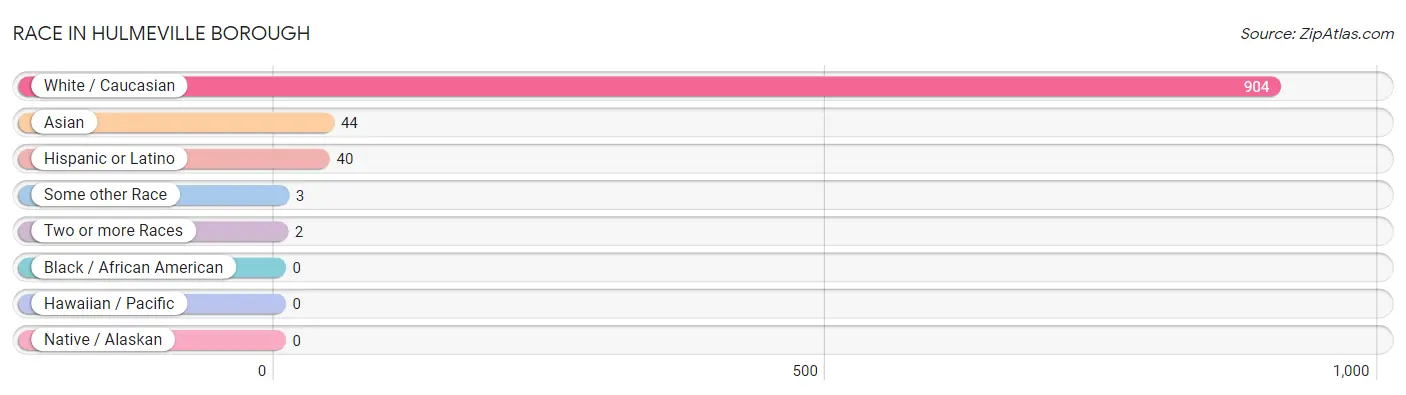
Race in Hulmeville borough
The most populous races in Hulmeville borough are White / Caucasian (904 | 94.9%), Asian (44 | 4.6%), and Hispanic or Latino (40 | 4.2%).
| Race | # Population | % Population |
| Asian | 44 | 4.6% |
| Black / African American | 0 | 0.0% |
| Hawaiian / Pacific | 0 | 0.0% |
| Hispanic or Latino | 40 | 4.2% |
| Native / Alaskan | 0 | 0.0% |
| White / Caucasian | 904 | 94.9% |
| Two or more Races | 2 | 0.2% |
| Some other Race | 3 | 0.3% |
| Total | 953 | 100.0% |
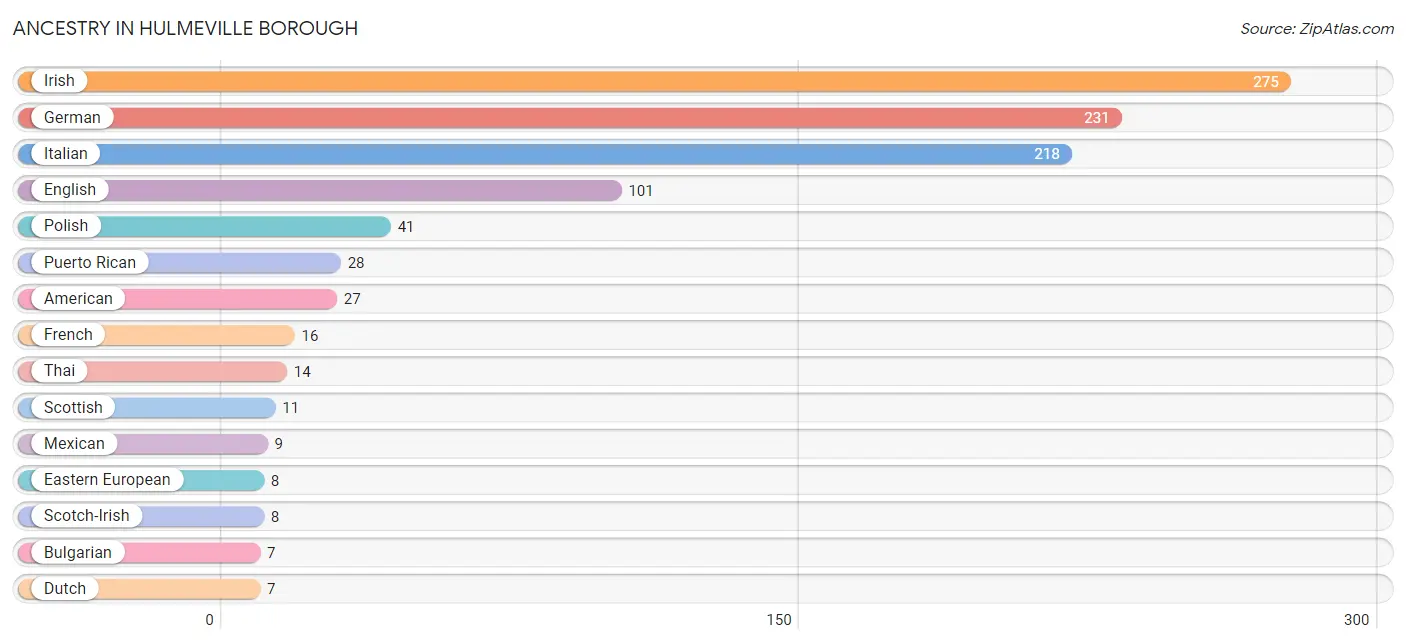
Ancestry in Hulmeville borough
The most populous ancestries reported in Hulmeville borough are Irish (275 | 28.9%), German (231 | 24.2%), Italian (218 | 22.9%), English (101 | 10.6%), and Polish (41 | 4.3%), together accounting for 90.9% of all Hulmeville borough residents.
| Ancestry | # Population | % Population |
| American | 27 | 2.8% |
| British | 2 | 0.2% |
| Bulgarian | 7 | 0.7% |
| Dutch | 7 | 0.7% |
| Eastern European | 8 | 0.8% |
| English | 101 | 10.6% |
| European | 3 | 0.3% |
| French | 16 | 1.7% |
| German | 231 | 24.2% |
| Greek | 2 | 0.2% |
| Hungarian | 6 | 0.6% |
| Irish | 275 | 28.9% |
| Italian | 218 | 22.9% |
| Korean | 7 | 0.7% |
| Mexican | 9 | 0.9% |
| Norwegian | 2 | 0.2% |
| Pennsylvania German | 5 | 0.5% |
| Polish | 41 | 4.3% |
| Portuguese | 2 | 0.2% |
| Puerto Rican | 28 | 2.9% |
| Russian | 6 | 0.6% |
| Scotch-Irish | 8 | 0.8% |
| Scottish | 11 | 1.1% |
| Slavic | 1 | 0.1% |
| Swedish | 7 | 0.7% |
| Swiss | 2 | 0.2% |
| Thai | 14 | 1.5% |
| Welsh | 1 | 0.1% | View All 28 Rows |
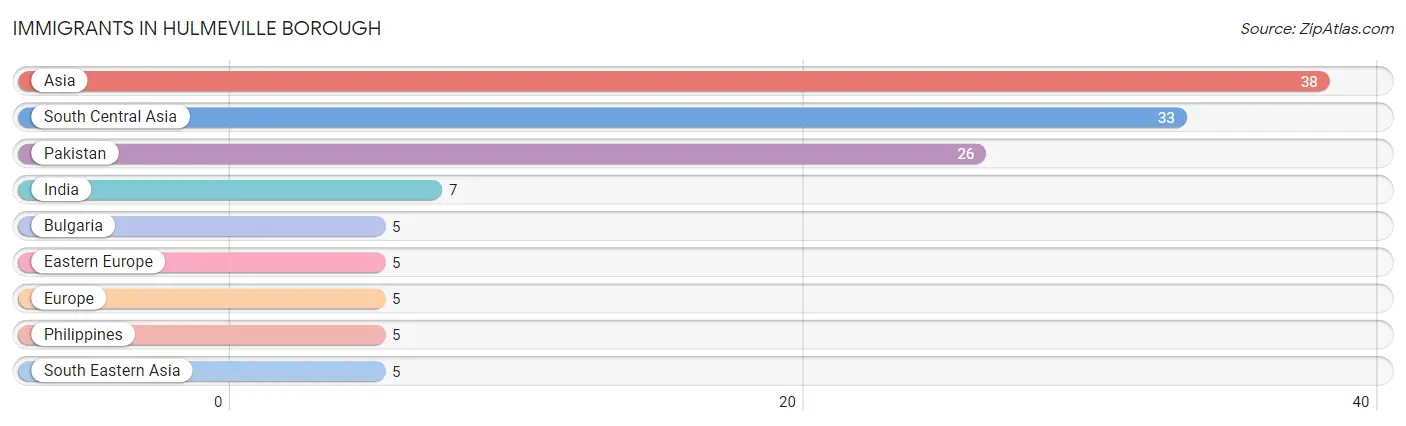
Immigrants in Hulmeville borough
The most numerous immigrant groups reported in Hulmeville borough came from Asia (38 | 4.0%), South Central Asia (33 | 3.5%), Pakistan (26 | 2.7%), India (7 | 0.7%), and Bulgaria (5 | 0.5%), together accounting for 11.4% of all Hulmeville borough residents.
| Immigration Origin | # Population | % Population |
| Asia | 38 | 4.0% |
| Bulgaria | 5 | 0.5% |
| Eastern Europe | 5 | 0.5% |
| Europe | 5 | 0.5% |
| India | 7 | 0.7% |
| Pakistan | 26 | 2.7% |
| Philippines | 5 | 0.5% |
| South Central Asia | 33 | 3.5% |
| South Eastern Asia | 5 | 0.5% | View All 9 Rows |
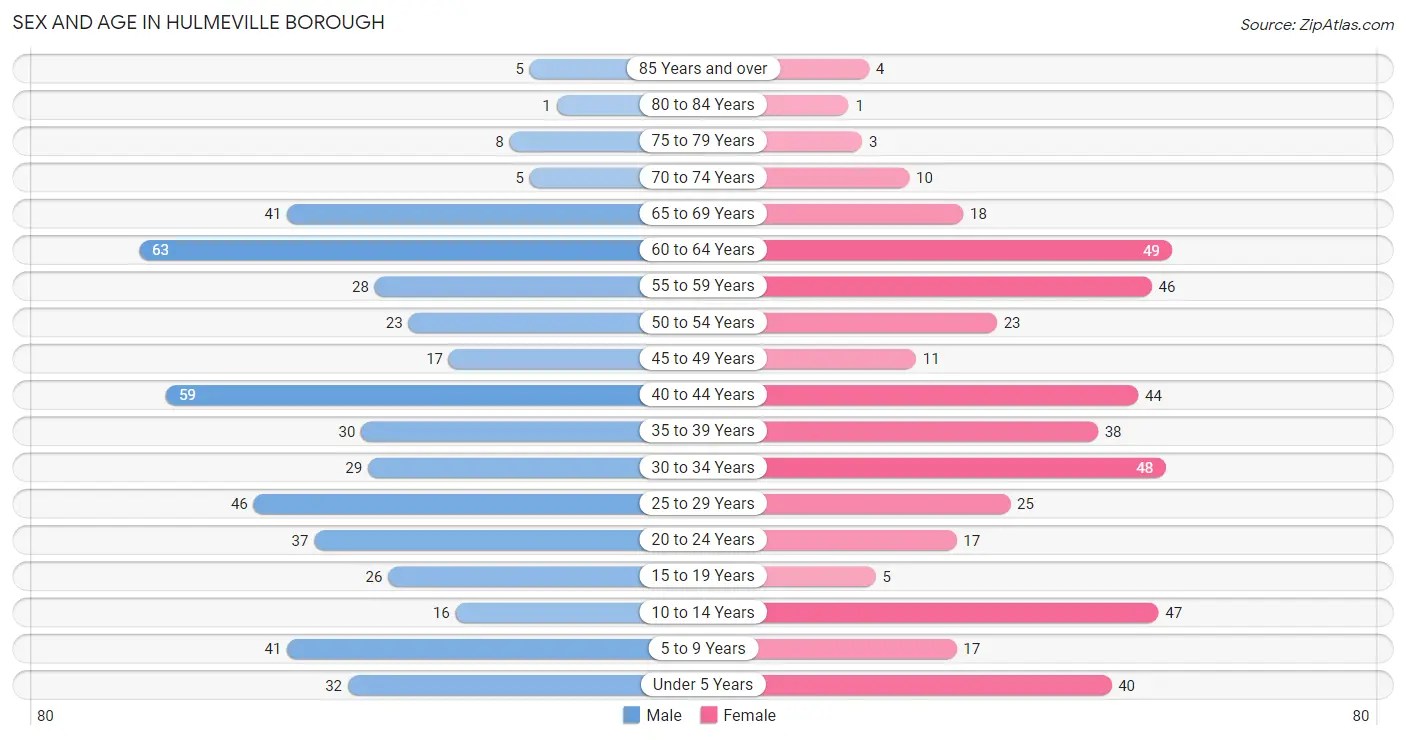
Sex and Age in Hulmeville borough
Sex and Age in Hulmeville borough
The most populous age groups in Hulmeville borough are 60 to 64 Years (63 | 12.4%) for men and 60 to 64 Years (49 | 11.0%) for women.
| Age Bracket | Male | Female |
| Under 5 Years | 32 (6.3%) | 40 (9.0%) |
| 5 to 9 Years | 41 (8.1%) | 17 (3.8%) |
| 10 to 14 Years | 16 (3.2%) | 47 (10.5%) |
| 15 to 19 Years | 26 (5.1%) | 5 (1.1%) |
| 20 to 24 Years | 37 (7.3%) | 17 (3.8%) |
| 25 to 29 Years | 46 (9.1%) | 25 (5.6%) |
| 30 to 34 Years | 29 (5.7%) | 48 (10.8%) |
| 35 to 39 Years | 30 (5.9%) | 38 (8.5%) |
| 40 to 44 Years | 59 (11.6%) | 44 (9.9%) |
| 45 to 49 Years | 17 (3.4%) | 11 (2.5%) |
| 50 to 54 Years | 23 (4.5%) | 23 (5.2%) |
| 55 to 59 Years | 28 (5.5%) | 46 (10.3%) |
| 60 to 64 Years | 63 (12.4%) | 49 (11.0%) |
| 65 to 69 Years | 41 (8.1%) | 18 (4.0%) |
| 70 to 74 Years | 5 (1.0%) | 10 (2.2%) |
| 75 to 79 Years | 8 (1.6%) | 3 (0.7%) |
| 80 to 84 Years | 1 (0.2%) | 1 (0.2%) |
| 85 Years and over | 5 (1.0%) | 4 (0.9%) |
| Total | 507 (100.0%) | 446 (100.0%) |
Families and Households in Hulmeville borough
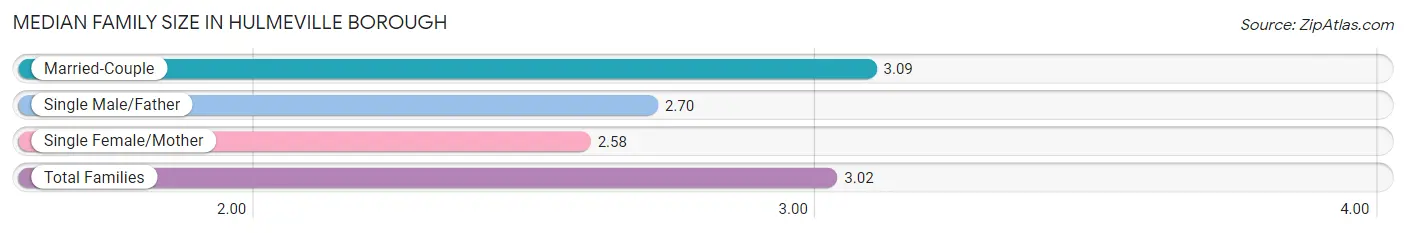
Median Family Size in Hulmeville borough
The median family size in Hulmeville borough is 3.02 persons per family, with married-couple families (239 | 84.5%) accounting for the largest median family size of 3.09 persons per family. On the other hand, single female/mother families (24 | 8.5%) represent the smallest median family size with 2.58 persons per family.
| Family Type | # Families | Family Size |
| Married-Couple | 239 (84.5%) | 3.09 |
| Single Male/Father | 20 (7.1%) | 2.70 |
| Single Female/Mother | 24 (8.5%) | 2.58 |
| Total Families | 283 (100.0%) | 3.02 |
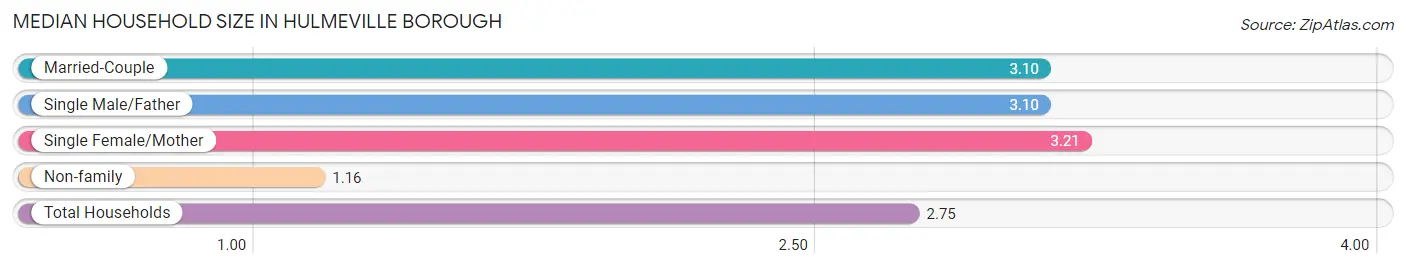
Median Household Size in Hulmeville borough
The median household size in Hulmeville borough is 2.75 persons per household, with single female/mother households (24 | 6.9%) accounting for the largest median household size of 3.21 persons per household. non-family households (63 | 18.2%) represent the smallest median household size with 1.16 persons per household.
| Household Type | # Households | Household Size |
| Married-Couple | 239 (69.1%) | 3.10 |
| Single Male/Father | 20 (5.8%) | 3.10 |
| Single Female/Mother | 24 (6.9%) | 3.21 |
| Non-family | 63 (18.2%) | 1.16 |
| Total Households | 346 (100.0%) | 2.75 |
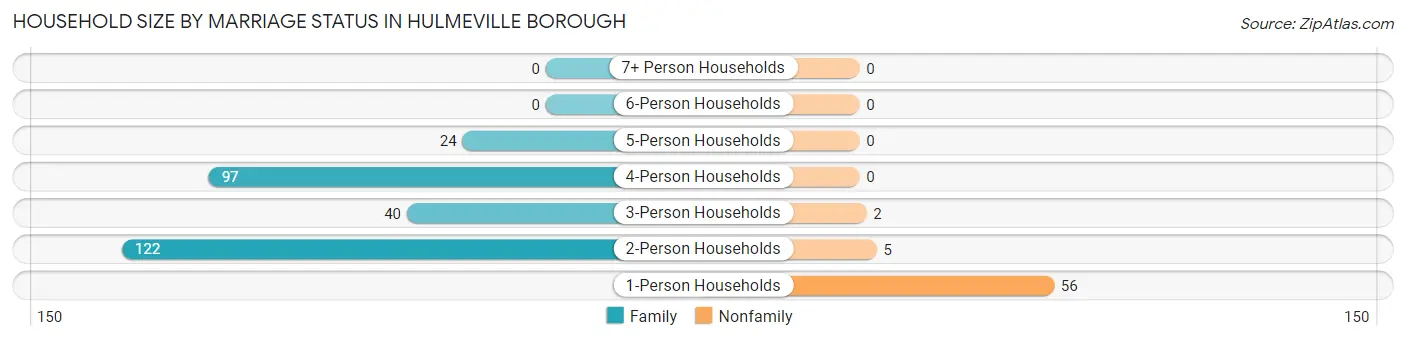
Household Size by Marriage Status in Hulmeville borough
Out of a total of 346 households in Hulmeville borough, 283 (81.8%) are family households, while 63 (18.2%) are nonfamily households. The most numerous type of family households are 2-person households, comprising 122, and the most common type of nonfamily households are 1-person households, comprising 56.
| Household Size | Family Households | Nonfamily Households |
| 1-Person Households | - | 56 (16.2%) |
| 2-Person Households | 122 (35.3%) | 5 (1.5%) |
| 3-Person Households | 40 (11.6%) | 2 (0.6%) |
| 4-Person Households | 97 (28.0%) | 0 (0.0%) |
| 5-Person Households | 24 (6.9%) | 0 (0.0%) |
| 6-Person Households | 0 (0.0%) | 0 (0.0%) |
| 7+ Person Households | 0 (0.0%) | 0 (0.0%) |
| Total | 283 (81.8%) | 63 (18.2%) |
Female Fertility in Hulmeville borough
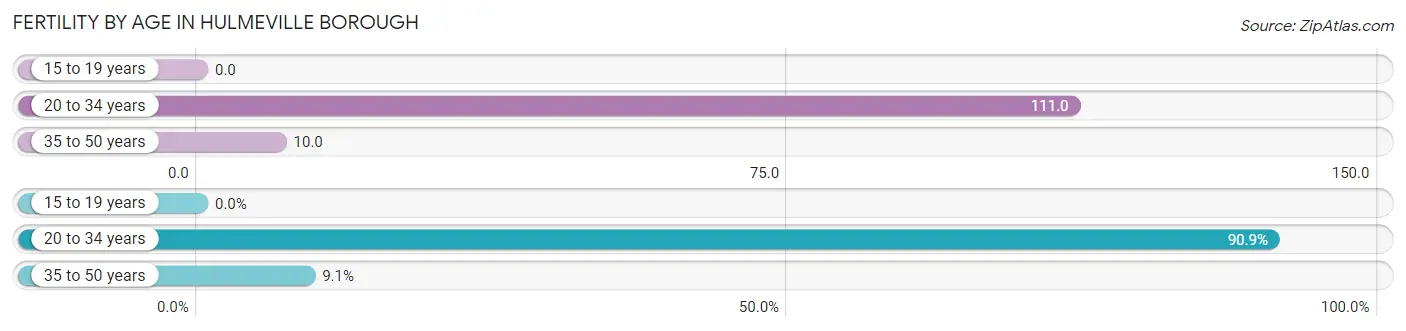
Fertility by Age in Hulmeville borough
Average fertility rate in Hulmeville borough is 58.0 births per 1,000 women. Women in the age bracket of 20 to 34 years have the highest fertility rate with 111.0 births per 1,000 women. Women in the age bracket of 20 to 34 years acount for 90.9% of all women with births.
| Age Bracket | Women with Births | Births / 1,000 Women |
| 15 to 19 years | 0 (0.0%) | 0.0 |
| 20 to 34 years | 10 (90.9%) | 111.0 |
| 35 to 50 years | 1 (9.1%) | 10.0 |
| Total | 11 (100.0%) | 58.0 |
Fertility by Age by Marriage Status in Hulmeville borough
81.8% of women with births (11) in Hulmeville borough are married. The highest percentage of unmarried women with births falls into 20 to 34 years age bracket with 20.0% of them unmarried at the time of birth, while the lowest percentage of unmarried women with births belong to 35 to 50 years age bracket with 0.0% of them unmarried.
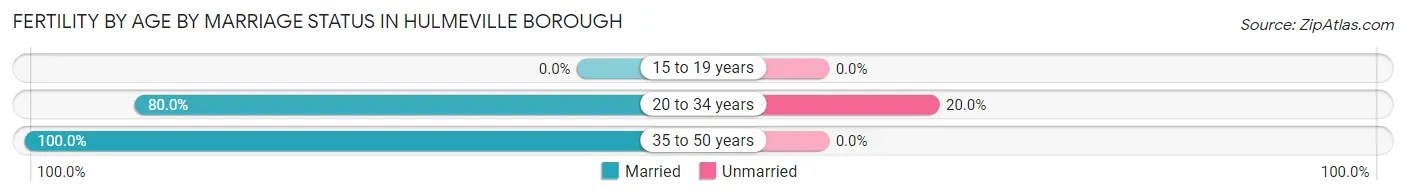
| Age Bracket | Married | Unmarried |
| 15 to 19 years | 0 (0.0%) | 0 (0.0%) |
| 20 to 34 years | 8 (80.0%) | 2 (20.0%) |
| 35 to 50 years | 1 (100.0%) | 0 (0.0%) |
| Total | 9 (81.8%) | 2 (18.2%) |
Fertility by Education in Hulmeville borough
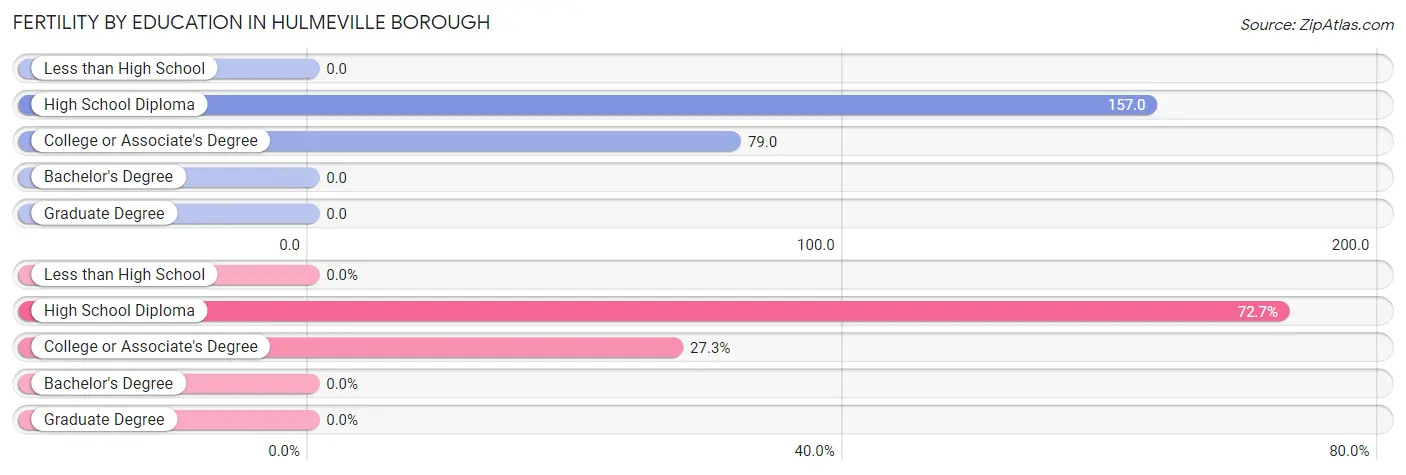
| Educational Attainment | Women with Births | Births / 1,000 Women |
| Less than High School | 0 (0.0%) | 0.0 |
| High School Diploma | 8 (72.7%) | 157.0 |
| College or Associate's Degree | 3 (27.3%) | 79.0 |
| Bachelor's Degree | 0 (0.0%) | 0.0 |
| Graduate Degree | 0 (0.0%) | 0.0 |
| Total | 11 (100.0%) | 58.0 |
Fertility by Education by Marriage Status in Hulmeville borough
18.2% of women with births in Hulmeville borough are unmarried. Women with the educational attainment of high school diploma are most likely to be married with 100.0% of them married at childbirth, while women with the educational attainment of college or associate's degree are least likely to be married with 66.7% of them unmarried at childbirth.
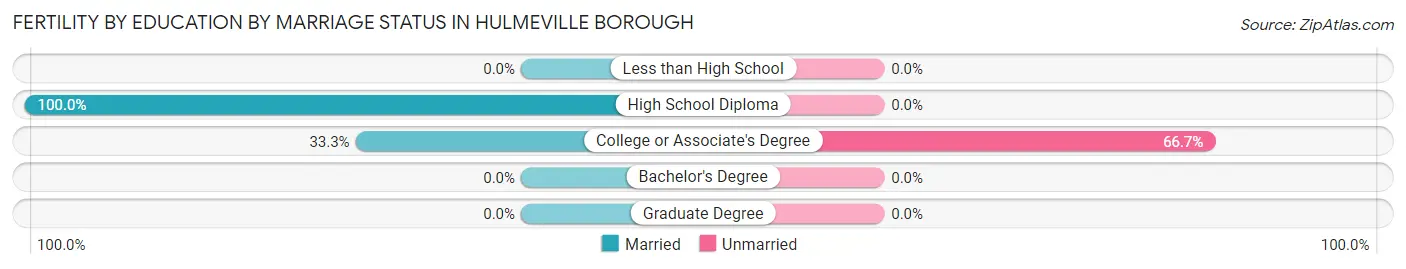
| Educational Attainment | Married | Unmarried |
| Less than High School | 0 (0.0%) | 0 (0.0%) |
| High School Diploma | 8 (100.0%) | 0 (0.0%) |
| College or Associate's Degree | 1 (33.3%) | 2 (66.7%) |
| Bachelor's Degree | 0 (0.0%) | 0 (0.0%) |
| Graduate Degree | 0 (0.0%) | 0 (0.0%) |
| Total | 9 (81.8%) | 2 (18.2%) |
Income in Hulmeville borough
Income Overview in Hulmeville borough
Per Capita Income in Hulmeville borough is $47,067, while median incomes of families and households are $124,712 and $116,500 respectively.
| Characteristic | Number | Measure |
| Per Capita Income | 953 | $47,067 |
| Median Family Income | 283 | $124,712 |
| Mean Family Income | 283 | $141,066 |
| Median Household Income | 346 | $116,500 |
| Mean Household Income | 346 | $126,998 |
| Income Deficit | 283 | $0 |
| Wage / Income Gap (%) | 953 | 39.92% |
| Wage / Income Gap ($) | 953 | 60.08¢ per $1 |
| Gini / Inequality Index | 953 | 0.35 |
Earnings by Sex in Hulmeville borough
Average Earnings in Hulmeville borough are $57,232, $73,958 for men and $44,432 for women, a difference of 39.9%.
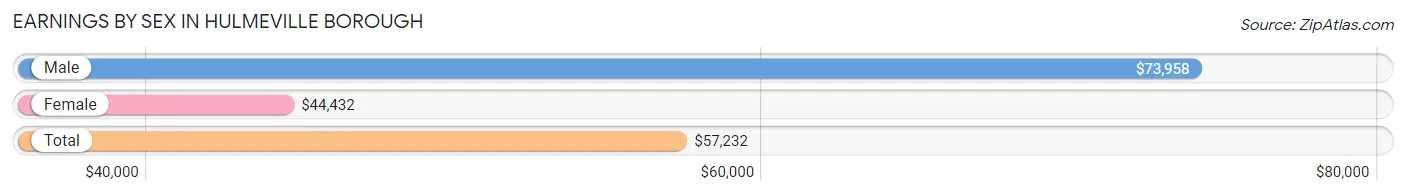
| Sex | Number | Average Earnings |
| Male | 295 (52.8%) | $73,958 |
| Female | 264 (47.2%) | $44,432 |
| Total | 559 (100.0%) | $57,232 |
Earnings by Sex by Income Bracket in Hulmeville borough
The most common earnings brackets in Hulmeville borough are $100,000+ for men (81 | 27.5%) and $40,000 to $44,999 for women (37 | 14.0%).
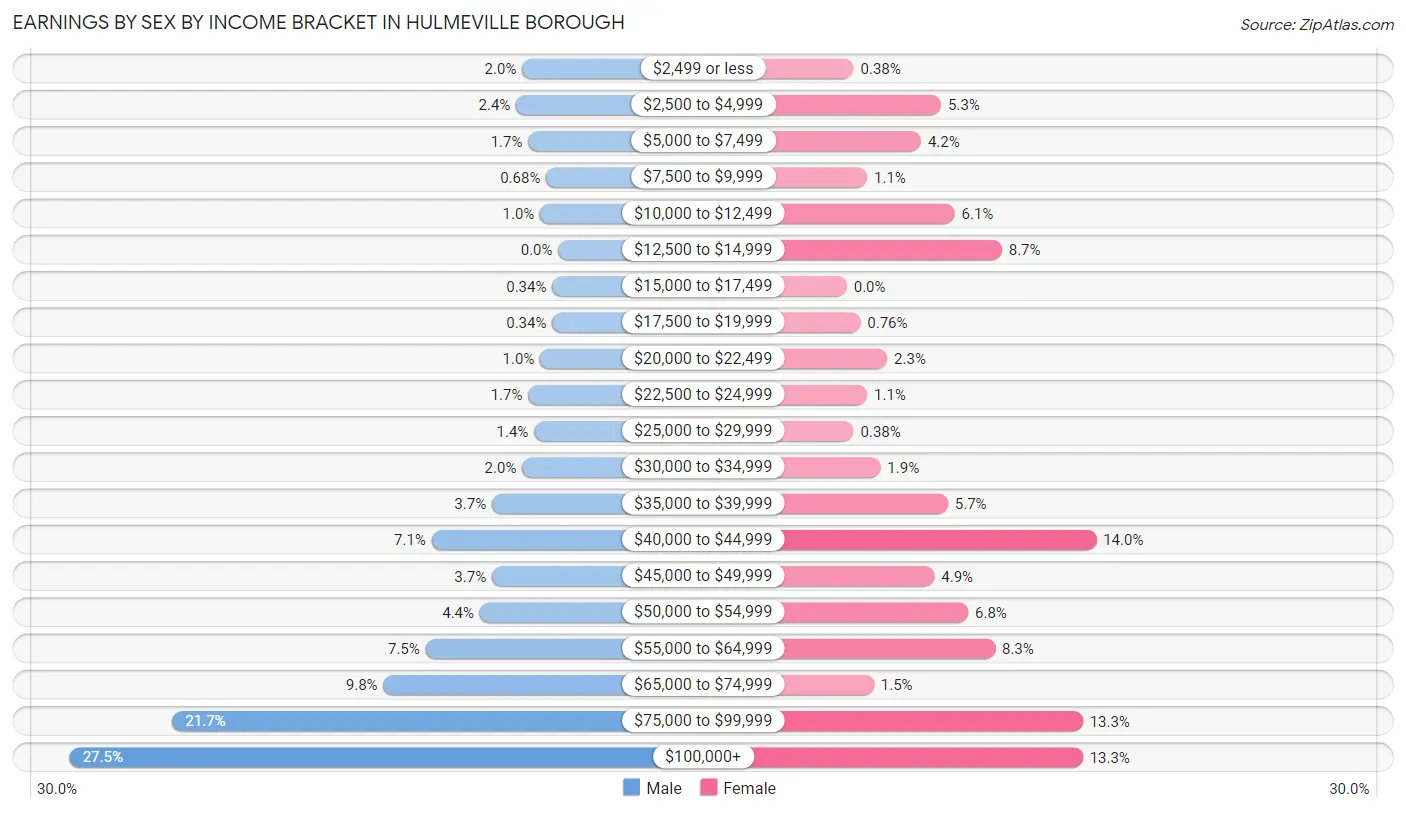
| Income | Male | Female |
| $2,499 or less | 6 (2.0%) | 1 (0.4%) |
| $2,500 to $4,999 | 7 (2.4%) | 14 (5.3%) |
| $5,000 to $7,499 | 5 (1.7%) | 11 (4.2%) |
| $7,500 to $9,999 | 2 (0.7%) | 3 (1.1%) |
| $10,000 to $12,499 | 3 (1.0%) | 16 (6.1%) |
| $12,500 to $14,999 | 0 (0.0%) | 23 (8.7%) |
| $15,000 to $17,499 | 1 (0.3%) | 0 (0.0%) |
| $17,500 to $19,999 | 1 (0.3%) | 2 (0.8%) |
| $20,000 to $22,499 | 3 (1.0%) | 6 (2.3%) |
| $22,500 to $24,999 | 5 (1.7%) | 3 (1.1%) |
| $25,000 to $29,999 | 4 (1.4%) | 1 (0.4%) |
| $30,000 to $34,999 | 6 (2.0%) | 5 (1.9%) |
| $35,000 to $39,999 | 11 (3.7%) | 15 (5.7%) |
| $40,000 to $44,999 | 21 (7.1%) | 37 (14.0%) |
| $45,000 to $49,999 | 11 (3.7%) | 13 (4.9%) |
| $50,000 to $54,999 | 13 (4.4%) | 18 (6.8%) |
| $55,000 to $64,999 | 22 (7.5%) | 22 (8.3%) |
| $65,000 to $74,999 | 29 (9.8%) | 4 (1.5%) |
| $75,000 to $99,999 | 64 (21.7%) | 35 (13.3%) |
| $100,000+ | 81 (27.5%) | 35 (13.3%) |
| Total | 295 (100.0%) | 264 (100.0%) |
Earnings by Sex by Educational Attainment in Hulmeville borough
Average earnings in Hulmeville borough are $80,625 for men and $47,656 for women, a difference of 40.9%. Men with an educational attainment of graduate degree enjoy the highest average annual earnings of $140,417, while those with high school diploma education earn the least with $64,688. Women with an educational attainment of graduate degree earn the most with the average annual earnings of $81,250, while those with high school diploma education have the smallest earnings of $40,583.
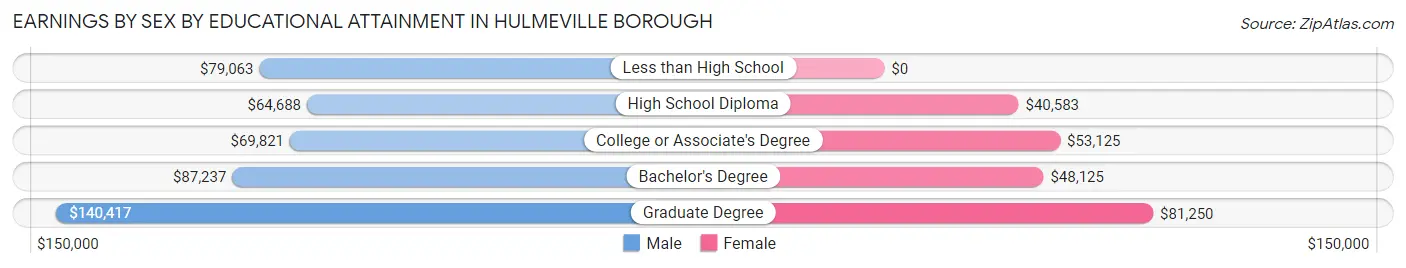
| Educational Attainment | Male Income | Female Income |
| Less than High School | $79,063 | $0 |
| High School Diploma | $64,688 | $40,583 |
| College or Associate's Degree | $69,821 | $53,125 |
| Bachelor's Degree | $87,237 | $48,125 |
| Graduate Degree | $140,417 | $81,250 |
| Total | $80,625 | $47,656 |
Family Income in Hulmeville borough
Family Income Brackets in Hulmeville borough
According to the Hulmeville borough family income data, there are 107 families falling into the $100,000 to $149,999 income range, which is the most common income bracket and makes up 37.8% of all families. Conversely, the $15,000 to $24,999 income bracket is the least frequent group with only 2 families (0.7%) belonging to this category.
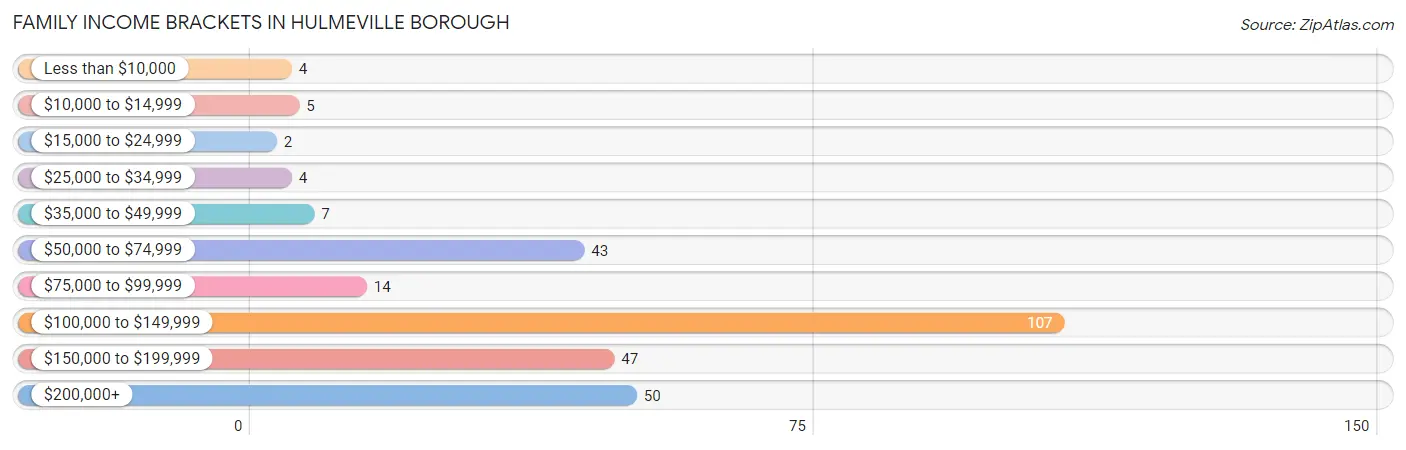
| Income Bracket | # Families | % Families |
| Less than $10,000 | 4 | 1.4% |
| $10,000 to $14,999 | 5 | 1.8% |
| $15,000 to $24,999 | 2 | 0.7% |
| $25,000 to $34,999 | 4 | 1.4% |
| $35,000 to $49,999 | 7 | 2.5% |
| $50,000 to $74,999 | 43 | 15.2% |
| $75,000 to $99,999 | 14 | 4.9% |
| $100,000 to $149,999 | 107 | 37.8% |
| $150,000 to $199,999 | 47 | 16.6% |
| $200,000+ | 50 | 17.7% |
Family Income by Famaliy Size in Hulmeville borough
5-person families (24 | 8.5%) account for the highest median family income in Hulmeville borough with $150,000 per family, while 2-person families (130 | 45.9%) have the highest median income of $57,916 per family member.
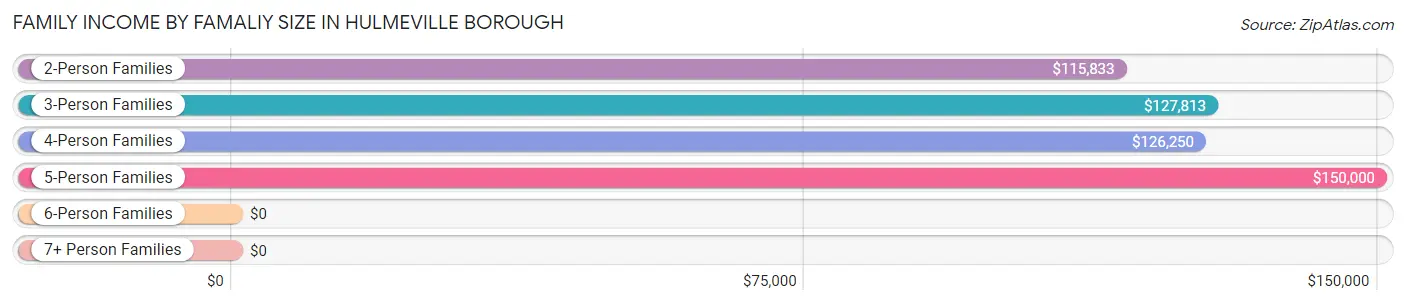
| Income Bracket | # Families | Median Income |
| 2-Person Families | 130 (45.9%) | $115,833 |
| 3-Person Families | 47 (16.6%) | $127,813 |
| 4-Person Families | 82 (29.0%) | $126,250 |
| 5-Person Families | 24 (8.5%) | $150,000 |
| 6-Person Families | 0 (0.0%) | $0 |
| 7+ Person Families | 0 (0.0%) | $0 |
| Total | 283 (100.0%) | $124,712 |
Family Income by Number of Earners in Hulmeville borough
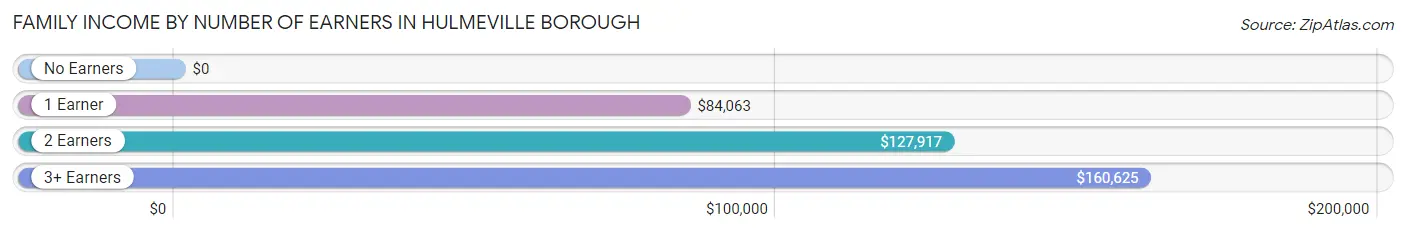
| Number of Earners | # Families | Median Income |
| No Earners | 15 (5.3%) | $0 |
| 1 Earner | 87 (30.7%) | $84,063 |
| 2 Earners | 152 (53.7%) | $127,917 |
| 3+ Earners | 29 (10.2%) | $160,625 |
| Total | 283 (100.0%) | $124,712 |
Household Income in Hulmeville borough
Household Income Brackets in Hulmeville borough
With 109 households falling in the category, the $100,000 to $149,999 income range is the most frequent in Hulmeville borough, accounting for 31.5% of all households. In contrast, only 5 households (1.5%) fall into the less than $10,000 income bracket, making it the least populous group.
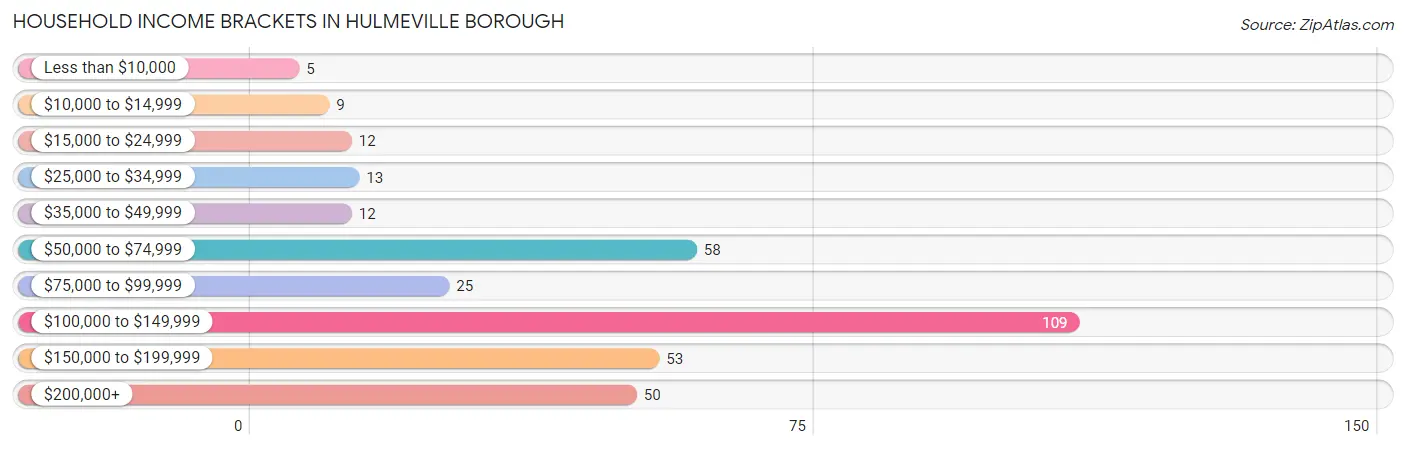
| Income Bracket | # Households | % Households |
| Less than $10,000 | 5 | 1.4% |
| $10,000 to $14,999 | 9 | 2.6% |
| $15,000 to $24,999 | 12 | 3.5% |
| $25,000 to $34,999 | 13 | 3.8% |
| $35,000 to $49,999 | 12 | 3.5% |
| $50,000 to $74,999 | 58 | 16.8% |
| $75,000 to $99,999 | 25 | 7.2% |
| $100,000 to $149,999 | 109 | 31.5% |
| $150,000 to $199,999 | 53 | 15.3% |
| $200,000+ | 50 | 14.5% |
Household Income by Householder Age in Hulmeville borough
The median household income in Hulmeville borough is $116,500, with the highest median household income of $128,194 found in the 25 to 44 years age bracket for the primary householder. A total of 135 households (39.0%) fall into this category.
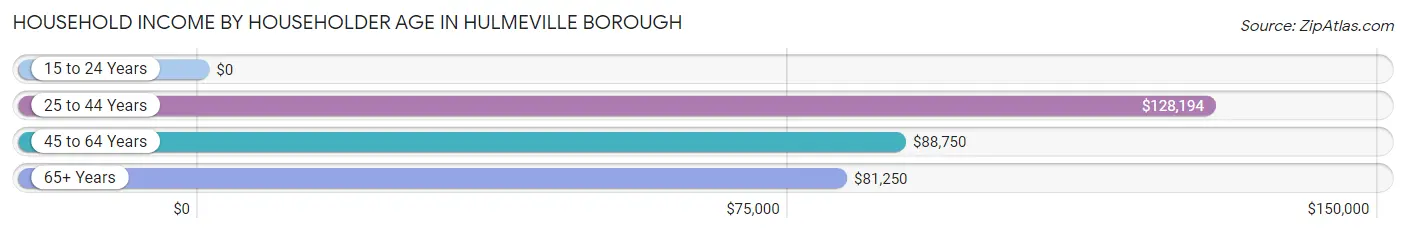
| Income Bracket | # Households | Median Income |
| 15 to 24 Years | 0 (0.0%) | $0 |
| 25 to 44 Years | 135 (39.0%) | $128,194 |
| 45 to 64 Years | 146 (42.2%) | $88,750 |
| 65+ Years | 65 (18.8%) | $81,250 |
| Total | 346 (100.0%) | $116,500 |
Poverty in Hulmeville borough
Income Below Poverty by Sex and Age in Hulmeville borough
With 4.7% poverty level for males and 6.1% for females among the residents of Hulmeville borough, 15 year old males and 16 and 17 year old females are the most vulnerable to poverty, with 2 males (33.3%) and 1 females (50.0%) in their respective age groups living below the poverty level.
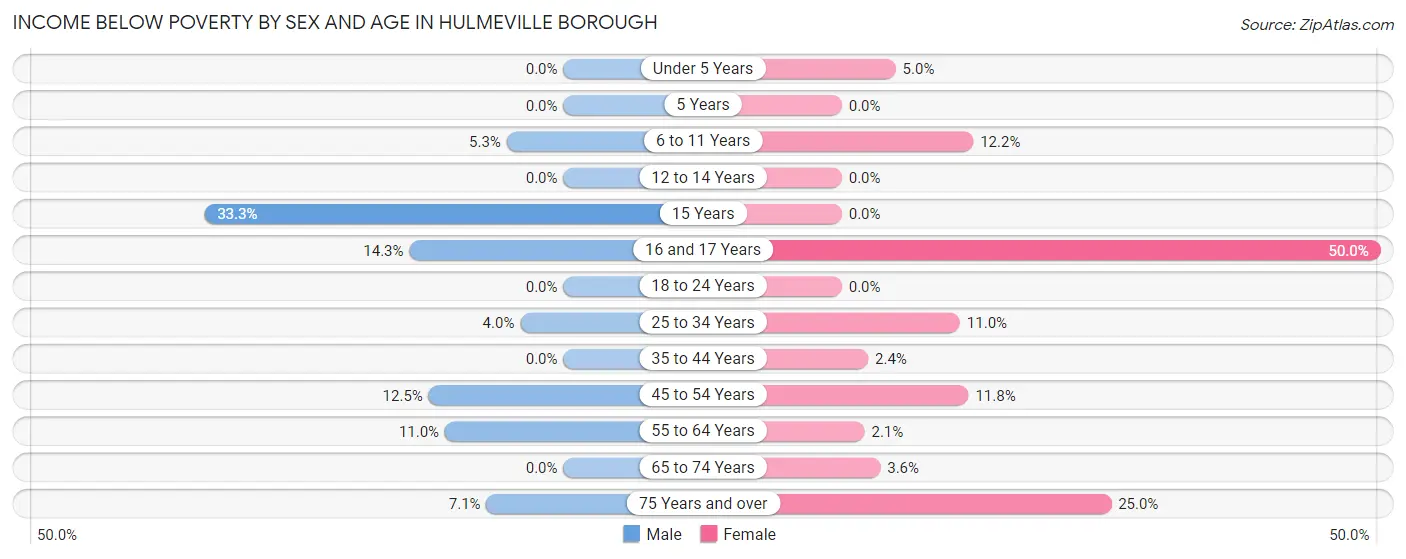
| Age Bracket | Male | Female |
| Under 5 Years | 0 (0.0%) | 2 (5.0%) |
| 5 Years | 0 (0.0%) | 0 (0.0%) |
| 6 to 11 Years | 2 (5.3%) | 5 (12.2%) |
| 12 to 14 Years | 0 (0.0%) | 0 (0.0%) |
| 15 Years | 2 (33.3%) | 0 (0.0%) |
| 16 and 17 Years | 1 (14.3%) | 1 (50.0%) |
| 18 to 24 Years | 0 (0.0%) | 0 (0.0%) |
| 25 to 34 Years | 3 (4.0%) | 8 (11.0%) |
| 35 to 44 Years | 0 (0.0%) | 2 (2.4%) |
| 45 to 54 Years | 5 (12.5%) | 4 (11.8%) |
| 55 to 64 Years | 10 (11.0%) | 2 (2.1%) |
| 65 to 74 Years | 0 (0.0%) | 1 (3.6%) |
| 75 Years and over | 1 (7.1%) | 2 (25.0%) |
| Total | 24 (4.7%) | 27 (6.1%) |
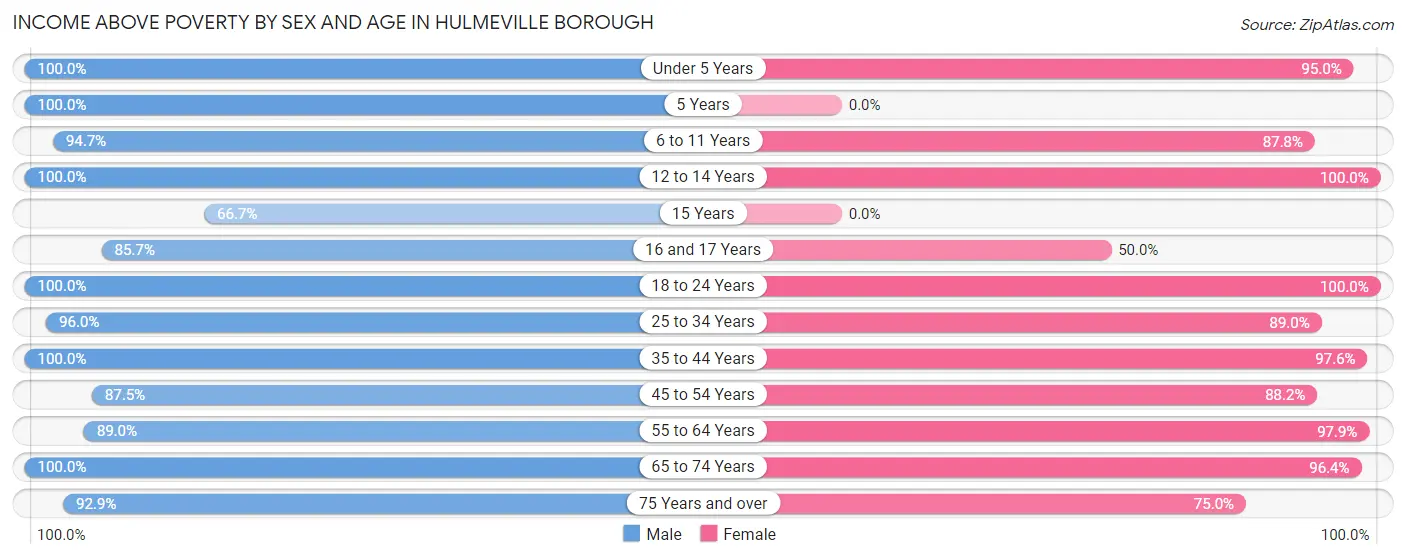
Income Above Poverty by Sex and Age in Hulmeville borough
According to the poverty statistics in Hulmeville borough, males aged under 5 years and females aged 12 to 14 years are the age groups that are most secure financially, with 100.0% of males and 100.0% of females in these age groups living above the poverty line.
| Age Bracket | Male | Female |
| Under 5 Years | 32 (100.0%) | 38 (95.0%) |
| 5 Years | 9 (100.0%) | 0 (0.0%) |
| 6 to 11 Years | 36 (94.7%) | 36 (87.8%) |
| 12 to 14 Years | 10 (100.0%) | 17 (100.0%) |
| 15 Years | 4 (66.7%) | 0 (0.0%) |
| 16 and 17 Years | 6 (85.7%) | 1 (50.0%) |
| 18 to 24 Years | 50 (100.0%) | 20 (100.0%) |
| 25 to 34 Years | 72 (96.0%) | 65 (89.0%) |
| 35 to 44 Years | 89 (100.0%) | 80 (97.6%) |
| 45 to 54 Years | 35 (87.5%) | 30 (88.2%) |
| 55 to 64 Years | 81 (89.0%) | 93 (97.9%) |
| 65 to 74 Years | 46 (100.0%) | 27 (96.4%) |
| 75 Years and over | 13 (92.9%) | 6 (75.0%) |
| Total | 483 (95.3%) | 413 (93.9%) |
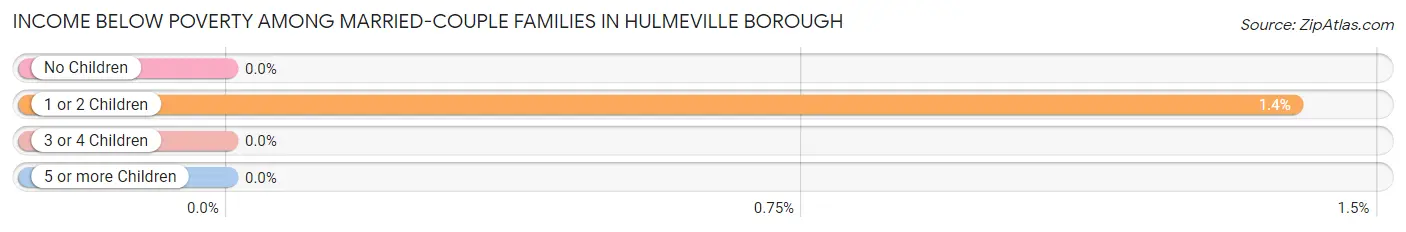
Income Below Poverty Among Married-Couple Families in Hulmeville borough
The poverty statistics for married-couple families in Hulmeville borough show that 0.4% or 1 of the total 239 families live below the poverty line. Families with 1 or 2 children have the highest poverty rate of 1.4%, comprising of 1 families. On the other hand, families with no children have the lowest poverty rate of 0.0%, which includes 0 families.
| Children | Above Poverty | Below Poverty |
| No Children | 151 (100.0%) | 0 (0.0%) |
| 1 or 2 Children | 71 (98.6%) | 1 (1.4%) |
| 3 or 4 Children | 16 (100.0%) | 0 (0.0%) |
| 5 or more Children | 0 (0.0%) | 0 (0.0%) |
| Total | 238 (99.6%) | 1 (0.4%) |
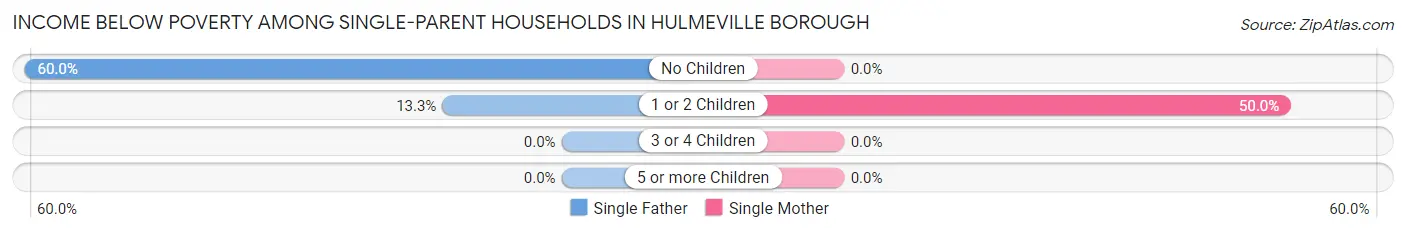
Income Below Poverty Among Single-Parent Households in Hulmeville borough
According to the poverty data in Hulmeville borough, 25.0% or 5 single-father households and 16.7% or 4 single-mother households are living below the poverty line. Among single-father households, those with no children have the highest poverty rate, with 3 households (60.0%) experiencing poverty. Likewise, among single-mother households, those with 1 or 2 children have the highest poverty rate, with 4 households (50.0%) falling below the poverty line.
| Children | Single Father | Single Mother |
| No Children | 3 (60.0%) | 0 (0.0%) |
| 1 or 2 Children | 2 (13.3%) | 4 (50.0%) |
| 3 or 4 Children | 0 (0.0%) | 0 (0.0%) |
| 5 or more Children | 0 (0.0%) | 0 (0.0%) |
| Total | 5 (25.0%) | 4 (16.7%) |
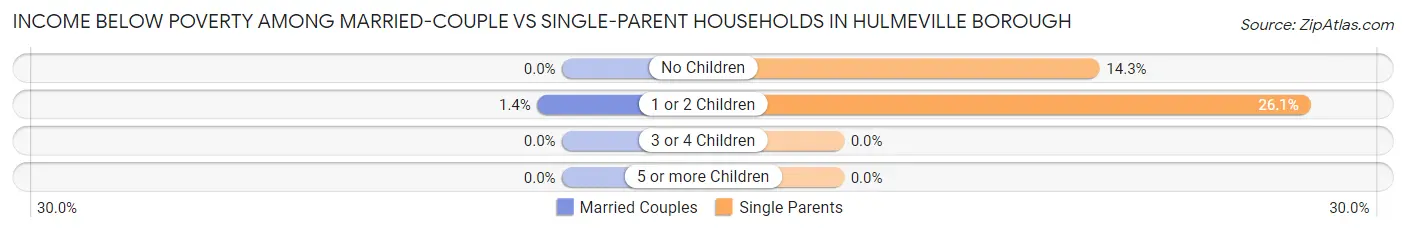
Income Below Poverty Among Married-Couple vs Single-Parent Households in Hulmeville borough
The poverty data for Hulmeville borough shows that 1 of the married-couple family households (0.4%) and 9 of the single-parent households (20.4%) are living below the poverty level. Within the married-couple family households, those with 1 or 2 children have the highest poverty rate, with 1 households (1.4%) falling below the poverty line. Among the single-parent households, those with 1 or 2 children have the highest poverty rate, with 6 household (26.1%) living below poverty.
| Children | Married-Couple Families | Single-Parent Households |
| No Children | 0 (0.0%) | 3 (14.3%) |
| 1 or 2 Children | 1 (1.4%) | 6 (26.1%) |
| 3 or 4 Children | 0 (0.0%) | 0 (0.0%) |
| 5 or more Children | 0 (0.0%) | 0 (0.0%) |
| Total | 1 (0.4%) | 9 (20.4%) |
Employment Characteristics in Hulmeville borough
Employment by Class of Employer in Hulmeville borough
Among the 484 employed individuals in Hulmeville borough, private company employees (326 | 67.4%), not-for-profit organizations (72 | 14.9%), and local government employees (48 | 9.9%) make up the most common classes of employment.
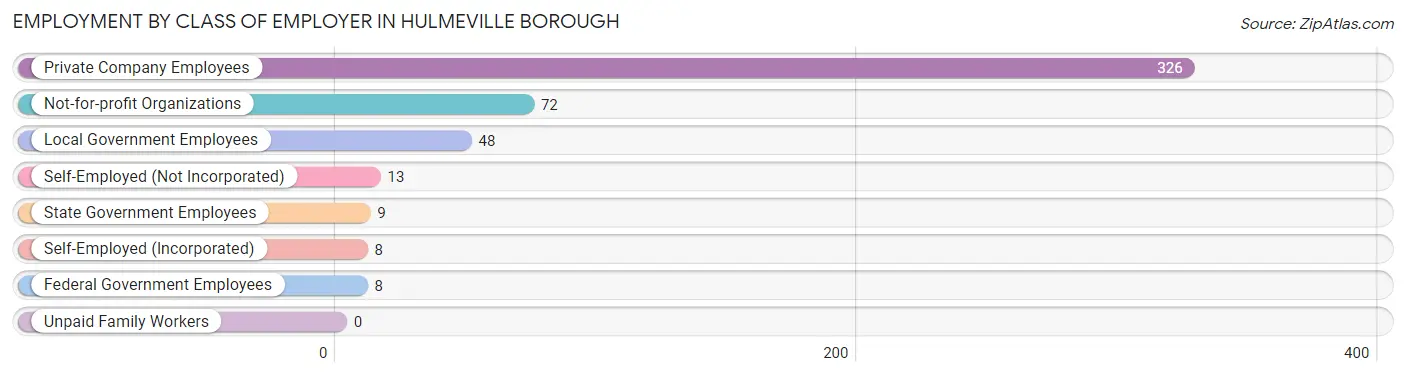
| Employer Class | # Employees | % Employees |
| Private Company Employees | 326 | 67.4% |
| Self-Employed (Incorporated) | 8 | 1.7% |
| Self-Employed (Not Incorporated) | 13 | 2.7% |
| Not-for-profit Organizations | 72 | 14.9% |
| Local Government Employees | 48 | 9.9% |
| State Government Employees | 9 | 1.9% |
| Federal Government Employees | 8 | 1.7% |
| Unpaid Family Workers | 0 | 0.0% |
| Total | 484 | 100.0% |
Employment Status by Age in Hulmeville borough
According to the labor force statistics for Hulmeville borough, out of the total population over 16 years of age (754), 71.1% or 536 individuals are in the labor force, with 7.6% or 41 of them unemployed. The age group with the highest labor force participation rate is 35 to 44 years, with 95.9% or 164 individuals in the labor force. Within the labor force, the 20 to 24 years age range has the highest percentage of unemployed individuals, with 31.0% or 13 of them being unemployed.
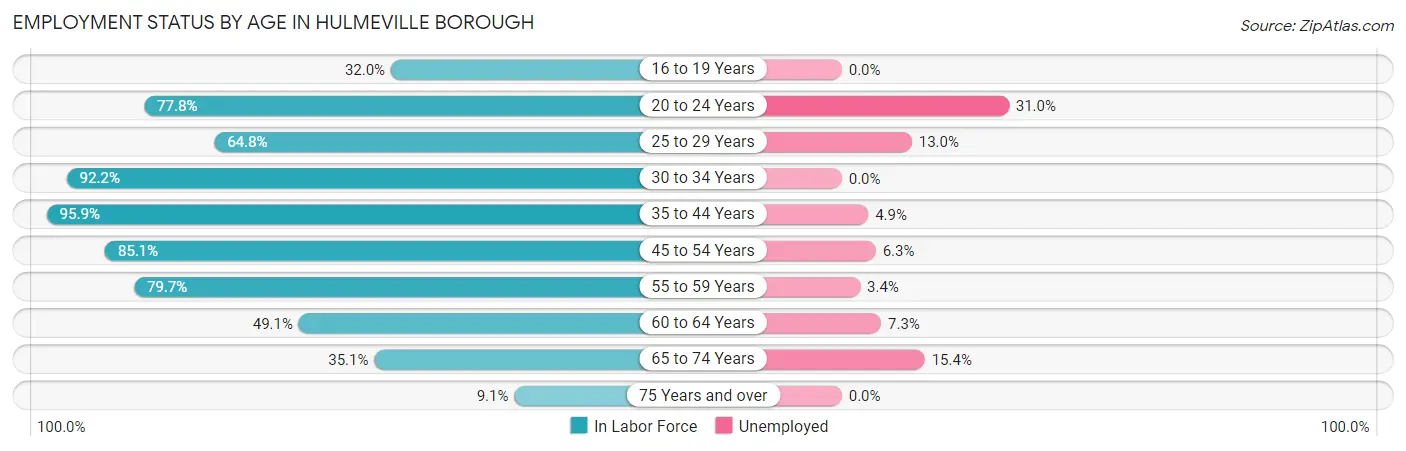
| Age Bracket | In Labor Force | Unemployed |
| 16 to 19 Years | 8 (32.0%) | 0 (0.0%) |
| 20 to 24 Years | 42 (77.8%) | 13 (31.0%) |
| 25 to 29 Years | 46 (64.8%) | 6 (13.0%) |
| 30 to 34 Years | 71 (92.2%) | 0 (0.0%) |
| 35 to 44 Years | 164 (95.9%) | 8 (4.9%) |
| 45 to 54 Years | 63 (85.1%) | 4 (6.3%) |
| 55 to 59 Years | 59 (79.7%) | 2 (3.4%) |
| 60 to 64 Years | 55 (49.1%) | 4 (7.3%) |
| 65 to 74 Years | 26 (35.1%) | 4 (15.4%) |
| 75 Years and over | 2 (9.1%) | 0 (0.0%) |
| Total | 536 (71.1%) | 41 (7.6%) |
Employment Status by Educational Attainment in Hulmeville borough
According to labor force statistics for Hulmeville borough, 79.1% of individuals (458) out of the total population between 25 and 64 years of age (579) are in the labor force, with 5.2% or 24 of them being unemployed. The group with the highest labor force participation rate are those with the educational attainment of bachelor's degree or higher, with 85.5% or 188 individuals in the labor force. Within the labor force, individuals with bachelor's degree or higher education have the highest percentage of unemployment, with 6.4% or 12 of them being unemployed.
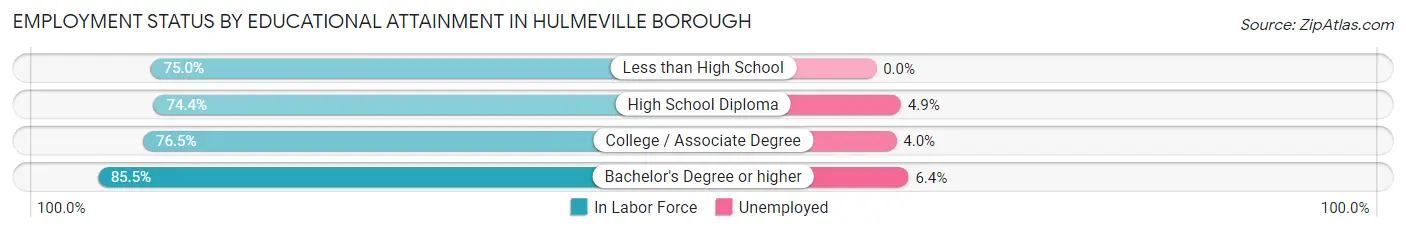
| Educational Attainment | In Labor Force | Unemployed |
| Less than High School | 6 (75.0%) | 0 (0.0%) |
| High School Diploma | 163 (74.4%) | 11 (4.9%) |
| College / Associate Degree | 101 (76.5%) | 5 (4.0%) |
| Bachelor's Degree or higher | 188 (85.5%) | 14 (6.4%) |
| Total | 458 (79.1%) | 30 (5.2%) |
Employment Occupations by Sex in Hulmeville borough
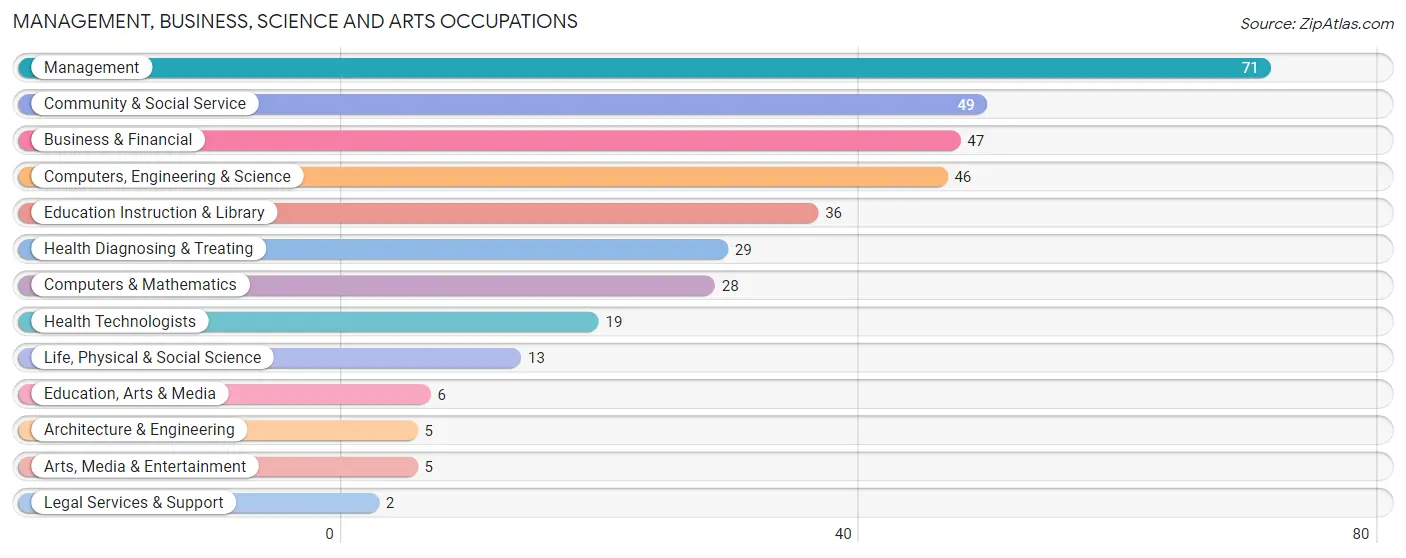
Management, Business, Science and Arts Occupations
The most common Management, Business, Science and Arts occupations in Hulmeville borough are Management (71 | 14.3%), Community & Social Service (49 | 9.9%), Business & Financial (47 | 9.5%), Computers, Engineering & Science (46 | 9.3%), and Education Instruction & Library (36 | 7.3%).
Management, Business, Science and Arts Occupations by Sex
Within the Management, Business, Science and Arts occupations in Hulmeville borough, the most male-oriented occupations are Architecture & Engineering (100.0%), Computers & Mathematics (85.7%), and Computers, Engineering & Science (78.3%), while the most female-oriented occupations are Legal Services & Support (100.0%), Health Diagnosing & Treating (100.0%), and Health Technologists (100.0%).
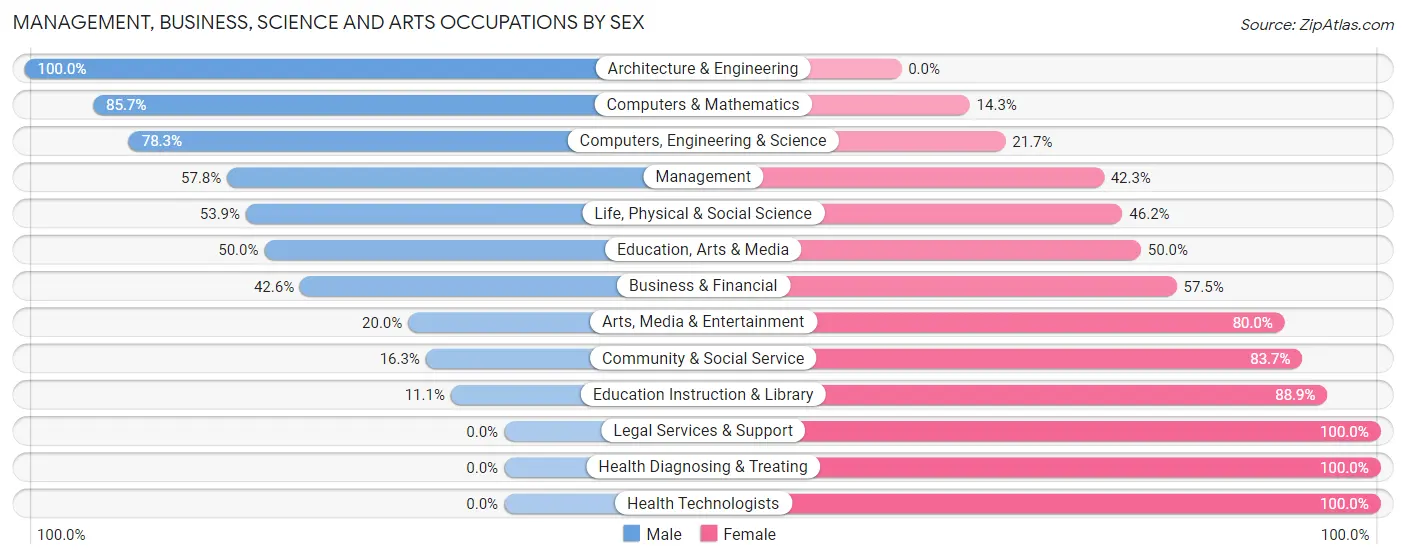
| Occupation | Male | Female |
| Management | 41 (57.8%) | 30 (42.2%) |
| Business & Financial | 20 (42.5%) | 27 (57.5%) |
| Computers, Engineering & Science | 36 (78.3%) | 10 (21.7%) |
| Computers & Mathematics | 24 (85.7%) | 4 (14.3%) |
| Architecture & Engineering | 5 (100.0%) | 0 (0.0%) |
| Life, Physical & Social Science | 7 (53.8%) | 6 (46.2%) |
| Community & Social Service | 8 (16.3%) | 41 (83.7%) |
| Education, Arts & Media | 3 (50.0%) | 3 (50.0%) |
| Legal Services & Support | 0 (0.0%) | 2 (100.0%) |
| Education Instruction & Library | 4 (11.1%) | 32 (88.9%) |
| Arts, Media & Entertainment | 1 (20.0%) | 4 (80.0%) |
| Health Diagnosing & Treating | 0 (0.0%) | 29 (100.0%) |
| Health Technologists | 0 (0.0%) | 19 (100.0%) |
| Total (Category) | 105 (43.4%) | 137 (56.6%) |
| Total (Overall) | 260 (52.5%) | 235 (47.5%) |
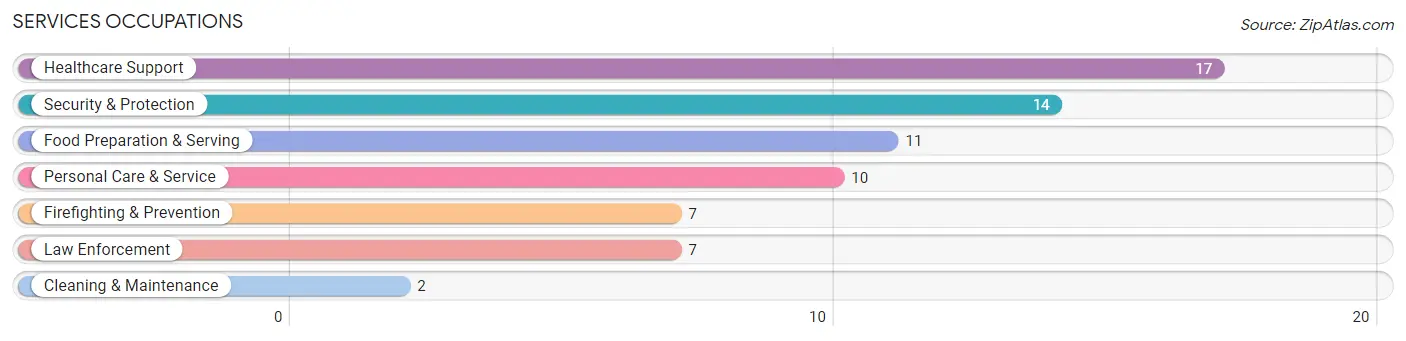
Services Occupations
The most common Services occupations in Hulmeville borough are Healthcare Support (17 | 3.4%), Security & Protection (14 | 2.8%), Food Preparation & Serving (11 | 2.2%), Personal Care & Service (10 | 2.0%), and Firefighting & Prevention (7 | 1.4%).
Services Occupations by Sex
Within the Services occupations in Hulmeville borough, the most male-oriented occupations are Security & Protection (100.0%), Firefighting & Prevention (100.0%), and Law Enforcement (100.0%), while the most female-oriented occupations are Healthcare Support (100.0%), Personal Care & Service (100.0%), and Food Preparation & Serving (36.4%).
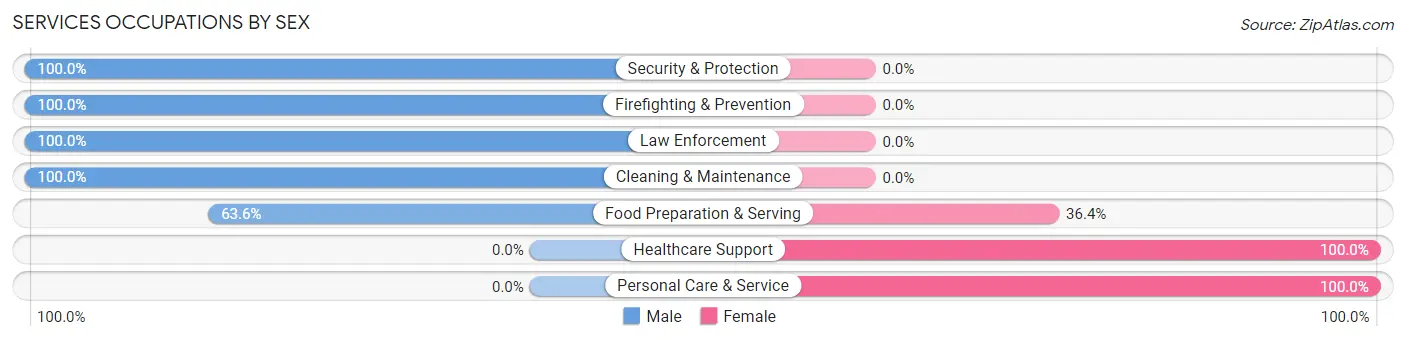
| Occupation | Male | Female |
| Healthcare Support | 0 (0.0%) | 17 (100.0%) |
| Security & Protection | 14 (100.0%) | 0 (0.0%) |
| Firefighting & Prevention | 7 (100.0%) | 0 (0.0%) |
| Law Enforcement | 7 (100.0%) | 0 (0.0%) |
| Food Preparation & Serving | 7 (63.6%) | 4 (36.4%) |
| Cleaning & Maintenance | 2 (100.0%) | 0 (0.0%) |
| Personal Care & Service | 0 (0.0%) | 10 (100.0%) |
| Total (Category) | 23 (42.6%) | 31 (57.4%) |
| Total (Overall) | 260 (52.5%) | 235 (47.5%) |
Sales and Office Occupations
The most common Sales and Office occupations in Hulmeville borough are Office & Administration (55 | 11.1%), and Sales & Related (25 | 5.1%).

Sales and Office Occupations by Sex

| Occupation | Male | Female |
| Sales & Related | 13 (52.0%) | 12 (48.0%) |
| Office & Administration | 10 (18.2%) | 45 (81.8%) |
| Total (Category) | 23 (28.7%) | 57 (71.3%) |
| Total (Overall) | 260 (52.5%) | 235 (47.5%) |
Natural Resources, Construction and Maintenance Occupations
The most common Natural Resources, Construction and Maintenance occupations in Hulmeville borough are Construction & Extraction (34 | 6.9%), and Installation, Maintenance & Repair (15 | 3.0%).

Natural Resources, Construction and Maintenance Occupations by Sex
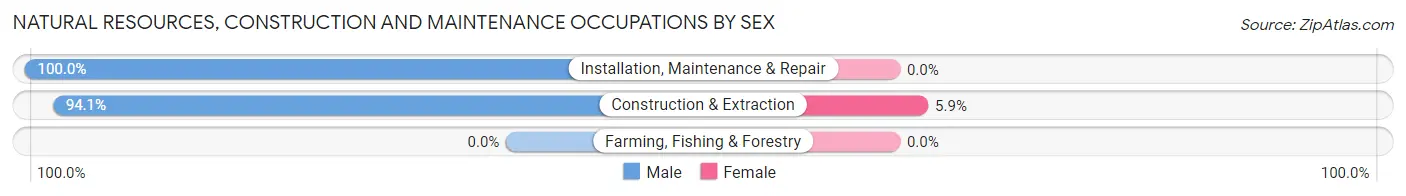
| Occupation | Male | Female |
| Farming, Fishing & Forestry | 0 (0.0%) | 0 (0.0%) |
| Construction & Extraction | 32 (94.1%) | 2 (5.9%) |
| Installation, Maintenance & Repair | 15 (100.0%) | 0 (0.0%) |
| Total (Category) | 47 (95.9%) | 2 (4.1%) |
| Total (Overall) | 260 (52.5%) | 235 (47.5%) |
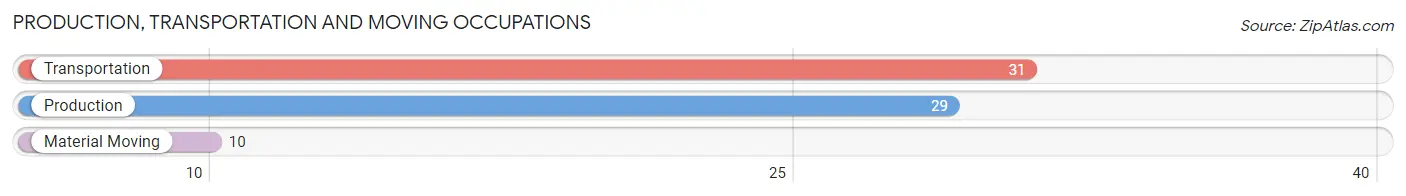
Production, Transportation and Moving Occupations
The most common Production, Transportation and Moving occupations in Hulmeville borough are Transportation (31 | 6.3%), Production (29 | 5.9%), and Material Moving (10 | 2.0%).
Production, Transportation and Moving Occupations by Sex
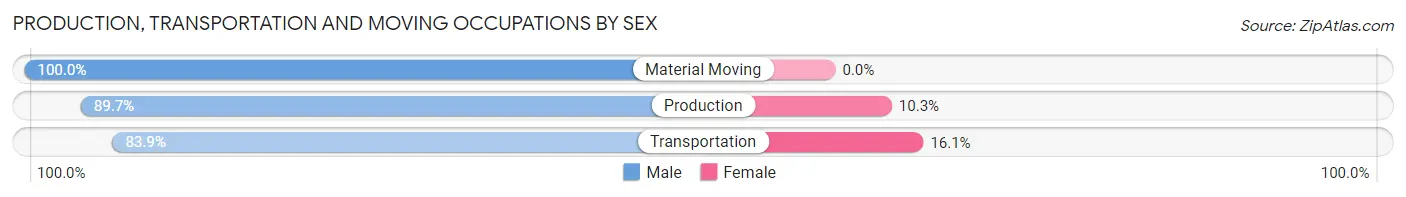
| Occupation | Male | Female |
| Production | 26 (89.7%) | 3 (10.3%) |
| Transportation | 26 (83.9%) | 5 (16.1%) |
| Material Moving | 10 (100.0%) | 0 (0.0%) |
| Total (Category) | 62 (88.6%) | 8 (11.4%) |
| Total (Overall) | 260 (52.5%) | 235 (47.5%) |
Employment Industries by Sex in Hulmeville borough
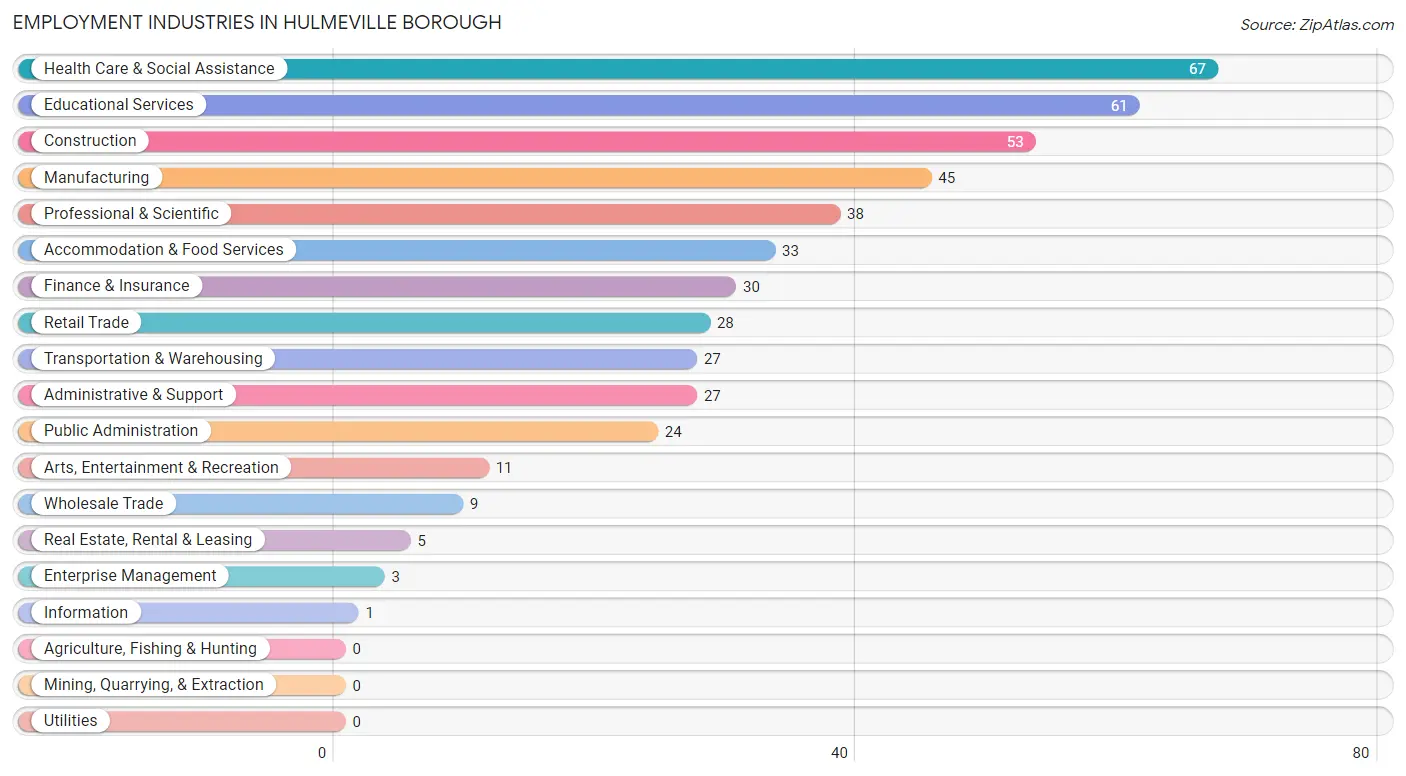
Employment Industries in Hulmeville borough
The major employment industries in Hulmeville borough include Health Care & Social Assistance (67 | 13.5%), Educational Services (61 | 12.3%), Construction (53 | 10.7%), Manufacturing (45 | 9.1%), and Professional & Scientific (38 | 7.7%).
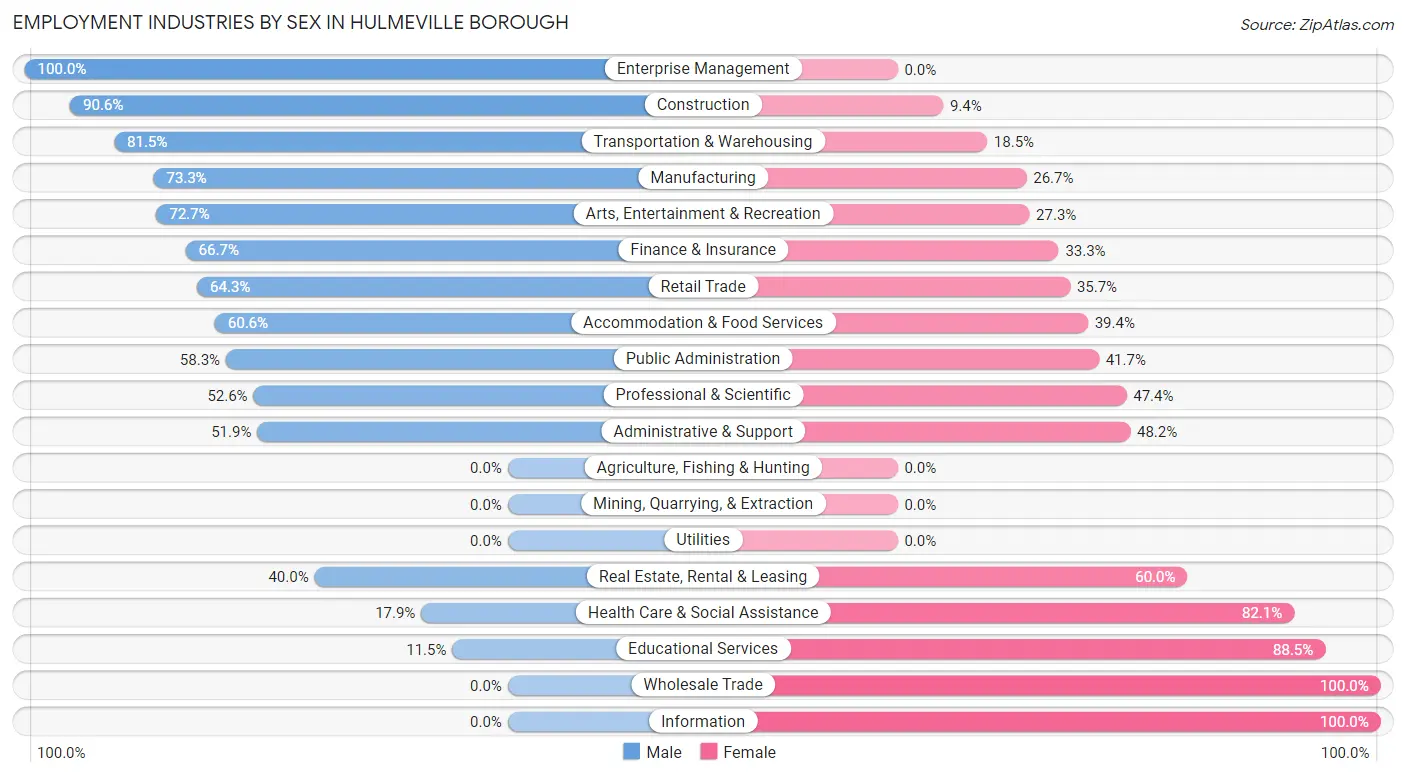
Employment Industries by Sex in Hulmeville borough
The Hulmeville borough industries that see more men than women are Enterprise Management (100.0%), Construction (90.6%), and Transportation & Warehousing (81.5%), whereas the industries that tend to have a higher number of women are Wholesale Trade (100.0%), Information (100.0%), and Educational Services (88.5%).
| Industry | Male | Female |
| Agriculture, Fishing & Hunting | 0 (0.0%) | 0 (0.0%) |
| Mining, Quarrying, & Extraction | 0 (0.0%) | 0 (0.0%) |
| Construction | 48 (90.6%) | 5 (9.4%) |
| Manufacturing | 33 (73.3%) | 12 (26.7%) |
| Wholesale Trade | 0 (0.0%) | 9 (100.0%) |
| Retail Trade | 18 (64.3%) | 10 (35.7%) |
| Transportation & Warehousing | 22 (81.5%) | 5 (18.5%) |
| Utilities | 0 (0.0%) | 0 (0.0%) |
| Information | 0 (0.0%) | 1 (100.0%) |
| Finance & Insurance | 20 (66.7%) | 10 (33.3%) |
| Real Estate, Rental & Leasing | 2 (40.0%) | 3 (60.0%) |
| Professional & Scientific | 20 (52.6%) | 18 (47.4%) |
| Enterprise Management | 3 (100.0%) | 0 (0.0%) |
| Administrative & Support | 14 (51.8%) | 13 (48.1%) |
| Educational Services | 7 (11.5%) | 54 (88.5%) |
| Health Care & Social Assistance | 12 (17.9%) | 55 (82.1%) |
| Arts, Entertainment & Recreation | 8 (72.7%) | 3 (27.3%) |
| Accommodation & Food Services | 20 (60.6%) | 13 (39.4%) |
| Public Administration | 14 (58.3%) | 10 (41.7%) |
| Total | 260 (52.5%) | 235 (47.5%) |
Education in Hulmeville borough
School Enrollment in Hulmeville borough
The most common levels of schooling among the 190 students in Hulmeville borough are middle school (54 | 28.4%), elementary school (49 | 25.8%), and college / undergraduate (32 | 16.8%).
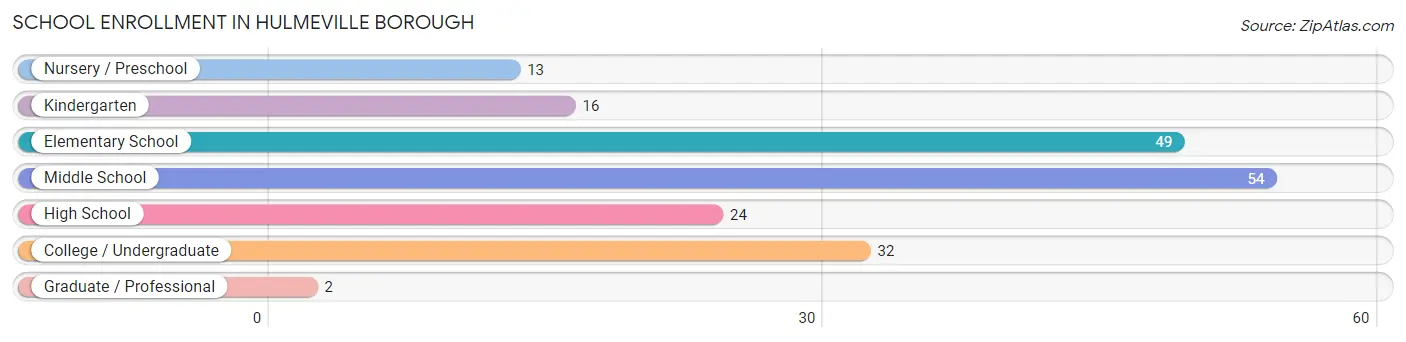
| School Level | # Students | % Students |
| Nursery / Preschool | 13 | 6.8% |
| Kindergarten | 16 | 8.4% |
| Elementary School | 49 | 25.8% |
| Middle School | 54 | 28.4% |
| High School | 24 | 12.6% |
| College / Undergraduate | 32 | 16.8% |
| Graduate / Professional | 2 | 1.1% |
| Total | 190 | 100.0% |
School Enrollment by Age by Funding Source in Hulmeville borough
Out of a total of 190 students who are enrolled in schools in Hulmeville borough, 22 (11.6%) attend a private institution, while the remaining 168 (88.4%) are enrolled in public schools. The age group of 3 to 4 year olds has the highest likelihood of being enrolled in private schools, with 5 (38.5% in the age bracket) enrolled. Conversely, the age group of 15 to 17 year olds has the lowest likelihood of being enrolled in a private school, with 15 (100.0% in the age bracket) attending a public institution.
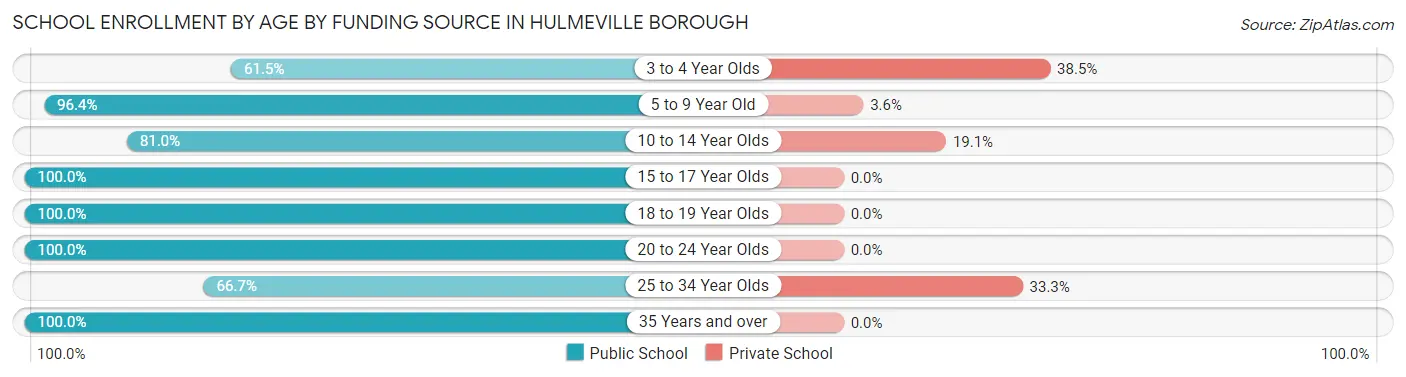
| Age Bracket | Public School | Private School |
| 3 to 4 Year Olds | 8 (61.5%) | 5 (38.5%) |
| 5 to 9 Year Old | 53 (96.4%) | 2 (3.6%) |
| 10 to 14 Year Olds | 51 (80.9%) | 12 (19.1%) |
| 15 to 17 Year Olds | 15 (100.0%) | 0 (0.0%) |
| 18 to 19 Year Olds | 12 (100.0%) | 0 (0.0%) |
| 20 to 24 Year Olds | 16 (100.0%) | 0 (0.0%) |
| 25 to 34 Year Olds | 6 (66.7%) | 3 (33.3%) |
| 35 Years and over | 7 (100.0%) | 0 (0.0%) |
| Total | 168 (88.4%) | 22 (11.6%) |
Educational Attainment by Field of Study in Hulmeville borough
Education (62 | 23.6%), business (59 | 22.4%), social sciences (24 | 9.1%), engineering (23 | 8.7%), and computers & mathematics (15 | 5.7%) are the most common fields of study among 263 individuals in Hulmeville borough who have obtained a bachelor's degree or higher.
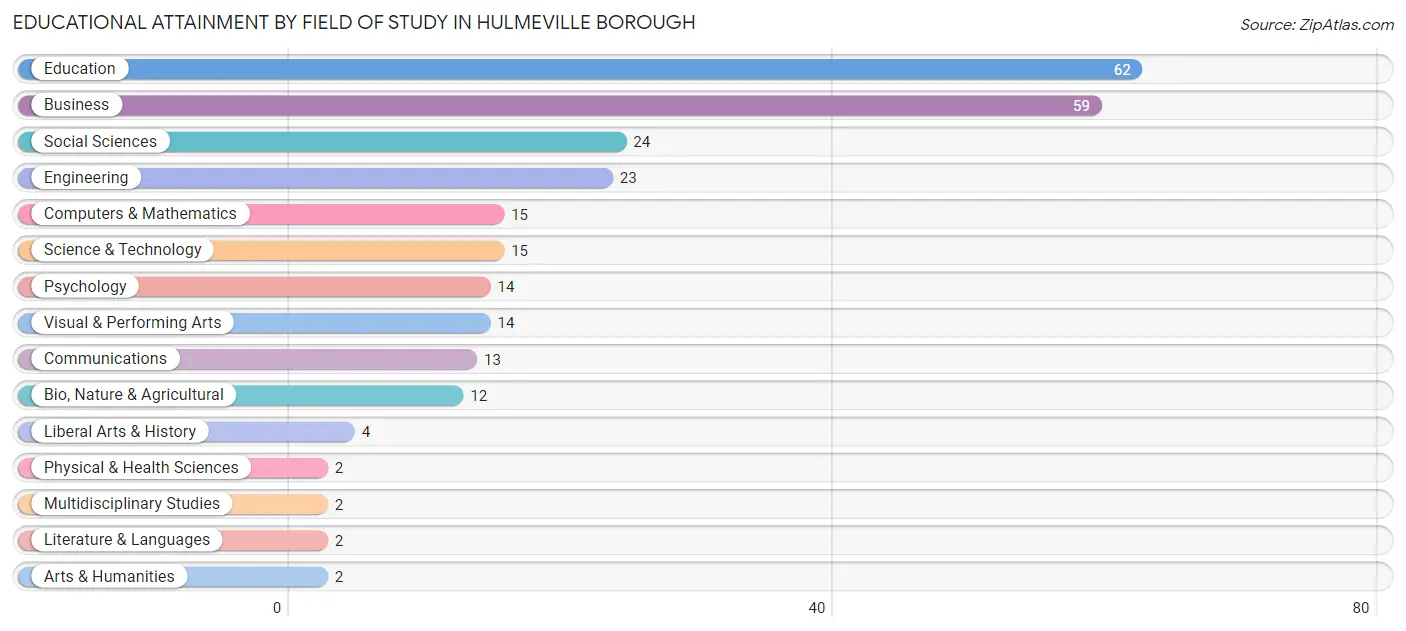
| Field of Study | # Graduates | % Graduates |
| Computers & Mathematics | 15 | 5.7% |
| Bio, Nature & Agricultural | 12 | 4.6% |
| Physical & Health Sciences | 2 | 0.8% |
| Psychology | 14 | 5.3% |
| Social Sciences | 24 | 9.1% |
| Engineering | 23 | 8.7% |
| Multidisciplinary Studies | 2 | 0.8% |
| Science & Technology | 15 | 5.7% |
| Business | 59 | 22.4% |
| Education | 62 | 23.6% |
| Literature & Languages | 2 | 0.8% |
| Liberal Arts & History | 4 | 1.5% |
| Visual & Performing Arts | 14 | 5.3% |
| Communications | 13 | 4.9% |
| Arts & Humanities | 2 | 0.8% |
| Total | 263 | 100.0% |
Transportation & Commute in Hulmeville borough
Vehicle Availability by Sex in Hulmeville borough
The most prevalent vehicle ownership categories in Hulmeville borough are males with 2 vehicles (131, accounting for 51.6%) and females with 2 vehicles (108, making up 57.0%).
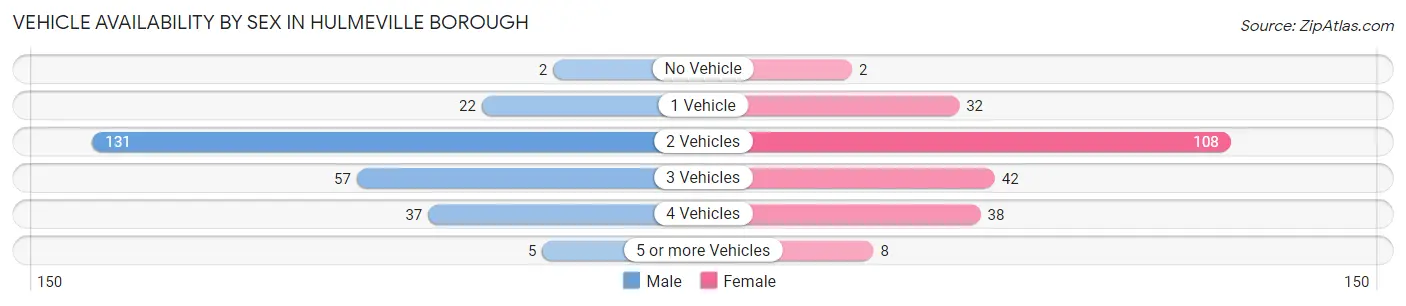
| Vehicles Available | Male | Female |
| No Vehicle | 2 (0.8%) | 2 (0.9%) |
| 1 Vehicle | 22 (8.7%) | 32 (13.9%) |
| 2 Vehicles | 131 (51.6%) | 108 (47.0%) |
| 3 Vehicles | 57 (22.4%) | 42 (18.3%) |
| 4 Vehicles | 37 (14.6%) | 38 (16.5%) |
| 5 or more Vehicles | 5 (2.0%) | 8 (3.5%) |
| Total | 254 (100.0%) | 230 (100.0%) |
Commute Time in Hulmeville borough
The most frequently occuring commute durations in Hulmeville borough are 10 to 14 minutes (95 commuters, 22.8%), 15 to 19 minutes (56 commuters, 13.5%), and 45 to 59 minutes (45 commuters, 10.8%).
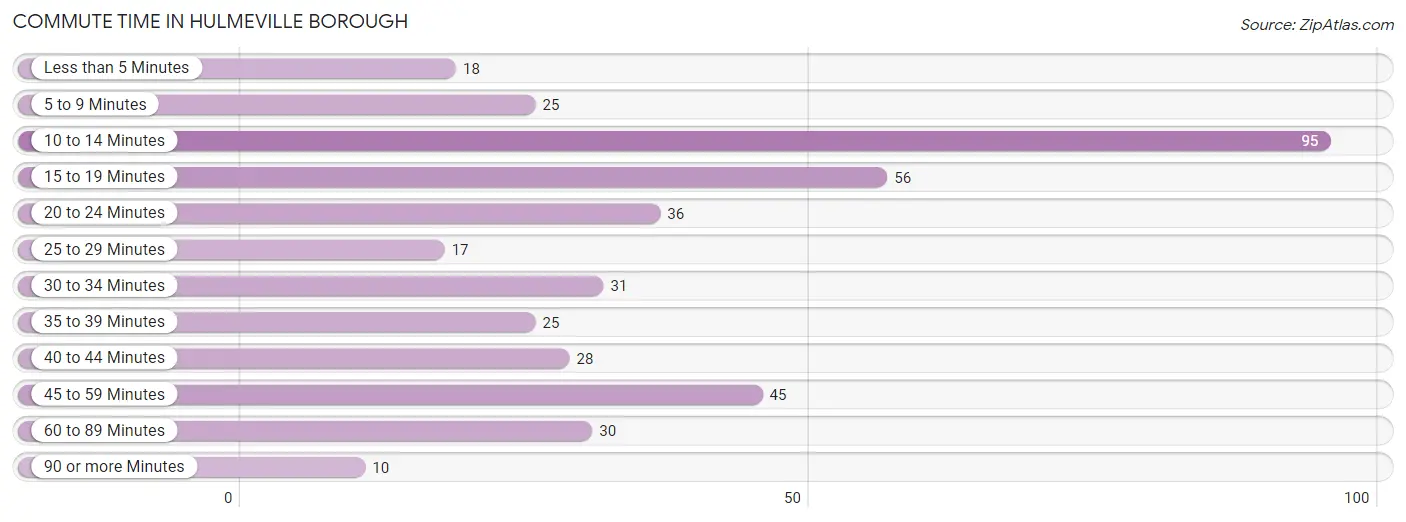
| Commute Time | # Commuters | % Commuters |
| Less than 5 Minutes | 18 | 4.3% |
| 5 to 9 Minutes | 25 | 6.0% |
| 10 to 14 Minutes | 95 | 22.8% |
| 15 to 19 Minutes | 56 | 13.5% |
| 20 to 24 Minutes | 36 | 8.6% |
| 25 to 29 Minutes | 17 | 4.1% |
| 30 to 34 Minutes | 31 | 7.4% |
| 35 to 39 Minutes | 25 | 6.0% |
| 40 to 44 Minutes | 28 | 6.7% |
| 45 to 59 Minutes | 45 | 10.8% |
| 60 to 89 Minutes | 30 | 7.2% |
| 90 or more Minutes | 10 | 2.4% |
Commute Time by Sex in Hulmeville borough
The most common commute times in Hulmeville borough are 10 to 14 minutes (38 commuters, 18.1%) for males and 10 to 14 minutes (57 commuters, 27.7%) for females.
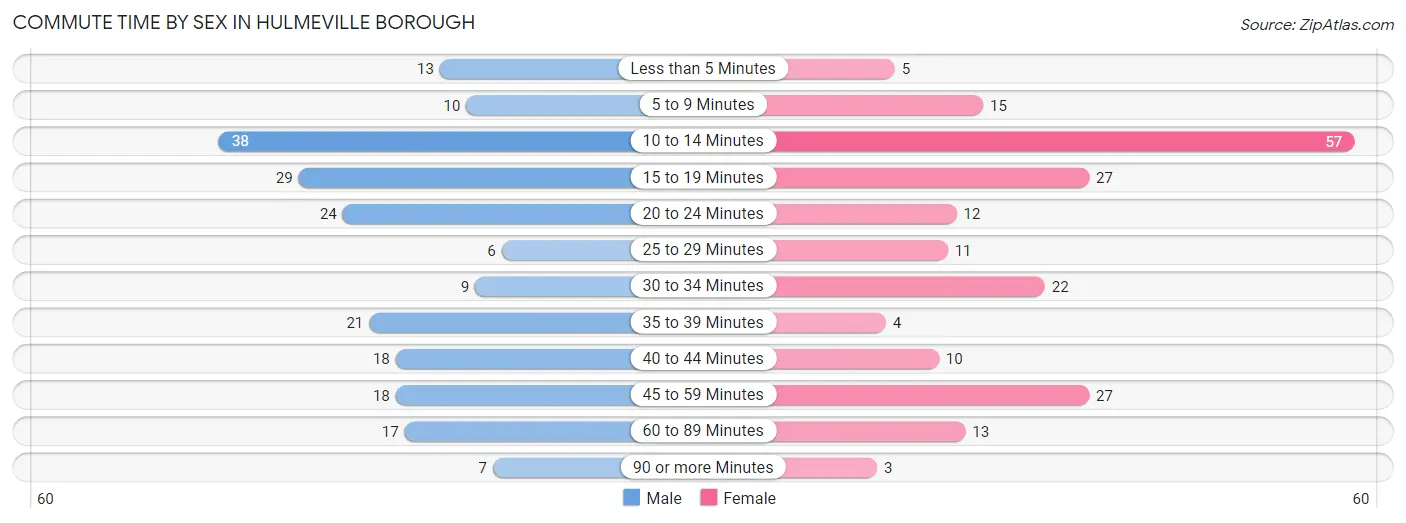
| Commute Time | Male | Female |
| Less than 5 Minutes | 13 (6.2%) | 5 (2.4%) |
| 5 to 9 Minutes | 10 (4.8%) | 15 (7.3%) |
| 10 to 14 Minutes | 38 (18.1%) | 57 (27.7%) |
| 15 to 19 Minutes | 29 (13.8%) | 27 (13.1%) |
| 20 to 24 Minutes | 24 (11.4%) | 12 (5.8%) |
| 25 to 29 Minutes | 6 (2.9%) | 11 (5.3%) |
| 30 to 34 Minutes | 9 (4.3%) | 22 (10.7%) |
| 35 to 39 Minutes | 21 (10.0%) | 4 (1.9%) |
| 40 to 44 Minutes | 18 (8.6%) | 10 (4.9%) |
| 45 to 59 Minutes | 18 (8.6%) | 27 (13.1%) |
| 60 to 89 Minutes | 17 (8.1%) | 13 (6.3%) |
| 90 or more Minutes | 7 (3.3%) | 3 (1.5%) |
Time of Departure to Work by Sex in Hulmeville borough
The most frequent times of departure to work in Hulmeville borough are 6:00 AM to 6:29 AM (34, 16.2%) for males and 7:30 AM to 7:59 AM (44, 21.4%) for females.
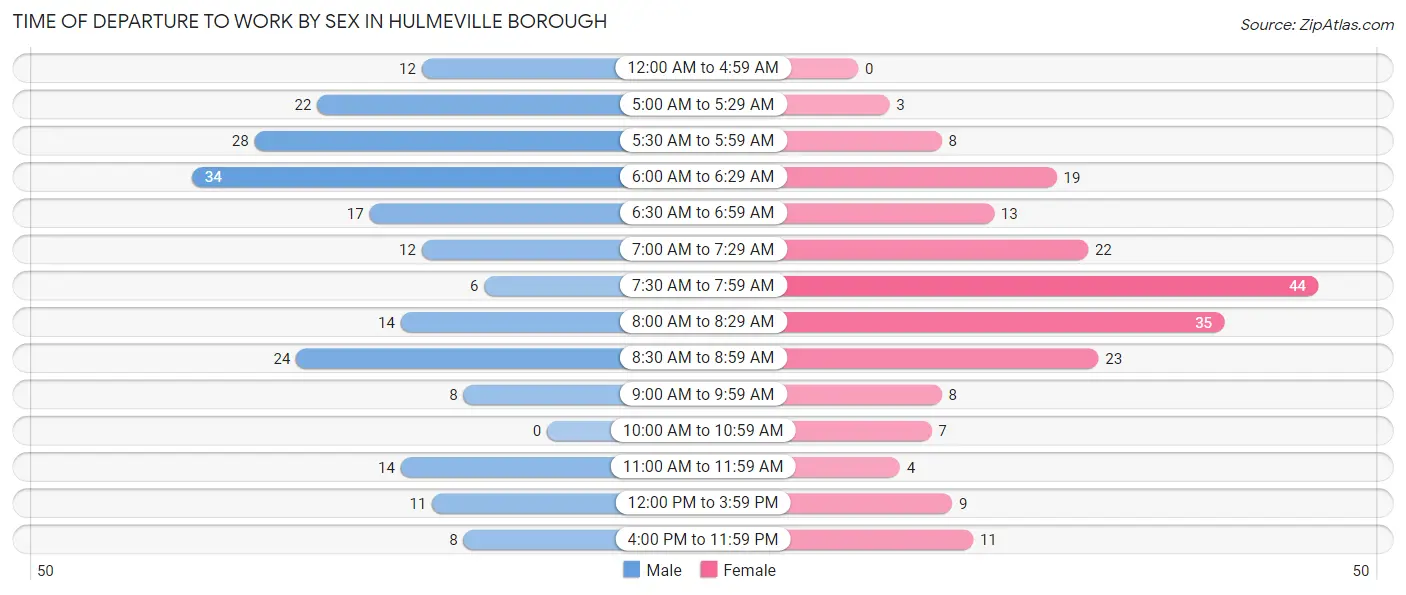
| Time of Departure | Male | Female |
| 12:00 AM to 4:59 AM | 12 (5.7%) | 0 (0.0%) |
| 5:00 AM to 5:29 AM | 22 (10.5%) | 3 (1.5%) |
| 5:30 AM to 5:59 AM | 28 (13.3%) | 8 (3.9%) |
| 6:00 AM to 6:29 AM | 34 (16.2%) | 19 (9.2%) |
| 6:30 AM to 6:59 AM | 17 (8.1%) | 13 (6.3%) |
| 7:00 AM to 7:29 AM | 12 (5.7%) | 22 (10.7%) |
| 7:30 AM to 7:59 AM | 6 (2.9%) | 44 (21.4%) |
| 8:00 AM to 8:29 AM | 14 (6.7%) | 35 (17.0%) |
| 8:30 AM to 8:59 AM | 24 (11.4%) | 23 (11.2%) |
| 9:00 AM to 9:59 AM | 8 (3.8%) | 8 (3.9%) |
| 10:00 AM to 10:59 AM | 0 (0.0%) | 7 (3.4%) |
| 11:00 AM to 11:59 AM | 14 (6.7%) | 4 (1.9%) |
| 12:00 PM to 3:59 PM | 11 (5.2%) | 9 (4.4%) |
| 4:00 PM to 11:59 PM | 8 (3.8%) | 11 (5.3%) |
| Total | 210 (100.0%) | 206 (100.0%) |
Housing Occupancy in Hulmeville borough
Occupancy by Ownership in Hulmeville borough
Of the total 346 dwellings in Hulmeville borough, owner-occupied units account for 292 (84.4%), while renter-occupied units make up 54 (15.6%).
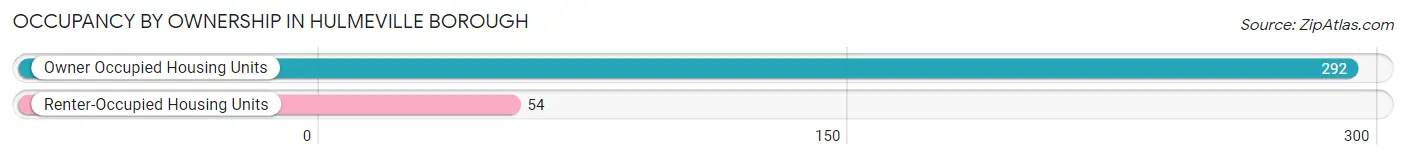
| Occupancy | # Housing Units | % Housing Units |
| Owner Occupied Housing Units | 292 | 84.4% |
| Renter-Occupied Housing Units | 54 | 15.6% |
| Total Occupied Housing Units | 346 | 100.0% |
Occupancy by Household Size in Hulmeville borough
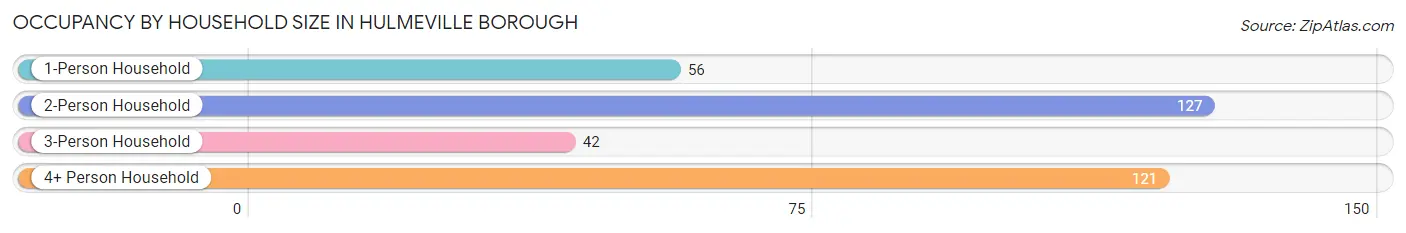
| Household Size | # Housing Units | % Housing Units |
| 1-Person Household | 56 | 16.2% |
| 2-Person Household | 127 | 36.7% |
| 3-Person Household | 42 | 12.1% |
| 4+ Person Household | 121 | 35.0% |
| Total Housing Units | 346 | 100.0% |
Occupancy by Ownership by Household Size in Hulmeville borough
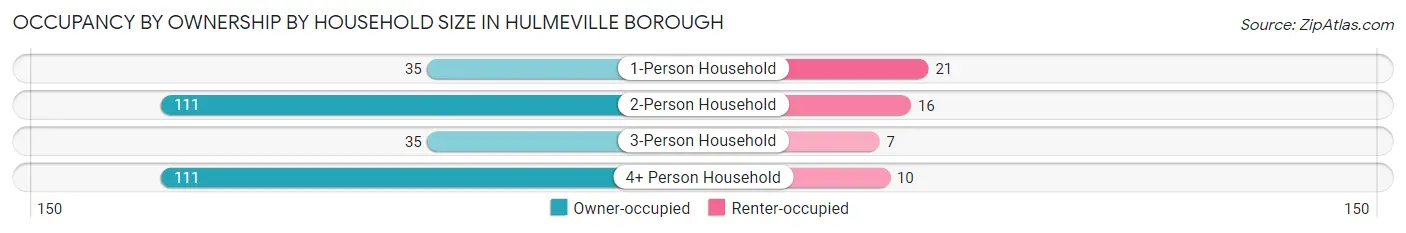
| Household Size | Owner-occupied | Renter-occupied |
| 1-Person Household | 35 (62.5%) | 21 (37.5%) |
| 2-Person Household | 111 (87.4%) | 16 (12.6%) |
| 3-Person Household | 35 (83.3%) | 7 (16.7%) |
| 4+ Person Household | 111 (91.7%) | 10 (8.3%) |
| Total Housing Units | 292 (84.4%) | 54 (15.6%) |
Occupancy by Educational Attainment in Hulmeville borough
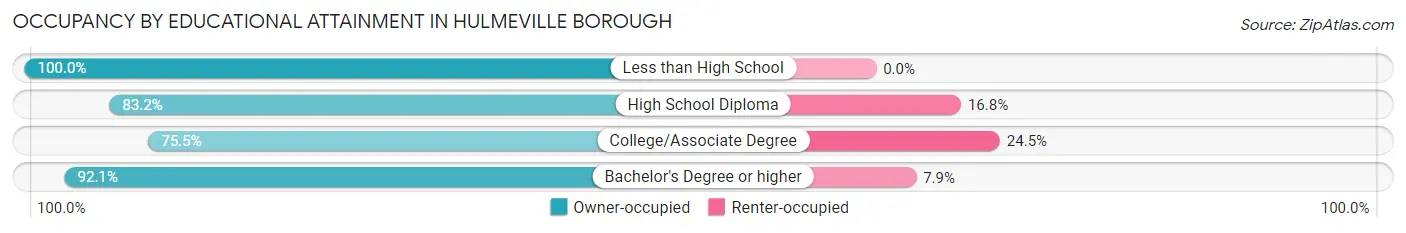
| Household Size | Owner-occupied | Renter-occupied |
| Less than High School | 7 (100.0%) | 0 (0.0%) |
| High School Diploma | 89 (83.2%) | 18 (16.8%) |
| College/Associate Degree | 80 (75.5%) | 26 (24.5%) |
| Bachelor's Degree or higher | 116 (92.1%) | 10 (7.9%) |
Occupancy by Age of Householder in Hulmeville borough
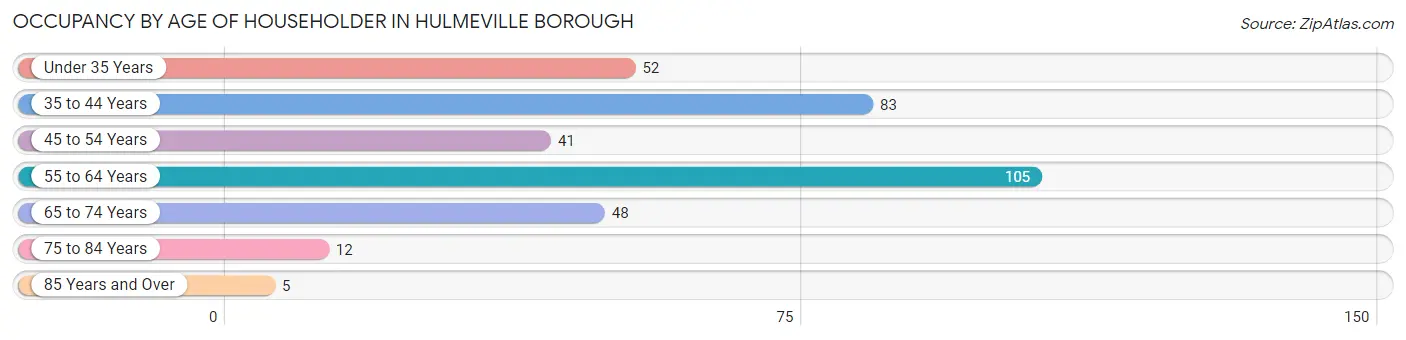
| Age Bracket | # Households | % Households |
| Under 35 Years | 52 | 15.0% |
| 35 to 44 Years | 83 | 24.0% |
| 45 to 54 Years | 41 | 11.8% |
| 55 to 64 Years | 105 | 30.3% |
| 65 to 74 Years | 48 | 13.9% |
| 75 to 84 Years | 12 | 3.5% |
| 85 Years and Over | 5 | 1.5% |
| Total | 346 | 100.0% |
Housing Finances in Hulmeville borough
Median Income by Occupancy in Hulmeville borough
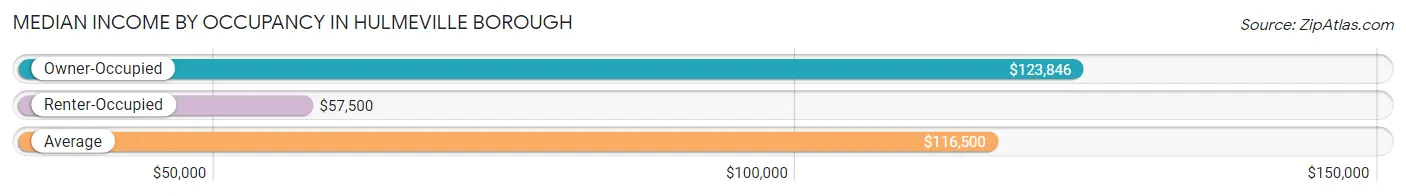
| Occupancy Type | # Households | Median Income |
| Owner-Occupied | 292 (84.4%) | $123,846 |
| Renter-Occupied | 54 (15.6%) | $57,500 |
| Average | 346 (100.0%) | $116,500 |
Occupancy by Householder Income Bracket in Hulmeville borough
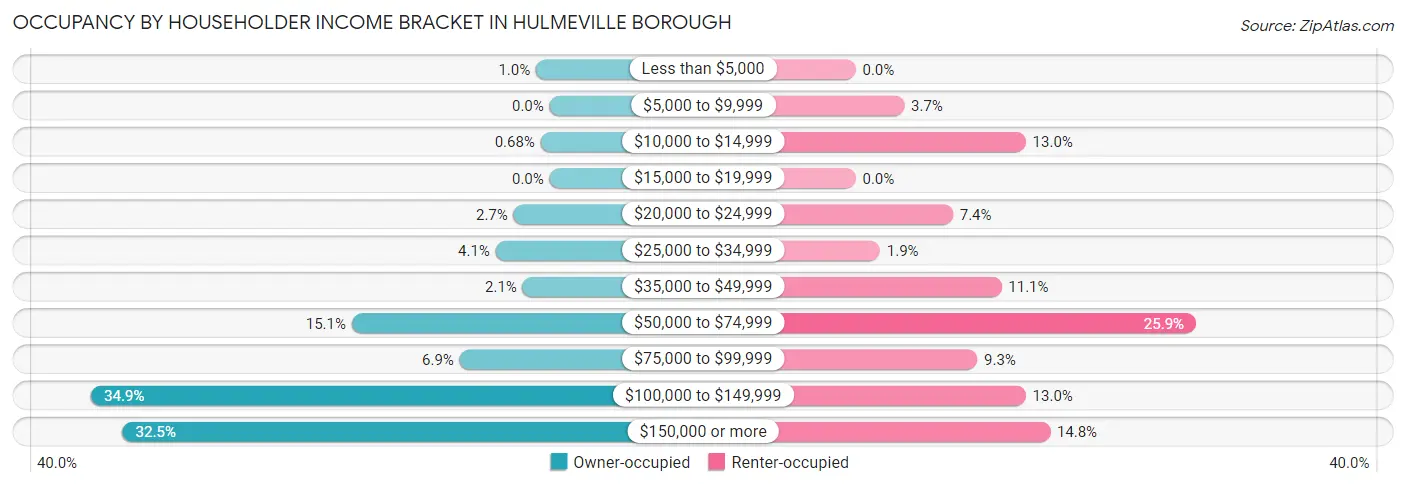
| Income Bracket | Owner-occupied | Renter-occupied |
| Less than $5,000 | 3 (1.0%) | 0 (0.0%) |
| $5,000 to $9,999 | 0 (0.0%) | 2 (3.7%) |
| $10,000 to $14,999 | 2 (0.7%) | 7 (13.0%) |
| $15,000 to $19,999 | 0 (0.0%) | 0 (0.0%) |
| $20,000 to $24,999 | 8 (2.7%) | 4 (7.4%) |
| $25,000 to $34,999 | 12 (4.1%) | 1 (1.8%) |
| $35,000 to $49,999 | 6 (2.1%) | 6 (11.1%) |
| $50,000 to $74,999 | 44 (15.1%) | 14 (25.9%) |
| $75,000 to $99,999 | 20 (6.9%) | 5 (9.3%) |
| $100,000 to $149,999 | 102 (34.9%) | 7 (13.0%) |
| $150,000 or more | 95 (32.5%) | 8 (14.8%) |
| Total | 292 (100.0%) | 54 (100.0%) |
Monthly Housing Cost Tiers in Hulmeville borough
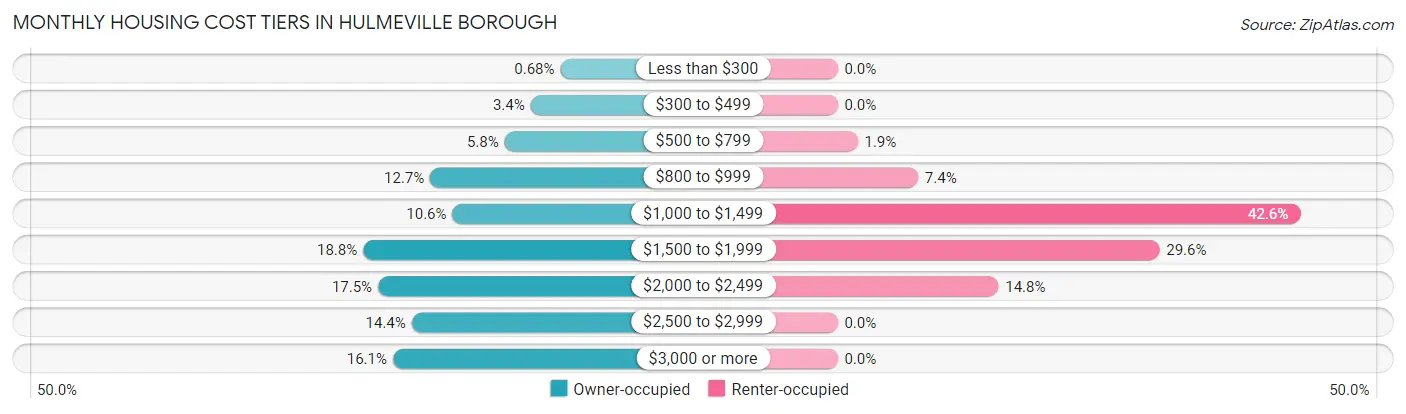
| Monthly Cost | Owner-occupied | Renter-occupied |
| Less than $300 | 2 (0.7%) | 0 (0.0%) |
| $300 to $499 | 10 (3.4%) | 0 (0.0%) |
| $500 to $799 | 17 (5.8%) | 1 (1.8%) |
| $800 to $999 | 37 (12.7%) | 4 (7.4%) |
| $1,000 to $1,499 | 31 (10.6%) | 23 (42.6%) |
| $1,500 to $1,999 | 55 (18.8%) | 16 (29.6%) |
| $2,000 to $2,499 | 51 (17.5%) | 8 (14.8%) |
| $2,500 to $2,999 | 42 (14.4%) | 0 (0.0%) |
| $3,000 or more | 47 (16.1%) | 0 (0.0%) |
| Total | 292 (100.0%) | 54 (100.0%) |
Physical Housing Characteristics in Hulmeville borough
Housing Structures in Hulmeville borough
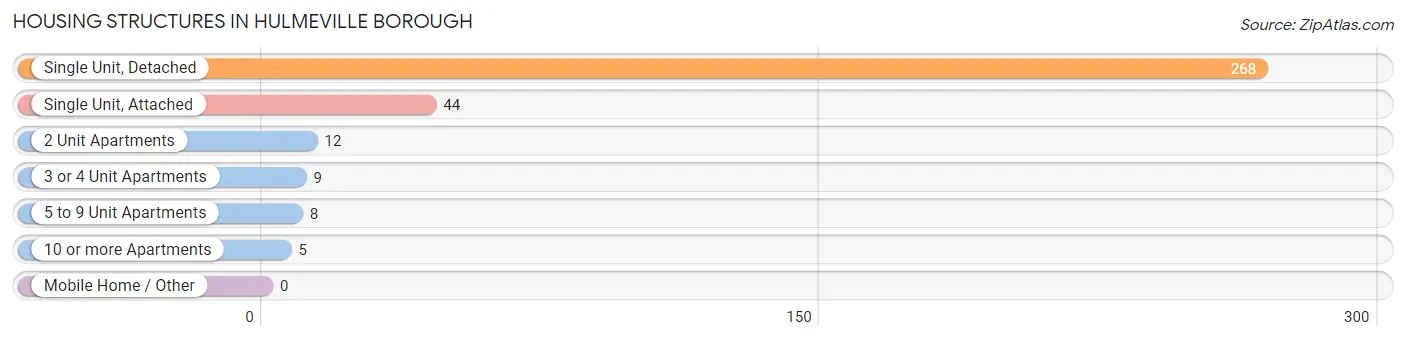
| Structure Type | # Housing Units | % Housing Units |
| Single Unit, Detached | 268 | 77.5% |
| Single Unit, Attached | 44 | 12.7% |
| 2 Unit Apartments | 12 | 3.5% |
| 3 or 4 Unit Apartments | 9 | 2.6% |
| 5 to 9 Unit Apartments | 8 | 2.3% |
| 10 or more Apartments | 5 | 1.5% |
| Mobile Home / Other | 0 | 0.0% |
| Total | 346 | 100.0% |
Housing Structures by Occupancy in Hulmeville borough
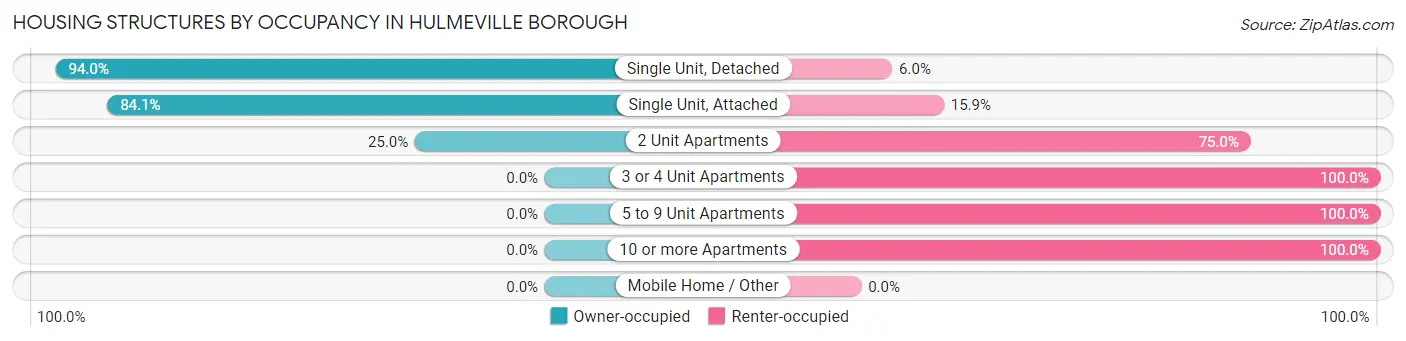
| Structure Type | Owner-occupied | Renter-occupied |
| Single Unit, Detached | 252 (94.0%) | 16 (6.0%) |
| Single Unit, Attached | 37 (84.1%) | 7 (15.9%) |
| 2 Unit Apartments | 3 (25.0%) | 9 (75.0%) |
| 3 or 4 Unit Apartments | 0 (0.0%) | 9 (100.0%) |
| 5 to 9 Unit Apartments | 0 (0.0%) | 8 (100.0%) |
| 10 or more Apartments | 0 (0.0%) | 5 (100.0%) |
| Mobile Home / Other | 0 (0.0%) | 0 (0.0%) |
| Total | 292 (84.4%) | 54 (15.6%) |
Housing Structures by Number of Rooms in Hulmeville borough
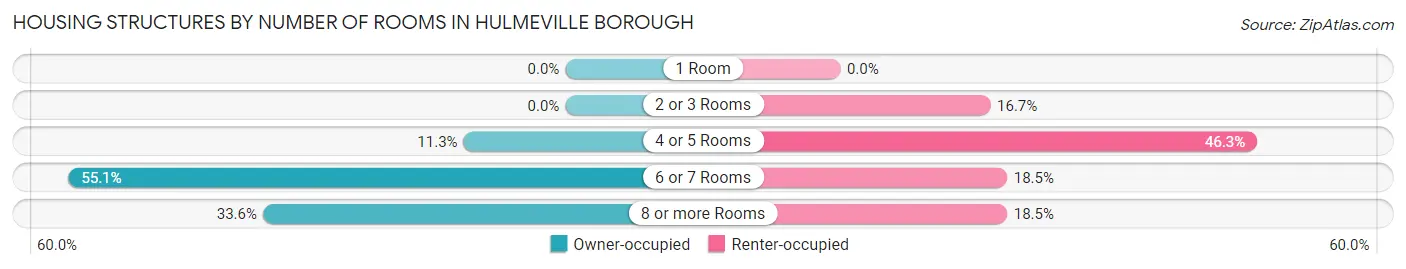
| Number of Rooms | Owner-occupied | Renter-occupied |
| 1 Room | 0 (0.0%) | 0 (0.0%) |
| 2 or 3 Rooms | 0 (0.0%) | 9 (16.7%) |
| 4 or 5 Rooms | 33 (11.3%) | 25 (46.3%) |
| 6 or 7 Rooms | 161 (55.1%) | 10 (18.5%) |
| 8 or more Rooms | 98 (33.6%) | 10 (18.5%) |
| Total | 292 (100.0%) | 54 (100.0%) |
Housing Structure by Heating Type in Hulmeville borough
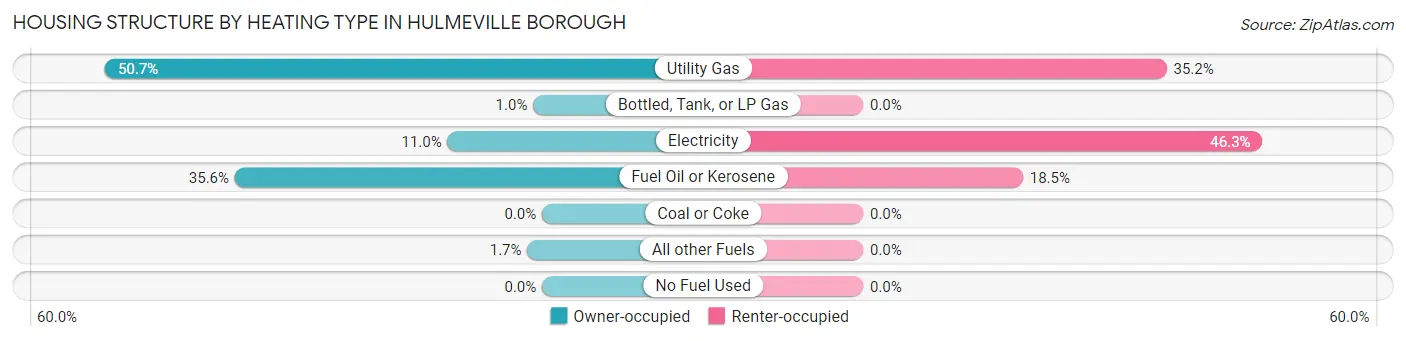
| Heating Type | Owner-occupied | Renter-occupied |
| Utility Gas | 148 (50.7%) | 19 (35.2%) |
| Bottled, Tank, or LP Gas | 3 (1.0%) | 0 (0.0%) |
| Electricity | 32 (11.0%) | 25 (46.3%) |
| Fuel Oil or Kerosene | 104 (35.6%) | 10 (18.5%) |
| Coal or Coke | 0 (0.0%) | 0 (0.0%) |
| All other Fuels | 5 (1.7%) | 0 (0.0%) |
| No Fuel Used | 0 (0.0%) | 0 (0.0%) |
| Total | 292 (100.0%) | 54 (100.0%) |
Household Vehicle Usage in Hulmeville borough
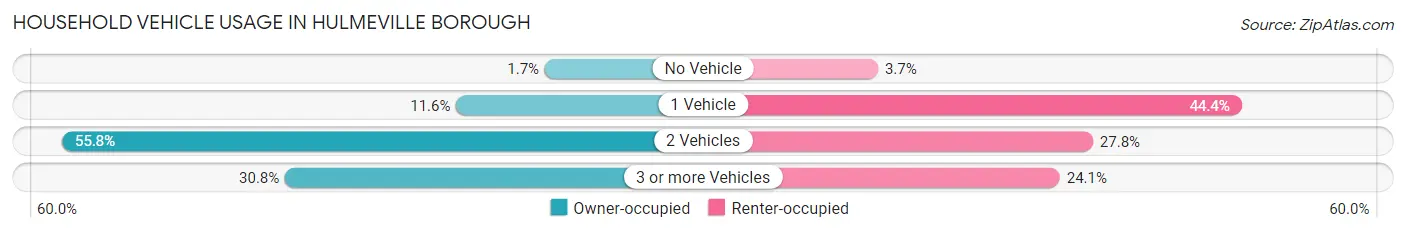
| Vehicles per Household | Owner-occupied | Renter-occupied |
| No Vehicle | 5 (1.7%) | 2 (3.7%) |
| 1 Vehicle | 34 (11.6%) | 24 (44.4%) |
| 2 Vehicles | 163 (55.8%) | 15 (27.8%) |
| 3 or more Vehicles | 90 (30.8%) | 13 (24.1%) |
| Total | 292 (100.0%) | 54 (100.0%) |
Real Estate & Mortgages in Hulmeville borough
Real Estate and Mortgage Overview in Hulmeville borough
| Characteristic | Without Mortgage | With Mortgage |
| Housing Units | 75 | 217 |
| Median Property Value | $302,200 | $350,000 |
| Median Household Income | $81,250 | $87 |
| Monthly Housing Costs | $854 | $47 |
| Real Estate Taxes | $5,679 | $2 |
Property Value by Mortgage Status in Hulmeville borough
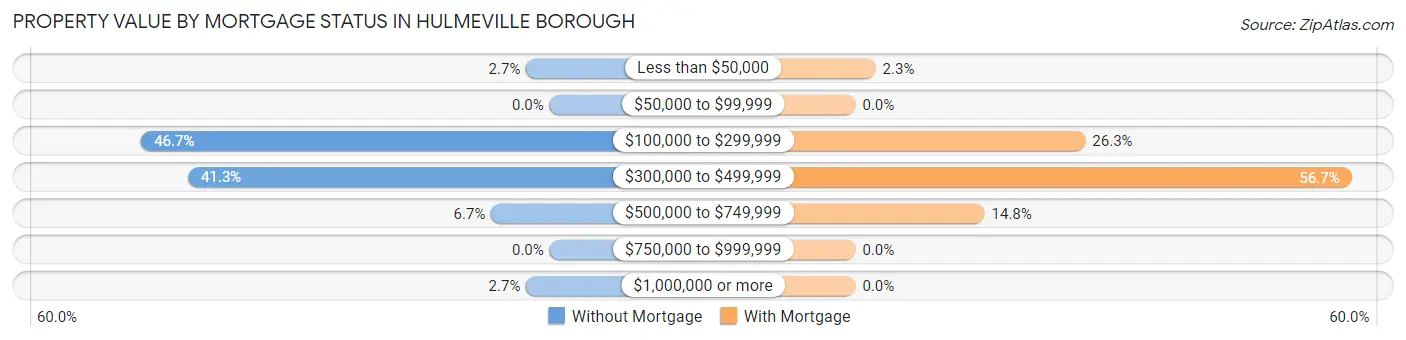
| Property Value | Without Mortgage | With Mortgage |
| Less than $50,000 | 2 (2.7%) | 5 (2.3%) |
| $50,000 to $99,999 | 0 (0.0%) | 0 (0.0%) |
| $100,000 to $299,999 | 35 (46.7%) | 57 (26.3%) |
| $300,000 to $499,999 | 31 (41.3%) | 123 (56.7%) |
| $500,000 to $749,999 | 5 (6.7%) | 32 (14.7%) |
| $750,000 to $999,999 | 0 (0.0%) | 0 (0.0%) |
| $1,000,000 or more | 2 (2.7%) | 0 (0.0%) |
| Total | 75 (100.0%) | 217 (100.0%) |
Household Income by Mortgage Status in Hulmeville borough
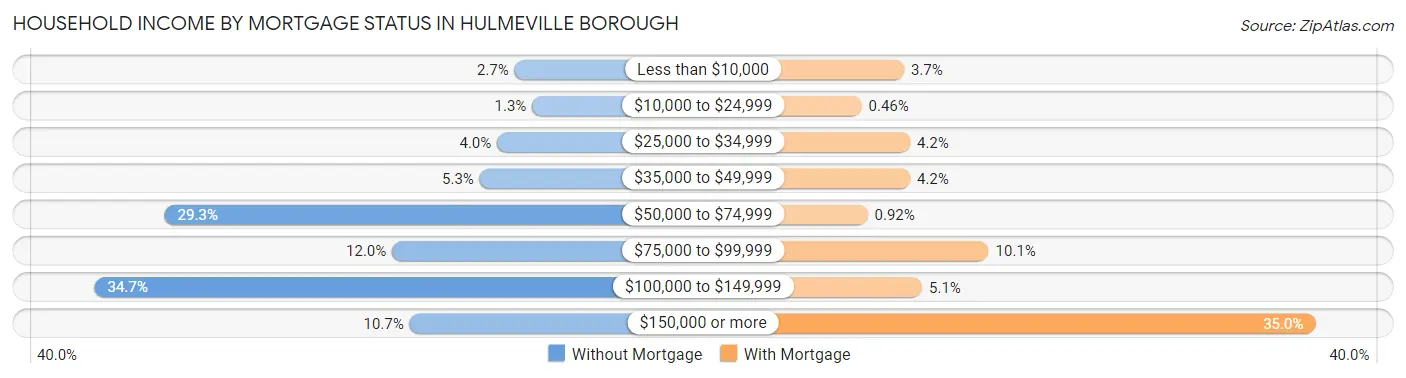
| Household Income | Without Mortgage | With Mortgage |
| Less than $10,000 | 2 (2.7%) | 8 (3.7%) |
| $10,000 to $24,999 | 1 (1.3%) | 1 (0.5%) |
| $25,000 to $34,999 | 3 (4.0%) | 9 (4.2%) |
| $35,000 to $49,999 | 4 (5.3%) | 9 (4.2%) |
| $50,000 to $74,999 | 22 (29.3%) | 2 (0.9%) |
| $75,000 to $99,999 | 9 (12.0%) | 22 (10.1%) |
| $100,000 to $149,999 | 26 (34.7%) | 11 (5.1%) |
| $150,000 or more | 8 (10.7%) | 76 (35.0%) |
| Total | 75 (100.0%) | 217 (100.0%) |
Property Value to Household Income Ratio in Hulmeville borough
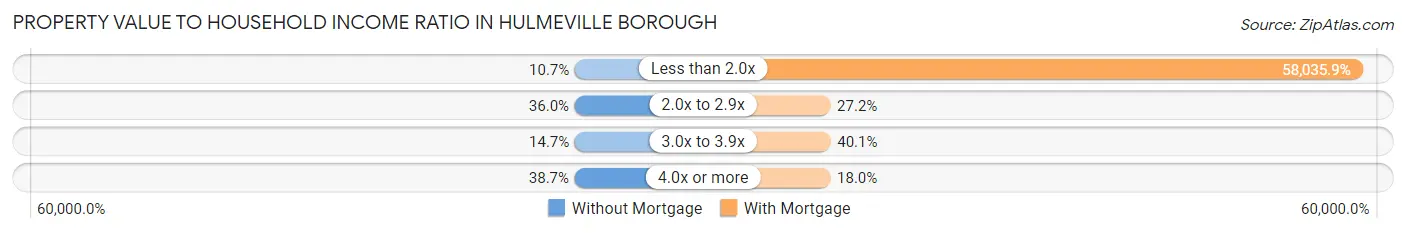
| Value-to-Income Ratio | Without Mortgage | With Mortgage |
| Less than 2.0x | 8 (10.7%) | 125,938 (58,035.9%) |
| 2.0x to 2.9x | 27 (36.0%) | 59 (27.2%) |
| 3.0x to 3.9x | 11 (14.7%) | 87 (40.1%) |
| 4.0x or more | 29 (38.7%) | 39 (18.0%) |
| Total | 75 (100.0%) | 217 (100.0%) |
Real Estate Taxes by Mortgage Status in Hulmeville borough
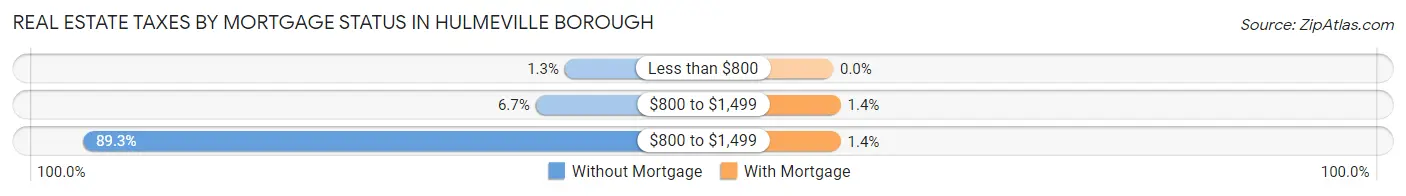
| Property Taxes | Without Mortgage | With Mortgage |
| Less than $800 | 1 (1.3%) | 0 (0.0%) |
| $800 to $1,499 | 5 (6.7%) | 3 (1.4%) |
| $800 to $1,499 | 67 (89.3%) | 3 (1.4%) |
| Total | 75 (100.0%) | 217 (100.0%) |
Health & Disability in Hulmeville borough
Health Insurance Coverage by Age in Hulmeville borough
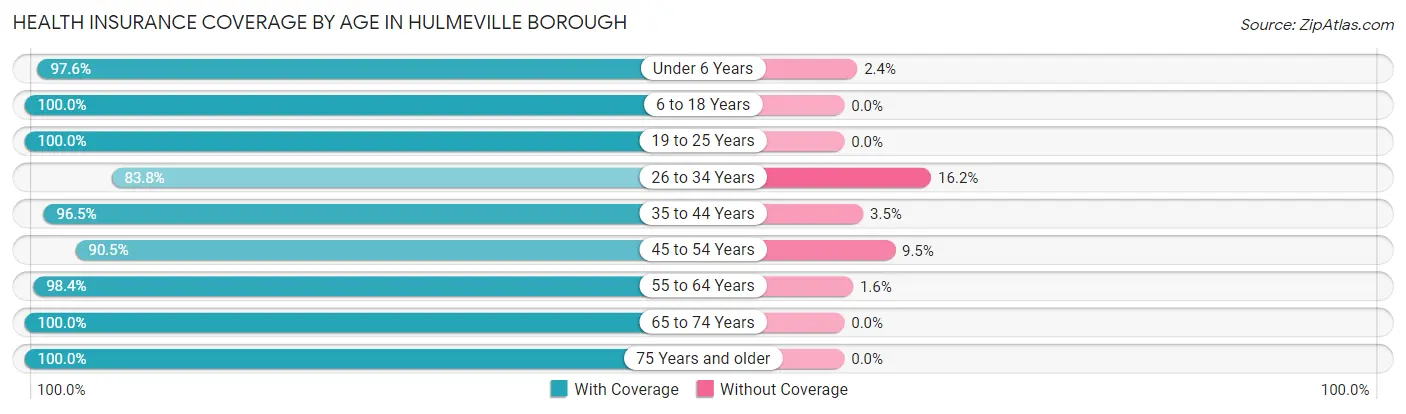
| Age Bracket | With Coverage | Without Coverage |
| Under 6 Years | 81 (97.6%) | 2 (2.4%) |
| 6 to 18 Years | 135 (100.0%) | 0 (0.0%) |
| 19 to 25 Years | 66 (100.0%) | 0 (0.0%) |
| 26 to 34 Years | 119 (83.8%) | 23 (16.2%) |
| 35 to 44 Years | 165 (96.5%) | 6 (3.5%) |
| 45 to 54 Years | 67 (90.5%) | 7 (9.5%) |
| 55 to 64 Years | 183 (98.4%) | 3 (1.6%) |
| 65 to 74 Years | 74 (100.0%) | 0 (0.0%) |
| 75 Years and older | 22 (100.0%) | 0 (0.0%) |
| Total | 912 (95.7%) | 41 (4.3%) |
Health Insurance Coverage by Citizenship Status in Hulmeville borough
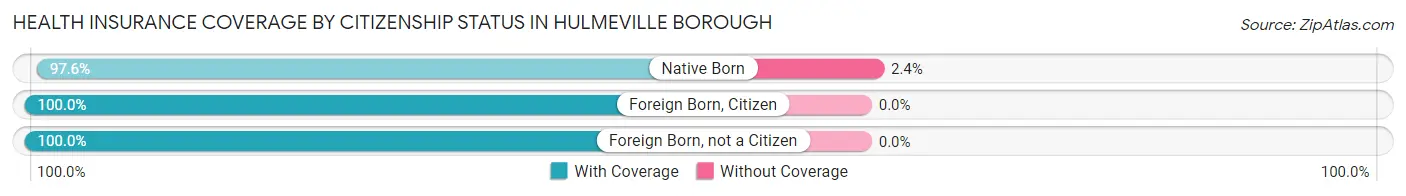
| Citizenship Status | With Coverage | Without Coverage |
| Native Born | 81 (97.6%) | 2 (2.4%) |
| Foreign Born, Citizen | 135 (100.0%) | 0 (0.0%) |
| Foreign Born, not a Citizen | 66 (100.0%) | 0 (0.0%) |
Health Insurance Coverage by Household Income in Hulmeville borough
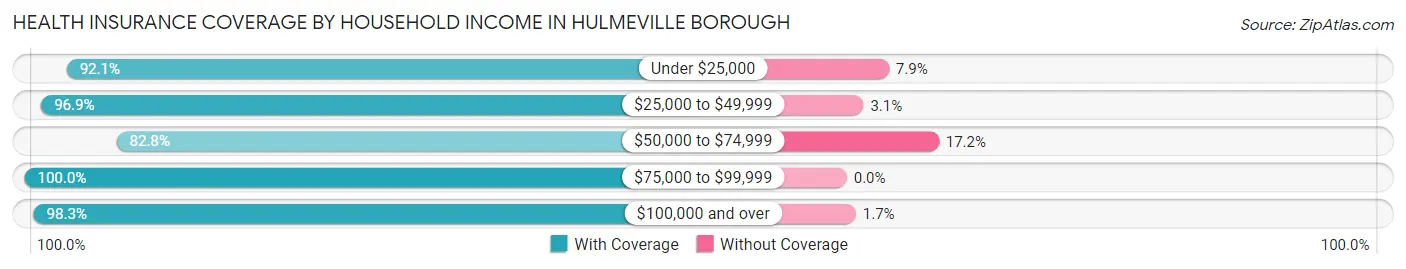
| Household Income | With Coverage | Without Coverage |
| Under $25,000 | 35 (92.1%) | 3 (7.9%) |
| $25,000 to $49,999 | 62 (96.9%) | 2 (3.1%) |
| $50,000 to $74,999 | 120 (82.8%) | 25 (17.2%) |
| $75,000 to $99,999 | 58 (100.0%) | 0 (0.0%) |
| $100,000 and over | 637 (98.3%) | 11 (1.7%) |
Public vs Private Health Insurance Coverage by Age in Hulmeville borough
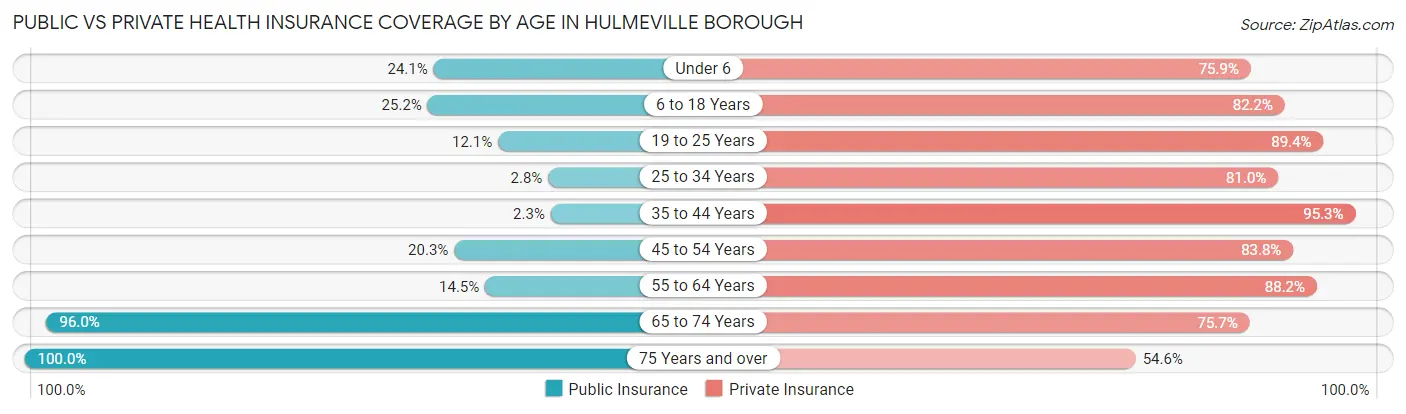
| Age Bracket | Public Insurance | Private Insurance |
| Under 6 | 20 (24.1%) | 63 (75.9%) |
| 6 to 18 Years | 34 (25.2%) | 111 (82.2%) |
| 19 to 25 Years | 8 (12.1%) | 59 (89.4%) |
| 25 to 34 Years | 4 (2.8%) | 115 (81.0%) |
| 35 to 44 Years | 4 (2.3%) | 163 (95.3%) |
| 45 to 54 Years | 15 (20.3%) | 62 (83.8%) |
| 55 to 64 Years | 27 (14.5%) | 164 (88.2%) |
| 65 to 74 Years | 71 (96.0%) | 56 (75.7%) |
| 75 Years and over | 22 (100.0%) | 12 (54.5%) |
| Total | 205 (21.5%) | 805 (84.5%) |
Disability Status by Sex by Age in Hulmeville borough
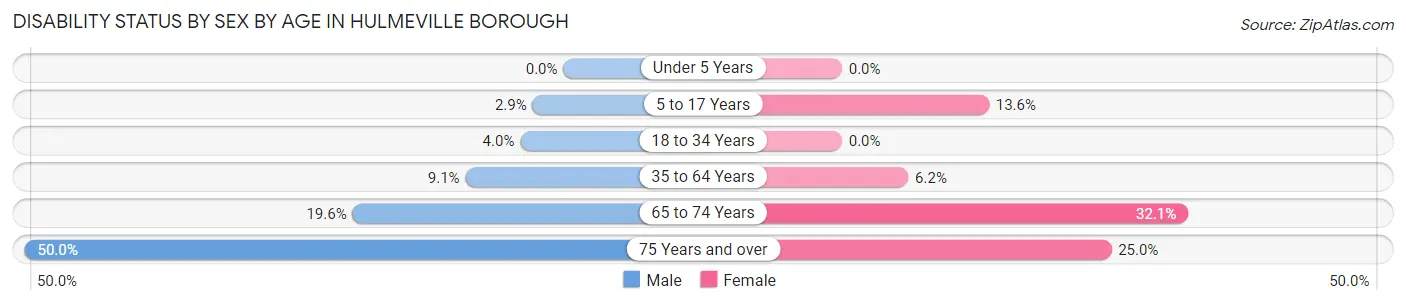
| Age Bracket | Male | Female |
| Under 5 Years | 0 (0.0%) | 0 (0.0%) |
| 5 to 17 Years | 2 (2.9%) | 9 (13.6%) |
| 18 to 34 Years | 5 (4.0%) | 0 (0.0%) |
| 35 to 64 Years | 20 (9.1%) | 13 (6.2%) |
| 65 to 74 Years | 9 (19.6%) | 9 (32.1%) |
| 75 Years and over | 7 (50.0%) | 2 (25.0%) |
Disability Class by Sex by Age in Hulmeville borough
Disability Class: Hearing Difficulty
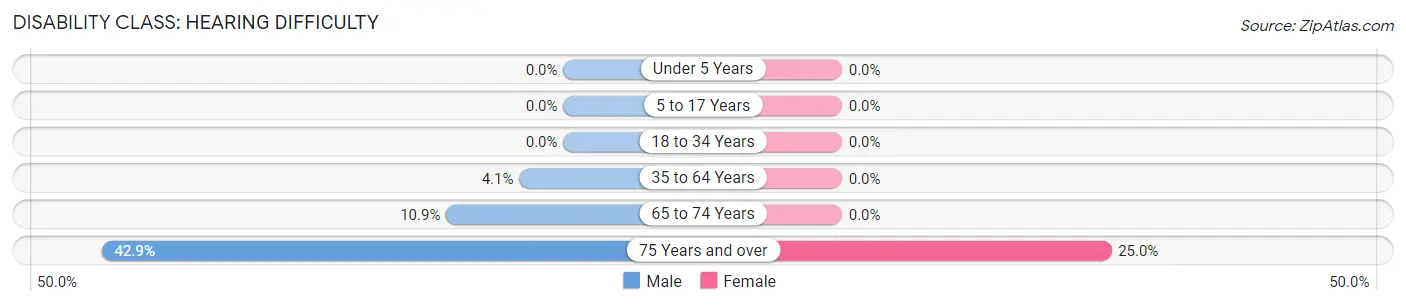
| Age Bracket | Male | Female |
| Under 5 Years | 0 (0.0%) | 0 (0.0%) |
| 5 to 17 Years | 0 (0.0%) | 0 (0.0%) |
| 18 to 34 Years | 0 (0.0%) | 0 (0.0%) |
| 35 to 64 Years | 9 (4.1%) | 0 (0.0%) |
| 65 to 74 Years | 5 (10.9%) | 0 (0.0%) |
| 75 Years and over | 6 (42.9%) | 2 (25.0%) |
Disability Class: Vision Difficulty
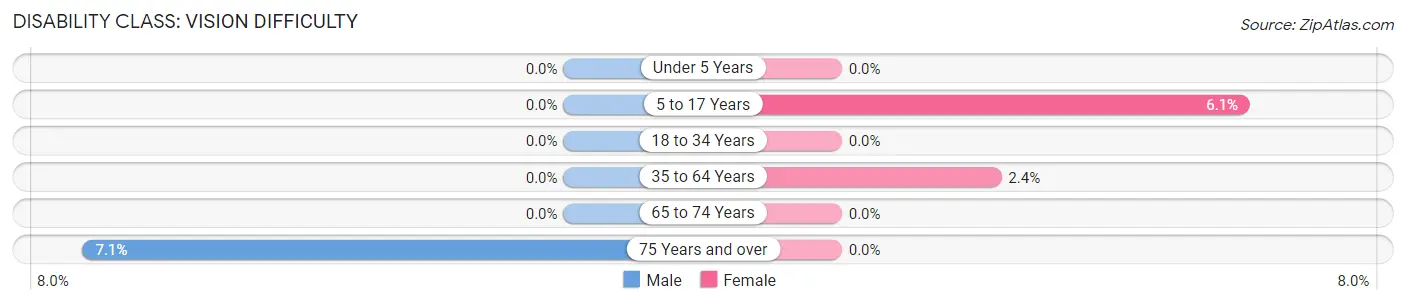
| Age Bracket | Male | Female |
| Under 5 Years | 0 (0.0%) | 0 (0.0%) |
| 5 to 17 Years | 0 (0.0%) | 4 (6.1%) |
| 18 to 34 Years | 0 (0.0%) | 0 (0.0%) |
| 35 to 64 Years | 0 (0.0%) | 5 (2.4%) |
| 65 to 74 Years | 0 (0.0%) | 0 (0.0%) |
| 75 Years and over | 1 (7.1%) | 0 (0.0%) |
Disability Class: Cognitive Difficulty
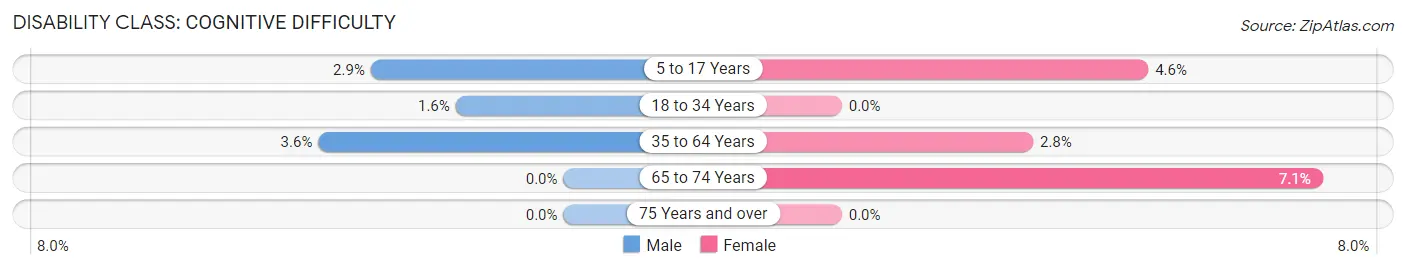
| Age Bracket | Male | Female |
| 5 to 17 Years | 2 (2.9%) | 3 (4.5%) |
| 18 to 34 Years | 2 (1.6%) | 0 (0.0%) |
| 35 to 64 Years | 8 (3.6%) | 6 (2.8%) |
| 65 to 74 Years | 0 (0.0%) | 2 (7.1%) |
| 75 Years and over | 0 (0.0%) | 0 (0.0%) |
Disability Class: Ambulatory Difficulty
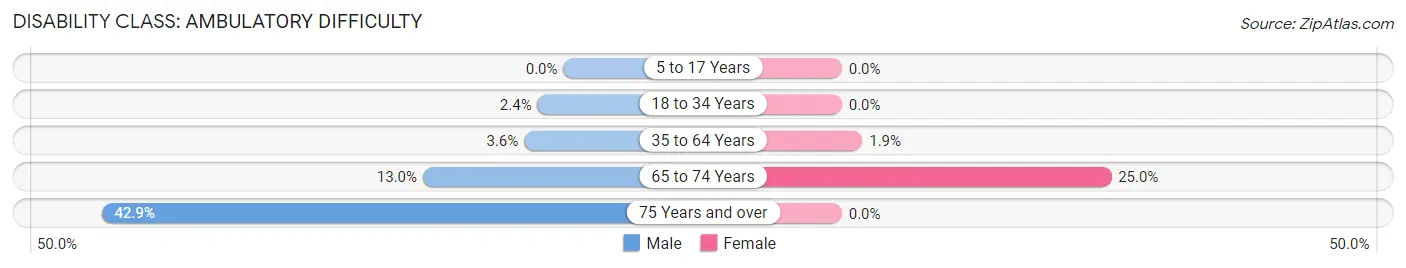
| Age Bracket | Male | Female |
| 5 to 17 Years | 0 (0.0%) | 0 (0.0%) |
| 18 to 34 Years | 3 (2.4%) | 0 (0.0%) |
| 35 to 64 Years | 8 (3.6%) | 4 (1.9%) |
| 65 to 74 Years | 6 (13.0%) | 7 (25.0%) |
| 75 Years and over | 6 (42.9%) | 0 (0.0%) |
Disability Class: Self-Care Difficulty
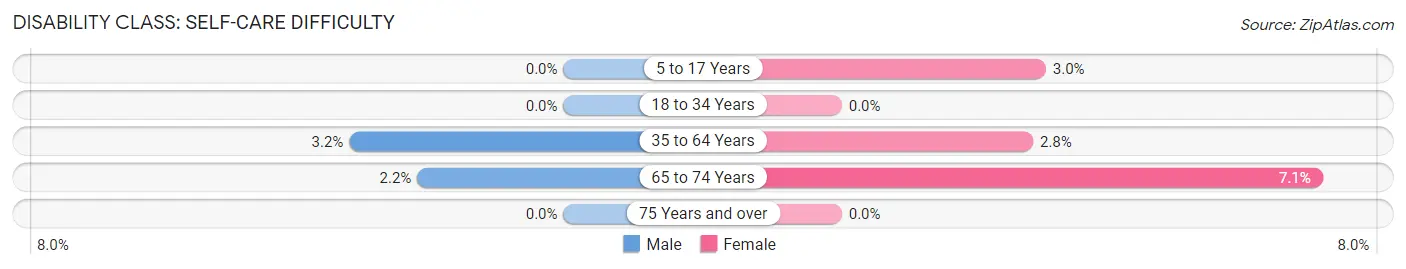
| Age Bracket | Male | Female |
| 5 to 17 Years | 0 (0.0%) | 2 (3.0%) |
| 18 to 34 Years | 0 (0.0%) | 0 (0.0%) |
| 35 to 64 Years | 7 (3.2%) | 6 (2.8%) |
| 65 to 74 Years | 1 (2.2%) | 2 (7.1%) |
| 75 Years and over | 0 (0.0%) | 0 (0.0%) |
Technology Access in Hulmeville borough
Computing Device Access in Hulmeville borough
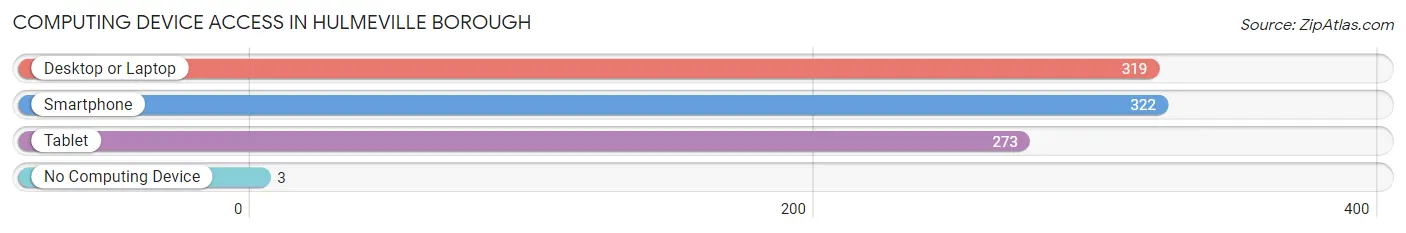
| Device Type | # Households | % Households |
| Desktop or Laptop | 319 | 92.2% |
| Smartphone | 322 | 93.1% |
| Tablet | 273 | 78.9% |
| No Computing Device | 3 | 0.9% |
| Total | 346 | 100.0% |
Internet Access in Hulmeville borough
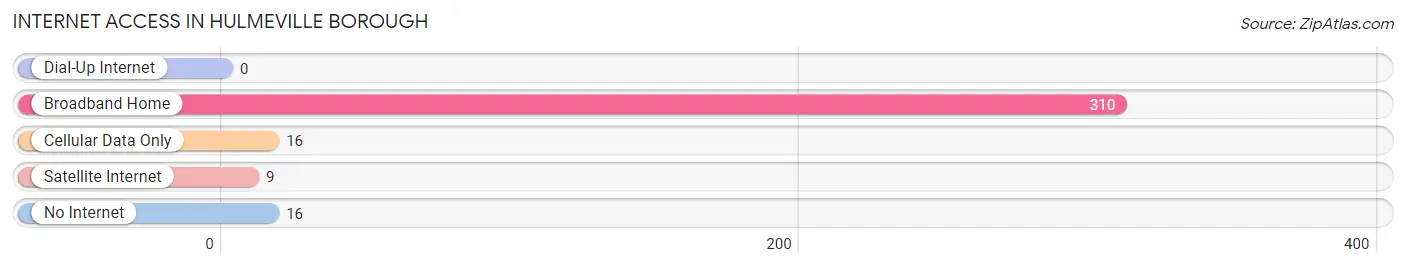
| Internet Type | # Households | % Households |
| Dial-Up Internet | 0 | 0.0% |
| Broadband Home | 310 | 89.6% |
| Cellular Data Only | 16 | 4.6% |
| Satellite Internet | 9 | 2.6% |
| No Internet | 16 | 4.6% |
| Total | 346 | 100.0% |
Hulmeville borough Summary
Hulmeville Borough is a small borough located in Bucks County, Pennsylvania. It is situated in the northeast corner of the county, just south of the city of Philadelphia. The borough is bordered by Middletown Township to the north, Northampton Township to the east, and Bristol Township to the south and west. The population of Hulmeville Borough was 2,845 at the 2010 census.
History
Hulmeville Borough was originally part of Middletown Township, which was established in 1692. The area was first settled in the early 1700s by a Quaker family named Hulme. The Hulme family owned a large tract of land in the area, which was eventually divided into smaller parcels and sold to other settlers. In 1876, the area was incorporated as a borough, and was named after the Hulme family.
Geography
Hulmeville Borough is located at 40°7'45" North, 74°55'45" West (40.129167, -74.929167). It has a total area of 0.7 square miles, all of which is land. The borough is located in the Delaware Valley, and is part of the Philadelphia metropolitan area.
Economy
Hulmeville Borough is primarily a residential community, with no major industries or businesses located within its borders. The borough does have a few small businesses, including a few restaurants, a convenience store, and a few other retail establishments. The majority of the borough's residents are employed in the nearby cities of Philadelphia and Trenton.
Demographics
As of the 2010 census, there were 2,845 people, 1,093 households, and 790 families residing in the borough. The population density was 4,093.3 people per square mile. The racial makeup of the borough was 94.2% White, 2.2% African American, 0.2% Native American, 0.9% Asian, 0.1% Pacific Islander, 0.9% from other races, and 1.5% from two or more races. Hispanic or Latino of any race were 2.7% of the population.
The median income for a household in the borough was $60,938, and the median income for a family was $68,958. Males had a median income of $45,938 versus $35,938 for females. The per capita income for the borough was $25,938. About 3.2% of families and 4.2% of the population were below the poverty line, including 5.2% of those under age 18 and 4.2% of those age 65 or over.
Conclusion
Hulmeville Borough is a small borough located in Bucks County, Pennsylvania. It is situated in the northeast corner of the county, just south of the city of Philadelphia. The borough is primarily a residential community, with no major industries or businesses located within its borders. The population of Hulmeville Borough was 2,845 at the 2010 census. The borough has a diverse population, with a median income of $60,938 for households and $68,958 for families. Hulmeville Borough is a great place to live, work, and raise a family.
Common Questions
What is the Total Population of Hulmeville borough?
Total Population of Hulmeville borough is 953.
What is the Total Male Population of Hulmeville borough?
Total Male Population of Hulmeville borough is 507.
What is the Total Female Population of Hulmeville borough?
Total Female Population of Hulmeville borough is 446.
What is the Ratio of Males per 100 Females in Hulmeville borough?
There are 113.68 Males per 100 Females in Hulmeville borough.
What is the Ratio of Females per 100 Males in Hulmeville borough?
There are 87.97 Females per 100 Males in Hulmeville borough.
What is the Median Population Age in Hulmeville borough?
Median Population Age in Hulmeville borough is 39.4 Years.
What is the Average Family Size in Hulmeville borough
Average Family Size in Hulmeville borough is 3.0 People.
What is the Average Household Size in Hulmeville borough
Average Household Size in Hulmeville borough is 2.8 People.
What is Per Capita Income in Hulmeville borough?
Per Capita income in Hulmeville borough is $47,067.
What is the Median Family Income in Hulmeville borough?
Median Family Income in Hulmeville borough is $124,712.
What is the Median Household income in Hulmeville borough?
Median Household Income in Hulmeville borough is $116,500.
What is Income or Wage Gap in Hulmeville borough?
Income or Wage Gap in Hulmeville borough is 39.9%.
Women in Hulmeville borough earn 60.1 cents for every dollar earned by a man.
What is Inequality or Gini Index in Hulmeville borough?
Inequality or Gini Index in Hulmeville borough is 0.35.
How Large is the Labor Force in Hulmeville borough?
There are 536 People in the Labor Forcein in Hulmeville borough.
What is the Percentage of People in the Labor Force in Hulmeville borough?
71.1% of People are in the Labor Force in Hulmeville borough.
What is the Unemployment Rate in Hulmeville borough?
Unemployment Rate in Hulmeville borough is 7.6%.